Investments Efficiency in Industry 4
41
Investments Efficiency in Industry 4.0 Natalia Skorobogatova PhD in Economics Associate Professor Department of International Economics Igor Sikorsky Kyiv Polytechnic Institute NATIONAL TECHNICAL UNIVERSITY OF UKRAINE “IGOR SIKORSKY KYIV POLYTECHNIC INSTITUTE”
Transcript of Investments Efficiency in Industry 4

Investments Efficiency
in Industry 4.0
Natalia Skorobogatova
PhD in Economics
Associate Professor
Department of International Economics
Igor Sikorsky Kyiv Polytechnic Institute
N A T I O N A L T E C H N I C A L U N I V E R S I T Y O F U K R A I N E
“ I G O R S I K O R S K Y K Y I V P O L Y T E C H N I C I N S T I T U T E ”

Investments
Who
invests?
Person People
Companies
State
What?Materials
Technologies
Buildings
Equipment
Securities
Other assets
Money
Why?Where?
Other
objects
Banks
Enterprises
Startups
Hospitals
Schools
Securities
Infrastructure
Solving
social
problems
Profit Impact
Improvement of
ecology
Other goals

Law of Ukraine "On Investment Activity"https://zakon.rada.gov.ua/laws/show/1560-12
■ Investments are all types of property and intellectual
values invested in objects of entrepreneurial and other
types of activity, as a result of which profit (income) is
created and / or a social and environmental effect is
achieved.

Investments can be made in the forms
funds, bank deposits, shares, stocks and other securities
(except bills)
movable and immovable property (buildings, structures,
equipment and other material values)
intellectual property rights
technical, technological, commercial and other knowledge,
which are issued in the form of technical documentation,
skills and production experience that are necessary for the
organization of a particular type of production ("know-how")
rights to use land, water, resources, buildings, structures,
equipment, as well as other property rights
other values

Industry 4.0 describes the growing
trend towards automation and data
exchange in technology and
processes within the manufacturing
industry, including:
• The internet of things (IoT)
• The industrial internet of things (IIoT)
• Cyber-physical systems (CPS)
• Smart manufacture
• Smart factories
• Cloud computing
• Cognitive computing
• Artificial intelligence

Investment in technology innovation
KPMG Technology Industry Innovation Survey, 2019
https://assets.kpmg/content/dam/kpmg/us/pdf/2019/06/investment-in-technology-innovation-2019.pdf
Greatest potential for
transformation and long-
term value creation Investing in now
Plan to invest in three years
from now
1 Internet of Things (IoT) Internet of Things (IoT) Internet of Things (IoT)
2 Robotic process automation
(RPA)
Artificial intelligence Robotics (including autonomous
vehicles)
3 Artificial intelligence Robotic process automation (RPA) Artificial intelligence
4 Blockchain Robotics (including autonomous
vehicles)
Blockchain
5 Robotics (including autonomous
vehicles)
Augment reality Robotic process automation
(RPA)
6 Augment reality Blockchain Virtual reality
7 Virtual reality Social networking, collaboration
technologies
Biotech, digital health, genetics
8 Social networking, collaboration
technologies
Biotech, digital health, genetics Social networking, collaboration
technologies
9 Biotech, digital health, genetics Virtual reality On Demand platforms
10 On Demand platforms On Demand platforms Augment reality

The main quantitative indicators:
Annual digital revenue increases by 2,9% on average – and a
significant minority that expect total increases of more than 50% over
five years. That adds up to $ 493 billion in increased annual revenues
for the next five years across the industrial sectors.
Cost reductions by 3,6% per year on average. Digital technologies
enable shorter operational lead times, higher asset utilisation and
maximum product quality. All respondents expect to save $ 421
billion in costs every year for the next five years.
Geissbauer R., Vedso J., and Schrauf S. Global Industry 4.0 Survey.
Industry 4.0: Building the digital enterprise. URL: https://www.pwc.com

Expected Cost Reduction by Industry Sector (%)
3,7
3,9
3,9
3,7
3,4
4,2
3,6
3,2
3,2
0 0,5 1 1,5 2 2,5 3 3,5 4 4,5
Aerospace, defence & security
Automotive
Chemicals
Electronics
Engineering & construction
Forest, paper & packaging
Industrial manufacturing
Metals
Transportation & logisticsWeighted
Average
created by the data of
https://www.pwc.com

Planned investments in Industry 4.0 by industry sector, in % per year
5
5
5
7
5
4
5
4
5
0 1 2 3 4 5 6 7 8
Aerospace, defence & security
Automotive
Chemicals
Electronics
Engineering & construction
Forest, paper & packaging
Industrial manufacturing
Metals
Transportation & logistics
created by the data of
https://www.pwc.com

Planned investments in Industry 4.0 by industry sector, in billions of dollars per year
13
65
45
243
195
15
177
55
97
0 50 100 150 200 250 300
Aerospace, defence & security
Automotive
Chemicals
Electronics
Engineering & construction
Forest, paper & packaging
Industrial manufacturing
Metals
Transportation & logistics
created by the data of https://www.pwc.com

Investment volumes in Industry 4.0 by countries
http://www2.itif.org/2018-gtipa-summit-stephen-ezell.pdf

High-technology exports (current US$), GDP, PPP (current international $)
created by the data of https://data.worldbank.org/

Ukraine has developed a draft National Strategy Industry 4.0
1. Institutionalization of the development of industrial high-tech segments at thestate level, i.e. recognition of target sectors of industrial high-tech as key for thedevelopment of the Ukrainian economy. This will restore confidence in the state andgive a powerful impetus to the development of priority industries.
2. The creation of an innovative ecosystem of industrial high-tech involves solvingsuch development problems: complete independent audit of the existing elementsof the ecosystem (design bureaus of leading enterprises, a system of universitiesand NASU, scientific and technological parks, etc.) and the determination of theirtarget indicators; establishing a technology transfer from Ukrainian scientificinstitutions, science parks, R & D laboratories to end customers, as well as creatingnetwork links between them; attracting investments and funds to accelerateinnovative development.
3. Acceleration of clustering in the field of Industry 4.0 both at the regional andnational levels. High-tech industrial clusters must solve a number of problems bothin terms of increasing value in the chains of their ecosystems and in the growth ofexports.
Yurchak O. Ukrainian Industry Strategy 4.0 - 7 trends
URL: https://industry4-0-ukraine.com.ua/

Ukraine has developed a draft National Strategy Industry 4.0
4. Full-scale digitalization of key sectors of industry, energy and infrastructure. It isplanned to create regulatory incentives to accelerate digitalization, both among endcustomers and innovators 4.0; creation of digital transformation roadmaps byindustry; large-scale digitalization of industrial sectors.
5. The maximum integration of innovations in the strategy of the defence complexand the country's security is especially important in the context of aggression fromthe Russian Federation. This includes the launch of special state programs for thetransition of defence plants to technologies 4.0 and increasing their innovativeness,ensuring cybersecurity.
6. Launch of export programs for the industrial high-tech sector. It is necessary tocreate a special trade mission for the export of products and services in the eraof 4.0.
7. Internationalization and integration into the global space 4.0 - the creation ofseparate programs for integration into the 4.0 space in the EU. At the same time, itis necessary to create programs for integration into value chains at the level ofother world communities and states.
Yurchak O. Ukrainian Industry Strategy 4.0 - 7 trends
URL: https://industry4-0-ukraine.com.ua/

Investments and income in Ukraine, 2010-2018, UAH million
created by the data of http://www.ukrstat.gov.ua/

created by the data of https://data.worldbank.org/
Dependence of nominal GDP on FDI
Ukraine
USA
Germany
United KingdomChina
France
Italy
South Korea
Japan
Brazil
India
Russia
Australia
Saudi Arabia
South Africa
-50000
0
50000
100000
150000
200000
250000
300000
350000
400000
0,00 5 000,00 10 000,00 15 000,00 20 000,00 25 000,00
Fore
ign
dir
ect
inve
stm
ent,
mill
ion
do
llars
Nominal GDP, billion dollars

created by the data of https://data.worldbank.org/
Dependence of nominal GDP on the share of R&D
Ukraine
USAGermany
United Kingdom
ChinaFranceItaly
South Korea
Japan
Brazil
India
Russia
Australia
Saudi Arabia
South Africa
-1
0
1
2
3
4
5
0,00 5 000,00 10 000,00 15 000,00 20 000,00 25 000,00
Shar
e o
f R
&D
in G
DP,
%
Nominal GDP, billion dollars

created by the data of https://data.worldbank.org/
Dependence of the share of R&D on FDI
Ukraine
USAGermany
United Kingdom
ChinaFrance
Italy
South Korea
Japan
Brazil
India
Russia
Australia
Saudi ArabiaSouth Africa
-1
0
1
2
3
4
5
-50000 0 50000 100000 150000 200000 250000 300000 350000 400000
Shar
e o
f R
&D
in G
DP,
%
Foreign direct investment, million dollars

Impact of Industry 4.0 instruments on financial performance
Revenue
Increasing the speed of bringing new products to
market by accelerating the production cycle
Increasing customization of
goods and services through more
accurate identification and meeting the needs of society
Improving the quality of goods and services by
reducing defective
products, delivery times
Non
-curr
ent
assets
Growing investment in fixed assets of
industry: robots, 3D printers, server
equipment
Growing of investments in
intangible assets: software, licenses,
patents
Growing investment in Research &
Development
Costs
Reducing the cost of maintenance needs
due to predictive analytics
Reducing of electricity costs due to its reasonable use
Reducing of costs due to
automation and robotization of
production

How Industry 4.0 is delivering revenue, cost and efficiency gains?
https://www.pwc.com/

Annual innovation investment by company size
KPMG Technology Industry Innovation Survey, 2019
https://assets.kpmg/content/dam/kpmg/us/pdf/2019/06/investment-in-technology-innovation-2019.pdf
Startup Mid-Market Large Enterprise
$ 0 - $ 9.9 M 84 % 59 % 40 %
$ 10 M - $ 99.9 M 14% 32 % 28 %
$ 100 - $ 499.9 M 0 % 3 % 11 %
$ 500 M + 1 % 6 % 18 %

Companies that do not strategically invest will lose competitive advantage
https://www.pwc.com/

Most companies expect Industry 4.0 investments to pay back within two years
https://www.pwc.com/

Performance indicators on investment project
Dynamic methods
Net present value
Profitability index
Discounted payback period
Internal rate of return
Static methods
Payback period
Accounting rate of return

Static methods
+■ easy to calculate
■ easy to understand
result
-■ time value of money is
not considered
■ risk is not considered
■ the duration of the
project life cycle is not
considered
■ ignores cash flows after
payback period

Payback period
The payback period refers to the amount of time it takes to
recover the cost of an investment.
Shorter paybacks mean more attractive investments.
Accounting rate of return
ARR = Average annual profit after tax * 100%
Average or Initial Investment
Of the various accounting rates of return on different
alternative projects, the one having highest rate of return is
taken to be the best investment proposal.

Dynamic methods
-■ difficult to calculate
■ subjective assessment
■ difficult to understand
the result
+■ time value of money is
considered
■ risk is considered
■ the duration of the
project life cycle is
considered

Net present value
■ Net present value is the sum of discounted future cash inflow and outflow
related to the project. Generally, the weighted average cost of capital (WACC) is
the discounting factor for future cash-flows in net present value method.
𝑵𝑷𝑽 =
𝒕=𝟎
𝒏𝑹𝒕(𝟏 + 𝒊)𝒕
Rt – net cash inflow-outflows during a single period t
i – discount rate or return that could be earned in alternative investments
t – number of time periods
■ The company should accept the project if the NPV is positive.
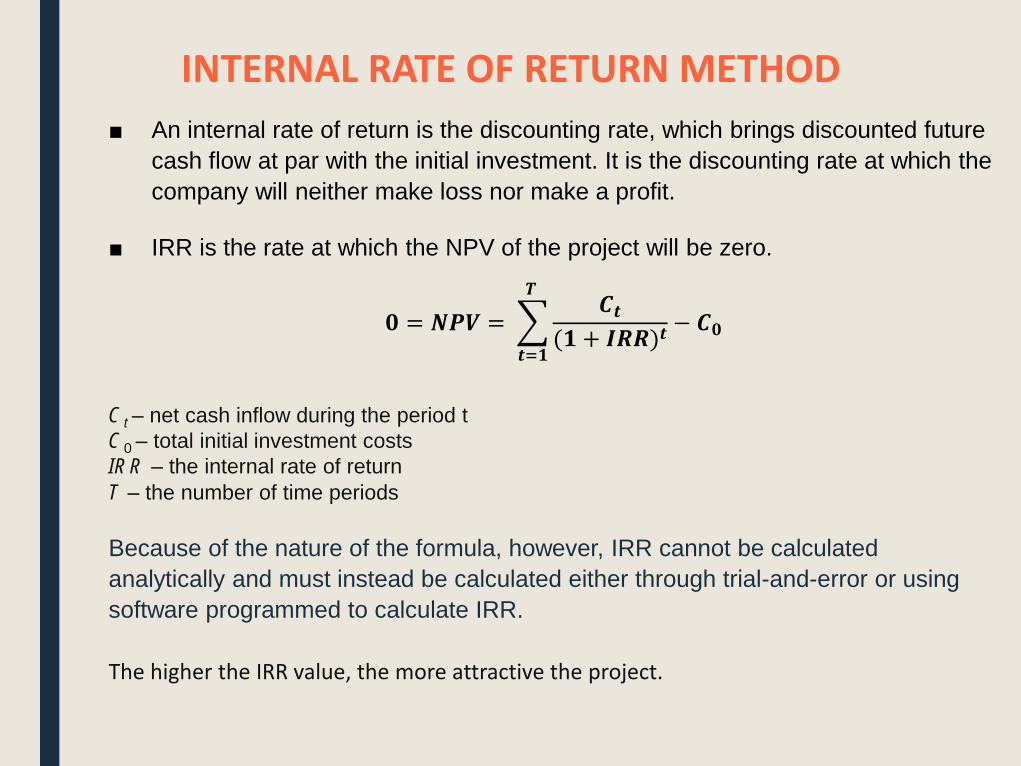
INTERNAL RATE OF RETURN METHOD
■ An internal rate of return is the discounting rate, which brings discounted future
cash flow at par with the initial investment. It is the discounting rate at which the
company will neither make loss nor make a profit.
■ IRR is the rate at which the NPV of the project will be zero.
𝟎 = 𝑵𝑷𝑽 =
𝒕=𝟏
𝑻𝑪𝒕
(𝟏 + 𝑰𝑹𝑹)𝒕− 𝑪𝟎
Ct – net cash inflow during the period t
C0 – total initial investment costs
IRR – the internal rate of return
T – the number of time periods
Because of the nature of the formula, however, IRR cannot be calculated
analytically and must instead be calculated either through trial-and-error or using
software programmed to calculate IRR.
The higher the IRR value, the more attractive the project.

PROFITABILITY INDEX
■ The profitability index (PI) is the present value of the future cash inflows divided by the
initial investments.
Profitability Index (PI) = Present Value of Cash Inflows
Present Value of Cash Outlay
■ The only difference between the net present value method and profitability index
method is that when using the NPV technique the initial investments is deducted from
the present value of the expected cash inflows, while with the profitability index
approach the initial investments is used as a divisor.
■ The project is acceptable if its profitability index value is greater than 1.
DISCOUNTED PAYBACK PERIOD METHOD
■ In this method, the payback period is calculated on the basis of discounted future cash
flows, and in the payback method, it is calculated on the basis of future cash flows.

The balanced approach to assessing the efficiency of investments in Industry 4.0
Innovative efficiency

• cost reduction
• sales increasing
• improving of product quality
• increasing of the profitability of production and others
• reduction of emissions into the environment
• reduction of environmental pollution
• installation of treatment facilities and others
• improving the living standards of the population
• increasing in the number of jobs
• providing some important goods and services of a specific region
• improving the working conditions of staff and others
• relevance of the introduced technologies on the market
• the prospects of the proposed technical solutions
• increasing labor productivity and product quality
• increasing the level (quality) of labor resources
• the level of reduction of natural and labor resources and others

Interpipe's digital transformation of manufacturing
https://www.youtube.com/watch?v=KlHXEIJy3ug

https://www.sw.siemens.com/
Amid unprecedented change and the rapid pace of innovation, digitalization is no
longer tomorrow’s idea. We take what the future promises tomorrow and make it real
for our customers today. Welcome to… Where today meets tomorrow.

https://www.sw.siemens.com/

https://www.bosch.com/products-and-services/connected-products-and-services/industry-4-0/

Association of Industrial Automation of Ukraine
■ Main activities and tasks of the Association include:
• Harmonization and promotion of international standards (IEC/ISO) in the field of industrial automation and IT.
• Consolidation and development of expert groups.
• Improving dialogue between different groups of stakeholders (incl. researchers and Universities).
• Providing industry insights, outline critical development problems and suggest appropriate solutions.
• Set up and provide new services for community members and partners, including promotion and export.
• Developing hi-tech communities and eco-systems in cluster-like approach.
• Moving innovations in line with developing countries.https://appau.org.ua
/

Members■ Vendors (manufacturers – suppliers of equipment and
software in the industrial automation system):• Siemens Ukraine• Owen• Microl• Rittal• Phoenix Contact• Radmirtech• Bosch Security• Schneider Electric• Novatek Electro• Alay• Fractal Tools Inc.• Kontron• Information Technologies• Refit
■ High schools:• National University of Food Technologies, Department of
Acid• National Technical University of Ukraine “Kyiv Polytechnic
Institute. Igor Sikorsky, Department of AETP• Donetsk National Technical University (DonNTU)• Kyiv National University of Construction and Architecture,
Department of ATP• Kryvy Rih National University, Department of Computer
Science and Technology Automation• National University “Lviv Polytechnic”• Zaporizhzhya National Technical University• Kharkiv National University of Radio Electronics• National Aerospace University “Kharkiv Aviation Institute”• Sumy State University• Vinnytsia National Technical University• Ivano-Frankivsk National Technical University of Oil and Gas• (IFNTUNG), Department of ITTS• Odessa National Academy of Telecommunication• Research Laboratory of Mechatronics and
Robotics (ОNAFT)
• Ukrainian State University of Railway Transport• Flight Academy of the National Aviation University• National University of Bio resources and Nature
Management, Chair of ACTI• Odessa National Polytechnic University■ System Integrators, OEMs, IT Developers and
Integrators, Engineering Companies:• Techinservice• Azov Controls• Artezia• CJSC Saturn Date International• Elius-M• Innovative Technical Solutions• Scientific-Production Enterprise “Information Technologies”
Ltd.• NVP Zaliznichavtomatika• Naftogazhim Service• CANT +• SoftElegance• BusinessLogic• PassivDom Ukraine LLC• Infocom Ltd.• Systems Automation Service Ltd.• Flexlink Systems• Indusoft Ukraine• 482.solutions
■ End users – Industrial Enterprises:• Interpipe Ltd.• Milkiland N.V. Ltd.• METinvest holding■ Others:• Promelelect magazine• B2B Ray• Synergy, Center for Partnership and Innovation■ Engineering:• Kryukiv Carriage Works https://appau.org.ua/

Portfolio of strategic project Industry 4.0
https://industry4-0-ukraine.com.ua/results-1st-year-eng/

Risks of investment projects
The decision on an investment project can be
characterized by the following features:
- the presence of uncertainty and (or) conflict
- the availability of alternatives and the need to choose
one of them
- the opportunity to evaluate the available alternatives -
to make a decision
Industry 4.0 threats and risks:
Cybersecurity and the need to counter cyber attacks
Process control problems
Growth of unemployment (low-skilled personnel
performing routine work) and imbalance in the labor
market (lack of highly qualified personnel, creative
specialists)
Psychological conflicts and man-machine conflicts,
etc.

I wish good luck in choosing ideas, evaluating the
efficiency of projects and neutralizing risks!
I hope all your projects will be effective and will bring
profit
Thank you for attention!