iNvEstmENt stAtistiCAl sECtiON - Alaskadoa.alaska.gov/drb/pdf/pers/cafr/2013PersInvestment.pdf ·...
22
Alaska Public Employees’ Retirement System • FY 2013 CAFR iNvEstmENt sECtiON
-
Upload
phungnguyet -
Category
Documents
-
view
217 -
download
0
Transcript of iNvEstmENt stAtistiCAl sECtiON - Alaskadoa.alaska.gov/drb/pdf/pers/cafr/2013PersInvestment.pdf ·...
Alaska Public Employees’ Retirement System • FY 2013 CAFR
stAtistiCAlsECtiONiNvEstmENtsECtiON

Alaska Public Employees’ Retirement System • FY 2013 CAFR

Alaska Public Employees’ Retirement System • FY 2013 CAFR 81
Investment Section
August 30, 2013
Alaska Retirement Management Board State of Alaska, Department of Revenue Treasury Division 333 Willoughby Avenue, 11th Floor Juneau, AK 99801
Dear Board Members:
This letter reviews the investment performance of the Alaska Retirement Management Board (ARMB) for the fiscal year ended June 30, 2013.
Callan Associates Inc. (Callan) independently calculates time-weighted performance statistics based on underlying custodial data provided by the Board’s custodian, State Street Bank and Trust Company. The performance calculations were made using a time-weighted return methodology based upon market values. ARMB’s real estate consultant, the Townsend Group, calculates returns for the real estate segment of the portfolio. Callan incorporates that data into the total plan returns. Callan serves as ARMB’s independent general investment consultant and evaluates the ARMB’s performance in relation to market benchmarks, appropriate manager peer groups and other public pension systems. The performance calculations were made using methodology similar to Global Investment Performance standards.
ARMB’s primary investment objective is to prudently and expertly invest assets, in accordance with governing law and industry practices, in a manner that will help ensure assets under supervision are sufficient to pay promised benefits to its members and their beneficiaries. In pursuit of this objective, the ARMB periodically evaluates liabilities, expected contributions, and potential earnings. This analysis is used to consider a wide range of potentially viable investment strategies. The Board selects a strategic investment policy that balances long-term growth potential and acceptable risk. A policy benchmark is constructed that mirrors the Board’s strategic asset allocation policy. This policy benchmark is a custom index comprised of equity, fixed income, real estate and other market indices weighted in the same proportions as ARMB’s investment policy.
Major equity markets enjoyed a strong fiscal year 2013, both internationally and domestically. The Russell 3000 Index, a measure of the broad U.S. equity market, jumped 21.46%. International stocks, as measured by the MSCI ACWI ex-U.S. Index, gained 14.14% for the fiscal year. A broad measure of the total global equity market (MSCI All Country World Index) rose 17.21%. Fixed income struggled during fiscal year 2013. The Barclays Capital Aggregate Bond Index, a widely used gauge of the investment grade domestic bond market, declined 0.69%. Absolute return strategies, such as hedge fund-of-funds, posted respectable gains during the fiscal year. For example, the Callan Absolute Return Hedge Fund-of-Funds Style median return was 9.52% (net-of-fee). Private real estate investments continued to advance, returning 10.72% (NCREIF Property Index) for fiscal 2013. Publicly traded real estate, as measured by the FTSE NAREIT Equity Index, increased 9.42%.

82 Alaska Public Employees’ Retirement System • FY 2013 CAFR
Investment Section
For the fiscal year, the Public Employees’ Retirement System (PERS) had a time-weighted total return of 12.50% and the Teachers’ Retirement System (TRS) had a time-weighted total return of 12.59%. Both Systems outperformed their strategic policy benchmark target return of 12.27% and the 11.99% median return for Callan’s Public Fund database. Over longer-term periods, PERS and TRS have closely tracked their target index returns. For example, PERS’ 10-year annualized return was 6.94% while TRS’s return was slightly higher at 6.99%. These returns were close to but slightly below their target of 7.03%. Over the longest period for which Callan has detailed data (21-¾ years), PERS and TRS have achieved annualized total returns of 7.59% and 7.65%, respectively, while the policy benchmark return for the same span was 7.62%.
For fiscal year 2013 there were significant differences in performance between asset categories. For example, domestic equities (as measured by the Russell 3000 Index) had a return of 21.46% while fixed income (Barclays Aggregate Bond Index) actually fell, losing 0.69%. Non-U.S. Government Bonds, as measured by the Citi Non-U.S. World Gov’t Bond Index, declined 5.72%. Similarly, the spread in international equity returns was wide. Developed equities (MSCI EAFE Index) gained 18.62% for the fiscal year but equities in emerging markets (MSCI Emerging Markets Index) only rose 3.23%.
ARMB’s various asset group returns were all positive, as shown below:
Domestic Stocks 21.23% Int’l Stocks 15.01% Private Equity 11.61% Real Assets 10.48% Absolute Return 8.41% * (adjusted to reflect Fiscal Year period) Fixed Income 0.57%
Both Systems are well diversified and currently have asset allocation policies that, in our opinion, are consistent with achievement of a long-term “real” return of 4.5% or better.
In summary, fiscal 2013 was a good year for most major asset categories allowing balanced investment portfolios to perform well.
Sincerely,
Michael J. O’Leary, CFA Executive Vice President

Alaska Public Employees’ Retirement System • FY 2013 CAFR 83
Investment Section
Department of Revenue Treasury Division
Staff
Commissioner Bryan Butcher
Deputy CommissionerAngela Rodell
Chief Investment Officer Gary Bader
ComptrollerPamela Leary, CPA
Cash ManagementMichelle M. Prebula, MBA, CPA, CCM
Investment OfficersBob G. MitchellStephen R. SikesZachary HannaSteve Verschoor Shane CarsonSean HowardPaul Hackenmueller
ARMB Liaison OfficerJudy Hall
Casey ColtonNicholas OrrVictor DjajalieJoy WilkinsonAlyson CampbellEmily Peyton
External Money Managers and Consultants
Investment ConsultantsCallan Associates, Inc.
Denver, COThe Townsend Group
San Francisco, CA
Investment Advisory CouncilWilliam Jennings
Colorado Springs, COJerrold Mitchell
Wayland, MAGeorge Wilson
Boston, MA
Absolute ReturnCrestline Investors, Inc.
Fort Worth, TXGlobal Assets Management Inc.
Los Angeles, CAPrisma Capital Partners
New York, NY
Domestic Equity Large CapitalizationAnalytic Investors LLC
Los Angeles, CABarrow, Hanley, Mewhinney & Strauss
Dallas, TXCapital Guardian Trust Co.
Los Angeles, CARCM Global Investors
San Francisco, CAMcKinley Capital Management, Inc.
Anchorage, AKRelational Investors LLC
San Diego, CAQuantitative Management Associates
Newark, NJ
Domestic Equity Small CapitalizationJennison Associates LLC
New York, NYLord Abbett & Co.
Jersey City, NJLuther King Capital Management
Fort Worth, TXFrontier Capital Management
Boston, MAVictory Capital Management
St. Louis, MO
Domestic Equity MicroCapDePrince, Race & Zollo, Inc.
Winter Park, FLLord Abbett & Co.
Jersey City, NJ
Domestic Equity Index FundState Street Global Advisors
San Francisco, CA
Emerging MarketsCapital Guardian Trust Co.
Los Angeles, CAEaton Vance Management
Boston, MA
Global EquityLazard Freres Asset Management
New York, NY
High Yield/Convertible BondMacKay Shields LLC
New York, NYAdvent Capital Management
New York, NY

84 Alaska Public Employees’ Retirement System • FY 2013 CAFR
Investment Section
External Money Managers and Consultants (cont.)
International Equity – EAFEBrandes Investment Partners, L.P.
San Diego, CACapital Guardian Trust Co.
Los Angeles, CA
International Small CapMondrian Investment Partners
London, EnglandSchroders Investment Management NA
New York, NY
International Fixed IncomeMondrian Investment Partners
London, England
Master Limited PartnershipsFAMCO MLP
St. Louis, MOTortoise Capital Advisors LLC
Leawood, KS
Private EquityAbbott Capital Management, L.P.
New York, NYPathway Capital Management, LLC
Irvine, CA
Real Assets – FarmlandHancock Agricultural Investment Group
Boston, MAUBS AgriVest, LLC
Hartford, CT
Real Assets – Commingled FundsAlmanac Realty Investors
Alpharetta, GA BlackRock Realty
San Francisco, CAColony Capital
Los Angeles, CACornerstone Real Estate Advisers, LLC
Hartford, CTCoventry Real Estate Fund II, LLC
New York, NYClarion Partners
New York, NYJ.P. Morgan Investment Management Inc.
New York, NY
Sentinel Real Estate CorporationNew York, NY
Tishman Speyer PropertiesNew York NY
UBS Realty Investors, LLCHartford, CT
Real Assets – Real Estate Core Separate AccountsCornerstone Real Estate Advisers, Inc.
Hartford, CTLaSalle Investment Management
Chicago, ILSentinel Real Estate Corporation
New York, NYUBS Realty Investors, LLC
San Francisco, CA
Real Assets – Timber Hancock Timber Resource Group
Charlotte, NCTimberland Investment Resources LLC
Brookline, MA
Supplemental Benefits System, Deferred Compensation Plan and Defined Contribution Plan
BlackRockSan Francisco, CA
RCMSan Francisco, CA
State Street Global AdvisorsBoston, MA
T. Rowe Price Investment ServicesBaltimore, MD
Brandes Investment PartnersSan Diego, CA
Global Master CustodianState Street Bank & Trust Co.
Boston, MA
Independent AuditorsKPMG, LLP
Anchorage, AK
Legal CounselRobert Johnson
Anchorage, AK
Silverpeake Real Estate PartnersNew York, NY
Lowe Hospitality Investment Partners, LLCLos Angeles, CA

Alaska Public Employees’ Retirement System • FY 2013 CAFR 85
Investment Section
INVESTMENTS
The investment goals of the State of Alaska Public Employees’ Retirement System (PERS) are the long term return and sustainability of the pension funds under management. Near-term market fluctuations are integrated into the overall outlook of the fund guidelines. Annually, the Alaska Retirement Management Board (ARMB) sets its asset allocation strategy in order to reflect changes in the marketplace while still retaining an optimal risk/return level within the set constraints and objectives of the ARMB.
The ARMB categorizes its investments into seven asset classes: domestic equities, global equities ex-U.S., fixed income, real assets, private equity, absolute return and cash equivalents. The performance of each asset class is compared with a benchmark comprised of one or more market indices. The performance for the total portfolio is compared with its policy portfolio, determined by calculating the weighted performance of the underlying asset class benchmarks at the portfolio’s target asset allocation. The asset class benchmarks are illustrated below:
Asset Class Benchmark
Domestic Equity Russell 3000 Index
Global Equities Ex-U.S. MSCI All Country World Ex-U.S. Index
Fixed Income 80% Barclays Intermediate Treasury Index 10% Merrill Lynch High Yield II Constrained Index 7% Citigroup World Gov. Bond Ex-U.S. Index 3% JP Morgan Global Bond Index - Emerging Markets Broad Diversified Index
Real Assets 55% NCREIF Property Index 20% Barclays TIPS Index 10% NCREIF Farmland Index 10% NCREIF Timberland Index 5% FTSE NAREIT All Equity REIT Index
Private Equity 1/3 S&P 500 Index 1/3 Russell 2000 Index 1/3 MSCI EAFE Index
Absolute Return 91 Day Treasury Bill + 5%
Cash Equivalents 91 Day Treasury Bill
The target asset allocation is determined by the ARMB, utilizing capital market assumptions provided by its independent general investment consultant, Callan Associates. During the 2013 fiscal year, the ARMB’s target asset allocation was 27% domestic equities, 23% global equities ex-U.S., 16% real assets, 14% fixed income, 8% private equity, 6% absolute return, and 6% cash equivalents. The target asset allocation is expected to generate a return of 7.11% with a standard deviation of 14.20%.
Public Employees’ Retirement SystemInvestment Report

86 Alaska Public Employees’ Retirement System • FY 2013 CAFR
Investment Section
Public Employees’ Retirement SystemSchedule of Investment Results
Fiscal Years Ended June 30
2009 2010 2011 2012 2013
Annualized
3 Year 5 Year
Total FundPERS (20.49%) 11.39% 21.22% 0.46% 12.50% 11.05% 3.92%Actuarial Earnings Rate 8.25 8.25 8.00 8.00 8.00 8.00 8.00
U.S. Common Stock ReturnsPERS Domestic Equities (26.72) 15.45 33.37 1.80 21.23 18.07 6.85Custom Composite Index (26.56) 15.72 32.37 3.84 21.46 18.63 7.25
International Stock ReturnsPERS International Equities (29.11) 12.05 28.27 (13.67) 15.01 8.39 0.23Morgan Stanley Capital International
ACWI ex-US (30.54) 10.87 30.27 (14.15) 14.14 8.48 (0.34)Fixed Income
PERS 3.39 11.19 5.46 4.90 0.57 3.62 5.04Custom Composite Index 5.41 10.16 5.06 5.08 (0.04) 3.34 5.09
Private EquityPERS (23.67) 18.86 20.14 9.44 11.61 13.64 5.89Custom Composite Index (27.19) 13.87 32.93 (3.61) 21.24 15.81 5.19
Absolute ReturnPERS (12.51) 6.59 5.98 (2.05) 8.41 4.02 0.973-month Treasury Bill +5% 5.95 5.16 5.16 5.06 5.11 5.11 5.29
Real AssetsPERS (21.02) (0.28) 15.25 10.46 10.47 11.95 1.94Custom Composite Index (10.82) 1.17 12.66 11.41 8.35 10.79 4.18
Cash EquivalentsPERS - - 0.47 0.44 0.25 0.39 -3-month Treasury Bill - - 0.16 0.06 0.11 0.11 -
ACWI = All Country World IndexReturns for periods longer than one year are reported on an annualized basis.Basis of calculation: Time-Weighed rate of return based on the market rate of return.

Alaska Public Employees’ Retirement System • FY 2013 CAFR 87
Investment Section
Policy
Global Equity Ex-U.S.23% ± 4%
Broad Domestic Equity27% ± 6%
Private Equity8% ± 5%
Cash and Cash Equivalents6% - 6% / + 1%
Absolute Return6% ± 4%
Real Assets16% ± 8%
Fixed Income Securities14% ± 5%
Actual — Defined Benefit Pension
Global Equity Ex-U.S.22.37%
Broad Domestic Equity32.63%
Private Equity8.96%
Cash and Cash Equivalents1.19%
Absolute Return4.41%
Real Assets17.21%
Fixed Income Securities13.23%
Public Employees’ Retirement System Asset Allocation June 30, 2013

88 Alaska Public Employees’ Retirement System • FY 2013 CAFR
Investment Section
Actual — Defined Benefit Alaska Retiree Healthcare Trust
Global Equity Ex-U.S.22.25%
Broad Domestic Equity32.46%
Private Equity8.91%
Cash and Cash Equivalents1.66%
Absolute Return4.39%
Real Assets17.16%
Fixed Income Securities13.16%
Public Employees’ Retirement System Asset Allocation June 30, 2013
Pooled Investment Funds39.87%
Cash and Cash Equivalents1.85%
Collective Investment Funds58.28%
Actual — Defined Contribution Participant Directed

Alaska Public Employees’ Retirement System • FY 2013 CAFR 89
Investment Section
Actual — Defined Contribution Health Reimbursement Arrangement
Global Equity Ex-U.S.22.02%
Broad Domestic Equity32.12%
Private Equity8.82%
Cash and Cash Equivalents2.69%
Absolute Return4.34%
Real Assets16.98%
Fixed Income Securities13.02%
Actual — Defined Contribution Occupational Death & Disability
Global Equity Ex-U.S.22.11%
Broad Domestic Equity32.25%
Private Equity8.85%
Cash and Cash Equivalents2.30%
Absolute Return4.36%
Real Assets17.05%
Fixed Income Securities13.08%
Public Employees’ Retirement System Asset Allocation June 30, 2013

90 Alaska Public Employees’ Retirement System • FY 2013 CAFR
Investment Section
Public Employees’ Retirement System Asset Allocation June 30, 2013
Actual — Defined Contribution Retiree Medical Plan
Global Equity Ex-U.S.22.07%
Broad Domestic Equity32.20%
Private Equity8.84%
Cash and Cash Equivalents2.45%
Absolute Return4.35%
Real Assets17.03%
Fixed Income Securities13.06%

Alaska Public Employees’ Retirement System • FY 2013 CAFR 91
Investment Section
Invested assets under the fiduciary responsibility of the Alaska Retirement Management Board (ARMB) have been commingled in various investment pools to minimize costs and maximize returns. Treasury Division has created twenty-three different mutual fund-like pools to accomplish the investment asset allocation policies of the ARMB. Using investment pools increases investment efficiency in three ways. First, combining individual funds’ cash inflows and outflows to offset each other reduces the amount of cash on hand needed to support daily operations. Second, pooling investments significantly reduces accounting, budgeting, and administrative costs. Finally, the ARMB can achieve economies of scale by making available investment options that could not otherwise be practically provided for smaller retirement funds. Below are the ten largest fixed income and equity holdings.
Fixed IncomeRank Largest Fixed Income Holdings Market Value Par Value
1 US Treasury 0.875% 12/31/2016 $ 238,916,085 $ 239,065,5012 US Treasury 2.625% 07/31/2014 106,782,463 104,062,9853 US Treasury 2.000% 02/15/2022 91,532,333 93,586,8454 US Treasury 0.250% 02/15/2015 69,800,003 69,840,9295 US Treasury 0.875% 07/31/2019 48,229,527 50,634,6746 US Treasury 1.125% 05/31/2019 40,670,343 41,904,5587 US Treasury 0.250% 09/30/2014 28,211,694 28,201,7678 US Treasury 0.625% 05/31/2017 25,016,921 25,422,0989 US Treasury 0.250% 05/15/2016 23,573,079 23,826,233
10 US Treasury 0.250% 01/31/2015 20,728,935 20,732,978
Equities
Rank Largest Equity Holdings Market Value1 Apple Inc $ 63,794,0302 Exxon Mobil Corp 51,680,4723 Chevron Corp 42,422,8184 JP Morgan Chase & Co 42,212,6485 Pfizer Inc 40,765,0156 International Business Machines Corp 37,217,4387 Wells Fargo & Co 34,017,8028 Oracle Corp 33,551,5249 General Electric Co 30,608,028
10 AT&T Inc 29,644,757
Additional investment information may be obtained from the Department of Revenue, Treasury Division, P.O. Box 110405, Juneau, Alaska 99811-0405.
Alaska Retirement Management BoardTop Ten Holdings by Asset Type
June 30, 2013

92 Alaska Public Employees’ Retirement System • FY 2013 CAFR
Investment Section
Total Fair Value FeesInternational Fixed Income* Mondrian Investment Partners $249,305,257 $1,016,092 High Yield Pool* Mackay Shields, LLC 356,509,150 1,560,476Total High Yield 356,509,150 1,560,476Alternative Equity** Relational Investors 189,315,321 1,392,783 * Analytic SSgA Account 81,713,882 10,546 * Analytic Buy Write Account 2,237,402 126,720 * Allianz Buy -Write Account 56,913,247 304,392 Total Alternative Equity 330,179,852 1,834,441 Domestic Equity Pools* Advent Capital 89,900,517 585,554* Barrow, Hanley, Mewhinney & Strauss, INC 171,633,042 1,045,470* Jennison Associates LLC 111,293,906 738,392* Lazard Asset Management 255,083,880 559,987* Lord Abbett & Co. 156,858,962 1,174,046* Luther King Cap. Management 107,098,090 517,303* Victory Capital Management 61,445,658 455,019* Frontier Capital Management 105,826,363 795,159 ARMB Equity Yield Strategy 77,637,909 —* McKinley Capital 186,837,770 799,613* Quantitative Management Associates 188,429,010 440,555* SSgA Russell 1000 Growth 740,784,022 79,347* SSgA Russell 1000 Value 779,088,238 97,460* SSgA Russell 2000 Growth 9,945,351 4,436* SSgA Russell 2000 Value 37,152,977 9,127* SSgA Russell 200 331,259,748 40,000* SSgA Futures Large Cap 7,650,844 7,262* SSgA Future Small Cap 6,164,511 6,461* DePrince, Race & Zollo Inc.-Micro Cap 62,089,865 643,909* Allianz Global Investors 188,975,696 701,359Total Domestic Equities 3,675,156,359 8,700,459Private Equity Pool** BlumCapital Partners-Strategic 6,836,932 213,828 ** Warburg Pincus X 24,266,730 510,837 ** Angelo Gordon & Co. 9,914,697 245,497 ** Onex Partners 13,878,920 294,854 ** Lexington Partners 32,226,471 311,959 * Pathway Capital Management 527,060,724 1,597,792 * Abbott Capital Management 511,386,737 1,364,587 ** Merit Capital Partners 8,295,295 182,043 Total Private Equities 1,133,866,506 4,721,397 International Equity Pools* SSgA 386,267,035 228,584 * Brandes Investment Partners 606,956,225 2,082,128 * Capital Guardian Trust Co. 479,032,061 1,174,590 * McKinley Capital Mgmt. 224,376,057 1,112,968 * Lazard Freres 294,557,132 350,932 Blackrock ACWI Ex-US IMI — 69,076* Mondrian Investment Partners 92,144,263 673,870 * Schroder Investment Management 88,320,561 657,409 Total International Equities 2,171,653,334 6,349,557Absolute Return Pool** Mariner Investment Group 1,094,757 256,104** Crestline Investors Inc. 187,684,966 1,551,142 ** Global Asset Management 183,402,681 909,480 ** Prisma Capital Partners 186,246,780 924,856 Total Absolute Return 558,429,184 3,641,582
(continued)
Public Employees’ Retirement System Schedule of Investment Management Fees
Year Ended June 30, 2013

Alaska Public Employees’ Retirement System • FY 2013 CAFR 93
Investment Section
Total Fair Value FeesEmerging Markets Equity Pool** The Capital Group Inc. $ — $ 358,363** Lazard Freres Asset Managers 228,538,875 —** Eaton Vance 143,240,034 —
Total Emerging Markets Equities 371,778,909 358,363Real Estate Pool** JPM Strategic 126,037,790 1,044,877 ** UBS Consolidated 55,350,747 579,268 ** Cornerstone 68,482,263 245,922 ** Lasalle 154,521,858 1,095,263 ** Sentinel, SA 107,339,967 548,659 ** UBS Separate 194,325,203 1,188,947 ** Lowe Hospitality 2,021,023 45,451 ** ING Clarion 21,995,747 376,492 ** Silverpeak Legacy Pension Partners 56,082,417 785,656 ** Rothschild Five Arrows 46,759,923 898,605 ** Tishman Speyer 56,794,507 649,745 ** BlackRock Diamond 18,784,285 265,292 ** Colony Investors VIII, L.P. 15,109,619 449,131** LaSalle Medical Office Fund II 13,531,678 241,483 ** Cornerstone Apartment Venture III 19,120,634 204,091 ** Coventry 9,934,016 234,943 Total Real Estate 966,191,677 8,853,823 Master Limited Partnerships Pool** Tortoise MLP 129,544,123 392,460 ** Famco MLP 125,789,419 303,754 Total Master Limited Partnerships 255,333,542 696,214 Timber Pool** Timberland INVT Resources 122,962,448 909,135 ** Hancock Natural Resource Group 60,776,997 473,165 Total Timber 183,739,445 1,382,300 Farmland Pool** Hancock Agriculture Investment Group 178,326,750 1,350,952 ** UBS Agrivest 307,598,783 2,181,333 Total Farmland 485,925,533 3,532,285 Farmland Water Pool** Hancock Farmland & Water 6,528,662 38,496 ** UBS Agrivest 11,265,233 83,773 Total Farmland Water 17,793,895 122,269 Energy Pool** EIG Energy Fund XV 24,182,980 400,547 ** EIG Energy Fund XD 5,901,522 74,593 ** EIG Energy Fund XIV-A 45,735,236 576,838Total Energy 75,819,738 1,051,978 Custodian* State Street Bank 667,971Investment Advisory* Townsend Group 70,990 * Callan Associates 125,681 * Investment Advisory Council 65,607 Total Investment Advisory 262,278Investment Performance* Callan Associates 191,610
Total External Management Fees $ 44,943,095
*These fees are paid through the Alaska Statewide Accounting System (AKSAS)**These fees are deducted from earnings by the fund manager and are not directly recorded in AKSAS.
Public Employees’ Retirement System Schedule of Investment Management Fees (cont.)
Year Ended June 30, 2013

94 Alaska Public Employees’ Retirement System • FY 2013 CAFR
Investment Section
Defined Benefit - Pension
Asset Allocation Fair Market % of TotalInvestments (at Fair Value) Policy Range Value Assets
Cash and Cash Equivalents Short-term Fixed Income Pool $ 79,518,746 Total Cash and Cash Equivalents 6.00% 0-7% 79,518,746 1.19%
Fixed Income SecuritiesU.S. Treasury Fixed Income Pool 508,305,867High Yield Pool 188,205,768International Fixed Income Pool 131,612,939Emerging Debt Pool 56,023,255Total Fixed Income Securities 14.00% 9-19% 884,147,829 13.23%
Broad Domestic EquityLarge Cap Pool 1,729,360,071Small Cap Pool 403,689,227Convertible Bond Pool 47,461,893Total Broad Domestic Equity 27.00% 21-33% 2,180,511,191 32.63%
Global Equity Ex-U.S.International Equity Pool 1,203,194,389International Equity Small Cap Pool 95,269,004Emerging Markets Equity Pool 196,266,535Total Global Equity Ex-U.S. 23.00% 19-27% 1,494,729,928 22.37%
Private EquityPrivate Equity Pool 598,588,278Total Private Equity 8.00% 3-13% 598,588,278 8.96%
Absolute ReturnAbsolute Return Pool 294,812,870Total Absolute Return 6.00% 2-10% 294,812,870 4.41%
Real AssetsReal Estate Pool 508,825,552Real Estate Investment Trust Pool 100,656,229Master Limited Partnership Pool 134,793,799Energy Pool 40,027,695Farmland Pool 248,098,005Farmland Water Pool 17,793,896Timber Pool 97,002,008Treasury Inflation Protected Securities Pool 3,095,099Total Real Assets 16.00% 8-24% 1,150,292,283 17.21%
Total Invested Assets 100.00% $ 6,682,601,125 100.00%
Public Employees’ Retirement SystemInvestment Summary Schedule
June 30, 2013

Alaska Public Employees’ Retirement System • FY 2013 CAFR 95
Investment Section
Defined Benefit - Alaska Retiree Healthcare Trust
Asset Allocation Fair Market % of TotalInvestments (at Fair Value) Policy Range Value Assets
Cash and Cash Equivalents Short-term Fixed Income Pool $ 97,596,818Total Cash and Cash Equivalents 6.00% 0-7% 97,596,818 1.66%
Fixed Income SecuritiesU.S. Treasury Fixed Income Pool 444,101,354High Yield Pool 164,434,382International Fixed Income Pool 114,985,791Emerging Debt Pool 48,947,017Total Fixed Income Securities 14.00% 9-19% 772,468,544 13.16%
Broad Domestic EquityLarge Cap Pool 1,510,983,099Small Cap Pool 352,715,889Convertible Bond Pool 41,467,283Total Broad Domestic Equity 27.00% 21-33% 1,905,166,271 32.46%
Global Equity Ex-U.S.International Equity Pool 1,051,245,683International Equity Small Cap Pool 83,237,496Emerging Markets Equity Pool 171,477,019Total Global Equity Ex-U.S. 23.00% 19-27% 1,305,960,198 22.25%
Private EquityPrivate Equity Pool 522,981,569Total Private Equity 8.00% 3-13% 522,981,569 8.91%
Absolute ReturnAbsolute Return Pool 257,575,389Total Absolute Return 6.00% 2-10% 257,575,389 4.39%
Real AssetsReal Estate Pool 446,790,138Real Estate Investment Trust Pool 87,943,963Master Limited Partnership Pool 117,771,821Energy Pool 34,971,844Farmland Pool 232,343,281Farmland Water Pool - Timber Pool 84,749,795 Treasury Inflation Protected Securities Pool 2,704,160Total Real Assets 16.00% 8-24% 1,007,275,002 17.16%
Total Invested Assets 100.00% $ 5,869,023,791 100.00%
Public Employees’ Retirement SystemInvestment Summary Schedule
June 30, 2013
96 Alaska Public Employees’ Retirement System • FY 2013 CAFR
Investment Section
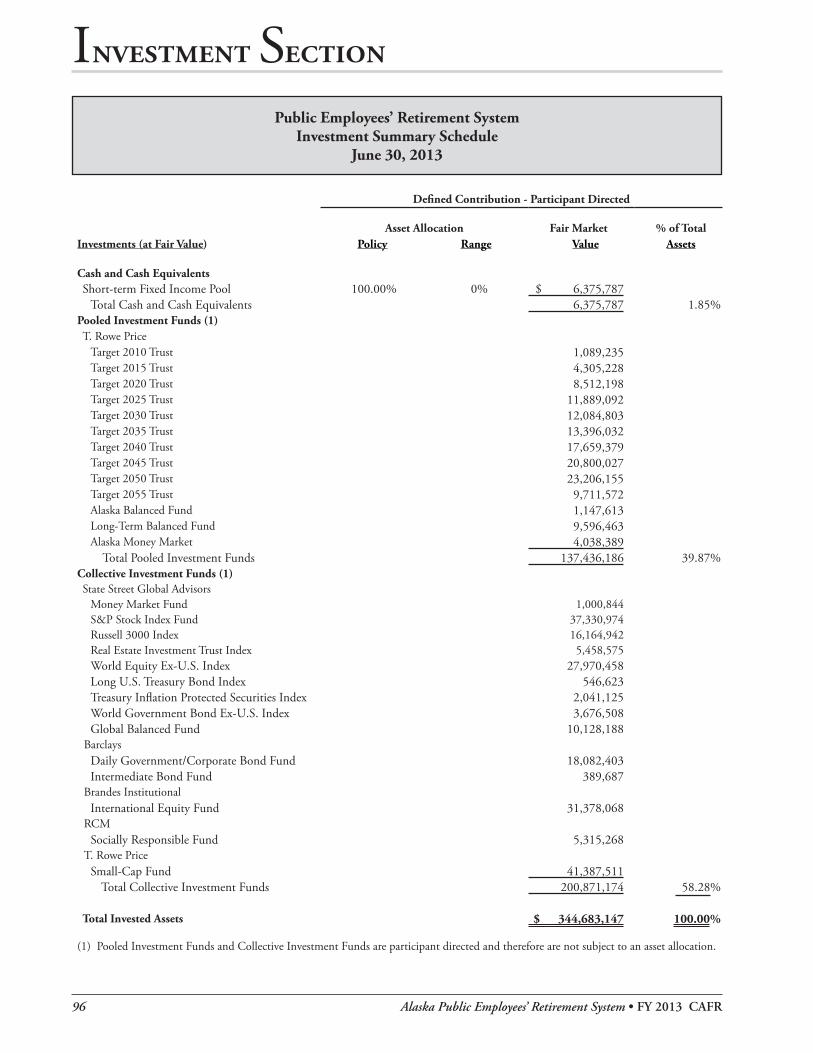
Defined Contribution - Participant Directed
Asset Allocation Fair Market % of TotalInvestments (at Fair Value) Policy Range Value Assets
Cash and Cash EquivalentsShort-term Fixed Income Pool 100.00% 0% $ 6,375,787
Total Cash and Cash Equivalents 6,375,787 1.85%Pooled Investment Funds (1)T. Rowe Price
Target 2010 Trust 1,089,235 Target 2015 Trust 4,305,228 Target 2020 Trust 8,512,198 Target 2025 Trust 11,889,092 Target 2030 Trust 12,084,803 Target 2035 Trust 13,396,032 Target 2040 Trust 17,659,379 Target 2045 Trust 20,800,027 Target 2050 Trust 23,206,155 Target 2055 Trust 9,711,572 Alaska Balanced Fund 1,147,613 Long-Term Balanced Fund 9,596,463 Alaska Money Market 4,038,389
Total Pooled Investment Funds 137,436,186 39.87%Collective Investment Funds (1)State Street Global Advisors
Money Market Fund 1,000,844 S&P Stock Index Fund 37,330,974 Russell 3000 Index 16,164,942 Real Estate Investment Trust Index 5,458,575 World Equity Ex-U.S. Index 27,970,458 Long U.S. Treasury Bond Index 546,623 Treasury Inflation Protected Securities Index 2,041,125 World Government Bond Ex-U.S. Index 3,676,508 Global Balanced Fund 10,128,188
BarclaysDaily Government/Corporate Bond Fund 18,082,403 Intermediate Bond Fund 389,687
Brandes InstitutionalInternational Equity Fund 31,378,068
RCMSocially Responsible Fund 5,315,268
T. Rowe PriceSmall-Cap Fund 41,387,511
Total Collective Investment Funds 200,871,174 58.28%
Total Invested Assets $ 344,683,147 100.00% (1) Pooled Investment Funds and Collective Investment Funds are participant directed and therefore are not subject to an asset allocation.
Public Employees’ Retirement SystemInvestment Summary Schedule
June 30, 2013
Alaska Public Employees’ Retirement System • FY 2013 CAFR 97
Investment Section
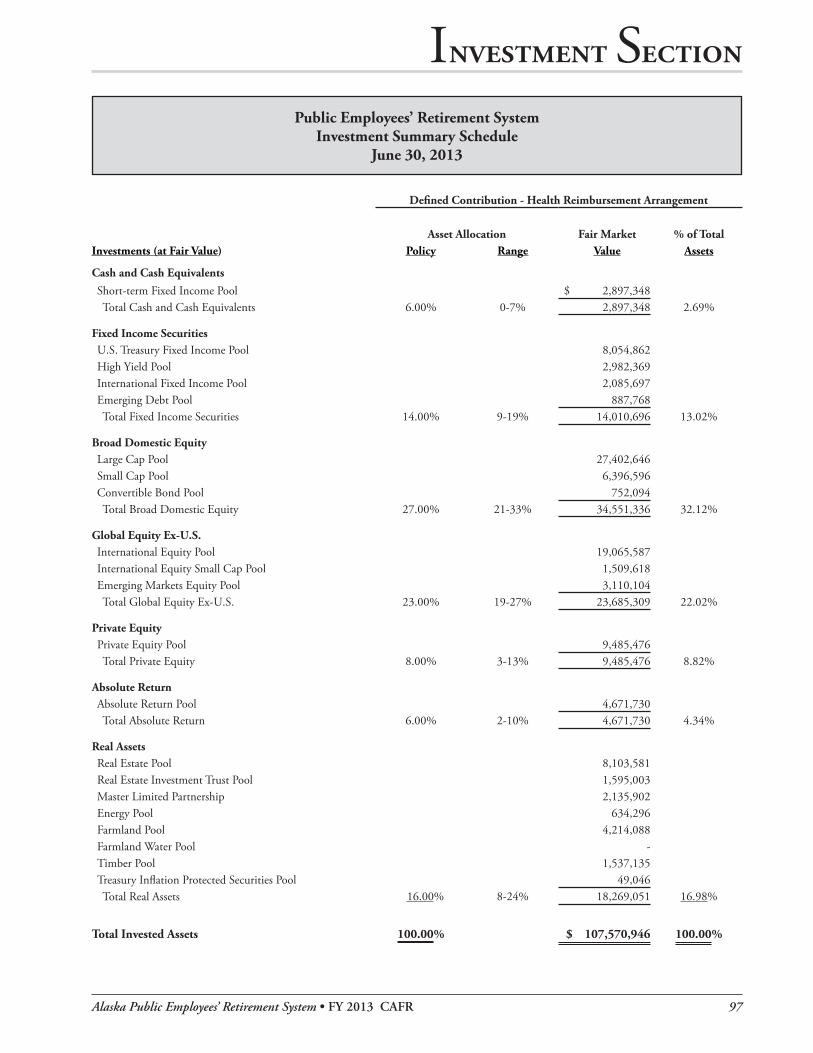
Defined Contribution - Health Reimbursement Arrangement
Asset Allocation Fair Market % of TotalInvestments (at Fair Value) Policy Range Value Assets
Cash and Cash Equivalents Short-term Fixed Income Pool $ 2,897,348Total Cash and Cash Equivalents 6.00% 0-7% 2,897,348 2.69%
Fixed Income SecuritiesU.S. Treasury Fixed Income Pool 8,054,862High Yield Pool 2,982,369International Fixed Income Pool 2,085,697Emerging Debt Pool 887,768Total Fixed Income Securities 14.00% 9-19% 14,010,696 13.02%
Broad Domestic EquityLarge Cap Pool 27,402,646Small Cap Pool 6,396,596Convertible Bond Pool 752,094Total Broad Domestic Equity 27.00% 21-33% 34,551,336 32.12%
Global Equity Ex-U.S.International Equity Pool 19,065,587International Equity Small Cap Pool 1,509,618Emerging Markets Equity Pool 3,110,104Total Global Equity Ex-U.S. 23.00% 19-27% 23,685,309 22.02%
Private EquityPrivate Equity Pool 9,485,476Total Private Equity 8.00% 3-13% 9,485,476 8.82%
Absolute ReturnAbsolute Return Pool 4,671,730Total Absolute Return 6.00% 2-10% 4,671,730 4.34%
Real AssetsReal Estate Pool 8,103,581Real Estate Investment Trust Pool 1,595,003Master Limited Partnership 2,135,902Energy Pool 634,296Farmland Pool 4,214,088Farmland Water Pool -Timber Pool 1,537,135Treasury Inflation Protected Securities Pool 49,046Total Real Assets 16.00% 8-24% 18,269,051 16.98%
Total Invested Assets 100.00% $ 107,570,946 100.00%
Public Employees’ Retirement SystemInvestment Summary Schedule
June 30, 2013

98 Alaska Public Employees’ Retirement System • FY 2013 CAFR
Investment Section
Defined Contribution - Occupational Death & Disability
Asset Allocation Fair Market % of TotalInvestments (at Fair Value) Policy Range Value Assets
Cash and Cash Equivalents Short-term Fixed Income Pool $ 265,738 Total Cash and Cash Equivalents 6.00% 0-7% 265,738 2.30%
Fixed Income SecuritiesU.S. Treasury Fixed Income Pool 866,814High Yield Pool 320,946International Fixed Income Pool 224,446Emerging Debt Pool 95,537Total Fixed Income Securities 14.00% 9-19% 1,507,743 13.08%
Broad Domestic EquityLarge Cap Pool 2,948,969Small Cap Pool 688,381Convertible Bond Pool 80,935Total Broad Domestic Equity 27.00% 21-33% 3,718,285 32.25%
Global Equity Ex-U.S.International Equity Pool 2,051,753 International Equity Small Cap Pool 162,458 Emerging Markets Equity Pool 334,691 Total Global Equity Ex-U.S. 23.00% 19-27% 2,548,902 22.11%
Private EquityPrivate Equity Pool 1,020,770 Total Private Equity 8.00% 3-13% 1,020,770 8.85%
Absolute ReturnAbsolute Return Pool 502,743 Total Absolute Return 6.00% 2-10% 502,743 4.36%
Real AssetsReal Estate Pool 872,059 Real Estate Investment Trust Pool 171,646 Master Limited Partnership Pool 229,856 Energy Pool 68,259 Farmland Pool 453,495 Farmland Water Pool - Timber Pool 165,418 Treasury Inflation Protected Securities Pool 5,278 Total Real Assets 16.00% 8-24% 1,966,011 17.05%
Total Invested Assets 100.00% $ 11,530,192 100.00%
Public Employees’ Retirement SystemInvestment Summary Schedule
June 30, 2013

Alaska Public Employees’ Retirement System • FY 2013 CAFR 99
Investment Section
Defined Contribution - Retiree Medical Plan
Asset Allocation Fair Market % of TotalInvestments (at Fair Value) Policy Range Value Assets
Cash and Cash Equivalents Short-term Fixed Income Pool $ 502,666 Total Cash and Cash Equivalents 6.00% 0-7% 502,666 2.45%
Fixed Income SecuritiesU.S. Treasury Fixed Income Pool 1,541,203 High Yield Pool 570,643 International Fixed Income Pool 399,068 Emerging Debt Pool 169,864 Total Fixed Income Securities 14.00% 9-19% 2,680,778 13.06%
Broad Domestic EquityLarge Cap Pool 5,243,277 Small Cap Pool 1,223,942 Convertible Bond Pool 143,905 Total Broad Domestic Equity 27.00% 21-33% 6,611,124 32.20%
Global Equity Ex-U.S.International Equity Pool 3,648,026 International Equity Small Cap Pool 288,852 Emerging Markets Equity Pool 595,084 Total Global Equity Ex-U.S. 23.00% 19-27% 4,531,962 22.07%
Private EquityPrivate Equity Pool 1,814,936 Total Private Equity 8.00% 3-13% 1,814,936 8.84%
Absolute ReturnAbsolute Return Pool 893,882 Total Absolute Return 6.00% 2-10% 893,882 4.35%
Real AssetsReal Estate Pool 1,550,526 Real Estate Investment Trust Pool 305,188 Master Limited Partnership Pool 408,686 Energy Pool 121,365 Farmland Pool 806,317 Farmland Water Pool -Timber Pool 294,113 Treasury Inflation Protected Securities Pool 9,384 Total Real Assets 16.00% 8-24% 3,495,579 17.03%
Total Invested Assets 100.00% $ 20,530,927 100.00%
Public Employees’ Retirement SystemInvestment Summary Schedule
June 30, 2013

100 Alaska Public Employees’ Retirement System • FY 2013 CAFR
Investment Section
Fund
Domestic Equity Pool
International Equity Pool Total
Defined Benefit Plan - Pension $47,965 $28,221 $76,186Defined Benefit Plan - Alaska Retiree Healthcare Trust 41,053 24,267 65,320Defined Contribution Retirement Plan - Health Reimbursement Arrangement 617 381 998Defined Contribution Retirement Plan - Occupational Death & Disability - Peace Officer/Firefighter 21 13 34Defined Contribution Retirement Plan - Occupational Death & Disability - All Others 51 31 82Defined Contribution Retirement Plan - Retiree Medical Pan 125 76 201Total Recaptured Commission Fees $ 89,832 $ 52,989 $ 142,821
The ARMB’s Commission Recapture program has been in place since 1995, first working with various brokers then switching to the State Street program in 2005. Under a commission recapture program a portion of the commissions and mark-ups on trades (placed through the State Street broker network) flow directly back to the fund.
The program allows managers to place trades for commission recapture purposes. The ARMB has established direction percentages for the managers to strive for, but is only requiring best efforts to meet them given their fiduciary obligation to achieve best execution of transactions.
The current rebate arrangement with State Street Global Markets (SSGM) is: 90% of the commissions received in excess of executing the brokers’ execution-only rates; 100% of commissions in excess of its execution-only rates for all trading directed through SSGM.
Public Employees’ Retirement System Recaptured Commission Fees
Year Ended June 30, 2013