Investment Section - IN.gov Report from the Chief Investment Officer 123 Outline of ... ensure...
38
2016 COMPREHENSIVE ANNUAL FINANCIAL REPORT For the Fiscal Year Ended June 30, 2016 113 Report on Investment Activities 116 Report from the Chief Investment Officer 123 Outline of Investment Policies 125 Investment Summary Investment Results – Consolidated Defined Benefit Assets 126 Assets by Retirement Plan 127 Asset Allocation Summary: June 30, 2016 Actual vs. June 30, 2015 Actual 128 Asset Allocation Summary: June 30, 2016 Actual vs. Target 129 Annualized Time-Weighted Rate of Return by Asset Class vs. Benchmark Returns 130 Asset Class Summaries 138 Historical Comparative Investment Results 139 Ten-Year Time-Weighted Investment Rates of Return 140 Statistical Performance Investment Results – Annuity Savings Accounts and Legislators’ Defined Contribution Plan 141 Assets by Investment Option 142 Historical Annualized Time-Weighted Rate of Return by Investment Option vs. Benchmark Returns 143 Annuity Savings Accounts Ten-Year Guaranteed Fund Interest Crediting Rates Investment Information 144 Largest Assets Held as of June 30, 2016 145 Top Ten Brokers’ Commission Fees 145 Investment Management Fees 146 Investment Professionals Investment Section
Transcript of Investment Section - IN.gov Report from the Chief Investment Officer 123 Outline of ... ensure...

2016 COMPREHENSIVE ANNUAL FINANCIAL REPORTFor the Fiscal Year Ended June 30, 2016
113 Report on Investment Activities116 Report from the Chief Investment Officer123 Outline of Investment Policies125 Investment Summary
Investment Results – Consolidated Defined Benefit Assets
126 Assets by Retirement Plan127 Asset Allocation Summary: June 30, 2016 Actual vs. June 30, 2015 Actual128 Asset Allocation Summary: June 30, 2016 Actual vs. Target129 Annualized Time-Weighted Rate of Return by Asset Class vs. Benchmark Returns130 Asset Class Summaries138 Historical Comparative Investment Results139 Ten-Year Time-Weighted Investment Rates of Return140 Statistical Performance
Investment Results – Annuity Savings Accounts and Legislators’ Defined Contribution Plan
141 Assets by Investment Option142 Historical Annualized Time-Weighted
Rate of Return by Investment Option vs. Benchmark Returns143 Annuity Savings Accounts Ten-Year Guaranteed Fund Interest Crediting Rates
Investment Information
144 Largest Assets Held as of June 30, 2016145 Top Ten Brokers’ Commission Fees145 Investment Management Fees146 Investment Professionals
Investment Section

INVESTMENT SECTION 113
Report on Investment Activities
August 8, 2016
Board of Trustees
Indiana Public Retirement System
One North Capitol Avenue
Indianapolis, IN 46204
Dear Trustees:
As Indiana Public Retirement System’s (INPRS) general consultant, Verus Advisory is pleased to
provide the Board of Trustees with an overview of the market environment for the fiscal year ended
June 30, 2016 as well as an update on performance and a summary of recent developments.
Investment Landscape
The 2016 fiscal year was marked by continued challenges in the global economy and capital
markets; where continued volatility in equity, energy, and currency markets prompted central banks
globally to foster low and even negative interest rate policies.
The U.S. continued its moderate recovery during fiscal year 2016 with real GDP growth of 2.1 percent
(as of March 31st) year over year, positive but below the long-term trend. Headline inflation was
1.0 percent during the period. Our research suggests that the current cycle, while above average in
terms of duration, has resulted in lower cumulative economic growth than most prior cycles. The
labor market in the U.S. continues to improve with headline U-3 unemployment at 4.9 percent as
of June 30, 2016; the participation rate declines of the last several years appear to have stabilized.
The fiscal year began with concerns over an economic slowdown in China and continued pressure
on energy markets causing broadly negative sentiment across risk markets. INPRS was not immune
to this sell-off, and this market downturn cost the portfolio approximately 4.0 percent during the
third quarter of 2015.
In the fourth quarter of 2015, disinflationary pressures continued globally prompting the European
Central Bank to push deposit rates further into negative territory. The U.S. dollar appreciated to its
highest level since 2003 relative to a trade weighted basket of currencies. The most notable event
in markets was the Federal Reserve raising the fed funds rate for the first time since the Global
Financial Crisis, creating a notable divergence in central bank policies between the U.S. and other
developed markets.
Indiana Public Retirement System

114 INVESTMENT SECTION
Report on Investment Activities, continued
The first quarter of 2016 witnessed a precipitous drop in equity markets as recessionary fears
escalated. With the Federal Reserve offering more dovish commentary, oil prices finding a bottom,
and economic stimulus propping up China’s economy, markets quickly stabilized and re-traced new
highs, with emerging markets seeing a particularly significant recovery.
The second quarter of 2016 ended with Brexit where the U.K. voted to leave the EU catching the
market by surprise. Brexit led to a short-term market sell-off followed by most markets snapping
back relatively quickly. More impactful to performance for INPRS has been interest rates continued
move lower; as of June 30, 2016 approximately one third of all global government bonds were
trading with a negative yield, more than $10 trillion in market value. Two of the largest sovereign
bond markets outside the U.S., German and Japanese yield curves had negative yields out to the 15
year tenor.
Plan Performance1
The INPRS investment portfolio (“the Portfolio”) earned a 1.2 percent return net of fees for the
fiscal year ending June 30, 2016. This return trailed the policy index return by 20 basis points and
the long-term actuarial assumed return, of 6.75 percent, by 5.6 percent. However, INPRS’ one-year
return did exceed the median of a public funds universe2 which earned 0.8 percent.
As previously discussed, the largest driver of returns during the fiscal year was depreciation in
global public equities (which in turn was largely driven by a strengthening U.S. dollar) and weaker
commodity markets offset by lower interest rates driving bond prices higher. On an absolute basis,
exposure to global private equity, global fixed income, real estate and risk parity were positive,
while investments in public equity, commodities, and hedge funds were negative.
The Portfolio’s investments in private equity, global fixed income and risk parity exceeded their
respective composite benchmarks. Private equity returned 6.8 percent on a time-weighted basis,
exceeding the public market equivalent benchmark (Russell 3000 + 3.0 percent) by 1.7 percent;
being overweight in this asset class was additive to returns. Inflation-linked bonds returned 5.4
percent and exceeded the benchmark by 10 basis points. Risk parity strategies generated returns of
1.7 percent, outperforming the composite’s custom benchmark by 90 basis points.
Global public equity strategies fell 4.3 percent over the period, the broad market index fell 3.9
percent. The nominal fixed income portfolio returned 8.9 percent, trailing its benchmark by 0.4
percent. Despite a 14 percent return in commodities for the first six months of 2016, the fiscal year
return was (19.6) percent, trailing the benchmark by 1.2 percent. Real estate strategies generated
returns of 8.1 percent trailing its benchmark by 4.5 percent over the fiscal year while absolute
return lost 2.9 percent.1Rates of return are net of fees and based on calculations made by the System’s custodian, Bank of New York Mellon, and are presented using a time weighted rate of return methodology based upon market value.2Bank of New York Mellon Universe of Public Funds
Indiana Public Retirement System

Indiana Public Retirement System
INVESTMENT SECTION 115
Report on Investment Activities, continued
On a longer term basis, the portfolio has generated 4.8 percent annually over the last three years
and 4.2 percent over the last five years. Consistent with the INPRS’ goal of minimizing investment
risk, the realized standard deviation of the program has averaged less than 6.0 percent for the last
five years.
Plan Activity
After a 2015 fiscal year that focused on ensuring the asset allocation was aligned with the
enterprise objectives (completed through an asset-liability study), during 2016 Verus worked with
INPRS staff on a number of strategic initiatives designed to maximize the overall efficiency of the
portfolio. This included implementation of a cash securitization strategy which should improve
realized returns and decrease the operational burdens associated with liquidity management.
Verus has also worked with staff on evaluating the merits of internalizing certain investment
management functions in an effort to reduce the fees paid to third-party investment managers
and further improve the in-house intellectual capital. A comprehensive study regarding the
appropriateness of investment management fees has also been conducted. Verus and INPRS staff
have undertaken analyses focused on revisiting the role of commodities in the context of the
current disinflationary cycle. The collaboration on this effort has provided additional insight relative
to the risk exposure within the portfolio, including how risk is defined from a liquidity perspective
and how INPRS can utilize measurement of risk factors in the portfolio rebalancing process.
All of us here at Verus appreciate the opportunity to assist in meeting the investment objectives
set forth by the INPRS Board. We are confident in the direction of the portfolio given the INPRS’
demographics and fiscal strength. We look forward to continuing our partnership as we navigate
ever-changing capital markets.
Sincerely,
Jeffrey J. MacLean
Chief Executive Officer

Indiana Public Retirement System
116 INVESTMENT SECTION
Report from the Chief Investment Officer
INPRS’ Investment Imperatives1
Established in fiscal year 2012, three long-term imperatives that are vital to the continued health of the System’s defined
benefit plans have served as the guide for the investment staff. Every strategic, tactical, and operational decision that is
made must have the expectation of positively contributing to at least one of these imperatives.
1. Achieve the long-term rate of return assumption. Effective fiscal year 2013, INPRS’ Board set the long-term
rate of return assumption at 6.75 percent, and again last fiscal year, the Board reaffirmed 6.75 percent as the
appropriate long-term assumption. In order for the System to maintain a healthy funded status, it is essential to
achieve this rate of return over the long-term (defined as 10+ years in INPRS’ Investment Policy Statement).
2. Accomplish the first imperative as effectively and efficiently as possible. While it is important to establish an
asset allocation that is expected to meet the target rate of return over a long time horizon, as fiduciaries, it is also
important to maintain focus on maximizing the return per unit of risk, limiting return volatility, and maximizing cost
efficiency.
3. Maintain enough liquidity to make retirement payments on time. As the System matures, retirement payments
will be a greater cash outflow each year. As a result, it is critical to maintain an appropriate level of liquidity to
ensure payments are made on time and without causing undue stress to the investment portfolio.
Putting the Year in Perspective2
The consolidated defined benefit assets returned 1.2 percent net of all fees over the past fiscal year and ended with a market
value of $24.8 billion. Fiscal year 2016 was a continuation of the low return environment of the prior year as well as increased
volatility across asset classes. This was the second straight year that U.S. public equities experienced an intra-year sell-off
greater than 10.0 percent, which had not happened in the three years prior. Not to mention, commodities finished the year
down over 18.0 percent. Defying consensus views from market participants though, longer-dated U.S. Treasury bonds had
another banner year with a return greater than 16.0 percent. This combination of difficult to anticipate events, in addition to
many others not mentioned, continued to strengthen our belief in the importance of diversification and the avoidance of a
concentration in any one asset class.
The path toward reducing INPRS’ concentration in equities started in fiscal year 2012. Based on extensive research of the
various asset classes and their performance in different economic environments through time, it was determined that a new
risk-balanced framework better fit our first two imperatives. Developed from that research, the following chart illustrates
the projected range of outcomes for INPRS’ asset allocation around the 6.75 percent return target (dotted line). This visual
is meant to track the cumulative performance of the actual portfolio (solid line) versus those expectations along the way.
Although the portfolio has underperformed the return target since adopting the new asset allocation strategy in 2012, the
cumulative return is well within our range of expected outcomes.
1For more detail, see the INPRS’ Investment Policy Statement, Section 4 – Guiding Principles. 2Rates of return specific to INPRS’ portfolio are based on calculations made by the System’s custodian, Bank of New York Mellon, and are presented using a time-weighted rate of return methodology based upon market value.

Indiana Public Retirement System
INVESTMENT SECTION 117
Report from the Chief Investment Officer, continued
INPRS Net of Fees Cumulative Returns
21.9%
29.9%
-20%
0%
20%
40%
60%
80%
100%
Jun-
12
Jun-
13
Jun-
14
Jun-
15
Jun-
16
INPRS Net of Fees Cumulative Returns
Actual Cumulative Returns Target Cumulative Returns 1 Standard Deviation 2 Standard Deviation
INPRS ReturnsJuly 2012 - June 2016
Target:Annual Return = 6.75%Std. Dev = 10.00%
Actual:Annual Return = 5.07%Std. Dev. = 4.64%
The following table shows INPRS’ annual net-of-fees returns over the same time period. Since inception of the revised
strategy, the portfolio has generated an annual return of 5.0 percent above the return of cash and outperformed the average
historical spread for the asset allocation over cash (4.5 percent)3.
INPRS Annual Returns (Net of Fees)
Excess Return + Cash Return = Total Return
FY2016 1.0 % 0.2 % 1.2 %
FY2015 0.0 0.0 0.0
FY2014 13.6 0.1 13.7
FY2013 5.9 0.1 6.0
INPRS Annual Return 5.0 0.1 5.1
Avg. Annual Return of INPRS Target Asset Allocation (since 1937)4
4.5 3.6 8.1
The prior charts highlight the near-term challenges resulting from today’s low interest rate (and cash return) environment as
the Plan’s total performance has fallen short of the target rate of return assumption of 6.75 percent since 2012. However,
the target rate of return was established based on a much longer time horizon. As such, the asset allocation that was
constructed to meet the return objective will ultimately be measured over decades rather than years.
3A portfolio’s return in excess of cash is also known as the risk premium. Cash return based on three-month LIBOR (source: the System’s custodian, Bank of New York Mellon). 4Excess return presented by INPRS’ general consultant, Verus, at the June 2015 INPRS Board meeting. INPRS’ current target asset allocation was approximated historically using available indices. Cash return based on the one-month US Treasury bill return from 1937 - 2015 (source: Dimensional Fund Advisors’ Matrix Book 2016 of Historical Returns Data).

Indiana Public Retirement System
118 INVESTMENT SECTION
Report from the Chief Investment Officer, continued
Performance Attribution
Looking closer at fiscal year 2016, a majority of asset classes had positive returns, while asset classes that tend to perform
poorly when growth is lower than expected – public equities and commodities – struggled. Real estate and private equity
continued to post strong returns net of all fees, albeit on a lagged basis.5 More specifically, INPRS’ separate asset classes
and actual asset allocation generated the following returns:
For the Year Ended June 30, 2016
8.9% 8.1% 6.8% 5.4%1.7%
-2.9% -4.3%
-19.6%
1.2%
-30.0%
-20.0%
-10.0%
0.0%
10.0%
20.0%
Fixed Income - ExInflation-Linked
RealEstate
PrivateEquity
Fixed Income -Inflation-Linked
RiskParity
AbsoluteReturn
PublicEquity
Commodities INPRS
Fiscal YTD as of June 30, 2016
The chart above does not tell the full story, though, as there was a reversal in performance mid-year. The turning point
occurred in February 2016 as broad-based underperformance in the first seven months of the fiscal year threatened the
pace of improving global growth and, thus, caused the Federal Reserve and other global central banks to reconsider raising
interest rates or tightening policy any further. As a result, performance in the final five months of the fiscal year was much
improved, led by commodities and fixed income.6
4.8%
4.6%
0.2%
-0.6%
-1.0%
-8.7%
-11.3%
-31.8%
-5.2%
-50.0% -25.0% 0.0% 25.0% 50.0%
Real Estate
Private Equity
Fixed Income - Ex Inflation-Linked
Fixed Income - Inflation-Linked
Absolute Return
Risk Parity
Public Equity
Commodities
INPRS
Jul 2015 - Jan 2016
3.2%
2.1%
8.7%
6.0%
-1.9%
11.3%
7.9%
17.9%
6.8%
-50.0% -25.0% 0.0% 25.0% 50.0%
Real Estate
Private Equity
Fixed Income - Ex Inflation-Linked
Fixed Income - Inflation-Linked
Absolute Return
Risk Parity
Public Equity
Commodities
INPRS
Feb 2016 - Jun 2016
5Real estate and private equity performance is lagged one quarter due to the timing of valuations.6Although it was the second best performer from February to June, risk parity was not mentioned because it is a diversified allocation of equities, fixed income, and commodities.
July 2015 - Jan 2016 Feb 2016 - Jun 2016
-31.8%

Indiana Public Retirement System
INVESTMENT SECTION 119
Report from the Chief Investment Officer, continued
The following chart takes into account the weight of each asset class in the portfolio as well as its return over the past year.
By linking these components, we are able to observe the contribution to total return that each asset class provided. This
view serves as a better representation of performance given that our risk-balanced strategy produces an allocation that
invests less in more volatile asset classes (e.g. commodities) and more in less volatile asset classes (e.g. fixed income).
Fiscal YTD Contribution to Total Return (As of 6/30/16)
1.2%
-1.5%
-1.0%
-0.3%
0.1%
0.2%
0.4%
0.5%
0.9%
1.9%
-5.0% -3.0% -1.0% 1.0% 3.0% 5.0%
Total INPRS
Commodities
Public Equity
Absolute Return
Cash + Cash Overlay
Risk Parity
Fixed Income - Inflation-Linked
Real Estate
Private Equity
Fixed Income - Ex Inflation-Linked
Fiscal YTD Contribution to Total Return (As of 6/30/16)
In fiscal year 2016, INPRS experienced a return that was 0.2 percent below its target asset allocation benchmark, net of all
fees. The benchmark is meant to reflect what performance would have been had the portfolio been at target weights in each
asset class the entire year and invested in passive strategies. The tactical asset allocation decisions made by the team this
year produced a slight value-add. On the other hand, the public asset classes lagged their respective benchmarks resulting
in an underperformance of 0.3 percent, which more than offset the positive contributions from tactical asset allocation
decisions. Despite the underperformance relative to the overall benchmark this year, INPRS’ portfolio has produced
approximately $188 million in added value over a portfolio of merely passive investments (asset allocation + manager
selection) since reaching the revised asset allocation in July 2012.
Reflections from the Past Four Years
As previously mentioned, the System set out on a course seeking more balance across economic and market environments
starting in fiscal year 2012 with the approval of a new asset allocation strategy. Despite slight revisions to the asset
allocation during last year’s asset-liability study that resulted in a marginally higher expected return and return-risk ratio,
the outcome reaffirmed the path of diversification INPRS had previously chosen and continues to pursue. As such, INPRS
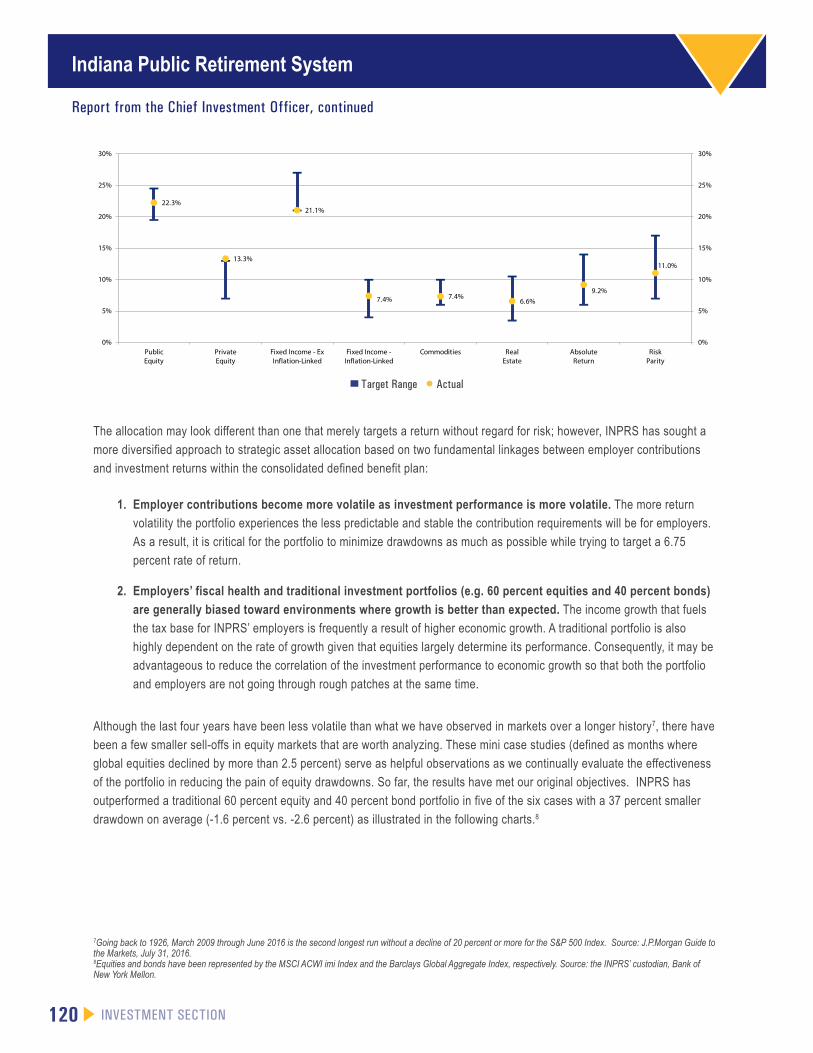
prudently moved toward the new target allocations over the course of fiscal year 2016. The allocation as of June 30, 2016
can be found in the chart on the following page.
Indiana Public Retirement System
120 INVESTMENT SECTION
Report from the Chief Investment Officer, continued
22.3%
13.3%
21.1%
7.4% 7.4%6.6%
9.2%
11.0%
0%
5%
10%
15%
20%
25%
30%
0%
5%
10%
15%
20%
25%
30%
PublicEquity
PrivateEquity
Fixed Income - ExInflation-Linked
Fixed Income -Inflation-Linked
Commodities RealEstate
AbsoluteReturn
RiskParity
Target Range Actual
The allocation may look different than one that merely targets a return without regard for risk; however, INPRS has sought a
more diversified approach to strategic asset allocation based on two fundamental linkages between employer contributions
and investment returns within the consolidated defined benefit plan:
1. Employer contributions become more volatile as investment performance is more volatile. The more return
volatility the portfolio experiences the less predictable and stable the contribution requirements will be for employers.
As a result, it is critical for the portfolio to minimize drawdowns as much as possible while trying to target a 6.75
percent rate of return.
2. Employers’ fiscal health and traditional investment portfolios (e.g. 60 percent equities and 40 percent bonds)
are generally biased toward environments where growth is better than expected. The income growth that fuels
the tax base for INPRS’ employers is frequently a result of higher economic growth. A traditional portfolio is also
highly dependent on the rate of growth given that equities largely determine its performance. Consequently, it may be
advantageous to reduce the correlation of the investment performance to economic growth so that both the portfolio
and employers are not going through rough patches at the same time.
Although the last four years have been less volatile than what we have observed in markets over a longer history7, there have
been a few smaller sell-offs in equity markets that are worth analyzing. These mini case studies (defined as months where
global equities declined by more than 2.5 percent) serve as helpful observations as we continually evaluate the effectiveness
of the portfolio in reducing the pain of equity drawdowns. So far, the results have met our original objectives. INPRS has
outperformed a traditional 60 percent equity and 40 percent bond portfolio in five of the six cases with a 37 percent smaller
drawdown on average (-1.6 percent vs. -2.6 percent) as illustrated in the following charts.8
7Going back to 1926, March 2009 through June 2016 is the second longest run without a decline of 20 percent or more for the S&P 500 Index. Source: J.P.Morgan Guide to the Markets, July 31, 2016.8Equities and bonds have been represented by the MSCI ACWI imi Index and the Barclays Global Aggregate Index, respectively. Source: the INPRS’ custodian, Bank of New York Mellon.
▀ Target Range • Actual

Indiana Public Retirement System
INVESTMENT SECTION 121
Equity Drawdowns: INPRS vs 60/40 Portfolio
While there is still work to be done to ensure future equity drawdowns do not have damaging effects on the portfolio and thus
employer contributions, analysis of the first real-time examples we have observed leave us encouraged that we have headed
down the appropriate path.
Focus on Continual Improvement
There has been an evolution in culture over the past five years as the INPRS investment team has conscientiously focused
more attention on risk management across each function of the investment process. This shift has resulted in enhancements
to our portfolio risk reporting, fee reporting, external investment manager diligence, and compliance function to name a few.
The focus on continual improvement was no different in fiscal year 2016 as the team completed projects associated with fee
management and liquidity.
Related to the second investment imperative, effectiveness and efficiency, INPRS continued to negotiate fees and cut
costs where possible. As a resource to use in these efforts going forward, INPRS participated in a public pension fee study
conducted by CEM Benchmarking. The benchmarking study compared the cost of INPRS’ asset allocation and subsequent
performance to CEM’s extensive database of similar-sized public pension plans. After neutralizing for differences in asset
allocation across plans, CEM reported that INPRS’ annual investment fees were lower than the average peer plan.9 While it
is important for the team to remain vigilant in minimizing fees, the ultimate barometer of success will be performance net of
all fees. Examining the benefit from fees paid over the past five years, CEM reported that INPRS’ outperformance over its
passive benchmark (0.3 percent annually net of all fees) was in the top half of the peer universe.
9INPRS’ fees were 0.02% lower than the average peer plan. Report as of December 31, 2014.
-2.73%-2.31%
-5.00%
-4.00%
-3.00%
-2.00%
-1.00%
0.00%
INPRS 60/40
June 2013
-0.44%
-1.66%
-5.00%
-4.00%
-3.00%
-2.00%
-1.00%
0.00%
INPRS 60/40
January 2014
-2.11% -2.25%
-5.00%
-4.00%
-3.00%
-2.00%
-1.00%
0.00%
INPRS 60/40
September 2014
-1.96%
-4.13%
-5.00%
-4.00%
-3.00%
-2.00%
-1.00%
0.00%
INPRS 60/40
August 2015
-1.33%
-1.96%
-5.00%
-4.00%
-3.00%
-2.00%
-1.00%
0.00%
INPRS 60/40
September 2015
-1.19%
-3.17%
-5.00%
-4.00%
-3.00%
-2.00%
-1.00%
0.00%
INPRS 60/40
January 2016
Report from the Chief Investment Officer, continued

Indiana Public Retirement System
122 INVESTMENT SECTION
Focusing on the third investment imperative, liquidity, INPRS continues to strive for greater precision in determining the
optimal amount of liquid assets to keep on-hand while minimizing the performance drag from low cash returns. A good
example in fiscal year 2016 was the implementation of a cash overlay program. The securities used to construct the overlay
attempt to match INPRS’ target asset allocation as closely as possible while enabling us to maintain a similar cash profile.
Inside and outside of the overlay portfolio, INPRS is positioned to deliver adequate liquidity for retirement payments. As of
June 30, 2016, INPRS estimates 30 percent of the Consolidated Defined Benefit Assets could be liquidated in one week, 68
percent of the portfolio could be liquidated within one month, and 78 percent of the portfolio could be liquidated within six
months without a significant market impact.
Looking Forward
I have found my first six years at INPRS, first as Director of Public Equity and then Deputy CIO, to be greatly fulfilling.
Now as CIO, I will continue to maintain focus on ensuring that INPRS achieves its imperatives over the coming years and
decades. While the current environment may make it difficult to achieve the return component in the near-term, I have
confidence in the strong culture and team we have at INPRS. This foundation allows me to be optimistic over the long-term
that we can meet each of the imperatives outlined above.
Sincerely,
Scott B. Davis, CFA
Chief Investment Officer
Report from the Chief Investment Officer, continued

Indiana Public Retirement System
INVESTMENT SECTION 123
Outline of Investment Policies
The Indiana Public Retirement System’s (“INPRS”) Board of Trustees (“Board”) serves as the ultimate fiduciary of
INPRS. Indiana Code, Article 5-10.5 provides that a nine-member Board of Trustees will oversee INPRS. The nine
trustees shall be appointed by the Governor, four of whom must be members of INPRS. The INPRS Board of Trustees
appoints the executive director of INPRS.
The Board establishes investment policies; however, Indiana law establishes guidelines on the investment of the Fund’s
assets. At all times, INPRS must invest its assets in accordance with the “Prudent Investor” standard. Under this standard,
investment decisions are based upon the same degree of care that a prudent person acting in a like capacity and familiar
with such matters would use in the conduct of an enterprise of a similar character with similar aims.
The objective of the Board’s Investment Policy Statement (“IPS”) is to maintain adequate funding for each retirement fund and
pension system in order to provide for the payment of such fund’s actuarially determined liabilities over time in a cost-effective
manner. The purpose of the IPS is to support this general objective by:
�� Setting forth the investment policies which the Board judges to be appropriate and prudent, in consideration of the
needs and legal requirements applicable to direct investment of the assets;
�� Making a clear distinction between the roles and responsibilities of the Board, Staff, and each Service Provider;
�� Establishing formalized criteria to measure, monitor and evaluate the performance results of the Investment
Managers;
�� Communicating the investment policies, objectives, guidelines, and performance criteria of the Board to the Staff,
Investment Managers, Consultants, Service Providers, employers, members and all other interested parties; and
�� Serving as a review document to guide the ongoing oversight of the investments by the System and demonstrating
that the Board is fulfilling its fiduciary responsibilities in the administration and management of each Retirement
Fund’s assets solely in the interests of such Retirement Fund’s members and beneficiaries.
The Board intends for the IPS to be a dynamic document, and, as such, expects to conduct periodic reviews utilizing input
from INPRS staff, consultants and other knowledgeable parties. The Board anticipates approving changes from time to
time to reflect changes in any or all of: economic and market conditions, investment opportunities, the System’s investment
strategy, benefit provisions, and the INPRS’s governance.
The Board recognizes that the allocation of assets is the most important determinant of investment rates of returns over long
periods of time. The procedure for determining the allocation will consider the relevant characteristics of the liabilities and
the potential assets of the Fund. An asset liability study will be conducted no less than every three years and will analyze the
expected returns of various asset classes, projected liabilities, risks associated with alternative asset mix strategies and their
effect on the projected market value of assets, funded status, and contributions to the Fund.
With a long-term investment focus, the portfolio is invested across the following asset classes: Public Equity, Private Equity,
Fixed Income - Ex Inflation-Linked, Fixed Income - Inflation-Linked, Commodities, Real Estate, Absolute Return, and Risk
Parity. The current asset allocation, approved by the Board on October 23, 2015 is as follows:

Indiana Public Retirement System
124 INVESTMENT SECTION
Outline of Investment Policies, continued
INPRS Asset Allocation: Target Allocation Target Range Benchmark
Public Equity 22.0 % 19.5 to 24.5 % MSCI All Country World
Private Equity 10.0 7.0 to 13.0 Russell 3000 + 300bps
Fixed Income – Ex Inflation-Linked 24.0 21.0 to 27.0 Custom Benchmark
Fixed Income – Inflation-Linked 7.0 4.0 to 10.0 Custom Benchmark
Commodities 8.0 6.0 to 10.0 Custom Benchmark
Real Estate 7.0 3.5 to 10.5 NCREIF NFI-ODCE
Absolute Return 10.0 6.0 to 14.0 HFRI Fund of Funds Composite
Risk Parity 12.0 7.0 to 17.0 Custom Benchmark
The Board employs investment managers to implement the asset allocation through a selective and thorough search process
that embodies the principles of procedural due diligence. It is the intent of the Board to encourage the participation of all qualified
organizations in this process. The Board encourages investment managers to develop long-term investment strategies consistent
with the guidelines outlined in the IPS, as well as governing Indiana statutes. Additionally, investment managers will adhere to and
comply with the CFA Institute Global Investment Performance Standards in calculating and reporting investment performance.
Performance of each manager is measured against the rate of return associated with appropriate market index benchmarks and an
appropriate universe or style peer group of investment managers.
Annuity Savings Accounts (ASA) are accounts established for each member of the Public Employees’ Retirement Fund and the
Teachers’ Retirement Fund (Pre-1996 Account and 1996 Account). A member’s account is credited with the legislated 3 percent
mandatory contribution (either paid by the member or the employer). The member has investment direction to several alternative
funds or may direct contributions to the Guaranteed Fund. The ASA produces an additional separate benefit from the fixed-formula
employer funded pension benefit to the member. The ASA investment options currently include:
1. Large Cap Equity Index Fund;
2. Small/Mid Cap Equity Fund;
3. International Equity Fund;
4. Fixed Income Fund;
5. Inflation Linked Fixed Income Fund;
6. Target-Date Retirement Funds;
7. Money Market Fund;
8. Stable Value Fund (PERF ASA Only & Legislators’ Plan only);
9. Consolidated Defined Benefit Assets (Legislators’ Plan only);
10. Guaranteed Fund
The Guaranteed Fund provides a guarantee of the value of an individual’s contributions plus any interest credited. The INPRS
Board of Trustees annually establishes the interest crediting rate for the Guaranteed Fund based on a uniform methodology. The
interest crediting rate for the Guaranteed Fund during the last 10 years is included in the Investment Highlights of this section.
The number and types of investment funds offered will be periodically reviewed by the Board in order to ensure diversity of
investment alternatives, adequate and reasonable availability of investment types, and clarity and usefulness of the investment
choices. ASA performance data is included in the Investment Highlights of this section.
Fund Fact Sheets for the aforementioned ASA investment options, are available online at:
http://www.in.gov/inprs/fundfactsheets.htm

Indiana Public Retirement System
INVESTMENT SECTION 125
Investment SummaryAs of June 30, 2016
(dollars in millions)ActualAssets Percent
Consolidated Defined Benefit Assets:
Defined Benefit Retirement Plans' Assets $ 24,766.6 82.7 %
Legislators' Defined Contribution Plan (LEDC Plan)1 9.0 -
Total Consolidated Defined Benefit Assets 24,775.6 82.7
Annuity Savings Accounts (ASA) Assets2:
Public Employees' Retirement Fund (PERF) 2,613.1 8.7
Teachers' Retirement Fund Pre-1996 Account (TRF Pre-1996) 1,277.5 4.3
Teachers’ Retirement Fund 1996 Account (TRF 1996) 1,217.8 4.1
Total Annuity Savings Accounts Assets 5,108.4 17.1
Legislators' Defined Contribution Plan3 19.0 0.1
Pension Relief Fund4 26.9 0.1
Death Benefit Funds5 14.6 -
Total Investments6 $ 29,944.5 100.0 %
1Assets represent members of the LEDC Plan who have elected the Consolidated Defined Benefit Assets option. 2ASA assets are directed by PERF, TRF Pre-1996 and TRF 1996 members outside the Consolidated Defined Benefit Assets. 3Account balances directed outside the Legislators’ Consolidated Defined Benefit Assets option. 4Assets are invested in a Money Market Fund with Bank of New York Mellon. 5Includes State Employees' Death Benefit Fund and Public Safety Officers' Special Death Benefit Fund. 6Includes Investment Receivables, Foreign Exchange Contracts Receivables, Interest and Dividend Receivables, Securities Lending Collateral, Investment Payables, Foreign Exchange Contracts Payables, Securities Lending Obligations, and Obligations Under Reverse Repurchase Agreements.
82.7%
0.2%
17.1% Total Consolidated Defined Benefit Assets
Total ASA Assets
LEDC Plan, Pension Relief Fund,Death Benefit Funds

126 INVESTMENT SECTION
Assets by Retirement PlanAs of June 30, 2016
(dollars in millions)
Retirement Plan Amount Percent
Public Employees' Retirement Fund $ 11,198.7 45.2 %
Teachers' Retirement Fund Pre-1996 Account 3,609.4 14.6
Teachers' Retirement Fund 1996 Account 4,399.8 17.8
1977 Police Officers' and Firefighters' Pension and Disability Fund 4,950.0 20.0
Judges' Retirement System 441.7 1.8
State Excise Police, Gaming Agent, Gaming Control Officer, andConservation Enforcement Officers’ Retirement Plan 111.3 0.4
Prosecuting Attorneys' Retirement Fund 52.8 0.2
Legislators' Retirement System – Defined Benefit Plan 2.9 -
Legislators' Retirement System – Defined Contribution Plan 9.0 -
Total Consolidated Defined Benefit Assets1 $ 24,775.6 100.0 %
1Includes Investment Receivables, Foreign Exchange Contracts Receivables, Interest and Dividend Receivables, Securities Lending Collateral, Investment Payables, Foreign Exchange Contracts Payables, Securities Lending Obligations, and Obligations Under Reverse Repurchase Agreements.
45.2%
14.6%
20.0%
1.8%0.4%
0.2%
Public Employees’ Retirement Fund
Teachers’ Retirement Fund Pre-1996 Account
Teachers’ Retirement Fund 1996 Account
1977 Police Officers’ and Firefighters‘Pension and Disability Fund
Judges’ Retirement System
Excise, Gaming and Conservation
Prosecuting Attorneys’ Retirement Fund17.8%
Investment Results – Consolidated Defined Benefit Assets

INVESTMENT SECTION 127
Asset Allocation Summary: June 30, 2016 Actual vs. June 30, 2015 Actual
(dollars in millions) June 30, 2016 June 30, 2015
Asset Class Amount Percent Amount Percent
Public Equity $ 5,511.8 22.3 % $ 5,521.0 22.4 %
Private Equity 3,304.5 13.3 3,181.0 12.9
Fixed Income – Ex Inflation-Linked1 5,216.4 21.1 5,335.7 21.6
Fixed Income – Inflation-Linked 1,838.0 7.4 2,455.9 10.0
Commodities 1,822.0 7.4 1,850.5 7.5
Real Estate 1,629.8 6.6 1,518.9 6.2
Absolute Return 2,279.0 9.2 2,309.3 9.4
Risk Parity 2,736.4 11.0 2,457.5 10.0
Cash + Cash Overlay 437.7 1.7 - -
Total Consolidated Defined Benefit Assets2 $ 24,775.6 100.0 % $ 24,629.8 100.0 %
1Includes cash & cash equivalents for fiscal year ended June 30, 2015 only.2Amounts disclosed above will agree to the Pooled Unit Trust Investments in the Financial Section in Note 2 (H) Summary of Significant Accounting Policies. The amounts disclosed above are shown by investment strategy and will differ from the Statement of Net Position and the Summary of Investments Held in the Financial Section Note 3 (D) Cash and Investments, due to the investment strategy disclosure being related to a systematic plan to achieve returns and diversification and the Summary of Investments Held disclosure summarized by 1) the legal structure of the investments and 2) excluding Investment Receivables, Foreign Exchange Contracts Receivables, Interest and Dividend Receivables, Securities Lending Collateral, Investment Payables, Foreign Exchange Contracts Payables, Securities Lending Obligations, and Obligations Under Reverse Repurchase Agreements.
0%
5.0%
10.0%
15.0%
20.0%
25.0%
30.0%
2016 2015 2016 2015 2016 2015 2016 2015 2016 2015 2016 2015 2016 2015 2016 20162015 2015
22.3
%
13.3
%
21.1
%
7.4%
7.4%
6.6%
9.2%
11.0
%
1.7%
22.4
%
12.9
%
21.6
%
10.0
%
7.5%
6.2%
9.4%
10.0
%
Public Equity
Private Equity
Fixed Income – Ex Inflation-Linked
Fixed Income – Inflation-Linked
Commodities
Real Estate
Absolute Return
Risk Parity
Cash + Cash Overlay
Investment Results – Consolidated Defined Benefit Assets

128 INVESTMENT SECTION
Asset Allocation Summary: June 30, 2016 Actual vs. Target
Asset ClassJune 30, 2016
Actual Target
Allowable Range for
Investments
Public Equity 22.3 % 22.0 % 19.5 to 24.5 %
Private Equity 13.3 10.0 7.0 to 13.0
Fixed Income – Ex Inflation-Linked 21.1 24.0 21.0 to 27.0
Fixed Income – Inflation-Linked 7.4 7.0 4.0 to 10.0
Commodities 7.4 8.0 6.0 to 10.0
Real Estate 6.6 7.0 3.5 to 10.5
Absolute Return 9.2 10.0 6.0 to 14.0
Risk Parity 11.0 12.0 7.0 to 17.0
Cash + Cash Overlay1 1.7 N/A
Total Consolidated Defined Benefit Assets 100.0 % 100.0 %
1Includes cash, cash equivalents, and cash overlay. INPRS does not have a target allocation to cash as an asset class.
Note: Cash + Cash Overlay is not represented in the above chart as INPRS does not have a target allocation to cash as an asset class.
0%
5%
10%
15%
20%
25%
30%
Public Equity Private Equity Fixed Income – Ex Inflation-Linked
Fixed Income – Inflation-Linked
22.3%
Commodities Real Estate Absolute Return
Risk Parity
Target Range
21.1%
13.3%
7.4% 7.4% 6.6%9.2%
11.0%
Actual
0%
5%
10%
15%
20%
25%
30%
Investment Results – Consolidated Defined Benefit Assets

INVESTMENT SECTION 129
Annualized Time-Weighted Rate of Return by Asset Class vs. Benchmark ReturnsFor the Year Ended June 30, 2016
1-Year1
Asset ClassActual Return2
Benchmark Return2
Actual Over / (Under)
Benchmark Benchmark
Public Equity (4.3) % (3.9) % (0.4) MSCI All Country World IMI Index (MSCI ACWI)
Private Equity 6.8 5.1 1.7 Russell 3000 Index Plus 300 Basis Points
Fixed Income - Ex Inflation-Linked 8.9 9.3 (0.4) Custom Benchmark3
Fixed Income - Inflation-Linked 5.4 5.3 0.1 Custom Benchmark4
Commodities (19.6) (18.4) (1.2) Custom Benchmark5
Real Estate 8.1 12.6 (4.5) NCREIF Open End Diversified Core Equity Index (ODCE)
Absolute Return (2.9) (1.4) (1.5) HFRI Custom Benchmark6
Risk Parity 1.7 0.8 0.9 Custom Benchmark7
Cash + Cash Overlay 5.9 4.2 1.7 Custom Benchmark8
Total Consolidated Defined Benefit Assets 1.2 1.4 (0.2) Custom Benchmark
1Based on calculations made by the System's custodian, Bank of New York Mellon. Time-weighted rates of return have been reported for fiscal year 2016. 2Net of fees. 3Benchmark represents the sub-asset class target allocation within the fixed income portfolio over time. 4Global Inflation 70/30 is a 70% weight to Global Inflation-Linked Bonds (including U.S.) and a 30% weight to U.S. Inflation-Linked Bonds. 550% Bloomberg Commodity Index / 50% Goldman Sachs Commodity Index and a collateral component is a 75/25 blend of Global Inflation Linked Bonds (ILBs) and 90-day Treasury Bills respectively.6Weighted average of INPRS’ exposure to representative HFRI sub-strategy indices.760% MSCI ACWI IMI Index (Equities) / 40% Barclays Global Aggregate Bond Index (Bonds).8Benchmark represents the allocation to sub-asset class targets for the cash overlay starting in April 2016; prior to that, the 3-month Treasury Bill was the benchmark for cash.
Investment Results – Consolidated Defined Benefit Assets

130 INVESTMENT SECTION
Market Valueas of 06/30/2016
INPRS 1-YearNet Performance1
MSCI All Country World IMI Index 1-Year Performance
$5,511.8 Million (4.3)% (3.9)%
INPRS Allocation Portfolio Structure
Performance Attribution
INPRS’ public equity portfolio had a return of (4.3) percent for fiscal year 2016. The portfolio underperformed the benchmark by 0.4 percent as the underperformance from the domestic portfolio more than offset the outperformance from the international portfolio. The domestic portfolio’s underperformance was the result of an overweight to the small cap space and underperformance of large/mid cap active strategies.
Market Overview
Global equities, as represented by the MSCI All Country World IMI Index, were down 3.9 percent, over the year. Based on the Russell 3000 Index, domestic equities were up 2.1 percent over the fiscal year, while international equities were down 9.6 percent based on the MSCI ACWI ex US IMI Index.
For the first quarter of the fiscal year, INPRS’ global equity portfolio was down 10.0 percent. Global equity markets had a rough quarter mainly driven by concerns about slower growth within the Chinese economy and European Union countries. The Federal Reserve left interest rates unchanged while the European Central Bank indicated it might extend its QE program if needed.
In the second quarter, INPRS’ global equity portfolio was up 4.8 percent. Global equity markets generally recovered from the lows of the first quarter as concerns about a Chinese slowdown and geopolitical risks decreased. Energy and emerging markets continued to put downward pressure on the global equity markets.
In the third quarter, INPRS’ global equity portfolio was up 0.3 percent. While global equity markets had a volatile quarter, beginning calendar year 2016 with a steep loss in January, markets recovered by the end of the quarter as central banks renewed commitments to stimulate growth. Global economic data showed some improvement and oil prices recovered significantly from recent lows.
In the fourth quarter, INPRS’ global equity portfolio was up 1.1 percent. Another volatile quarter was the experience in equity markets as Brexit shocked the world at the end of June. Concern over slowing global growth, the future of the European Union, the impact of Brexit, the direction of interest rate, and the price of commodities contributed to increasing volatility in equity markets around the world.
1Investment performance is based on calculations made by the system’s custodian, Bank of New York Mellon, and are time weighted rates of return.
0.0% 5.0% 10.0% 15.0% 20.0% 25.0%
Current Target
22.0%
22.3%
50.3%
39.3%
45.8%
10.4%
52.4%33.7%
13.9%
54.2%
Portfolio Objective
The public equity portfolio seeks to provide long-term capital appreciation and income through exposure to public equity securities. INPRS uses a variety of external managers to create a globally diversified portfolio within the asset class. Historically, public equities have performed well in environments when actual economic growth came in higher than expectations and/or when actual inflation came in lower than expectations.
Regional Exposure
n Domestic (U.S.)n Developed International n Emerging Markets
Market Cap Exposure
n Large Capn Mid Cap n Small/Micro Cap
Investment Strategy
n Active n Passive
Asset Class Summary: Public Equity
Investment Results – Consolidated Defined Benefit Assets

INVESTMENT SECTION 131
Market Valueas of 06/30/2016
INPRS 1-YearNet Performance1
Russell 3000 plus 300 basis points 1-Year Performance
$3,304.5 Million 6.8% 5.1%
INPRS Allocation Portfolio Structure
Performance Attribution
The private equity portfolio returned 6.8 percent for fiscal year 2016, outpacing its benchmark return of 5.1 percent by 1.7 percent. The private equity portfolio also outperformed the Cambridge Associates Pooled IRR for the one year period, 8.9 percent versus 6.3 percent, respectively, and the since inception period, 11.4 percent versus 10.4 percent, respectively.
Secondary interests have led the way for the private equity portfolio returning 14.4 percent inception to date. Venture capital, buyouts, special situations, and Real Assets (energy) all proved to be accretive to the overall plan return generating 12.6 percent, 11.7 percent, 10.1 percent, and 11.1 percent, respectively.
Although the exit environment for private equity was not as consistently strong in fiscal year 2016 as in recent years past, INPRS’ private equity portfolio continued to receive positive net cash flows of $188 million. Distributions during the fiscal year totaled $750 million and contributions totaled $546 million.
Portfolio Overview
The private equity portfolio continues to maintain a home continent bias with over 80 percent of portfolio net asset value located in North America. Investments are well diversified by sub-asset class with buyout and venture capital / growth accounting for the largest portions of the portfolio at 44 percent and 25 percent, respectively.
The portfolio continues to mature with only 2.9 percent of net asset value now coming from pre-2006 funds and a weighted average fund age of seven years.
In fiscal year 2016, INPRS invested capital with nine managers across thirteen investments, totaling $669 million of new commitments. Commitments were made to managers in the buyout, real assets, and special situations sub-asset classes.
1Investment performance is based on calculations made by the system’s custodian, Bank of New York Mellon, and are time-weighted rates of return.
80.7%
13.0%
7.9%
6.3%
44.2%
13.8%
10.6%
25.4%
6.0%
11.5%10.7%
6.9%
9.2%
2.9%
Portfolio Objective
The private equity portfolio seeks to provide risk adjusted returns in excess of the public equity markets while simultaneously decreasing the volatility of the investment portfolio through diversification. The pivate equity portfolio is invested in the following sub-asset classes: venture and growth capital, buyout, energy, and debt related strategies.
0.5%
11.3%
0.0% 3.0% 6.0% 9.0% 12.0% 15.0%
Current Target
13.3%
10.0%
Investment by Region
n North America n Europe
n Rest of the World
Investment by Sub-Asset Class
n Venture/Growth n Buyout
n Special Situations n Real Assets
n Other
Investment by Vintage Year
9.6%
n 2016n 2015 n 2014 n 2013n 2012 n 2011n 2010n 2009n 2008n 2007n 2006n Pre-2006
2.3%
Asset Class Summary: Private Equity
20.5% 6.7%
Investment Results – Consolidated Defined Benefit Assets

132 INVESTMENT SECTION
INPRS Allocation Portfolio Overview
INPRS Benchmark
Duration to worst: 9.5 yrs 9.5 yrs
Yield to worst: 2.8% 2.8%
Credit quality: A2 / A A1 / A+
Performance AttributionFor fiscal year 2016, INPRS fixed income portfolio returned 8.9 percent, underperforming its benchmark by 0.4 percent. Active management within long duration bonds and emerging market debt were the main detractors from performance.
Market OverviewDuring fiscal year 2016, investors shifted focus from the U.S. economic recovery and the Fed’s dot plot to the negative global economic growth trend and the contagion effect it had on valuation of risk and risk-free assets. Markets experienced several significant shocks: (1) slower than expected Chinese growth, (2) a collapse of commodity prices, (3) trillions of dollars in negative yielding risk-free assets, and (4) Brexit; yet valuations of (both risk and risk-free assets) set all time highs. INPRS’ fixed income portfolio benefited from this anomaly but continued its cautious stance.
For the first quarter, uninspiring U.S. growth and labor market prints (e.g. weak participation rate and wage growth) and highly dovish monetary policy in the EU and Japan led to declines in developed market yields. Slower than expected Chinese growth pressured commodities prices and drove spreads significantly wider. INPRS fixed income portfolio returned (0.4) percent with emerging market debt and the opportunistic credit strategy as the main detractors to performance.
For the second quarter, the highly anticipated 0.25 percent Fed rate hike finally materialized in December after 2.5 years of speculation and drove Treasury yields higher. With U.S. dollar at a decade high and continued deceleration of Chinese growth, prices of commodities declined further, spreads widen significantly as credit quality deteriorated, and a number of emerging economies fell further into recession. INPRS fixed income portfolio returned (0.5) percent with long duration Treasury and IG credits, and opportunistic credit strategy as the main detractors to performance.
For the third quarter, continued downward global growth trend and manufacturing overcapacity both acted as dampener on inflation. The lack of inflationary pressure supported the highly dovish monetary policy at global central banks. This dynamic, coupled with the S&P 500 having its worst start to a calendar year ever, tilted the Fed back to being dovish. Global safe haven yields rallied and the U.S. dollar weakened. Drawdown in risk assets was short lived and a full recovery was made by quarter-end. INPRS fixed income portfolio returned 5.1 percent with long duration Treasury and IG credits, and emerging markets debt as the main contributors to performance.
For the fourth quarter, lackluster global growth, suppressed inflation, and market volatility driven by Brexit and missed earnings, dismissed the expectation of a Fed rate hike and continued the commitment on highly dovish monetary policy at global central banks. Global safe haven yields continued to rally, U.S. dollar weakened and several equity markets set all time highs. INPRS fixed income portfolio returned 4.6 percent with emerging markets debt as the main contributor to performance.1Investment performance is based on calculations made by the system’s custodian, Bank of New York Mellon, and are time-weighted rates of return.2Represents sub-asset class target allocations within the fixed income portfolio over time.3Derivative exposure is included in Government.
Market Valueas of 6/30/2016
INPRS 1-YearNet Performance1 Custom Benchmark2
$5,216.4 Million 8.9% 9.3%
64.1%
3.2%
55.8%6.4%
8.3%
2.6%
29.5%
0.0% 5.0% 10.0% 15.0% 20.0% 25.0%
Current Target
21.1%
24.0%
17.2%
Portfolio ObjectiveThe fixed income portfolio seeks to generate current income and long-term risk-adjusted return in excess of the Custom Benchmark (“Benchmark”) through investment in debt securities. A focus is placed on preservation of capital. To minimize the probability of substantial principal loss over the investment horizon, staff first reduce volatility of the portfolio then enhance portfolio return from contractual income and capital appreciation through active management.
Regional Exposure
n Domestic n Foreign - Developed
n Foreign - Emerging n Foreign - Frontier
n Other
Sector Exposure3
n Government n Gov’t Related
n Corporates n Securitized
Asset Class Summary: Fixed Income – Ex Inflation-Linked
12.9%
Investment Results – Consolidated Defined Benefit Assets

INVESTMENT SECTION 133
INPRS Allocation Portfolio Overview
INPRS Benchmark
Duration to worst: 19.6 yrs 19.3 yrs
Yield to worst: 1.9% 0.9%
Credit quality: Aaa / AA+ Aa1 / AA+
Performance AttributionFor fiscal year 2016, INPRS global ILBs portfolio returned 5.4 percent, outperforming its benchmark by 0.1 percent. The portfolio’s exposure to long duration U.S. TIPS was the main contributor to performance.
Market OverviewINPRS extended duration significantly in U.S. TIPS and transitioned to its approved target allocation in fiscal year 2016. The portfolio is expected to retain its sensitivity to changes in inflation expectation; however, given its long duration, changes in real rates are expected to influence performance, as well.
During the last twelve months, inflation prints remained near zero in ex-U.S. developed markets despite highly dovish monetary policy at global central banks that resulted in trillions of negative yielding risk-free assets. Inflation prints were within a normal range in the U.S., excluding the effects of food and energy. Lackluster global growth coupled with another collapse in commodity prices kept the risk of an unexpected spike in inflation relatively low but not zero. As an inflation hedge, INPRS’ global ILBs portfolio stayed vigilant and kept pace with its benchmark.
For the first quarter, growth was uninspiring in the U.S. and ex-U.S. developed markets, while slower than expected growth in China pressured prices of commodities and kept inflation prints below expectations and breakeven inflation narrowed considerably. INPRS global ILBs portfolio declined 1.4 percent in the quarter.
For the second quarter, the highly anticipated 0.25 percent Fed rate hike finally materialized in December after more than two years of speculation and drove real rates higher. Despite inflation prints in the U.S. and ex-U.S. developed markets rising slightly and breakeven inflation widening, INPRS global ILBs portfolio declined 0.7 percent in the quarter.
For the third quarter, a continued downward global growth trend and manufacturing overcapacity both acted as a dampener on inflation. However, benefits of lower commodity prices started to trickle through to end consumers and breakeven inflation widened slightly. This dynamic, coupled with the S&P 500 having its worst start ever to a calendar year, tilted the Fed back to being dovish which resulted in a significant rally of real rates. INPRS global ILBs portfolio returned 4.1 percent in the quarter.
For the fourth quarter, lackluster global growth, suppressed inflation, and market volatility driven by Brexit as well as missed earnings, dismissed the expectation of another Fed rate hike and continued the commitment on highly dovish monetary policy at global central banks. As a result, breakeven inflation declined slightly and real rates rallied significantly. INPRS global ILBs portfolio returned 3.4 percent.1Investment performance is based on calculations made by the system’s custodian, Bank of New York Mellon, and are time weighted rates of return.2Global Inflation 70/30 is a 70% weight to Global Inflation-Linked Bonds (including U.S.) and a 30% weight to U.S. Inflation-Linked Bonds.
Market Valueas of 6/30/2016
INPRS 1-YearNet Performance1
Custom Benchmark1-Year Performance2
$1,838.0 Million 5.4% 5.3%
0.6%
99.4%
Portfolio Objective
The global inflation-linked bonds (“ILBs”) portfolio seeks to generate long-term risk-adjusted return similar to that of the custom global inflation index (“Benchmark”), comprised of 70 percent Barclays Capital U.S. Treasury Inflation Protected Securities (TIPS) Index and 30 percent Barclays Capital Global Inflation-Linked Bond Index, through investment in inflation-linked securities as well as provide protection against unanticipated inflation primarily via passive management.
0.0% 2.0% 4.0% 6.0% 8.0%
Current Target
7.4%
7.0%
0.0% 50.0% 100.0%
U.S.
U.K.
France
Canada
Germany
Sweden
Australia
77.2%
8.3%
4.1%
4.1%
3.0%
2.1%
1.2%
Country Exposure
Management Style
n Active n Passive
Asset Class Summary: Fixed Income – Inflation-Linked
Investment Results – Consolidated Defined Benefit Assets

134 INVESTMENT SECTION
Market Valueas of 6/30/2016
INPRS 1-YearNet Performance1
Custom Benchmark1-Year Performance2
$1,822.0 Million (19.6)% (18.4)%
INPRS Allocation Portfolio Structure
Performance Attribution
The commodities portfolio one-year total return trailed its benchmark by 1.2 percentage points. Commodities’ total return is comprised of two components: 1) commodity futures return and 2) collateral return. The one-year return for each of these components was approximately (21.6) percent and 2.0 percent, respectively.
Market OverviewINPRS’ commodity exposure is approximately equal to a 50/50 blend of the Bloomberg Commodity Index (“BCOM”) and the S&P Goldman Sachs Commodity Index (“GSCI”). For the fiscal year, the two indices returned (13.3) percent and (26.1) percent, respectively.
China reported slower growth for the first quarter, which had a significant impact on commodity prices. The more diversified BCOM fell 14.5 percent during the quarter, its largest quarterly decline since the fourth quarter of 2008. Petroleum markets were hit hardest, with WTI Crude Oil falling nearly 25.0 percent within the quarter.
Commodity markets were mostly down over the first two quarters of fiscal year 2016. Notably, energy, industrial metals, precious metals, livestock, and the agriculture complexes all experienced double-digit declines for the full calendar year of 2015. A number of negative forces weighed on commodity prices during the second quarter of fiscal year 2016, including U.S. dollar strength, deflationary concerns in Europe, and a slowing of the Chinese economy. The BCOM and the GSCI were down 10.6 percent and 16.6 percent, respectively, for the second quarter of fiscal year 2016.
Commodity markets rallied toward the end of the third quarter. Led by the precious metals complex, a small group of commodities, including RBOB gasoline, zinc, gold, silver, soybean oil, and lean hogs, each experienced double-digit price gains to begin calendar year 2016. The BCOM index climbed 0.4 percent while the GSCI index fell 2.5 percent during the period.
The commodity rally late in the third-quarter continued into the fourth quarter, with the BCOM and the GSCI indices increasing 12.8 percent and 12.7 percent, respectively. Crude oil prices gained over 25.0 percent during the quarter, benefiting from strong demand and inventory draws. The largest increases in spot prices, however, were in natural gas and soybean meal. Both commodities were up more than 49.0 percent during the quarter.1Investment Returns are based on calculations made by the system’s custodian, Bank of New York Mellon, and are time weighted rates of return.2Custom Benchmark is a 50/50 blend of the Bloomberg Commodity Index and the Goldman Sachs Commodity Index. The collateral component is a 75/25 blend of global inflation-linked bond indices and 90-day Treasury Bills respectively.3Approximate.
49.0%
11.0% 14.0%
13.0%
Portfolio Objective
The purpose of the commodity portfolio is to enhance long-term risk-adjusted returns by preserving investment capital and lowering overall volatility. The portfolio should also act as a hedge against unanticipated inflation. Commodity investments have historically delivered returns that are less correlated with equity and fixed income markets which may provide an opportunity to enhance returns and/or reduce volatility.
Current Target
7.4%
8.0%
0.0% 2.0% 4.0% 6.0% 8.0% 10.0%
7.0%
Sector Weights3
n Agriculture n Energy
n Industrial Metals n Livestock
n Foods and Fibers n Precious Metals
Asset Class Summary: Commodities
6.0%
Investment Results – Consolidated Defined Benefit Assets

INVESTMENT SECTION 135
INPRS Allocation Portfolio Structure
Performance AttributionFor fiscal year 2016, the real estate portfolio trailed its benchmark by 4.5 percentage points. It is important to note that the real estate portfolio will trail its all-equity benchmark during periods of strong equity outperformance relative to debt, as the portfolio is comprised of approximately 35.0 percent commercial real estate debt. The debt portion of the portfolio accounted for nearly all of the relative underperformance with the debt and equity portfolios having returned 2.0 percent and 12.1 percent, respectively, for the period.
Market Overview
Capital continued to flow into private real estate during the fiscal year, as evidenced by another year of strong performance. Appreciation was once again the largest contributor to total return. This trend slowed significantly during the year, however, as income exceeded appreciation in the fourth quarter.
For the first quarter, the ODCE returned 3.7 percent. U.S. commercial real estate performed well during the quarter with healthy levels of absorption and continued rental gains as the main drivers. Given the relative attractiveness of U.S. assets, global capital flows remained strong. Across property types, industrial posted the highest return for the quarter, increasing 3.7 percent.
Despite a preliminary second quarter annualized GDP estimate of 0.7 percent, the final quarter of 2015 witnessed record levels of commercial real estate asset pricing, the highest transaction volume and peak occupancies for the cycle across the office, retail and industrial property types. Performance for the ODCE was up 3.3 percent for the quarter.
For the third quarter, the ODCE was up 2.2 percent. The U.S. real estate markets continued to achieve favorable results in the third quarter despite a global backdrop of economic uncertainty and capital markets volatility. Retail and industrial were the top-performing property types, both increasing 3.0 percent for the quarter.
In an otherwise low-yielding market environment, the ODCE finished the year with another relatively strong quarter, up 2.1 percent3. In the U.S., industrial led the other major property types with a return of 2.9 percent for the quarter. Retail and apartments also performed well, increasing 2.2 percent and 1.9 percent, respectively. 1Investment performance is based on calculations made by the system’s custodian, Bank of New York Mellon, and are time weighted rates of return.2Estimated.3Based on preliminary results as published by NCREIF.
Market Valueas of 6/30/2016
INPRS 1-YearNet Performance1
NCREIF Open End DiversifiedCore Equity Index (“ODCE”)
1-Year Performance
$1,629.8 Million 8.1% 12.6%
26.5%
15.5%
11.1%10.1%
4.4%
13.1%
14.8%
33.5%
32.2%
20.1%
9.7%
96.8%
Portfolio Objective
The real estate portfolio is mostly comprised of investments in private real estate partnerships, and the underlying exposures are a mix of debt and equity holdings. The portfolio seeks to generate attractive risk-adjusted returns by providing stable current income and preserving investment capital. The portfolio should also reduce volatility by providing a hedge against inflation and through the diversification benefits provided by real estate investments.
4.5%
Current Target
6.6%
7.0%
0.0% 1.0% 2.0% 3.0% 4.0% 5.0% 6.0% 7.0% 8.0%
4.5%
Property Type2
n Office n Retail
n Apartments n Industrial
n Hotel n Senior Housing
n Student Housing n Other
Property Location2
n U.S.-East n U.S.-West
n U.S.-South n U.S.-Midwest
n International
Market Typen Public n Private
Asset Class Summary: Real Estate
3.2%
Investment Results – Consolidated Defined Benefit Assets

136 INVESTMENT SECTION
Market Valueas of 6/30/2016
INPRS 1-YearNet Performance1 HFRI Custom Benchmark2
$2,279.0 Million (2.9)% (1.4)%
INPRS Allocation
Performance AttributionINPRS underperformed the HFRI Custom benchmark due to a combination of strategy selection and individual manager performance in ex-US equity, event driven, global macro, and structured credit strategies.
Market OverviewINPRS’ absolute return portfolio returned (2.9) percent during fiscal year 2016. The performance trails the return for the custom benchmark.
During the fiscal year, the portfolio was impacted by a combination of market disappointment in central bank decisions, rapid tightening and easing of financial conditions post the China equity/growth scare in Q3 2015, high yield spread widening in Q1 2016, and the immediate market shock from the outcome of the Brexit vote near the end of the fiscal year.
The portfolio’s strategies exhibited a wide range of results over the fiscal year, with a range of total returns from -20 percent to +20 percent. The average positive performing investment (twelve in total) had a starting allocation of $77 million and returned 6.7 percent. The average negative performing investment (thirteen in total) had a starting allocation of $108 million and returned (10.2) percent over the fiscal year. In summary, the poor performers had lower returns on larger initial allocations than the offsetting positive performers. Despite the challenging alpha performance, the portfolio exhibited very little beta to traditional asset classes over the fiscal year -- 0.1 to the MSCI ACWI, (0.3) to the Barclays Global Aggregate Index, and zero to the S&P GSCI. The average pairwise correlation of fund returns across the entire roster of hedge funds was 0.2, with the maximum average pairwise correlation of any single investment to other fund investments at 0.3.
INPRS’ fund-of-funds portfolio, which was an 18.3 percent allocation at the end of the fiscal year, lost 5.0 percent in aggregate over the fiscal year, with wide performance dispersion between the managers. Exposure to energy-related event driven and credit strategies detracted the most from performance, with the greatest positive impact coming from residential mortgages and short-term quantitative strategies.1Investment performance is based on calculations made by the systems custodian, Bank of New York Mellon, and are time-weighted rates of return.2HFRI Custom benchmark is a weighted average of INPRS’ exposure to representative HRFI sub-strategy indices.3The sum total of sub-strategy returns may differ from the reported portfolio-level return due to rounding at the sub-strategy and portfolio levels.4May not total 100% due to transition cash balance, allocations as of June 2016.
-4.0%
-3.0%
-2.0%
-1.0%
0.0%
1.0%
2.0%
0.5%
-1.0%
0.5%
-1.0%
-1.0%
-0.9%
Contribution to Performance by Strategy3
Portfolio Composition
Fund of Funds – Look-Through4
18.3%
18.9%
23.8% 17.0%
10.3%
21.8%
13.7%
13.7%
24.4%
Portfolio Objective
The purpose of the absolute return strategies program is to enhance the long-term risk adjusted returns of the plan by delivering alpha, providing diversification benefits, and preserving capital. Absolute return strategies generate returns by exploiting mispricing and inefficiencies in global capital markets, while attempting to reduce exposures to primary market factors (e.g. interest rates and equities) through various hedging techniques. These strategies have historically delivered returns with low correlation to traditional long-only investment strategies. It is important to maintain an appropriate level of diversification among investment strategies in order to most effectively meet these stated objectives. At the end of the fiscal year, the absolute return portfolio was comprised of twenty-three managers across twenty-five investments.
Current Target
9.2%
10.0%
0.0% 2.0% 4.0% 6.0% 8.0% 10.0%
11.7%
26.2%
n Event Driven
n Fund of Funds
n Long/Short Equity
n Multi-Strategy
n Relative Value
n Tactical Trading
n Event Driven
n Long/Short Equity
n Multi-Strategy
n Relative Value
n Tactical Trading
n Event Driven
n Fund of Funds
n Long/Short Equity
n Multi-Strategy
n Relative Value
n Tactical Trading
Asset Class Summary: Absolute Return
Investment Results – Consolidated Defined Benefit Assets

INVESTMENT SECTION 137
INPRS Allocation Portfolio Structure
Performance Attribution
Lacking a passive market equivalent for the risk parity portfolio, INPRS continues to use the traditional portfolio of 60 percent global equities and 40 percent global bonds (“60/40 portfolio”) as a benchmark for long-term return and risk comparisons, despite expectations of significant tracking error. For fiscal year 2016, the risk parity portfolio outperformed a 60/40 portfolio by 0.9 percent. Diversification beyond U.S. equities and bonds was rewarded through periods of volatility in the second half of the fiscal year.
Over the past few years, equity risk concentrated or 60/40 portfolios have benefited from low volatility and high returns within the equity market. However, brief periods of volatility in January and June resulted in an outperformance in risk-balanced risk parity portfolios over a 60/40 portfolio. In particular, the largest contributing factor to performance within a risk parity portfolio over the fiscal year was nominal bonds. Inflation indexed bonds also contributed positively to performance, while equity and commodities were detractors to performance.
Market Overview
The first half of fiscal year 2016 was a continuation of fiscal year 2015 - where a low inflationary environment caused losses in commodities and inflation indexed bonds which could not be offset by gains in nominal bonds or equities. As a result, risk parity underperformed a 60/40 portfolio. As inflation began to rise throughout the second half of fiscal year 2016 and Brexit added volatility within equity markets, gains in nominal bonds, inflation indexed bonds, and commodities resulted in outperformance of risk parity over 60/40 portfolios where risk is concentrated within equities.
1Based on calculations made by the system’s custodian, Bank of New York Mellon, and are time weighted rates of return.2Comprised of 60% MSCI ACWI IMI Index (equities) & 40% Barclays Global Aggregate Bond Index (bonds).
Market Valueas of 6/30/2016
INPRS 1-YearNet Performance1
Custom Benchmark1-Year Performance2
$2,736.4 Million 1.7% 0.8%
44.7%46.8%
8.5%
25%
RisingGrowth
RisingInflation
FallingGrowth
FallingInflation
Portfolio Objective
The risk parity portfolio seeks to create risk balance that is capable of delivering consistent and high risk adjusted returns in several macro-economic environments. Unlike a traditional asset allocation that is highly dependent on positive equity returns, the risk parity portfolio is constructed to accrue various asset class risk premiums, including equity, without long-term dominance from any single asset class. As a result, the underperformance of a given asset class in a particular environment is expected to be offset by the outperformance of another asset with an opposing sensitivity to the environment.
The risk parity portfolio rests on the following key tenets:1. Over a full market cycle, most asset classes carry a risk premium, and by investing in them, investors expect to earn a return higher than
that offered by cash instruments.2. The return of a particular asset class is proportional to its risk over long periods of time (i.e., different asset classes have similar Sharpe
ratios).3. True diversification goes beyond simple capital allocation and, instead, focuses on risk allocation.4. The main drivers of returns are growth and inflation factors and changes in risk premiums; asset classes will perform differently depending
on the particular combination of such factors.
25%
25% 25%
Current Target
11.0%
12.0%
0.0% 2.0% 4.0% 6.0% 8.0% 10.0% 12.0%
Manager Allocation
n Bridgewater n AQR n First Quadrant
Target Risk Allocation
Exposure to asset classes thatperform well in the following
economic environments
Asset Class Summary: Risk Parity
Investment Results – Consolidated Defined Benefit Assets
138 INVESTMENT SECTION
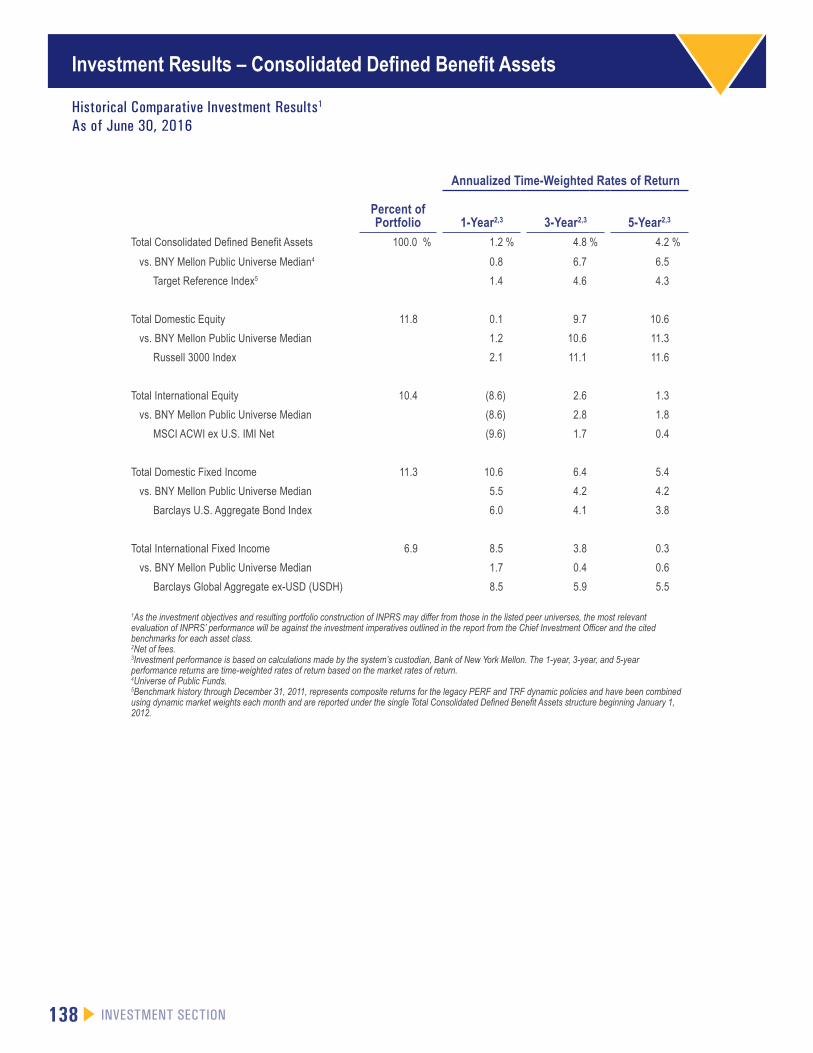
Annualized Time-Weighted Rates of Return
Percent of Portfolio 1-Year2,3 3-Year2,3 5-Year2,3
Total Consolidated Defined Benefit Assets 100.0 % 1.2 % 4.8 % 4.2 %
vs. BNY Mellon Public Universe Median4 0.8 6.7 6.5
Target Reference Index5 1.4 4.6 4.3
Total Domestic Equity 11.8 0.1 9.7 10.6
vs. BNY Mellon Public Universe Median 1.2 10.6 11.3
Russell 3000 Index 2.1 11.1 11.6
Total International Equity 10.4 (8.6) 2.6 1.3
vs. BNY Mellon Public Universe Median (8.6) 2.8 1.8
MSCI ACWI ex U.S. IMI Net (9.6) 1.7 0.4
Total Domestic Fixed Income 11.3 10.6 6.4 5.4
vs. BNY Mellon Public Universe Median 5.5 4.2 4.2
Barclays U.S. Aggregate Bond Index 6.0 4.1 3.8
Total International Fixed Income 6.9 8.5 3.8 0.3
vs. BNY Mellon Public Universe Median 1.7 0.4 0.6
Barclays Global Aggregate ex-USD (USDH) 8.5 5.9 5.5
1As the investment objectives and resulting portfolio construction of INPRS may differ from those in the listed peer universes, the most relevant evaluation of INPRS’ performance will be against the investment imperatives outlined in the report from the Chief Investment Officer and the cited benchmarks for each asset class.2Net of fees. 3Investment performance is based on calculations made by the system’s custodian, Bank of New York Mellon. The 1-year, 3-year, and 5-year performance returns are time-weighted rates of return based on the market rates of return.4Universe of Public Funds. 5Benchmark history through December 31, 2011, represents composite returns for the legacy PERF and TRF dynamic policies and have been combined using dynamic market weights each month and are reported under the single Total Consolidated Defined Benefit Assets structure beginning January 1, 2012.
Historical Comparative Investment Results1
As of June 30, 2016
Investment Results – Consolidated Defined Benefit Assets

INVESTMENT SECTION 139
Ten-Year Time-Weighted Investment Rates of Return1
For the Year Ended June 30
(dollars in millions)
Market Value of Assets
Rate of Return2
Actuarial Assumed
Rate
2016 INPRS3 $ 24,775.6 1.2 % 6.75 %
2015 INPRS 24,629.8 0.0 6.75
2014 INPRS 24,560.3 13.7 6.75
2013 INPRS 21,488.7 6.0 6.75
2012 INPRS 19,708.9 0.7 7.00
2011 PERF CRIF4 15,796.6 20.1 7.00
TRF DB Assets5 5,984.0 18.2 7.00
2010 PERF CRIF 13,314.0 13.9 7.25
TRF DB Assets 5,073.0 14.8 7.50
2009 PERF CRIF 11,795.1 (20.6) 7.25
TRF DB Assets 4,236.0 (18.0) 7.50
2008 PERF CRIF 14,851.0 (7.6) 7.25
TRF DB Assets 5,252.0 (6.0) 7.50
2007 PERF CRIF 16,114.3 18.2 7.25
TRF DB Assets 5,501.0 17.9 7.50
1 Returns from 2007 - 2011 presented as previously reported; returns 2012 and thereafter are based on calculations made by the System’s custodian, Bank of New York Mellon. All returns are time-weighted rates of return.2Net of fees; 2007 - 2011 reported as gross of fees. 3INPRS Consolidated Defined Benefit Assets. 4Public Employees' Retirement Fund Consolidated Retirement Investment Fund. 5Teachers' Retirement Fund Defined Benefit Assets.
Investment Results – Consolidated Defined Benefit Assets

140 INVESTMENT SECTION
Statistic 1-Year 3-Years 5-Years 10-Years
Annualized Time-Weighted Rate of Return 1.19 % 4.78 % 4.18 % 3.80 %
Annualized Standard Deviation 5.49 4.67 5.71 9.42
Annualized Sharpe Ratio1 0.22 1.01 0.74 0.34
Beta2 0.33 0.33 0.40 0.57
Annualized Alpha3 (0.22) 0.07 (0.23) (0.16)
Correlation2 0.83 0.79 0.84 0.91
1Risk Free Proxy is the Citigroup 3 Month Treasury Bill.2Market Proxy is the S&P 500. 3Market Proxy is INPRS’ Custom Benchmark.
Definition of Key Terms:
Standard Deviation: A statistic used to measure the dispersion in a distribution. Dispersion is measured relative to the mean, or average of the distribution. The greater the dispersion, the higher the risk associated with the pattern of observations. One standard deviation describes two-thirds of the observations in a normal or bell-shaped distribution. In an asset allocation context, standard deviation is a conventional proxy for risk or volatility.
Sharpe Ratio: Ratio used to measure risk-adjusted performance. The Sharpe Ratio is calculated by subtracting a risk-free rate (proxy) from the rate of return for a portfolio and dividing the result by the standard deviation of the portfolio returns. The Sharpe Ratio provides insight on excess risk held in the portfolio. The greater a portfolio’s Sharpe Ratio, the better its risk-adjusted performance has been. A negative Sharpe Ratio indicates that a risk-less asset would perform better than the security being analyzed.
Beta: A measure of the volatility, or systematic risk, of a security or portfolio in comparison to the market as a whole. Beta is the tendency of a security’s return to respond to swings in the market. A Beta of less than one (1) indicates less volatility than the market. A Beta of greater than one (1) indicates greater volatility than the market.
Alpha: A measure of performance on a risk-adjusted basis. Alpha is the difference between the actual performance of the fund and the performance which should have been achieved given the market’s performance and the fund’s risk posture.
Correlation: A Statistical measure of how two (2) securities move in relation to each other. A correlation of positive 1.0 indicates similar magnitude and direction of change. A correlation of negative (1.0) indicates similar magnitude, but opposite direction. A correlation of zero indicates the relationship is purely random. Often, the correlation is squared and known as R-squared or the Coefficient of the Correlation.
Statistical PerformanceAs of June 30, 2016
Investment Results – Consolidated Defined Benefit Assets

INVESTMENT SECTION 141
Assets by Investment Option As of June 30, 2016
(dollars in millions)
Investment OptionASA & LEDC Plan Assets1
Percent of Self-Directed Investments
Guaranteed Fund $ 2,874.2 56.1 %
Large Cap Equity Index Fund 827.1 16.1
Small / Mid Cap Equity Fund 582.6 11.4
International Equity Fund 181.5 3.5
Fixed Income Fund 177.9 3.5
Inflation-Linked Fixed Income Fund 33.7 0.7
Money Market Fund 23.2 0.4
Stable Value Fund 1.2 -
Target Date Funds2 426.0 8.3
Total ASA and LEDC Plan Assets3 $ 5,127.4 100.0 %
1Assets include all PERF, TRF Pre-1996, and TRF 1996 ASA assets and the LEDC Plan account balances allocated outside of the Consolidated Defined Benefit Assets option.2Consolidated market values of all Target Date Funds.3Includes Investment Receivables, Foreign Exchange Contracts Receivables, Interest and Dividend Receivables, Investment Payables, Foreign Exchange Contracts Payables, and Obligations Under Reverse Repurchase Agreements.
Guaranteed Fund
Large Cap Equity Index Fund
Small / Mid Cap Equity Fund
International Equity Fund
Fixed Income Fund
Inflation-Linked Fixed Income Fund
Money Market Fund
Target Date Funds
56.1%
16.1%
11.4%
0.4%
3.5%
3.5%8.3%
0.7%
Investment Results – Annuity Savings Accounts and Legislators’ Defined Contribution Plan

142 INVESTMENT SECTION
Historical Annualized Time-Weighted Rate of Return by Investment Option vs. Benchmark Returns As of June 30, 2016
Investment Option 1-Year1,2 3-Year1,2 5-Year1,2
Guaranteed Fund 0.46 % 0.35 % 0.63 %
Large Cap Equity Index Fund 4.0 11.6 12.1 S&P 500 Index 4.0 11.7 12.1
Small / Mid Cap Equity Fund (4.8) 8.0 8.8 Russell Small Cap Completeness Index (5.2) 8.6 9.3
International Equity Fund (8.9) 2.4 0.9 MSCI ACWI ex US Index (10.2) 1.2 0.1
Fixed Income Fund 5.4 4.0 4.1 Barclays U.S. Aggregate Bond Index 6.0 4.1 3.8
Inflation-Linked Fixed Income Fund 3.6 2.0 2.5 Barclays U.S. TIPS Index 4.4 2.3 2.6
Money Market Fund 0.3 0.2 0.1 Citigroup 3 Month T-Bill Index 0.1 0.1 0.1
Stable Value Fund3 1.4 2.2 2.5 Citigroup 3 Month T-Bill Index 0.1 0.1 0.1
Target Date Funds4:
Retirement Fund 3.0 3.3 3.5 Retirement Fund Index 3.1 2.8 2.7
Retirement Fund 2020 2.5 4.2 4.1 2020 Fund Index 2.7 3.9 3.7
Retirement Fund 2025 2.2 4.9 4.6 2025 Fund Index 2.3 4.6 4.3
Retirement Fund 2030 1.1 5.5 5.0 2030 Fund Index 1.1 5.3 4.8
Retirement Fund 2035 (0.7) 5.7 5.2 2035 Fund Index (1.0) 5.3 4.9
Retirement Fund 2040 (1.2) 5.6 5.2 2040 Fund Index (1.6) 5.2 4.8
Retirement Fund 2045 (1.1) 5.6 5.2 2045 Fund Index (1.6) 5.2 4.8
Retirement Fund 2050 (1.1) 5.6 5.2 2050 Fund Index (1.6) 5.2 4.8
Retirement Fund 2055 (1.1) 5.6 5.2 2055 Fund Index (1.6) 5.2 4.8
Retirement Fund 2060 (1.1) 5.7 5.5 2060 Fund Index (1.6) 5.2 4.9
1Return net of fees.2Based on performance calculations made by the system’s record keeper, Xerox. The 1-year, 3-year, and 5-year performance returns are time-weighted rates of return for the fiscal year ended June 30, 2016. Prior to July 30, 2010, all data presented (excluding the Guaranteed Fund) is calculated from manager composite performance. After July 30, 2010, all performance presented consists of actual investment returns experienced by members.3Investment Fund Option in the Legislators' Defined Contribution Plan and Public Employees’ Retirement Fund ASA Only Plan.4Target Date Fund benchmarks are comprised of performance data using a passive strategy with the same asset allocation of each Target Date Fund.
Investment Results – Annuity Savings Accounts and Legislators’ Defined Contribution Plan

INVESTMENT SECTION 143
Annuity Savings Accounts Ten-Year Guaranteed Fund Interest Crediting RatesFor the Year Ended June 30
Interest Credit Rate
INPRS PERF TRF
2016 0.46 % N/A N/A
2015 0.32 N/A N/A
2014 0.26 N/A N/A
2013 0.28 N/A N/A
20121 1.75 N/A N/A
2011 N/A 1.75 % 1.75 %
2010 N/A 3.50 3.50
2009 N/A 6.00 5.50
2008 N/A 6.50 6.00
2007 N/A 6.00 5.50
1Guaranteed Fund assets of PERF, TRF Pre-1996 and TRF 1996 were unitized as of January 1, 2012.
0.0%
1.0%
2.0%
3.0%
4.0%
5.0%
6.0%
7.0%
8.0%
Interest Credit Rate: INPRS
Interest Credit Rate: PERF
Interest Credit Rate: TRF
2016201520142013201220112010200920082007
Investment Results – Annuity Savings Accounts and Legislators’ Defined Contribution Plan

144 INVESTMENT SECTION
(dollars in thousands)
Company Shares Fair Value
Microsoft Corp. 1,221,812 $ 62,520
Nestle SA 726,560 56,047
Apple Inc. 535,521 51,196
Exxon Mobil Corp. 398,410 37,347
Alphabet Inc. Class C Capital Stock 51,203 35,438
Visa Inc. 472,287 35,030
Taiwan Semiconductor Manufacturing 6,620,494 33,350
Alphabet Inc. Class A Common Stock 46,471 32,694
Johnson & Johnson 266,816 32,365
Allergan PLC 136,764 31,605
1A complete list of portfolio holdings is available upon request.
Largest Assets Held as of June 30, 2016Top Ten Fixed Income Holdings by Fair Value1
Largest Assets Held as of June 30, 2016Top Ten Equity Holdings by Fair Value1
(dollars in thousands)
DescriptionCoupon
RateMaturity
DatePar
ValueFair
Value
U.S. Treasury - CPI Inflation Index Bond 2.125 % 2/15/41 $ 159,575 $ 210,504
U.S. Treasury - CPI Inflation Index Bond 1.375 2/15/44 158,407 183,119
U.S. Treasury - CPI Inflation Index Bond 0.750 2/15/45 157,806 158,478
U.S. Treasury Bond 2.500 2/15/46 149,440 155,610
U.S. Treasury - CPI Inflation Index Bond 0.750 2/15/42 154,343 154,646
U.S. Treasury - CPI Inflation Index Bond 0.625 2/15/43 155,922 151,762
U.S. Treasury Note 1.000 5/31/18 147,860 149,004
U.S. Treasury - CPI Inflation Index Bond 2.125 2/15/40 101,076 132,140
U.S. Treasury Note 0.375 10/31/16 113,240 113,248
U.S. Treasury - CPI Inflation Index Bond 1.000 2/15/46 94,424 101,938
1A complete list of portfolio holdings is available upon request.
Investment Information

INVESTMENT SECTION 145
Investment Management FeesFor the Year Ended June 30, 2016
(dollars in thousands)
Asset ClassInvestment
Management Fees
Consolidated Defined Benefit Assets
Public Equity $ 16,190
Private Equity 42,110
Fixed Income – Ex Inflation-Linked 10,654
Fixed Income – Inflation-Linked 3,374
Commodities 7,263
Real Estate 16,785
Absolute Return 51,912
Risk Parity 7,909
Cash + Cash Overlay 100
Total Consolidated Defined Benefit Assets 156,297
Special Death Benefit Fund Assets 8
Annuity Savings Accounts Assets 4,260
Total Investment Management Fees $ 160,565
Top Ten Brokers’ Commission FeesFor the Year Ended June 30, 2016
(dollars in thousands)
BrokerAmount Paid
in Fees
Morgan Stanley & Co. Inc. $ 674
Goldman Sachs & Co. 523
Newedge USA LLC 433
Investment Technology Group, New York 127
Credit Suisse, New York 118
UBS Securities LLC 118
Jeffries & Co. Inc., New York 116
Merrill Lynch International 110
Instinet Europe Limited, London 103
JP Morgan Secs Ltd, London 66
Top Ten Brokers' Commission Fees 2,388
Other Brokers 1,799
Total Brokers' Commission Fees $ 4,187
Investment Information

146 INVESTMENT SECTION
Investment Professionals
Consolidated Defined Benefit Assets
CustodianBank of New York Mellon
ConsultantsAksia (Absolute Return)
Mercer (Real Estate)
Verus (General: Defined Benefit)
Torrey Cove (Private Equity)
Public EquityAltrinsic Global Advisors, LLC
Arrowstreet Capital, LP
Artisan Partners Limited Partnership
Baillie Gifford & Company
BlackRock Institutional Trust
Jackson Square Partners
Disciplined Growth Investors
Leading Edge Investment Advisors
Rhumbline Advisers
Schroders
Times Square Capital Management, LLC
Private EquityA.M. Pappas & Associates, LLC
ABRY Partners
Accel Partners
Accent Equity Partners AB
Actis Capital
Advanced Technology Ventures
Advent International Global Private Equity
Aisling Capital
AlpInvest US Holdings, Inc.
American Securities Capital Partners, L.P.
AnaCap Financial Partners LLP
Apax Partners, Inc
Apollo Management, L.P.
ARCH Venture Partners
Ares Management
Arle Capital Partners
Austin Ventures
Avenue Capital Group, LLC
Bain Capital Partners
Baring Private Equity Asia Limited
Bay Partners
Bertram Capital
Black Diamond Capital Management, LLC
Brentwood Associates
Caltius Mezzanine
Cardinal Partners
Catterton Partners
Centerfield Capital Partners
Century Park Capital Partners
Cerberus Capital Management
Charterhouse Capital Partners
CID Capital
Cinven Limited
Clarity China
Close Brothers Private Equity, Ltd.
Code Hennessy & Simmons LLC
Coller Capital
Columbia Capital LLC
Court Square Capital Partners
Crescent Capital Partners
Crestview Capital Funds
CVC Capital Partners
Doll Capital Management
Elevation Partners
EnCap Investments
Energy Capital Partners
Enhanced Capital Partners
Escalate Capital Partners
Falcon Investment Advisors, LLC
First Reserve Corporation
Forbion Capital Partners
Fortress Investment Group LLC
Gilde Buyout Partners
Globespan Capital Partners
GSO Capital Opportunities
GTCR Golder Rauner, LLC
H2 Equity Partners BV
Hammond Kennedy Whitney & Co
Hellman & Friedman LLC
Herkules Capital
High Road Capital Partners
Horsley Bridge
Insight Venture Partners
Institutional Venture Partners
Investment Information

INVESTMENT SECTION 147
Investment Professionals, continued
Consolidated Defined Benefit Assets
Private Equity, cont.JFM Management Inc.
Khosla Ventures
KPS Special Situations Funds
Landmark Partners, Inc.
Leonard Green & Partners
Lexington Partners Inc.
Lightyear Capital LLC
Lindsay Goldberg
Lion Capital
MBK Partners
Merit Capital Partners
Mill Road Capital
Neuberger Berman
New Enterprise Associates
New Mountain Capital LLC
NGP Energy Capital Management
Oak Hill Advisors, L.P.
Oak Hill Capital Management, Inc.
Oak Investment Partners
Oaktree Capital Management, LLC
Opus Capital Venture Partners
Panda Power Funds
Parthenon Capital
Peninsula Capital Partners LLC
Permira Advisers Limited
Platinum Equity, LLC
Rho Capital Partners, Inc.
RJD Partners Limited
SAIF Management II Ltd
Sankaty Advisors
Scale Venture Partners
Silver Cup
Silver Lake Partners
Stepstone
Sumeru Equity Partners
Sun Capital Partners
TA Associates
Technology Crossover Ventures
Technology Partners
Terra Firma Capital Partners
The Blackstone Group
The Jordan Company (TJC)
TowerBrook Investors
TPG Capital
Trilantic Capital Partners
Trinity Ventures
Triton
True Ventures
TSG Consumer Partners
Veritas Capital Management
Veronis, Suhler & Associates, Inc.
Vestar Capital Partners, Inc.
Vintage Venture Partners
Vision Capital LLP
Vista Equity Partners
Walden Group of Venture Capital Funds
Warburg Pincus
Warwick Energy Investment Group
Wayzata Investment Partners, LLC
Weston Presidio Capital
White Deer Energy
Windjammer Capital Investors
WLR Recovery Partners
Xenon Private Equity
York Capital Management
Fixed Income - Ex Inflation LinkedGoldman Sachs Asset Management, LP
Income Research + Management
Oak Hill Advisors, LP
Oak Tree Capital Management, LP
Pacific Investment Management Company (PIMCO)
Reams Asset Management
State Street Global Advisors
Stone Harbor
TCW
Wellington
Fixed Income - Inflation LinkedBlackRock Financial Management
Bridgewater Associates, Inc.
Northern Trust Global Investments
CommoditiesCoreCommodity Management
Goldman Sachs Asset Management, LP
Gresham Investment Management, LLC
Investment Information

148 INVESTMENT SECTION
Investment Professionals, continued
Consolidated Defined Benefit Assets
Real EstateAbacus Capital Group, LLC
BlackRock Financial Management
Blackstone Property Partners
Blackstone Real Estate Partners
Colony Capital, LLC
Exeter Property Group, LLC
Greenfield Partners, LLC
H/2 Capital Partners
Harrison Street Real Estate Capital, LLC
House Investments
JDM Partners
LaSalle Investment Management
Lone Star Funds
Mesa West Capital
Prima Capital Advisors, LLC
Related Fund Management LLC
Rockpoint Group LLC
Stockbridge Capital Group
TA Realty Associates
Walton Street Capital, LLC
WestRiver Capital, LLC
Absolute ReturnAQR Capital Management
Aeolus Capital Management
Black River Asset Management
Blackstone Alternative Asset Management (BAAM)
Blackstone Tactical Opportunities Advisors
Brevan Howard Asset Management
Bridgewater Associates, Inc.
Davidson Kempner Capital Management
D.E. Shaw Multi-Asset Manager
Emerging Sovereign Group
Highfields Capital Management
Ionic Capital Management
Kepos Capital
King Street Capital Management
MKP Capital Management
Nephila Capital
Oceanwood Capital Management
Oxford Asset Management
Pacific Alternative Asset Management
Company (PAAMCO)
Perella Weinberg Partners
Pharo Global Advisors
Tilden Park Associates
Two Sigma Advisers
Risk ParityAQR Capital Management
Bridgewater Associates, Inc
First Quadrant
Cash OverlayRussell Investments
Investment Information
INVESTMENT SECTION 149
Annuity Savings Account & Legislators’ Defined Contribution Plan Assets
Public Employees’ Retirement Fund (PERF)
Teachers’ Retirement Fund Pre-1996 Account
(TRF Pre-1996)
Teachers’ Retirement Fund 1996 Account
(TRF 1996)
Legislators’ Defined Contribution Plan
(LEDC Plan)
ConsultantCap Cities (General: Defined Contribution)
Large Cap Equity Index FundBlackRock Institutional Trust
Small/Mid Cap Equity FundRhumbline Advisers
Times Square Capital Management, LLC
International Equity FundAltrinsic Global Advisors, LLC
Arrowstreet Capital, LP
Baillie Gifford & Company
BlackRock Institutional Trust
Fixed Income FundLoomis Sayles & Company
Northern Trust Global Investments
Pacific Investment Management Company (PIMCO)
Inflation-Linked Fixed Income FundBlackRock Institutional Trust
Money Market FundBank of New York Mellon
Guaranteed FundLogan Circle
Reams Asset Management
State Street Global Advisors
Stable Value Fund (PERF ASA Only & Legislators’ Plans only)Galliard Capital Management
Pension Relief FundBank of New York Mellon
Special Death FundsBlackRock Financial Management
Investment Professionals, continued
Investment Information