Bond Portfolio Management Strategies Active, Passive, and Immunization Strategies.

Investment Portfolio Strategies in the Current Environment
Charles A. CrowleyManaging Director
Wells Fargo Securities, LLC

Market Trends
2

0.00
0.50
1.00
1.50
2.00
2.50
3.00
3.50
4.00
4.50
1Y 3Y 5Y 7Y 9Y 11Y 13Y 15Y 17Y 19Y 21Y 23Y 25Y 27Y 29Y
Yie
ld (
%)
Spot 1YR FWD 2YR FWD 3YR FWD
Federal Reserve Highlights
Forward Curve
April FOMC Meeting Highlights Market Expectations of Fed Funds Rate
Growth in economic activity has picked up recently Household spending appears to be rising more quickly,
business fixed investment has edged down, and housing sector recovery has remained slow
The Committee views risks to the outlook for the economy and labor market as nearly balanced, and recognizes that inflation below its 2% objective could pose risks to economic performance
The economy is expected to continue to expand at a moderate pace and employment to improve gradually
The Committee’s sizable and continuing asset purchase program should maintain downward pressure on longer term interest rates, support mortgage markets and help make broader financial conditions more accommodative
The Committee will continue its purchases of Treasury and agency mortgage-backed securities as well as employ other policy tools as appropriate until the outlook for the labor market has improved substantially in the context of price stability
The Committee will assess both realized and expected progress towards its employment and inflation objectives in determining how long to maintain the current 0-0.25% target range for the federal funds rate
The next FOMC meeting will take place June 17-18th
Source: FOMC Minutes
0.00%
0.25%
0.50%
0.75%
1.00%
1.25%
1.50%
1.75%
2.00%
Yie
ld
Pre FOMC Post FOMC
Source: Bloomberg LP
3

Federal Reserve Holdings
Commentary
Current purchases of $45 bn/mo $25 bn/mo in U.S. Treasuries $20 bn/mo in agency MBS
Reducing at a steady pace of $10 bn/meeting -$5 bn/mo in U.S. Treasuries -$5 bn/mo in agency MBS
Fed Mortgage Holdings
Source: Wells Fargo Securities, LLC
$0.0
$0.5
$1.0
$1.5
$2.0
$2.5
$3.0
$3.5
$4.0
$4.5
2007 2008 2009 2010 2011 2012 2013 2014
($,
in t
rilli
ons)
Other: Apr @ $223.2BForeign Swaps: Apr @ $0.4BPDCF & TAFCommercial Paper & Money MarketRepos & Dis. Window: Apr @ $0.0BAgencies & MBS: Apr @ $1,650.5BTreasuries: Apr @ $2,324.4B
Federal Reserve Balance Sheet
Source: Federal Reserve Board, Bloomberg LP and Wells Fargo Securities, LLC
Total Fed as %Outstanding Holdings of Total
30 yrFNMA 1,647,243 696,551 42.3%FHLMC 945,212 379,471 40.1%GNMA I 354,480 64,948 18.3%GNMA II 889,288 240,386 27.0%Sub-Total 3,836,223 1,381,356 36.0%
20 YrFNMA 120,743 3,870 3.2%FHLMC 74,018 751 1.0%Sub-Total 194,761 4,621 2.4%
15 yrFNMA 425,882 127,970 30.0%FHLMC 261,969 66,465 25.4%GNMA I 22,203 - 0.0%GNMA II 29,318 - 0.0%Sub-Total 739,372 194,435 26.3%
10 yrFNMA 54,366 1,794 3.3%FHLMC 14,543 692 4.8%Sub-Total 68,909 2,486 3.6%
$4,839,265 $1,582,898 32.7%
4

0.0%
0.5%
1.0%
1.5%
2.0%
2.5%
3.0%
4/25/2014 12/31/2013 12/31/2012
Yield Curve
While the Fed has begun tapering their asset purchases, they have reaffirmed their highly accommodative monetary policy. The result: A Steepening Yield Curve
Yield Curve
2’s – 5’s UST Curve Spread 2’s – 10’s UST Curve Spread
4/25/2014 12/31/2013 Var 12/31/2012 Var
1yr 0.09 0.11 (0.03) 0.14 (0.05)
2yr 0.43 0.39 0.04 0.26 0.17
3yr 0.87 0.77 0.10 0.37 0.50
5yr 1.71 1.74 (0.04) 0.75 0.96
7yr 2.26 2.46 (0.20) 1.20 1.06
10yr 2.65 3.03 (0.38) 1.78 0.87
‐1.0
‐0.5
0.0
0.5
1.0
1.5
2.0
2.5
3.0
3.51/1999
1/2000
1/2001
1/2002
1/2003
1/2004
1/2005
1/2006
1/2007
1/2008
1/2009
1/2010
1/2011
1/2012
1/2013
1/2014Spread
(bps)
‐0.5
0.0
0.5
1.0
1.5
2.0
1/1999
1/2000
1/2001
1/2002
1/2003
1/2004
1/2005
1/2006
1/2007
1/2008
1/2009
1/2010
1/2011
1/2012
1/2013
1/2014Spread
(bps)
High Low Average Median Current1.63 -0.25 0.69 0.72 1.30
Source: Bloomberg LP
High Low Average Median Current2.91 -0.51 1.39 1.68 2.24
5

MBS Trends
Trend
15yr 3% MBS MBS 30yr Coupon Stack
Recent changes in unrealized gains/losses in investment portfolios have been roughly equivalent to price movement of 15yr 3% MBS
As expected, higher coupon MBS have held in better during sell offs
With prepayments slowing, many recent MBS coupons are approaching fully extended levels
Source: Bloomberg LP 94.00
96.00
98.00
100.00
102.00
104.00
106.00
108.00
110.00
112.00
6%
5.5%
5%
4.5%
4%
3.5%
3%
2.5%
6%
5%
4.5%
4%
3.5%
3%
2.5%
2%
MBS 15yr Coupon Stack
89.00
91.00
93.00
95.00
97.00
99.00
101.00
103.00
105.00
107.00
109.00
111.00
6

-
0.50
1.00
1.50
2.00
2.50
3.00
Jan-13 Feb-13 Mar-13 Apr-13 May-13 Jun-13 Jul-13 Aug-13 Sep-13 Oct-13 Nov-13 Dec-13 Jan-14 Feb-14 Mar-14 Apr-14
15yr MBS
3yr FHLB
2yr FHLB +15 bps
+51 bps
+72 bps
FHLB Rates & Spreads
15yr MBS & FHLB Rates
15yr MBS & FHLB Spreads
0.50
0.70
0.90
1.10
1.30
1.50
1.70
1.90
2.10
Jan-13 Feb-13 Mar-13 Apr-13 May-13 Jun-13 Jul-13 Aug-13 Sep-13 Oct-13 Nov-13 Dec-13 Jan-14 Feb-14 Mar-14 Apr-14
15yr MBS vs. 3yr FHLB
15yr MBS vs. 2yr FHLB
+51 bps wider
+56 bps wider
Source: Bloomberg LP
7
Credit Union Trends
8

Cash/Assets Loans/Assets Loans/Deposits & Shares
13.0%14.2%14.7%
13.9%13.3%
11.7%12.0%11.2%
0%
2%
4%
6%
8%
10%
12%
14%
16%
20132012201120102009200820072006
50.1%49.6%50.6%52.5%54.6%58.2%
60.9%61.3%
0%
10%
20%
30%
40%
50%
60%
70%
20132012201120102009200820072006
59.2%58.5%59.9%62.3%65.4%
70.4%74.0%74.1%
0%
10%
20%
30%
40%
50%
60%
70%
80%
20132012201120102009200820072006
Balance Sheet
Source: SNL Financial, LLC
9
Shares & Deposits/Assets Borrowings/Assets Net Worth/Assets
85.9%86.0%85.8%
85.6%
84.6%
83.5%83.1%
83.5%
82%
82%
83%
83%
84%
84%
85%
85%
86%
86%
87%
20132012201120102009200820072006
0.5%0.4%0.4%
0.4%
1.0%
0.8%
0.6%0.7%
0.0%
0.2%
0.4%
0.6%
0.8%
1.0%
1.2%
20132012201120102009200820072006
13.2%13.1%13.2%13.3%
13.7%
14.8%
15.3%
14.8%
11.5%
12.0%
12.5%
13.0%
13.5%
14.0%
14.5%
15.0%
15.5%
20132012201120102009200820072006

Earnings
Yields
6.3%6.6%
6.9%7.1%7.2%7.5%7.4%7.1%
0.9%1.0%1.2%1.5%
2.1%
3.2%
4.3%3.7%
4.3%4.7%
5.1%5.5%
5.9%
6.8%7.3%
6.7%
0%
1%
2%
3%
4%
5%
6%
7%
8%
20132012201120102009200820072006Yield on Loans "Yield on Investments" Yield on Earning Assets
Cost of Funds
0.5%0.6%0.8%
1.1%
1.5%
2.2%2.5%2.1%
0.6%
0.3%
0.5%0.6%0.7%
1.2%
1.9%
2.8%
0.5%0.6%
0.8%
1.1%
1.6%
2.2%
2.5%
2.1%
0.0%
0.5%
1.0%
1.5%
2.0%
2.5%
3.0%
20132012201120102009200820072006Cost of Deposits Cost of Borrowings Cost of Funds
Source: SNL Financial, LLC
10
Net Interest Margin
3.55%3.72%3.83%3.76%3.64%
4.01%
4.41%4.25%
0.0%
0.5%
1.0%
1.5%
2.0%
2.5%
3.0%
3.5%
4.0%
4.5%
5.0%
20132012201120102009200820072006

Earnings
Source: SNL Financial, LLC
ROA ROE Efficiency Ratio
85.0%79.9%77.5%
73.2%
65.9%60.9%
56.1%57.2%
0%
10%
20%
30%
40%
50%
60%
70%
80%
90%
20132012201120102009200820072006
2.20%
3.15%
2.19%
0.78%
‐1.02%
1.35%
4.94%
5.61%
‐2%
‐1%
0%
1%
2%
3%
4%
5%
6%
20132012201120102009200820072006
0.22%
0.30%
0.22%
0.07%
‐0.08%
0.23%
0.69%0.73%
‐0.2%
‐0.1%
0.0%
0.1%
0.2%
0.3%
0.4%
0.5%
0.6%
0.7%
0.8%
20132012201120102009200820072006
*Listed as Operating Expense/Gross Income in call reports
Non-Interest Income / Avg Assets Non-Interest Expense / Avg Assets
1.07%1.06%1.02%0.95%
1.20%
1.06%1.09%1.01%
0.0%
0.2%
0.4%
0.6%
0.8%
1.0%
1.2%
1.4%
20132012201120102009200820072006
3.70%3.72%
3.89%
3.96%3.90%
4.10%
4.01%
3.81%
3.4%
3.5%
3.6%
3.7%
3.8%
3.9%
4.0%
4.1%
4.2%
20132012201120102009200820072006
11
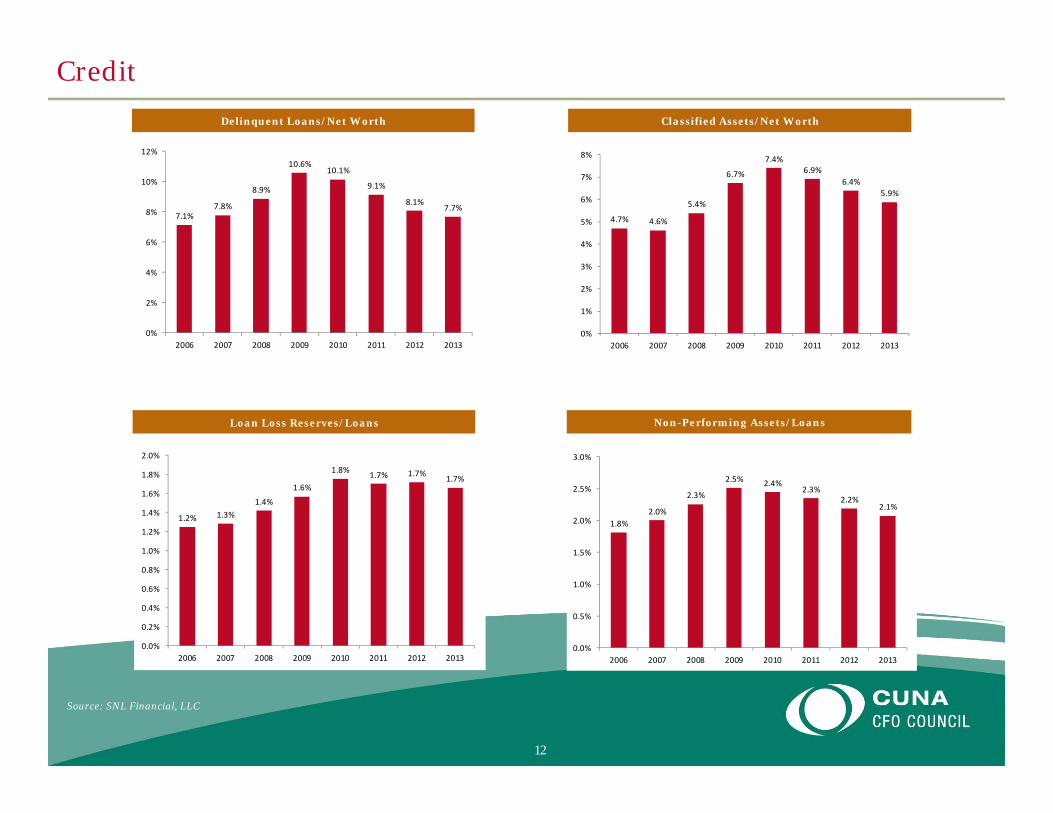
Credit
Source: SNL Financial, LLC
12
Delinquent Loans/Net Worth Classified Assets/Net Worth
Loan Loss Reserves/Loans Non-Performing Assets/Loans
2.1%2.2%
2.3%2.4%2.5%
2.3%
2.0%1.8%
0.0%
0.5%
1.0%
1.5%
2.0%
2.5%
3.0%
20132012201120102009200820072006
1.7%1.7%1.7%1.8%
1.6%
1.4%1.3%1.2%
0.0%
0.2%
0.4%
0.6%
0.8%
1.0%
1.2%
1.4%
1.6%
1.8%
2.0%
20132012201120102009200820072006
5.9%6.4%
6.9%7.4%
6.7%
5.4%
4.6%4.7%
0%
1%
2%
3%
4%
5%
6%
7%
8%
20132012201120102009200820072006
7.7%8.1%
9.1%
10.1%10.6%
8.9%
7.8%7.1%
0%
2%
4%
6%
8%
10%
12%
20132012201120102009200820072006

2014 Themes
– Outlook
– Economy is improving
– Consumer loan growth not rebounding as fast as business sector
– Positive earnings, yet still below pre-crisis level
– Cost of funds appears to have bottomed
– Expense rationalization
– Competitive environment
– More focus and reliance on interest rate risk / balance sheet management
13

Investment Portfolio Activity
14
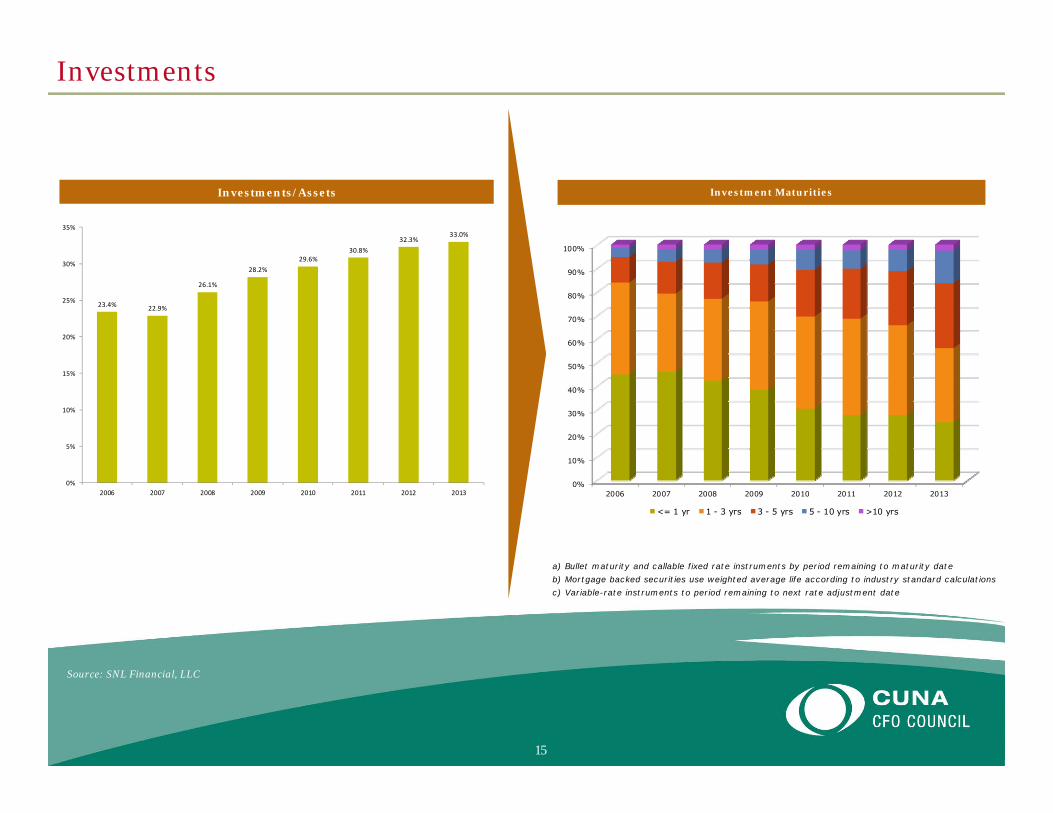
Investment Maturities
0%
10%
20%
30%
40%
50%
60%
70%
80%
90%
100%
20132012201120102009200820072006
<= 1 yr 1 - 3 yrs 3 - 5 yrs 5 - 10 yrs >10 yrs
Investments
Source: SNL Financial, LLC
15
33.0%32.3%
30.8%29.6%
28.2%
26.1%
22.9%23.4%
0%
5%
10%
15%
20%
25%
30%
35%
20132012201120102009200820072006
Investments/Assets
a) Bullet maturity and callable fixed rate instruments by period remaining to maturity dateb) Mortgage backed securities use weighted average life according to industry standard calculationsc) Variable-rate instruments to period remaining to next rate adjustment date

Security Allocations
Asset breakouts represent 2013 dataSource: SNL Financial, LLC
16
U.S. Government Obligations Agency/GSE Debt Agency/GSE MBS
Municipals Privately Issued MBS & CMBS Mututal Funds & Common Trusts
>10B 5-10B 1-10B 500M-1B 250-500M 50-250M <50MPvt MBS 1.7% 0.1% 1.2% 0.6% 1.6% 0.2% 0.1%
CMBS 0.0% 4.8% 1.9% 3.0% 2.3% 1.5% 0.4%CMBS includes agency-backed and private CMBS
0.0%
0.5%
1.0%
1.5%
2.0%
2.5%
3.0%
3.5%
4.0%
4.5%
5.0%
20132012201120102009200820072006% o
f to
tal i
nve
stm
ents
0%
5%
10%
15%
20%
25%
30%
35%
40%
201320122011201020092008200720060%
5%
10%
15%
20%
25%
30%
35%
40%
20132012201120102009200820072006
0.0%
0.2%
0.4%
0.6%
0.8%
1.0%
1.2%
1.4%
1.6%
1.8%
201320122011201020092008200720060.0%
0.5%
1.0%
1.5%
2.0%
2.5%
20132012201120102009200820072006
Private MBS CMBS
0.0%
0.2%
0.4%
0.6%
0.8%
1.0%
1.2%
1.4%
1.6%
20132012201120102009200820072006
>10B 5-10B 1-10B 500M-1B 250-500M 50-250M <50M18.8% 3.4% 3.5% 1.9% 1.1% 1.0% 0.9%
>10B 5-10B 1-10B 500M-1B 250-500M 50-250M <50M27.7% 35.5% 42.3% 37.1% 30.5% 20.0% 5.1%
Agency/GSE Debt breakout unavailable pre-2008
>10B 5-10B 1-10B 500M-1B 250-500M 50-250M <50M37.0% 43.6% 43.5% 44.0% 39.4% 20.3% 3.6%
Agency/GSE MBS breakout unavailable pre-2008Includes agency CMBS, SBAs, etc.
>10B 5-10B 1-10B 500M-1B 250-500M 50-250M <50M0.3% 1.9% 1.0% 0.8% 0.5% 0.3% 0.2%
>10B 5-10B 1-10B 500M-1B 250-500M 50-250M <50M1.1% 3.0% 1.8% 1.7% 1.4% 1.0% 0.3%
Municipals data unavailable pre-2011

Portfolio Yields
Industry 2013: Breakdown by Asset Size
0.4%0.4%0.5%0.5%0.6%
1.0%
1.8%1.7%
0.9%1.0%
1.2%
1.6%
2.1%
3.2%
4.3%
3.8%
0.0%
0.5%
1.0%
1.5%
2.0%
2.5%
3.0%
3.5%
4.0%
4.5%
5.0%
20132012201120102009200820072006
[Portfolio Yield - Cost of Funds] Spread
Yield on Securities
-0.2%
0.2%
0.4%
0.5%0.5%
0.5%
0.4%
1.0%0.9%
1.0%1.1% 1.1%
1.0%
0.8%
-0.4%
-0.2%
0.0%
0.2%
0.4%
0.6%
0.8%
1.0%
1.2%
1.4%
>10B 5B-10B 1B-10B 500M-1B 250M-500M 50M-250M <50M
[Portfolio Yield - Cost of Funds] Spread Yield on Securities
Source: SNL Financial, LLC
17

Held-to-Maturity Allocations
Source: SNL Financial, LLC
18
Industry 2013: Breakdown by Asset Size
25.5%24.2%24.5%24.5%26.2%25.7%
29.1%
35.4%
70.2%72.4%72.9%
75.3%77.2%77.2%
73.7%71.2%
0%
10%
20%
30%
40%
50%
60%
70%
80%
90%
20132012201120102009200820072006
HTM BV (% of portfolio) % of Banks with 0% in HTM
11%
29%
23%
18%
28%
38%
66%
25%
64%
49%
55%
49%52%
80%
0.0%
10.0%
20.0%
30.0%
40.0%
50.0%
60.0%
70.0%
80.0%
90.0%
>10B 5B-10B 1B-10B 500M-1B 250M-500M 50M-250M <50M
HTM BV (% of portfolio) % of Banks with 0% in HTM

Investment Portfolio Activity
Defensive portfolio positioning continues for higher rates that have yet to come. Discussions have turned from “Earnings & Yield” to “Volatility & Extension”
– Developing an investment framework
– Quantify the breakeven rate
– Understand portfolio volatility
– Securities that roll down the curve
– Limit extension risk
– Increase cash flow
» Seasoned 15yr MBS, 1oyr MBS
» Short stated final structured pass-throughs
– Bullet securities to roll down the curve
– Add floating / adjustable rate product
– Evaluate potential hedging
– FHLB vs. Interest Rate Swaps
19

Developing an Investment Framework
20

Breakeven Analysis
Source: Wells Fargo Securities, LLC
21

Developing an Investment Framework
Objective: XYZ Credit Union would like to develop a Quantitative Risk Management Framework
Interest Rate Risk Spread Risk Liquidity Risk Credit Risk
Risk tolerance is a function of two factors:
Capital Volatility Threshold Investment Portfolio Allocation
Step 1: Define the Risks to the Investment Portfolio
Step 2: Calculate Risk Tolerance:
Capital Volatility Threshold
The Capital Volatility Threshold (CVT) is the maximum acceptable decline in the net worth
22

Investment Portfolio Allocation
The credit union should have a target size for the investment portfolio (as a % of total assets)
The target size of the investment portfolio is a function of: liquidity needs, asset concentration, funding mix, ALM profile, capital position, and the lending environment
The Risk Tolerance (RT) is the maximum acceptable percentage price decline in the investment portfolio
Developing an Investment Framework
Step 3: Define the Market Shock Scenario
The Market Shock Scenario (MSS) is a function of both interest rate and spread volatility.
The most conservative approach is to assume an instantaneous shock of interest rates/spreads. In times of high interest rate/spread volatility, the MSS should be set at a higher level, while in times of low interest rate/spread volatility, the MSS should be set at a lower level.
Assume interest rate/spread volatility is historically high, meaning the probability of a market shock is above average, the relevant MSS might be +300bps.
23

Developing an Investment Framework
Conversely, assume interest rate/spread volatility is historically low, meaning the probability of a market shock is below average, the relevant MSS might be a +100bps/+200bps
All else equal, the higher/(lower) the MSS the shorter/(longer) the duration of the investment portfolio
As rational investors, we seek to maximize return, subject to our risk constraints. The goal is to build an investment portfolio that maximizes expected income, but does not decline by more than the RT in the MSS.
Assume the RT is -10.0%, and the relevant MSS is +200bps. Our goal is to maximize expected income, subject to the constraint that the investment portfolio does not decline by more than 10.0% in a +200bps scenario.
Steps 2-4 should be repeated as balance sheet and market conditions change
Step 4: Rebalance the Investment Portfolio
24

The following tables illustrate the interaction between the capital volatility threshold, investment portfolio allocation, and the risk tolerance:
Developing an Investment Framework
+300 Shock% of Current Book Market Book Market Avg Market ∆ Market
Sector Count Total Coupon Face Price Price Yield Yield Life Price Value
Portfolio Total 90 100% 4.6 67,980 96.10 100.04 6.2 3.5 5.1 88.47 (7,870)---Less HTM 0 0% 0.0 0 0.00 0.00 0.0 0.0 0.0 0.00 0AFS Total 90 100% 4.6 67,980 96.10 100.04 5.0 3.5 5.0 88.47 (7,870)
+300 Price Volatility (%∆) = -11.6%
Source: Wells Fargo Securities, LLC 25
Total Assets: 437,641Total AFS Securities: 70,563OCI: (4,833)Capital: 44,357
Total AFS Securities / Total Assets: 16.1%Market Shock Scenario: +300 bpsHedge Term: 5 yr
Actual
Capital / Assets: 10.1%
Capital Volatility Threshold: -1.7%
Proforma Capital / Assets: 8.4%
Capital / Assets (%∆): -16.9%
Price Decline +300 bps: -11.6%
Effective Duration: 3.9
Target
Capital / Assets: 10.1%
Capital Volatility Threshold: -1.5%
Proforma Capital / Assets: 8.6%
Capital / Assets (%∆): -15.0%
Price Decline +300 bps: -10.3%
Effective Duration: 3.4
Hedge Value +300 bps (%∆): 13.4%
Hedge Notional: 6,608
-10.32% 12.0% 14.0% 16.1% 19.0% 21.0%
-0.5% -4.6% -4.0% -3.4% -2.9% -2.6%
-1.0% -9.2% -7.9% -6.8% -5.8% -5.2%
-1.5% -13.9% -11.9% -10.3% -8.8% -7.9%
-2.0% -18.1% -15.6% -13.5% -11.5% -10.4%
-2.5% -22.6% -19.3% -16.8% -14.2% -12.9%
Price Volatility +300 bps
Total AFS Securities / Total Assets
Cap
ital V
olat
ility
Thr
esho
ld
Developing an Investment Framework
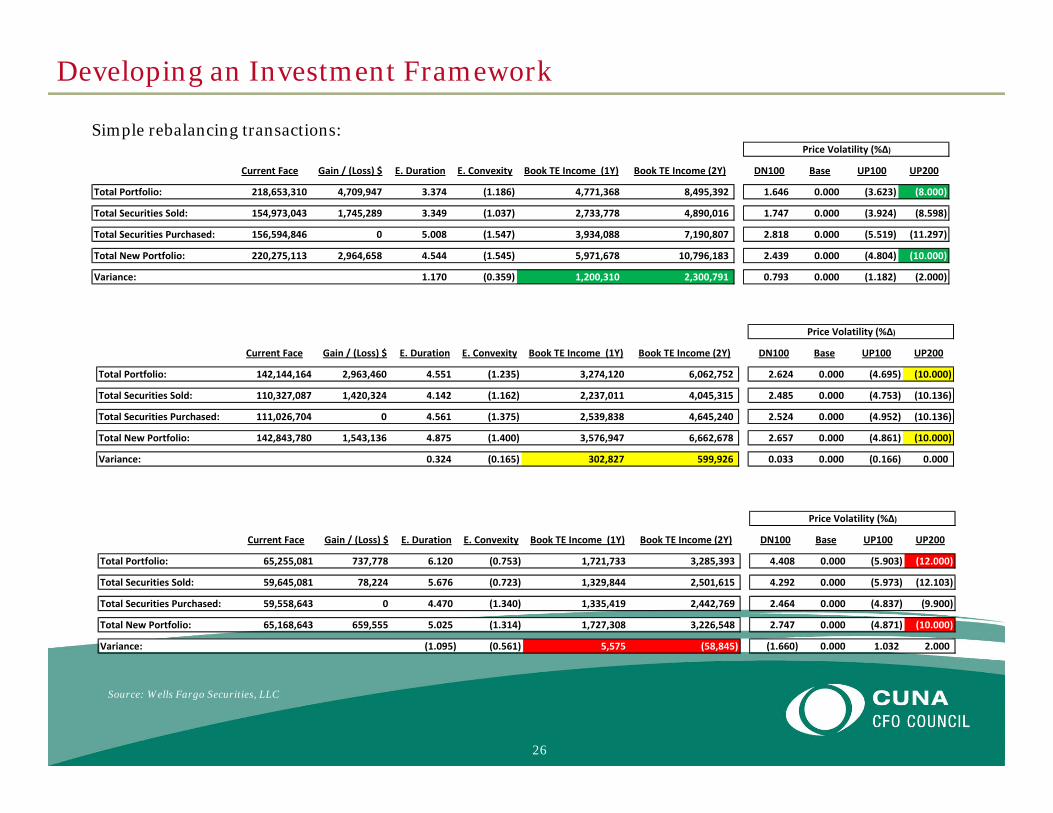
Simple rebalancing transactions:
Current Face Gain / (Loss) $ E. Duration E. Convexity Book TE Income (1Y) Book TE Income (2Y) DN100 Base UP100 UP200
Total Portfolio: 218,653,310 4,709,947 3.374 (1.186) 4,771,368 8,495,392 1.646 0.000 (3.623) (8.000)
Total Securities Sold: 154,973,043 1,745,289 3.349 (1.037) 2,733,778 4,890,016 1.747 0.000 (3.924) (8.598)
Total Securities Purchased: 156,594,846 0 5.008 (1.547) 3,934,088 7,190,807 2.818 0.000 (5.519) (11.297)
Total New Portfolio: 220,275,113 2,964,658 4.544 (1.545) 5,971,678 10,796,183 2.439 0.000 (4.804) (10.000)
Variance: 1.170 (0.359) 1,200,310 2,300,791 0.793 0.000 (1.182) (2.000)
Price Volatility (%Δ)
Current Face Gain / (Loss) $ E. Duration E. Convexity Book TE Income (1Y) Book TE Income (2Y) DN100 Base UP100 UP200
Total Portfolio: 142,144,164 2,963,460 4.551 (1.235) 3,274,120 6,062,752 2.624 0.000 (4.695) (10.000)
Total Securities Sold: 110,327,087 1,420,324 4.142 (1.162) 2,237,011 4,045,315 2.485 0.000 (4.753) (10.136)
Total Securities Purchased: 111,026,704 0 4.561 (1.375) 2,539,838 4,645,240 2.524 0.000 (4.952) (10.136)
Total New Portfolio: 142,843,780 1,543,136 4.875 (1.400) 3,576,947 6,662,678 2.657 0.000 (4.861) (10.000)
Variance: 0.324 (0.165) 302,827 599,926 0.033 0.000 (0.166) 0.000
Price Volatility (%Δ)
Current Face Gain / (Loss) $ E. Duration E. Convexity Book TE Income (1Y) Book TE Income (2Y) DN100 Base UP100 UP200
Total Portfolio: 65,255,081 737,778 6.120 (0.753) 1,721,733 3,285,393 4.408 0.000 (5.903) (12.000)
Total Securities Sold: 59,645,081 78,224 5.676 (0.723) 1,329,844 2,501,615 4.292 0.000 (5.973) (12.103)
Total Securities Purchased: 59,558,643 0 4.470 (1.340) 1,335,419 2,442,769 2.464 0.000 (4.837) (9.900)
Total New Portfolio: 65,168,643 659,555 5.025 (1.314) 1,727,308 3,226,548 2.747 0.000 (4.871) (10.000)
Variance: (1.095) (0.561) 5,575 (58,845) (1.660) 0.000 1.032 2.000
Price Volatility (%Δ)
Source: Wells Fargo Securities, LLC
26
0.00
0.50
1.00
1.50
2.00
2.50
3.00
3.50
4.00
4.50
1Y 2Y 3Y 4Y 5Y 6Y 7Y 8Y 9Y 10Y 11Y 12Y 13Y 14Y 15Y 16Y 17Y 18Y 19Y 20Y 21Y 22Y 23Y 24Y 25Y 26Y 27Y 28Y 29Y 30YYie
ld (
%)
Spot 1YR FWD 2YR FWD 3YR FWD
2.14
2.60
2.97
3.25
0.98
1.75
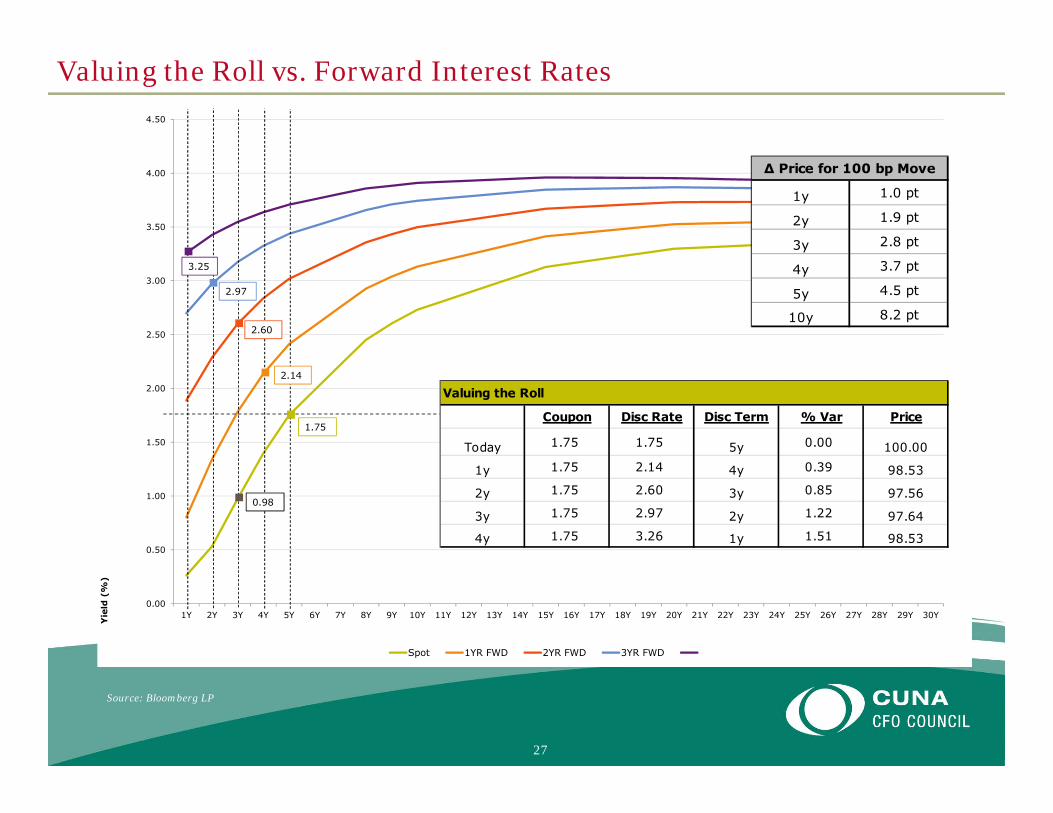
Valuing the Roll vs. Forward Interest Rates
27
Source: Bloomberg LP
Valuing the Roll
Coupon Disc Rate Disc Term % Var Price
Today 1.75 1.75 5y 0.00 100.00
1y 1.75 2.14 4y 0.39 98.53
2y 1.75 2.60 3y 0.85 97.56
3y 1.75 2.97 2y 1.22 97.64
4y 1.75 3.26 1y 1.51 98.53
∆ Price for 100 bp Move
1y 1.0 pt
2y 1.9 pt
3y 2.8 pt
4y 3.7 pt
5y 4.5 pt
10y 8.2 pt
Limiting Extension Risk
28
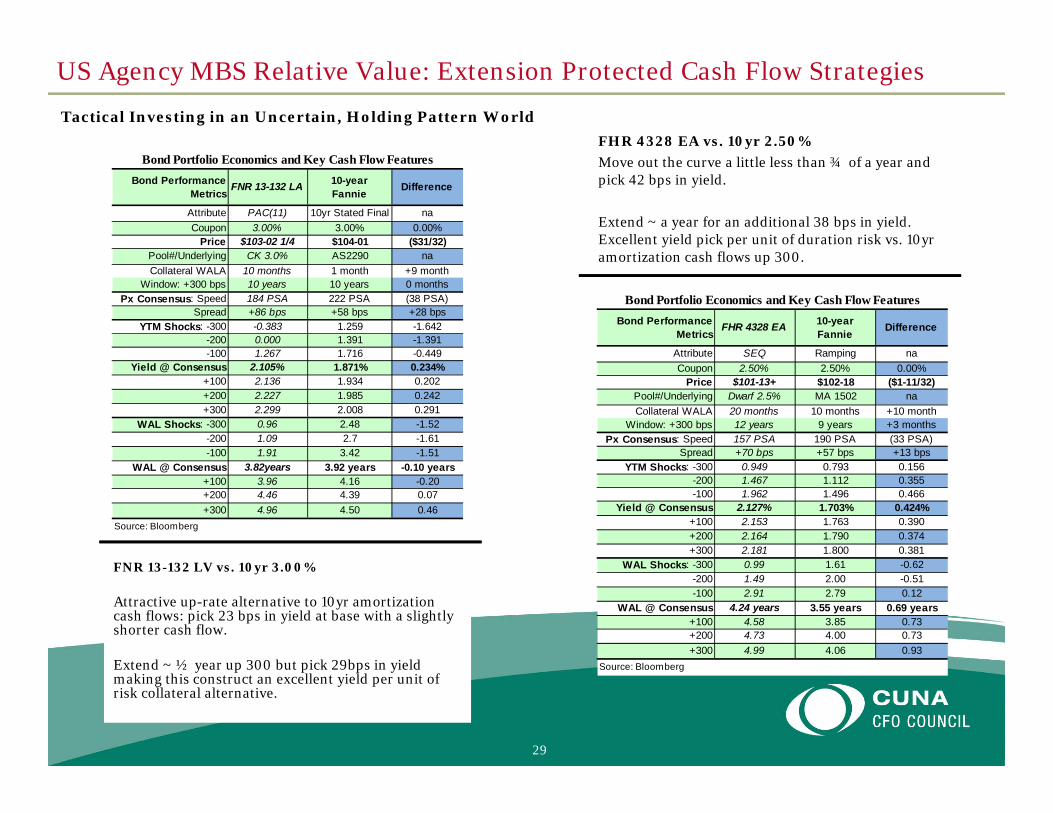
US Agency MBS Relative Value: Extension Protected Cash Flow Strategies
FNR 13-132 LV vs. 10yr 3.00%
Attractive up-rate alternative to 10yr amortization cash flows: pick 23 bps in yield at base with a slightly shorter cash flow.
Extend ~ ½ year up 300 but pick 29bps in yield making this construct an excellent yield per unit of risk collateral alternative.
Tactical Investing in an Uncertain, Holding Pattern World
Bond Performance Metrics
FNR 13-132 LA 10-year Fannie Difference
Attribute PAC(11) 10yr Stated Final naCoupon 3.00% 3.00% 0.00%
Price $103-02 1/4 $104-01 ($31/32)Pool#/Underlying CK 3.0% AS2290 naCollateral WALA 10 months 1 month +9 month
Window: +300 bps 10 years 10 years 0 months Px Consensus: Speed 184 PSA 222 PSA (38 PSA)
Spread +86 bps +58 bps +28 bpsYTM Shocks: -300 -0.383 1.259 -1.642
-200 0.000 1.391 -1.391-100 1.267 1.716 -0.449
Yield @ Consensus 2.105% 1.871% 0.234%+100 2.136 1.934 0.202+200 2.227 1.985 0.242+300 2.299 2.008 0.291
WAL Shocks: -300 0.96 2.48 -1.52-200 1.09 2.7 -1.61-100 1.91 3.42 -1.51
WAL @ Consensus 3.82years 3.92 years -0.10 years+100 3.96 4.16 -0.20+200 4.46 4.39 0.07+300 4.96 4.50 0.46
Source: Bloomberg
Bond Portfolio Economics and Key Cash Flow FeaturesFHR 4328 EA vs. 10yr 2.50%Move out the curve a little less than ¾ of a year and pick 42 bps in yield.
Extend ~ a year for an additional 38 bps in yield. Excellent yield pick per unit of duration risk vs. 10yr amortization cash flows up 300.
Bond Performance Metrics
FHR 4328 EA 10-year Fannie Difference
Attribute SEQ Ramping naCoupon 2.50% 2.50% 0.00%
Price $101-13+ $102-18 ($1-11/32)Pool#/Underlying Dwarf 2.5% MA 1502 naCollateral WALA 20 months 10 months +10 month
Window: +300 bps 12 years 9 years +3 months Px Consensus: Speed 157 PSA 190 PSA (33 PSA)
Spread +70 bps +57 bps +13 bpsYTM Shocks: -300 0.949 0.793 0.156
-200 1.467 1.112 0.355-100 1.962 1.496 0.466
Yield @ Consensus 2.127% 1.703% 0.424%+100 2.153 1.763 0.390+200 2.164 1.790 0.374+300 2.181 1.800 0.381
WAL Shocks: -300 0.99 1.61 -0.62-200 1.49 2.00 -0.51-100 2.91 2.79 0.12
WAL @ Consensus 4.24 years 3.55 years 0.69 years+100 4.58 3.85 0.73+200 4.73 4.00 0.73+300 4.99 4.06 0.93
Source: Bloomberg
Bond Portfolio Economics and Key Cash Flow Features
29

US Agency MBS Relative Value: Extension Protected Cash Flow Strategies
Tactical Investing in an Uncertain, Holding Pattern World
A convenient static risk measure: 150k max dwarf 2.50% is an excellent alternative to FHR 4315 HA from a risk reward perspective – gives minimal base case yield with a slightly lower duration and better extension protection at nearly two points cheaper!
Bond Performance Metrics FHR 4315 HA 15-year
Fannie20-year Fannie
Attribute Sequential 150K Max RampingCoupon 3.00% 2.50% 3.50%
Price $102-04 1/8 $100-12 $102-30Pool#/Underlying 20yr 3.0% AQ 0578 MA 1584Collateral WALA 13 months 17 months 8 months
Window: +300 bps 14 years 13 years 19 years Px Consensus: Speed 156 PSA 156 PSA 200 PSA
Spread +80 bps +73 bps +94 bpsYTM Shocks: -300 1.060 2.124 1.765
-200 1.564 2.213 2.158-100 2.219 2.348 2.563
Yield @ Consensus 2.516% 2.389% 2.893%+100 2.562 2.396 2.984+200 2.581 2.400 3.009+300 2.594 2.403 3.025
WAL Shocks: -300 1.17 1.44 1.87-200 1.59 1.89 2.45-100 2.98 3.54 3.59
WAL @ Consensus 4.94 years 4.79 years 5.76 years+100 5.49 5.11 6.88+200 5.77 5.32 7.26+300 5.95 5.43 7.51
Source: Bloomberg
Bond Portfolio Economics and Key Cash Flow Features
0.00
0.50
1.00
1.50
2.00
2.50
3.00
3.50
4.00
0 2 4 6 8 10 12 14 16 18 20
Yield
Duration
Yield per Unit of Duration Risk
UST US Swap 10yr 2.5 FHR 4315 CA30yr MHA80 3.0 30yr HLB 4.0 30yr FICO 4.5 20yr 3.5Seas 20yr 4.0 7/1Hybrid 2.537 FHR 4315 EA 30yr 3.520yr 3.0 FHR 4315 HA Seas 15yr 3.0 2yr A Corp5yr A Corp 10yr A Corp 2yr Agy 3yr Agy5yr Agy 2yr nc 3m 3yr nc 3m 5yr nc 6m2yr AAA muni 5yr AAA muni 10yr AAA muni FHR 4328 AD150k Max dwf 2.5
Source: Wells Fargo Securities, LLC
30
Floating Rate Investments
With the recent increase in interest rates, many clients are re-evaluating their investment strategy
Losses have accumulated faster than most investors expected
With more interest rate volatility expected, clients are looking for a safe place to park cash until fixed
income markets stabilize
Overnight Fed deposits offer too little yield (currently, 25 bps)
Floating rate investments are increasingly popular with our clients looking to minimize interest rate
risk, while maintaining a reasonable return
The next slide outlines some of the most popular floating rate investment alternatives
31

Floating Rate Investments
NGN Floaters GNMA CMO Floaters SBA Floaters
NGN floaters offer a WAL < 3Yrs and a discount margin (DM) of ~ 22bps at 10 CPR
GNMA CMO floaters offer a WAL < 5Yrs and a discount margin (DM) of ~ 36bps at BBG median PSA
SBA floaters offer a WAL < 4Yrs, and a yield of ~1.0% at 10 CPR
Benefits Short final maturity (6 years, 2020) Full faith and credit of the US
government
Benefits Simple PT structure (no whipsaw
risk) Full faith and credit of the US
government
Benefits Uncapped Full faith and credit of the US
government
Considerations Cap risk (8%) Spread risk Liquidity risk
Considerations Cap risk (6.5%) Spread risk Liquidity risk
Considerations Premium risk Spread risk Liquidity risk
Source: Bloomberg LP
32

Hedging
33

Hedging Options
– Fixed rate security with pay-fixed interest rate swap
» Converts fixed rate to floating rate
– Floating rate FHLB advance with pay-fixed interest rate swap
» AOCI benefit with cash flow hedge
» Term out funding
– Term floating rate FHLB advance with interest rate cap
– Forward starting IR swap
34

TenorNotional Amount -2.00% -1.00% -0.50% -0.25% Par +1.00% +2.00% +3.00% +4.00%
5y $10MM (1,013) (493) (243) (121) - 467 910 1 ,330 1 ,7 27 10y $10MM (1,951) (926) (452) (223) - 838 1 ,597 2,284 2,906 15y $10MM (2,7 7 7 ) (1 ,289) (621) (305) - 1 ,117 2,086 2,928 3,660
Rate Shift *MTM Changes in Thousands
Hedging Floating Rate Funding
The current environment makes a compelling case for hedging against higher rates as earnings and NIM are under pressure with theFed on hold:
– On the asset side, credit unions are acquiring longer duration assets in loan and investment portfolios and loan demand is tepid
– On the liability side, credit unions are keeping funding lower-cost and a shorter-term– With the shifts on both sides of the balance sheet, there is commonly an ALM need for protection against higher rates
Floating rate funding can be hedged with both spot and forward starting swaps. Any forward starting swaps longer than 90 days from trade date require NCUA approval.
This strategy can be deployed against existing or future variable rate funding (FHLB advances, retail or wholesale time deposits, market-linked interest bearing deposits).
Typically the hedge will have pricing efficiencies to other term funding sources.
This strategy can also be used as a leverage play for credit unions looking to increase Net Interest Income by adding funding, using the hedge to manage duration, then deploying the funding against longer dated fixed rate assets.
In the current environment, many credit unions are hedging against higher rates to protect Net Interest Income (NII) and Economic Value of Equity (EVE)
Using Interest Rate Hedges to Manage Funding, Enhance NIM, and Protect EVE
ALM Impact of Hedge
Source: WFS Interest Rate Risk Management Group
35

Identifying Funding Source
A credit union can achieve significant savings using swaps in coordination with FHLB Advances:
FHLB Advance Rates have a term premium that raises the cost of financing
Financing with shorter term floating rate Advances minimizes the term premium impact
Savings will vary between FHLBs and tenors, but for the below FHLB, 10y fixed rate borrowings were at an 88 bps premium to benchmark swap rates
Credit unions can achieve the term rates they are looking for by combining a floating rate FHLB Advance with an interest rate swap and then simply renewing the short-term floating rate advance periodically
For credit unions that want to extend their funding with a hedge but don’t have the need for wholesale funding, there are retail funding sources that are hedgable. Most common are:
Market-linked interest bearing deposits (LIBOR, Fed Funds, Prime)
Retail time deposits
Municipal deposits
Retail Funding AlternativesFHLB Funding Alternative
Source: WFS Interest Rate Risk Management Group
36
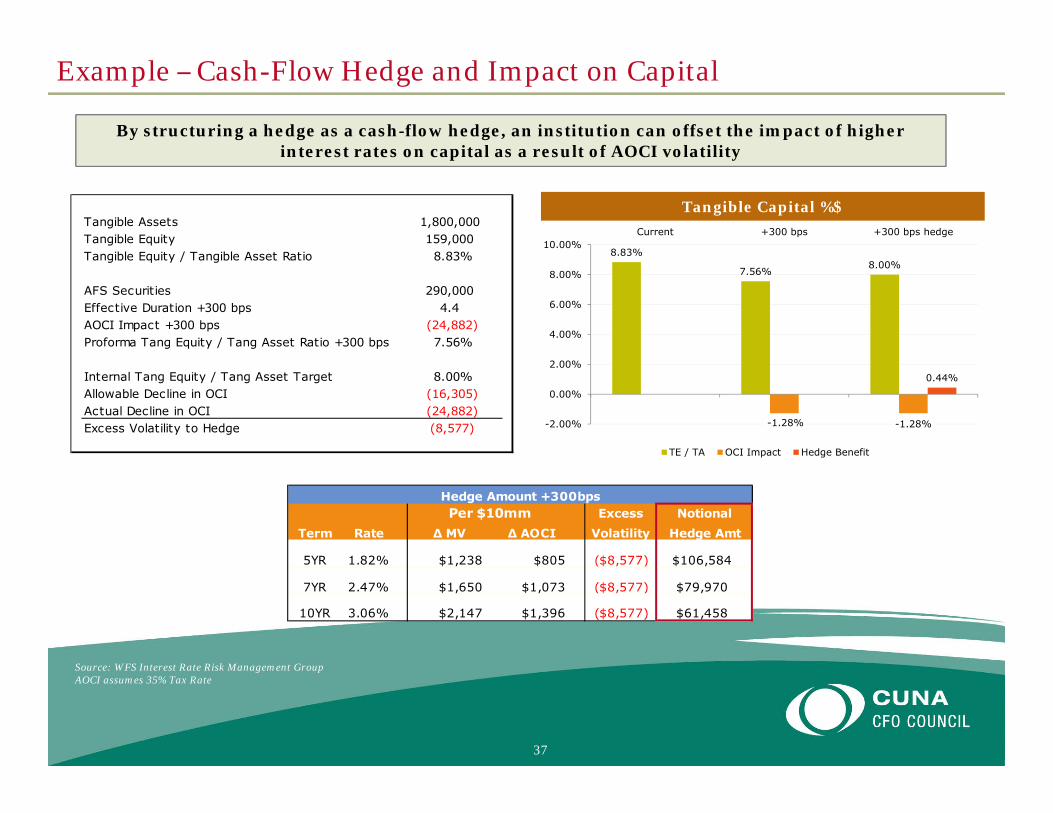
Example – Cash-Flow Hedge and Impact on Capital
By structuring a hedge as a cash-flow hedge, an institution can offset the impact of higher interest rates on capital as a result of AOCI volatility
Source: WFS Interest Rate Risk Management GroupAOCI assumes 35% Tax Rate
Tangible Capital %$
8.83%
7.56%8.00%
-1.28% -1.28%
0.44%
-2.00%
0.00%
2.00%
4.00%
6.00%
8.00%
10.00%Current +300 bps +300 bps hedge
TE / TA OCI Impact Hedge Benefit
Tangible Assets 1,800,000Tangible Equity 159,000Tangible Equity / Tangible Asset Ratio 8.83%
AFS Securities 290,000Effective Duration +300 bps 4.4AOCI Impact +300 bps (24,882)Proforma Tang Equity / Tang Asset Ratio +300 bps 7.56%
Internal Tang Equity / Tang Asset Target 8.00%Allowable Decline in OCI (16,305)Actual Decline in OCI (24,882)Excess Volatility to Hedge (8,577)
Excess NotionalTerm Rate ∆ MV ∆ AOCI Volatility Hedge Amt
5YR 1.82% $1,238 $805 ($8,577) $106,584
7YR 2.47% $1,650 $1,073 ($8,577) $79,970
10YR 3.06% $2,147 $1,396 ($8,577) $61,458
Per $10mmHedge Amount +300bps
37

Appendix
38

Asset Liability Management - I
39
Assets Cash and InvestmentsCash & Cash Equivalents 3,487,792 13% 330,475 5% 142,809 8%
HTM Securities BV 448,381 2% 591,662 9% 114,017 6%AFS Securities FV 3,589,364 13% 1,466,240 22% 373,986 20%
Total Securities 4,037,745 15% 2,057,902 31% 488,003 26%Trading Portfolio Investments - 7,967 0.1% 4,018 0.2%Other Investments 116,645 0.4% 42,304 0.6% 21,270 1%Total Investments 4,154,390 15% 2,108,173 32% 513,292 27%
LoansLoans Held For Sale 156,399 0.6% 13,351 0.2% 3,992 0.2%
Unsecured Credit Card Loans/LOC 2,685,574 10% 253,735 4% 68,466 4%Other Unsecured Loans/LOC 935,389 3% 104,218 2% 42,417 2%New Vehicle Loans 1,554,350 6% 609,501 9% 131,318 7%Used Vehicle Loans 1,881,525 7% 718,153 11% 209,699 11%1st Mtge RE Loans/LOC 10,084,760 36% 1,776,155 27% 503,689 27%Other RE Loans/LOC 1,738,500 6% 338,570 5% 134,803 7%Leases Receivable - 5,624 0.1% 1,468 0.1%Other loans/LOC to Members 315,757 1% 102,408 2% 56,407 3%Other Loans & Leases 23,709 0.1% 15,449 0.2% 5,969 0.3%
Gross Lns & Leases 19,219,563 69% 3,923,813 60% 1,154,236 61%Total Reserves 251,357 0.9% 53,274 0.8% 13,095 0.7%
Net Lns & Leases 18,968,206 68% 3,870,539 59% 1,141,141 61%NCUA Shr Ins Capitalization Dep 204,476 0.7% 51,743 0.8% 15,123 0.8%Other Assets 867,341 3% 209,075 3% 67,184 4%Total Assets 27,838,603 100% 6,583,357 100% 1,883,540 100%
Liabilities & Equity Share Drafts & Regular Shares 7,390,310 27% 2,394,785 36% 675,839 36%Money Market Shares 6,570,848 24% 1,378,346 21% 443,723 24%Share Certificates 5,477,973 20% 1,151,298 17% 342,568 18%IRA/KEOGH Accounts 2,746,584 10% 495,612 8% 136,477 7%All Other Shares 47,016 0.2% 91,430 1% 14,847 0.8%Non-Member Deposits 15,173 0.1% 23,343 0.4% 5,140 0.3%
Shares & Deposits 22,247,904 80% 5,534,815 84% 1,618,594 86%Total Borrowings 2,484,175 9% 314,149 5% 51,040 3%Other Liabilities 365,296 1% 65,901 1% 18,716 1.0%Total Liabilities 25,097,375 90% 5,914,865 90% 1,688,350 90%Total Equity Cap 2,741,228 10% 668,492 10% 195,190 10%
MemoShares & Deposits: <1 Yr 18,404,689 66% 4,845,283 74% 1,425,186 76%Shares & Deposits: 1-3 Yrs 2,262,159 8% 481,073 7% 138,412 7%Shares & Deposits: >3 Yrs 1,581,056 6% 208,459 3% 54,996 3%
Shares & Deposits 22,247,904 80% 5,534,815 84% 1,618,594 86%Total Liabilities: < 1 Yr 941,878 3% 120,844 2% 14,567 0.8%Total Liabilities: 1-3 Yrs 299,550 1% 62,873 1.0% 14,385 0.8%Total Liabilities: >3 Yrs 1,242,748 4% 130,433 2% 22,088 1%
Total Borrowings 2,484,175 9% 314,149 5% 51,040 3%
All figures in $000s; Peer data in averages; Source: SNL Financial, 4Q13
> 10 B 5 - 10 B 1 - 5 B
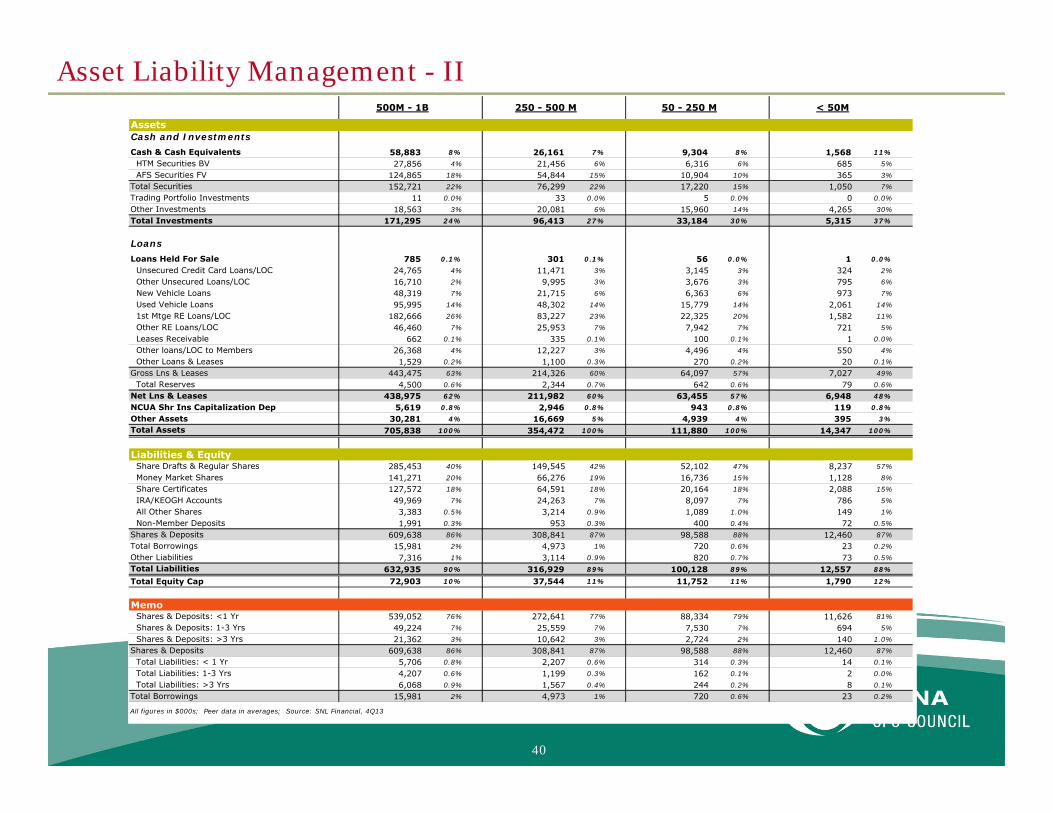
Assets Cash and InvestmentsCash & Cash Equivalents 58,883 8% 26,161 7% 9,304 8% 1,568 11%
HTM Securities BV 27,856 4% 21,456 6% 6,316 6% 685 5%AFS Securities FV 124,865 18% 54,844 15% 10,904 10% 365 3%
Total Securities 152,721 22% 76,299 22% 17,220 15% 1,050 7%Trading Portfolio Investments 11 0.0% 33 0.0% 5 0.0% 0 0.0%Other Investments 18,563 3% 20,081 6% 15,960 14% 4,265 30%Total Investments 171,295 24% 96,413 27% 33,184 30% 5,315 37%
LoansLoans Held For Sale 785 0.1% 301 0.1% 56 0.0% 1 0.0%
Unsecured Credit Card Loans/LOC 24,765 4% 11,471 3% 3,145 3% 324 2%Other Unsecured Loans/LOC 16,710 2% 9,995 3% 3,676 3% 795 6%New Vehicle Loans 48,319 7% 21,715 6% 6,363 6% 973 7%Used Vehicle Loans 95,995 14% 48,302 14% 15,779 14% 2,061 14%1st Mtge RE Loans/LOC 182,666 26% 83,227 23% 22,325 20% 1,582 11%Other RE Loans/LOC 46,460 7% 25,953 7% 7,942 7% 721 5%Leases Receivable 662 0.1% 335 0.1% 100 0.1% 1 0.0%Other loans/LOC to Members 26,368 4% 12,227 3% 4,496 4% 550 4%Other Loans & Leases 1,529 0.2% 1,100 0.3% 270 0.2% 20 0.1%
Gross Lns & Leases 443,475 63% 214,326 60% 64,097 57% 7,027 49%Total Reserves 4,500 0.6% 2,344 0.7% 642 0.6% 79 0.6%
Net Lns & Leases 438,975 62% 211,982 60% 63,455 57% 6,948 48%NCUA Shr Ins Capitalization Dep 5,619 0.8% 2,946 0.8% 943 0.8% 119 0.8%Other Assets 30,281 4% 16,669 5% 4,939 4% 395 3%Total Assets 705,838 100% 354,472 100% 111,880 100% 14,347 100%
Liabilities & Equity Share Drafts & Regular Shares 285,453 40% 149,545 42% 52,102 47% 8,237 57%Money Market Shares 141,271 20% 66,276 19% 16,736 15% 1,128 8%Share Certificates 127,572 18% 64,591 18% 20,164 18% 2,088 15%IRA/KEOGH Accounts 49,969 7% 24,263 7% 8,097 7% 786 5%All Other Shares 3,383 0.5% 3,214 0.9% 1,089 1.0% 149 1%Non-Member Deposits 1,991 0.3% 953 0.3% 400 0.4% 72 0.5%
Shares & Deposits 609,638 86% 308,841 87% 98,588 88% 12,460 87%Total Borrowings 15,981 2% 4,973 1% 720 0.6% 23 0.2%Other Liabilities 7,316 1% 3,114 0.9% 820 0.7% 73 0.5%Total Liabilities 632,935 90% 316,929 89% 100,128 89% 12,557 88%Total Equity Cap 72,903 10% 37,544 11% 11,752 11% 1,790 12%
MemoShares & Deposits: <1 Yr 539,052 76% 272,641 77% 88,334 79% 11,626 81%Shares & Deposits: 1-3 Yrs 49,224 7% 25,559 7% 7,530 7% 694 5%Shares & Deposits: >3 Yrs 21,362 3% 10,642 3% 2,724 2% 140 1.0%
Shares & Deposits 609,638 86% 308,841 87% 98,588 88% 12,460 87%Total Liabilities: < 1 Yr 5,706 0.8% 2,207 0.6% 314 0.3% 14 0.1%Total Liabilities: 1-3 Yrs 4,207 0.6% 1,199 0.3% 162 0.1% 2 0.0%Total Liabilities: >3 Yrs 6,068 0.9% 1,567 0.4% 244 0.2% 8 0.1%
Total Borrowings 15,981 2% 4,973 1% 720 0.6% 23 0.2%
All figures in $000s; Peer data in averages; Source: SNL Financial, 4Q13
500M - 1B 250 - 500 M 50 - 250 M < 50M
Asset Liability Management - II
40

Balance SheetTotal Assets 27,838,603 6,583,357 1,883,540 Cash / Assets 12.53% 5.02% 7.6%Investments / Assets 14.92% 32.02% 27.3%Loans / Assets 68.14% 58.79% 60.6%Shares & Deposits / Assets 79.92% 84.07% 85.9%Borrowings / Assets 8.92% 4.77% 2.7%Loans / Deposits 85.26% 69.93% 0.7%
Investment AllocationsAFS Securities 3,589,364 86% 1,466,240 70% 373,986 73%HTM Securities 448,381 11% 591,662 28% 114,017 22%Trading Securities - 7,967 0.4% 4,018 0.8%All Other Investments 115,948 3% 26,967 1% 10,542 2%Deposits in Banks and Thrifts - 3,832 0.2% 7,133 1%Loans to and Inv in Natural Person CUs 697 0.0% 147 0.0% 568 0.1%Capital at Corporate Credit Unions - 715 0.0% 1,209 0.2%All Other Investments in Corporate CUs - 10,643 0.5% 1,819 0.4%
Total Investments, Cash & Cash Equiv 4,154,390 100% 2,108,173 100% 513,292 100%
Investment MaturitiesTotal Investments <1 Yr 232,333 6% 800,685 38% 113,886 22%Total Inv, Cash & Cash Equiv 1-3 Yr 956,689 23% 696,782 33% 159,281 31%Total Inv, Cash & Cash Equiv 3-10 Yr 2,907,535 70% 594,690 28% 226,711 44%Total Inv, Cash & Cash Equiv >10 Yr 57,833 1% 16,016 0.8% 13,414 3%
Total Inv, Cash & Cash Equiv 4,154,390 100% 2,108,173 100% 513,292 100%
Memo*: U.S. Government ObligationsNCUA Guaranteed Notes 17,559 0.4% 71,362 3% 5,867 1%FDIC-Issued Guaranteed Notes - - 37 0.0%Treasuries & Other U.S. Gov Obligations 763,284 18% - 11,941 2%
U.S. Government Obligations 780,843 19% 71,362 3% 17,845 3%
Memo*: Federal Agency SecuritiesAgency/GSE Debt 1,152,467 28% 747,550 35% 217,250 42%Agency/GSE MBS (incl. CMOs, CMBS, SBAs) 1,539,093 37% 919,054 44% 223,397 44%
Federal Agency Securities 2,691,559 65% 1,666,603 79% 440,647 86%
Memo*: MunicipalsMunicipal Securities 46,944 1% 62,500 3% 9,417 2%
Memo*: MBSMBS: CMOs/REMICs 529,547 13% 551,636 26% 104,674 20%Other Privately Issued MBS 70,156 2% 1,711 0.1% 6,022 1%CMBS - 101,532 5% 9,835 2%
Memo*: Other SecuritiesMutual Funds 11,872 0.3% 39,074 2% 4,912 1.0%Common Trusts - - 103 0.0%
Mutual Funds & Common Trusts 11,871 0.3% 39,074 2% 5,014 1.0%Bank Issued FDIC Guar Bonds - 5,744 0.3% -
All figures in $000s; Peer data in averages; Source: SNL Financial, 4Q13
1 - 5 B5 - 10 B> 10 B
Portfolio - I
41

Balance SheetTotal Assets 705,838 354,472 111,880 14,347 Cash / Assets 8.34% 7.38% 8.3% 10.9%Investments / Assets 24.27% 27.20% 29.7% 37.0%Loans / Assets 62.19% 59.80% 56.7% 48.4%Shares & Deposits / Assets 86.37% 87.13% 88.1% 86.9%Borrowings / Assets 2.26% 1.40% 0.6% 0.2%Loans / Deposits 72.01% 68.64% 0.6% 0.6%
Investment AllocationsAFS Securities 124,865 73% 54,844 57% 10,904 33% 365 7%HTM Securities 27,856 16% 21,456 22% 6,316 19% 685 13%Trading Securities 11 0.0% 33 0.0% 5 0.0% 0 0.0%All Other Investments 4,798 3% 2,809 3% 712 2% 84 2%Deposits in Banks and Thrifts 11,158 7% 14,919 15% 13,675 41% 3,732 70%Loans to and Inv in Natural Person CUs 565 0.3% 812 0.8% 819 2% 263 5%Capital at Corporate Credit Unions 846 0.5% 740 0.8% 390 1% 63 1%All Other Investments in Corporate CUs 1,197 0.7% 800 0.8% 363 1% 122 2%
Total Investments, Cash & Cash Equiv 171,295 100% 96,413 100% 33,184 100% 5,315 100%
Investment MaturitiesTotal Investments <1 Yr 33,782 20% 21,172 22% 9,412 28% 1,979 37%Total Inv, Cash & Cash Equiv 1-3 Yr 51,926 30% 26,962 28% 11,004 33% 2,010 38%Total Inv, Cash & Cash Equiv 3-10 Yr 79,764 47% 45,271 47% 11,738 35% 1,218 23%Total Inv, Cash & Cash Equiv >10 Yr 5,822 3% 3,009 3% 1,029 3% 108 2%
Total Inv, Cash & Cash Equiv 171,295 100% 96,413 100% 33,184 100% 5,315 100%
Memo*: U.S. Government ObligationsNCUA Guaranteed Notes 1,963 1% 656 0.7% 79 0.2% 5 0.1%FDIC-Issued Guaranteed Notes - 4 0.0% 61 0.2% 9 0.2%Treasuries & Other U.S. Gov Obligations 1,325 0.8% 429 0.4% 189 0.6% 37 0.7%
U.S. Government Obligations 3,288 2% 1,089 1% 329 1.0% 50 0.9%
Memo*: Federal Agency SecuritiesAgency/GSE Debt 63,546 37% 29,454 31% 6,649 20% 269 5%Agency/GSE MBS (incl. CMOs, CMBS, SBAs) 75,340 44% 38,011 39% 6,749 20% 193 4%
Federal Agency Securities 138,885 81% 67,464 70% 13,398 40% 462 9%
Memo*: MunicipalsMunicipal Securities 2,954 2% 1,353 1% 324 1.0% 15 0.3%
Memo*: MBSMBS: CMOs/REMICs 29,010 17% 15,101 16% 1,795 5% 18 0.3%Other Privately Issued MBS 1,070 0.6% 1,508 2% 83 0.2% 4 0.1%CMBS 5,125 3% 2,230 2% 511 2% 20 0.4%
Memo*: Other SecuritiesMutual Funds 1,203 0.7% 504 0.5% 89 0.3% 7 0.1%Common Trusts 89 0.1% 0 0.0% 3 0.0% 1 0.0%
Mutual Funds & Common Trusts 1,292 0.8% 504 0.5% 92 0.3% 8 0.2%Bank Issued FDIC Guar Bonds 9 0.0% 47 0.0% 43 0.1% 6 0.1%
All figures in $000s; Peer data in averages; Source: SNL Financial, 4Q13 *Memo items represent individual sectors and may not tie to totals
< 50M50 - 250 M250 - 500 M500M - 1B
Portfolio - II
42

Profitability & Performance
Asset Yields Yield on Loans 4.85% 4.21% 4.62%Yield on Investments 1.03% 1.02% 1.20%
Yield on Earning Assets 4.31% 3.22% 3.72%
Liability Costs Cost of Int-Bearing Deposits 1.04% 0.62% 0.64%Cost of Borrowed Money 3.02% 2.34% 2.59%
Cost of Int-Bearing Liabilities 1.17% 0.68% 0.68%Cost of Funds 1.17% 0.68% 0.68%
Spreads/Margin Yield / Cost Spread 3.15% 2.53% 3.04%
Net Interest Margin (FTE) 2.80% 2.43% 2.7%
Profitability ROAA 0.99% 1.11% 0.84%ROAE 10.43% 11.42% 8.25%Interest Income / Assets 3.53% 2.91% 3.28%Interest Expense / Assets 1.04% 0.61% 0.60%Efficiency Ratio 49.70% 53.44% 62.54%
CapitalCapital AdequacyNet Worth / Total Assets 9.64% 10.27% 10.70%Total Delinquent Loans / Net Worth 5.99% 6.76% 5.85%Solvency Evaluation 111.53% 111.98% 112.13%Classified Assets / Net Worth 8.01% 8.62% 6.90%
CreditAsset Quality LLR / Total Loans 1.17% 1.35% 1.13%Coverage Ratio 152.88% 151.43% 152.89%Delinquent Loans / Total Loans 0.85% 1.02% 0.93%NPAs / Total Loans 0.94% 1.20% 1.14%NPAs / Equity + LLRs 6.16% 7.44% 7.91%
All figures in $000s; Peer data in averages; Source: SNL Financial, 4Q13
1 - 5 B> 10 B 5 - 10 B
Performance, Profitability, Capital & Credit - I
43

Profitability & Performance
Asset Yields Yield on Loans 4.94% 5.11% 5.52% 6.76%Yield on Investments 1.23% 1.29% 1.09% 0.83%
Yield on Earning Assets 3.98% 4.00% 4.04% 4.53%
Liability Costs Cost of Int-Bearing Deposits 0.53% 0.54% 0.45% 1.39%Cost of Borrowed Money 1.80% 1.78% 1.81% 0.97%
Cost of Int-Bearing Liabilities 0.56% 0.56% 0.46% 0.47%Cost of Funds 0.56% 0.56% 0.46% 0.47%
Spreads/Margin Yield / Cost Spread 3.42% 3.43% 3.58% 0.71%
Net Interest Margin (FTE) 3.13% 3.10% 3.2% 3.6%
Profitability ROAA 0.73% 0.65% 0.45% (0.20%)ROAE 7.41% 6.39% 4.16% (0.73%)Interest Income / Assets 3.44% 3.49% 3.49% 3.56%Interest Expense / Assets 0.50% 0.49% 0.41% 0.45%Efficiency Ratio 69.83% 72.17% 76.79% 90.05%
CapitalCapital AdequacyNet Worth / Total Assets 10.74% 10.92% 10.98% 14.39%Total Delinquent Loans / Net Worth 5.71% 6.27% 6.45% 8.41%Solvency Evaluation 112.24% 112.29% 112.29% 118.14%Classified Assets / Net Worth 6.37% 6.38% 5.52% 5.89%
CreditAsset Quality LLR / Total Loans 1.05% 1.09% 1.02% 1.99%Coverage Ratio 156.06% 138.97% 134.44% 122.98%Delinquent Loans / Total Loans 0.96% 1.02% 1.18% 2.34%NPAs / Total Loans 1.14% 1.23% 1.44% 2.46%NPAs / Equity + LLRs 6.91% 7.15% 7.52% 8.33%
All figures in $000s; Peer data in averages; Source: SNL Financial, 4Q13
< 50M50 - 250 M500M - 1B 250 - 500 M
Performance, Profitability, Capital & Credit - II
44

Disclaimer
Fixed Income Market & Portfolio Strategies Commentary is a product of Wells Fargo Securities, LLC’s fixed income sales and is not a product of Wells Fargo Securities, LLC’s Global Research Department. The views of the Strategist may differ from that of the Global Research Department.
About Wells Fargo SecuritiesWells Fargo Securities is the trade name for the capital markets and investment banking services of Wells Fargo & Company and its subsidiaries, including but not limited to Wells Fargo Securities, LLC, a member of NYSE, FINRA, NFA and SIPC, Wells Fargo Institutional Securities, LLC, a member of FINRA and SIPC, Wells Fargo Prime Services, LLC, a member of FINRA, NFA and SIPC and Wells Fargo Bank, N.A., Wells Fargo Securities, LLC carries and provides clearing services for Wells Fargo Institutional Securities, LLC customer accounts. Wells Fargo Securities, LLC, Wells Fargo Institutional Securities, LLC and Wells Fargo Prime Services, LLC are distinct entities from affiliated banks and thrifts.
Important Disclosures Relating to Conflicts of Interest and Potential Conflicts of InterestWells Fargo Securities, LLC may sell or buy the subject securities to/from customers on a principal basis. Wells Fargo Securities, LLC has or may have proprietary positions in the securities mentioned herein. The trading desk has or may have proprietary positions in the securities mentioned herein. The author’s compensation is based on, among other things, Wells Fargo Securities, LLC’s overall performance, the profitability of Wells Fargo Securities, LLC’s Fixed income Department and the profitability of the trading desk.
Accuracy of InformationThe information presented in this report is based on data provided by the client or obtained from the client's Wells Fargo Fixed Income Sales account and data provided by Interactive Data Corporation. While we believe the data to be reliable, Wells Fargo Fixed Income Sales does not guarantee accuracy or completeness. This information should not be construed as investment advice of a solicitation to sell or buy any security. The information herein was obtained from sources which Wells Fargo Securities, LLC and its suppliers believe reliable, but they do not guarantee its accuracy. Security prices and yields are subject to market fluctuation and availability. Past performance is no guarantee of future results. Wells Fargo Securities, LLC cannot provide tax advice. Please see your tax advisor to determine how this information may apply to your own situation. Neither the information, nor any opinion expressed, constitute a solicitation of the purchase or sale of any securities.
This report is for your information only and is not an offer to sell, or a solicitation of an offer to buy, the securities or instruments named or described in this report. Interested parties are advised to contact the entity with which they deal, or the entity that provided this report to them, if they desire further information. The information in this report has been obtained or derived from sources believed by Wells Fargo Securities, LLC to be reliable, but Wells Fargo Securities, LLC does not represent that this information is accurate or complete. Any opinions or estimates contained in this report represent the judgment of Wells Fargo Securities, LLC at this time and are subject to change without notice. Wells Fargo Securities, LLC and its affiliates may from time to time provide advice with respect to, acquire, hold or sell a position in, the securities or instruments named or described in this report. Wells Fargo Securities, LLC is a separate legal entity and distinct from affiliated banks.
Copyright © 2012 Wells Fargo & CompanySECURITIES: NOT FDIC‐INSURED/NOT BANK‐GUARANTEED/MAY LOSE VALUE
45