INVESTMENT OPPORTUNITIES IN INDONESIA - ANIE
40
© 2013 by Indonesian Investment Coordinating Board. All rights reserved © 2013 by Indonesian Investment Coordinating Board. All rights reserved INVESTMENT OPPORTUNITIES IN INDONESIA Presented by: Deputy Chairman For Investment Planning Jakarta, May 2013
Transcript of INVESTMENT OPPORTUNITIES IN INDONESIA - ANIE

© 2013 by Indonesian Investment Coordinating Board. All rights reserved © 2013 by Indonesian Investment Coordinating Board. All rights reserved
INVESTMENT OPPORTUNITIES IN INDONESIA
Presented by: Deputy Chairman For Investment Planning
Jakarta, May 2013

Indonesia Investment Coordinating Board
Italy Investment in the World and Indonesia 2010-2012
In USD Million 2010 2011 2012
Italy Outward Investment Position To The World
489,646 520,582 567,000 (Forecast)
Italy Outward Investment Flow To The World
32,657 47,253 30,000 (Forecast)
Italy Investment Positions
1 Transportation, Storage, and Telecomunication (19,5 Million USD)
2 Mining (16 Million USD)
3 Food Industry (6.5 Million USD)
4 Metal, Machinery and Electronic Industry (6 Million USD)
5 Hotel and Restaurant (2.3 Million USD)
Italy Investment In Indonesia Based On Sector 2010 - 2012
Sources: OECD & BKPM, 2013 (Processed by BKPM)
Indonesia Investment Coordinating Board
Investment Opportunities in Value Added:Mining Based Industry

Indonesia Investment Coordinating Board
NO COMMODITY RESOURCES PRODUCTION LOCATIONWORLD RANK
(PRODUCTION)
1 Coal 105,187 Million Ton 275 MT (2010) Sumatera, Kalimantan 6th
2 Natural Gas 153 Trillion Square Cubic Feet 3.40 TSCF (2010) Sumatera, Kalimantan, Maluku, Papua
12th
3 Oil 7732 Million Stock Tank Barrel 344 MSTB (2010) Sumatera, Java, Kalimantan 23th
4 Geothermal 29,038 GWe 1,226 MWe(2010) Sumatera, Java, Sulawesi, Maluku
3th
5 Tin (Metal) 623 Thousand metric tons 105 thousand metric tons (2009) Sumatera 2nd
6 Copper (Metal) 68,960 Thousand metric tons 868 thousand metric tons (2009) Papua, Maluku, Nusa Tenggara
5th
7 Nickel 1,650,418 thousand metric tons 189 thousand metric tons (2009) Sulawesi, Sumatera, Maluku, Papua
2nd
8 Gold (Metal) 4,163 metric tons 105 metric tons (2009) Kalimantan, Sumatera, Maluku, Papua
7th
9 Silver (Metal) 505,151 metric tons 215 metric tons (2009) Sumatera, Sulawesi, Nusa Tenggara, Papua
14th
10 Bauxite (Metal) 470 million tons 16 million tons (2009) Kalimantan 5th
11 Iron Sands (Concentrate)
267,337 thousand tons 63 thousand metric tons (2009) Sumatera, Java, Kalimantan 37th
12 Manganese (Metal) 866,795 tons -- Java, Kalimantan, East Nusa Tenggara
--
13 Diamonds 539,800 carat -- Kalimantan --
14 Granite (Non metal) 54,731 million tons -- Kep Riau (Sumatera) --
Source: BKPM, ESDM, US Geological Survey, 2010
Indonesia Natural Resources: Mineral And Energy Sectors

Indonesia Investment Coordinating Board
1. Investment Opportunities in Value Added: Mining Based Industry
1. PURIFICATION AND PETROLEUM REFINING INDUSTRY (petrochemical industry);
2. CHEMICAL INDUSTRY (including the fertilizer industry, cement, and ceramic);
3. PRIMARY METAL INDUSTRIES (steel, nickel processing industry, aluminum industryand copper processing industry);
Sources: London Metal Exchange/LME, 2011 (Processed)

Indonesia Investment Coordinating Board
Investment Opportunities: Mineral Sector
Mining Investment Climate in IndonesiaSurvey Result
Source: Fraser Institute and Metal Economics Group
No Status Company
1 Processing & Refining Existing 7
2Processing & Refining Proposal Before Ministry of Energy and Mineral Resources (MEMR) Regulation No 7 Year 2012
24
3Processing & Refining Proposal After MEMR Regulation No 7 Year 2012
186
Total 217
Timeline Of Mineral Processing And Refining MARKET OUTLOOK: CAUTIOUS
INVESTMENT OPPORTUNITIES: Smelter Industry(Processing and Refining)
Recapitulation of Processing & Refining Plan Document (Update December 2012)
Source: Ministry of Energy (2012)

Indonesia Investment Coordinating Board
Investment Opportunities: Coal Industry
Source: Ministry of Energy and Mineral Resources, 2012
2011 MARKET LEADERS
(MIO TONS)
MARKET OUTLOOK: CAUTIOUSIndonesian coal production will be flat in 2013 as thedownturn in the market continued. The slowdown in China'seconomic growth is cutting deeper into Indonesia's coalsector, forcing producers to reduce output and slash costs.
INVESTMENT OPPORTUNITIES:1. Coal Infrastructure: Coal Hauling network , railways ,
stockpile & Seaport, Coal Blending facility
2. Mine mouth power plant development
3. Coal processing plant development: coal upgrading andconversion
REALIZATION PLANNINGDEMAND VSSUPPLY

Indonesia Investment Coordinating Board
Investment Opportunities in Value Added: Agro Based Industry

Indonesia Investment Coordinating BoardSource: BKPM, ESDM, US Geological Survey, 2010
NO COMMODITYWORLD RANK(RESOURCES)
1 Kapok fiber 1
2 Cinnamon (Canella) 1
3 Bebih Cotton In The Shell 1
4 Palm Kernels 1
5 Coconut 1
6 Vanilla 1
7 Palm Oil 1
8 Spring Onions 1
9 Clove 1
10 Pepper (Piper Spp.) 2
11 Green Beans 2
12 Nuts 2
13 Cocoa Beans 2
14 Natural Rubber 2
15 Ginger 3
16 Papaya 3
17 Cassava 3
18 Sugar crops (sugar crops) 3
19 Rice, Rice 3
20 Roots and tubers, nes 3
21 Other bird eggs, in shell 3
22 corn 4
23 Fresh tropical fruits 4
24 Manila Fibre (Abaca) 4
25 Peppers and green peppers 4
Indonesia Natural Resources: Agriculture Sectors
NO COMMODITYWORLD RANK(RESOURCES)
26 avocado 4
27 Mango, Guava, mangosteens, 4
28 sweet potatoes 4
29 green coffee 4
30 pineapple 4
31 spinach 5
32 Nutmeg, mace and cardamoms 5
33 Fresh fruits 5
34 areca nut 5
35 banana 6
36 eggplant 6
37 Cabbage and other brassicas 6
38 cashew nuts 6
39 Tobacco, unmanufactured 6
40 tea 7
41 Native chicken 7
42 peanuts 8
43 green corn 8
44 chicken eggs 8
45 Goat Meat 9
46 orange 10
47 soybean 10
48 cane 10
49 Cucumbers and gherkins 10
50 other fibers 10

Indonesia Investment Coordinating Board
1. Investment Opportunities in Value Added: Agro Based Industry
1. PALM OIL INDUSTRY;
2. COCOA PROCESSING INDUSTRY AND CHOCOLATE MAKING;
3. RUBBER GOODS INDUSTRY;
4. PULP/PAPER INDUSTRY;
5. WOOD WORKING, FURNITURE INDUSTRY, AND RATTAN
6. SEAWEED PROCESSING INDUSTRY
Sources: London Metal Exchange/LME, 2011 (Processed)

Indonesia Investment Coordinating Board
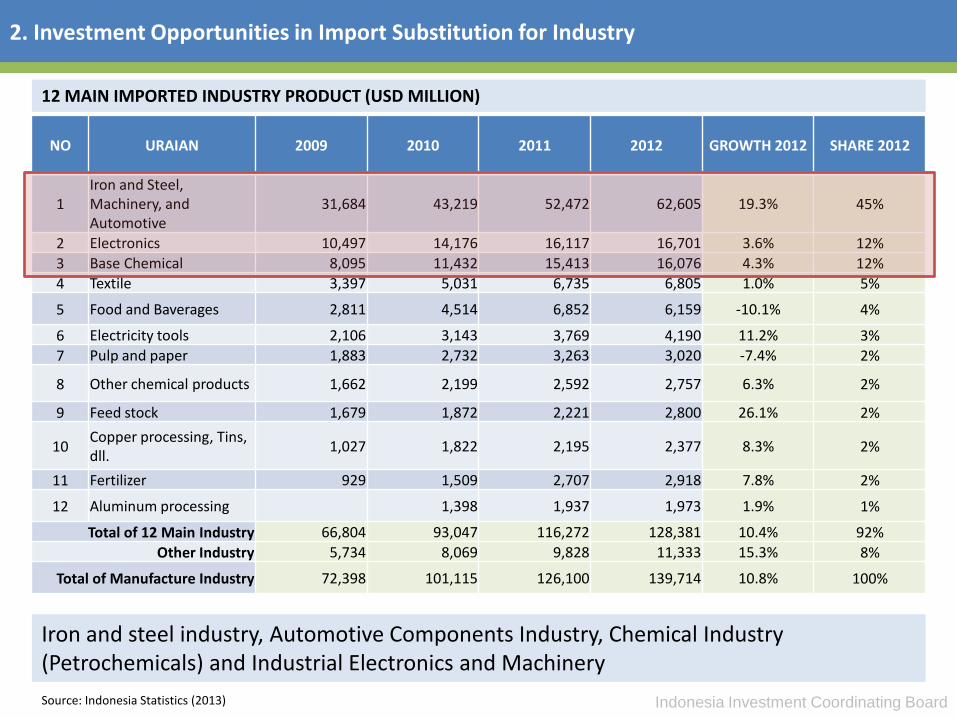
Investment Opportunities in Import Substitution for Industry
Indonesia Investment Coordinating Board
2. Investment Opportunities in Import Substitution for Industry
NO URAIAN 2009 2010 2011 2012 GROWTH 2012 SHARE 2012
1Iron and Steel, Machinery, and Automotive
31,684 43,219 52,472 62,605 19.3% 45%
2 Electronics 10,497 14,176 16,117 16,701 3.6% 12%
3 Base Chemical 8,095 11,432 15,413 16,076 4.3% 12%
4 Textile 3,397 5,031 6,735 6,805 1.0% 5%
5 Food and Baverages 2,811 4,514 6,852 6,159 -10.1% 4%
6 Electricity tools 2,106 3,143 3,769 4,190 11.2% 3%
7 Pulp and paper 1,883 2,732 3,263 3,020 -7.4% 2%
8 Other chemical products 1,662 2,199 2,592 2,757 6.3% 2%
9 Feed stock 1,679 1,872 2,221 2,800 26.1% 2%
10Copper processing, Tins,dll.
1,027 1,822 2,195 2,377 8.3% 2%
11 Fertilizer 929 1,509 2,707 2,918 7.8% 2%
12 Aluminum processing 1,398 1,937 1,973 1.9% 1%
Total of 12 Main Industry 66,804 93,047 116,272 128,381 10.4% 92%
Other Industry 5,734 8,069 9,828 11,333 15.3% 8%
Total of Manufacture Industry 72,398 101,115 126,100 139,714 10.8% 100%
12 MAIN IMPORTED INDUSTRY PRODUCT (USD MILLION)
Iron and steel industry, Automotive Components Industry, Chemical Industry (Petrochemicals) and Industrial Electronics and Machinery
Source: Indonesia Statistics (2013)

Indonesia Investment Coordinating Board
Investment Opportunities: Petrochemical Industry
INDONESIA PETROCHEMICAL INDUSTRY (EXISTING CONDITION)
MARKET OUTLOOK: PROSPECTIVE
INVESTMENT OPPORTUNITIES: Indonesia is stillsuffering an insufficient supply of petrochemicalproducts (net importers)
SUPPLY VS DEMAND (YEAR 2011)PETROCHEMICAL CLUSTER
1. Anyer, Merak, Cilegon, SerangAnd Bojanegara – BantenProvince (Olefin Center)
2. Gresik, Lamongan, Tuban Dan Cepu – East Java (Aromatic Center)
3. Bontang Dan Balikpapan, East Kalimantan (Methane Center)
4. Balongan – West Java
5. Cilacap – Central Java
INDONESIA PETROCHEMICAL INDUSTRY STRUCTURE
we are now encouraging investment on “missing middle” on petrochemical industriesSource: Ministry of Industry (2012)

Indonesia Investment Coordinating Board
Investment Opportunities: Steel Industry
Country Kg/Capita/Year
INDONESIA 37.3
Malaysia 315.8
Thailand 211
Vietnam 139.8
Singapore 570.1
Japan 500.9
Korea 1,077.2
China 427.4
India 54.9
United States 267.3
Asia 255.8
European Union 299.1
World 206.2
STEEL CONSUMPTION
MARKET OUTLOOK: STABLE Until now, the domestic steel market is still in deficit. There is over demand
both in the upstream, intermediate and downstream.
National steel demand to reach 10 million tons per year. While the national steel products reached 5.5 million tons. The rest, amounting to 4.5 million tonnes, supported by imports.
Electricity and gas supply constraints are an obstacle for the production of the national steel industry.
West Sumatera
East JavaBanten
South Kalimantan
Potential Locations
: Industry already exist
: Industry not exist
INVESTMENT OPPORTUNITIES: INDONESIA STEEL INDUSTRY STRUCTURE
we encourage investment on “missing middle” on petrochemical industries
Source: Ministry of Industry (2012)
Indonesia Investment Coordinating Board
Investment Opportunities on Import Substitution for Consumption

Indonesia Investment Coordinating Board
3. Investment Opportunities on Import Substitution for Consumption
1. Agriculture (fruits, rice, vegetables)
2. Food and Beverage Industry (processed foods)
3. Household Appliances Industry
4. Automotive industry
5. Industrial Oil Refinery (oil, lubricants)
SECTOR (MILLION USD) VALUE SHARE
1Food and beverages, primary, mainly for household
2,837 21%
2
Food and beverages, processed, mainly for household
1,954 15%
3 Passenger motor cars 1,927 14%
4Transport equipment, nonindustrial
1,585 12%
5 Durable consumer goods 1,541 11%
6 Semi-durable consumer goods 1,515 11%
7 Non-durable consumer goods 1,435 11%
8Fuels and lubricants, processed, oil products 1) 350 3%
9 Goods not elsewhere specified 264 2%
BARANG KONSUMSI 13,409 100%
IMPORTED CONSUMPTION GOODS 2012
Source: Indonesia Statistics (2013)

Indonesia Investment Coordinating Board
4. Indonesia high growth spending on consumption
MONTHLY SPENDING PER CAPITA BY COMMODITY GROUP(RP), 2010-2012
1. Agriculture Industry
2. Food and beverages Industry
3. Cement industry
4. Building materials industry
Source: Indonesia Statistics (2013)
“Increase on high quality imported consumption goods due to increasing
on income percapita”

Indonesia Investment Coordinating Board
Investment Opportunities on High Growth Domestic Demand Industry

Indonesia Investment Coordinating Board
Investment Opportunities: Cement Industry
CEMENT CAPACITY COULD ALMOST DOUBLE IN THE NEXT 5 YEARS
DOMESTIC MARKET CONSUMPTION (2011)
Retail (residential) sector is the largest consumer of cement in Indonesia
MARKET OUTLOOK: PROSPECTIVE
Key Drivers of Domestic cement demand:
1. National Economic Growth
2. Favorable Interest Rate Environment
3. Infrastructure Expansion
4. Per Capita Consumption increase from current lowlevels (kg/capita) Indonesia (199); China (1.900);Singapore (900); Malaysia (700); Vietnam (500);Thailand (400)
Source: Semen Indonesia (2012)

Indonesia Investment Coordinating Board
BUILDING MATERIALS/EQUIPMENT MARKET VALUE [USD MILLION]
The market will grow at around 10% a year over the next five years, with imports continuing to account for a large share
MARKET OUTLOOK: PROSPECTIVE
the total value of equipment sales in Indonesia reached USD4.2billion in 2012. This market data includes building constructionequipment, earthmoving and tunnelling equipment, road buildingequipment, construction materials manufacturing equipment, andmining equipment.
The compound annual growth rate (CAGR) 2008-2012: over 10% ,with sales rebounding quickly from the slump in 2009.
In the next five years, sales growth will continue to expand at anannual average rate around 10%.
The outlook for the overall market will be heavily dependent onthe government’s success in driving through its ambitiousinfrastructure development plans. It will also depend to a greatextention the mining sector’s performance.
CONSTRUCTION MACRO RISK MODEL FOR EMERGING MARKETSConstruction “Macro Risk” Is Low In Indonesia
Investment Opportunities: Other Building Materials
Source: World Market Intelligence (2013)

Indonesia Investment Coordinating Board
Investment Opportunities: Tire Industry
Domestic Motorcycle Sales (Thousand units)
Domestic Car Sales (Thousand units)
2010 2011 2012
Production 49,855 51,812 49,859
Domestic sales -Replacement
10,467 11,107 11,923
Domestic sales -Original Equipment
3,983 4,344 5,519
Export 35,117 35,882 32,117
INDONESIA TIRE MARKET (THOUSAND)
Source: GAIKINDO and AISI (2013)
MARKET OUTLOOK: PROSPECTIVE

Indonesia Investment Coordinating Board
Investment Opportunities on Export Oriented Industry

Indonesia Investment Coordinating Board
5. Investment Opportinities in Export Oriented Industry: 10 Main Commodity
“Indonesia as Production Hub For International Market”
NO10 MAIN
COMMODITYDESTINATION COUNTRY
DEPENDENCY OFIMPORTED RAW MATERALS
1TEXTILE AND TEXTILE PRODUCT
United States, Japan, Germany, Turkey, Korea, MEDIUM
2 ELECTRONIC Singapore, United States, Japan, Hong Kong, China, HIGH
3 RUBBER United States, Japan, China, Korea, Singapore, LOW
4 PALM OIL India, China, Malaysia, Bangladesh, Netherlands, LOW
5FOREST PRODUCTS
Japan, China, United States, Korea, Australia, LOW
6 FOOTWEAR United States, Belgium, Germany, United Kingdom, Netherlands, MEDIUM
7 AUTOMOTIVE Thailand, Japan, Saudi Arabia, Philippines, Malaysia, HIGH
8 SHRIMPS United States, Japan, China, United Kingdom, Belgium, LOW
9 COCOA Malaysia, United States, Singapore, China, Spain, LOW
10 COFFEE United States, Japan, Germany, Italy, Malaysia, LOW
“Indonesia as Production Hub For International Market”
Source: Ministry of Trade (2012)

Indonesia Investment Coordinating Board
Investment Opportunities: Textile and Clothing Industry
Potential Location: Focus on Java Island MARKET OUTLOOK: PROSPECTIVE
INVESTMENT OPPORTUNITIES
Indonesia has great potential in developing products garments, yarn,textile products as well as other man-made fibers.
a. Garment products: male and female clothes, jackets, underwearand wedding dress.
b. For yarn products: sewing thread, yarn for knitting fabric and yarn.
c. other textile products: rugs, tablecloths, net curtains, towels,socks, embroidery, and curtains.
Indonesia position in World Main Markets are (US: 5th); (UK: 13th);(Germany: 12th); (Japan: 5th); (Korea: 4th)
Source: Ministry of Industry and Textile Association (2012)

Indonesia Investment Coordinating Board
Investment Opportunities: Rubber Industry
WORLD RUBBER CONDITION
Consumption is higher than production
The world market is dominated by 6 countries are: Thailand, Indonesia, Malaysia, India, China, and Vietnam.
The largest rubber consumer in the world are: China, United States, and Europe.
INDONESIA RUBBER CONDITION
Indonesia is the largest area of rubber in the world.
From the production side, Indonesia is the No. 2 as a major producer of rubber in the world 24% of market share) under Thailand (33%)
Sumatra is the largest producer of raw rubber in Indonesia: 65% share of the national rubber production.
Based on BPS data (2011) the largest plantation area (top 3) are:
1. South Sumatra: 665 thousand ha
2. North Sumatra: 463 thousand ha
3. Jambi: 443 thousand ha.
Potential areas for rubber plantation: Sumatra dan Kalimantan.
MARKET OUTLOOK: PROSPECTIVE
INVESTMENT OPPORTUNITIES: DOWNSTREAM INDUSTRY
1. Manufacture of motor vehicle tires
2. Latex industry
3. Rubber goods industry
4. Engineering goods for industrial and automotive
Indonesia Rubber Production And Consumption (Source: IRSG 2011)
Source: Ministry of Agriculture(2012)

Indonesia Investment Coordinating Board
Investment Opportunities: Palm Oil
Production and Consumption of Palm Oil World
Production Consumption
MARKET OUTLOOK: PROSPECTIVE
Indonesia is the largest producer and exporter of palm oil / CPO inthe world previously dominated by Malaysia.
INVESTMENT OPPORTUNITIES: PALM OIL INDUSTRY
1. Primary Industries: Crude Palm Oil (CPO), Palm Nucleus Oil (PKO), shell, fiber, empty fruit bunches, and sludge
2. Upstream Industry: carotene, tocoperol, oil cake, soap stock
3. Manufacture of: pro-vitamin A, pro-vitamin E, cocoa butter
4. Downstream Industry: bio diesel oil.
POTENTIAL LOCATION FOR PALM OIL INDUSTRY:
Sei Mangkei in North Sumatera, Dumai in Riau Province , and Maloy in East Kalimantan.
0.00
500.00
1000.00
1500.00
2000.00
19
96
19
97
19
98
19
99
20
00
20
01
20
02
20
03
20
04
20
05
20
06
20
07
20
08
20
09
20
10
20
11
Pri
ce($
)
Tahun
Crude oil ($/bbl) CPO ($/MT) PKO ($/MT)
Price World of Crude Oil, Crude Palm Oil, and Palm Kernel Oil
Source: Ministry of Agriculture(2012)

Indonesia Investment Coordinating Board
Investment Opportunities: Cocoa Industry
MARKET OUTLOOK: PROSPECTIVE Total area of Indonesia cocoa increased
sharply to reach 1,677,254 ha in 2011.This condition is expected to continue toincrease to 1,805,986 ha in 2014.
In 2011, Indonesian cocoa productionamounted to 712,231 tons.
Potential Locations :1. Sulawesi (South Sulawesi, Southeast
Sulawesi, Central Sulawesi and WestSulawesi)
2. Other provinces (North Sumatra,West Sumatra, Aceh and East Java)
INVESTMENT OPPORTUNITIES: PROCESSING INDUSTRY
Indonesia's cacaoagribusiness developmentgeared to increase value-added cocoa withintegrated agribusinessdevelopment fromupstream to downstream.
Source: Ministry of Agriculture(2012)
Indonesia Investment Coordinating Board
Investment Opportunities on PPP Infrastructure projects

Indonesia Investment Coordinating Board
6. Investment Opportunities in PPP Infrastructure Projects: 24 Proposed Projects
NO. PROJECTSINVESTMENT
(US$ MILLION)PROJECT STATUS (2012)
1. Cisumdawu Toll Road 1.015,8 FS is finished, Land procurement progress of 23%
2. Pandaan – Malang Toll Road 420 Land procurement progress of 10%
3. Kertajati International Airport 130 Pre FS, Masterplan dan Business plan are finished, Coordinate permit has been approved, Land procurement 2012 : 715 Ha, target until 2014 : 1800 ha
4. KulonProgo International Airport 500Pre FS (location) is finished, but the project status has not decided by Ministry of Transportation
5.Expansion of Pelabuhan Tanjung Priok-Cilamaya, Karawang Barat
1.032Pre FS finished
6.Soekarno Hatta – Manggarai International Railway Development
2.000FS, Environmental Impact Assessment, and other permits are on progress
7.Integrated Terminal Gedebage Railway, Bandung
133FS is finished
8.Revatilation of Yogyakarta Rail Station danPedestrianisasi Malioboro
870FS is finished
9. Lamongan Regency Water Supply 16,67 - OBC is finished in 2012
- FBC in 2013
10. West Semarang Water Supply 78
- VGF is on discussion by Ministry of Finance
- Interested investors is from Singapore, Spain, China, Malaysia, South
Korea, and Japan.
- Project launching is on July - August 2013
11.Solid Waste Treatment & Final Disposal Putri Cempo, Solo
30
12.Solid Waste Treatment & Final Disposal Bandung Raya
80
- FS by JICA is finished
- JICA willing to fund for construction and waste management
technology
13.Solid Waste Treatment & Final Disposal Bogor - Depok
40- FS by JICA is finished
- Procurement document is already finished
TOTAL 6.345,5
A. KORIDOR JAWA
Source: Ministry of National Planning (2012)

Indonesia Investment Coordinating Board
6. Investment Opportunities in PPP Infrastructure Projects: 24 Proposed Projects
B.KORIDOR
SUMATERA
NO. PROJECTSINVESTMENT(US$ MILLION
PROJECT STATUS (2012)
1. Kuala Tanjung Port , North Sumatera -Pre FS is finished
2. Jambi Coal Fired Power Plant 1.040 -
3. Geothermal Bengkulu - Waiting the permit from Ministry of Energy
4. Batam Municipal Solid Waste 60 – 120
- Pre FS is finished
- Outline Business Case is finished
- Environmental Impact Assessment on
progress (will be finish in 6-8 mounth)
- Government guartantee is on evaluation by
PT. PII
- Interested investors are from France, United
States, and Japan.
TOTAL 1.160
D.KORIDOR SULAWESI
1. Balikpapan – Samarinda Toll Road 1.200
- FS is finished
- The construction permit for “roads on
Preservation Forest” is still on process at the
Ministry of Forestry
- NGOs problem
2. Development Maloy International Port 2.130 Pre FS is finished3. Greater Pontianak Water Supply 143 FS is finished
TOTAL 3.474
C.KORIDOR
KALIMANTAN
1. Manado – Bitung Toll Road 353 Land procurement progress of 25%
2. New Makasar Port - Pre FS is finished
3. Karama Hydro Power Plant 1.336 -4. Palu Municipal Water Supply 30 FS is finished
TOTAL 1.719Source: Ministry of National Planning (2012)

Indonesia Investment Coordinating Board
Investment Opportunities on Tourism and Creative Industry

Indonesia Investment Coordinating Board
7. Tourism and Creative Industry
Year
International VisitorAverage
Length Of Stay (Day)
Average Expenditure Per Person (USD)
Revenue
TotalGrowth
(%)Per Day Per Visit
Total (Million
USD)
Growth (%)
2007 5,505,759 13.02 9.02 107.7 970.98 5345.98 20.19
2008 6,234,497 13.24 8.58 137.38 1178.54 7347.6 37.44
2009 6,323,730 1.43 7.69 129.57 995.93 6297.99 -14.29
2010 7,002,944 10.74 8.04 135.1 1085.75 7603.45 20.73
2011 7,649,731 9.24 7.84 142.69 1118.26 8554.39 12.51
2012 8 044 462
MARKET OUTLOOK: PROSPECTIVE
INVESTMENT OPPORTUNITIES:
Seven Special Interest Tourism Areas
1. Cruise tourism
2. Meetings, Incentive, Convention,Exhibition/ Event
3. Nature based and ecotourism
4. Culture and historical based tourism
5. Shopping and culinary
6. Wellness and medical tourism
7. Recreational sports: golf, diving, etc
NUMBER OF PASSENGER CRUISE TOURISM
TARGET OF TOURISM VISITOR
2013Foreign: 9 millionDomestic: 250 million
2014Foreign: 10 millionDomestic: 255 million
Sources: Ministry of Tourism and Creative Economy , 2012

Indonesia Investment Coordinating Board
Distribution of 50 National Tourism Destination (DPN)
Sources: Ministry of Tourism and Creative Economy , 2012

Indonesia Investment Coordinating Board
16 National Tourism Priority Area 2012 – 2014
North Sumatera
Riau
West Sumatera
BintanBatam
Jakarta
West Java
Central Java
East Java
East Kalimantan
Southeast Sulawesi
South Sulawesi
Papua
West Papua
North Sulawesi
Middle Kalimantan
Bali
West Nusa Tenggara
East Nusa Tenggara
Danau Toba
Kepulauan Seribu
Kota Tua
Borobudur
Bromo-Tengger-Semeru
Kintamani-Danau Batur
Menjongan-Pemuteran
Kuta-Sanur-Nusa Dua
Gn.Rinjani
Komodo
Raja Ampat
Ende-D.kelimutu
Tj.Puting
Toraja
Bunaken
Wakatobi
Sources: Ministry of Tourism and Creative Economy , 2012
Indonesia Investment Coordinating Board
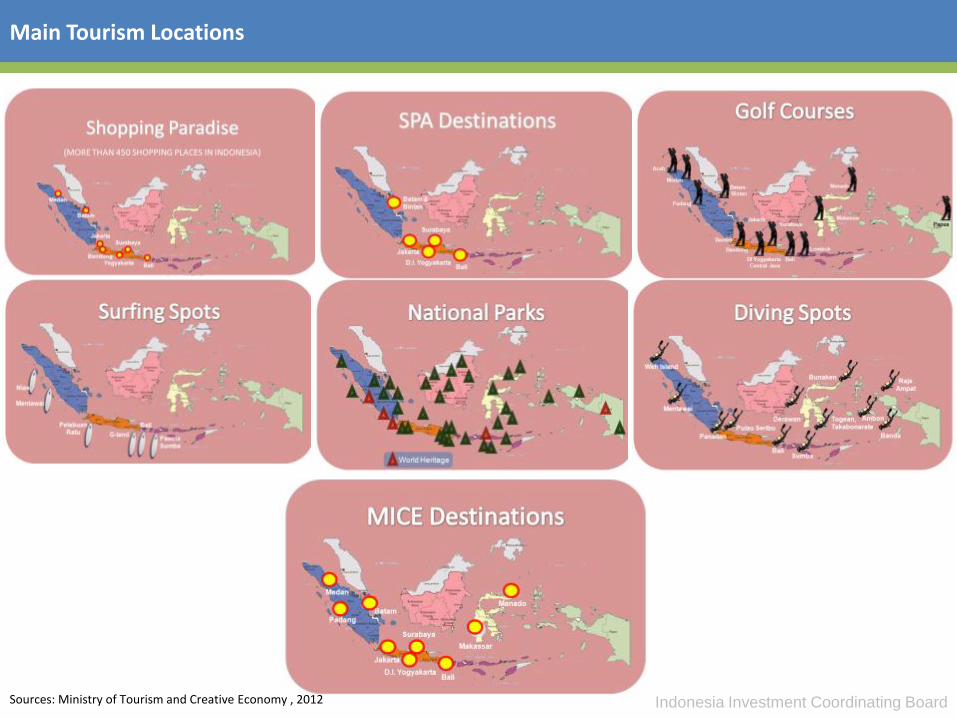
Main Tourism Locations
Sources: Ministry of Tourism and Creative Economy , 2012

Indonesia Investment Coordinating Board
7. Tourism and Creative Industry
ECONOMIC VALUE (USD BILLION) MARKET OUTLOOK: PROSPECTIVE
In Indonesia, the creative industries are defined as industryderived from the utilization of creativity, skills and individualtalents of individual to make create wealth and generateemployment by producing and exploiting individual creativity.
Creative industry accounted for 7.29 percent of Indonesia’s GDP. In2012, Indonesia’s creative industries have employed 11. 57 millionpeople, accounting for 10.63 percent to the nation's overallemployment ( rank 3 on employment absorption).
the creative industries have a bright export prospects in thefuture. In 2011, exports of creative industries to reach of USD 800million. Targeted in 2015 to exceed UUD 1.5 billion.
Majority export comes from fashion (60% of market share) andcrafts (36.5% market share)
*)Data until Aug 12
FILM PRODUCTION IN INDONESIA1992 – 2012
Sources: Ministry of Tourism & Economy creative industry, 2012

Indonesia Investment Coordinating Board
Investment Opportunities on Renewable Energy Sectors

Indonesia Investment Coordinating Board
NO RENEWABLE ENERGY POTENTIALINSTALL
CAPACITY (MW)UTILIZATION
1 Large Hydro (MW) 75,670 5,705.29 7.54%
2Small Hydro/Microhydro (MW)
769.69 217.89 28.31%
3 Geothermal (MW) 29,038 1,226 4.2%
4 Biomass (MW) 49,810 1,618.4 3.25%
5 Solar4.80
kWh/m2/day13.5 -
6 Wind 3 – 6 m/s 1.96 -
7 Ocean/Sea (MW) 43,000 - -
Indonesia Potential on Renewable Energy
Source: Ministry of Energy, 2012

Indonesia Investment Coordinating Board
Investment Opportunities: Geothermal Industry
Geothermal Project in Indonesia ( Installed Capacity) 2011Target Of National Energy Mix
MARKET OUTLOOK: PROSPECTIVE Geothermal power in Indonesia is an increasingly
significant source of renewable energy. Indonesia has 40%of the world's potential geothermal resources, estimatedat 29,000 GWe.
Currently Indonesia is the world's third largest geothermalelectricity producer after the United States and thePhilippines. Installed production capacity (2011) is almost1,226 MW from seven geothermal fields in Java, NorthSumatra and North Sulawesi.
In 2007, geothermal energy represented 1.9% of thecountry's total energy supply and 3.7% of its electricpower.
Indonesia plan to build 44 new geothermal plants by2014, more than tripling capacity to 4,000 MW. By 2025,Indonesia aims to produce more than 9,000 MW ofgeothermal power, becoming the world's leadinggeothermal energy producer. This would account for 5%of Indonesia's total energy needs.
Source: Ministry of Energy, 2012

THANK YOU
Invest in...
© 2013 by Indonesian Investment Coordinating Board. All rights reserved
CONTACT USBADAN KOORDINASI PENANAMAN MODAL (BKPM)Jl. Jend. Gatot Subroto No. 44, Jakarta 12190P.O. Box 3186, IndonesiaP : +62 21 5292 1334F : +62 21 5264 211E : [email protected]
Indonesia Investment Promotion Center (IIPC)