An Economic Analysis of Bangladesh's Foreign Exchange Reserves
Bank of Israel
Market Operations Department
Investment of the
Foreign Exchange
Reserves
Annual Report 2014
1
Contents
Main developments………………………………………………………………………2
A. The foreign exchange reserves……………………………………………………….4
1. The framework for holding and managing the reserves……………………………4
2. The risk profile of the reserves and investment policy guidelines…………...…….5
3. The risk management framework and strategic allocation…………………..……. 6
4. Changes in the level of the reserves in 2014…………………………………..…...8
5. The level of Israel’s foreign exchange reserves…………………………………..10
B. The global economic and financial environment……………………………………12
C. The holding period rate of return on the reserves in 2014…………………………..17
1. The rate of return on the reserves portfolio………………………………….……17
2. The active management contribution………………………………………….….19
2.a Contribution of the investment in equities………………………………..…..20
2.b Contribution of active management in numeraire currencies portfolios……..23
2.c Contribution of strategic exposures……………………………….………… 24
3. CVaR and risk - return measurement…………………………………….………28
Appendix 1: Glossary…………………………………………………….…………….31
Appendix 2: Foreign exchange reserves: investment policy guidelines………..………34
Appendix 3: Principles for determining the desired level of the foreign exchange
Reserves……………………………………………………………………….………. 40

2
Main developments1
Israel's foreign exchange reserves increased by about $4 billion in 2014,
compared with an increase of about $6 billion in the previous year, and at the end of
2014 they totaled $86.1 billion.2
In 2014, the Bank of Israel purchased $7 billion. Half the sum was purchased
within the framework of the Bank of Israel’s intervention intended to moderate
exchange rate volatility which is not in line with fundamental economic conditions in
Israel, and the other half was purchased within the framework of implementing the plan
to moderate the effect of natural gas production on the exchange rate. The change in the
reserves that is attributed to interest income, capital gains, and exchange rate
differentials between the dollar and the currencies in which the reserves are invested,
reduced the reserves by around $3 billion. This was mainly the result of the
strengthening of the dollar vis-à-vis the other currencies in which the reserves portfolio
is held.
At the beginning of the year, the investment policy guidelines for the foreign
exchange reserves were revised—the maximum permitted allocation to equities was
increased to 12 percent, from 6 percent, and investments in corporate bonds were
approved, to a maximum of 6 percent of the reserves. The guidelines were updated
following the definition of the reserves’ risk profile that was determined toward the end
of 2013. The risk profile then was defined so that given the worst 5 percent of possible
outcomes the average loss would not exceed 400 basis points, in a one-year horizon
(CVaR5%). During the course of the year, the CVaR5% of the reserves portfolio ranged
around 300 basis points.
Within the framework of the process of the strategic allocation of the reserves
portfolio for 2014, it was decided to allocate 8 percent to equities and the remainder to
bonds; to increase the portfolio’s duration from 10 months to 12 months; and to include
a corporate bond component in the reserves. Accordingly, toward the end of the year,
one percent of the reserves were invested in US corporate bonds as a pilot investment.
This year, the holding period rate of return on the reserves, in terms of the
numeraire3, was 1.28 percent, of which 0.22 percent was the benchmark return and 1.06
percent was the active management contribution. The active management contribution,
which was double the previous decade’s average, is attributed primarily to investment in
equities, which contributed 67 basis points. Investing the reserves in longer maturities,
1 The report on the investment of Israel's foreign exchange reserves has been published each year since
2000. Previous years’ reports are published on the Bank of Israel website at:
http://www.boi.org.il/en/Markets/ForeignExchangeReservesReport/Pages/Default.aspx 2 The level of the reserves includes allocations of Special Drawing Rights by the International Monetary
Fund to member countries (SDR Allocation) and Israel's balance in the Reserve Tranche of the Fund. At
the end of 2014 these totaled $1.8 billion. For more on this issue, see the Bank of Israel's Financial
Statements for 2014. 3 The numeraire is a currency basket in which the foreign exchange reserves are measured. For more
information, see Chapter A, Section 3 of this report.

3
while diversifying assets across the curve differently than in the benchmark, contributed
about 35 basis points to the active management return. This was due to a decline in
yields in countries whose currencies are included in the numeraire, which generated
capital gains.
In continuation of the process, which began in 2013, of reducing the exposure of
the reserves to currencies and assets of commodity-oriented economies, the share of
strategic exposures in the reserves portfolio in 2014 remained low, similar to that at the
end of 2013.
4
A. The foreign exchange reserves
1. The framework for holding and managing the reserves
According to the Bank of Israel Law, 5770–2010, one of the Bank's functions is to
hold and manage the country's foreign exchange reserves.4
In accordance with this law, the Monetary Committee, headed by the Governor, was
granted the authority, among others, to manage the reserves. The Monetary
Committee’s role is to establish the guidelines for the investment of the reserves, in
consultation with the Minister of Finance, and to monitor the implementation of such
policy. The Committee approves and revises the allocation of responsibilities for the
investment of the reserves between it on the one hand and the Foreign Currency
Committee5 and the Market Operations Department on the other. In addition, the
Monetary Committee, with the approval of the Minister of Finance, has the power to
change the guidelines according to which the Governor decides on the appropriate long-
term level of foreign exchange reserves.
Countries hold foreign exchange reserves for three main purposes:
To provide the economy with sufficient foreign currency for an emergency situation
(such as war or natural disaster). In such instances, it may be necessary to maintain
imports or to rapidly increase them in order to deal with the emergency, while
exports are liable to be negatively impacted, thus reducing the inflow of foreign
currency. In these circumstances, the government and the private sector will find it
difficult to raise foreign currency abroad, and the foreign exchange reserves will
become the country’s main source for financing in foreign currency.
To enable the central bank to intervene in the foreign currency market in the
following circumstances: (1) the foreign exchange rate has deviated from the range
that is consistent with the economy’s fundamental equilibrium; or (2) the foreign
currency market is not functioning properly (market failure).
To allow the central bank to operate in the foreign currency market in order to
moderate the effect of significant capital flows of either foreign or local residents,
which are liable to undermine the stability of the financial markets, thereby
negatively impacting the stability of the economy as a whole (a specific case of the
previous function).
In order to achieve these goals, the investment of the reserves is carried out according to
the following three basic principles: Maintaining the purchasing power of the
reserves, managing the reserves at a high level of liquidity and achieving a
suitable holding-period rate of return on the reserves portfolio, as long as this
does not interfere with achieving the previous objectives (as discussed in Appendix
2—Foreign Exchange Reserves: Investment Policy Guidelines).
4 Until the Bank of Israel Law, 5770–2010 came into force, on June 1, 2010, the reserves were managed
in accordance with the Bank of Israel Law, 5714–1954 and its legal interpretations over the years, and in
accordance with the investment policy decided on by the Governor. 5 The Foreign Currency Committee is an internal committee of the Bank, headed by the Governor. Its
function is to translate the guidelines for investing the reserves into detailed instructions for their
management.

5
2. The risk profile of the reserves and investment policy guidelines
The reserves portfolio is managed within a framework of investment rules. These rules
were set in order to achieve the investment policy objectives, while controlling the
exposure of the reserves to various financial risks—currency risk, price risk,6 credit risk
and liquidity risk. In principle, the rules are conservative and express cautious
management of the reserves. The reserves’ investment policy makers are aware of
developments in the markets and changes in the level of the reserves, and make changes
and revisions in the rules and the characteristics of investment when necessary.
Toward the end of 2013, the Monetary Committee completed the process of adjusting
the risk profile of the reserves to their current level and the integration of the foreign
currency purchases in the framework of the natural gas program, whose investment
horizon is long-term. The risk profile was defined in terms of the maximum loss that the
Committee is willing to accept, without affecting the attainment of the objectives for
which the reserves are kept. Accordingly, the risk profile was determined so that given
the worst 5 percent of possible outcomes the average loss would not be greater than 400
basis points over a one-year horizon (CvaR5%).7 Nevertheless, the Committee
determined that the strategic allocation would be limited to a maximum CVaR of 300
basis points. This is consistent with the Committee’s risk appetite and the desire not to
utilize the entire risk budget so as to leave some risk margin for the active management
of the reserves portfolio and to make any possible necessary changes in the CVaR due
to volatility of the markets.
The guidelines for the investment policy were revised at the beginning of 2014
according to the risk profile defined.8 Two changes stand out in particular: the
maximum permitted allocation for investment in equities was increased from 6 percent
to 12 percent of the reserves, and for the first time investment in corporate bonds was
approved, up to a maximum of 6 percent of the reserves.9
6 The price risk for bonds is the interest rate risk measured in terms of modified duration.
7 CvaR5% is the average of the 5 percent percentile of the distribution of the expected returns of the
reserves portfolio. 8 See Appendix 2 for the revised guidelines.
9 The utilization rate for the permitted allocation in each type of assets for foreign exchange reserves
investment is subject to compliance with the defined risk profile.

6
3. The risk management framework and strategic allocation
Like other investors around the world, management of the various financial risks in the
Bank of Israel’s foreign exchange reserves portfolio is based on management of the
reserves portfolio vis-a-vis a benchmark. A benchmark is a hypothetical portfolio
composed of various investable assets and formulated according to known and fixed
rules. The benchmark represents the portfolio holder’s preferences and risk profile,
which are reflected in its composition and in its characteristics. The benchmark provides
a yardstick for measuring performance of the portfolio manager’s investment decisions.
The numeraire is a basket of currencies whose composition reflects the possible uses of
the reserves, when necessary, and the principles that reflect the goals of holding those
reserves. The holding period rate of return on foreign exchange reserves is measured in
terms of the numeraire, and from the point of view of the reserves portfolio manager, its
composition is considered to be a neutral composition. The composition of the
numeraire is reviewed at least once a year and revised when necessary with the approval
of the Monetary Committee. The numeraire is defined quantitatively (a quantity-based
currency basket) so that its composition varies daily in line with changes in the
exchange rates of its composite currencies. The numeraire consists of three currencies,
whose weights were distributed over the year, on average, as follows:10
dollar—63.8
percent, euro—33.2 percent, and pound sterling—3.0 percent.
The numeraire benchmark (“the benchmark”) represents a conservative composition
of investable assets, which meets the first two goals of the investment policy for the
reserves—maintaining their purchasing power and managing the reserves with a high
level of liquidity. The benchmark is therefore invested in highly rated, short-term
government bonds of selected countries whose currencies are included in the numeraire,
and they provide a high degree of security and liquidity. The currency composition of
the benchmark and the numeraire are identical, so that the benchmark has no currency
exposure.
In the past, prior to March 2014, the benchmark represented the risk profile consistent
with the portfolio holder’s risk appetite. In March 2014, it was decided that the
benchmark composition would represent an investable portfolio with minimum risk,
high levels of security and liquidity. The duration of the portfolio was therefore
reduced, 11
and set at six months, instead of the previous ten months.12
Notably, the change in the benchmark lowers its expected return due to its minimal risk
level, and reduces its volatility. Therefore, the result obtained by comparing the
portfolio performance to the benchmark performance may differ from the result of
comparing the portfolio performance to the performance of the benchmark which the
portfolio was measured against in the years preceding the change.
10
In November 2013, as part of a periodic assessment, the parameters that form the basis for
determining the numeraire’s distribution were reviewed. The Monetary Committee decided not to
change the numeraire’s currency composition, and to leave its distribution as it was previously: 63
percent—dollar, 34 percent—euro, and 3 percent— pound sterling. 11
Throughout this document, duration refers to duration of the portfolio excluding the equity
component. 12
Until March 2014, the duration of the portfolios that make up the benchmark was 9, 10, and 16
months for the dollar, euro and pound sterling portfolios, respectively. Since March 2014, each of
these portfolios has a duration of 6 months.
7
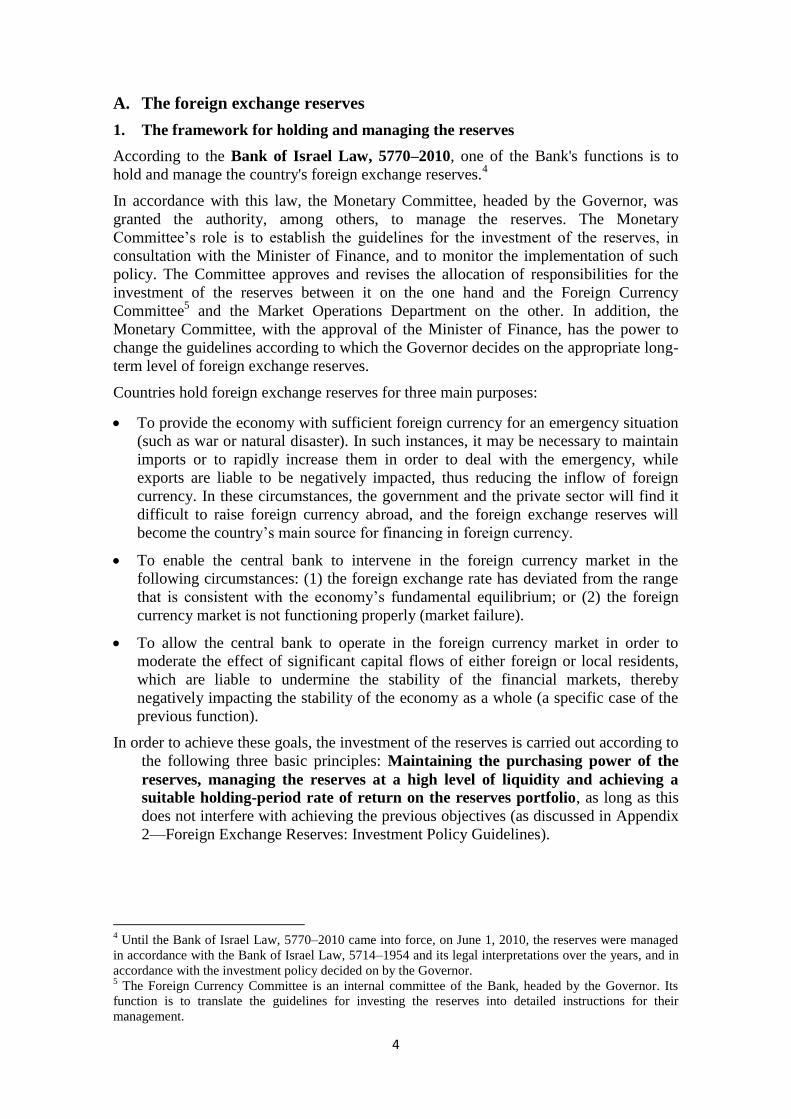
At the beginning of 2014, a process of strategic allocation of the reserves portfolio was
conducted. The various characteristics of this allocation were determined by the
Monetary Committee in an effort to attain a suitable return, subject to the risk profile
defined by the Committee, while meeting the first two goals of the reserves portfolio
holding policy. The allocation takes place as necessary, in line with market
developments and at least once a year.
As part of the strategic allocation, the strategic composition of the reserves portfolio
was determined so that the expected return on the portfolio is high within the
framework of the desired risk level and the guidelines’ limitations. This, given the
forecasts for the returns on the different assets included in the allocation.
The Monetary Committee approved the following strategic allocation for 2014:
8 percent will be invested in equities.
92 percent will be invested in fixed income.
The portfolio duration was increased so as to increase the expected return. In
2014 the duration of the reserves portfolio was 12 months13
compared to 10
months in 2013.
During the strategic allocation process, it was decided that corporate bonds would
comprise 2 to 6 percent of the portfolio, in accordance with market conditions and the
expected spread levels. Therefore, toward the end of 2014, the Bank of Israel began to
invest in US corporate bonds with a rating of BBB- and above, subject to the guidelines
according to which the maximum permitted investment in this type of bonds is up to 6
percent of the portfolio. As this is a new component in the reserves portfolio, an initial
pilot investment in corporate bonds of 1 percent of the reserves was made—half of
which is managed internally and half of which is managed through an external manager
specializing in the management of investments in this channel. Although corporate bond
spreads have declined in recent years, reducing the attractiveness of this investment
channel relative to the past, the expectation of an excess return compared with Treasury
notes supports the inclusion of corporate bonds in the portfolio.
13
Average duration over the course of the year.
8
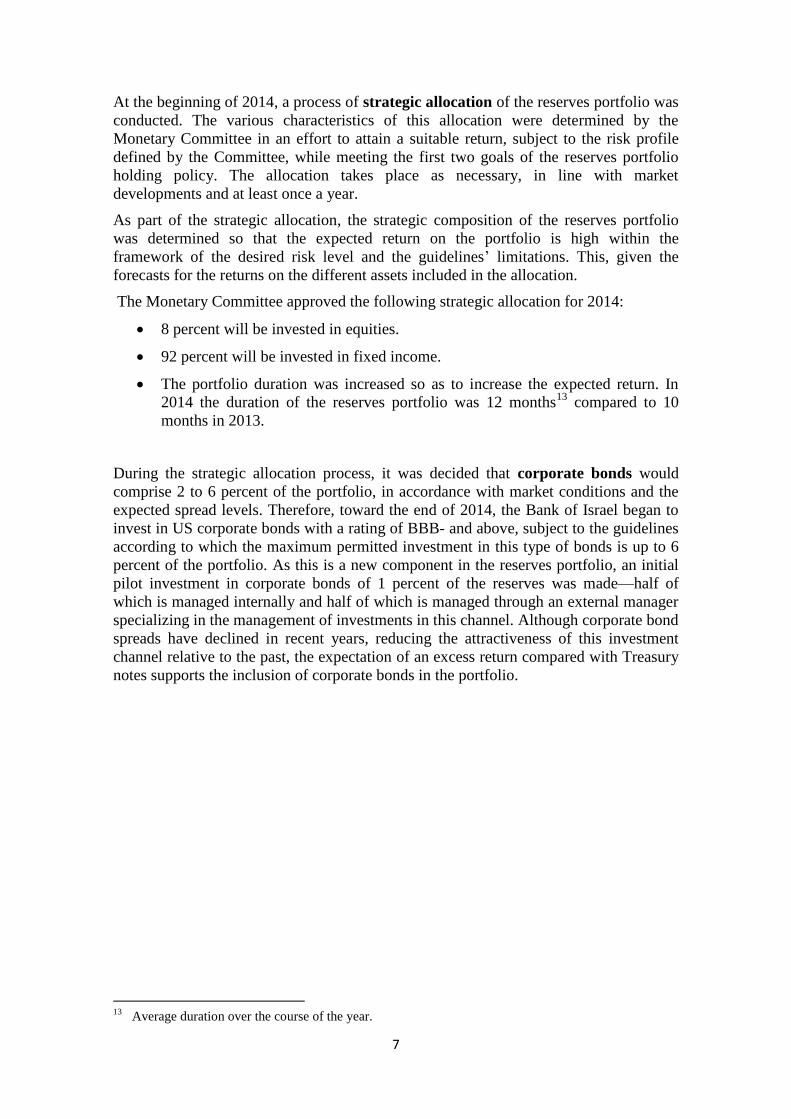
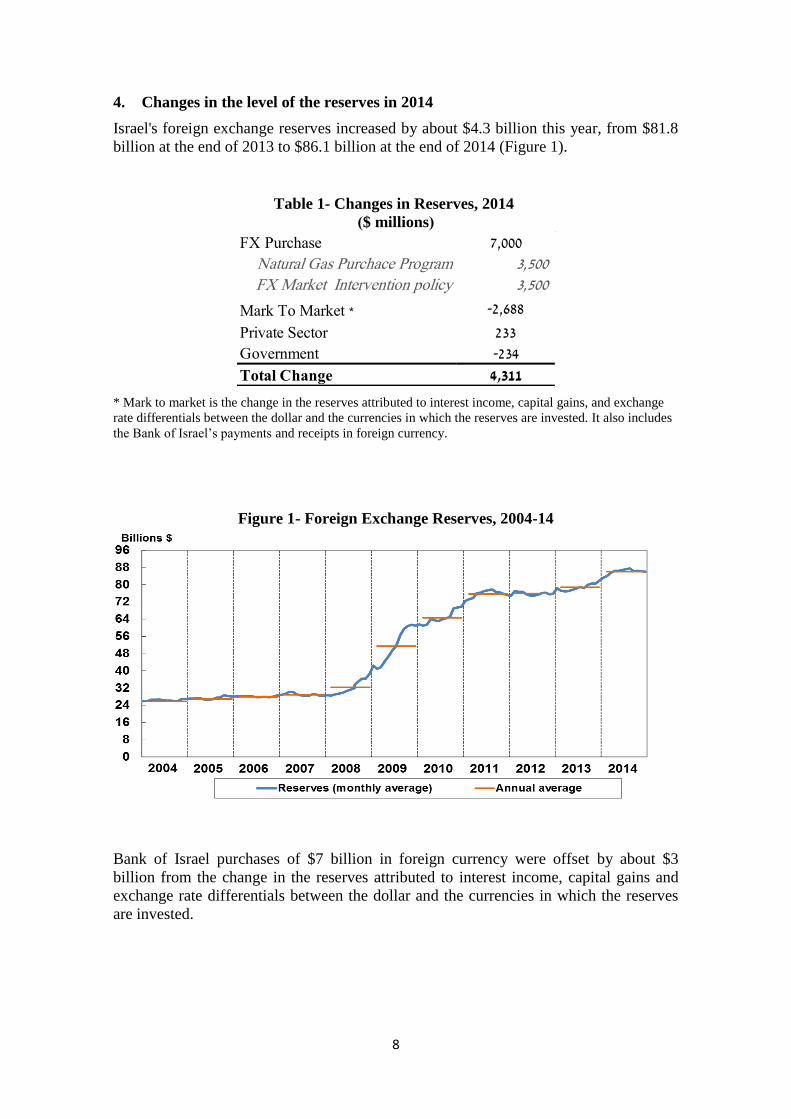
4. Changes in the level of the reserves in 2014
Israel's foreign exchange reserves increased by about $4.3 billion this year, from $81.8
billion at the end of 2013 to $86.1 billion at the end of 2014 (Figure 1).
Table 1- Changes in Reserves, 2014
)$ millions(
* Mark to market is the change in the reserves attributed to interest income, capital gains, and exchange
rate differentials between the dollar and the currencies in which the reserves are invested. It also includes
the Bank of Israel’s payments and receipts in foreign currency.
Figure 1- Foreign Exchange Reserves, 2004-14
Bank of Israel purchases of $7 billion in foreign currency were offset by about $3
billion from the change in the reserves attributed to interest income, capital gains and
exchange rate differentials between the dollar and the currencies in which the reserves
are invested.
FX Purchase 7,000
Natural Gas Purchace Program 3,500 FX Market Intervention policy 3,500
Mark To Market * -2,688
Private Sector 233
Government -234
Total Change 4,311
9
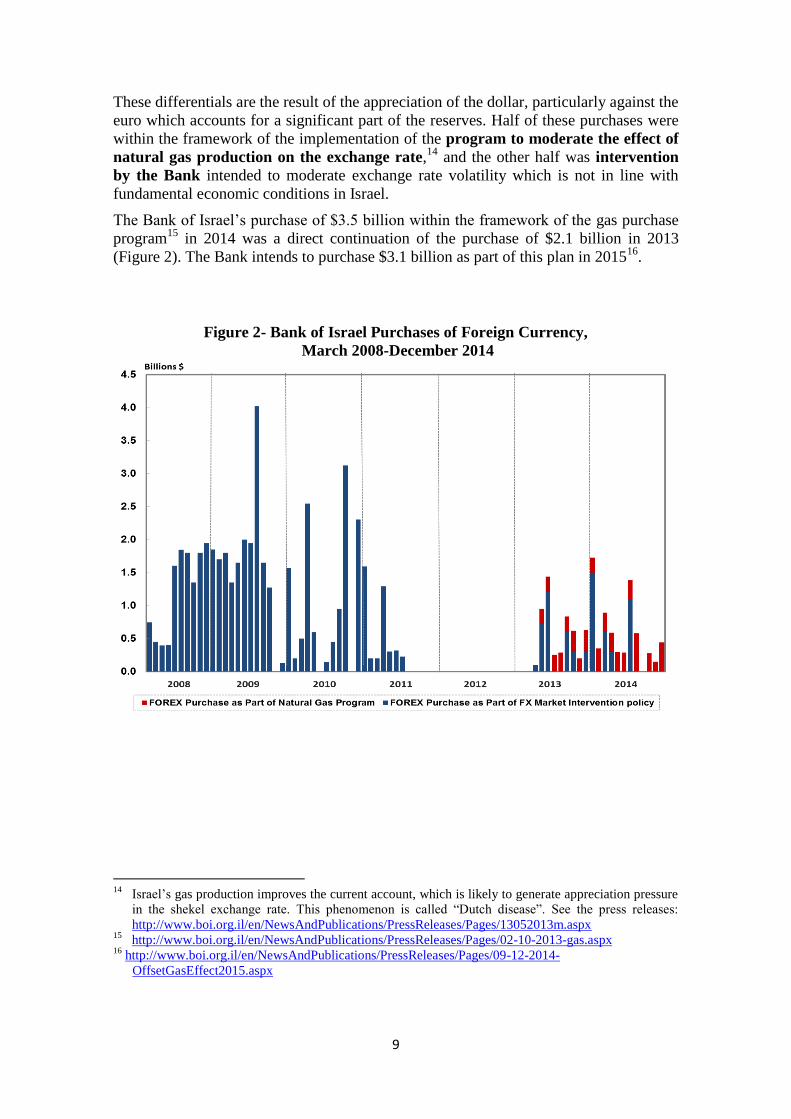
These differentials are the result of the appreciation of the dollar, particularly against the
euro which accounts for a significant part of the reserves. Half of these purchases were
within the framework of the implementation of the program to moderate the effect of
natural gas production on the exchange rate,14
and the other half was intervention
by the Bank intended to moderate exchange rate volatility which is not in line with
fundamental economic conditions in Israel.
The Bank of Israel’s purchase of $3.5 billion within the framework of the gas purchase
program15
in 2014 was a direct continuation of the purchase of $2.1 billion in 2013
(Figure 2). The Bank intends to purchase $3.1 billion as part of this plan in 201516
.
Figure 2- Bank of Israel Purchases of Foreign Currency,
March 2008-December 2014
14
Israel’s gas production improves the current account, which is likely to generate appreciation pressure
in the shekel exchange rate. This phenomenon is called “Dutch disease”. See the press releases:
http://www.boi.org.il/en/NewsAndPublications/PressReleases/Pages/13052013m.aspx 15
http://www.boi.org.il/en/NewsAndPublications/PressReleases/Pages/02-10-2013-gas.aspx 16 http://www.boi.org.il/en/NewsAndPublications/PressReleases/Pages/09-12-2014-
OffsetGasEffect2015.aspx
10
5. The level of Israel’s foreign exchange reserves
a. Adequacy of the level of the foreign exchange reserves
The adequacy of the level of foreign exchange reserves is an important indicator of
a country’s financial stability, and supports the central bank in carrying out its
functions. The reserves are a source of liquidity in foreign currency, which the bank
can use when needed. Furthermore, an adequate level of foreign exchange reserves
contributes to improving the country’s international financial standing by
increasing confidence in its ability to withstand shocks to the economy. This
advantage is manifested in the country’s credit rating, and in the evaluations
produced by rating agencies, allowing the economy to lower the costs of financing
debt raised abroad.
The principles for determining the appropriate level of reserves were defined
according to the goals for holding them.17
Based on these principles, at the
beginning of 2015, the Governor revised the appropriate range to between $70 and
$110 billion, replacing the previous range of $65-90 billion, defined by the
Governor in 2010. The appropriate range was revised on the basis of these
principles and in accordance with economic developments over the last five years.
In terms of GDP for 2014, the appropriate level is within the 23-36 percent range,
slightly lower than the previous range for GDP in 2010 of 28-39 percent. The
reserve level is currently close to the middle of the new range determined by the
Governor.
The Bank of Israel’s intervention in the foreign exchange market for the purpose of
carrying out its functions and attaining its objectives may lead to a deviation in the
actual level of reserves from the determined appropriate level. Such a deviation is
permitted under the Bank of Israel Law. Nevertheless, the Bank may take action to
alter the level of reserves only when the deviation is significant and sustained, and
only if such actions are consistent with attaining the Bank’s objectives as specified
in the Bank of Israel Law - including price stability, support for other objectives of
economic policy, and support for stability in the financial system. It is therefore
possible for the foreign exchange reserves to deviate from the desired level for
extended periods of time.
b. Israel’s actual levels of foreign exchange reserves
The adequacy of the level of reserves held by a country is generally evaluated in
terms of ratios of the reserves to various economic variables. In Israel, these ratios
have risen during the past decade as a result of the increase in the size of the
reserves since 2008 (Table 2).
17
See Appendix 3: Principles for determining the appropriate level.
11
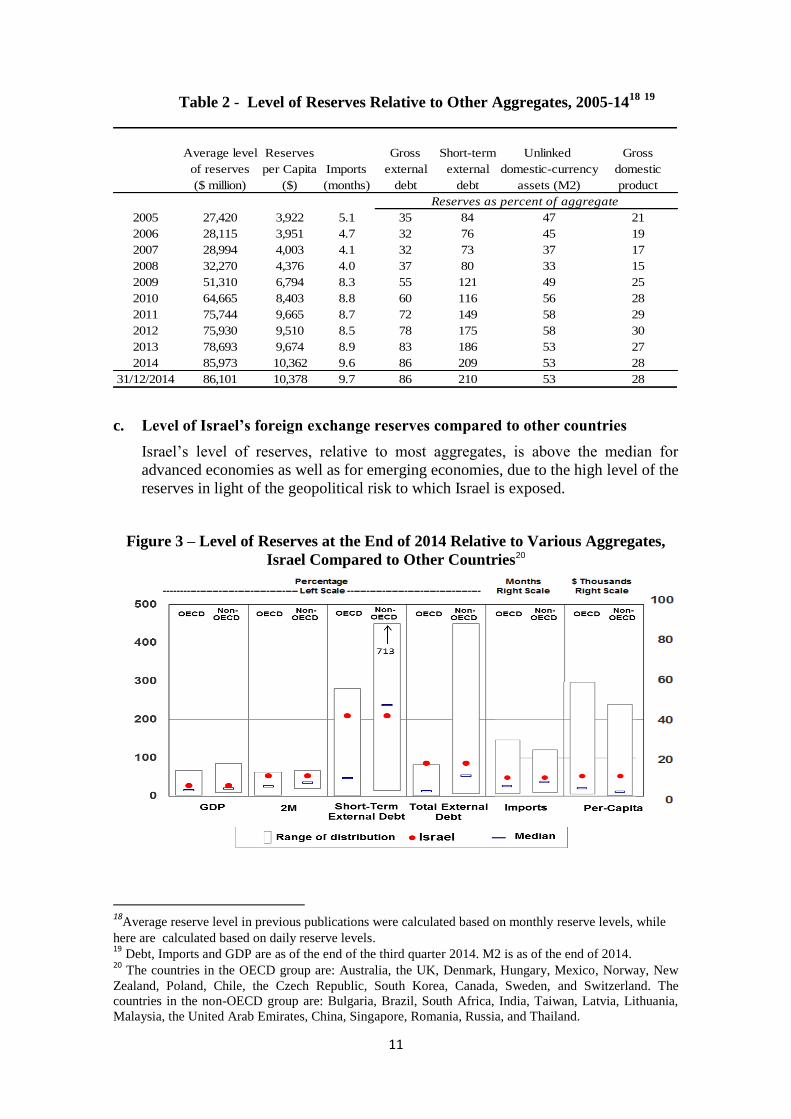
Table 2 - Level of Reserves Relative to Other Aggregates, 2005-1418
19
c. Level of Israel’s foreign exchange reserves compared to other countries
Israel’s level of reserves, relative to most aggregates, is above the median for
advanced economies as well as for emerging economies, due to the high level of the
reserves in light of the geopolitical risk to which Israel is exposed.
Figure 3 – Level of Reserves at the End of 2014 Relative to Various Aggregates,
Israel Compared to Other Countries20
18
Average reserve level in previous publications were calculated based on monthly reserve levels, while
here are calculated based on daily reserve levels. 19
Debt, Imports and GDP are as of the end of the third quarter 2014. M2 is as of the end of 2014. 20
The countries in the OECD group are: Australia, the UK, Denmark, Hungary, Mexico, Norway, New
Zealand, Poland, Chile, the Czech Republic, South Korea, Canada, Sweden, and Switzerland. The
countries in the non-OECD group are: Bulgaria, Brazil, South Africa, India, Taiwan, Latvia, Lithuania,
Malaysia, the United Arab Emirates, China, Singapore, Romania, Russia, and Thailand.
Average level Reserves Gross Short-term Unlinked Gross
of reserves per Capita Imports external external domestic-currency domestic
($ million) ($) (months) debt debt assets (M2) product
2005 27,420 3,922 5.1 35 84 47 21
2006 28,115 3,951 4.7 32 76 45 19
2007 28,994 4,003 4.1 32 73 37 17
2008 32,270 4,376 4.0 37 80 33 15
2009 51,310 6,794 8.3 55 121 49 25
2010 64,665 8,403 8.8 60 116 56 28
2011 75,744 9,665 8.7 72 149 58 29
2012 75,930 9,510 8.5 78 175 58 30
2013 78,693 9,674 8.9 83 186 53 27
2014 85,973 10,362 9.6 86 209 53 28
31/12/2014 86,101 10,378 9.7 86 210 53 28
Reserves as percent of aggregate
12
B. The global economic and financial environment
In the global financial environment, government bond yields declined sharply
in 2014 while prices in stock markets in advanced economies, particularly the
US, increased. In emerging economies, trends were mixed. Equity market
prices in advanced economies rose despite the tapering of the US quantitative
easing program, which reached an end in October, and against the
background of quantitative easing programs in the eurozone and Japan, and
the relative strength of the US economy. These factors also led to a sharp
appreciation of the dollar against most currencies, primarily in the second half
of the year. In parallel, the price of oil dropped markedly, as global demand
declined at the same time as the supply of oil increased. In the global economic
environment, inflation rates declined during the year to below the inflation
targets of many central banks—posing a critical risk in some of the economies.
In the first half of the year, stock market prices rose and government bond yields
declined, against the background of the accommodative monetary policy
worldwide, and despite the tapering of quantitative easing in the US. As Europe and
Japan showed further signs of weakness in the second half of the year, including
weak macroeconomic data and low inflation levels, the decoupling of Europe and
Japan from the resurgent US economy intensified. This was reflected in US
outperformance compared to volatile trading in Europe and Japan. In June, the
price of Brent crude oil began a steep decline from $105 to just $55 a barrel at the
end of the year, against the background of a slowdown in demand and an increase
supply. These trends derived from, among other things, further slowdown in China,
the energy revolution in the US and OPEC’s decision not to cut back the supply of
oil. The global economic and financial environment during the year was also
affected by the deteriorating geopolitical situation between Russia and Ukraine,
which led to increased risk aversion among investors.
In parallel with these financial developments, the real economy in most
countries—particularly in Europe, Japan and the emerging economies, continued to
slow. In October, the International Monetary Fund revised downward its global
growth forecast, according to which, in 2014 the global economy was expected to
grow by 3.3%, below the long-term trend. This was mainly due to continuing
weakness in emerging markets and the fact that various European economies as
well as Japan were once again in recession. The forecast for global growth in 2015
is 3.8%.
In October, the US Federal Reserve ended its quantitative easing program in light
of improved macro data, particularly in the employment market, where 215,000
jobs on average were added each month and the unemployment rate declined from
6.7 percent to just 5.8 percent.
Notwithstanding the tapering, yields on 10-year US government notes declined in
2014 from 3 percent to 2.2 percent. There are several reasons for this: excess
liquidity in the markets, accommodative monetary policy around the world, low
yields in Europe in general, and in its peripheral economies in particular, increased
demand for US Treasury notes by central banks worldwide (including China’s
central bank) and the strengthening of the dollar. In contrast, yields on two-year
notes increased from 38 to 66 basis points, against the background of market
assessments that the US would increase the interest rate in the near future.

13
Figure 4 – Ten-Year Yields to Maturity of US, Germany and UK
Government Bonds, 2014
Figure 5 – Two-Year Yields to Maturity of US, Germany and UK
Government Bonds, 2014
Severe weather in the US at the beginning of the year adversely affected economic
data (employment, real estate, manufacturing, and sales), resulting in negative
growth of 2.1 percent21
in the first quarter. Due to this weakness, investment houses
lowered US 2014 growth projections from 3 percent to just 1.7 percent. However,
with the economy’s recovery as the year progressed, growth rates rose significantly
in the following quarters, so that at the end of 2014 annual growth was 2.5 percent.
In the eurozone, against the background of economic weakness, reflected in weak
growth figures and low inflation, the ECB reduced the interest rate on bank deposits
to negative levels, beginning with a program to purchase asset-backed securities
21
The growth rates mentioned in this publication are quarter on quarter in annual terms, unless specified
otherwise.
14
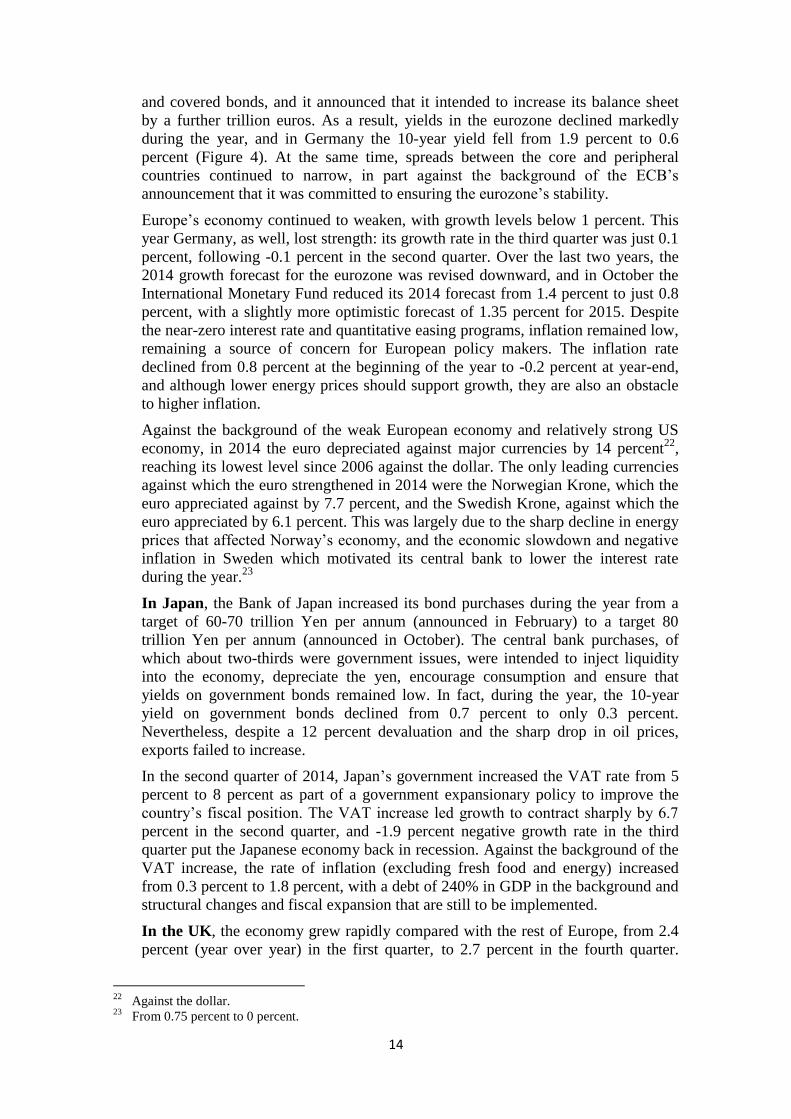
and covered bonds, and it announced that it intended to increase its balance sheet
by a further trillion euros. As a result, yields in the eurozone declined markedly
during the year, and in Germany the 10-year yield fell from 1.9 percent to 0.6
percent (Figure 4). At the same time, spreads between the core and peripheral
countries continued to narrow, in part against the background of the ECB’s
announcement that it was committed to ensuring the eurozone’s stability.
Europe’s economy continued to weaken, with growth levels below 1 percent. This
year Germany, as well, lost strength: its growth rate in the third quarter was just 0.1
percent, following -0.1 percent in the second quarter. Over the last two years, the
2014 growth forecast for the eurozone was revised downward, and in October the
International Monetary Fund reduced its 2014 forecast from 1.4 percent to just 0.8
percent, with a slightly more optimistic forecast of 1.35 percent for 2015. Despite
the near-zero interest rate and quantitative easing programs, inflation remained low,
remaining a source of concern for European policy makers. The inflation rate
declined from 0.8 percent at the beginning of the year to -0.2 percent at year-end,
and although lower energy prices should support growth, they are also an obstacle
to higher inflation.
Against the background of the weak European economy and relatively strong US
economy, in 2014 the euro depreciated against major currencies by 14 percent22
,
reaching its lowest level since 2006 against the dollar. The only leading currencies
against which the euro strengthened in 2014 were the Norwegian Krone, which the
euro appreciated against by 7.7 percent, and the Swedish Krone, against which the
euro appreciated by 6.1 percent. This was largely due to the sharp decline in energy
prices that affected Norway’s economy, and the economic slowdown and negative
inflation in Sweden which motivated its central bank to lower the interest rate
during the year.23
In Japan, the Bank of Japan increased its bond purchases during the year from a
target of 60-70 trillion Yen per annum (announced in February) to a target 80
trillion Yen per annum (announced in October). The central bank purchases, of
which about two-thirds were government issues, were intended to inject liquidity
into the economy, depreciate the yen, encourage consumption and ensure that
yields on government bonds remained low. In fact, during the year, the 10-year
yield on government bonds declined from 0.7 percent to only 0.3 percent.
Nevertheless, despite a 12 percent devaluation and the sharp drop in oil prices,
exports failed to increase.
In the second quarter of 2014, Japan’s government increased the VAT rate from 5
percent to 8 percent as part of a government expansionary policy to improve the
country’s fiscal position. The VAT increase led growth to contract sharply by 6.7
percent in the second quarter, and -1.9 percent negative growth rate in the third
quarter put the Japanese economy back in recession. Against the background of the
VAT increase, the rate of inflation (excluding fresh food and energy) increased
from 0.3 percent to 1.8 percent, with a debt of 240% in GDP in the background and
structural changes and fiscal expansion that are still to be implemented.
In the UK, the economy grew rapidly compared with the rest of Europe, from 2.4
percent (year over year) in the first quarter, to 2.7 percent in the fourth quarter.
22
Against the dollar. 23
From 0.75 percent to 0 percent.
15
Financial markets were strongly impacted by comments made by the Governor of
the Bank of England, Mark Carney. In May, he raised the possibility of an interest
rate rise in 2014, although later in the year he commented that the economic
situation was less favorable than it appeared. The result was that the markets once
again postponed pricing in the first interest rate increase in the UK. The Bank of
England’s growth forecasts for 2015 and 2016 were lowered by 0.2 percent, to 2.8
percent and 2.6 percent respectively, and inflation is expected to be less than 1%,
after declining from 2 percent to just 0.5 percent in 2014. Over the year, 10-year
UK government bond yields declined from 3 percent to 1.8 percent.
In 2014, China continued to take the necessary steps for maintaining stable,
sustainable growth without exacerbating the slowdown arising from the
implementation of these changes.
The growth rate in the third quarter was 7.3% (in annual terms).24
Investment as a
component of GDP continued to moderate, mainly due to lower levels of
investment in real estate and infrastructure, whereas domestic consumption and net
exports grew. At the same time, inflation reached a six-year low, allowing
policymakers to introduce expansionary but focused monetary policy in an effort to
avoid increasing the high debt levels.
In emerging economies, growth in 2014 was relatively weak, with economic
activity in the central areas below the trend for the past three years. The year began
with a growing external deficit and high levels of inflation. The environment was
therefore sensitive to external shocks, seen as tapering began and was followed by
increased yields in the US. Due to the tightened financial conditions and liquidity in
these markets in the second half of 2013, which were accompanied by economic
slowdown in China and slowdown in world trade volume, the first half of 2014 was
the worst period for emerging economies since the financial crisis. The situation
improved somewhat as the year progressed due to a marked improvement in the
external balance, economic recovery in the US, the sharp decline in inflation and
accommodative policies introduced by the central banks in Europe and Japan. The
decline in inflation provided policymakers in the emerging markets with greater
freedom of action, and in some cases accommodative monetary policy and new
structural reforms were introduced.
Nevertheless, the economies in these markets are extremely diverse and global
developments affect them very differently. For example, the strengthening of the
dollar supports export-oriented countries, whereas lower energy prices support
import-oriented countries. The key to successfully coping with the changing
situation appears to be the ability of the different economies to implement
appropriate structural reforms.
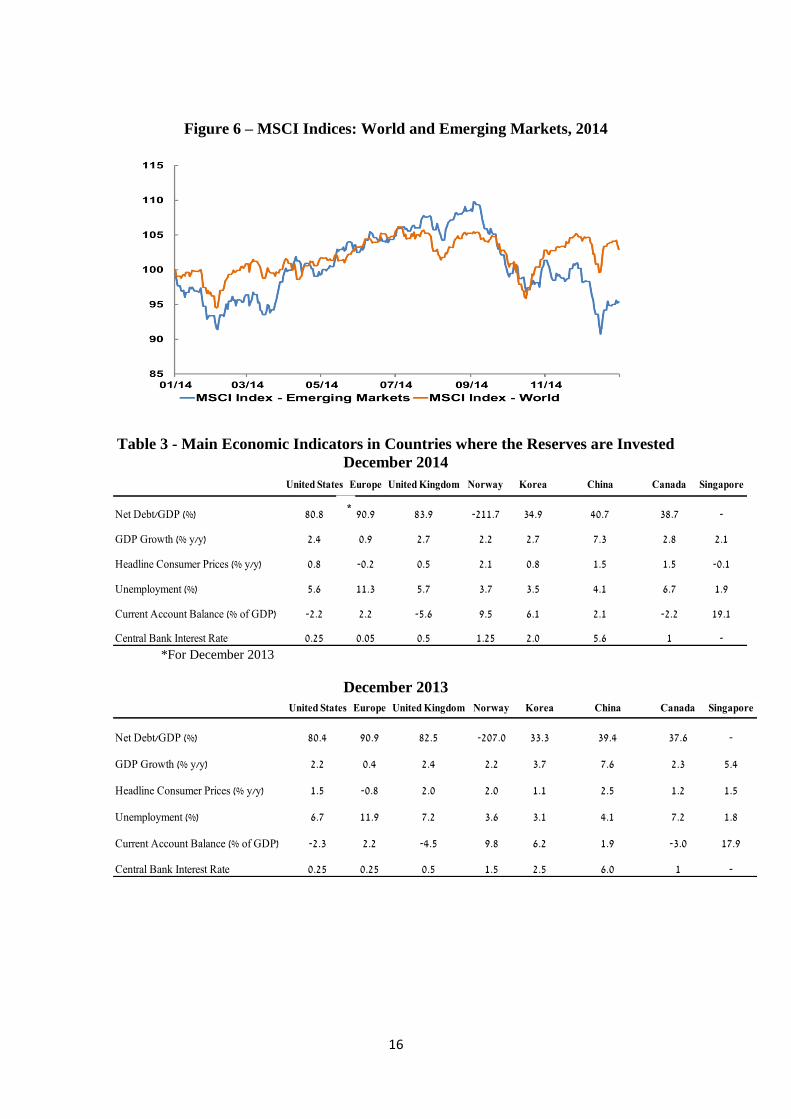
In the financial markets, the emerging economies did not benefit from the US
recovery. Their currencies weakened against the dollar and the MSCI Emerging
Markets Index declined by 4.6 percent, compared with a 3 percent increase in the
corresponding index for developed economies. In contrast, low commodities prices
and prolonged expansionary monetary policy provided a positive environment for
the government bonds of emerging markets. Since November, when risk aversion
increased due to tension with Russia, there has been an outflow of capital from the
emerging economies.
24
After 7.4% in the first quarter and 7.5% in the second quarter.
16
Figure 6 – MSCI Indices: World and Emerging Markets, 2014
Table 3 - Main Economic Indicators in Countries where the Reserves are Invested
December 2014
*For December 2013
December 2013
United States Europe United Kingdom Norway Korea China Canada Singapore
Net Debt/GDP (%) 80.8 90.9 83.9 -211.7 34.9 40.7 38.7 -
GDP Growth (% y/y) 2.4 0.9 2.7 2.2 2.7 7.3 2.8 2.1
Headline Consumer Prices (% y/y) 0.8 -0.2 0.5 2.1 0.8 1.5 1.5 -0.1
Unemployment (%) 5.6 11.3 5.7 3.7 3.5 4.1 6.7 1.9
Current Account Balance (% of GDP) -2.2 2.2 -5.6 9.5 6.1 2.1 -2.2 19.1
Central Bank Interest Rate 0.25 0.05 0.5 1.25 2.0 5.6 1 -
United States Europe United Kingdom Norway Korea China Canada Singapore
Net Debt/GDP (%) 80.4 90.9 82.5 -207.0 33.3 39.4 37.6 -
GDP Growth (% y/y) 2.2 0.4 2.4 2.2 3.7 7.6 2.3 5.4
Headline Consumer Prices (% y/y) 1.5 -0.8 2.0 2.0 1.1 2.5 1.2 1.5
Unemployment (%) 6.7 11.9 7.2 3.6 3.1 4.1 7.2 1.8
Current Account Balance (% of GDP) -2.3 2.2 -4.5 9.8 6.2 1.9 -3.0 17.9
Central Bank Interest Rate 0.25 0.25 0.5 1.5 2.5 6.0 1 -
*
17
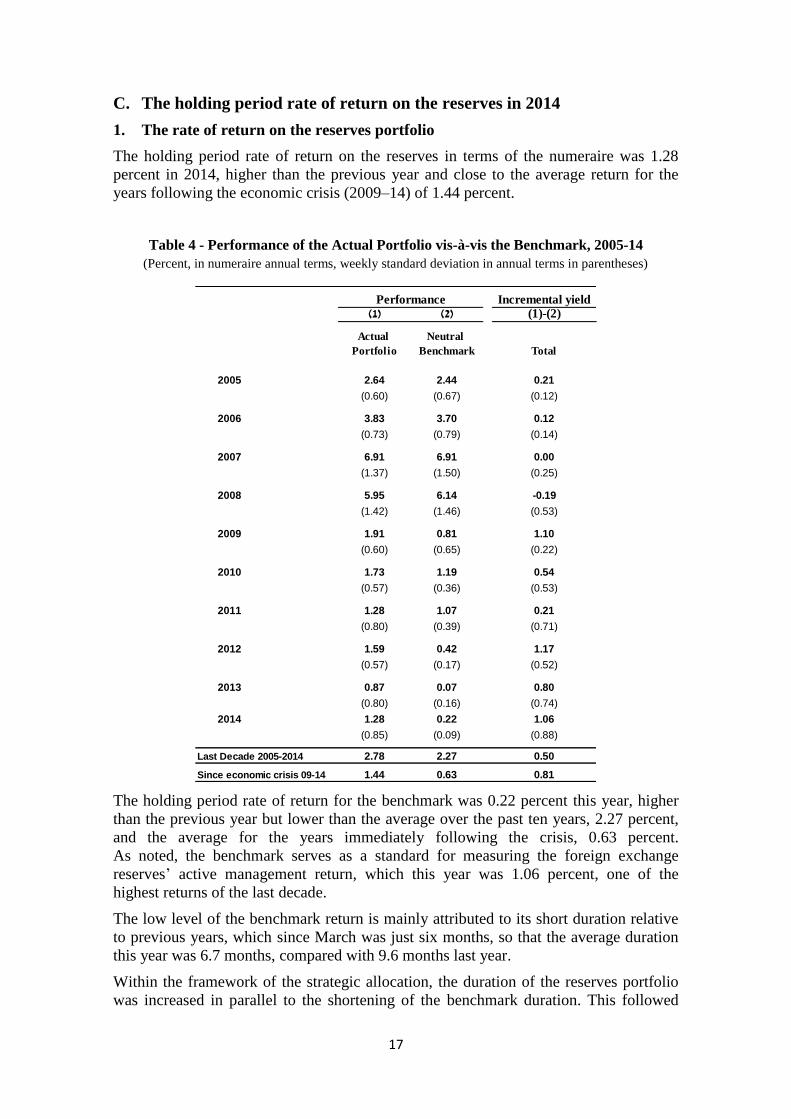
C. The holding period rate of return on the reserves in 2014
1. The rate of return on the reserves portfolio
The holding period rate of return on the reserves in terms of the numeraire was 1.28
percent in 2014, higher than the previous year and close to the average return for the
years following the economic crisis (2009–14) of 1.44 percent.
Table 4 - Performance of the Actual Portfolio vis-à-vis the Benchmark, 2005-14
(Percent, in numeraire annual terms, weekly standard deviation in annual terms in parentheses)
The holding period rate of return for the benchmark was 0.22 percent this year, higher
than the previous year but lower than the average over the past ten years, 2.27 percent,
and the average for the years immediately following the crisis, 0.63 percent.
As noted, the benchmark serves as a standard for measuring the foreign exchange
reserves’ active management return, which this year was 1.06 percent, one of the
highest returns of the last decade.
The low level of the benchmark return is mainly attributed to its short duration relative
to previous years, which since March was just six months, so that the average duration
this year was 6.7 months, compared with 9.6 months last year.
Within the framework of the strategic allocation, the duration of the reserves portfolio
was increased in parallel to the shortening of the benchmark duration. This followed
Incremental yield(1) (2) (1)-(2)
Actual
Portfolio
Neutral
Benchmark Total
2005 2.64 2.44 0.21
(0.60) (0.67) (0.12)
2006 3.83 3.70 0.12
(0.73) (0.79) (0.14)
2007 6.91 6.91 0.00
(1.37) (1.50) (0.25)
2008 5.95 6.14 -0.19
(1.42) (1.46) (0.53)
2009 1.91 0.81 1.10
(0.60) (0.65) (0.22)
2010 1.73 1.19 0.54
(0.57) (0.36) (0.53)
2011 1.28 1.07 0.21
(0.80) (0.39) (0.71)
2012 1.59 0.42 1.17
(0.57) (0.17) (0.52)
2013 0.87 0.07 0.80
(0.80) (0.16) (0.74)
2014 1.28 0.22 1.06
(0.85) (0.09) (0.88)
Last Decade 2005-2014 2.78 2.27 0.50
Since economic crisis 09-14 1.44 0.63 0.81
Performance

18
previous years in which the portfolio duration had been kept short—a response to the
significant decline of the yield curves in many markets around the world to their lowest
levels since 2008. Although maintaining short duration in the portfolio in recent years25
reduced the risk of a negative return in the event of a rise in yields to maturity, it also
led to lower interest income and limited capital gains from the declining yields.
Figure 7- Two-Year Yields to Maturity of US, Germany and UK
Government Bonds, 2008-14
25
From 2009 until the beginning of 2014.
19
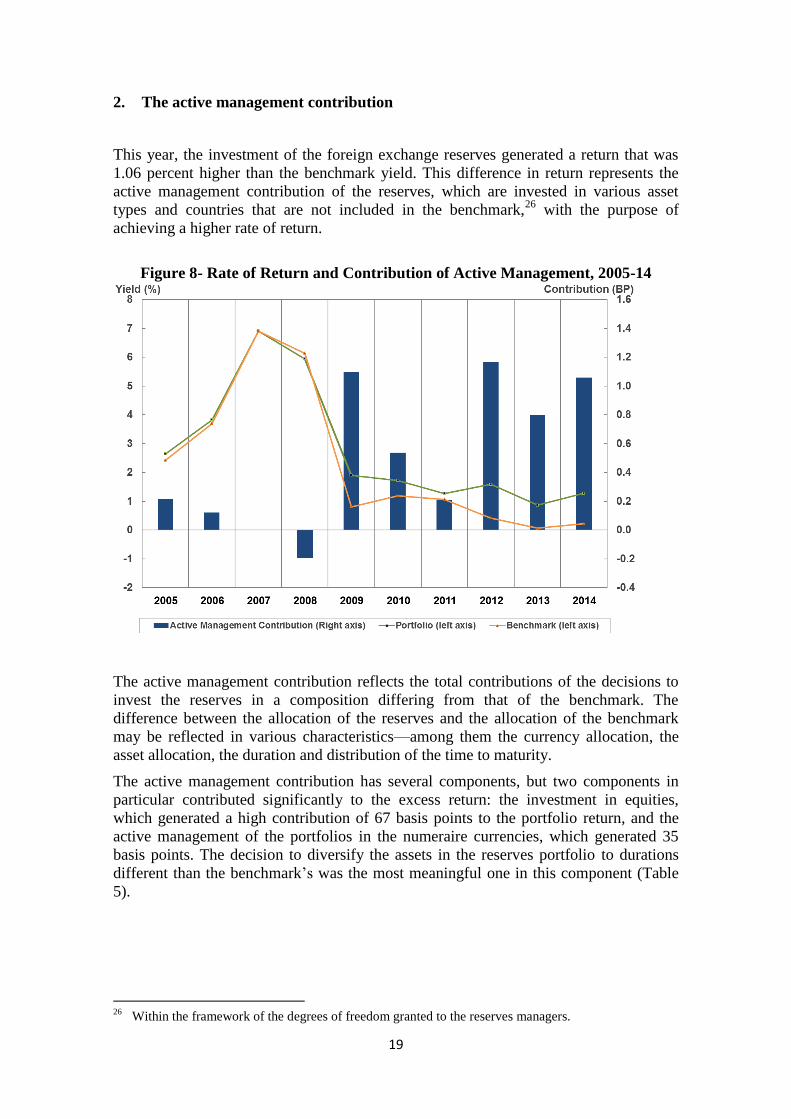
2. The active management contribution
This year, the investment of the foreign exchange reserves generated a return that was
1.06 percent higher than the benchmark yield. This difference in return represents the
active management contribution of the reserves, which are invested in various asset
types and countries that are not included in the benchmark,26
with the purpose of
achieving a higher rate of return.
Figure 8- Rate of Return and Contribution of Active Management, 2005-14
The active management contribution reflects the total contributions of the decisions to
invest the reserves in a composition differing from that of the benchmark. The
difference between the allocation of the reserves and the allocation of the benchmark
may be reflected in various characteristics—among them the currency allocation, the
asset allocation, the duration and distribution of the time to maturity.
The active management contribution has several components, but two components in
particular contributed significantly to the excess return: the investment in equities,
which generated a high contribution of 67 basis points to the portfolio return, and the
active management of the portfolios in the numeraire currencies, which generated 35
basis points. The decision to diversify the assets in the reserves portfolio to durations
different than the benchmark’s was the most meaningful one in this component (Table
5).
26
Within the framework of the degrees of freedom granted to the reserves managers.
20
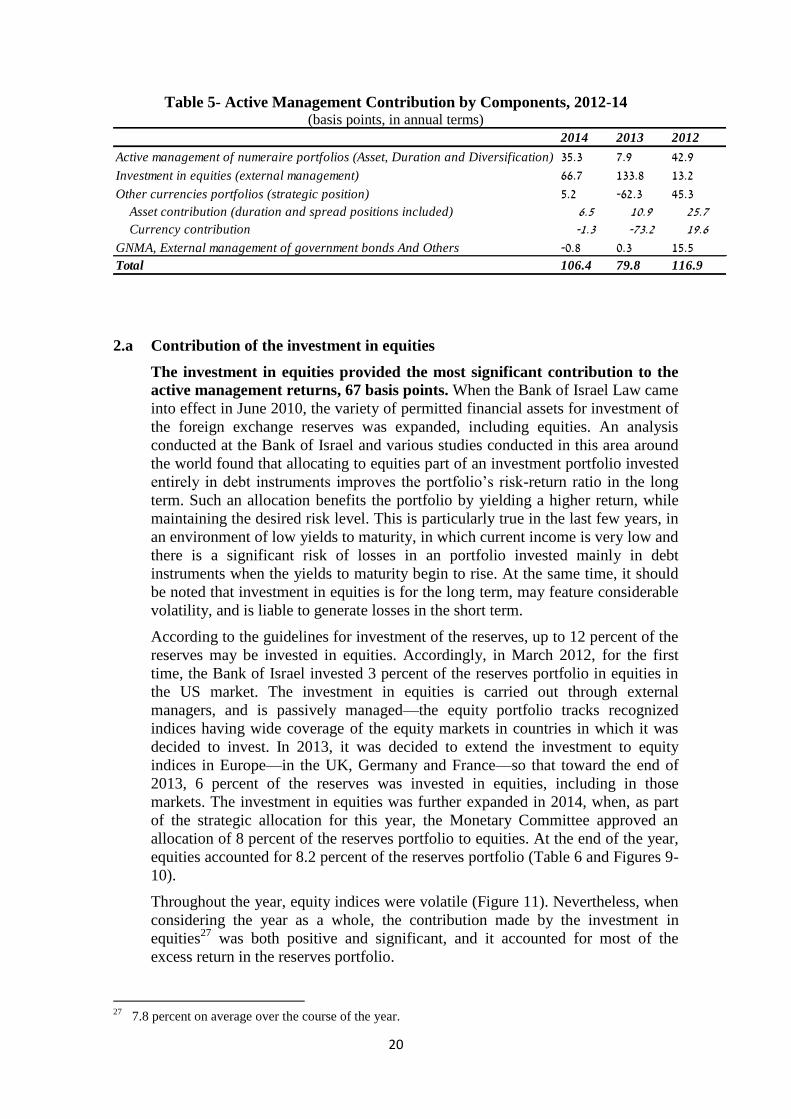
Table 5- Active Management Contribution by Components, 2012-14 (basis points, in annual terms)
2.a Contribution of the investment in equities
The investment in equities provided the most significant contribution to the
active management returns, 67 basis points. When the Bank of Israel Law came
into effect in June 2010, the variety of permitted financial assets for investment of
the foreign exchange reserves was expanded, including equities. An analysis
conducted at the Bank of Israel and various studies conducted in this area around
the world found that allocating to equities part of an investment portfolio invested
entirely in debt instruments improves the portfolio’s risk-return ratio in the long
term. Such an allocation benefits the portfolio by yielding a higher return, while
maintaining the desired risk level. This is particularly true in the last few years, in
an environment of low yields to maturity, in which current income is very low and
there is a significant risk of losses in an portfolio invested mainly in debt
instruments when the yields to maturity begin to rise. At the same time, it should
be noted that investment in equities is for the long term, may feature considerable
volatility, and is liable to generate losses in the short term.
According to the guidelines for investment of the reserves, up to 12 percent of the
reserves may be invested in equities. Accordingly, in March 2012, for the first
time, the Bank of Israel invested 3 percent of the reserves portfolio in equities in
the US market. The investment in equities is carried out through external
managers, and is passively managed—the equity portfolio tracks recognized
indices having wide coverage of the equity markets in countries in which it was
decided to invest. In 2013, it was decided to extend the investment to equity
indices in Europe—in the UK, Germany and France—so that toward the end of
2013, 6 percent of the reserves was invested in equities, including in those
markets. The investment in equities was further expanded in 2014, when, as part
of the strategic allocation for this year, the Monetary Committee approved an
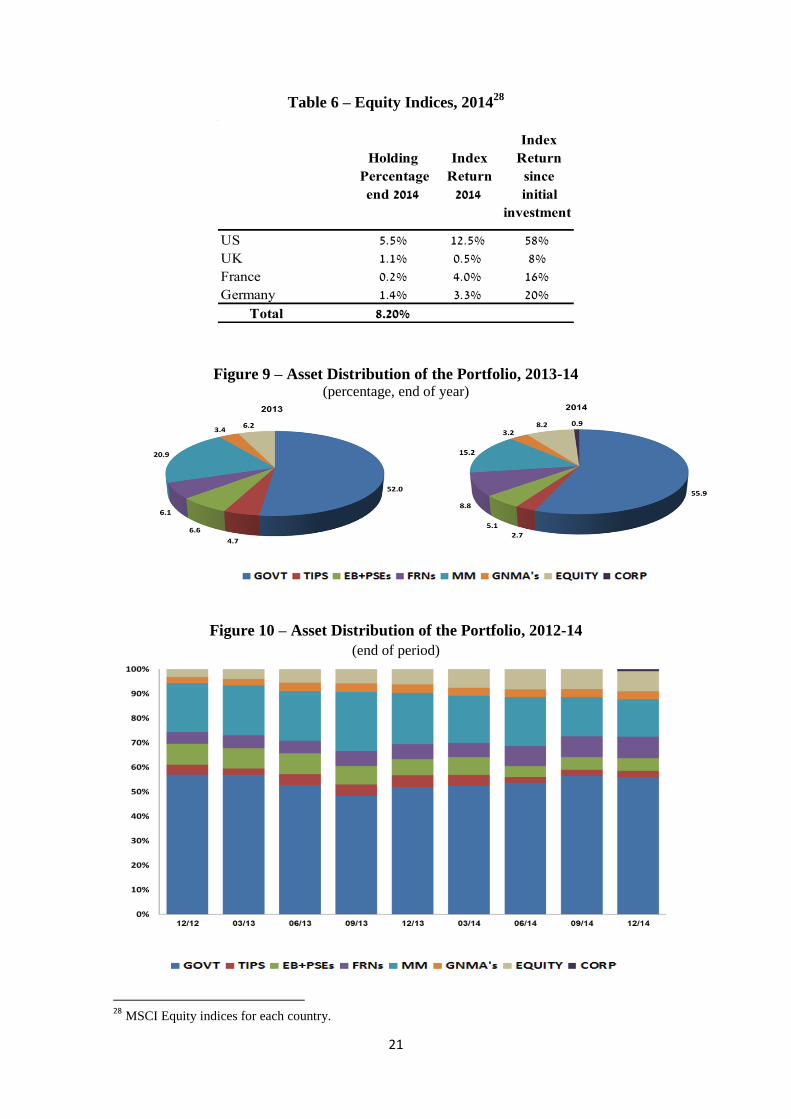
allocation of 8 percent of the reserves portfolio to equities. At the end of the year,
equities accounted for 8.2 percent of the reserves portfolio (Table 6 and Figures 9-
10).
Throughout the year, equity indices were volatile (Figure 11). Nevertheless, when
considering the year as a whole, the contribution made by the investment in
equities27
was both positive and significant, and it accounted for most of the
excess return in the reserves portfolio.
27
7.8 percent on average over the course of the year.
2014 2013 2012
Active management of numeraire portfolios (Asset, Duration and Diversification) 35.3 7.9 42.9
Investment in equities (external management) 66.7 133.8 13.2
Other currencies portfolios (strategic position) 5.2 -62.3 45.3 Asset contribution (duration and spread positions included) 6.5 10.9 25.7
Currency contribution -1.3 -73.2 19.6
GNMA, External management of government bonds And Others -0.8 0.3 15.5Total 106.4 79.8 116.9
21
Table 6 – Equity Indices, 201428
Figure 9 – Asset Distribution of the Portfolio, 2013-14 (percentage, end of year)
Figure 10 – Asset Distribution of the Portfolio, 2012-14
(end of period)
28
MSCI Equity indices for each country.
Index
Return
since
initial
investment
Index
Return
2014
Holding
Percentage
end 2014
58%12.5%5.5%US
8%0.5%1.1%UK
16%4.0%0.2%France
20%3.3%1.4%Germany
8.20%Total

22
Figure 11 – Equity Indices: US, UK, Germany and France, 2014
23
According to a large number of empirical findings that have been documented in
research, international diversification of investment in equities improves the risk-
return ratio. Although world markets have become more integrated in recent
years, international diversification of the investments is expected to improve the
portfolio’s risk-return ratio. This is confirmed by marked differences in the way
that the different markets reacted to the financial crisis and their behavior as they
emerged from the crisis.
Accordingly, as part of the strategic allocation for 2015, the Monetary Committee
decided to review the possible diversification of the investment in equities to other
markets—Japan, South Korea and Hong Kong—in addition to those of the
numeraire currencies.
2.b Contribution of active management in numeraire currencies portfolios
Active management in the numeraire portfolios generated 35 basis points in
excess return this year. This is largely the result of the decision to invest the
foreign exchange reserves in a duration that differs from the benchmark duration
and to diversify the assets differently over the curve compared with the
benchmark—unlike previous years when this component made a smaller
contribution.
This year, the portfolio duration was higher than the benchmark duration, due to a
shortening of the benchmark duration beginning in March and an increase in the
portfolio duration as part of the strategic allocation. The portfolio thus benefited
from a longer duration relative to the benchmark which this year was 12 months
on average, compared with last year when the portfolio duration and the
benchmark duration were almost identical—10 months on average.
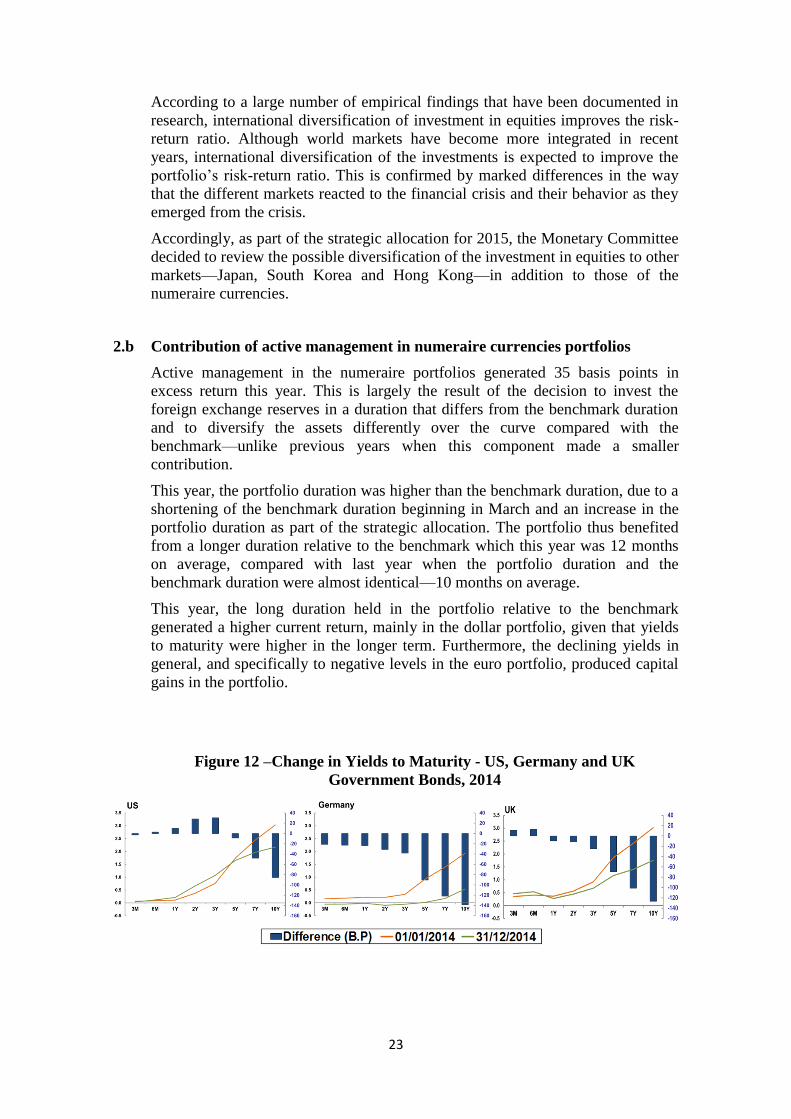
This year, the long duration held in the portfolio relative to the benchmark
generated a higher current return, mainly in the dollar portfolio, given that yields
to maturity were higher in the longer term. Furthermore, the declining yields in
general, and specifically to negative levels in the euro portfolio, produced capital
gains in the portfolio.
Figure 12 –Change in Yields to Maturity - US, Germany and UK
Government Bonds, 2014
24
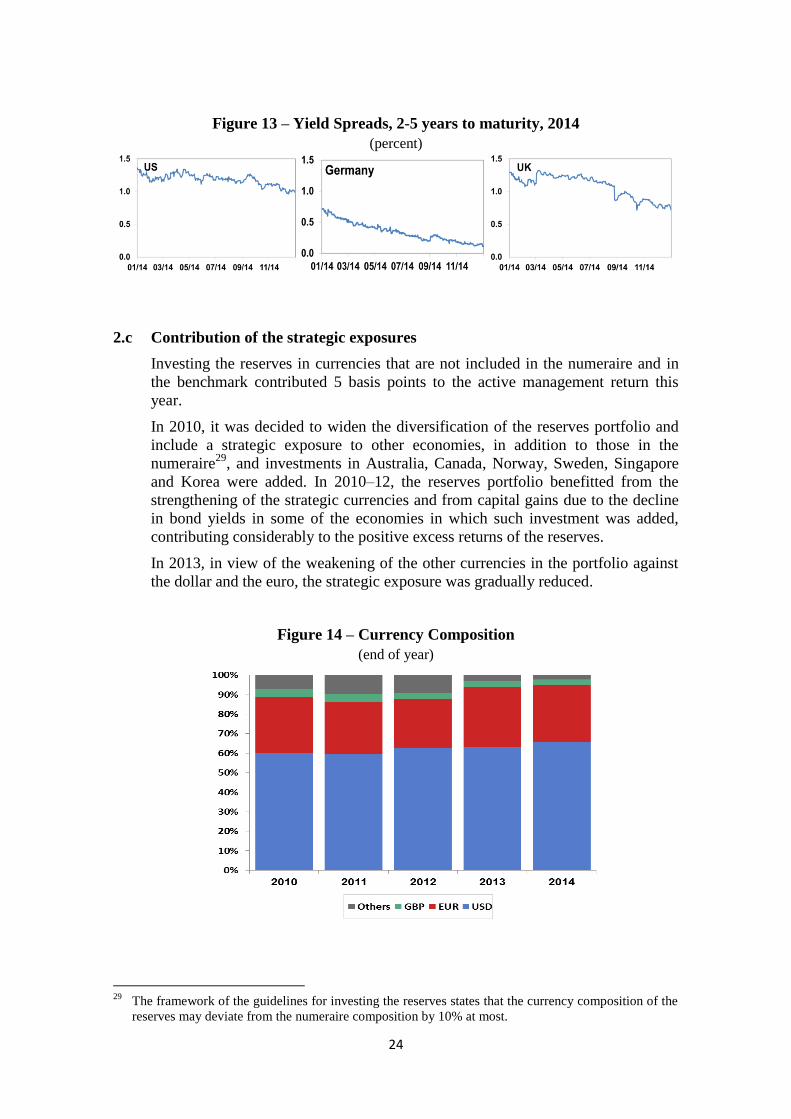
Figure 13 – Yield Spreads, 2-5 years to maturity, 2014
(percent)
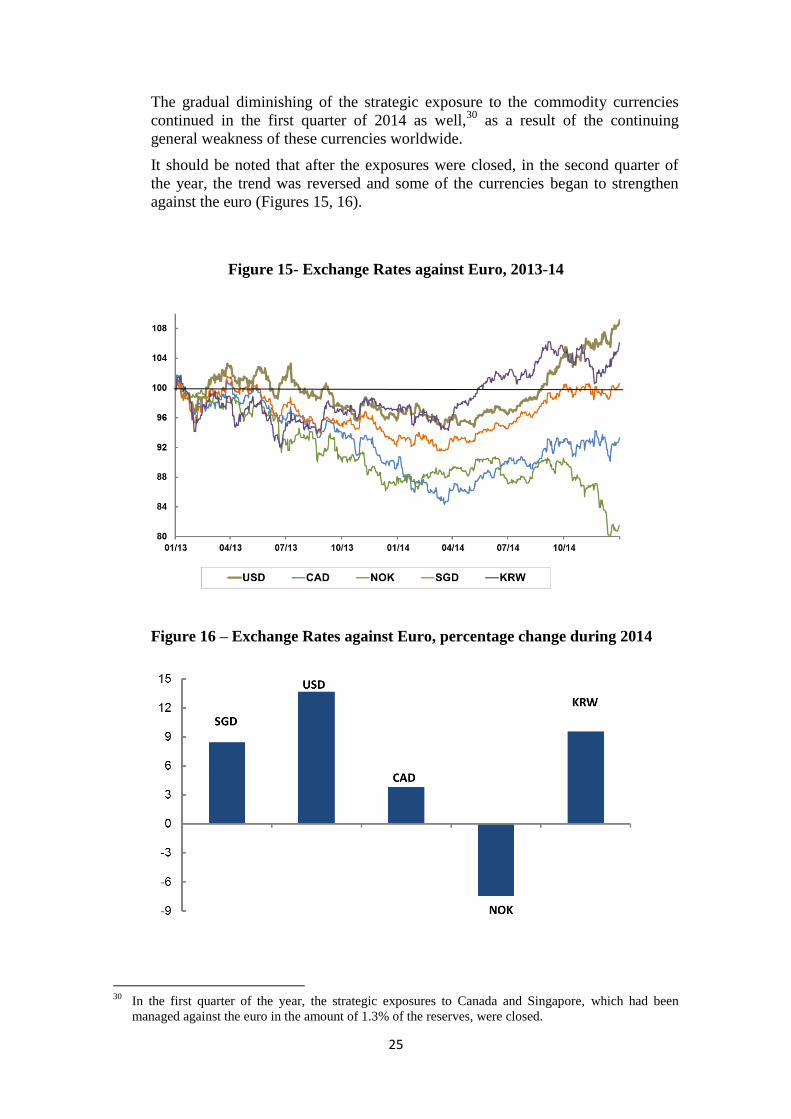
2.c Contribution of the strategic exposures
Investing the reserves in currencies that are not included in the numeraire and in
the benchmark contributed 5 basis points to the active management return this
year.
In 2010, it was decided to widen the diversification of the reserves portfolio and
include a strategic exposure to other economies, in addition to those in the
numeraire29
, and investments in Australia, Canada, Norway, Sweden, Singapore
and Korea were added. In 2010–12, the reserves portfolio benefitted from the
strengthening of the strategic currencies and from capital gains due to the decline
in bond yields in some of the economies in which such investment was added,
contributing considerably to the positive excess returns of the reserves.
In 2013, in view of the weakening of the other currencies in the portfolio against
the dollar and the euro, the strategic exposure was gradually reduced.
Figure 14 – Currency Composition
(end of year)
29
The framework of the guidelines for investing the reserves states that the currency composition of the
reserves may deviate from the numeraire composition by 10% at most.
25
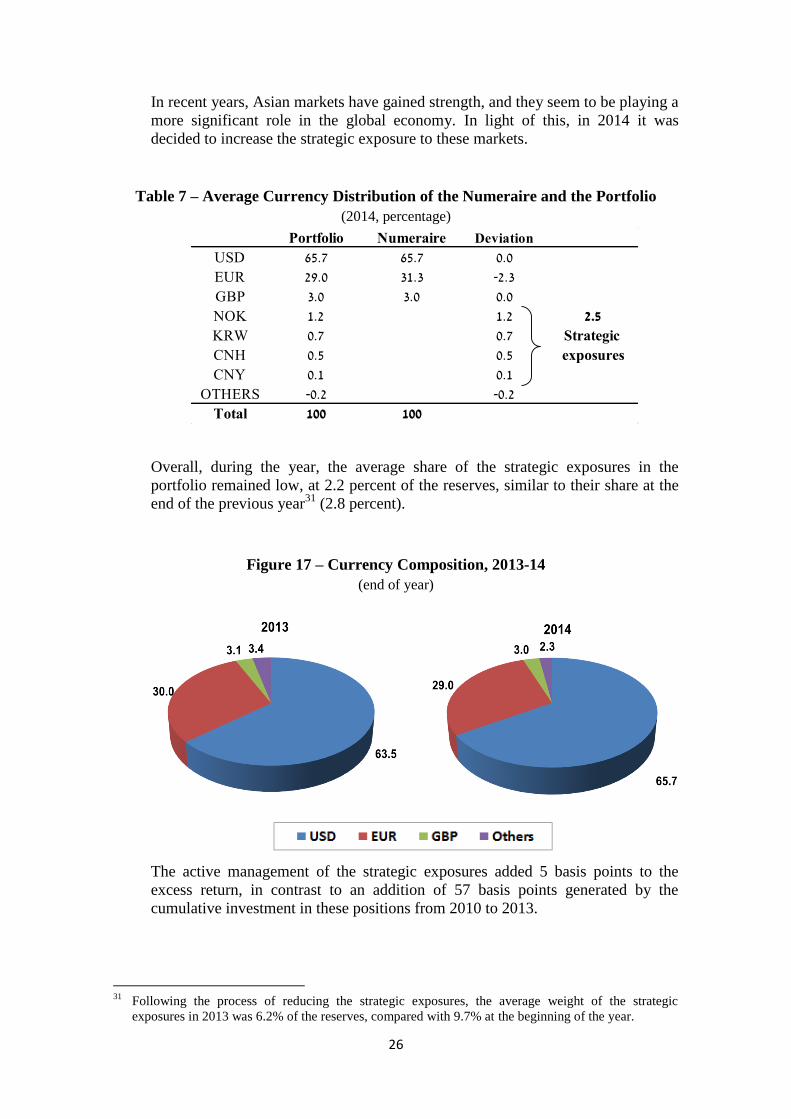
The gradual diminishing of the strategic exposure to the commodity currencies
continued in the first quarter of 2014 as well,30
as a result of the continuing
general weakness of these currencies worldwide.
It should be noted that after the exposures were closed, in the second quarter of
the year, the trend was reversed and some of the currencies began to strengthen
against the euro (Figures 15, 16).
Figure 15- Exchange Rates against Euro, 2013-14
Figure 16 – Exchange Rates against Euro, percentage change during 2014
30
In the first quarter of the year, the strategic exposures to Canada and Singapore, which had been
managed against the euro in the amount of 1.3% of the reserves, were closed.
26
In recent years, Asian markets have gained strength, and they seem to be playing a
more significant role in the global economy. In light of this, in 2014 it was
decided to increase the strategic exposure to these markets.
Table 7 – Average Currency Distribution of the Numeraire and the Portfolio
(2014, percentage)
Overall, during the year, the average share of the strategic exposures in the
portfolio remained low, at 2.2 percent of the reserves, similar to their share at the
end of the previous year31
(2.8 percent).
Figure 17 – Currency Composition, 2013-14
(end of year)
The active management of the strategic exposures added 5 basis points to the
excess return, in contrast to an addition of 57 basis points generated by the
cumulative investment in these positions from 2010 to 2013.
31
Following the process of reducing the strategic exposures, the average weight of the strategic
exposures in 2013 was 6.2% of the reserves, compared with 9.7% at the beginning of the year.
Portfolio Numeraire Deviation
USD 65.7 65.7 0.0
EUR 29.0 31.3 -2.3
GBP 3.0 3.0 0.0
NOK 1.2 1.2 2.5
KRW 0.7 0.7
CNH 0.5 0.5
CNY 0.1 0.1
OTHERS -0.2 -0.2
Total 100 100
Strategic
exposures

27
Table 8 – Strategic Exposures Summary, 2010-14
(percentage)
The positive contribution generated by the strategic exposures this year can be
attributed entirely to the asset management, which was slightly offset by a
currency loss. Yield curves in bond markets of the additional countries in which
the reserves were invested were higher than those in the benchmark bond markets,
and they were invested with a higher duration than that of the portfolios in the
numeraire currencies. The assets in these countries therefore yielded a higher
current return in the reserves portfolio, in addition to the capital gains generated
by the declining yields in these markets (Figure 18).
Figure 18 – Two-Year Yields to Maturity of Government Bonds of Various
Countries, 2014 (percentage)
Total Asset
Contribution
Currency
Contribution
0.470.030.442010
0.260.210.052011
0.460.260.22012
-0.620.11-0.732013
0.050.07-0.012014
0.620.68-0.05Total
28
3. CVaR and risk-return measurements
The CVaRp (Conditional Value at Risk) index measures the risk level in terms of
loss expectation in the investment portfolio over a particular time horizon and with
a given probability (p).
It is worth noting that the CVaRp is an ex ante measurement, which is affected by
changes in the holdings of the portfolio and in the volatility of the portfolio’s assets.
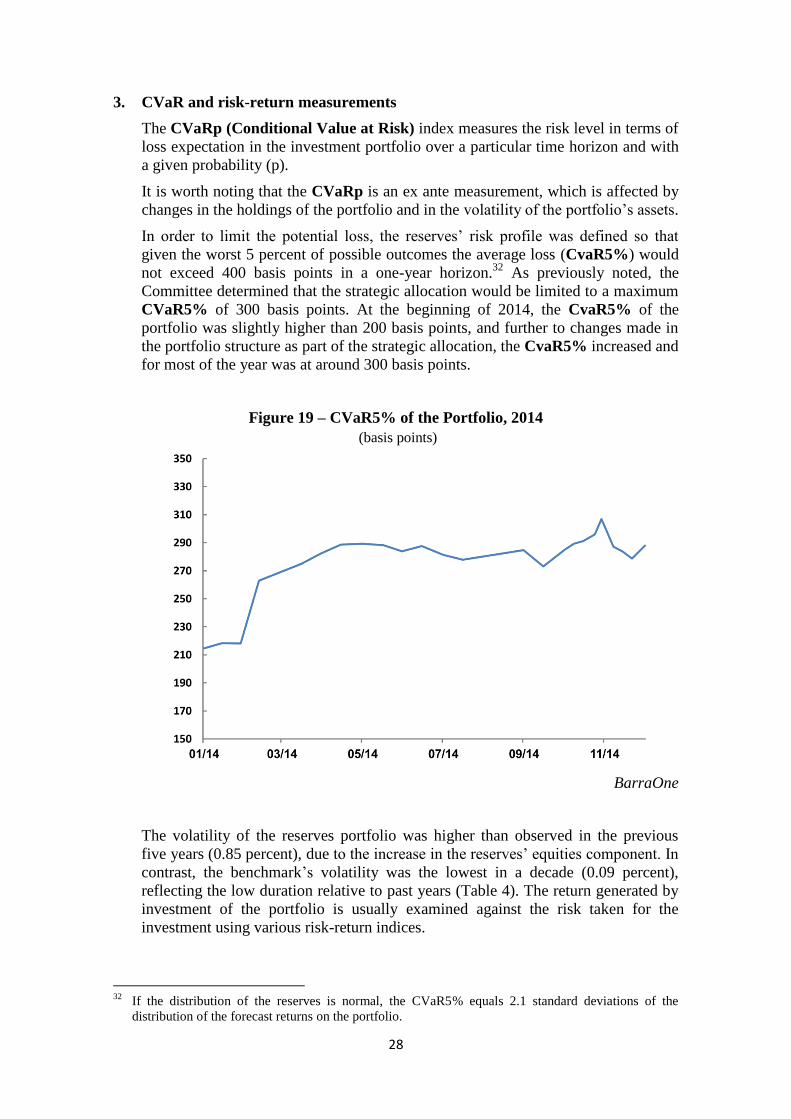
In order to limit the potential loss, the reserves’ risk profile was defined so that
given the worst 5 percent of possible outcomes the average loss (CvaR5%) would
not exceed 400 basis points in a one-year horizon.32
As previously noted, the
Committee determined that the strategic allocation would be limited to a maximum
CVaR5% of 300 basis points. At the beginning of 2014, the CvaR5% of the
portfolio was slightly higher than 200 basis points, and further to changes made in
the portfolio structure as part of the strategic allocation, the CvaR5% increased and
for most of the year was at around 300 basis points.
Figure 19 – CVaR5% of the Portfolio, 2014
(basis points)
BarraOne
The volatility of the reserves portfolio was higher than observed in the previous
five years (0.85 percent), due to the increase in the reserves’ equities component. In
contrast, the benchmark’s volatility was the lowest in a decade (0.09 percent),
reflecting the low duration relative to past years (Table 4). The return generated by
investment of the portfolio is usually examined against the risk taken for the
investment using various risk-return indices.
32
If the distribution of the reserves is normal, the CVaR5% equals 2.1 standard deviations of the
distribution of the forecast returns on the portfolio.

29
The information ratio (IR) is generally used to examine the active management
contribution relative to the risk incurred to achieve it, and is equal to the ratio of the
excess return to its standard deviation. This year, the return on the portfolio was
higher than that of the previous year, and the risk level rose slightly—so that the IR
was slightly higher than the previous year and similar to the average for the past
decade (1.31).
Figure 20 –Ratio of the Active-Management Contribution to its Standard
Deviation (Information Ratio), 2005–14
Risk adjusted return calculated using the Modigliani & Modigliani measure
This measure is used to examine the portfolio’s return, adjusted for the risk of the
portfolio relative to the benchmark against which it is measured. The measure is
obtained by multiplying the portfolio’s Sharpe index by the standard deviation of
the benchmark return plus a risk-free rate.33
A comparison of the risk-adjusted return of the reserves portfolio with the return of
the benchmark against which the portfolio is measured shows that for most of the
last decade, active management of the reserves has been preferable: the portfolio’s
risk-adjusted return was higher than the benchmark return. This means that in most
of the last ten years, the ratio of return to the risk taken in active management was
preferable to the return obtained in passive management.
33 M2 =Rp−Rf
σp∗ σb + Rf
𝑹𝒑 Return of the portfolio; 𝝈𝒑 The standard deviation of the return of the portfolio; 𝝈𝒃 Standard
deviation of the benchmark return; 𝑹𝒇 The risk-free interest rate, calculated by weighting the risk-
free rate on the three numeraire currencies: dollar, euro and pound sterling. Based on the interest rate
on short-term deposits minus the TED spread.

30
Although the risk entailed in management of the portfolio was greater than in the
benchmark (as seen in the high standard deviation of the portfolio compared to the
benchmark), the excess return was greater than the additional risk taken, and
preferable to the return that would have been obtained by passive management
(remaining with the benchmark).
In contrast, this year, as in 2008 and 2011, the ratio shows that the benchmark
achieved a higher return relative to risk than this ratio in the portfolio. Although the
portfolio return was higher than the benchmark return in these years, the portfolio’s
risk-adjusted return was lower than the benchmark return. This finding confirms
that the increased return involved greater risk per unit of return—particularly this
year when the return produced by the benchmark was solid compared with the
minimal amount of risk taken to achieve it.
Figure 21 – Portfolio’s Risk Adjusted Return (Modigliani & Modigliani measure)
against the Benchmark’s Return, 2005-14
31
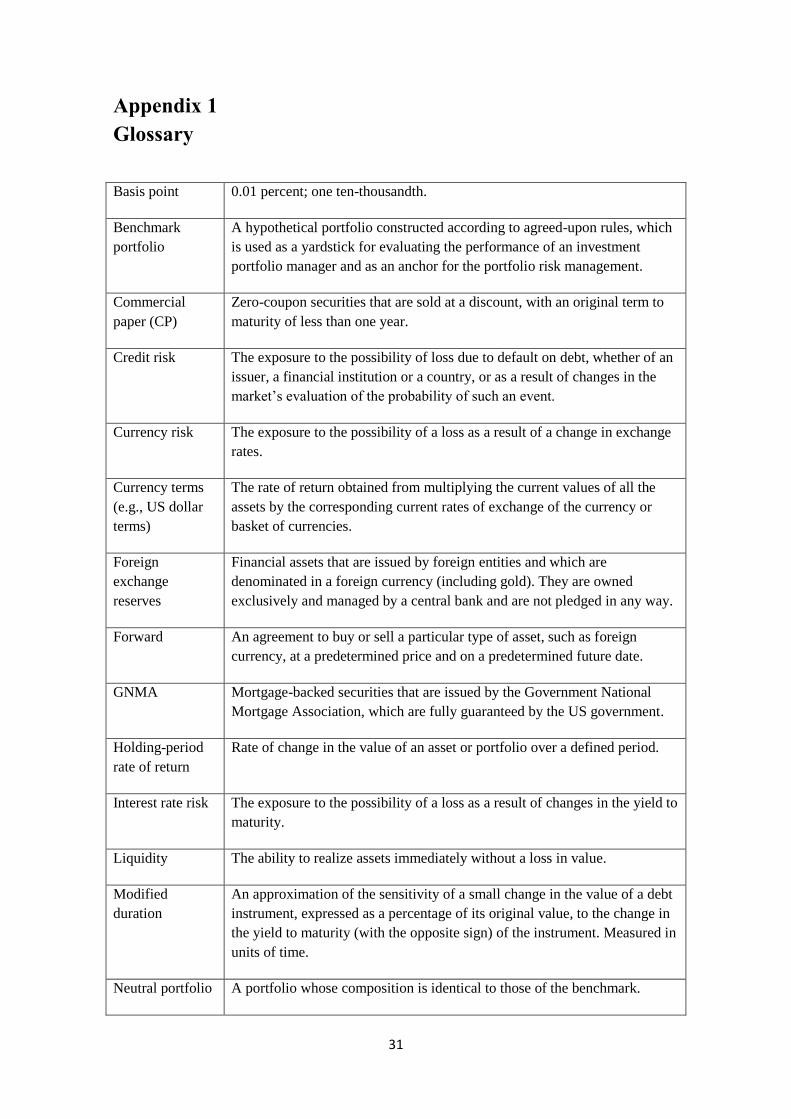
Appendix 1
Glossary
0.01 percent; one ten-thousandth. Basis point
A hypothetical portfolio constructed according to agreed-upon rules, which
is used as a yardstick for evaluating the performance of an investment
portfolio manager and as an anchor for the portfolio risk management.
Benchmark
portfolio
Zero-coupon securities that are sold at a discount, with an original term to
maturity of less than one year.
Commercial
paper (CP)
The exposure to the possibility of loss due to default on debt, whether of an
issuer, a financial institution or a country, or as a result of changes in the
market’s evaluation of the probability of such an event.
Credit risk
The exposure to the possibility of a loss as a result of a change in exchange
rates.
Currency risk
The rate of return obtained from multiplying the current values of all the
assets by the corresponding current rates of exchange of the currency or
basket of currencies.
Currency terms
(e.g., US dollar
terms)
Financial assets that are issued by foreign entities and which are
denominated in a foreign currency (including gold). They are owned
exclusively and managed by a central bank and are not pledged in any way.
Foreign
exchange
reserves
An agreement to buy or sell a particular type of asset, such as foreign
currency, at a predetermined price and on a predetermined future date.
Forward
Mortgage-backed securities that are issued by the Government National
Mortgage Association, which are fully guaranteed by the US government.
GNMA
Rate of change in the value of an asset or portfolio over a defined period. Holding-period
rate of return
The exposure to the possibility of a loss as a result of changes in the yield to
maturity.
Interest rate risk
The ability to realize assets immediately without a loss in value. Liquidity
An approximation of the sensitivity of a small change in the value of a debt
instrument, expressed as a percentage of its original value, to the change in
the yield to maturity (with the opposite sign) of the instrument. Measured in
units of time.
Modified
duration
A portfolio whose composition is identical to those of the benchmark. Neutral portfolio
32
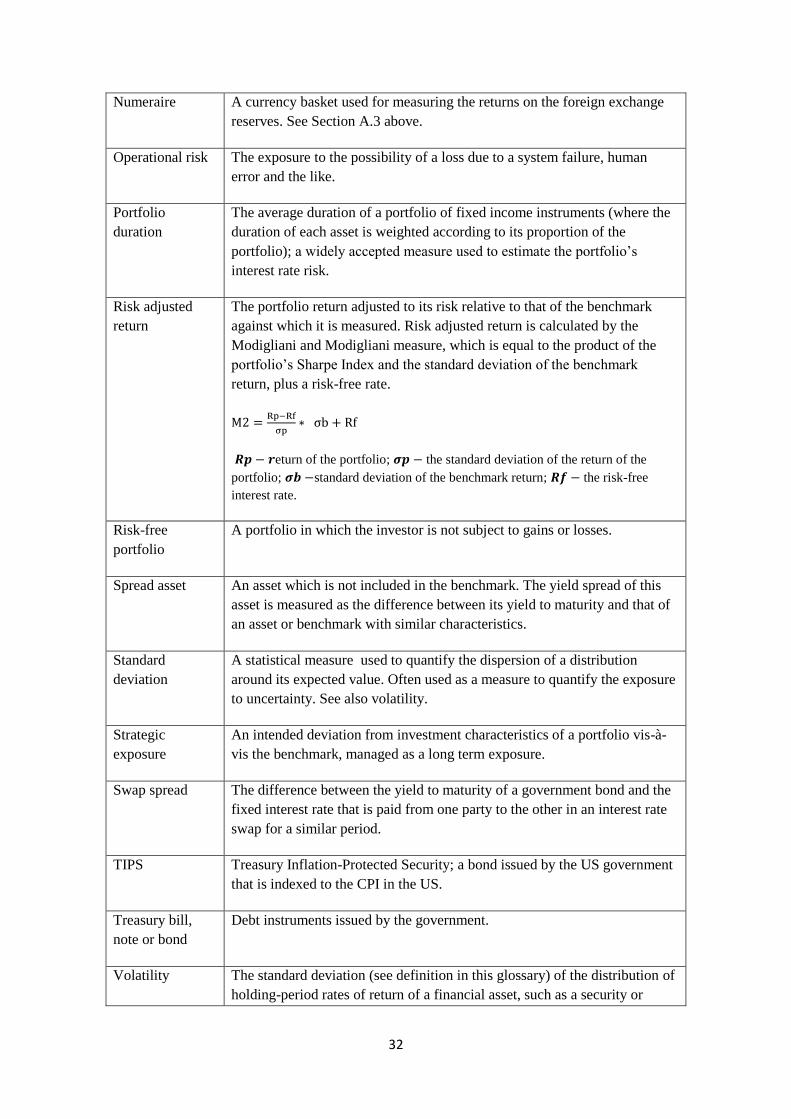
A currency basket used for measuring the returns on the foreign exchange
reserves. See Section A.3 above.
Numeraire
The exposure to the possibility of a loss due to a system failure, human
error and the like.
Operational risk
The average duration of a portfolio of fixed income instruments (where the
duration of each asset is weighted according to its proportion of the
portfolio); a widely accepted measure used to estimate the portfolio’s
interest rate risk.
Portfolio
duration
The portfolio return adjusted to its risk relative to that of the benchmark
against which it is measured. Risk adjusted return is calculated by the
Modigliani and Modigliani measure, which is equal to the product of the
portfolio’s Sharpe Index and the standard deviation of the benchmark
return, plus a risk-free rate.
M2 =Rp−Rf
σp∗ σb + Rf
𝑹𝒑 − 𝒓eturn of the portfolio; 𝝈𝒑 − the standard deviation of the return of the
portfolio; 𝝈𝒃 −standard deviation of the benchmark return; 𝑹𝒇 − the risk-free
interest rate.
Risk adjusted
return
A portfolio in which the investor is not subject to gains or losses. Risk-free
portfolio
An asset which is not included in the benchmark. The yield spread of this
asset is measured as the difference between its yield to maturity and that of
an asset or benchmark with similar characteristics.
Spread asset
A statistical measure used to quantify the dispersion of a distribution
around its expected value. Often used as a measure to quantify the exposure
to uncertainty. See also volatility.
Standard
deviation
An intended deviation from investment characteristics of a portfolio vis-à-
vis the benchmark, managed as a long term exposure.
Strategic
exposure
The difference between the yield to maturity of a government bond and the
fixed interest rate that is paid from one party to the other in an interest rate
swap for a similar period.
Swap spread
Treasury Inflation-Protected Security; a bond issued by the US government
that is indexed to the CPI in the US.
TIPS
Debt instruments issued by the government. Treasury bill,
note or bond
The standard deviation (see definition in this glossary) of the distribution of
holding-period rates of return of a financial asset, such as a security or
Volatility
33
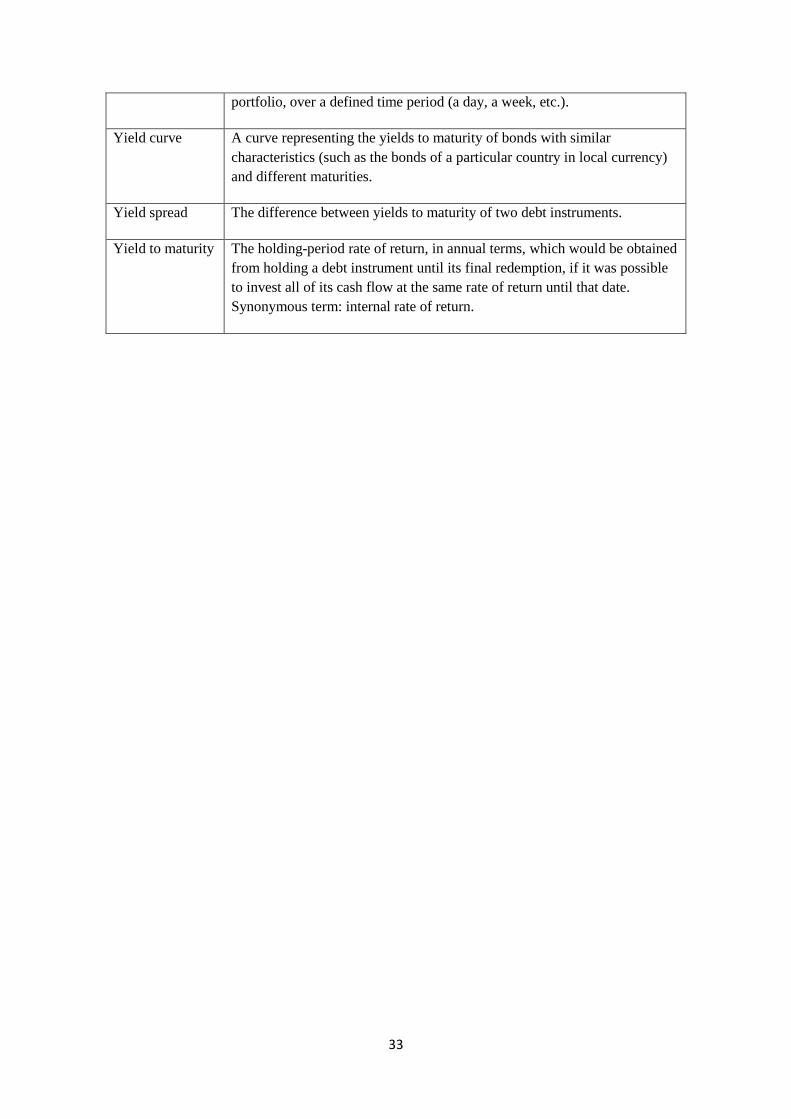
portfolio, over a defined time period (a day, a week, etc.).
A curve representing the yields to maturity of bonds with similar
characteristics (such as the bonds of a particular country in local currency)
and different maturities.
Yield curve
The difference between yields to maturity of two debt instruments. Yield spread
The holding-period rate of return, in annual terms, which would be obtained
from holding a debt instrument until its final redemption, if it was possible
to invest all of its cash flow at the same rate of return until that date.
Synonymous term: internal rate of return.
Yield to maturity
34
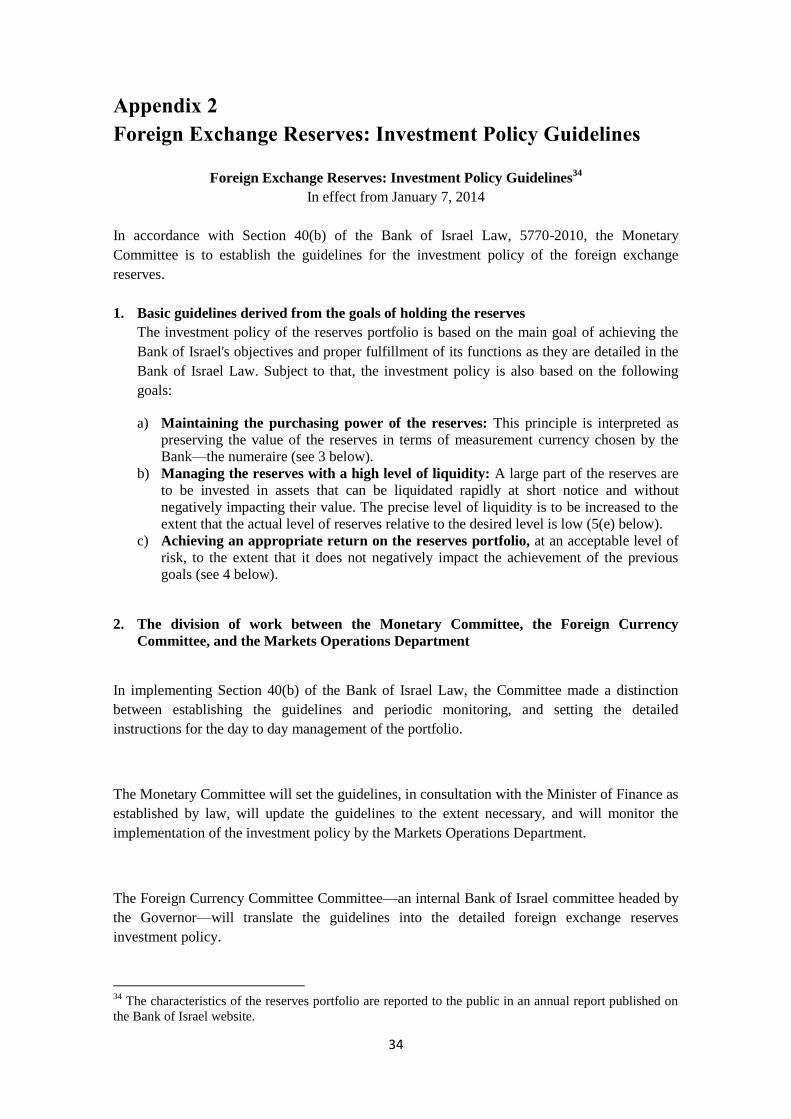
Appendix 2
Foreign Exchange Reserves: Investment Policy Guidelines
Foreign Exchange Reserves: Investment Policy Guidelines34
In effect from January 7, 2014
In accordance with Section 40(b) of the Bank of Israel Law, 5770-2010, the Monetary
Committee is to establish the guidelines for the investment policy of the foreign exchange
reserves.
1. Basic guidelines derived from the goals of holding the reserves
The investment policy of the reserves portfolio is based on the main goal of achieving the
Bank of Israel's objectives and proper fulfillment of its functions as they are detailed in the
Bank of Israel Law. Subject to that, the investment policy is also based on the following
goals:
a) Maintaining the purchasing power of the reserves: This principle is interpreted as
preserving the value of the reserves in terms of measurement currency chosen by the
Bank—the numeraire (see 3 below).
b) Managing the reserves with a high level of liquidity: A large part of the reserves are
to be invested in assets that can be liquidated rapidly at short notice and without
negatively impacting their value. The precise level of liquidity is to be increased to the
extent that the actual level of reserves relative to the desired level is low (5(e) below).
c) Achieving an appropriate return on the reserves portfolio, at an acceptable level of
risk, to the extent that it does not negatively impact the achievement of the previous
goals (see 4 below).
2. The division of work between the Monetary Committee, the Foreign Currency
Committee, and the Markets Operations Department
In implementing Section 40(b) of the Bank of Israel Law, the Committee made a distinction
between establishing the guidelines and periodic monitoring, and setting the detailed
instructions for the day to day management of the portfolio.
The Monetary Committee will set the guidelines, in consultation with the Minister of Finance as
established by law, will update the guidelines to the extent necessary, and will monitor the
implementation of the investment policy by the Markets Operations Department.
The Foreign Currency Committee Committee—an internal Bank of Israel committee headed by
the Governor—will translate the guidelines into the detailed foreign exchange reserves
investment policy.
34
The characteristics of the reserves portfolio are reported to the public in an annual report published on
the Bank of Israel website.

35
The Market Operations Department will implement the investment policy, within the
framework of degrees of freedom which will be set periodically by the Monetary Committee
and the Foreign Currency Committee, and will report to the Monetary Committee and the
Foreign Currency Committee on a quarterly basis on the implementation of the policy:
developments in international markets and their impact on the management of the reserves, the
investment decisions reached by the Department, the portfolio's rate of return, and the financial
and other risks to which the portfolio is exposed.
The Market Operations Department will advise the Monetary Committee and the Foreign
Currency Committee on fulfilling their functions, through position papers and suggestions for
discussion in the Committees.
The Monetary Committee will approve and update periodically the division of authorities
regarding the investment policy of the foreign exchange reserves.
3. The measurement currency for the holding rate of return on the foreign exchange
reserves and the principles for its determination
The measurement currency for the holding rate of return on the reserves—hereinafter, the
numeraire—is a basket of currencies and its composition allocation35
is decided by the
Monetary Committee. The allocation of the numeraire is set according to principles which
reflect the goals of holding the reserves.
The principles according to which the composition of the numeraire is set are:
a) The currency composition of actual imports, and of imports expected in an emergency
situation
b) The composition of the short and medium term external debt
c) Assessments regarding the liquidity of the various currencies in which investment is
possible.
The composition of the numeraire is also examined from the perspective of the currency
composition of foreign exchange reserves portfolios of all central banks of countries that are
IMF members, as reported by the IMF.
35
The numeraire is defined in terms of units of currency (i.e., X dollars, Y euro, and Z pound sterling).
The ratio between the currency units (in the above example, X:Y:Z) is determined by the currency
composition of the portfolio (in the above example, % of dollars in the portfolio, % euro, and % pound
sterling), which is set by the Committee and the exchange rates of the numeraire currencies at the time of
the decision.

36
The composition of the numeraire will be set at the end of each year by the Monetary
Committee, on the basis of the Market Operations Department’s recommendation, in
accordance with changes in domestic and global market conditions. If there are significant
changes in one or more of principles (a)–(c), the composition of the numeraire will be brought
to discussion by the Monetary Committee.
The reserves portfolio holding rate of return is measured in terms of the numeraire, so that the
currency basket which makes up the numeraire is seen by the reserves portfolio managers as a
risk-free currency composition.
4. The risk profile
The risk profile determines the maximum level of risk that the Monetary Committee is willing
to accept in order to achieve the goals of holding the reserves. In establishing the risk profile,
scenario analysis and a range of analytical tools to measure risk, such as VaR, CVaR, and others
should be used. The risk profile is to be set by the Committee on a periodic basis in accordance
with the changing conditions in the global capital markets.
The risk profile will be set so that given the worst 5 percent of outcomes, the average loss will
not be greater than 400 basis points over a 1-year horizon.
5. The rules for managing the financial risks of the reserves
The rules for managing the financial risks to which the reserves are exposed, and their asset
allocation, are to be set in accordance with the goals of the investment policy of the reserves
(Section 1 above) and subject to the risk profile set by the Monetary Committee (Section 4). The
asset allocation of the foreign exchange reserves will be approved at least once a year by the
Monetary Committee.
a) The types of assets approved for use in managing the reserves are:
1. Bonds (including bonds with fixed interest, with variable interest, and CPI-indexed
bonds)
2. Mortgage-backed securities (MBS) and asset-backed securities (ABS), a maximum of
6% of total reserves
3. Tradable Certificates of Deposit (CDs)
4. Fixed term deposits
5. Commercial Paper (CP)
6. Equities, a maximum of 12% of total reserves
7. Derivatives whose underlying asset is permitted for investment.
37
b) Management against a benchmark
Control over most features of the financial risk of the reserves is anchored in their
management against a system of benchmarks. The rules for managing the financial risks of
the reserves generate the currency allocation of the benchmarks, the features of their price
risk (such as duration) in each currency, and the asset types included in it. The investment
returns of the portfolio managers are measured against these benchmarks.
c) Currency risk:
The currency exposure of the reserves is set by:
1) The composition of the numeraire.
2) Strategic currency positions relative to the composition of the numeraire: The extent of the
strategic currency positions is limited to 10 percent of total reserves. The composition and
amounts of the positions will be set by the Monetary Committee.
3) Short and medium term currency positions relative to the composition of the numeraire:
Their amount is limited to 2 percent of the total reserves. The composition and amounts of
the positions will be set by the Market Operations Department.
d) Credit risk:
In order to limit the credit risk inherent in day-to-day management of the reserves portfolio,
the Monetary Committee set the following rules:
1. Investment is permitted in the currency of countries for which their major credit rating
category is at least A. Investment in countries for which their credit rating group is BBB
requires the specific authorization of the Monetary Committee.
2. Investment in bonds and commercial paper issued by governments, or with government
guarantees, is permitted if their major rating category is at least BBB. Investment in the
BBB major rating category is limited to 1 percent of total reserves. Investment in such
assets, if their major credit rating category is BBB, requires the specific authorization of the
Monetary Committee.
3. Investment in bonds of public sector entities (PSE) is limited to a maximum of 15 percent of
total reserves, and only in bonds those whose major credit rating category is at least A.
Investment in such assets, if their major credit rating category group is below AA, is limited
to 1 percent of total reserves.
4. Investment in corporate bonds is limited to 6 percent of total reserves, and only in bonds
whose major credit rating category is at least BBB.
38
5. Investment in bonds and deposits of international financial institutions is limited to 15
percent of the reserves.
6. The exposure of the reserves to the international banking system should not be greater than
10 percent of total reserves, and that is only to banks whose major credit rating category is
at least A. Activity with banks and brokers whose major credit rating category is BBB is
limited to DVP36
(delivery versus payment) alone.
e) Liquidity risk:
In order to provide an immediate response to the financial problems which arise during
emergencies, a large portion of the reserves should be invested in assets that can be
liquidated in large amounts at short notice and without negatively impacting their
realization value.
The assets in which the reserves are invested are classified into 3 levels of liquidity:
1. Assets that can be realized within a week without negatively impacting their realization
value.
2. Assets that can be realized within a month without negatively impacting their
realization value.
3. Assets that can be realized within six months without negatively impacting their
realization value.
There is a minimum level of investment in the two highest liquidity levels, and there is a
maximum threshold for the third level. Classification into the various liquidity levels can
change due to changes in market conditions. In order to meet the liquidity demands, the
Committee established that at least 45 percent of the total reserves are to be invested in
government bonds.
f) Active management and compliance rules:
The reserves portfolio is actively managed within the framework of limited and well defined
degrees of freedom, as long as the investment policy adheres to the guidelines.
6. The nonfinancial risks inherent in managing the reserves
In determining the investment policy for the reserves, there must be taken into account the
exposure of the Bank and of the portfolio to the various nonfinancial risks inherent in investing
the reserves—reputation risk, legal risk, political risk, operational risk, and so forth.
7. Measuring returns and reporting them
The reserves are managed with transparency. The Market Operations Department shall report
periodically to the Monetary Committee (see 2 above) on the amount of the reserves and
36
DVP activity is when the payment and the asset are transferred between the sides at the same time and
thus the credit risk in such activity is essentially zero.
39
changes in them, the currency composition, changes in currency positions, the asset allocation,
portfolio duration, country exposure, credit risk, liquidity risk, and the return on the portfolio
and its various components. The report should include an analysis of the current developments
in the financial markets and their effect on the management of the reserves.
40
Appendix 3
Principles for Determining the Desired Level of Foreign Exchange
Reserves
1. The appropriate level of foreign exchange reserves as an indicator of the economic
strength of the country
Countries hold foreign exchange reserves for three main purposes:
A. To enable the central bank to intervene in the foreign exchange market in circumstances
in which (1) the exchange rate deviates from the range that is consistent with the economy’s
fundamental equilibrium; or (2) the foreign exchange market is not functioning adequately
(market failure);
B. To enable the central bank to operate in the foreign exchange market in order to
moderate the effect of large capital flows from either foreign or local residents, which are liable
to undermine the stability of the financial markets, and thus negatively impact the stability of
the economy as a whole (a specific case of A);
C. To allow for the provision of sufficient foreign currency to the economy in an
emergency situation (such as a war or a strong earthquake). In such circumstances, there will be
a need to increase imports rapidly and by a significant amount in order to deal with the
emergency, while exports may also be adversely affected and therefore this source of foreign
currency will also be reduced. Under such circumstances, the government and the private sector
will find it difficult to raise foreign currency abroad and the foreign exchange reserves will be
left as the country's main source for financing in foreign currency.
Therefore, holding an appropriate level of foreign exchange reserves is considered by local and
foreign financial institutions, companies, households and rating agencies as a main indicator of
a country’s economic resilience. The larger a country’s foreign exchange reserves are, the
greater the ability of policy makers to deal with unavoidable economic and political pressures.
Furthermore, large foreign exchange reserves tend to reduce the rates of interest paid both by
the government and by the private sector for financing from abroad. In short, in the eyes of the
financial markets and of individuals, foreign exchange reserves at an appropriate level make an
important contribution to the confidence in a country’s ability to deal with economic, financial
and political shocks to the economy.
2. There are various approaches to the calculation of the appropriate level of foreign
exchange reserves:
a. Relative to import months: For most of the post-World War II period, the
appropriate level of foreign exchange reserves was measured in terms of "import
months"—the number of months of imports that the reserves would be able to
finance. This approach dominated as long as international capital flows were

41
limited, and the main source of difficulties in foreign exchange was the current
account of the balance of payments.
b. Relative to capital flows: During the 1990s, it became clear that many financial
crises were caused by large-scale capital flows, that is, disruptions in the capital
account, rather than by disruptions in the current account of the balance of
payments. At the end of the 1990s, wide use was made of the Greenspan-Guidotti
rule, according to which a country's foreign exchange reserves should be at least as
much as the country’s foreign currency liabilities (of both the public and private
sectors) during the coming twelve- month period, thus allowing a country to deal
with a complete cutoff from sources of foreign currency for a period of one year.
The 100 percent rule (according to which the reserves must be equal to the full
amount of foreign currency liabilities for one year) was based on an empirical
study—how countries survived the financial crises of the 1990s and early 2000s: it
was found that countries which operated according to the 100 percent rule were
prone to fewer foreign currency attacks, and were better able to deal with them.
During the global crisis which began in 2007 it became clear that countries which
held foreign exchange reserves exceeding 100 percent were better able to deal with
the crisis. The main examples are Brazil, Russia, and South Korea. Each of those
countries held foreign exchange reserves that exceeded 100 percent of their foreign
exchange liabilities, and they used them effectively to stabilize the exchange rate
and/or to maintain financial stability. It is currently recognized that foreign
exchange reserves of between 100 percent and 200 percent of an economy's foreign
currency liabilities are more effective than a reserves level which meets the
Greenspan-Guidotti rule precisely.
c. Relative to potential uses in the future (the eclectic approach): In calculating the
appropriate level of foreign exchange reserves for Israel, the Bank of Israel adopted
the eclectic approach, which is based on the potential uses of the reserves in an
emergency. Clearly, in a time of national emergency, Israel will likely require
reserves, both to finance imports (according to the import months approach,
including imports of goods and services related to the emergency situation) as well
as to deal with capital flows – payments of existing debts to foreign residents, with
potential capital flows.
Based on the range of factors listed above and in accordance with the current conditions
in Israel's economy, the Governor revised the desired level of reserves to a range of
$70–110 billion.37
Additionally, in setting the level of foreign exchange reserves, the cost of holding the
reserves38
was taken into account. However, in terms of a risk-reward analysis of
holding the reserves, it is difficult to measure quantitatively the advantages and benefits
of holding them. The contribution of the reserves to the economy cannot be quantified
and priced, among other reasons because their contribution may be critical in
emergency situations whose nature and severity are difficult to predict.
37
The Governor updated the range in the beginning of 2015 from the range of $65–90 billion that was set
in 2010, and which had remained unchanged since then. The increase in the range of the desired level of
reserves is consistent with the changes that occurred in the Israeli economy over the past 5 years. 38
The accounting cost of the Bank of Israel's activity is recorded in the Bank's general ledger. At the
same time, the Bank's accounts do not include the expected profit (in terms of stability of the economy)
derived from the expected use of the reserves in various situations in the future, nor that derived from
market assessments that larger reserves contribute to the economy, as described above.
42
3. Israel's actual level of foreign exchange reserves
Implementing the eclectic approach, which takes into account both the need to import goods and
services as well as the potential capital flows related to a crisis situation, must take into account
Israel's unique geopolitical situation, which requires a higher level of reserves relative to
economic variables which are generally taken into account when calculating the appropriate
level of foreign exchange reserves.39
4. Intervention in the foreign exchange market and the appropriate level
It is important to note that, as explained in Section 53 of the Bank of Israel Law, the
intervention of the Bank of Israel in the foreign exchange market, in order to fulfill its functions
and attain its objectives, may lead to a deviation in the actual level of the reserves from their
desirable level. Government and banking system activity can also lead to such a deviation. In
general, the Bank will act to change the level of the reserves only when the deviation is
significant and prolonged, and only if such action is in line with attaining the Bank's objectives
as established in the Bank of Israel Law, which include maintaining price stability, supporting
other economic policy goals, and supporting the stability of the financial system. Thus, the
foreign currency reserves could deviate from the desired level for extended periods of time.
39
For a discussion on the ratios of the actual reserves to economic variables and a comparison with other
countries, please see Chapter A, part 5, sections B and C of this report.
![Chinese Foreign Exchange Reserves, Policy Choices, and the ... · Chinese Foreign Exchange Reserves, Policy Choices, and the U.S. Economy Christopher J. Neely “It [2008] was a time](https://static.fdocuments.in/doc/165x107/5e160893bd809f26f974029d/chinese-foreign-exchange-reserves-policy-choices-and-the-chinese-foreign-exchange.jpg)