
INVESTMENT MANAGEMENT Morgan Stanley Focus ... in portfolio of common stocks (including depositary...
40
Trustees Frank L. Bowman Michael Bozic Kathleen A. Dennis James F. Higgins Dr. Manuel H. Johnson Joseph J. Kearns Michael F. Klein Michael E. Nugent W. Allen Reed Fergus Reid Officers Michael E. Nugent Chairperson of the Board Arthur Lev President and Principal Executive Officer Mary Ann Picciotto Chief Compliance Officer Stefanie V. Chang Yu Vice President Francis J. Smith Treasurer and Principal Financial Officer Mary E. Mullin Secretary Transfer Agent Boston Financial Data Services, Inc. 2000 Crown Colony Drive Quincy, Massachusetts 02169 Custodian State Street Bank and Trust Company One Lincoln Street Boston, Massachusetts 02111 Independent Registered Public Accounting Firm Ernst & Young LLP 200 Clarendon Street Boston, Massachusetts 02116 Legal Counsel Dechert LLP 1095 Avenue of the Americas New York, New York 10036 Counsel to the Independent Trustees Kramer Levin Naftalis & Frankel LLP 1177 Avenue of the Americas New York, New York 10036 Adviser Morgan Stanley Investment Management Inc. 522 Fifth Avenue New York, New York 10036 The financial statements included herein have been taken from the records of the Fund without examination by the independent auditors and accordingly they do not express an opinion thereon. This report is submitted for the general information of the shareholders of the Fund. For more detailed information about the Fund, its fees and expenses and other pertinent information, please read its Prospectus. The Fund’s Statement of Additional Information contains additional information about the Fund, including its trustees. It is available, without charge, by calling (800) 869-NEWS. This report is not authorized for distribution to prospective investors in the Fund unless preceded or accompanied by an effective Prospectus. Please read the Prospectus carefully before investing. Morgan Stanley Distribution, Inc., member FINRA. © 2013 Morgan Stanley AMOSAN 705303 EXP [08/31/14] INVESTMENT MANAGEMENT Morgan Stanley Focus Growth Fund Semiannual Report June 30, 2013
Transcript of INVESTMENT MANAGEMENT Morgan Stanley Focus ... in portfolio of common stocks (including depositary...

TrusteesFrank L. BowmanMichael BozicKathleen A. DennisJames F. HigginsDr. Manuel H. JohnsonJoseph J. KearnsMichael F. KleinMichael E. NugentW. Allen ReedFergus ReidOfficersMichael E. NugentChairperson of the BoardArthur LevPresident and Principal Executive OfficerMary Ann PicciottoChief Compliance OfficerStefanie V. Chang YuVice PresidentFrancis J. SmithTreasurer and Principal Financial OfficerMary E. MullinSecretaryTransfer AgentBoston Financial Data Services, Inc.2000 Crown Colony DriveQuincy, Massachusetts 02169CustodianState Street Bank and Trust CompanyOne Lincoln StreetBoston, Massachusetts 02111Independent Registered Public Accounting FirmErnst & Young LLP200 Clarendon StreetBoston, Massachusetts 02116Legal CounselDechert LLP1095 Avenue of the AmericasNew York, New York 10036Counsel to the Independent TrusteesKramer Levin Naftalis & Frankel LLP1177 Avenue of the AmericasNew York, New York 10036AdviserMorgan Stanley Investment Management Inc.522 Fifth AvenueNew York, New York 10036
The financial statements included herein have been taken from the recordsof the Fund without examination by the independent auditors and accordinglythey do not express an opinion thereon.
This report is submitted for the general information of the shareholders ofthe Fund. For more detailed information about the Fund, its fees andexpenses and other pertinent information, please read its Prospectus. TheFund’s Statement of Additional Information contains additional informationabout the Fund, including its trustees. It is available, without charge, bycalling (800) 869-NEWS.
This report is not authorized for distribution to prospective investors in theFund unless preceded or accompanied by an effective Prospectus. Pleaseread the Prospectus carefully before investing.
Morgan Stanley Distribution, Inc., member FINRA.
© 2013 Morgan Stanley
AMO
SAN705303
EXP[08/31/14]
INVESTMENT MANAGEMENT
Morgan StanleyFocus Growth Fund
SemiannualReportJune 30, 2013

Morgan Stanley Focus Growth FundTable of Contents
Welcome Shareholder . . . . . . . . . . . . . . . . . . . . . . . . . . . . . . . . . . . . . . . . . . . . . . . . . . . . . . . . . . . . . . . . . . . . . . . . . . . . . . . . . . . . . 3Fund Report . . . . . . . . . . . . . . . . . . . . . . . . . . . . . . . . . . . . . . . . . . . . . . . . . . . . . . . . . . . . . . . . . . . . . . . . . . . . . . . . . . . . . . . . . . . . . . 4Performance Summary . . . . . . . . . . . . . . . . . . . . . . . . . . . . . . . . . . . . . . . . . . . . . . . . . . . . . . . . . . . . . . . . . . . . . . . . . . . . . . . . . . . . 7Expense Example . . . . . . . . . . . . . . . . . . . . . . . . . . . . . . . . . . . . . . . . . . . . . . . . . . . . . . . . . . . . . . . . . . . . . . . . . . . . . . . . . . . . . . . . . 8Investment Advisory Agreement Approval . . . . . . . . . . . . . . . . . . . . . . . . . . . . . . . . . . . . . . . . . . . . . . . . . . . . . . . . . . . . . . . . . 9Portfolio of Investments . . . . . . . . . . . . . . . . . . . . . . . . . . . . . . . . . . . . . . . . . . . . . . . . . . . . . . . . . . . . . . . . . . . . . . . . . . . . . . . . . . . 12Statement of Assets and Liabilities . . . . . . . . . . . . . . . . . . . . . . . . . . . . . . . . . . . . . . . . . . . . . . . . . . . . . . . . . . . . . . . . . . . . . . . . . 14Statement of Operations . . . . . . . . . . . . . . . . . . . . . . . . . . . . . . . . . . . . . . . . . . . . . . . . . . . . . . . . . . . . . . . . . . . . . . . . . . . . . . . . . . 15Statements of Changes in Net Assets . . . . . . . . . . . . . . . . . . . . . . . . . . . . . . . . . . . . . . . . . . . . . . . . . . . . . . . . . . . . . . . . . . . . . . . 16Notes to Financial Statements . . . . . . . . . . . . . . . . . . . . . . . . . . . . . . . . . . . . . . . . . . . . . . . . . . . . . . . . . . . . . . . . . . . . . . . . . . . . . 17Financial Highlights . . . . . . . . . . . . . . . . . . . . . . . . . . . . . . . . . . . . . . . . . . . . . . . . . . . . . . . . . . . . . . . . . . . . . . . . . . . . . . . . . . . . . . 29U.S. Privacy Policy . . . . . . . . . . . . . . . . . . . . . . . . . . . . . . . . . . . . . . . . . . . . . . . . . . . . . . . . . . . . . . . . . . . . . . . . . . . . . . . . . . . . . . . . 33
2

Welcome Shareholder,
We are pleased to provide this semiannual report, in which you will learn how your investment in MorganStanley Focus Growth Fund performed during the latest six-month period. It includes an overview of themarket conditions and discusses some of the factors that affected performance during the reporting period.In addition, the report contains financial statements and a list of portfolio holdings.
Morgan Stanley Investment Management is a client-centric, investor-led organization. Our globalpresence, intellectual capital, and breadth of products and services enable us to partner with investors tomeet the evolving challenges of today’s financial markets. We aim to deliver superior investment serviceand to empower our clients to make the informed decisions that help them reach their investment goals.
As always, we thank you for selecting Morgan Stanley Investment Management, and look forward toworking with you in the months and years ahead.
This material must be preceded or accompanied by a prospectus for the fund being offered.
Market forecasts provided in this report may not necessarily come to pass. There is no assurance thatthe Fund will achieve its investment objective. The Fund is subject to market risk, which is thepossibility that market values of securities owned by the Fund will decline and, therefore, the value ofthe Fund’s shares may be less than what you paid for them. Accordingly, you can lose money investingin this Fund. Please see the prospectus for more complete information on investment risks.
3

Fund Report (unaudited)
For the six months ended June 30, 2013
Total Return for the 6 Months Ended June 30, 2013
Class A Class B
Class L(Formerly
Class C) Class I
Russell1000®
GrowthIndex1
LipperLarge-Cap
GrowthFundsIndex2
12.41% 11.98% 12.10% 12.55% 11.80% 10.18%
The performance of the Fund’s four share classesvaries because each has different expenses. TheFund’s total returns assume the reinvestment of alldistributions but do not reflect the deduction of anyapplicable sales charges. Such costs would lowerperformance. See Performance Summary forstandardized performance and benchmarkinformation.
Market ConditionsModest growth in the U.S. economy and a backdrop ofaccommodative monetary policy drove the stockmarket to positive returns for the six-month periodended June 30, 2013. Concerns about the effects ofautomatic federal spending cuts (known assequestration) and higher payroll taxes, flare ups inthe European debt crisis, and slackening growth inChina contributed to market volatility throughout theperiod. Nevertheless, stock prices trended higheroverall as investors continued to believe the FederalReserve (the Fed) and other central banks around theworld would continue providing ample liquidity throughinterest rate cuts and asset purchase programs.Although the Dow Jones Industrial Average andS&P 500® Index, two of the most commonly citedmeasures of the U.S. stock market, reached newhighs in May, the market pulled back in June after theFed announced its intention to scale back stimulus inthe second half of the year.
Performance AnalysisAll share classes of Morgan Stanley Focus GrowthFund outperformed the Russell 1000® Growth Index(the “Index”) and the Lipper Large-Cap Growth FundsIndex for the six months ended June 30, 2013,assuming no deduction of applicable sales charges.
The consumer discretionary sector was the largestcontributor to relative performance during the period.Stock selection was the primary driver of the sector’soutperformance, with gains led by a holding in anelectric car and components manufacturer. Stockselection in the energy sector was advantageous.Within the sector, a holding in a solar panel makercontributed the most to performance. An overweightto the financial services sector was beneficial toreturns, as was stock selection to a lesser degree. Acredit card company was the most additive holding inthe sector.
Conversely, the producer durables sector had adetrimental effect on relative performance. Althoughthe portfolio’s holdings in the sector did not actuallydetract from performance, relative performance washampered by a lack of exposure to some of the better-performing producer durables stocks. An underweightto the health care sector, which was moderately offsetby relative gains from stock selection, hurtperformance as well. No exposure to the utilitiessector further diminished relative returns.
There is no guarantee that any sectors mentioned willcontinue to perform as discussed herein or thatsecurities in such sectors will be held by the Fund inthe future.
4

TOP 10 HOLDINGS as of 06/30/13
Amazon.com, Inc. 9.6%
Google, Inc., Class A 8.8
Facebook, Inc., Class A 6.3
Priceline.com, Inc. 4.4
Visa, Inc., Class A 4.2
Motorola Solutions, Inc. 4.1
Illumina, Inc. 4.0
Mastercard, Inc., Class A 3.9
Monsanto Co. 3.5
Edenred (France) 3.4
TOP FIVE INDUSTRIES as of 06/30/13
Computer Services, Software & Systems 21.4%
Diversified Retail 16.5
Consumer Lending 8.1
Pharmaceuticals 5.8
Textiles Apparel & Shoes 5.3
Subject to change daily. Provided for informational purposes only andshould not be deemed as a recommendation to buy or sell thesecurities mentioned above. Top 10 holdings and top five industriesare as a percentage of net assets.
Morgan Stanley is a full-service securities firm engaged in securitiestrading and brokerage activities, investment banking, research andanalysis, financing and financial advisory services.
Investment StrategyThe Fund normally invests at least 65 percent of itsassets in portfolio of common stocks (includingdepositary receipts). The Fund’s “Adviser,” MorganStanley Investment Management Inc., emphasizes abottom-up stock selection process, seeking attractiveinvestments on an individual company basis. Inselecting securities for investment, the Adviser seeksto invest primarily in established and emerging highquality companies it believes have sustainablecompetitive advantages and the ability to redeploycapital at high rates of return. The Adviser typicallyfavors companies with rising returns on investedcapital, above average business visibility, strong freecash flow generation and an attractive risk/reward.
For More InformationAbout Portfolio HoldingsEach Morgan Stanley fund provides a complete scheduleof portfolio holdings in its semiannual and annual reportswithin 60 days of the end of the fund’s second and fourthfiscal quarters. The semiannual reports and the annualreports are filed electronically with the Securities andExchange Commission (SEC) on Form N-CSRS and FormN-CSR, respectively. Morgan Stanley also delivers thesemiannual and annual reports to fund shareholders andmakes these reports available on its public web site,www.morganstanley.com. Each Morgan Stanley fund alsofiles a complete schedule of portfolio holdings with theSEC for the fund’s first and third fiscal quarters on FormN-Q. Morgan Stanley does not deliver the reports for thefirst and third fiscal quarters to shareholders, nor are thereports posted to the Morgan Stanley public web site. Youmay, however, obtain the Form N-Q filings (as well as theForm N-CSR and N-CSRS filings) by accessing the SEC’sweb site, http://www.sec.gov. You may also review andcopy them at the SEC’s public reference room inWashington, DC. Information on the operation of the
5

SEC’s public reference room may be obtained by callingthe SEC at (800) SEC-0330. You can also request copiesof these materials, upon payment of a duplicating fee, byelectronic request at the SEC’s e-mail address([email protected]) or by writing the public referencesection of the SEC, Washington, DC 20549-1520.
Proxy Voting Policy and Procedures andProxy Voting RecordYou may obtain a copy of the Fund’s Proxy VotingPolicy and Procedures without charge, upon request,by calling toll free (800) 869-NEWS or by visiting theMutual Fund Center on our web site atwww.morganstanley.com. It is also available on theSEC’s web site at http://www.sec.gov.
You may obtain information regarding how the Fundvoted proxies relating to portfolio securities during themost recent twelve-month period ended June 30without charge by visiting the Mutual Fund Center onour web site at www.morganstanley.com. Thisinformation is also available on the SEC’s web site athttp://www.sec.gov.
Householding NoticeTo reduce printing and mailing costs, the Fundattempts to eliminate duplicate mailings to the sameaddress. The Fund delivers a single copy of certainshareholder documents, including shareholder reports,prospectuses and proxy materials, to investors with thesame last name who reside at the same address. Yourparticipation in this program will continue for anunlimited period of time unless you instruct usotherwise. You can request multiple copies of thesedocuments by calling (800) 869-NEWS, 8:00 a.m. to8:00 p.m., ET. Once our Customer Service Center hasreceived your instructions, we will begin sendingindividual copies for each account within 30 days.
6

Performance Summary (unaudited)
Average Annual Total Returns — Period Ended June 30, 2013
Class A Shares*(since 07/28/97)
Class B Shares**(since 03/27/80)
Class L Shares†
(since 07/28/97)Class I Shares††
(since 07/28/97)
Symbol AMOAX AMOBX AMOCX AMODX
1 Year 16.14%3 15.26%3 15.38%3 16.43%3
10.02 4 10.26 4 15.38 4 —
5 Years 6.45 3 5.64 3 5.67 3 6.71 3
5.30 4 5.32 4 5.67 4 —
10 Years 7.88 3 7.23 3 7.09 3 8.15 3
7.30 4 7.23 4 7.09 4 —
Since Inception 5.78 3 10.40 3 4.98 3 6.03 3
5.42 4 10.40 4 4.98 4 —
Gross Expense Ratio 0.96 1.71 1.46 0.71
Performance data quoted represents past performance, which is no guarantee of future results and current performance may be loweror higher than the figures shown. For most recent month-end performance figures, please visit www.morganstanley.com/im or speak withyour Financial Advisor. Investment returns and principal value will fluctuate and fund shares, when redeemed, may be worth more or lessthan their original cost. The table does not reflect the deduction of taxes that a shareholder would pay on fund distributions or theredemption of fund shares. Performance for Class A, Class B, Class L, and Class I shares will vary due to differences in sales chargesand expenses. See the Fund’s current prospectus for complete details on fees and sales charges. Expenses are as of each Fund’s fiscalyear end as outlined in the Fund’s current prospectus.
* The maximum front-end sales charge for Class A is 5.25%.** The maximum contingent deferred sales charge (CDSC) for Class B is 5.0%. The CDSC declines to 0% after six years. Effective April
2005, Class B shares will generally convert to Class A shares approximately eight years after the end of the calendar month in whichthe shares were purchased. Performance for periods greater than eight years reflects this conversion (beginning April 2005).
† Effective February 25, 2013, Class C shares were renamed Class L shares. Class C shares held for less than one year were subjectto a 1.0% CDSC. The CDSC on Class L shares was eliminated effective February 25, 2013.
†† Class I has no sales charge.(1) The Russell 1000® Growth Index measures the performance of the large-cap growth segment of the U.S. equity universe. It includes
those Russell 1000® Index companies with higher price-to-book ratios and higher forecasted growth values. The Russell 1000®
Index is an index of approximately 1,000 of the largest U.S. companies based on a combination of market capitalization and currentindex membership. The Index is unmanaged and its returns do not include any sales charges or fees. Such costs would lowerperformance. It is not possible to invest directly in an index.
(2) The Lipper Large-Cap Growth Funds Index is an equally weighted performance index of the largest qualifying funds (based on netassets) in the Lipper Large-Cap Growth Funds classification. The Index, which is adjusted for capital gains distributions and incomedividends, is unmanaged and should not be considered an investment. There are currently 30 funds represented in this Index. TheFund was in the Lipper Large-Cap Growth Funds classification as of the date of this report.
(3) Figure shown assumes reinvestment of all distributions and does not reflect the deduction of any sales charges.(4) Figure shown assumes reinvestment of all distributions and the deduction of the maximum applicable sales charge. See the Fund’s
current prospectus for complete details on fees and sales charges.
7

Expense Example (unaudited)
As a shareholder of the Fund, you incur two types of costs: (1) transaction costs, including sales charges(loads) on purchase payments and (2) ongoing costs, including advisory fees, administration fees; distributionand service (12b-1) fees; and other Fund expenses. This example is intended to help you understand yourongoing costs (in dollars) of investing in the Fund and to compare these costs with the ongoing costs ofinvesting in other mutual funds.
This example is based on an investment of $1,000 invested at the beginning of the period and held for theentire period 01/01/13 – 06/30/13.
Actual ExpensesThe first line of the table below provides information about actual account values and actual expenses. Youmay use the information in this line, together with the amount you invested, to estimate the expenses that youpaid over the period. Simply divide your account value by $1,000 (for example, an $8,600 account valuedivided by $1,000 = 8.6), then multiply the result by the number in the first line under the heading entitled“Expenses Paid During Period” to estimate the expenses you paid on your account during this period.
Hypothetical Example for Comparison PurposesThe second line of the table below provides information about hypothetical expenses based on the Fund’sactual expense ratio and an assumed rate of return of 5% per year before expenses, which is not the Fund’sactual return. The hypothetical account values and expenses may not be used to estimate the actual endingaccount balance or expenses you paid for the period. You may use this information to compare the ongoingcost of investing in the Fund and other funds. To do so, compare this 5% hypothetical example with the 5%hypothetical examples that appear in the shareholder reports of the other funds.
Please note that the expenses shown in the table are meant to highlight your ongoing costs only and do notreflect any transactional costs, such as sales charges (loads). Therefore, the second line of the table is usefulin comparing ongoing costs, and will not help you determine the relative total cost of owning different funds.In addition, if these transactional costs were included, your costs would have been higher.
BeginningAccount Value
EndingAccount Value
Expenses PaidDuring Period@
01/01/13 06/30/1301/01/13 –06/30/13
Class AActual (12.41% return) . . . . . . . . . . . . . . . . . . . . . . . . . . . . . . . . . . . . . . . . . . . . . . . . $1,000.00 $1,124.10 $5.06Hypothetical (5% annual return before expenses) . . . . . . . . . . . . . . . . . . . . . . . $1,000.00 $1,020.03 $4.81Class BActual (11.98% return) . . . . . . . . . . . . . . . . . . . . . . . . . . . . . . . . . . . . . . . . . . . . . . . . $1,000.00 $1,119.80 $8.99Hypothetical (5% annual return before expenses) . . . . . . . . . . . . . . . . . . . . . . . $1,000.00 $1,016.31 $8.55Class L@@Actual (12.10% return) . . . . . . . . . . . . . . . . . . . . . . . . . . . . . . . . . . . . . . . . . . . . . . . . $1,000.00 $1,121.00 $8.05Hypothetical (5% annual return before expenses) . . . . . . . . . . . . . . . . . . . . . . . $1,000.00 $1,017.21 $7.65Class IActual (12.55% return) . . . . . . . . . . . . . . . . . . . . . . . . . . . . . . . . . . . . . . . . . . . . . . . . $1,000.00 $1,125.50 $3.74Hypothetical (5% annual return before expenses) . . . . . . . . . . . . . . . . . . . . . . . $1,000.00 $1,021.27 $3.56
@ Expenses are equal to the Fund’s annualized expense ratios of 0.96%, 1.71%, 1.53% and 0.71% for Class A, Class B, Class L andClass I shares, respectively, multiplied by the average account value over the period, multiplied by 181/365 (to reflect the one-halfyear period).
@@ Effective February 25, 2013, Class C shares were renamed Class L shares.
8

Investment Advisory Agreement Approval (unaudited)
Nature, Extent and Quality of ServicesThe Board reviewed and considered the nature and extent of the investment advisory services provided by theInvestment Adviser (as defined herein) under the advisory agreement, including portfolio management,investment research and equity and fixed income securities trading. The Board also reviewed and consideredthe nature and extent of the non-advisory, administrative services provided by the Fund’s Administrator (asdefined herein) under the administration agreement, including accounting, clerical, bookkeeping, compliance,business management and planning, and the provision of supplies, office space and utilities at the InvestmentAdviser’s expense. (The Investment Adviser and the Administrator together are referred to as the “Adviser”and the advisory and administration agreements together are referred to as the “Management Agreement.”)The Board also compared the nature of the services provided by the Adviser with similar services provided bynon-affiliated advisers as reported to the Board by Lipper, Inc. (“Lipper”).
The Board reviewed and considered the qualifications of the portfolio managers, the senior administrativemanagers and other key personnel of the Adviser who provide the administrative and advisory services to theFund. The Board determined that the Adviser’s portfolio managers and key personnel are well qualified byeducation and/or training and experience to perform the services in an efficient and professional manner. TheBoard concluded that the nature and extent of the advisory and administrative services provided werenecessary and appropriate for the conduct of the business and investment activities of the Fund andsupported its decision to approve the Management Agreement.
Performance, Fees and Expenses of the FundThe Board reviewed the performance, fees and expenses of the Fund compared to its peers, as determinedby Lipper, and to appropriate benchmarks where applicable. The Board discussed with the Adviser theperformance goals and the actual results achieved in managing the Fund. When considering a fund’sperformance, the Board and the Adviser place emphasis on trends and longer-term returns (focusing on one-year, three-year and five-year performance, as of December 31, 2012, or since inception, as applicable).When a fund underperforms its benchmark and/or its peer group average, the Board and the Adviser discussthe causes of such underperformance and, where necessary, they discuss specific changes to investmentstrategy or investment personnel. The Board noted that the Fund’s performance was better than its peergroup average for the three- and five-year periods but below its peer group average for the one-year period.The Board discussed with the Adviser the level of the advisory and administration fees (together, the“management fee”) for this Fund relative to comparable funds and/or other accounts advised by the Adviserand/or compared to its peers as determined by Lipper. In addition to the management fee, the Board alsoreviewed the Fund’s total expense ratio. The Board noted that both the Fund’s management fee and total
9

expense ratio were lower than its peer group averages. After discussion, the Board concluded that the Fund’sperformance, management fee and total expense ratio were competitive with its peer group averages.
Economies of ScaleThe Board considered the size and growth prospects of the Fund and how that relates to the Fund’s totalexpense ratio and particularly the Fund’s management fee rate, which includes breakpoints. In conjunctionwith its review of the Adviser’s profitability, the Board discussed with the Adviser how a change in assets canaffect the efficiency or effectiveness of managing the Fund and whether the management fee level isappropriate relative to current and projected asset levels and/or whether the management fee structurereflects economies of scale as asset levels change. The Board has determined that its review of the actualand potential economies of scale of the Fund supports its decision to approve the Management Agreement.
Profitability of the Adviser and AffiliatesThe Board considered information concerning the costs incurred and profits realized by the Adviser and itsaffiliates during the last year from their relationship with the Fund and during the last two years from theirrelationship with the Morgan Stanley Fund Complex and reviewed with the Adviser the cost allocationmethodology used to determine the profitability of the Adviser and affiliates. The Board has determined thatits review of the analysis of the Adviser’s expenses and profitability supports its decision to approve theManagement Agreement.
Other Benefits of the RelationshipThe Board considered other benefits to the Adviser and its affiliates derived from their relationship with theFund and other funds advised by the Adviser. These benefits may include, among other things, “float” benefitsderived from handling of checks for purchases and sales, research received by the Adviser generated fromcommission dollars spent on funds’ portfolio trading and fees for distribution and/or shareholder servicing.The Board reviewed with the Adviser each of these arrangements and the reasonableness of the Adviser’scosts relative to the services performed. The Board has determined that its review of the other benefitsreceived by the Adviser or its affiliates supports its decision to approve the Management Agreement.
Resources of the Adviser and Historical Relationship Between the Fund and the AdviserThe Board considered whether the Adviser is financially sound and has the resources necessary to performits obligations under the Management Agreement. The Board also reviewed and considered the historicalrelationship between the Fund and the Adviser, including the organizational structure of the Adviser, thepolicies and procedures formulated and adopted by the Adviser for managing the Fund’s operations and the
10

Board’s confidence in the competence and integrity of the senior managers and key personnel of the Adviser.The Board concluded that the Adviser has the financial resources necessary to fulfill its obligations under theManagement Agreement and that it is beneficial for the Fund to continue its relationship with the Adviser.
Other Factors and Current TrendsThe Board considered the controls and procedures adopted and implemented by the Adviser and monitoredby the Fund’s Chief Compliance Officer and concluded that the conduct of business by the Adviser indicates agood faith effort on its part to adhere to high ethical standards in the conduct of the Fund’s business.
General ConclusionAfter considering and weighing all of the above factors, the Board concluded that it would be in the bestinterest of the Fund and its shareholders to approve renewal of the Management Agreement for another year.In reaching this conclusion the Board did not give particular weight to any single factor referenced above. TheBoard considered these factors over the course of numerous meetings, some of which were in executivesession with only the independent Board members and their counsel present. It is possible that individualBoard members may have weighed these factors differently in reaching their individual decisions to approvethe Management Agreement.
11

Morgan Stanley Focus Growth FundPortfolio of Investments � June 30, 2013 (unaudited)
NUMBER OFSHARES VALUE
Common Stocks (99.2%)Alternative Energy (1.5%)
306,696 Range Resources Corp. . . . . . . . $ 23,713,735Asset Management & Custodian (2.8%)
174,044 BlackRock, Inc. . . . . . . . . . . . . . . . 44,703,201
Automobiles (2.4%)354,603 Tesla Motors, Inc. (a) . . . . . . . . . . 38,095,000
Biotechnology (4.0%)854,745 Illumina, Inc. (a) . . . . . . . . . . . . . . . 63,969,116
Chemicals: Diversified (3.5%)561,194 Monsanto Co. . . . . . . . . . . . . . . . . . 55,445,967
Communications Technology (4.1%)1,130,160 Motorola Solutions, Inc. . . . . . . . 65,244,137
Computer Services, Software &Systems (21.4%)
184,380 Baidu, Inc. ADR (China) (a) . . . . . 17,429,4414,054,561 Facebook, Inc., Class A (a) . . . . 100,796,386
158,783 Google, Inc., Class A (a) . . . . . . . 139,787,790158,290 LinkedIn Corp., Class A (a) . . . . . 28,223,107
1,016,676 Salesforce.com, Inc. (a) . . . . . . . 38,816,690251,681 Workday, Inc., Class A (a) . . . . . 16,130,235
341,183,649
Computer Technology (4.4%)122,387 Apple, Inc. . . . . . . . . . . . . . . . . . . . . 48,475,043804,611 Yandex N.V., Class A
(Russia) (a) . . . . . . . . . . . . . . . . . 22,231,40270,706,445
Consumer Lending (8.1%)107,288 Mastercard, Inc., Class A . . . . . . 61,636,956365,021 Visa, Inc., Class A . . . . . . . . . . . . . 66,707,588
128,344,544Diversified Media (1.9%)
417,916 Naspers Ltd., Class N(South Africa) . . . . . . . . . . . . . . . 30,862,634
Diversified Retail (16.5%)548,498 Amazon.com, Inc. (a) . . . . . . . . . . 152,312,410
4,702,093 Groupon, Inc. (a) . . . . . . . . . . . . . . 39,967,79085,289 Priceline.com, Inc. (a) . . . . . . . . . 70,545,091
262,825,291
Financial Data & Systems (1.2%)579,589 MSCI, Inc. (a) . . . . . . . . . . . . . . . . . 19,282,926
NUMBER OFSHARES VALUE
Insurance: Property-Casualty (4.7%)500,712 Arch Capital Group Ltd. (a) . . . . . $ 25,741,604
1,895,516 Progressive Corp. (The) . . . . . . . 48,184,01773,925,621
Medical Equipment (3.3%)102,431 Intuitive Surgical, Inc. (a) . . . . . . . 51,889,496
Pharmaceuticals (5.8%)513,081 Mead Johnson Nutrition Co. . . . 40,651,408596,151 Valeant Pharmaceuticals
International, Inc.(Canada) (a) . . . . . . . . . . . . . . . . 51,316,678
91,968,086Recreational Vehicles & Boats (3.4%)
1,768,951 Edenred (France) . . . . . . . . . . . . . . 54,110,021Restaurants (3.1%)
750,144 Starbucks Corp. . . . . . . . . . . . . . . 49,126,931Semiconductors & Components (1.8%)
652,018 First Solar, Inc. (a) . . . . . . . . . . . . 29,164,765Textiles Apparel & Shoes (5.3%)
247,470 Christian Dior SA (France) . . . . . 39,942,779764,307 Coach, Inc. . . . . . . . . . . . . . . . . . . . 43,634,287
83,577,066Total Common Stocks(Cost $1,155,929,443) . . . . . . . 1,578,138,631
NUMBER OFSHARES (000)
Short-Term Investment (1.0%)Investment Company
16,394 Morgan Stanley InstitutionalLiquidity Funds –Money Market Portfolio –Institutional Class(See Note 5)(Cost $16,393,706) . . . . . . 16,393,706
Total Investments(Cost $1,172,323,149) . . . . . . . . . 100.2% 1,594,532,337
Liabilities in Excess ofOther Assets . . . . . . . . . . . . . . . . . . (0.2) (3,220,047)
Net Assets . . . . . . . . . . . . . . . . . . . . . . 100.0% $1,591,312,290
ADR American Depositary Receipt.(a) Non-income producing security.
See Notes to Financial Statements
12

Morgan Stanley Focus Growth FundSummary of Investments � June 30, 2013 (unaudited)
INDUSTRY VALUE
PERCENT OFTOTAL
INVESTMENTS
Computer Services, Software & Systems . . . . . . . . . . . . . . . . . . . . . . . . . . . . . . . . . . . . . . . . . . . . . . . . . . . . . . . . $ 341,183,649 21.4%Diversified Retail . . . . . . . . . . . . . . . . . . . . . . . . . . . . . . . . . . . . . . . . . . . . . . . . . . . . . . . . . . . . . . . . . . . . . . . . . . . . . . . 262,825,291 16.5Consumer Lending . . . . . . . . . . . . . . . . . . . . . . . . . . . . . . . . . . . . . . . . . . . . . . . . . . . . . . . . . . . . . . . . . . . . . . . . . . . . . 128,344,544 8.1Pharmaceuticals . . . . . . . . . . . . . . . . . . . . . . . . . . . . . . . . . . . . . . . . . . . . . . . . . . . . . . . . . . . . . . . . . . . . . . . . . . . . . . . 91,968,086 5.8Textiles Apparel & Shoes . . . . . . . . . . . . . . . . . . . . . . . . . . . . . . . . . . . . . . . . . . . . . . . . . . . . . . . . . . . . . . . . . . . . . . . 83,577,066 5.2Insurance: Property-Casualty . . . . . . . . . . . . . . . . . . . . . . . . . . . . . . . . . . . . . . . . . . . . . . . . . . . . . . . . . . . . . . . . . . . . 73,925,621 4.6Computer Technology . . . . . . . . . . . . . . . . . . . . . . . . . . . . . . . . . . . . . . . . . . . . . . . . . . . . . . . . . . . . . . . . . . . . . . . . . . 70,706,445 4.4Communications Technology . . . . . . . . . . . . . . . . . . . . . . . . . . . . . . . . . . . . . . . . . . . . . . . . . . . . . . . . . . . . . . . . . . . . 65,244,137 4.1Biotechnology . . . . . . . . . . . . . . . . . . . . . . . . . . . . . . . . . . . . . . . . . . . . . . . . . . . . . . . . . . . . . . . . . . . . . . . . . . . . . . . . . . 63,969,116 4.0Chemicals: Diversified . . . . . . . . . . . . . . . . . . . . . . . . . . . . . . . . . . . . . . . . . . . . . . . . . . . . . . . . . . . . . . . . . . . . . . . . . . 55,445,967 3.5Recreational Vehicles & Boats . . . . . . . . . . . . . . . . . . . . . . . . . . . . . . . . . . . . . . . . . . . . . . . . . . . . . . . . . . . . . . . . . . . 54,110,021 3.4Medical Equipment . . . . . . . . . . . . . . . . . . . . . . . . . . . . . . . . . . . . . . . . . . . . . . . . . . . . . . . . . . . . . . . . . . . . . . . . . . . . . 51,889,496 3.3Restaurants . . . . . . . . . . . . . . . . . . . . . . . . . . . . . . . . . . . . . . . . . . . . . . . . . . . . . . . . . . . . . . . . . . . . . . . . . . . . . . . . . . . . 49,126,931 3.1Asset Management & Custodian . . . . . . . . . . . . . . . . . . . . . . . . . . . . . . . . . . . . . . . . . . . . . . . . . . . . . . . . . . . . . . . . . 44,703,201 2.8Automobiles . . . . . . . . . . . . . . . . . . . . . . . . . . . . . . . . . . . . . . . . . . . . . . . . . . . . . . . . . . . . . . . . . . . . . . . . . . . . . . . . . . . 38,095,000 2.4Diversified Media . . . . . . . . . . . . . . . . . . . . . . . . . . . . . . . . . . . . . . . . . . . . . . . . . . . . . . . . . . . . . . . . . . . . . . . . . . . . . . . 30,862,634 1.9Semiconductors & Components . . . . . . . . . . . . . . . . . . . . . . . . . . . . . . . . . . . . . . . . . . . . . . . . . . . . . . . . . . . . . . . . . 29,164,765 1.8Alternative Energy . . . . . . . . . . . . . . . . . . . . . . . . . . . . . . . . . . . . . . . . . . . . . . . . . . . . . . . . . . . . . . . . . . . . . . . . . . . . . . 23,713,735 1.5Financial Data & Systems . . . . . . . . . . . . . . . . . . . . . . . . . . . . . . . . . . . . . . . . . . . . . . . . . . . . . . . . . . . . . . . . . . . . . . . 19,282,926 1.2Investment Company . . . . . . . . . . . . . . . . . . . . . . . . . . . . . . . . . . . . . . . . . . . . . . . . . . . . . . . . . . . . . . . . . . . . . . . . . . . 16,393,706 1.0
$1,594,532,337 100.0%
See Notes to Financial Statements
13

Morgan Stanley Focus Growth FundFinancial Statements
Statement of Assets and LiabilitiesJune 30, 2013 (unaudited)
Assets:Investments in securities, at value (cost $1,155,929,443) . . . . . . . . . . . . . . . . . . . . . . . . . . . . . . . . . . . . . . . . . . . . . . . . . . . . . . . . . $1,578,138,631Investment in affiliate, at value (cost $16,393,706) . . . . . . . . . . . . . . . . . . . . . . . . . . . . . . . . . . . . . . . . . . . . . . . . . . . . . . . . . . . . . . . . 16,393,706Total investments in securities, at value (cost $1,172,323,149) . . . . . . . . . . . . . . . . . . . . . . . . . . . . . . . . . . . . . . . . . . . . . . . . . . . 1,594,532,337Receivable for:
Dividends . . . . . . . . . . . . . . . . . . . . . . . . . . . . . . . . . . . . . . . . . . . . . . . . . . . . . . . . . . . . . . . . . . . . . . . . . . . . . . . . . . . . . . . . . . . . . . . . . . . . . 726,243Foreign withholding taxes reclaimed . . . . . . . . . . . . . . . . . . . . . . . . . . . . . . . . . . . . . . . . . . . . . . . . . . . . . . . . . . . . . . . . . . . . . . . . . . . . 360,107Shares of beneficial interest sold . . . . . . . . . . . . . . . . . . . . . . . . . . . . . . . . . . . . . . . . . . . . . . . . . . . . . . . . . . . . . . . . . . . . . . . . . . . . . . . 339,382Dividends from affiliate . . . . . . . . . . . . . . . . . . . . . . . . . . . . . . . . . . . . . . . . . . . . . . . . . . . . . . . . . . . . . . . . . . . . . . . . . . . . . . . . . . . . . . . . 1,655
Prepaid expenses and other assets . . . . . . . . . . . . . . . . . . . . . . . . . . . . . . . . . . . . . . . . . . . . . . . . . . . . . . . . . . . . . . . . . . . . . . . . . . . . . . 86,714Total Assets . . . . . . . . . . . . . . . . . . . . . . . . . . . . . . . . . . . . . . . . . . . . . . . . . . . . . . . . . . . . . . . . . . . . . . . . . . . . . . . . . . . . . . . . . . . . . . . . . 1,596,046,438
Liabilities:Payable for:
Shares of beneficial interest redeemed . . . . . . . . . . . . . . . . . . . . . . . . . . . . . . . . . . . . . . . . . . . . . . . . . . . . . . . . . . . . . . . . . . . . . . . . . 2,580,838Transfer agent fee . . . . . . . . . . . . . . . . . . . . . . . . . . . . . . . . . . . . . . . . . . . . . . . . . . . . . . . . . . . . . . . . . . . . . . . . . . . . . . . . . . . . . . . . . . . . 1,004,893Advisory fee . . . . . . . . . . . . . . . . . . . . . . . . . . . . . . . . . . . . . . . . . . . . . . . . . . . . . . . . . . . . . . . . . . . . . . . . . . . . . . . . . . . . . . . . . . . . . . . . . . 572,352Distribution fee . . . . . . . . . . . . . . . . . . . . . . . . . . . . . . . . . . . . . . . . . . . . . . . . . . . . . . . . . . . . . . . . . . . . . . . . . . . . . . . . . . . . . . . . . . . . . . . . 296,090Administration fee . . . . . . . . . . . . . . . . . . . . . . . . . . . . . . . . . . . . . . . . . . . . . . . . . . . . . . . . . . . . . . . . . . . . . . . . . . . . . . . . . . . . . . . . . . . . . 104,619
Accrued expenses and other payables . . . . . . . . . . . . . . . . . . . . . . . . . . . . . . . . . . . . . . . . . . . . . . . . . . . . . . . . . . . . . . . . . . . . . . . . . . . . 175,356Total Liabilities . . . . . . . . . . . . . . . . . . . . . . . . . . . . . . . . . . . . . . . . . . . . . . . . . . . . . . . . . . . . . . . . . . . . . . . . . . . . . . . . . . . . . . . . . . . . . . 4,734,148Net Assets . . . . . . . . . . . . . . . . . . . . . . . . . . . . . . . . . . . . . . . . . . . . . . . . . . . . . . . . . . . . . . . . . . . . . . . . . . . . . . . . . . . . . . . . . . . . . . . . . . . $1,591,312,290
Composition of Net Assets:Paid-in-capital . . . . . . . . . . . . . . . . . . . . . . . . . . . . . . . . . . . . . . . . . . . . . . . . . . . . . . . . . . . . . . . . . . . . . . . . . . . . . . . . . . . . . . . . . . . . . . . . . . . $1,039,249,031Net unrealized appreciation . . . . . . . . . . . . . . . . . . . . . . . . . . . . . . . . . . . . . . . . . . . . . . . . . . . . . . . . . . . . . . . . . . . . . . . . . . . . . . . . . . . . . . 422,209,188Accumulated undistributed net investment income . . . . . . . . . . . . . . . . . . . . . . . . . . . . . . . . . . . . . . . . . . . . . . . . . . . . . . . . . . . . . . . . . 178,314Accumulated undistributed net realized gain . . . . . . . . . . . . . . . . . . . . . . . . . . . . . . . . . . . . . . . . . . . . . . . . . . . . . . . . . . . . . . . . . . . . . . 129,675,757
Net Assets . . . . . . . . . . . . . . . . . . . . . . . . . . . . . . . . . . . . . . . . . . . . . . . . . . . . . . . . . . . . . . . . . . . . . . . . . . . . . . . . . . . . . . . . . . . . . . . . . . . $1,591,312,290
Class A Shares:Net Assets . . . . . . . . . . . . . . . . . . . . . . . . . . . . . . . . . . . . . . . . . . . . . . . . . . . . . . . . . . . . . . . . . . . . . . . . . . . . . . . . . . . . . . . . . . . . . . . . . . . . . . $1,095,540,248Shares Outstanding (unlimited shares authorized, $0.01 par value) . . . . . . . . . . . . . . . . . . . . . . . . . . . . . . . . . . . . . . . . . . . . . . . . . 25,641,812
Net Asset Value Per Share . . . . . . . . . . . . . . . . . . . . . . . . . . . . . . . . . . . . . . . . . . . . . . . . . . . . . . . . . . . . . . . . . . . . . . . . . . . . . . . . . . $42.72
Maximum Offering Price Per Share,(net asset value plus 5.54% of net asset value) . . . . . . . . . . . . . . . . . . . . . . . . . . . . . . . . . . . . . . . . . . . . . . . . . . . . . . . . . . . . . . . . . $45.09
Class B Shares: . . . . . . . . . . . . . . . . . . . . . . . . . . . . . . . . . . . . . . . . . . . . . . . . . . . . . . . . . . . . . . . . . . . . . . . . . . . . . . . . . . . . . . . . . . . . . . .Net Assets . . . . . . . . . . . . . . . . . . . . . . . . . . . . . . . . . . . . . . . . . . . . . . . . . . . . . . . . . . . . . . . . . . . . . . . . . . . . . . . . . . . . . . . . . . . . . . . . . . . . . . $31,738,815Shares Outstanding (unlimited shares authorized, $0.01 par value) . . . . . . . . . . . . . . . . . . . . . . . . . . . . . . . . . . . . . . . . . . . . . . . . . 837,195
Net Asset Value Per Share . . . . . . . . . . . . . . . . . . . . . . . . . . . . . . . . . . . . . . . . . . . . . . . . . . . . . . . . . . . . . . . . . . . . . . . . . . . . . . . . . . $37.91
Class L Shares:@@ . . . . . . . . . . . . . . . . . . . . . . . . . . . . . . . . . . . . . . . . . . . . . . . . . . . . . . . . . . . . . . . . . . . . . . . . . . . . . . . . . . . . . . . . . . . .Net Assets . . . . . . . . . . . . . . . . . . . . . . . . . . . . . . . . . . . . . . . . . . . . . . . . . . . . . . . . . . . . . . . . . . . . . . . . . . . . . . . . . . . . . . . . . . . . . . . . . . . . . . $71,401,191Shares Outstanding (unlimited shares authorized, $0.01 par value) . . . . . . . . . . . . . . . . . . . . . . . . . . . . . . . . . . . . . . . . . . . . . . . . . 1,900,489
Net Asset Value Per Share . . . . . . . . . . . . . . . . . . . . . . . . . . . . . . . . . . . . . . . . . . . . . . . . . . . . . . . . . . . . . . . . . . . . . . . . . . . . . . . . . . $37.57
Class I Shares: . . . . . . . . . . . . . . . . . . . . . . . . . . . . . . . . . . . . . . . . . . . . . . . . . . . . . . . . . . . . . . . . . . . . . . . . . . . . . . . . . . . . . . . . . . . . . . . .Net Assets . . . . . . . . . . . . . . . . . . . . . . . . . . . . . . . . . . . . . . . . . . . . . . . . . . . . . . . . . . . . . . . . . . . . . . . . . . . . . . . . . . . . . . . . . . . . . . . . . . . . . . $392,632,036Shares Outstanding (unlimited shares authorized, $0.01 par value) . . . . . . . . . . . . . . . . . . . . . . . . . . . . . . . . . . . . . . . . . . . . . . . . . 8,840,847
Net Asset Value Per Share . . . . . . . . . . . . . . . . . . . . . . . . . . . . . . . . . . . . . . . . . . . . . . . . . . . . . . . . . . . . . . . . . . . . . . . . . . . . . . . . . . $44.41
@@ Effective February 25, 2013, Class C shares were renamed Class L shares.
See Notes to Financial Statements
14

Morgan Stanley Focus Growth FundFinancial Statements continued
Statement of OperationsFor the six months ended June 30, 2013 (unaudited)
Net Investment Income:IncomeDividends (net of $727,029 foreign withholding tax) . . . . . . . . . . . . . . . . . . . . . . . . . . . . . . . . . . . . . . . . . . . . . . . . . . . . . . . . . . . . . . . . . $ 7,532,686Dividends from affiliate (Note 5) . . . . . . . . . . . . . . . . . . . . . . . . . . . . . . . . . . . . . . . . . . . . . . . . . . . . . . . . . . . . . . . . . . . . . . . . . . . . . . . . . . . . 28,602
Total Income . . . . . . . . . . . . . . . . . . . . . . . . . . . . . . . . . . . . . . . . . . . . . . . . . . . . . . . . . . . . . . . . . . . . . . . . . . . . . . . . . . . . . . . . . . . . . . . . . . 7,561,288
ExpensesAdvisory fee (Note 3) . . . . . . . . . . . . . . . . . . . . . . . . . . . . . . . . . . . . . . . . . . . . . . . . . . . . . . . . . . . . . . . . . . . . . . . . . . . . . . . . . . . . . . . . . . . . . . 3,435,708Distribution fee (Class A shares) (Note 4) . . . . . . . . . . . . . . . . . . . . . . . . . . . . . . . . . . . . . . . . . . . . . . . . . . . . . . . . . . . . . . . . . . . . . . . . . . . 1,319,543Distribution fee (Class B shares) (Note 4) . . . . . . . . . . . . . . . . . . . . . . . . . . . . . . . . . . . . . . . . . . . . . . . . . . . . . . . . . . . . . . . . . . . . . . . . . . . 172,521Distribution fee (Class L shares) (Note 4)@@ . . . . . . . . . . . . . . . . . . . . . . . . . . . . . . . . . . . . . . . . . . . . . . . . . . . . . . . . . . . . . . . . . . . . . . . . 289,252Transfer agent fees and expenses . . . . . . . . . . . . . . . . . . . . . . . . . . . . . . . . . . . . . . . . . . . . . . . . . . . . . . . . . . . . . . . . . . . . . . . . . . . . . . . . . 1,147,762Administration fee (Note 3) . . . . . . . . . . . . . . . . . . . . . . . . . . . . . . . . . . . . . . . . . . . . . . . . . . . . . . . . . . . . . . . . . . . . . . . . . . . . . . . . . . . . . . . . . 624,903Shareholder reports and notices . . . . . . . . . . . . . . . . . . . . . . . . . . . . . . . . . . . . . . . . . . . . . . . . . . . . . . . . . . . . . . . . . . . . . . . . . . . . . . . . . . . 140,178Professional fees . . . . . . . . . . . . . . . . . . . . . . . . . . . . . . . . . . . . . . . . . . . . . . . . . . . . . . . . . . . . . . . . . . . . . . . . . . . . . . . . . . . . . . . . . . . . . . . . . . 49,245Custodian fees . . . . . . . . . . . . . . . . . . . . . . . . . . . . . . . . . . . . . . . . . . . . . . . . . . . . . . . . . . . . . . . . . . . . . . . . . . . . . . . . . . . . . . . . . . . . . . . . . . . . 47,903Registration fees . . . . . . . . . . . . . . . . . . . . . . . . . . . . . . . . . . . . . . . . . . . . . . . . . . . . . . . . . . . . . . . . . . . . . . . . . . . . . . . . . . . . . . . . . . . . . . . . . . 35,196Trustees’ fees and expenses . . . . . . . . . . . . . . . . . . . . . . . . . . . . . . . . . . . . . . . . . . . . . . . . . . . . . . . . . . . . . . . . . . . . . . . . . . . . . . . . . . . . . . . 21,470Other . . . . . . . . . . . . . . . . . . . . . . . . . . . . . . . . . . . . . . . . . . . . . . . . . . . . . . . . . . . . . . . . . . . . . . . . . . . . . . . . . . . . . . . . . . . . . . . . . . . . . . . . . . . . . 28,389
Total Expenses . . . . . . . . . . . . . . . . . . . . . . . . . . . . . . . . . . . . . . . . . . . . . . . . . . . . . . . . . . . . . . . . . . . . . . . . . . . . . . . . . . . . . . . . . . . . . . . . 7,312,070Less: rebate from Morgan Stanley affiliated cash sweep (Note 5) . . . . . . . . . . . . . . . . . . . . . . . . . . . . . . . . . . . . . . . . . . . . . . . . . . . . (34,356)
Net Expenses . . . . . . . . . . . . . . . . . . . . . . . . . . . . . . . . . . . . . . . . . . . . . . . . . . . . . . . . . . . . . . . . . . . . . . . . . . . . . . . . . . . . . . . . . . . . . . . . . 7,277,714
Net Investment Income . . . . . . . . . . . . . . . . . . . . . . . . . . . . . . . . . . . . . . . . . . . . . . . . . . . . . . . . . . . . . . . . . . . . . . . . . . . . . . . . . . . . . . . 283,574
Realized and Unrealized Gain (Loss):Realized Gain (Loss) on:Investments . . . . . . . . . . . . . . . . . . . . . . . . . . . . . . . . . . . . . . . . . . . . . . . . . . . . . . . . . . . . . . . . . . . . . . . . . . . . . . . . . . . . . . . . . . . . . . . . . . . . . . . 130,877,770Foreign currency translation . . . . . . . . . . . . . . . . . . . . . . . . . . . . . . . . . . . . . . . . . . . . . . . . . . . . . . . . . . . . . . . . . . . . . . . . . . . . . . . . . . . . . . . (35,573)
Net Realized Gain . . . . . . . . . . . . . . . . . . . . . . . . . . . . . . . . . . . . . . . . . . . . . . . . . . . . . . . . . . . . . . . . . . . . . . . . . . . . . . . . . . . . . . . . . . . . . 130,842,197
Change in Unrealized Appreciation (Depreciation) on:Investments . . . . . . . . . . . . . . . . . . . . . . . . . . . . . . . . . . . . . . . . . . . . . . . . . . . . . . . . . . . . . . . . . . . . . . . . . . . . . . . . . . . . . . . . . . . . . . . . . . . . . . . 52,157,782
Net Gain . . . . . . . . . . . . . . . . . . . . . . . . . . . . . . . . . . . . . . . . . . . . . . . . . . . . . . . . . . . . . . . . . . . . . . . . . . . . . . . . . . . . . . . . . . . . . . . . . . . . . . . 182,999,979
Net Increase . . . . . . . . . . . . . . . . . . . . . . . . . . . . . . . . . . . . . . . . . . . . . . . . . . . . . . . . . . . . . . . . . . . . . . . . . . . . . . . . . . . . . . . . . . . . . . . . . . . . . $183,283,553
@@ Effective February 25, 2013, Class C shares were renamed Class L shares.
See Notes to Financial Statements
15

Morgan Stanley Focus Growth FundFinancial Statements continued
Statements of Changes in Net Assets
FOR THE SIXMONTHS ENDEDJUNE 30, 2013
FOR THE YEARENDED
DECEMBER 31, 2012
(unaudited)Increase (Decrease) in Net Assets:
Operations:Net investment income . . . . . . . . . . . . . . . . . . . . . . . . . . . . . . . . . . . . . . . . . . . . . . . . . . . . . . . . . . . . . . . . . . . $ 283,574 $ 4,175,184Net realized gain . . . . . . . . . . . . . . . . . . . . . . . . . . . . . . . . . . . . . . . . . . . . . . . . . . . . . . . . . . . . . . . . . . . . . . . . . 130,842,197 15,880,092Net change in unrealized appreciation (depreciation) . . . . . . . . . . . . . . . . . . . . . . . . . . . . . . . . . . . . . . . 52,157,782 178,052,726
Net Increase . . . . . . . . . . . . . . . . . . . . . . . . . . . . . . . . . . . . . . . . . . . . . . . . . . . . . . . . . . . . . . . . . . . . . . . . . 183,283,553 198,108,002
Dividends and Distributions to Shareholders from:Net investment income
Class A shares . . . . . . . . . . . . . . . . . . . . . . . . . . . . . . . . . . . . . . . . . . . . . . . . . . . . . . . . . . . . . . . . . . . . . . . . (2,343,907) —Class I shares . . . . . . . . . . . . . . . . . . . . . . . . . . . . . . . . . . . . . . . . . . . . . . . . . . . . . . . . . . . . . . . . . . . . . . . . . (1,719,318) —
Net realized gainClass A shares . . . . . . . . . . . . . . . . . . . . . . . . . . . . . . . . . . . . . . . . . . . . . . . . . . . . . . . . . . . . . . . . . . . . . . . . (6,308,337) —Class B shares . . . . . . . . . . . . . . . . . . . . . . . . . . . . . . . . . . . . . . . . . . . . . . . . . . . . . . . . . . . . . . . . . . . . . . . . (211,189) —Class L shares@@ . . . . . . . . . . . . . . . . . . . . . . . . . . . . . . . . . . . . . . . . . . . . . . . . . . . . . . . . . . . . . . . . . . . . . (468,170) —Class I shares . . . . . . . . . . . . . . . . . . . . . . . . . . . . . . . . . . . . . . . . . . . . . . . . . . . . . . . . . . . . . . . . . . . . . . . . . (2,155,251) —
Total Dividends and Distributions . . . . . . . . . . . . . . . . . . . . . . . . . . . . . . . . . . . . . . . . . . . . . . . . . . . . (13,206,172) —
Net decrease from transactions in shares of beneficial interest . . . . . . . . . . . . . . . . . . . . . . . . . . . . . (94,281,329) (145,992,046)
Net Increase . . . . . . . . . . . . . . . . . . . . . . . . . . . . . . . . . . . . . . . . . . . . . . . . . . . . . . . . . . . . . . . . . . . . . . . . . 75,796,052 52,115,956
Net Assets:Beginning of period . . . . . . . . . . . . . . . . . . . . . . . . . . . . . . . . . . . . . . . . . . . . . . . . . . . . . . . . . . . . . . . . . . . . . . 1,515,516,238 1,463,400,282
End of Period(Including accumulated undistributed net investment income of $178,314 and $3,957,965,respectively) . . . . . . . . . . . . . . . . . . . . . . . . . . . . . . . . . . . . . . . . . . . . . . . . . . . . . . . . . . . . . . . . . . . . . . . . . . . . . $1,591,312,290 $1,515,516,238
@@ Effective February 25, 2013, Class C shares were renamed Class L shares.
See Notes to Financial Statements
16

Morgan Stanley Focus Growth FundNotes to Financial Statements � June 30, 2013 (unaudited)
1. Organization and Accounting PoliciesMorgan Stanley Focus Growth Fund (the “Fund”) is registered under the Investment Company Act of 1940, asamended (the “Act”), as a non-diversified, open-end management investment company. The Fund’s investmentobjective is to seek long-term capital growth. The Fund was incorporated in Maryland in 1979, commencedoperations on March 27, 1980 and was reorganized as a Massachusetts business trust on April 6, 1987. OnJuly 28, 1997, the Fund converted to a multiple class share structure.
The Fund offers Class A shares, Class B shares, Class L shares and Class I shares. The four classes aresubstantially the same except that most Class A shares are subject to a sales charge imposed at the time ofpurchase and some Class A shares, and most Class B shares are subject to a contingent deferred salescharge imposed on shares redeemed within eighteen months and six years, respectively. Class L shares andClass I shares are not subject to a sales charge. Additionally, Class A shares, Class B shares and Class Lshares incur distribution expenses.
On February 25, 2013, Class C shares were renamed Class L shares.
The following is a summary of significant accounting policies:
A. Valuation of Investments — (1) An equity portfolio security listed or traded on an exchange is valued atits latest reported sales price (or at the exchange official closing price if such exchange reports an officialclosing price), if there were no sales on a given day, the security is valued at the mean between the lastreported bid and asked prices; (2) all other equity portfolio securities for which over-the-counter marketquotations are readily available are valued at the mean between the last reported bid and asked prices. Incases where a security is traded on more than one exchange, the security is valued on the exchangedesignated as the primary market; (3) when market quotations are not readily available, includingcircumstances under which Morgan Stanley Investment Management Inc. (the “Adviser”) determines that theclosing price, last sale price or the mean between the last reported bid and asked prices are not reflective ofa security’s market value, portfolio securities are valued at their fair value as determined in good faith underprocedures established by and under the general supervision of the Fund’s Board of Trustees (the “Trustees”).Occasionally, developments affecting the closing prices of securities and other assets may occur between thetimes at which valuations of such securities are determined (that is, close of the foreign market on which thesecurities trade) and the close of business on the New York Stock Exchange (“NYSE”). If developments occurduring such periods that are expected to materially affect the value of such securities, such valuations may beadjusted to reflect the estimated fair value of such securities as of the close of the NYSE, as determined ingood faith by the Trustees or by the Adviser using a pricing service and/or procedures approved by theTrustees; (4) quotations of foreign portfolio securities, other assets and liabilities and forward contractsstated in foreign currency are translated into U.S. dollar equivalents at the prevailing market rates prior to the
17

Morgan Stanley Focus Growth FundNotes to Financial Statements � June 30, 2013 (unaudited) continued
close of the NYSE; (5) certain portfolio securities may be valued by an outside pricing service approved by theTrustees; (6) investments in mutual funds, including the Morgan Stanley Institutional Liquidity Funds, arevalued at the net asset value as of the close of each business day; and (7) short-term debt securities withremaining maturities of 60 days or less at the time of purchase may be valued at amortized cost, unless theAdviser determines such valuation does not reflect the securities’ market value, in which case these securitieswill be valued at their fair market value determined by the Adviser.
Under procedures approved by the Trustees, the Fund’s Adviser has formed a Valuation Committee. TheValuation Committee provides administration and oversight of the Fund’s valuation policies and procedures,which are reviewed at least annually by the Trustees. These procedures allow the Fund to utilize independentpricing services, quotations from securities and financial instrument dealers, and other market sources todetermine fair value.
The Fund has procedures to determine the fair value of securities and other financial instruments for whichmarket prices are not readily available. Under these procedures, the Valuation Committee convenes on aregular and ad hoc basis to review such securities and considers a number of factors, including valuationmethodologies and significant unobservable valuation inputs, when arriving at fair value. The ValuationCommittee may employ a market-based approach which may use related or comparable assets or liabilities,recent transactions, market multiples, book values, and other relevant information for the investment todetermine the fair value of the investment. An income-based valuation approach may also be used in which theanticipated future cash flows of the investment are discounted to calculate fair value. Discounts may also beapplied due to the nature or duration of any restrictions on the disposition of the investments. Due to theinherent uncertainty of valuations of such investments, the fair values may differ significantly from the valuesthat would have been used had an active market existed. The Valuation Committee employs various methodsfor calibrating these valuation approaches including a regular review of valuation methodologies, key inputsand assumptions, transactional back-testing or disposition analysis, and reviews of any related marketactivity.
B. Accounting for Investments — Security transactions are accounted for on the trade date (date theorder to buy or sell is executed). Realized gains and losses on security transactions are determined by theidentified cost method. Dividend income and other distributions are recorded on the ex-dividend date.Discounts are accreted and premiums are amortized over the life of the respective securities and areincluded in interest income. Interest income is accrued daily as earned.
C. Multiple Class Allocations — Investment income, expenses (other than distribution fees), and realizedand unrealized gains and losses are allocated to each class of shares based upon the relative net asset valueon the date such items are recognized. Distribution fees are charged directly to the respective class.
18
Morgan Stanley Focus Growth FundNotes to Financial Statements � June 30, 2013 (unaudited) continued
D. Foreign Currency Translation and Foreign Investments — The books and records of the Fund aremaintained in U.S. dollars. Foreign currency amounts are translated into U.S. dollars at the mean of the bidand asked prices of such currencies against U.S. dollars last quoted by a major bank as follows:
— investments, other assets and liabilities at the prevailing rate of exchange on the valuation date;
— investment transactions and investment income at the prevailing rates of exchange on the dates ofsuch transactions.
Although the net assets of the Fund are presented at the foreign exchange rates and market values at theclose of the period, the Fund does not isolate that portion of the results of operations arising as a result ofchanges in the foreign exchange rates from the fluctuations arising from changes in the market prices ofsecurities held at period end. Similarly, the Fund does not isolate the effect of changes in foreign exchangerates from the fluctuations arising from changes in the market prices of securities sold during the period.Accordingly, realized and unrealized foreign currency gains (losses) on investments in securities are includedin the reported net realized and unrealized gains (losses) on investment transactions and balances. However,pursuant to U.S. Federal income tax regulations, gains and losses from certain foreign currency transactionsand the foreign currency portion of gains and losses realized on sales and maturities of foreign denominateddebt securities are treated as ordinary income for U.S. Federal income tax purposes.
Net realized gains (losses) on foreign currency transactions represent net foreign exchange gains (losses)from foreign currency forward exchange contracts, disposition of foreign currencies, currency gains (losses)realized between the trade and settlement dates on securities transactions, and the difference between theamount of investment income and foreign withholding taxes recorded on the Fund’s books and the U.S. dollarequivalent amounts actually received or paid. Net unrealized currency gains (losses) from valuing foreigncurrency denominated assets and liabilities at period end exchange rates are reflected as a component ofunrealized appreciation (depreciation) on the Statement of Assets and Liabilities. The change in unrealizedcurrency gains (losses) on foreign currency translations for the period is reflected in the Statement ofOperations.
Foreign security and currency transactions may involve certain considerations and risks not typicallyassociated with those of U.S. dollar denominated transactions as a result of, among other factors,fluctuations of exchange rates in relation to the U.S. dollar, the possibility of lower levels of governmentalsupervision and regulation of foreign securities markets and the possibility of political or economic instability.
E. Dividends and Distributions to Shareholders — Dividends and distributions to shareholders arerecorded on the ex-dividend date.
19

Morgan Stanley Focus Growth FundNotes to Financial Statements � June 30, 2013 (unaudited) continued
F. Use of Estimates — The preparation of financial statements in accordance with generally acceptedaccounting principles in the United States (“GAAP”) requires management to make estimates and assumptionsthat affect the reported amounts and disclosures. Actual results could differ from those estimates.
G. Indemnifications — The Fund enters into contracts that contain a variety of indemnifications. The Fund’smaximum exposure under these arrangements is unknown. However, the Fund has not had prior claims orlosses pursuant to these contracts and expects the risk of loss to be remote.
2. Fair Valuation MeasurementsFinancial Accounting Standards Board (“FASB”) Accounting Standards Codification (“ASC”) 820, Fair ValueMeasurements and Disclosures (“ASC 820”), defines fair value as the value that the Fund would receive to sellan investment or pay to transfer a liability in a timely transaction with an independent buyer in the principalmarket, or in the absence of a principal market the most advantageous market for the investment or liability.ASC 820 establishes a three-tier hierarchy to distinguish between (1) inputs that reflect the assumptionsmarket participants would use in valuing an asset or liability developed based on market data obtained fromsources independent of the reporting entity (observable inputs); and (2) inputs that reflect the reportingentity’s own assumptions about the assumptions market participants would use in valuing an asset or liabilitydeveloped based on the best information available in the circumstances (unobservable inputs) and to establishclassification of fair value measurements for disclosure purposes. Various inputs are used in determining thevalue of the Fund’s investments. The inputs are summarized in the three broad levels listed below.
• Level 1 — unadjusted quoted prices in active markets for identical investments
• Level 2 — other significant observable inputs (including quoted prices for similar investments,interest rates, prepayment speeds, credit risk, etc.)
• Level 3 — significant unobservable inputs including the Fund’s own assumptions in determining thefair value of investments. Factors considered in making this determination may include, but are notlimited to, information obtained by contacting the issuer, analysts, or the appropriate stockexchange (for exchange-traded securities), analysis of the issuer’s financial statements or otheravailable documents and, if necessary, available information concerning other securities in similarcircumstances
The inputs or methodology used for valuing securities are not necessarily an indication of the risk associatedwith investing in those securities and the determination of the significance of a particular input to the fair valuemeasurement in its entirety requires judgment and considers factors specific to each security.
20

Morgan Stanley Focus Growth FundNotes to Financial Statements � June 30, 2013 (unaudited) continued
The following is a summary of the inputs used to value the Fund’s investments as of June 30, 2013.
INVESTMENT TYPE
LEVEL 1UNADJUSTED
QUOTEDPRICES
LEVEL 2OTHER
SIGNIFICANTOBSERVABLE
INPUTS
LEVEL 3SIGNIFICANT
UNOBSERVABLEINPUTS TOTAL
Assets:Common Stocks
Alternative Energy . . . . . . . . . . . . . . . . . . . . . . . . . . . . . . . . . . . . $ 23,713,735 $ — $ — $ 23,713,735Asset Management & Custodian . . . . . . . . . . . . . . . . . . . . . . 44,703,201 — — 44,703,201Automobiles . . . . . . . . . . . . . . . . . . . . . . . . . . . . . . . . . . . . . . . . . 38,095,000 — — 38,095,000Biotechnology . . . . . . . . . . . . . . . . . . . . . . . . . . . . . . . . . . . . . . . 63,969,116 — — 63,969,116Chemicals: Diversified . . . . . . . . . . . . . . . . . . . . . . . . . . . . . . . . 55,445,967 — — 55,445,967Communications Technology . . . . . . . . . . . . . . . . . . . . . . . . . 65,244,137 — — 65,244,137Computer Services, Software & Systems . . . . . . . . . . . . . . 341,183,649 — — 341,183,649Computer Technology . . . . . . . . . . . . . . . . . . . . . . . . . . . . . . . . 70,706,445 — — 70,706,445Consumer Lending . . . . . . . . . . . . . . . . . . . . . . . . . . . . . . . . . . . 128,344,544 — — 128,344,544Diversified Media . . . . . . . . . . . . . . . . . . . . . . . . . . . . . . . . . . . . . 30,862,634 — — 30,862,634Diversified Retail . . . . . . . . . . . . . . . . . . . . . . . . . . . . . . . . . . . . . 262,825,291 — — 262,825,291Financial Data & Systems . . . . . . . . . . . . . . . . . . . . . . . . . . . . . 19,282,926 — — 19,282,926Insurance: Property-Casualty . . . . . . . . . . . . . . . . . . . . . . . . . . 73,925,621 — — 73,925,621Medical Equipment . . . . . . . . . . . . . . . . . . . . . . . . . . . . . . . . . . . 51,889,496 — — 51,889,496Pharmaceuticals . . . . . . . . . . . . . . . . . . . . . . . . . . . . . . . . . . . . . 91,968,086 — — 91,968,086Recreational Vehicles & Boats . . . . . . . . . . . . . . . . . . . . . . . . 54,110,021 — — 54,110,021Restaurants . . . . . . . . . . . . . . . . . . . . . . . . . . . . . . . . . . . . . . . . . . 49,126,931 — — 49,126,931Semiconductors & Components . . . . . . . . . . . . . . . . . . . . . . 29,164,765 — — 29,164,765Textiles Apparel & Shoes . . . . . . . . . . . . . . . . . . . . . . . . . . . . . 83,577,066 — — 83,577,066
Total Common Stocks . . . . . . . . . . . . . . . . . . . . . . . . . . . . . . . . 1,578,138,631 — — 1,578,138,631
Short-Term Investment – Investment Company . . . . . . 16,393,706 — — 16,393,706
Total Assets . . . . . . . . . . . . . . . . . . . . . . . . . . . . . . . . . . . . . . . . . . $1,594,532,337 $ — $ — $1,594,532,337
Transfers between investment levels may occur as the markets fluctuate and/or the availability of data used inan investment’s valuation changes. The Fund recognizes transfers between the levels as of the end of theperiod. As of June 30, 2013, securities with a total value of $84,972,655 transferred from Level 2 to Level 1.At December 31, 2012, the fair market value of certain securities were adjusted due to developments whichoccurred between the time of the close of the foreign markets on which they trade and the close of business onthe NYSE which resulted in their Level 2 classification.
21

Morgan Stanley Focus Growth FundNotes to Financial Statements � June 30, 2013 (unaudited) continued
Following is a reconciliation of investments in which significant unobservable inputs (Level 3) were used indetermining fair value:
CONVERTIBLEPREFERRED
STOCKS
Beginning Balance . . . . . . . . . . . . . . . . . . . . . . . . . . . . . . . . . . . . . . . . . . . . . . . . . . . . . . . . . . . . . . . . . . . . . . . . . . . . . . . . . . . . . . . . . . . . . . . . . . $1,046,715Purchases . . . . . . . . . . . . . . . . . . . . . . . . . . . . . . . . . . . . . . . . . . . . . . . . . . . . . . . . . . . . . . . . . . . . . . . . . . . . . . . . . . . . . . . . . . . . . . . . . . . . . . . —Sales . . . . . . . . . . . . . . . . . . . . . . . . . . . . . . . . . . . . . . . . . . . . . . . . . . . . . . . . . . . . . . . . . . . . . . . . . . . . . . . . . . . . . . . . . . . . . . . . . . . . . . . . . . . . —Amortization of discount . . . . . . . . . . . . . . . . . . . . . . . . . . . . . . . . . . . . . . . . . . . . . . . . . . . . . . . . . . . . . . . . . . . . . . . . . . . . . . . . . . . . . . . . . . —Transfers in . . . . . . . . . . . . . . . . . . . . . . . . . . . . . . . . . . . . . . . . . . . . . . . . . . . . . . . . . . . . . . . . . . . . . . . . . . . . . . . . . . . . . . . . . . . . . . . . . . . . . . —Transfers out . . . . . . . . . . . . . . . . . . . . . . . . . . . . . . . . . . . . . . . . . . . . . . . . . . . . . . . . . . . . . . . . . . . . . . . . . . . . . . . . . . . . . . . . . . . . . . . . . . . . —Change in unrealized appreciation/depreciation . . . . . . . . . . . . . . . . . . . . . . . . . . . . . . . . . . . . . . . . . . . . . . . . . . . . . . . . . . . . . . . . . . . . 7,723,716Realized gains (losses) . . . . . . . . . . . . . . . . . . . . . . . . . . . . . . . . . . . . . . . . . . . . . . . . . . . . . . . . . . . . . . . . . . . . . . . . . . . . . . . . . . . . . . . . . . . (8,770,431)
Ending Balance . . . . . . . . . . . . . . . . . . . . . . . . . . . . . . . . . . . . . . . . . . . . . . . . . . . . . . . . . . . . . . . . . . . . . . . . . . . . . . . . . . . . . . . . . . . . . . . . . . . . . $ —
Net change in unrealized appreciation/depreciation from investments still held as of June 30, 2013. . . . . . . . . . . . . . . . . . . . . $ —
3. Advisory/Administration AgreementsPursuant to an Investment Advisory Agreement with the Adviser, the Fund pays the Adviser an advisory fee,accrued daily and payable monthly, by applying the following annual rates to the net assets of the Funddetermined as of the close of each business day: 0.545% to the portion of the daily net assets not exceeding$250 million; 0.42% to the portion of the daily net assets exceeding $250 million but not exceeding $2.5billion; 0.395% to the portion of the daily net assets exceeding $2.5 billion but not exceeding $3.5 billion;0.37% to the portion of the daily net assets exceeding $3.5 billion but not exceeding $4.5 billion; and 0.345%to the portion of the daily net assets exceeding $4.5 billion. For the six months ended June 30, 2013, theadvisory fee rate (net of rebate) was equivalent to an annual effective rate of 0.44% of the Fund’s daily netassets.
Pursuant to an Administration Agreement with Morgan Stanley Services Company Inc. (the “Administrator”), anaffiliate of the Adviser, the Fund pays an administration fee, accrued daily and payable monthly, by applyingthe annual rate of 0.08% to the Fund’s daily net assets.
Under a Sub-Administration Agreement between the Administrator and State Street Bank and Trust Company(“State Street”), State Street provides certain administrative services to the Fund. For such services, theAdministrator pays State Street a portion of the fee the Administrator receives from the Fund.
4. Plan of DistributionShares of the Fund are distributed by Morgan Stanley Distribution, Inc. (the “Distributor”), an affiliate of theAdviser and Administrator. The Fund has adopted a Plan of Distribution (the “Plan”) pursuant to Rule 12b-1under the Act. The Plan provides that the Fund will pay the Distributor a fee which is accrued daily and paid
22

Morgan Stanley Focus Growth FundNotes to Financial Statements � June 30, 2013 (unaudited) continued
monthly at the following annual rates: (i) Class A — up to 0.25% of the average daily net assets of Class Ashares; (ii) Class B — up to 1.00% of the average daily net assets of Class B shares; and (iii) Class L — up to0.75% of the average daily net assets of Class L shares.
On February 25, 2013, Class C shares were renamed Class L shares. In addition, the Trustees approved anamendment to the Plan of Distribution reducing the distribution and shareholder services (12b-1) fee for theFund’s Class L shares from 1.00% to 0.75% of the average daily net assets of such Class, effectiveFebruary 25, 2013.
In the case of Class B shares, provided that the Plan continues in effect, any cumulative expenses incurred bythe Distributor but not yet recovered may be recovered through the payment of future distribution fees fromthe Fund pursuant to the Plan and contingent deferred sales charges paid by investors upon redemption ofClass B shares. Although there is no legal obligation for the Fund to pay expenses incurred in excess ofpayments made to the Distributor under the Plan and the proceeds of contingent deferred sales charges paidby investors upon redemption of shares, if for any reason the Plan is terminated, the Trustees will consider atthat time the manner in which to treat such expenses. The Distributor has advised the Fund that such excessamounts totaled $51,912,526 at June 30, 2013.
In the case of Class A shares and Class L shares, expenses incurred pursuant to the Plan in any calendar yearin excess of 0.25% or 0.75% of the average daily net assets of Class A shares or Class L shares,respectively, will not be reimbursed by the Fund through payments in any subsequent year, except thatexpenses representing a gross sales credit to Morgan Stanley Financial Advisors and other authorizedfinancial representatives at the time of sale may be reimbursed in the subsequent calendar year. For the sixmonths ended June 30, 2013, the distribution fee was accrued for Class A shares and Class L shares at theannual rate of 0.25% and 0.82%, respectively.
The Distributor has informed the Fund that for the six months ended June 30, 2013, it received contingentdeferred sales charges from certain redemptions of the Fund’s Class A shares, Class B shares and Class Lshares of $1,624, $19,922 and $3,442, respectively, and received $108,305 in front-end sales chargesfrom sales of the Fund’s Class A shares. The respective shareholders pay such charges, which are not anexpense of the Fund.
5. Security Transactions and Transactions with AffiliatesThe cost of purchases and proceeds from sales of investment securities, excluding short-term investments,for the six months ended June 30, 2013, aggregated $328,925,757 and $444,233,312, respectively.
The Fund invests in the Institutional Class of the Morgan Stanley Institutional Liquidity Funds – Money MarketPortfolio (the “Liquidity Funds”), an open-end management investment company managed by the Adviser.Advisory fees paid by the Fund are reduced by an amount equal to its pro-rata share of the advisory and
23

Morgan Stanley Focus Growth FundNotes to Financial Statements � June 30, 2013 (unaudited) continued
administration fees paid by the Fund due to its investment in the Liquidity Funds. For the six months endedJune 30, 2013, advisory fees paid were reduced by $34,356 relating to the Fund’s investment in the LiquidityFunds.
A summary of the Fund’s transactions in shares of the Liquidity Funds during the six months ended June 30,2013 is as follows:
VALUEDECEMBER 31, 2012
PURCHASESAT COST SALES
DIVIDENDINCOME
VALUEJUNE 30, 2013
$10,088,271 $296,062,773 $289,757,338 $28,602 $16,393,706
For the six months ended June 30, 2013, the Fund incurred brokerage commissions of $23,292 with MorganStanley & Co., LLC, an affiliate of the Adviser, Administrator and Distributor, for portfolio transactionsexecuted on behalf of the Fund.
For the six months ended June 30, 2013, the Fund incurred brokerage commissions of $20,563 withCitigroup, Inc., and its affiliated broker-dealers, which may be deemed affiliates of the Adviser, Administratorand Distributor under Section 17 of the Act, for portfolio transactions executed on behalf of the Fund.
Morgan Stanley Services Company Inc., an affiliate of the Adviser and Distributor, was the Fund’s transferagent. Effective July 1, 2013, the Trustees approved changing the transfer agent to Boston Financial DataServices, Inc.
The Fund has an unfunded noncontributory defined benefit pension plan covering certain independent Trusteesof the Fund who will have served as independent Trustees for at least five years at the time of retirement.Benefits under this plan are based on factors which include years of service and compensation. The Trusteesvoted to close the plan to new participants and eliminate the future benefits growth due to increases tocompensation after July 31, 2003. Aggregate pension costs for the six months ended June 30, 2013,included in “Trustees’ fees and expenses” in the Statement of Operations amounted to $3,580. At June 30,2013, the Fund had an accrued pension liability of $75,251, which is included in “Accrued expenses andother payables” in the Statement of Assets and Liabilities.
The Fund has an unfunded Deferred Compensation Plan (the “Compensation Plan”), which allows eachindependent Trustee to defer payment of all, or a portion, of the fees they receive for serving on the Board ofTrustees. Each eligible Trustee generally may elect to have the deferred amounts credited with a return equalto the total return on one or more of the Morgan Stanley funds that are offered as investment options underthe Compensation Plan. Appreciation/depreciation and distributions received from these investments arerecorded with an offsetting increase/decrease in the deferred compensation obligation and do not affect thenet asset value of the Fund.
24

Morgan Stanley Focus Growth FundNotes to Financial Statements � June 30, 2013 (unaudited) continued
6. Shares of Beneficial InterestTransactions in shares of beneficial interest were as follows:
FOR THE SIXMONTHS ENDEDJUNE 30, 2013
FOR THE YEARENDED
DECEMBER 31, 2012
(unaudited)SHARES AMOUNT SHARES AMOUNT
CLASS A SHARESSold . . . . . . . . . . . . . . . . . . . . . . . . . . . . . . . . . . . . . . . . . . . . . . . . . . . . . . . . . . . . . . . . . 548,149 $ 22,591,705 1,390,243 $ 52,289,874Conversion from Class B . . . . . . . . . . . . . . . . . . . . . . . . . . . . . . . . . . . . . . . . . . . . . 143,890 5,919,447 540,118 20,320,585Issued due to tax-free reorganization . . . . . . . . . . . . . . . . . . . . . . . . . . . . . . . . . . — — 49,523 1,813,535Reinvestment of dividends and distributions . . . . . . . . . . . . . . . . . . . . . . . . . . . . 197,098 8,282,052 — —Redeemed . . . . . . . . . . . . . . . . . . . . . . . . . . . . . . . . . . . . . . . . . . . . . . . . . . . . . . . . . . . (2,473,010) (101,761,380) (4,975,199) (185,235,661)
Net decrease – Class A . . . . . . . . . . . . . . . . . . . . . . . . . . . . . . . . . . . . . . . . . . . . . . . (1,583,873) (64,968,176) (2,995,315) (110,811,667)
CLASS B SHARESSold . . . . . . . . . . . . . . . . . . . . . . . . . . . . . . . . . . . . . . . . . . . . . . . . . . . . . . . . . . . . . . . . . 13,329 477,335 93,839 3,144,880Conversion to Class A . . . . . . . . . . . . . . . . . . . . . . . . . . . . . . . . . . . . . . . . . . . . . . . . (162,074) (5,919,447) (604,735) (20,320,585)Reinvestment of distributions . . . . . . . . . . . . . . . . . . . . . . . . . . . . . . . . . . . . . . . . . 5,263 196,030 — —Redeemed . . . . . . . . . . . . . . . . . . . . . . . . . . . . . . . . . . . . . . . . . . . . . . . . . . . . . . . . . . . (85,830) (3,121,797) (252,018) (8,429,234)
Net decrease – Class B . . . . . . . . . . . . . . . . . . . . . . . . . . . . . . . . . . . . . . . . . . . . . . (229,312) (8,367,879) (762,914) (25,604,939)
CLASS L SHARES@@Sold . . . . . . . . . . . . . . . . . . . . . . . . . . . . . . . . . . . . . . . . . . . . . . . . . . . . . . . . . . . . . . . . . 46,131 1,673,436 331,129 11,194,349Reinvestment of distributions . . . . . . . . . . . . . . . . . . . . . . . . . . . . . . . . . . . . . . . . . 12,359 456,672 — —Redeemed . . . . . . . . . . . . . . . . . . . . . . . . . . . . . . . . . . . . . . . . . . . . . . . . . . . . . . . . . . . (215,342) (7,773,813) (386,477) (12,763,189)
Net decrease – Class L . . . . . . . . . . . . . . . . . . . . . . . . . . . . . . . . . . . . . . . . . . . . . . . (156,852) (5,643,705) (55,348) (1,568,840)
CLASS I SHARESSold . . . . . . . . . . . . . . . . . . . . . . . . . . . . . . . . . . . . . . . . . . . . . . . . . . . . . . . . . . . . . . . . . 814,837 34,745,205 2,171,651 84,945,002Issued due to tax-free reorganization . . . . . . . . . . . . . . . . . . . . . . . . . . . . . . . . . . — — 224,564 8,551,405Reinvestment of dividends and distributions . . . . . . . . . . . . . . . . . . . . . . . . . . . . 86,983 3,798,550 — —Redeemed . . . . . . . . . . . . . . . . . . . . . . . . . . . . . . . . . . . . . . . . . . . . . . . . . . . . . . . . . . . (1,256,689) (53,845,324) (2,619,688) (101,503,007)
Net decrease – Class I . . . . . . . . . . . . . . . . . . . . . . . . . . . . . . . . . . . . . . . . . . . . . . . (354,869) (15,301,569) (223,473) (8,006,600)
Net decrease in Fund . . . . . . . . . . . . . . . . . . . . . . . . . . . . . . . . . . . . . . . . . . . . . . . . . (2,324,906) $(94,281,329) (4,037,050) $(145,992,046)
@@ Effective February 25, 2013, Class C shares were renamed Class L shares.Effective February 25, 2013, the Trustees approved the suspension of the continuous offering of Class B shares to new and existingshareholders.
7. Federal Income Tax StatusIt is the Fund’s intention to continue to qualify as a regulated investment company and distribute all of itstaxable and tax-exempt income. Accordingly, no provision for Federal income taxes is required in the financialstatements.
25

Morgan Stanley Focus Growth FundNotes to Financial Statements � June 30, 2013 (unaudited) continued
Dividend income and distributions to shareholders are recorded on the ex-dividend date. Interest income isrecognized on an accrual basis. Dividends from net investment income, if any, are declared and paidsemiannually. Net realized capital gains, if any, are distributed at least annually.
The Fund may be subject to taxes imposed by countries in which it invests. Such taxes are generally based onincome and/or capital gains earned or repatriated. Taxes are accrued based on net investment income, netrealized gains and net unrealized appreciation as such income and/or gains are earned. Taxes may also bebased on transactions in foreign currency and are accrued based on the value of investments denominated insuch currency.
FASB ASC 740-10, Income Taxes — Overall, sets forth a minimum threshold for financial statementrecognition of the benefit of a tax position taken or expected to be taken in a tax return. Management hasconcluded there are no significant uncertain tax positions that would require recognition in the financialstatements. If applicable, the Fund recognizes interest accrued related to unrecognized tax benefits in“Interest Expense” and penalties in ‘‘Other Expenses” in the Statement of Operations. The Fund files taxreturns with the U.S. Internal Revenue Service, New York and various states. Each of the tax years in the four-year period ended December 31, 2012, remains subject to examination by taxing authorities.
The tax character of distributions paid may differ from the character of distributions shown in the Statementsof Changes in Net Assets due to short-term capital gains being treated as ordinary income for tax purposes.There were no distributions paid during the years ended 2012 and 2011.
The amount and character of income and gains to be distributed are determined in accordance with incometax regulations which may differ from GAAP. These book/tax differences are either considered temporary orpermanent in nature.
Temporary differences are attributable to differing book and tax treatments for the timing of the recognitionof gains (losses) on certain investment transactions and the timing of the deductibility of certain expenses.
Permanent differences, primarily due to differing treatments of gains (losses) related to foreign currencytransactions, partnership basis adjustments and merger adjustments, resulted in the followingreclassifications among the Fund’s components of net assets at December 31, 2012:
ACCUMULATEDUNDISTRIBUTED
NET INVESTMENTINCOME
ACCUMULATEDUNDISTRIBUTEDNET REALIZED
GAIN PAID-IN-CAPITAL
$1,241,284 $(1,558,309) $317,025
26

Morgan Stanley Focus Growth FundNotes to Financial Statements � June 30, 2013 (unaudited) continued
At December 31, 2012, the components of distributable earnings for the Fund on a tax basis were as follows:UNDISTRIBUTED
ORDINARYINCOME
UNDISTRIBUTEDLONG-TERM
CAPITAL GAIN
$4,063,409 $9,253,411
At June 30, 2013, the aggregate cost for federal income tax purposes approximates the aggregate cost forbook purposes. The aggregate gross unrealized appreciation is $463,436,427 and the aggregate grossunrealized depreciation is $41,227,239 resulting in net unrealized appreciation of $422,209,188.
On December 22, 2010, the Regulated Investment Company Modernization Act of 2010 (the “ModernizationAct”) was signed into law. The Modernization Act modernizes several tax provisions related to RegulatedInvestment Companies (“RICs”) and their shareholders. One key change made by the Modernization Act is thatcapital losses will generally retain their character as short-term or long-term and may be carried forwardindefinitely to offset future gains. These losses are utilized before other capital loss carryforwards that expire.Generally, the Modernization Act is effective for taxable years beginning after December 22, 2010.
To the extent that capital loss carryforwards are used to offset any future capital gains realized during thecarryover period as provided by U.S. Federal income tax regulations, no capital gains tax liability will beincurred by a Fund for gains realized and not distributed. To the extent that capital gains are offset, suchgains will not be distributed to the shareholders. During the year ended December 31, 2012, the Fund utilizedcapital loss carryforwards for U.S. Federal income tax purposes of $5,025,004.
8. Fund MergerOn October 29, 2012, the Fund acquired the net assets of Morgan Stanley Institutional Fund, Inc. —Focus Growth Portfolio (“Focus Growth Portfolio”), an open-end investment company, based on the respectivevaluations as of the close of business on October 26, 2012, pursuant to a Plan of Reorganization approvedby the shareholders of Focus Growth Portfolio on September 27, 2012 (“Reorganization”). The purpose of thetransaction was to combine two portfolios managed by Morgan Stanley Investment Management Inc. withcomparable investment objectives and strategies. The acquisition was accomplished by a tax-free exchangeof 224,564 Class I shares of the Fund at a net asset value of $38.08 per share for 497,097 Class I shares ofFocus Growth Portfolio; 49,523 Class A shares of the Fund at a net asset value of $36.62 for 109,407 ClassP shares of Focus Growth Portfolio; The net assets of Focus Growth Portfolio before the Reorganization were$10,364,940, including unrealized appreciation of $644,700 at October 26, 2012. The investment portfolioof Focus Growth Portfolio, with a fair value of approximately $10,446,536 and identified cost ofapproximately $9,801,822 on October 26, 2012, was the principal asset acquired by the Fund. For financialreporting purposes, assets received and shares issued by the Fund were recorded at fair value; however, thecost basis of the investments received from Focus Growth Portfolio was carried forward to align ongoing
27

Morgan Stanley Focus Growth FundNotes to Financial Statements � June 30, 2013 (unaudited) continued
reporting of the Fund’s realized and unrealized gains and losses with amounts distributable to shareholdersfor tax purposes. Immediately prior to the Reorganization, the net assets of the Fund were approximately$1,496,771,074. Immediately after the merger, the net assets of the Fund were approximately$1,507,136,014.
Upon closing of the Reorganization, shareholders of Focus Growth Portfolio received shares of the Fund asfollows:
FOCUS GROWTHPORTFOLIO
FOCUS GROWTHFUND
Class I Class IClass P Class A
Assuming the acquisition had been completed on January 1, 2012, the beginning of the annual reportingperiod of the Portfolio, the Portfolio’s pro forma results of operations for the year ended December 31, 2012,are as follows:
Net investment loss(1) . . . . . . . . . . . . . . . . . . . . . . . . . . . . . . . . . . . . . . . . . . . . . . . . . . . . . . . . . . . . . . . . . . $ 4,595,239Net gain realized and unrealized gain(2) . . . . . . . . . . . . . . . . . . . . . . . . . . . . . . . . . . . . . . . . . . . . . . . . . . $195,080,867
Net increase (decrease) in net assets resulting from operations . . . . . . . . . . . . . . . . . . . . . . . . . . $199,676,106
(1) Approximately $4,175,184 as reported, plus approximately $232,230 Focus Growth Portfolio premerger, plus approximately$187,825 of estimated pro-forma eliminated expenses.
(2) Approximately $193,932,818 as reported, plus approximately $1,148,049 Focus Growth Portfolio premerger.
Because the combined investment portfolios have been managed as a single integrated portfolio since theacquisition was completed, it is not practicable to separate the amounts of revenue and earnings of FocusGrowth Portfolio that have been included in the Fund’s Statement of Operations since December 31, 2012.
28

Morgan Stanley Focus Growth FundFinancial Highlights
Selected ratios and per share data for a share of beneficial interest outstanding throughout each period:
FOR THE SIXMONTHS ENDEDJUNE 30, 2013
FOR THE YEAR ENDED DECEMBER 31,
2012 2011 2010^ 2009^ 2008^
(unaudited)Class A SharesSelected Per Share Data:Net asset value, beginning of period . . . . . . . . . . . $38.32 $33.63 $35.68 $28.14 $16.23 $34.23
Income (loss) from investment operations:Net investment income (loss)(1) . . . . . . . . . . . . . . 0.00(2) 0.10 (0.10) (0.09) (0.05) (0.13)Net realized and unrealized gain (loss) . . . . . . . 4.74 4.59 (1.95) 7.63 11.96 (17.87)
Total income (loss) from investment operations . . . 4.74 4.69 (2.05) 7.54 11.91 (18.00)
Less dividends and distributions from:Net investment income . . . . . . . . . . . . . . . . . . . . . (0.09) — — — — —Net realized gain . . . . . . . . . . . . . . . . . . . . . . . . . . . (0.25) — — — — —
Total dividends and distributions . . . . . . . . . . . . . . . (0.34) — — — — —
Net asset value, end of period . . . . . . . . . . . . . . . . . $42.72 $38.32 $33.63 $35.68 $28.14 $16.23
Total Return(3) . . . . . . . . . . . . . . . . . . . . . . . . . . . . . . . 12.41 %(7) 13.95% (5.75)% 26.79 % 73.38 % (52.59)%
Ratios to Average Net Assets(4):Net expenses . . . . . . . . . . . . . . . . . . . . . . . . . . . . . . . . . 0.96 %(5)(8) 0.96%(5) 0.96 %(5) 1.02 %(5) 1.12 %(5) 0.99 %(5)
Net investment income (loss) . . . . . . . . . . . . . . . . . . 0.01 %(5)(8) 0.26%(5) (0.28)%(5) (0.30)%(5) (0.24)%(5) (0.48)%(5)
Rebate from Morgan Stanley affiliate . . . . . . . . . . . 0.00 %(6)(8) 0.00%(6) 0.00 %(6) 0.00 %(6) 0.00 %(6) 0.00 %(6)
Supplemental Data:Net assets, end of period, in thousands . . . . . . . . $1,095,540 $1,043,181 $1,016,444 $1,166,135 $1,026,707 $642,610Portfolio turnover rate . . . . . . . . . . . . . . . . . . . . . . . . . 22%(7) 44% 32 % 44 % 11 % 31 %
^ Beginning with the year ended December 31, 2011, the Fund was audited by Ernst & Young LLP. The previous years were auditedby another independent registered public accounting firm.
(1) The per share amounts were computed using an average number of shares outstanding during the period.(2) Amount is less than $0.005.(3) Does not reflect the deduction of sales charge. Calculated based on the net asset value as of the last business day of the period.(4) Reflects overall Fund ratios for investment income and non-class specific expenses.(5) The ratios reflect the rebate of certain Fund expenses in connection with investments in a Morgan Stanley affiliate during the period.
The effect of the rebate on the ratios is disclosed in the above table as “Rebate from Morgan Stanley affiliate.”(6) Amount is less than 0.005%.(7) Not annualized.(8) Annualized.
See Notes to Financial Statements
29
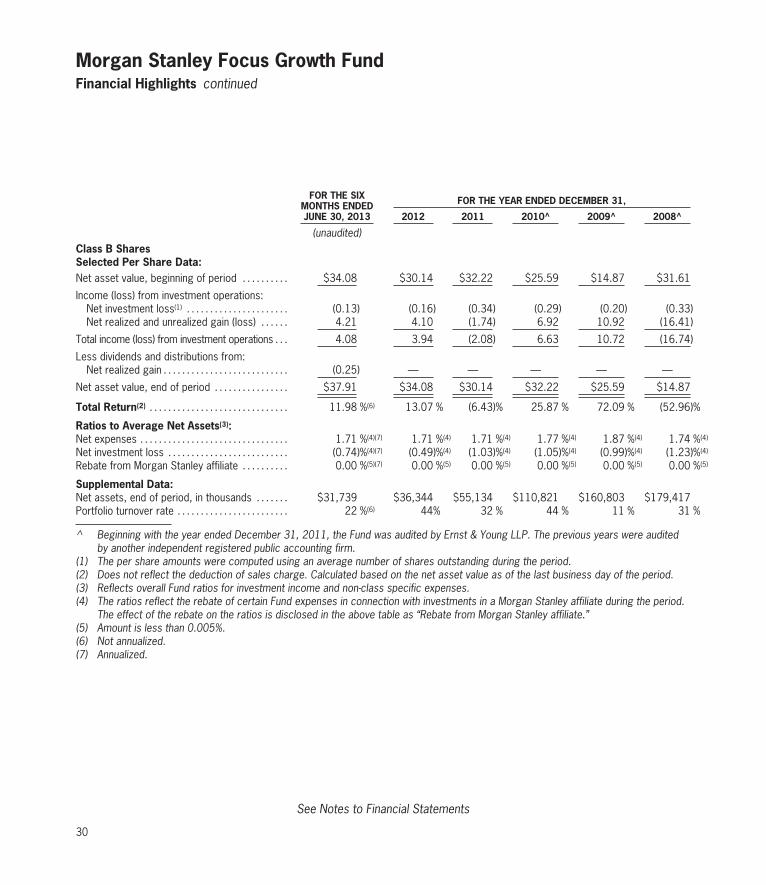
Morgan Stanley Focus Growth FundFinancial Highlights continued
FOR THE SIXMONTHS ENDEDJUNE 30, 2013
FOR THE YEAR ENDED DECEMBER 31,
2012 2011 2010^ 2009^ 2008^
(unaudited)Class B SharesSelected Per Share Data:Net asset value, beginning of period . . . . . . . . . . $34.08 $30.14 $32.22 $25.59 $14.87 $31.61
Income (loss) from investment operations:Net investment loss(1) . . . . . . . . . . . . . . . . . . . . . . (0.13) (0.16) (0.34) (0.29) (0.20) (0.33)Net realized and unrealized gain (loss) . . . . . . 4.21 4.10 (1.74) 6.92 10.92 (16.41)
Total income (loss) from investment operations . . . 4.08 3.94 (2.08) 6.63 10.72 (16.74)
Less dividends and distributions from:Net realized gain . . . . . . . . . . . . . . . . . . . . . . . . . . . (0.25) — — — — —
Net asset value, end of period . . . . . . . . . . . . . . . . $37.91 $34.08 $30.14 $32.22 $25.59 $14.87
Total Return(2) . . . . . . . . . . . . . . . . . . . . . . . . . . . . . . 11.98 %(6) 13.07 % (6.43)% 25.87 % 72.09 % (52.96)%
Ratios to Average Net Assets(3):Net expenses . . . . . . . . . . . . . . . . . . . . . . . . . . . . . . . . 1.71 %(4)(7) 1.71 %(4) 1.71 %(4) 1.77 %(4) 1.87 %(4) 1.74 %(4)
Net investment loss . . . . . . . . . . . . . . . . . . . . . . . . . . (0.74)%(4)(7) (0.49)%(4) (1.03)%(4) (1.05)%(4) (0.99)%(4) (1.23)%(4)
Rebate from Morgan Stanley affiliate . . . . . . . . . . 0.00 %(5)(7) 0.00 %(5) 0.00 %(5) 0.00 %(5) 0.00 %(5) 0.00 %(5)
Supplemental Data:Net assets, end of period, in thousands . . . . . . . $31,739 $36,344 $55,134 $110,821 $160,803 $179,417Portfolio turnover rate . . . . . . . . . . . . . . . . . . . . . . . . 22 %(6) 44% 32 % 44 % 11 % 31 %
^ Beginning with the year ended December 31, 2011, the Fund was audited by Ernst & Young LLP. The previous years were auditedby another independent registered public accounting firm.
(1) The per share amounts were computed using an average number of shares outstanding during the period.(2) Does not reflect the deduction of sales charge. Calculated based on the net asset value as of the last business day of the period.(3) Reflects overall Fund ratios for investment income and non-class specific expenses.(4) The ratios reflect the rebate of certain Fund expenses in connection with investments in a Morgan Stanley affiliate during the period.
The effect of the rebate on the ratios is disclosed in the above table as “Rebate from Morgan Stanley affiliate.”(5) Amount is less than 0.005%.(6) Not annualized.(7) Annualized.
See Notes to Financial Statements
30

Morgan Stanley Focus Growth FundFinancial Highlights continued
FOR THE SIXMONTHS ENDEDJUNE 30, 2013
FOR THE YEAR ENDED DECEMBER 31,
2012 2011 2010^ 2009^ 2008^
(unaudited)Class L SharesSelected Per Share Data:Net asset value, beginning of period . . . . . . . . . . . . . . $33.74 $29.84 $31.90 $25.34 $14.73 $31.30
Income (loss) from investment operations:Net investment loss(1) . . . . . . . . . . . . . . . . . . . . . . . . . . (0.10) (0.16) (0.34) (0.28) (0.19) (0.31)Net realized and unrealized gain (loss) . . . . . . . . . . 4.18 4.06 (1.72) 6.84 10.80 (16.26)
Total income (loss) from investment operations . . . . . . 4.08 3.90 (2.06) 6.56 10.61 (16.57)
Less dividends and distributions from:Net realized gain . . . . . . . . . . . . . . . . . . . . . . . . . . . . . . . (0.25) — — — — —
Net asset value, end of period . . . . . . . . . . . . . . . . . . . . $37.57 $33.74 $29.84 $31.90 $25.34 $14.73
Total Return(2) . . . . . . . . . . . . . . . . . . . . . . . . . . . . . . . . . . 12.10 %(6) 13.07 % (6.46)% 25.89 % 72.03 % (52.94)%
Ratios to Average Net Assets(3):Net expenses . . . . . . . . . . . . . . . . . . . . . . . . . . . . . . . . . . . . 1.53 %(4)(7) 1.71 %(4) 1.71 %(4) 1.77 %(4) 1.87 %(4) 1.74 %(4)
Net investment loss . . . . . . . . . . . . . . . . . . . . . . . . . . . . . . (0.56)%(4)(7) (0.49)%(4) (1.03)%(4) (1.05)%(4) (0.99)%(4) (1.23)%(4)
Rebate from Morgan Stanley affiliate . . . . . . . . . . . . . . 0.00 %(5)(7) 0.00 %(5) 0.00 %(5) 0.00 %(5) 0.00 %(5) 0.00 %(5)
Supplemental Data:Net assets, end of period, in thousands . . . . . . . . . . . $71,401 $69,420 $63,048 $71,158 $64,739 $45,406Portfolio turnover rate . . . . . . . . . . . . . . . . . . . . . . . . . . . . 22 %(6) 44 % 32 % 44 % 11 % 31 %
^ Beginning with the year ended December 31, 2011, the Fund was audited by Ernst & Young LLP. The previous years were auditedby another independent registered public accounting firm.
(1) The per share amounts were computed using an average number of shares outstanding during the period.(2) Does not reflect the deduction of sales charge. Calculated based on the net asset value as of the last business day of the period.
Effective February 25, 2013, Class C shares were renamed Class L shares. Class C shares held for less than one year were subjectto a 1.0% contingent deferred sales charge. The contingent deferred sales charge on Class L shares was eliminated effectiveFebruary 25, 2013.
(3) Reflects overall Fund ratios for investment income and non-class specific expenses.(4) The ratios reflect the rebate of certain Fund expenses in connection with investments in a Morgan Stanley affiliate during the period.
The effect of the rebate on the ratios is disclosed in the above table as “Rebate from Morgan Stanley affiliate.”(5) Amount is less than 0.005%.(6) Not annualized.(7) Annualized.
See Notes to Financial Statements
31

Morgan Stanley Focus Growth FundFinancial Highlights continued
FOR THE SIXMONTHS ENDEDJUNE 30, 2013
FOR THE YEAR ENDED DECEMBER 31,
2012 2011 2010^ 2009^ 2008^
(unaudited)Class I SharesSelected Per Share Data:Net asset value, beginning of period . . . . . . . . . . . $39.86 $34.90 $36.94 $29.05 $16.72 $35.17
Income (loss) from investment operations:Net investment income (loss)(1) . . . . . . . . . . . . . . 0.06 0.20 (0.01) (0.01) 0.00(2) (0.07)Net realized and unrealized gain (loss) . . . . . . . 4.94 4.76 (2.03) 7.90 12.33 (18.38)
Total income (loss) from investment operations . . . 5.00 4.96 (2.04) 7.89 12.33 (18.45)
Less dividends and distributions from:Net investment income . . . . . . . . . . . . . . . . . . . . . . (0.20) — — — — —Net realized gain . . . . . . . . . . . . . . . . . . . . . . . . . . . (0.25) — — — — —
Total dividends and distributions . . . . . . . . . . . . . . . (0.45) — — — — —
Net asset value, end of period . . . . . . . . . . . . . . . . . $44.41 $39.86 $34.90 $36.94 $29.05 $16.72
Total Return(3) . . . . . . . . . . . . . . . . . . . . . . . . . . . . . . . 12.55 %(7) 14.18% (5.50)% 27.16 % 73.74% (52.46)%
Ratios to Average Net Assets(4):Net expenses . . . . . . . . . . . . . . . . . . . . . . . . . . . . . . . . . 0.71 %(5)(8) 0.71%(5) 0.71 %(5) 0.77 %(5) 0.87%(5) 0.74 %(5)
Net investment income (loss) . . . . . . . . . . . . . . . . . . 0.26 %(5)(8) 0.51%(5) (0.03)%(5) (0.05)%(5) 0.01%(5) (0.23)%(5)
Rebate from Morgan Stanley affiliate . . . . . . . . . . . 0.00 %(6)(8) 0.00%(6) 0.00 %(6) 0.00 %(6) 0.00%(6) 0.00 %(6)
Supplemental Data:Net assets, end of period, in thousands . . . . . . . . $392,632 $366,571 $328,775 $385,571 $296,944 $240,596Portfolio turnover rate . . . . . . . . . . . . . . . . . . . . . . . . . 22 %(7) 44% 32 % 44 % 11 % 31 %
^ Beginning with the year ended December 31, 2011, the Fund was audited by Ernst & Young LLP. The previous years were auditedby another independent registered public accounting firm.
(1) The per share amounts were computed using an average number of shares outstanding during the period.(2) Amount is less than $0.005.(3) Calculated based on the net asset value as of the last business day of the period.(4) Reflects overall Fund ratios for investment income and non-class specific expenses.(5) The ratios reflect the rebate of certain Fund expenses in connection with investments in a Morgan Stanley affiliate during the period.
The effect of the rebate on the ratios is disclosed in the above table as “Rebate from Morgan Stanley affiliate.”(6) Amount is less than 0.005%.(7) Not annualized.(8) Annualized.
See Notes to Financial Statements
32
Morgan Stanley Focus Growth FundU.S. Privacy Policy (unaudited)
An Important Notice Concerning Our U.S. Privacy Policy
This privacy notice describes the U.S. privacy policy of Morgan Stanley Distribution, Inc., and the MorganStanley family of mutual funds (“us”, “our”, “we”).
We are required by federal law to provide you with notice of our U.S. privacy policy (“Policy”). This Policyapplies to both our current and former clients unless we state otherwise and is intended for individual clientswho purchase products or receive services from us for personal, family or household purposes. This Policy isnot applicable to partnerships, corporations, trusts or other non-individual clients or account holders, nor isthis Policy applicable to individuals who are either beneficiaries of a trust for which we serve as trustee orparticipants in an employee benefit plan administered or advised by us. This Policy is, however, applicable toindividuals who select us to be a custodian of securities or assets in individual retirement accounts, 401(k)accounts, or accounts subject to the Uniform Gifts to Minors Act.
This notice sets out our business practices to protect your privacy; how we collect and share personalinformation about you; and how you can limit our sharing or certain uses by others of this information. Wemay amend this Policy at any time, and will inform you of any changes to our Policy as required by law.
We Respect Your PrivacyWe appreciate that you have provided us with your personal financial information and understand yourconcerns about your information. We strive to safeguard the information our clients entrust to us. Protectingthe confidentiality and security of client information is an important part of how we conduct our business.
This notice describes what personal information we collect about you, how we collect it, when we may share itwith others, and how certain others may use it. It discusses the steps you may take to limit our sharing ofcertain information about you with our affiliated companies, including, but not limited to our affiliated bankingbusinesses, brokerage firms and credit service affiliates. It also discloses how you may limit our affiliates’ useof shared information for marketing purposes.
Throughout this Policy, we refer to the nonpublic information that personally identifies you as “personalinformation.” We also use the term “affiliated company” in this notice. An affiliated company is a company inour family of companies and includes companies with the Morgan Stanley name. These affiliated companiesare financial institutions such as broker-dealers, banks, investment advisers and credit card issuers. We referto any company that is not an affiliated company as a nonaffiliated third party. For purposes of Section 5 ofthis notice, and your ability to limit certain uses of personal information by our affiliates, this notice applies tothe use of personal information by our affiliated companies.
33

Morgan Stanley Focus Growth FundU.S. Privacy Policy (unaudited) continued
1. What Personal Information Do We Collect From You?We may collect the following types of information about you: (i) information provided by you, includinginformation from applications and other forms we receive from you, (ii) information about your transactionswith us or our affiliates, (iii) information about your transactions with nonaffiliated third parties, (iv) informationfrom consumer reporting agencies, (v) information obtained from our websites, and (vi) information obtainedfrom other sources. For example:
• We collect information such as your name, address, e-mail address, telephone/fax numbers, assets,income and investment objectives through applications and other forms you submit to us.
• We may obtain information about account balances, your use of account(s) and the types of products andservices you prefer to receive from us through your dealings and transactions with us and other sources.
• We may obtain information about your creditworthiness and credit history from consumer reportingagencies.
• We may collect background information from and through third-party vendors to verify representations youhave made and to comply with various regulatory requirements.
2. When Do We Disclose Personal Information We Collect About You?We may disclose personal information we collect about you in each of the categories listed above to affiliatedand nonaffiliated third parties.
a. Information We Disclose to Affiliated Companies. We may disclose personal information that wecollect about you to our affiliated companies to manage your account(s) effectively, to service and processyour transactions, and to let you know about products and services offered by us and affiliated companies, tomanage our business, and as otherwise required or permitted by law. Offers for products and services fromaffiliated companies are developed under conditions designed to safeguard your personal information.
b. Information We Disclose to Third Parties. We may disclose personal information that we collectabout you to nonaffiliated third parties to provide marketing services on our behalf or to other financialinstitutions with whom we have joint marketing agreements. We may also disclose all of the information wecollect to other nonaffiliated third parties for our everyday business purposes, such as to processtransactions, maintain account(s), respond to court orders and legal investigations, report to credit bureaus,offer our own products and services, protect against fraud, for institutional risk control, to perform serviceson our behalf, and as otherwise required or permitted by law.
When we share personal information about you with a nonaffiliated third party, they are required to limit theiruse of personal information about you to the particular purpose for which it was shared and they are notallowed to share personal information about you with others except to fulfill that limited purpose or as may bepermitted or required by law.
34

Morgan Stanley Focus Growth FundU.S. Privacy Policy (unaudited) continued
3. How Do We Protect The Security and Confidentiality Of Personal Information We Collect AboutYou?We maintain physical, electronic and procedural security measures that comply with applicable law andregulations to help safeguard the personal information we collect about you. We have internal policiesgoverning the proper handling of client information by employees. Third parties that provide support ormarketing services on our behalf may also receive personal information about you, and we require them toadhere to appropriate security standards with respect to such information.
4. How Can You Limit Our Sharing Certain Personal Information About You With Our AffiliatedCompanies For Eligibility Determination?By following the opt-out procedures in Section 6 below, you may limit the extent to which we share with ouraffiliated companies, personal information that was collected to determine your eligibility for products andservices such as your credit reports and other information that you have provided to us or that we may obtainfrom third parties (“eligibility information”). Eligibility information does not include your identificationinformation or personal information pertaining to our transactions or experiences with you. Please note that,even if you direct us not to share eligibility information with our affiliated companies, we may still share yourpersonal information, including eligibility information, with our affiliated companies under circumstances thatare permitted under applicable law, such as to process transactions or to service your account.
5. How Can You Limit the Use of Certain Personal Information About You by Our AffiliatedCompanies for Marketing?By following the opt-out instructions in Section 6 below, you may limit our affiliated companies from marketingtheir products or services to you based on personal information we disclose to them. This information mayinclude, for example, your income and account history with us. Please note that, even if you choose to limitour affiliated companies from using personal information about you that we may share with them formarketing their products and services to you, our affiliated companies may use your personal information thatthey obtain from us to market to you in circumstances permitted by law, such as if the affiliated party has itsown relationship with you.
6. How Can You Send Us an Opt-Out Instruction?If you wish to limit our sharing of eligibility information about you with our affiliated companies, or our affiliatedcompanies’ use of personal information for marketing purposes, as described in this notice, you may do soby:
• Calling us at (800) 548-7786Monday-Friday between 8 a.m. and 5 p.m. (EST)
35

Morgan Stanley Focus Growth FundU.S. Privacy Policy (unaudited) continued
• Writing to us at the following address:Boston Financial Data Services, Inc.c/o Privacy CoordinatorP.O. Box 219804Kansas City, Missouri 64121
If you choose to write to us, your request should include: your name, address, telephone number and accountnumber(s) to which the opt-out applies and whether you are opting out with respect to sharing of eligibilityinformation (Section 4 above), or information used for marketing (Section 5 above), or both. Written opt-outrequests should not be sent with any other correspondence. In order to process your request, we require thatthe request be provided by you directly and not through a third party. Once you have informed us about yourprivacy preferences, your opt-out preference will remain in effect with respect to this Policy (as it may beamended) until you notify us otherwise. If you are a joint account owner, we will accept instructions from anyone of you and apply those instructions to the entire account.
Please understand that if you limit our sharing or our affiliated companies’ use of personal information, youand any joint account holder(s) may not receive information about our affiliated companies’ products andservices, including products or services that could help you manage your financial resources and achieveyour investment objectives.
If you have more than one account or relationship with us, please specify the accounts to which you would likeus to apply your privacy choices. If you have accounts or relationships with our affiliates, you may receivemultiple privacy policies from them, and will need to separately notify those companies of your privacychoices for those accounts or relationships.
7. What if an affiliated company becomes a nonaffiliated third party?If, at any time in the future, an affiliated company becomes a nonaffiliated third party, further disclosures ofpersonal information made to the former affiliated company will be limited to those described in Section 2(b)above relating to nonaffiliated third parties. If you elected under Section 6 to limit disclosures we make toaffiliated companies, or use of personal information by affiliated companies, your election will not apply to useby any former affiliated company of your personal information in their possession once it becomes anonaffiliated third party.
36

Morgan Stanley Focus Growth FundU.S. Privacy Policy (unaudited) continued
Special Notice to Residents of VermontThe following section supplements our Policy with respect to our individual clients who have aVermont address and supersedes anything to the contrary in the above Policy with respect tothose clients only.
The State of Vermont requires financial institutions to obtain your consent prior to sharing personalinformation that they collect about you with nonaffiliated third parties, or eligibility information with affiliatedcompanies, other than in certain limited circumstances. Except as permitted by law, we will not sharepersonal information we collect about you with nonaffiliated third parties or eligibility information withaffiliated companies, unless you provide us with your written consent to share such information.
Special Notice to Residents of CaliforniaThe following section supplements our Policy with respect to our individual clients who have aCalifornia address and supersedes anything to the contrary in the above Policy with respect tothose clients only.
In response to a California law, if your account has a California home address, your personal informationwill not be disclosed to nonaffiliated third parties except as permitted by applicable California law, and wewill limit sharing such personal information with our affiliates to comply with California privacy laws thatapply to us.
37

(This Page Intentionally Left Blank)

(This Page Intentionally Left Blank)