Investment Management 314 Complete - StudentSummaries · 2018-05-21 · x Low transaction costs ,...
15
Investment Management 314 Complete
Transcript of Investment Management 314 Complete - StudentSummaries · 2018-05-21 · x Low transaction costs ,...

Investment
Management 314
Complete

Chapter 4 SECURITIES MARKETS: ORGANISATION AND OPERATION
The Market
A market is the means through which buyers and sellers are brought together to aid in the transfer of
goods and services. A market need not have a physical location; it is only necessary that the buyers
and sellers can communicate regarding the relevant aspects of the transaction.
The market does not necessarily own the goods and services but provides information and facilities
to aid in the transfer of ownership.
A market can deal in a variety of goods and services.
Both buyers and sellers benefit from the existence of a market.
Characteristics of a Good Market
Timely and accurate information on the price and volume of past transactions.
Liquidity, meaning an asset can be bought or sold quickly at a price close to the prices for previous
transactions (has price continuity), assuming no new information has been received. In turn, price
continuity requires depth.
Low transaction costs, including the cost of reaching the market, the actual brokerage costs, and the
cost of transferring the asset.
Prices that adjust rapidly to new information, so the prevailing price is fair since it reflects all
available information regarding the asset.
Organization of Securities Market
Securities market is split into the primary market, where new securities are sold, and secondary
markets, where outstanding securities are bought and sold.
Markets may be formal or informal.
Primary Capital Markets
The primary market is where new issues of bonds, preferred stock, or common stock are sold by
government units, municipalities, or companies who want to acquire new capital.
Secondary Financial Markets
Secondary markets permit trading in outstanding issues; stocks or bonds already sold to the public
are traded between current and potential owners.
The proceeds from a sale in the secondary market do not go to the issuing unit (the government,
municipality, or company), but rather to the owner of the security.
Importance of Secondary Markets
Because the secondary market involves the trading of securities initially sold in the primary market,
it provides liquidity to the individuals who acquired these securities.

A margin call is the call to provide more equity if the owner’s equity drops below the maintenance
margin.
Short Sales
A short sale is the sale of a stock that one does not own with the intent of purchasing it back later at a
lower price.
Specifically, one borrows the stock from another investor through a broker and sells it in the market.
Subsequently, one replaces it by buying at a potentially lower price than the price at which one sold
it. This is referred to as covering the short position.
Formulae 𝒊 = 𝑽 − 𝑫 𝒊 𝑩 𝑽
Where:
Market Value = Price x Number of Shares
Debit Balance = Initial Loan Value
𝑹 𝑹 = 𝑷 𝒊𝑰 𝒊 𝒊 𝑰
Where:
Initial investment = Price x Number of Shares x Margin Requirement + Commission on Buy 𝑭 = 𝟏𝑷 𝒊 𝑹 𝒊
Profit = Ending Value - Beginning Value + Dividends - Transaction Costs - Interest
Example 4.1
Seth Freeman has a margin account at Bank X with a balance of R150 000. The initial margin required is
60% and BHP Billiton is trading at R275 per share. If the required maintenance margin is 25%, to what
price can BHP Billiton fall before Seth receives a margin call?
Solution
X = Total Investment
0.6X = R150 000 ∴ X = R250 000
R250 000/R275 = 909 shares
Debit balance = R250 000 - R150 000 = R100 000
Market Value = 909P
0.25 = (909P - R100 000) / (909P) ∴ P = R146.68
Example 4.2
You decide to sell 100 shares of Topgun Enterprises Inc short when it is selling at its yearly high of $42.25.
Your broker tells you that your margin requirement is 60% and that the commission on the sale is $20.
Chapter 5 SECURITIES MARKETS: MARKET INDEXES
Uses of Security-Market Indexes
Security-market indexes have at least five significant uses:
1. As benchmarks to evaluate the performance of professional money managers.
2. To create and monitor an index fund.
3. To measure market rates of return in economic studies.
4. For predicting future market movements by technicians.
5. As a proxy for the market portfolio of risky assets when calculating the systematic risk of an
asset.
Indexes
Because the indicator series are intended to reflect the overall movements of a group of securities, it
is necessary to consider which factors are important when constructing an index that is intended to
represent a total population.
The Sample
The size of the sample, the breadth of the sample, and the source of the sample used to construct a
series are all important.
A small percentage of the total population will provide valid indications of the behaviour of the total
population if the sample is properly selected.
At some point the costs of taking a larger sample will almost certainly outweigh any benefits of
increased size. The sample should be representative of the total population; otherwise, its size will be
meaningless.
The source of the sample is important if there are any differences between segments of the
population, in which case samples from each segment are required.
Weighting Sample Members
Our second concern is with the weight given to each member in the sample.
Three principal weighting schemes are used: (1) a price-weighted series, (2) a market-value-
weighted series, and (3) an unweighted series, or what would be described as an equally weighted
series.
Computational Procedure
Our final consideration is selecting the computational procedure. One alternative is to take a simple
arithmetic average of the various members in the series.
Another is to compute an index and have all changes, whether in price or value, reported in terms of
the basic index. Finally, some prefer using a geometric average of the components rather than an
arithmetic average.
- Mid-cap growth
- Mid-cap value
- Large-cap growth
- Large-cap value
Test and Exam Practice Questions
Example 5.1:
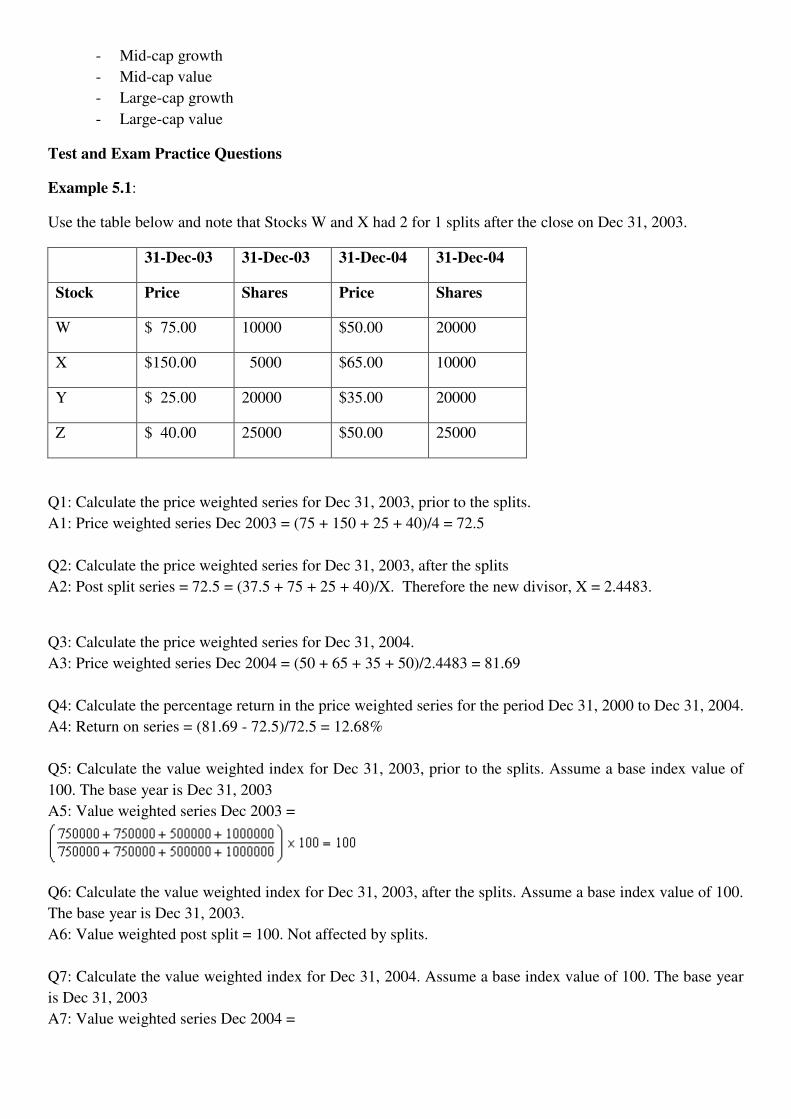
Use the table below and note that Stocks W and X had 2 for 1 splits after the close on Dec 31, 2003.
31-Dec-03 31-Dec-03 31-Dec-04 31-Dec-04
Stock Price Shares Price Shares
W $ 75.00 10000 $50.00 20000
X $150.00 5000 $65.00 10000
Y $ 25.00 20000 $35.00 20000
Z $ 40.00 25000 $50.00 25000
Q1: Calculate the price weighted series for Dec 31, 2003, prior to the splits.
A1: Price weighted series Dec 2003 = (75 + 150 + 25 + 40)/4 = 72.5
Q2: Calculate the price weighted series for Dec 31, 2003, after the splits
A2: Post split series = 72.5 = (37.5 + 75 + 25 + 40)/X. Therefore the new divisor, X = 2.4483.
Q3: Calculate the price weighted series for Dec 31, 2004.
A3: Price weighted series Dec 2004 = (50 + 65 + 35 + 50)/2.4483 = 81.69
Q4: Calculate the percentage return in the price weighted series for the period Dec 31, 2000 to Dec 31, 2004.
A4: Return on series = (81.69 - 72.5)/72.5 = 12.68%
Q5: Calculate the value weighted index for Dec 31, 2003, prior to the splits. Assume a base index value of
100. The base year is Dec 31, 2003
A5: Value weighted series Dec 2003 =
Q6: Calculate the value weighted index for Dec 31, 2003, after the splits. Assume a base index value of 100.
The base year is Dec 31, 2003.
A6: Value weighted post split = 100. Not affected by splits.
Q7: Calculate the value weighted index for Dec 31, 2004. Assume a base index value of 100. The base year
is Dec 31, 2003
A7: Value weighted series Dec 2004 =

Chapter 10
ANALYSIS OF FINANCIAL STATEMENTS
Major Financial Statements
Financial statements provide information on the resources available to management, how these
resources were financed, and what the firm accomplished with them.
Corporate shareholder annual and quarterly reports include three required financial statements: the
balance sheet, the income statement, and the statement of cash flows.
Information from the basic financial statements can be used to calculate financial ratios and to
analyse the operations of the firm to determine what factors influence a firm’s earnings, cash flows,
and risk characteristics.
Generally Accepted Accounting Principles
Among the input used to construct the financial statements are generally accepted accounting
principles (GAAP), which are formulated by the Financial Accounting Standards Board (FASB).
The FASB allows companies some flexibility to choose among appropriate GAAP. This flexibility
allows the firm’s managers to choose accounting standards that best reflect company practice. On the
negative side, this flexibility can allow firms to appear healthier than they really are.
The Balance Sheet
The balance sheet shows what resources (assets) the firm controls and how it has financed these
assets. Specifically, it indicates the current and fixed assets available to the firm at a point in time
(the end of the fiscal year or the end of a quarter).
The Income Statement
The income statement contains information on the profitability of the firm during some period of
time (a quarter or a year).
The income statement indicates the flow of sales, expenses, and earnings during a period of time.
The Statement of Cash Flows
The statement of cash flows integrates the information on the balance sheet and income statement.
For a given period, it shows the effects on the firm’s cash flow of income flows (based on the most
recent year’s income statement) and changes in various items on the balance sheet (based on the two
most recent annual balance sheets).
The result is a set of cash flow values that you can use to estimate the value of a firm and to evaluate
the risk and return of the firm’s bonds and stock.
The sum total of the cash flows from the three sections is the net change in the cash position of the
firm. This bottom-line number should equal the difference in the cash balance between the ending
and beginning balance sheets.
The statement of cash flows has three sections: cash flows from operating activities, cash flows from
investing activities, and cash flows from financing activities.
- Cash Flow from Operating Activities lists the sources and uses of cash that arise from the
normal operations of a firm.
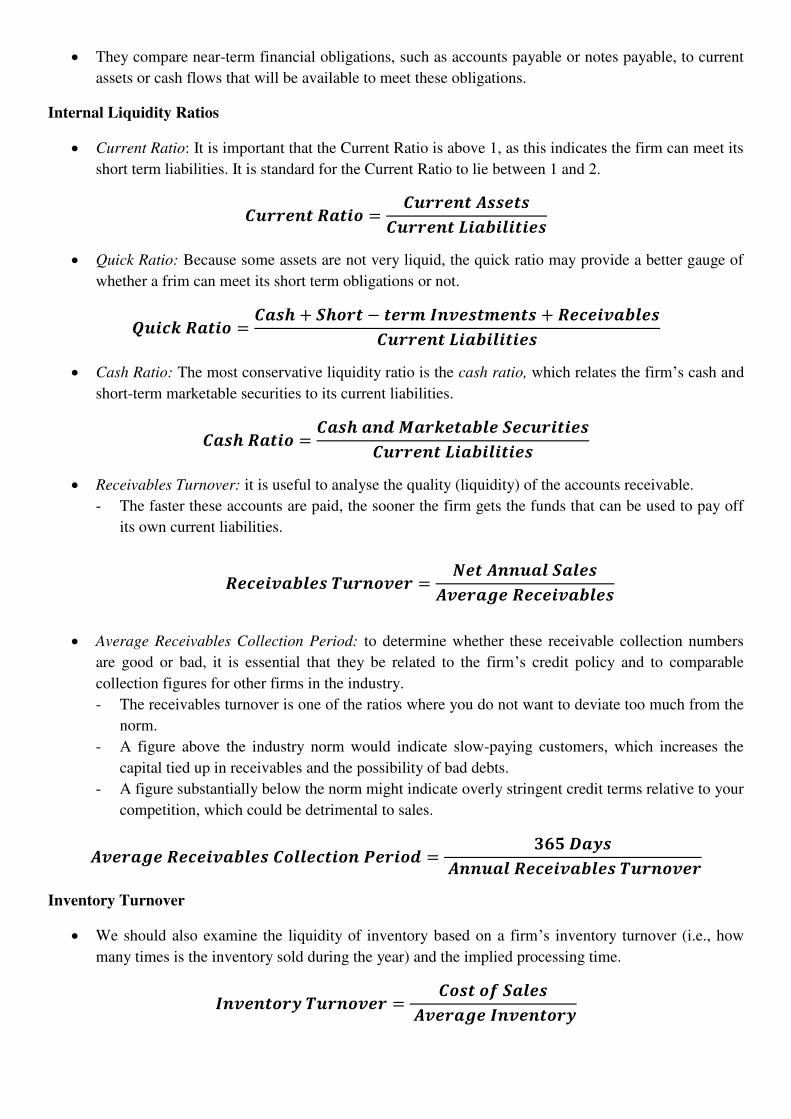
They compare near-term financial obligations, such as accounts payable or notes payable, to current
assets or cash flows that will be available to meet these obligations.
Internal Liquidity Ratios
Current Ratio: It is important that the Current Ratio is above 1, as this indicates the firm can meet its
short term liabilities. It is standard for the Current Ratio to lie between 1 and 2. =
Quick Ratio: Because some assets are not very liquid, the quick ratio may provide a better gauge of
whether a frim can meet its short term obligations or not. = + − 𝑰 +
Cash Ratio: The most conservative liquidity ratio is the cash ratio, which relates the firm’s cash and
short-term marketable securities to its current liabilities. =
Receivables Turnover: it is useful to analyse the quality (liquidity) of the accounts receivable.
- The faster these accounts are paid, the sooner the firm gets the funds that can be used to pay off
its own current liabilities.
=
Average Receivables Collection Period: to determine whether these receivable collection numbers
are good or bad, it is essential that they be related to the firm’s credit policy and to comparable
collection figures for other firms in the industry.
- The receivables turnover is one of the ratios where you do not want to deviate too much from the
norm.
- A figure above the industry norm would indicate slow-paying customers, which increases the
capital tied up in receivables and the possibility of bad debts.
- A figure substantially below the norm might indicate overly stringent credit terms relative to your
competition, which could be detrimental to sales. = 𝟑
Inventory Turnover
We should also examine the liquidity of inventory based on a firm’s inventory turnover (i.e., how
many times is the inventory sold during the year) and the implied processing time. 𝑰 = 𝑰

Fixed Assets 41
Total Assets 245
Working Capital 123
Total Debt 16
Equity 159
1. Calculate the operating margin.
Operating margin = (38 - 3)/542 = 6.5%
2. Calculate the asset turnover ratio.
Asset turnover = 542/245 = 2.2
3. Calculate the interest expense rate.
Interest expense rate = 3/245 = 1.2%
4. Calculate the financial leverage.
Financial leverage = 245/159 = 1.54
5. Calculate the income tax rate
Income tax rate = 13/32 = 40.6%
6. Calculate the return on equity (ROE).
ROE = [(6.5)(2.2)- 1.2](1.54)(1 - 0.406) = 12%
Example 10.4 (Problem 2 in R&R)
a) ROE = Net profit margin x Total asset turnover x Total assets/equity
Company K: ROE = 0.04 x 2.2 x 2.4 = 0.2112
Company L: ROE = 0.06 x 2.0 x 2.2 = 0.2640
Company M: ROE = 0.10 x 1.4 x 1.5 = 0.2100
b) Growth Rate = Retention Rate x ROE = (1 - Payout Rate) x ROE
Company K: Growth Rate = 1 – (1.25/2.75) x 0.2112 = 0.545 x .2112 = 0.1151
Company L: Growth Rate = 1 – (1.00/3.00) x 0.2640 = 0.67 x 0.2640 = 0.1769
Company M: Growth Rate = 1 – (1.00/4.50) x 0.2100 = 0.778 x 0.21 = 0.1634
Example 10.5
The DuPont formula defines the net return on shareholders’ equity as a function of the following
components: Operating margin, Asset turnover, Interest burden, Financial leverage and Income tax rate.
Using only the data in the following table:
a. Calculate each of the five components listed for 1999 and 2003, and calculate the return on equity
(ROE) for 1999 and 2003, using all of the five components. Show calculations.
b. Briefly discuss the impact of the changes in asset turnover and financial leverage on the change in ROE
from 1999 to 2003.
Chapter 12
Macro-analysis and Micro-valuation of the Stock Market
The Components of Market Analysis
Market analysis has two components: the macro-analysis of the relationship between the aggregate
securities markets and the aggregate economy, and the specific micro-valuation of the stock market.
The macro-analysis is in response to the belief that security markets reflect what is expected to go on
in the economy, because the value of an investment is determined by its expected cash flows and its
expected required rate of return.
Both of these valuations factors are influenced by the aggregate economic environment.
Macro-economy and market analysis provides important insights for subsequent industry and
company analysis.
The microanalysis builds on these macro insights by deriving a specific valuation for the market.
Macro-market Analysis
Fluctuations in security markets are related to changes in the aggregate economy.
Individual stock prices reflect investor expectations about an issuing firm’s performance in terms of
earnings, cash flow, and the investor’s required rate of return.
Economic Activity and Security Markets
Economic series can be classified into three groups: leading, coincident, and lagging indicator series.
Extensive analysis of the relationship between the economy and the stock market has shown that
stock prices are one of the better leading indicator series.
Stock prices consistently turn before the economy does.
There are two possible reasons why stock prices lead the economy.
One is that stock prices reflect expectations of earnings, dividends, and interest rates.
- As investors attempt to estimate these future variables, their stock price decisions reflect
expectations for future economic activity, not current activity.
A second possible reason is that the stock market reacts to various leading indicator series, the most
important being corporate earnings, corporate profit margins, interest rates, and changes in the
growth rate of the money supply.
- Because these series tend to lead the economy, when investors adjust stock prices to reflect
expectations for these leading economic series, it makes stock prices a leading series as well.
The Cyclical Indicator Approach
The cyclical indicator approach to forecasting the economy contends that the aggregate economy
expands and contracts in discernible periods.
Cyclical Indicator Categories
The first category, leading indicators of the business cycle, includes economic series that usually
reach peaks or troughs before corresponding peaks or troughs in aggregate economic activity.
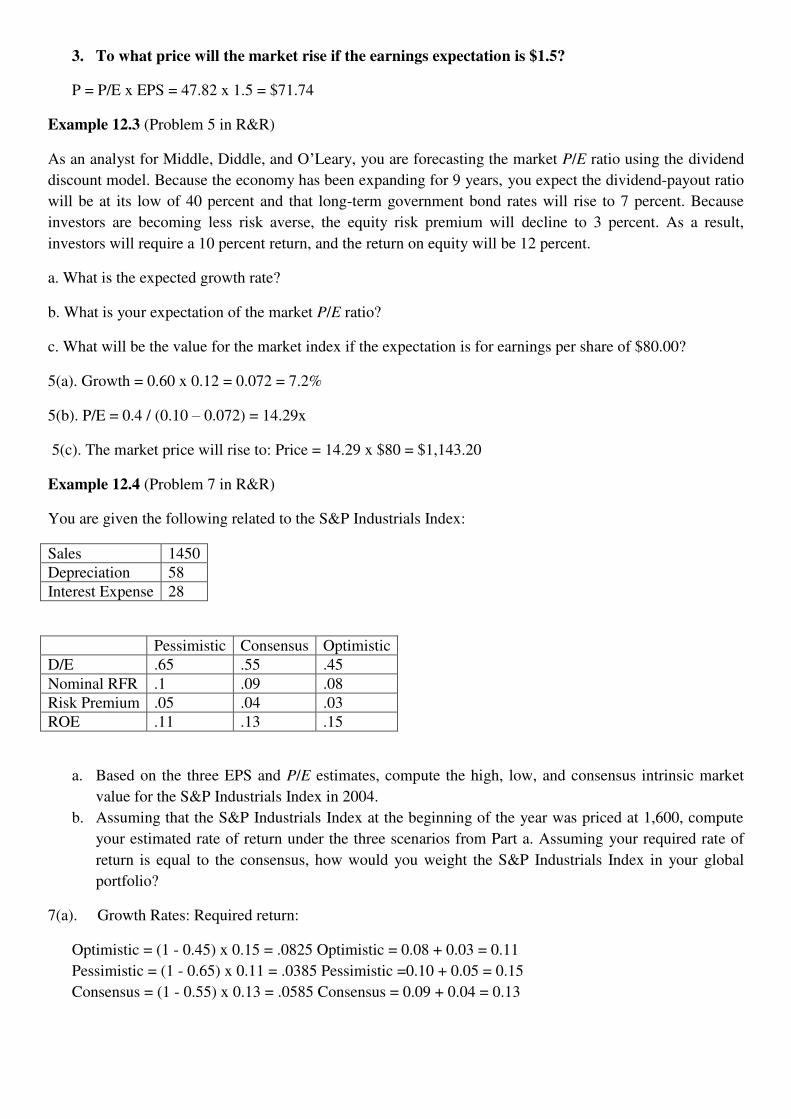
3. To what price will the market rise if the earnings expectation is $1.5?
P = P/E x EPS = 47.82 x 1.5 = $71.74
Example 12.3 (Problem 5 in R&R)
As an analyst for Middle, Diddle, and O’Leary, you are forecasting the market P/E ratio using the dividend
discount model. Because the economy has been expanding for 9 years, you expect the dividend-payout ratio
will be at its low of 40 percent and that long-term government bond rates will rise to 7 percent. Because
investors are becoming less risk averse, the equity risk premium will decline to 3 percent. As a result,
investors will require a 10 percent return, and the return on equity will be 12 percent.
a. What is the expected growth rate?
b. What is your expectation of the market P/E ratio?
c. What will be the value for the market index if the expectation is for earnings per share of $80.00?
5(a). Growth = 0.60 x 0.12 = 0.072 = 7.2%
5(b). P/E = 0.4 / (0.10 – 0.072) = 14.29x
5(c). The market price will rise to: Price = 14.29 x $80 = $1,143.20
Example 12.4 (Problem 7 in R&R)
You are given the following related to the S&P Industrials Index:
Sales 1450
Depreciation 58
Interest Expense 28
Pessimistic Consensus Optimistic
D/E .65 .55 .45
Nominal RFR .1 .09 .08
Risk Premium .05 .04 .03
ROE .11 .13 .15
a. Based on the three EPS and P/E estimates, compute the high, low, and consensus intrinsic market
value for the S&P Industrials Index in 2004.
b. Assuming that the S&P Industrials Index at the beginning of the year was priced at 1,600, compute
your estimated rate of return under the three scenarios from Part a. Assuming your required rate of
return is equal to the consensus, how would you weight the S&P Industrials Index in your global
portfolio?
7(a). Growth Rates: Required return:
Optimistic = (1 - 0.45) x 0.15 = .0825 Optimistic = 0.08 + 0.03 = 0.11
Pessimistic = (1 - 0.65) x 0.11 = .0385 Pessimistic =0.10 + 0.05 = 0.15
Consensus = (1 - 0.55) x 0.13 = .0585 Consensus = 0.09 + 0.04 = 0.13

Chapter 13
Industry Analysis
Why do Industry Analysis?
Investment practitioners perform industry analysis because they believe it helps them isolate
investment opportunities that have favourable return-risk characteristics.
Cross-Sectional Industry Performance
Studies of the annual industry performance have found that different industries have consistently
shown wide dispersion in their rates of return
These results imply that industry analysis is important and necessary to uncover these substantial
performance differences that will help identify both unprofitable and profitable opportunities.
Investigators have found almost no association in individual industry performance year to year or
over sequential rising or falling markets.
These time-series studies imply that past performance alone does not help project future industry
performance.
Variables that affect industry performance change over time and each year it is necessary to project
the future performance for individual industries on the basis of future estimates of these relevant
variables.
Studies have found wide dispersion in the performance among companies in most industries.
Implication of Dispersion within Industries
By selecting the best stocks within a strong industry, you avoid the risk that your analysis and
selection of a good company will be offset by poor industry performance.
Study results regarding the dispersion of risk found a wide range of risk among different industries at
a point in time, and the differences in industry risk typically widened during rising and falling
markets.
A study showed that although risk measures for different industries showed substantial dispersion
during a period of time, individual industries’ risk measures are stable over time.
Research on Industry Analysis
The rates of return for individual industries vary over time, so we cannot simply extrapolate past
industry performance into the future.
The rates of return of firms within industries also vary, so analysis of individual companies in an
industry is a necessary follow-up to industry analysis.
During any time period, different industries’ risk levels vary within wide ranges, so we must
examine and estimate the risk factors for alternative industries.
Risk measures for different industries remain fairly constant over time, so the historical risk analysis
is useful when estimating future risk.

Chapter 14
Company Analysis and Stock Valuation
Growth Companies and Growth Stocks
Observers have historically defined growth companies as those that consistently experience above-
average increases in sales and earnings. This definition has some limitations because many firms
could qualify due to certain accounting procedures, mergers, or other external events.
In contrast, financial theorists define a growth company as a firm with the management ability and
the opportunities to make investments that yield rates of return greater than the firm’s required rate
of return.
- This required rate of return is the firm’s weighted average cost of capital (WACC).
Growth stocks are not necessarily shares in growth companies.
A growth stock is a stock with a higher rate of return than other stocks in the market with similar
risk characteristics. The stock achieves this superior risk-adjusted rate of return because at some
point in time the market undervalued it compared to other stocks.
Although the stock market adjusts stock prices relatively quickly and accurately to reflect new
information, available information is not always perfect or complete.
Therefore, imperfect or incomplete information may cause a given stock to be undervalued or
overvalued at a point in time.
If the stock is undervalued, its price should eventually increase to reflect its true fundamental value
when the correct information becomes available.
During this period of price adjustment, the stock’s realized return will exceed the required return for
a stock with its risk, and, during this period of adjustment, it will be considered a growth stock.
Growth stocks are not necessarily limited to growth companies.
A future growth stock can be the stock of any type of company; the stock need only be undervalued
by the market.
The fact is, if investors recognize a growth company and discount its future earnings stream
properly, the current market price of the growth company’s stock will reflect its future earnings
stream.
Those who acquire the stock of a growth company at this correct market price will receive a rate of
return consistent with the risk of the stock, even when the superior earnings growth is attained.
In many instances, overeager investors tend to overestimate the expected growth rate of earnings
and cash flows for the growth company and, therefore, inflate the price of a growth company’s stock.
Investors who pay the inflated stock price will earn a rate of return below the risk-adjusted required
rate of return, despite the fact that the growth company experiences the above-average growth of
sales and earnings.
Several studies that have examined the stock price performance for samples of growth companies
have found that their stocks performed poorly—that is, the stocks of growth companies have
generally not been growth stocks.
Defensive companies and Stocks
Defensive companies are those whose future earnings are likely to withstand an economic downturn.
One would expect them to have relatively low business risk and not excessive financial risk.

Chapter 15
Equity Portfolio Management Strategies
Passive versus Active Management
Equity portfolio management strategies can be placed into either a passive or an active category.
Passive portfolio managers try to capture the expected return consistent with the risk level of their
portfolios.
Active portfolio managers form portfolios capable of producing actual returns that exceed risk-
adjusted expected returns.
The difference between the actual return and expected return is called the portfolio’s alpha.
Alpha represents the amount of value that a portfolio manager has added (if positive) or subtracted
(if negative) to the investment process.
Passive Management
Passive equity portfolio management typically holds stocks so the portfolio’s return will track those
of a benchmark over time. This approach is called indexing and there is no attempt by the manager to
generate alpha.
The manager is judged on how well he/she tracks the index return.
Active Management
Active equity management attempts to outperform an equity benchmark on a risk-adjusted basis.
There are two main ways to add alpha:
- Tactical adjustments: equity style or sector timing
- Security selection: stock-picking
Hedge funds are actively managed portfolios that often pursue and absolute return.
An Overview of Passive Equity Portfolio
Management Strategies
Passive equity portfolio management attempts to design a set of stock holdings that replicates the
performance of a specific benchmark.
A passive manager earns a fee by constructing a portfolio that closely tracks the returns to a
particular equity index meeting the client’s needs and objectives.
Benchmarks exist for various sectors of the stock market, such as small capitalization stocks,
value/growth stocks, developed world regions and emerging markets.
Stock markets throughout the world are often fairly efficient and for many active managers, the
annual costs of beating the market are difficult to overcome.
Because of cash flows into and out of an index fund, as well as events that change the composition of
the benchmark itself, the passive manager will inevitably need to buy and sell securities over time.
These transactions mean that the passive portfolio will inevitably underperform its index over time,
even if the manager minimizes turnover in the portfolio for every other reason.

Chapter 16
TECHNICAL ANALYSIS
Note: we will not be asked to draw a point-and-figure graph in the exam.
Underlying Assumptions of Technical Analysis
Technical analysts base trading decisions on examinations of prior price and volume data to
determine past market trends for which they predict future behavior for the market as a whole and for
individual securities.
The following assumptions underlie price movements:
1. The market value of any good or service is determined solely by the interaction of supply and
demand.
2. Supply and demand are governed by numerous rational and irrational factors. Included in these
factors are those economic variables relied on by the fundamental analyst as well as opinions,
moods, and guesses. The market weighs all these factors continually and automatically.
3. Disregarding minor fluctuations, the prices for individual securities and the overall value of the
market tend to move in trends, which persist for appreciable lengths of time.
4. Prevailing trends change in reaction to shifts in supply and demand relationships. These shifts, no
matter why they occur, can be detected sooner or later in the action of the market itself.
There is a significant difference of opinion regarding the assumption about the speed of adjustment
of stock process to changes in supply and demand.
Technical analysts expect stock prices to move in trends that persist for long periods because they
believe new information does not come to the market at one point in time but rather enters the market
over a period of time.
Technicians do not expect the price adjustment to be as abrupt as fundamental analysts and efficient
market supporter do. They expect a gradual price adjustment to reflect the gradual dissemination of
information.
Technician’s View of Price Adjustment to New Information
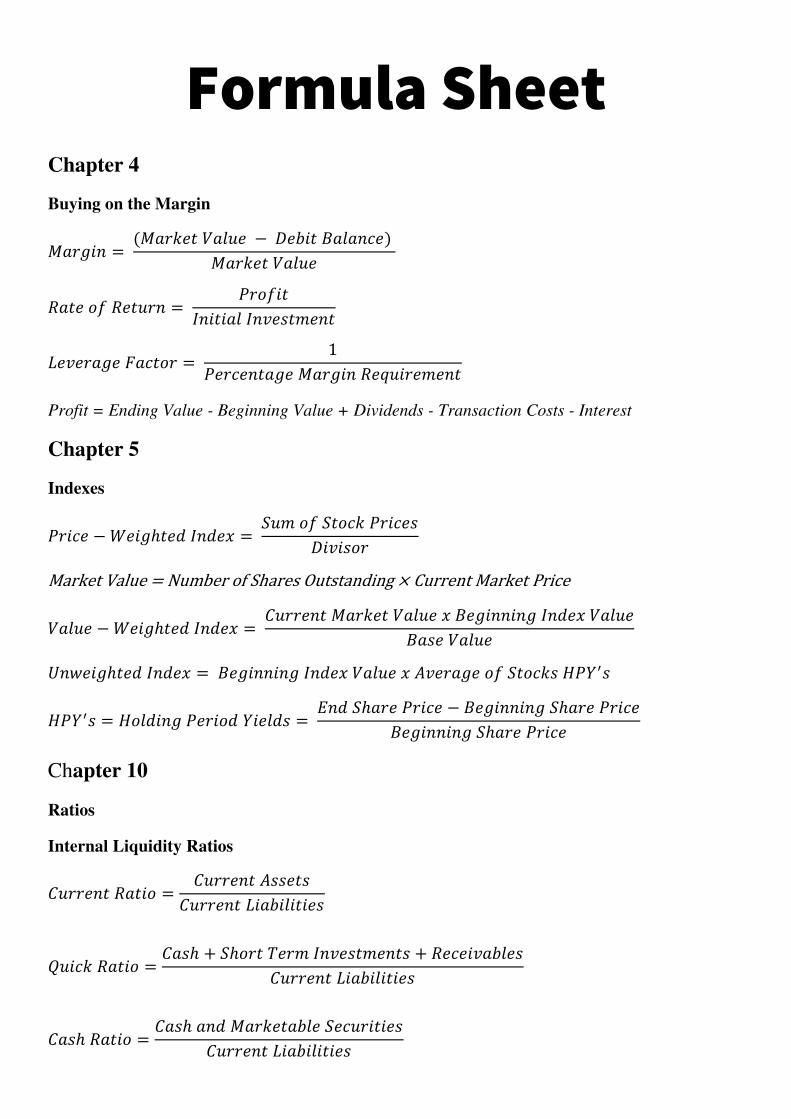
Formula Sheet
Chapter 4
Buying on the Margin = −
=
=
Profit = Ending Value - Beginning Value + Dividends - Transaction Costs - Interest
Chapter 5
Indexes − ℎ =
Market Value = Number of Shares Outstanding × Current Market Price − ℎ = ℎ = 𝑌′ 𝑌′ = 𝑌 = ℎ − ℎ ℎ
Chapter 10
Ratios
Internal Liquidity Ratios =
= ℎ + ℎ +
ℎ = ℎ

![THRIVE BROKERAGE BENEFIT - EasyEquitiesresources.easyequities.co.za/EasyEquities_THRIVE_Benefit... · 2020-05-04 · [THRIVE BROKERAGE BENEFIT ] THRIVE BROKERAGE BENEFIT | LAST UPDATED](https://static.fdocuments.in/doc/165x107/5f47a68b1c951a2c8e4d057e/thrive-brokerage-benefit-e-2020-05-04-thrive-brokerage-benefit-thrive-brokerage.jpg)