Investment in New Power Generation under Uncertainty ...
42
FCN Working Paper No. 12/2010 Investment in New Power Generation under Uncertainty: Benefits of CHP vs Condensing Plants in a Copula-Based Analysis Günther Westner and Reinhard Madlener September 2010 Institute for Future Energy Consumer Needs and Behavior (FCN) Faculty of Business and Economics / E.ON ERC
Transcript of Investment in New Power Generation under Uncertainty ...

FCN Working Paper No. 12/2010
Investment in New Power Generation under
Uncertainty: Benefits of CHP vs Condensing Plants
in a Copula-Based Analysis
Günther Westner and Reinhard Madlener
September 2010
Institute for Future Energy Consumer Needs and Behavior (FCN)
Faculty of Business and Economics / E.ON ERC
FCN Working Paper No. 12/2010
Investment in New Power Generation under Uncertainty: Benefits of CHP vs
Condensing Plants in a Copula-Based Analysis
September 2010
Authors’ addresses: Günther Westner
E.ON Energy Projects GmbH Arnulfstrasse 56 80335 Munich, Germany
E-mail: [email protected]
Reinhard Madlener Institute for Future Energy Consumer Needs and Behavior (FCN) Faculty of Business and Economics / E.ON Energy Research Center RWTH Aachen University Mathieustrasse 6 52074 Aachen, Germany E-mail: [email protected]
Publisher: Prof. Dr. Reinhard Madlener Chair of Energy Economics and Management Director, Institute for Future Energy Consumer Needs and Behavior (FCN) E.ON Energy Research Center (E.ON ERC) RWTH Aachen University Mathieustrasse 6, 52074 Aachen, Germany
Phone: +49 (0) 241-80 49820 Fax: +49 (0) 241-80 49829 Web: www.eonerc.rwth-aachen.de/fcn E-mail: [email protected]
1
Investment in new power generation under uncertainty: Benefits of CHP vs. condensing plants in a copula-based analysis
Günther Westner a and Reinhard Madlener b,*
a E.ON Energy Projects GmbH** , Arnulfstrasse 56, 80335 Munich, Germany
b Institute for Future Energy Consumer Needs and Behavior (FCN), Faculty of Business and
Economics / E.ON Energy Research Center, RWTH Aachen University, Mathieustrasse 6, 52074 Aachen, Germany
September 2010
Abstract In this paper, we apply a spread-based real options approach to analyze the decision-making problem of an investor who has the choice between an irreversible investment in a condensing power plant without heat utilization and a plant with combined heat-and-power (CHP) generation. Our investigation focuses on large-scale fossil-fueled generation technologies and is based on a stochastic model that uses copula functions to provide the input parameter of the real options model. We define the aggregated annual spread as assessment criteria for our investigation since it contains all relevant volatile input parameters that have an impact on the evaluation of investment decisions. We show that the specific characteristics of CHP plants, such as additional revenues from heat sales, promotion schemes, specific operational features, and a beneficial allocation of CO2 allowances, have a significant impact on the option value and therefore on the optimal timing for investment. For the two fossil-fueled CHP technologies investigated (combined-cycle gas turbine and steam turbine), we conclude from our analysis that a high share of CHP generation reduces the risk exposure for the investor. The maximal possible CHP generation depends significantly on the local heat demand in the surroundings of the power plant. Considering this, the size of the heat sink available could gain more relevance in the future selection process of sites for new large-scale fossil power plants. Key words: Combined heat and power; Real options; Investment under uncertainty, Copula
function
JEL Classification Nos.: C46; C61; D81; Q41
* Corresponding author. Tel. +49 241 80 49 820, Fax. +49 241 80 49 829; E-mail: [email protected]
aachen.de (R. Madlener). ** Please note that all statements made in this article are those from the authors and do not necessarily reflect
the views of E.ON Energy Projects GmbH.
2
1 Introduction
Fossil-fueled power plants will play an important role in the future European power
generation portfolio even if EU member states continue to tighten the reduction targets for
greenhouse gas emissions and to boost the usage of renewable energy sources. Currently,
there are more than 8 GW of coal-fired generation capacity under construction across, Europe
and further investments in coal-fired and gas-fired generation technology are planned in the
coming years to cover the growing demand for power (IEA, 2008a; Pahle, 2010). These new
investments will likely dominate the European generation portfolio far beyond the year 2030.
However, high investment costs, long payback periods of irreversible investments in new
power plants, commodity price variability in liberalized power markets, and regulatory
uncertainty bear significant risks for the investing utilities. As a consequence, some utilities
have already postponed or even canceled planned investments in new fossil power plants.
The power plant technology adopted has a significant impact on the risk exposure associated
with new investments in generation infrastructure. In this paper, we put our focus on the
question of whether combined heat and power (CHP) generation can contribute towards the
reduction of risks resulting from commodity price variability and risks related to, say, changes
in regulation, or to climate policy. CHP is one of the most effective means for saving primary
energy and reducing greenhouse gas emissions (IEA, 2008b; Blok and Turkenburg, 1994).
Due to these benefits, many EU member states promote CHP generation to accelerate the
dissemination of CHP technologies (Westner and Madlener, 2009). Specific characteristics,
such as additional revenues from heat sales, specific operational features, and a beneficial
allocation of CO2 allowances, can, in addition to the guaranteed governmental CHP
promotion e.g. by means of feed-in tariffs, contribute towards the reduction of risk exposure
of CHP generation in comparison to condensing plants with power-only generation.
Investments in new large-scale power plants imply high investment costs and long payback
periods, and thus bear significant risks for the investing utility. The risk exposure depends on
the development of commodity prices in liberalized energy markets as well as on political and
regulatory uncertainties, and hence has serious impact on the investment decision. Up to now,
the benefits of CHP generation in the context of investment decisions in large-scale fossil
power plants have not been investigated sufficiently. In our research, we apply a model of
decision-making under uncertainty using a real options approach (Dixit and Pindyck, 1994;

3
Trigeorgis, 1996). Specifically, we compare the risk exposure of energy companies having the
opportunity to invest either in a conventional condensing plant or a plant with CHP
generation. The real options methodology has already been widely applied in the context of
investment decisions in the electricity sector (e.g. Rothwell, 2006; Wickart and Madlener,
2007; Fleten and Näsäkkälä, 2010) and provides a powerful tool to quantify investment risk
(Copeland and Antikarov, 2001). In order to evaluate different power generation technologies,
we take the market conditions and regulatory framework established in Germany as the basis
for our analysis. Due to the commitment of the German government and a beneficial
promotion scheme, the conditions for CHP generation in Germany are more favorable than
compared to those in other European countries (Westner and Madlener, 2009).
This paper is structured as follows. In section 2, we first provide a concise overview of the
relevant literature on real options theory applied to investment decisions for new power
generation assets. Section 3 describes the specific characteristics of CHP in comparison to
other generation technologies. The input parameters used in our model are described in
section 4. Section 5 defines the structure of the real options model applied. In section 6, we
present and discuss the results obtained. Section 7 concludes.
2 Review of related literature
Options theory was originally developed in the 1970s (Black and Scholes, 1973; Merton,
1973) to evaluate financial options, but economists realized very soon that option pricing
could also provide important insights into decision-making on capital investments. Therefore,
with reference to the real assets involved, the term “real options” was established. First
applications of real options theory on investment decisions were made by McDonald and
Siegel (1986), Pindyck (1988, 1991, 1993), and Dixit and Pindyck (1994). During the last few
years, in a number of studies, real options theory has also been applied to decision-making
problems in the energy sector and here especially for investments in new power generation
infrastructures. In this section, we provide a chronological overview of the most recent
publications that apply real options theory in the context of power generation. We also review
some of the relevant literature related to investment decisions in CHP generation.
4
Murto and Nese (2003) focus on the optimal timing and the optimal technology choice for
investments in power production technologies. They put their focus on uncertainties arising
from input price variations, and investigate the impact on investments in fossil-fueled and
biomass-fired power plants. By applying a real options model with stochastic input prices,
they show that prices for fossil fuels are the main driver for investment timing and technology
choice. Sundberg and Sjödin (2003) in their research, consider how investment decisions in
CHP plants are influenced by the liberalization of the European electricity markets. Their
investigation focuses specifically on a co-operation between a paper mill and a municipal
utility. With an economic simulation model that is calibrated for the market conditions in
Sweden, they show that the optimal technology choice is strongly influenced by the returns
required by the investor. Ishii and Yan (2004) investigate how the investment behavior of
firms operating in the U.S. power sector depends on uncertainties in the regulatory
framework. They find evidence that regulatory uncertainty creates substantial option values,
which initiate utilities to delay their investment decisions in order to gather more information
and assurance regarding future regulatory change. They compare the results of their real
options model with corresponding estimates of two alternative models based on net present
value (NPV) and forward-looking (FWL) expectations. Hlouskova et al. (2005) consider the
commitment problem of an electricity producing turbine in the liberalized German power
market and derive profit-maximizing commitment decisions. They model the price
uncertainty with a mean-reverting process including jumps and time-varying means to
account for seasonality. The model is also applied to compute risk profiles of generation
assets for risk management purposes. Näsäkkäla and Fleten (2005) apply real options theory
to gas-fired power plants. They distinguish between gas-fired baseload and peakload plants.
Their model is based on the spark spread, defined as the difference between the price of
electricity and the cost of gas used for power generation. They come to the conclusion that an
increase in the variability of spark spreads has an ambiguous effect on the investment decision
and increases the profitability of peakload plants. Roques and Savva (2006) study the effect of
price cap regulation on investments in new generation capacity in an oligopolistic market. In
their continuous time model, they use stochastic demand volatility as an input variable for a
real options evaluation. They show that there exists an optimal price cap that maximizes
investment incentives, and that errors in the choice of the price cap can have detrimental
consequences. Rothwell (2006) uses a real options approach based on NPVs to determine the
risk premium associated with net revenue uncertainty of new nuclear power plants in Texas.
The author concludes that it is unlikely that there will be new orders for nuclear power plants

5
in deregulated electricity markets at the nuclear power plant prices quoted, unless there are
either dramatic changes in the CO2 mitigation policy or dramatic increases in fossil fuel
prices. Blyth et al. (2007) analyze the effect of uncertainties in future climate policy on
investment decisions in new power plants. In their model, which is based on real options
theory, they treat future climate policy as an external risk factor. The study analyzes
investment options in coal-fired and gas-fired power plants in combination with carbon
capture and storage (CCS) technologies. The authors conclude that the closer in time the
change in policy is, the greater the policy risk and the impact on the investment decision are.
In this respect, retrofit of CCS for coal plants can be used as a hedge against higher-than-
expected future carbon prices. Wickart and Madlener (2007) investigate with their real
options model the decision-making problem under uncertainty of an industrial firm, which is
considering investing either in CHP generation or in heat-only production. Their model
includes the main economic and technological variables as well as the uncertainty inherent in
volatile commodity prices. According to their findings, simplistic NPV calculation can be
misleading when estimating economic CHP potentials. Also, they find that energy market
regulation might have a significant impact on the economics of CHP potentials by altering
price volatilities. Kumbaroğlu et al. (2008) analyze diffusion prospects of new renewable
power generation technologies by applying a dynamic programing model based on real
options theory. They include learning curve information on renewable power generation
technologies and come to the conclusion that the flexibility to delay irreversible investments
can profoundly affect the diffusion prospects of renewable power generation technologies.
Governmental promotion accelerates learning effects and, therefore, leads to cost declines for
renewable energy technologies and thus to faster diffusion and more emission reduction.
Yang et al. (2008) focus on the evaluation of investments in the power sector with respect to
uncertainties in climate policy. They use real options theory to investigate investments in
different generation technologies, including gas, coal, and nuclear generation, and conclude
that climate policy risks increase before important climate policy events and vary according to
the technology chosen. Investor risks can be reduced by implementing long-term rather than
short-term climate change policy frameworks. Siddiqui and Maribu (2009) develop and apply
a real options model for microgrids that consist of small-scale distributed generation and CHP
applications to meet local energy loads. In order to reduce the risk exposure, they investigate
various investment strategies and come to the conclusion that a direct investment strategy in
microgrids is more beneficial for low levels of gas price volatility, whereas a sequential
strategy is preferable in the case of high price volatility. Fleten and Näsäkkälä (2010) consider

6
investments in new gas-fired power plants in liberalized energy markets with volatile
electricity and natural gas prices. In their investigation, they derive the value of operating
flexibility, and find thresholds for energy prices that are optimal for entering into investments.
They come to the conclusion that operating flexibility and the abandonment option interact in
a way that their joint value is less than their separate values, and that operating flexibility has
significant effects on the decision to build a plant.
As our review shows, the existing literature provides several examples of application of real
options theory and decision-making under uncertainty in the context of new investments in
power generation technologies. Table 1 summarizes chronologically the latest research
activities in this area.
Table1: Chronological summary of selected literature on applying real options theory to
investment decisions in the energy sector
Study Scope of research
Research focus Data Model(s) used
Main findings, conclusions
Murto and Nese (2002)
Investment decision between fossil- and biomass-fueled power plants
Investment timing and optimal technology choice for energy investments
Stylized; Numerical example based on market data from Nordpool
Dynamic real options model with stochastic input prices
Commodity price development of fossil fuels has a significant impact on investment timing and technology choice of new power plants.
Sundberg and Sjödin (2003)
Investment decisions in CHP plants
Optimization potential of a co-operation between a paper mill and a municipal utility
Commodity market prices in Sweden (1997-2001)
Economic simulation model MODEST (model for optimization of dynamic energy systems)
A co-operation between the paper mill and a municipal utility increases the cost-effectiveness by 7-11%. The chosen CHP technology affects the returns of both actors.
Ishii and Yan (2004)
Investment under regulatory uncertainty
Investment behaviour of firms operating in the U.S. power sector under regulatory uncertainty
Investments in the U.S. power generation sector (1996-2000)
Real options model, expected net present value (NPV) and forward-looking (FWL) model
Regulatory uncertainty creates a substantial option value that leads firms to delay investment decisions
Hlouskova et al. (2005)
Investment in an electricity producing turbine
Profit-maximizing investment decisions for power plants
Hourly electricity prices at the LPX spot market from (2000-2003)
Real options model, price uncertainty is captured by a mean reverting process with jumps
Real options theory can be applied in the context of short-term optimization and used to derive the value of an electricity producing turbine
Näsäkkäla and Fleten (2005)
Investments in gas-fired power plants
Flexibility in technology choice for investments in new power plants
Data from electricity and gas forward markets in Norway (Jan 2001 - Jan 2004)
Real options model, allowing for mean reversion in short-term variations
An increase in the variability of spark spreads impacts the investment decision and increases the attractiveness of peakload plants.

7
(Table 1 – cont.)
Roques and Savva (2006)
Investments in a regulated power market
Effects of price cap regulation on investments in an oligopolistic industry; focus on demand uncertainty
Stylized Real options approach based on stochastic demand volatility
Price cap regulation depends critically on demand volatility. Errors in the choice of the price cap can have detrimental consequences on investments and average prices.
Rothwell (2006) Investments in new nuclear power plants
Determination of risk-adjusted costs of capital for new nuclear power plants
Electricity market data from Texas-ERCOT (1990-2003)
Real options approach based on NPV calculation
Specific investment costs of about $ 1,200 per kWel could trigger new orders in nuclear power plants. New investments in nuclear power plants require dramatic changes to the commodity price level or changes in regulation.
Blyth et al. (2007)
Investments under uncertain climate change policy
Quantification of regulatory risks for coal- and gas-fired power plants and CCS technologies
Stylized Dynamic programing model based on the real options approach
The closer the change in policy, the greater the policy risk and the impact on the investment decision. Retrofit of CCS for coal plants is a hedge against higher-than-expected future carbon prices.
Wickart and Madlener (2007)
Energy supply related investment decision of industrial companies
Economic modeling of two different technologies: CHP vs. heat-only production
Stylized Stochastic model based on real options theory
Pure NPV calculation is misleading when estimating economic CHP potentials. Price volatility of commodities has an impact on the economic attractiveness of CHP potentials.
Kumbaroğlu et al. (2008)
Diffusion of new renewable power generation technologies
Integration of learning curves for renewable energy technologies
Empirical analysis based on data on the Turkish electricity supply industry
Dynamic programing model based on the real options approach
Governmental promotion accelerates the diffusion of renewable energy resources, enables learning curve effects and, therefore, leads to cost declines.
Yang et al. (2008)
Investments in the power sector with respect on uncertainty in future climate policy
Impact of climate policy on the technology choice of private investors
Stylized Dynamic programing model based on the real options approach
Climate change policy risks depend on the technology chosen and increase before a climate policy event. The risks can be reduced by implementing long-term rather than short-term climate change policy frameworks.
Siddiqui and Maribu (2009)
Investments in distributed generation
Economic evaluation of different kinds of investment strategies: direct vs. sequential investments
Case studies from several sites in the San Francisco area
Dynamic programing model based on the real options approach
For a low level of gas price volatility it is preferable to pursue a direct investment strategy. A sequential investment strategy is better in the case of a high gas price volatility.
Fleten and Näsäkkälä (2010)
Investments in gas-fired power plants
Economic evaluation of operating flexibility and abandonment option
Commodity prices derived from Norwegian commodity markets (Jan 2001 - Jan 2004)
Two-factor model to process power and gas prices
Operating flexibility and the abandonment option interact in a way that their joint value is less than their separate values. Operating flexibility can have a significant effect on the building decision.
Source: Own compilation

8
3 Specific characteristics of CHP in comparison to other power generation
technologies
Economic evaluation of CHP generation assets contrasts significantly with that of
conventional power generation technologies or renewable energy sources. The evaluation
further depends on the regulatory framework with respect to CHP in the country considered,
and it influences investment decisions as well as the operation of CHP plants. In Germany, the
country focused on in our investigation, the most significant differences between CHP and
conventional power plants are related to additional revenues from heat sales, revenues through
governmental CHP promotion, specific operational features and a beneficial allocation of CO2
emission allowances. In the following, we put the focus on these four specific characteristics
of CHP generation and analyze qualitatively their impact on the investment decision.
3.1 Additional revenues from heat sales
In contrast to condensing plants for power-only generation, CHP plants also produce heat as a
secondary product. The additional revenues through heat sales can contribute towards
reducing the risk exposure of the total investment in CHP technologies. The degree of risk
reduction depends on the impact of heat revenues on the volatility of the total plant revenues,
and is influenced by the correlation between heat revenues and commodity prices for power
and fuels. In order to analyze the effects of additional revenues from heat sales in the applied
model, we need to quantify volume and volatility of heat revenues. Due to the fact that there
is no transparent market price for heat available, it is typically impossible to derive heat prices
and volatilities from historical market data. CHP-related literature describes several
approaches to allocating fuel consumption or fuel cost between power and heat production
(see Dittmann et al., 2009). The approach adopted for our investigation is to define the price
for heat generically via the avoided cost of alternative heat production. Specifically, we
assume that an alternative isolated heat production is based on gas-fired heat boilers
(efficiency of 90%) and that the fuel costs are equal to the revenues through heat production
via CHP (cf. section 4.1). The volatility of the heat price is highly correlated with the fuel
price; therefore, we take the same standard deviation for the heat revenues as for natural gas.
A detailed consideration of investment cost for separate heat-only production is neglected for
simplicity.
9
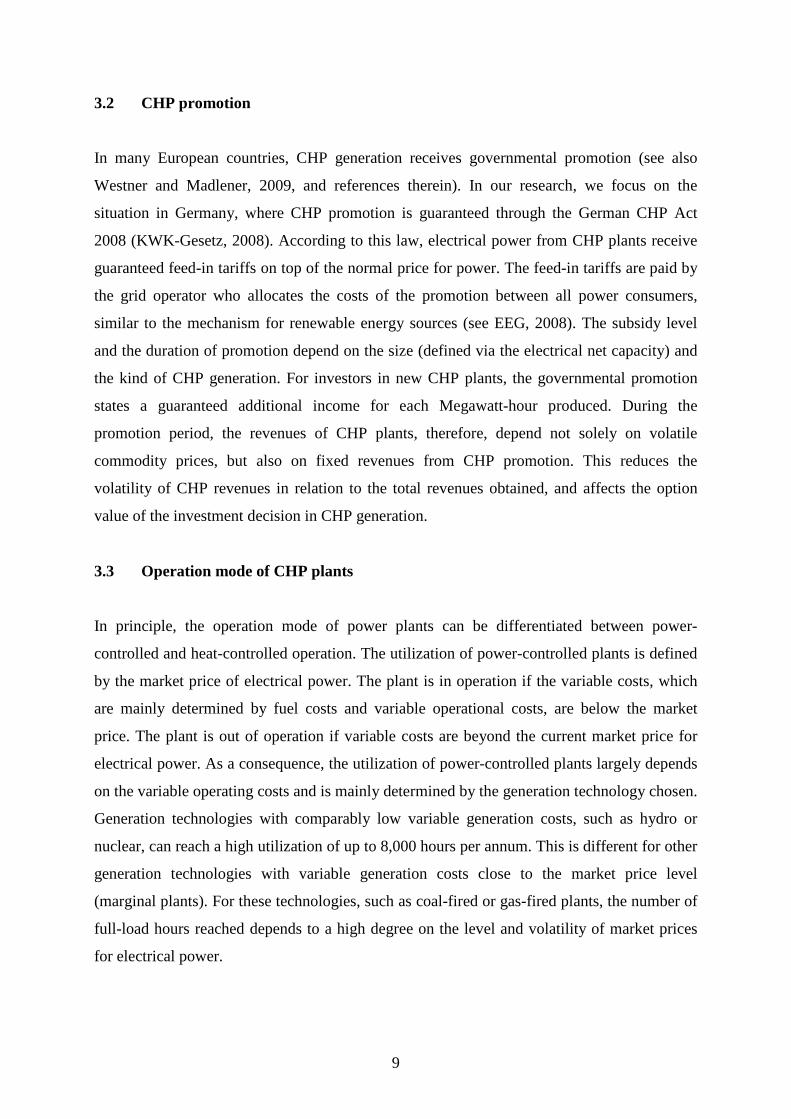
3.2 CHP promotion
In many European countries, CHP generation receives governmental promotion (see also
Westner and Madlener, 2009, and references therein). In our research, we focus on the
situation in Germany, where CHP promotion is guaranteed through the German CHP Act
2008 (KWK-Gesetz, 2008). According to this law, electrical power from CHP plants receive
guaranteed feed-in tariffs on top of the normal price for power. The feed-in tariffs are paid by
the grid operator who allocates the costs of the promotion between all power consumers,
similar to the mechanism for renewable energy sources (see EEG, 2008). The subsidy level
and the duration of promotion depend on the size (defined via the electrical net capacity) and
the kind of CHP generation. For investors in new CHP plants, the governmental promotion
states a guaranteed additional income for each Megawatt-hour produced. During the
promotion period, the revenues of CHP plants, therefore, depend not solely on volatile
commodity prices, but also on fixed revenues from CHP promotion. This reduces the
volatility of CHP revenues in relation to the total revenues obtained, and affects the option
value of the investment decision in CHP generation.
3.3 Operation mode of CHP plants
In principle, the operation mode of power plants can be differentiated between power-
controlled and heat-controlled operation. The utilization of power-controlled plants is defined
by the market price of electrical power. The plant is in operation if the variable costs, which
are mainly determined by fuel costs and variable operational costs, are below the market
price. The plant is out of operation if variable costs are beyond the current market price for
electrical power. As a consequence, the utilization of power-controlled plants largely depends
on the variable operating costs and is mainly determined by the generation technology chosen.
Generation technologies with comparably low variable generation costs, such as hydro or
nuclear, can reach a high utilization of up to 8,000 hours per annum. This is different for other
generation technologies with variable generation costs close to the market price level
(marginal plants). For these technologies, such as coal-fired or gas-fired plants, the number of
full-load hours reached depends to a high degree on the level and volatility of market prices
for electrical power.

10
The utilization of heat-controlled CHP plants is determined by heat demand. In times of
insufficient heat demand, the plant is not running and hence also generates no electrical power
output. The size of heat-controlled CHP plants is usually dimensioned according to the
constant heat sink (e. g. for district heating) in the surroundings of the plant site. Depending
on the chosen technology and the kind of application, the utilization of CHP plants operated
in the heat-control mode lies between 4,500 and 8,000 full-load hours, and depends less on
the price level for electrical power than on the characteristics of heat utilization.
The operation mode and, as a consequence, the plant utilization have a significant impact on
the economics of investments in new power generation. As the characteristics of utilization
differ significantly between power-controlled and heat-controlled plants, we need to consider
this aspect in our investigation. The more volatile the utilization is, the more volatile the
revenues are and the higher the option value of the plant is.
3.4 Allocation of CO2 emission allowances
In many European countries, CHP generation receives a beneficial allocation of CO2 emission
allowances. In Germany, the national allocation plan (BMU, 2006) for the second trading
period from 2008 to 2012 guarantees CHP plants a privileged allocation of free allowances
according to the double benchmark principle1. As a consequence, CHP plants can in some
cases even receive more allowances than used to cover their own emissions, and can gain
additional revenues through selling the surplus of freely allocated allowances to the market.
Fossil-fired condensing power plants without heat utilization receive in the current trading
period an allocation that is, due to the applied reduction factor for power production, usually
not sufficient to cover their emissions.
In the next trading period from 2013 onwards, the allocation mechanism of free CO2
allowances will be modified fundamentally. Up to now, the final allocation rules and
benchmarks for the next period are still under discussion, but the EU Directive 2009/29/EC
(EU, 2009) already states some principles for the allocation of certificates in the post-2012
period. According to the directive, full auctioning will be established for emissions from
electrical power generation, including CHP. The free allocation of certificates for heat
production is expected to remain in place. This means that it is very likely that from 2013 1 According to this principle, CHP plants receive CO2 allowances for the power produced and additional
allowances for heat production.
11
onwards, the present beneficial allocation for CHP according to the double benchmark
principle will be canceled, but it is likely that a significant advantage for CHP will remain in
comparison to fossil-fired condensing plants, due to the continuing free allocation for heat. In
our investigation, we include the beneficial treatment of CHP generation concerning
allocation of emission allowances, quantify the effects, and derive the impact on the option
value of CHP investments in comparison to conventional fossil plants.
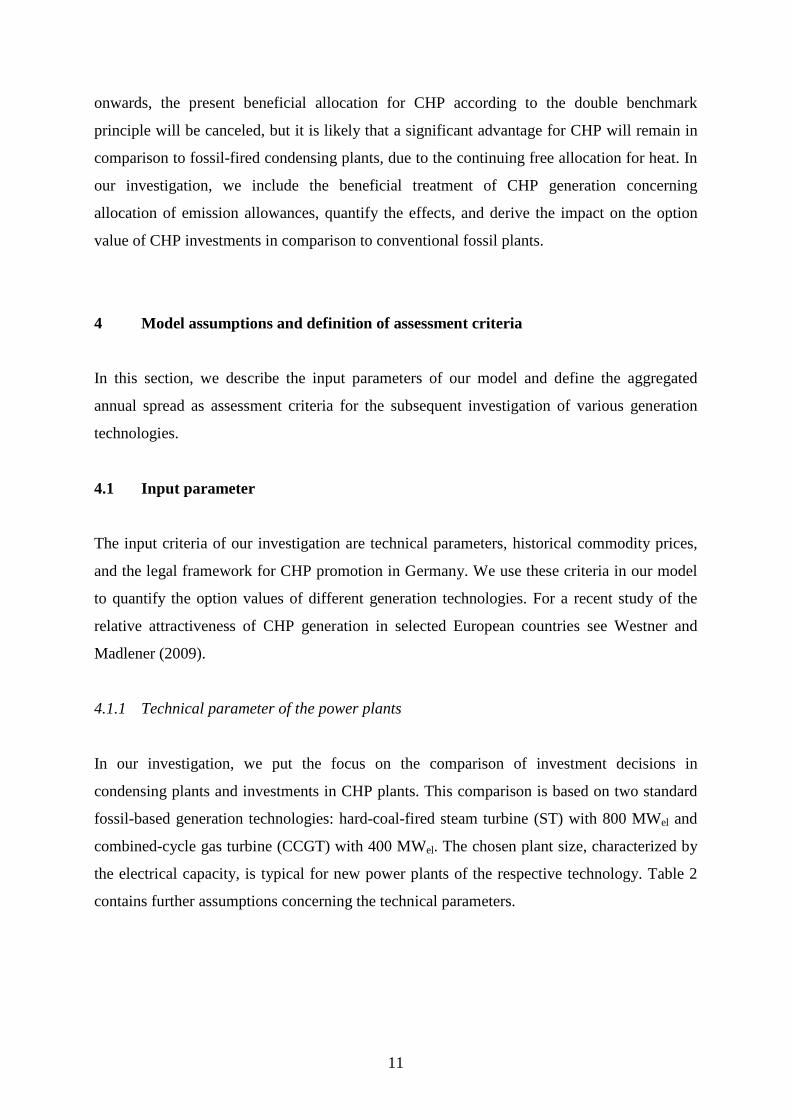
4 Model assumptions and definition of assessment criteria
In this section, we describe the input parameters of our model and define the aggregated
annual spread as assessment criteria for the subsequent investigation of various generation
technologies.
4.1 Input parameter
The input criteria of our investigation are technical parameters, historical commodity prices,
and the legal framework for CHP promotion in Germany. We use these criteria in our model
to quantify the option values of different generation technologies. For a recent study of the
relative attractiveness of CHP generation in selected European countries see Westner and
Madlener (2009).
4.1.1 Technical parameter of the power plants
In our investigation, we put the focus on the comparison of investment decisions in
condensing plants and investments in CHP plants. This comparison is based on two standard
fossil-based generation technologies: hard-coal-fired steam turbine (ST) with 800 MWel and
combined-cycle gas turbine (CCGT) with 400 MWel. The chosen plant size, characterized by
the electrical capacity, is typical for new power plants of the respective technology. Table 2
contains further assumptions concerning the technical parameters.

12
Table 2: Technical input parameters used in the model
Hard-coal ST technology CCGT technology
Condensing
plant CHP plant
Condensing plant
CHP plant
Fuel type hard coal hard coal natural gas natural gas
Operation mode power control power control power control heat control
Capacity (electrical) MWel 800 800 400 400
Plant lifetime A 40 40 30 30 Power efficiency 0.45 0.42 0.60 0.45 Heat efficiency - 0.18 - 0.35 Global efficiency (degree of fuel utilization)
0.45 0.60 0.60 0.80
Efficiency of alternative heat production
- 0.90 - 0.90
CO2 emission factor g CO2/kWhel 800 800 380 380
CO2 benchmark power g CO2/kWhel 750 750 365 365
CO2 benchmark heat g CO2/kWhth - 345 - 225
Promotion for CHP power generation
€/MWhel - 15 - 15
Source: Operational data derived from existing E.ON plants
We assume that the investigated condensing plants (for both fuel types) are operated in the
power-control mode. For the coal-fired CHP plant, we also assume that it is operated in this
mode. The defined heat efficiency of this plant lies at about 18%, which is a typical value for
large coal-fired plants with heat extraction in Germany. This assumption implies that the
lion’s share of the heat production is not utilized and that the useful heat demand can be
covered even if the plant is operating below its maximum power output. This provides some
operational flexibility and enables operators to run coal-fired CHP plants also in the power-
control mode. Later in our investigation, we increase the degree of heat efficiency and
describe the effect on the option value. The gas-fired CCGT-CHP plant is characterized by a
lower capacity and high heat efficiency of 35%.. Such plants are often used to supply large
consumers, such as industrial factories, with a high and constant power and heat demand.
These plants are typically operated in the heat-control mode, which we also assume for the
CCGT-CHP plant in our investigation. All other parameters as given in Table 2 are typical
values for the respective technologies, derived from existing plants in Germany.

13
4.1.2 Commodity price assumptions
The commodity prices used in our model are taken from the commodity markets in Germany.
As input parameters we use the historical commodity prices, as given in Table 3. The price for
heat is calculated on the basis of a gas-fired heat boiler with an efficiency of 90%.
Table 3: Characteristics of commodity prices used for MVP investigation
Price variable Periodicity Time period µ σ
Power price a Daily Oct 2007 - Sep 2009 54.71 €/MWhel 21.49 €/MWhel
Fuel price coal b Daily Oct 2007 - Sep 2009 10.25 €/MWhth 2.10 €/MWhth
Fuel price gas c Daily Oct 2007 - Sep 2009 20.09 €/MWhth 6.80 €/MWhth
CO2 allowances d Daily Oct 2007 - Sep 2009 16.21 €/t CO2 8.11 €/t CO2
Heat price e Daily Oct 2007 - Sep 2009 22.32 €/MWhth 6.80 €/MWhth
Sources: a EEX Price Index: Phelix Day Base, b API#2-Index: ARA Quarterly Futures Price, c EEX Gas Spot Market EGT, d CO2 Allowance Price Phase 2, e Calculated on the basis of a gas-fired boiler with an efficiency of 90%.
4.1.3 Promotion of CHP in Germany
The new German CHP Act 2008 (KWK-Gesetz, 2008), that entered into force on January 1,
2009, has significantly improved the conditions for CHP generation in Germany. According
to this law, plants receive a guaranteed feed-in tariff on top of the price for the produced
power. The subsidy level, as shown in Table 4, depends on the size of the plant, which is
defined by the electrical net capacity.

14
Table 4: Promotion of CHP by the 2009 German CHP Act
Plant size Remuneration
≤ 50 kWel 5.11 ct/kWh for the duration of 10 years, no degression
≤ 2 MWel 2.1 ct/kWh for the duration of 6 years or a maximum of 30,000 full-load hours 5.11 ct/kWh for the first 50 kW
> 2 MWel 1.5 ct/kWh for the duration of 6 years or a maximum of 30,000 full-load hours Exception industrial applications: Duration only 4 years or a maximum 30,000 full-load hours 2.1 ct/kWh for the first 2 MW, 5.11 ct/kWh for the first 50 kW
Source: KWK-Gesetz (2008).
4.2 Calculation of the aggregated annual spread
We take the aggregated annual spread (AAS), which is the result of the convolution of the
specific spread (S) and the power utilization of the plant (U), as criteria for the subsequent
assessment of various generation technologies. The AAS is described by a cumulative
distribution function. It can be considered as the major source of uncertainty for investments
in new power plants. In this section, we first define the specific spread and the plant
utilization, and than derive the distribution of the AAS by application of two alternative
methods: correlation coefficients and copula functions.
4.2.1 Specific spread
The specific spread (S) per MWh is the difference between the price of the output (electrical
power) and the costs of the input factors (e.g. fuels) or, in other words, the specific spread is
the contribution margin that a plant operator earns for converting fuels into electrical power.
We also consider the costs of CO2 emissions and take the so-called “clean” spreads for our
investigation. The spread of coal-fired plants is called “clean dark spread”, the spread of gas-
fired plants “clean spark spread”. The specific spreads of condensing power plants, SCond, are
defined as the difference between revenues and variable costs of power generation:
2)( COPFel
FECond C
CPS πλ
η−−−= , (1)
15
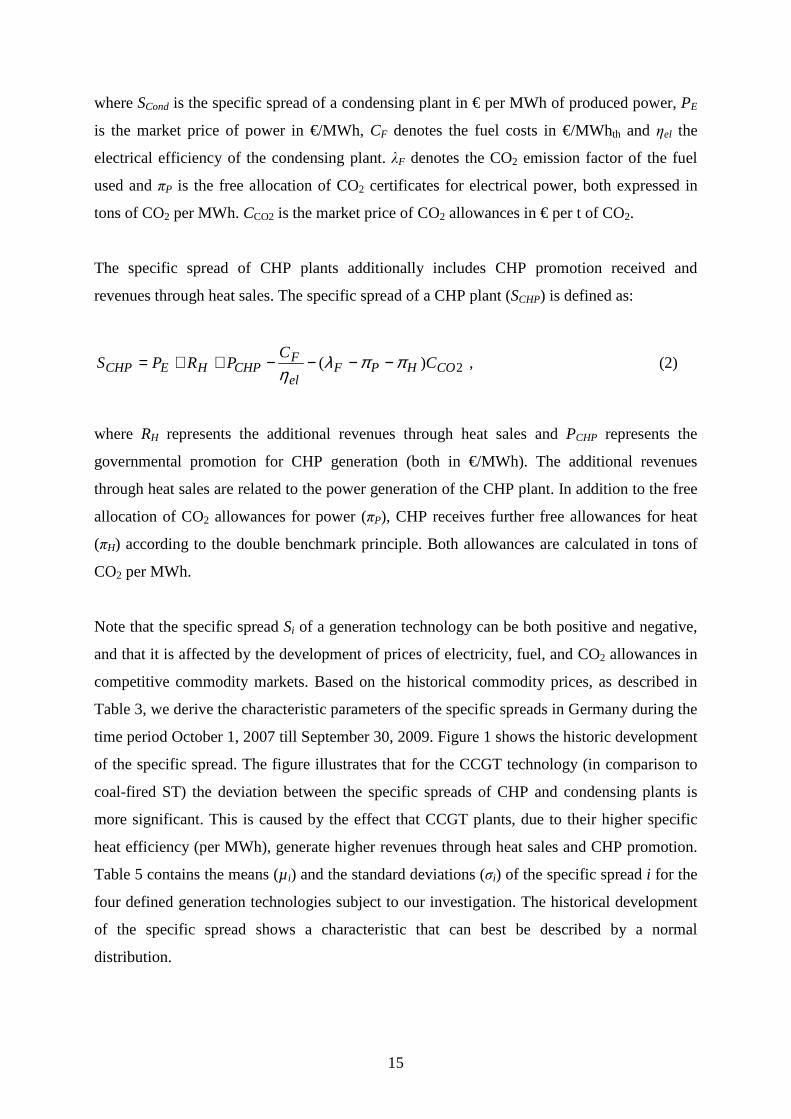
where SCond is the specific spread of a condensing plant in € per MWh of produced power, PE
is the market price of power in €/MWh, CF denotes the fuel costs in €/MWhth and ηel the
electrical efficiency of the condensing plant. λF denotes the CO2 emission factor of the fuel
used and πP is the free allocation of CO2 certificates for electrical power, both expressed in
tons of CO2 per MWh. CCO2 is the market price of CO2 allowances in € per t of CO2.
The specific spread of CHP plants additionally includes CHP promotion received and
revenues through heat sales. The specific spread of a CHP plant (SCHP) is defined as:
2)( COHPFel
FCHPHECHP C
CPRPS ππλ
η−−−−++= , (2)
where RH represents the additional revenues through heat sales and PCHP represents the
governmental promotion for CHP generation (both in €/MWh). The additional revenues
through heat sales are related to the power generation of the CHP plant. In addition to the free
allocation of CO2 allowances for power (πP), CHP receives further free allowances for heat
(πH) according to the double benchmark principle. Both allowances are calculated in tons of
CO2 per MWh.
Note that the specific spread Si of a generation technology can be both positive and negative,
and that it is affected by the development of prices of electricity, fuel, and CO2 allowances in
competitive commodity markets. Based on the historical commodity prices, as described in
Table 3, we derive the characteristic parameters of the specific spreads in Germany during the
time period October 1, 2007 till September 30, 2009. Figure 1 shows the historic development
of the specific spread. The figure illustrates that for the CCGT technology (in comparison to
coal-fired ST) the deviation between the specific spreads of CHP and condensing plants is
more significant. This is caused by the effect that CCGT plants, due to their higher specific
heat efficiency (per MWh), generate higher revenues through heat sales and CHP promotion.
Table 5 contains the means (µi) and the standard deviations (σi) of the specific spread i for the
four defined generation technologies subject to our investigation. The historical development
of the specific spread shows a characteristic that can best be described by a normal
distribution.

16
-40
0
40
80
120
160
01.10.2007 01.04.2008 01.10.2008 01.04.2009
-40
0
40
80
120
160
01.10.2007 01.04.2008 01.10.2008 01.04.2009
Coal-fired plant(Clean dark spread in €/MWh)
Gas-fired plant(Clean spark spread in €/MWh)
CHP plant
Condensing plant
CHP plant
Condensing plant
-40
0
40
80
120
160
01.10.2007 01.04.2008 01.10.2008 01.04.2009
-40
0
40
80
120
160
01.10.2007 01.04.2008 01.10.2008 01.04.2009
Coal-fired plant(Clean dark spread in €/MWh)
Gas-fired plant(Clean spark spread in €/MWh)
CHP plant
Condensing plant
CHP plant
Condensing plant
Figure 1: Development of the specific spreads from October 1, 2007 to September 30, 2009
Source: Own calculation, based on equation (1) and (2) with input parameter obtained in Table 3
Table 5: Characteristics of the specific spread for various generation technologies
(observations over time period October 1, 2007 to September 30, 2009)
Coal-fired plant (Clean dark spread in €/MWh)
Gas-fired plant (Clean spark spread in €/MWh)
Technology µ σ Probability distribution
µ σ Probability Distribution
Condensing plant
19.8 27.0 normal 15.6 29.8 Normal
CHP plant
21.0 24.9 normal 31.1 23.8 Normal
Source: Own calculation, based on Eqs. (1) and (2) with input parameter obtained in Table 3
4.2.2 Utilization of power plants
The plant utilization is the second important input parameter that has a significant impact on
the economics of power plants and, therefore, needs to be considered in our model. As already

17
mentioned in section 3, the utilization depends to a large extent on the operation mode of the
plant and varies significantly between the power-control mode, which is characteristic of
condensing plants, and the heat-control mode, which is typical of many CHP applications.
The utilization of power-controlled plants depends on the price level at the wholesale market
for electrical power in relation to the variable generation costs of the plant. If the variable
generation costs are below the power price, the plant produces electrical power; otherwise, the
plant is out of operation (ignoring ramp-up and shut-down costs and technical restrictions). As
a consequence for power-controlled plants, the specific spread and the utilization are not
independent.
The power utilization of heat-controlled CHP plants depends on the heat demand. If the heat
demand is constant over the entire year, e.g. in CHP plants used for industrial applications, the
power utilization per annum can reach up to 8,000 hours with a comparably low volatility. In
other applications, such as CHP installations for district heating, heat demand follows the
seasonal and daily fluctuations. In these plants, the utilization is significantly lower and
reaches usually only about 4,500 h/a – 5,000 h/a. The volatility depends on the variation of
the temperature, but in the long-term average, the annual utilization can be considered as very
stable. We assume that the coal-fired CHP plant is used for district heating and the gas-fired
CHP plant for industrial applications. Due to the forced downtime for operation and
maintenance we assume that the probability distribution of the CCGT-CHP plant is truncated
at a maximum utilization of 8,400 h/a. The characteristics of the utilization used for our
investigation are shown in Table 6.
Table 6: Typical utilization of the different generation technologies considered
Coal-fired plant (utilization in h/a)
Gas-fired plant (utilization in h/a)
Technology µ σ Probability distribution
µ σ Probability distribution
Condensing plant
5,000 1,000 log-normal 5,000 1,000 log-normal
CHP plant
5,000 1,000 log-normal 8,000 400 log-normal (truncated,
8,400 h max)
Source: Stylized data, derived from E.ON power plants

18
4.2.3 Calculation of the aggregated annual spread based on correlation coefficients
The option price model applied in our paper is based on the aggregated annual spreads for the
various types of power plant technology. The aggregated annual spread AASi, expressed in
€/kW for generation technology i, is the result of the convolution of the specific spread Si in
€/MWh and the power utilization Ui given by the full-load hours of the power plant:
iii USAAS ⋅= . (3)
The specific spreads Si as well as the power utilization Ui are given as probability
distributions. For plants that are operated in the power-control mode, the probability variables
are not independent of each other, and we need to consider the interdependency between
specific spreads and plant utilization. To the best of our knowledge this is a new approach. In
a first step, we do this by including the correlations. We derive the correlation by comparing
the hourly production of hard-coal- and gas-fired plants with the specific spread. The
production volumes are available from the transparency platform of the European Energy
Exchange (EEX), and the specific spreads are based on intraday power prices. Figure 2 shows
the interdependency of the specific spread for hard-coal- and gas-fired power plants. The
figure illustrates that the total available hard-coal capacity in Germany (about 12,500 MW) is
more than twice as high as the available capacity of gas plants (about 6,000 MW).
Furthermore the correlation factor of hard-coal-fired plants is due to the typical operating
mode higher than for gas-fired plants. The sharper upper bound illustrates that the total
available hard-coal capacity is usually completely utilized as soon as the specific spread
reaches a level above 20 €/MWh. For plants that are operated in the heat-control mode, we do
not need to consider the correlation between capacity and spread, as the plants are running
independently of the current specific spread.

19
0
2.500
5.000
7.500
10.000
12.500
15.000
-100 -80 -60 -40 -20 0 20 40 60 80 100
Specific spread [€/MWh]
Gen
erat
ion
capa
city
util
ized
[MW
]Hard-coal power generation(Correlation 0.620)
Gas-fired power generation(Correlation 0.522)
15,000
12,500
10,000
7,500
5,000
2,500
0
2.500
5.000
7.500
10.000
12.500
15.000
-100 -80 -60 -40 -20 0 20 40 60 80 100
Specific spread [€/MWh]
Gen
erat
ion
capa
city
util
ized
[MW
]Hard-coal power generation(Correlation 0.620)
Gas-fired power generation(Correlation 0.522)
15,000
12,500
10,000
7,500
5,000
2,500
Figure 2: Interdependencies between the specific spread based on intra-day power prices and
utilized generation capacity (exemplarily for December 2009)
Source: Own illustration based on data from the European Energy Exchange (EEX)
Next, we determined the probability distribution of the aggregated annual spread numerically
by applying a Monte-Carlo simulation with 50,000 runs. Figure 3 reports on the probability
distributions and the characteristic parameters of the aggregated annual spread for the
technologies investigated. The figure shows that CHP technologies provide for both fuel types
higher means of the AAS. The mean of the AAS of gas-fired CCGT-CHP amounts to 248
€/kW and is, due to the large degree of heat utilization (heat efficiency 35%), more than twice
as high as the AAS of the other technologies investigated. This illustrates the economic
attractiveness of high degrees of heat utilization.

20
Gas-fired CHP plant
0,0%
2,0%
4,0%
6,0%
8,0%
-500 -300 -100 100 300 500 700 900
Coal-fired CHP plant
0,0%
2,0%
4,0%
6,0%
8,0%
-500 -300 -100 100 300 500 700 900
Gas-fired condensation plant
0,0%
2,0%
4,0%
6,0%
8,0%
-500 -300 -100 100 300 500 700 900
Coal-fired condensing plant
0,0%
2,0%
4,0%
6,0%
8,0%
-500 -300 -100 100 300 500 700 900
Probability distribution [%]
Probability distribution [%]
Probability distribution [%]
Probability distribution [%]
Aggregated annual spread [ € / kW ]
Aggregated annual spread [ € / kW ]
Aggregated annual spread [ € / kW ]
Aggregated annual spread [ € / kW ]
8.0%
6.0%
4.0%
2.0%
0.0%
8.0%
6.0%
4.0%
2.0%
0.0%
8.0%
6.0%
4.0%
2.0%
0.0%
8.0%
6.0%
4.0%
2.0%
0.0%
Mean [€/kWel] 99.57Std. deviation [€/kWel] 136.24
Mean [€/kWel] 78.28Std. deviation [€/kWel] 149.73
Mean [€/kWel] 248.75Std. deviation [€/kWel] 190.58
Mean [€/kWel] 105.58Std. deviation [€/kWel] 125.35
Aggregated annual spread [ € / kW ] Aggregated annual spread [ € / kW ]
Aggregated annual spread [ € / kW ] Aggregated annual spread [ € / kW ]
Gas-fired CHP plant
0,0%
2,0%
4,0%
6,0%
8,0%
-500 -300 -100 100 300 500 700 900
Coal-fired CHP plant
0,0%
2,0%
4,0%
6,0%
8,0%
-500 -300 -100 100 300 500 700 900
Gas-fired condensation plant
0,0%
2,0%
4,0%
6,0%
8,0%
-500 -300 -100 100 300 500 700 900
Coal-fired condensing plant
0,0%
2,0%
4,0%
6,0%
8,0%
-500 -300 -100 100 300 500 700 900
Probability distribution [%]
Probability distribution [%]
Probability distribution [%]
Probability distribution [%]
Aggregated annual spread [ € / kW ]
Aggregated annual spread [ € / kW ]
Aggregated annual spread [ € / kW ]
Aggregated annual spread [ € / kW ]
8.0%
6.0%
4.0%
2.0%
0.0%
8.0%
6.0%
4.0%
2.0%
0.0%
8.0%
6.0%
4.0%
2.0%
0.0%
8.0%
6.0%
4.0%
2.0%
0.0%
Mean [€/kWel] 99.57Std. deviation [€/kWel] 136.24
Mean [€/kWel] 78.28Std. deviation [€/kWel] 149.73
Mean [€/kWel] 248.75Std. deviation [€/kWel] 190.58
Mean [€/kWel] 105.58Std. deviation [€/kWel] 125.35
Aggregated annual spread [ € / kW ] Aggregated annual spread [ € / kW ]
Aggregated annual spread [ € / kW ] Aggregated annual spread [ € / kW ]
Figure 3: Probability distributions and stochastic parameter of the aggregated annual spreads
based on correlation coefficients
Source: Own illustration based on the Monte-Carlo simulation of the aggregated annual spread
4.2.4 Calculation of the aggregated annual spread based on copula functions
In section 4.2.3, we used the correlation coefficients between specific spread and plant
utilization to gain the probability distributions of the aggregated annual spread. This approach
does not consider non-linear tail dependencies and thus may generate misleading results.
Therefore, we now want to verify our results by carrying out a more sophisticated
investigation of the dependence structure between specific spread and plant utilization based
on copula functions. Originally, copula functions were used in the context of risk management
of financial assets but in recent times this method has also been applied in the field of energy
economics. Recent examples are Denault et al. (2009), who simulated the energy inflow of a
generation portfolio consisting of hydro and wind generation by application of copula
functions, and Valizadeh Haghi et al. (2010), who used copula functions to model the
characteristics of fluctuating renewable generation in distribution networks. Before we present
the results of our copula-based model, we give a brief introduction of the theory behind
copula functions. A more detailed description of the copula approach can be found in Nelsen
(1999).
21
The fundamental theory behind all copula-based analysis is known as Sklar’s Theorem (Sklar,
1959). Sklar stated that if F: dℜ → (0,1) is a joint distribution function with margins X1, X2,
…, Xd, then there exists a copula C: (0,1)d → (0,1) such that for all dx ℜ∈ and du )0,1(∈
there exists a joint distribution function
)()}(),...,({)( 11 uCxFxFCxF dd == . (4)
Conversely, if C:(0,1)d → (0,1) is a copula and F1, …, Fd are distribution functions, then there
exists a joint distribution function F with margins F1, …, Fd such that for all dx ℜ∈ and
du )0,1(∈ there exists a copula function
)}(),...,({),...,( 11
111 ddn uFuFFuuC −−= . (5)
The copula function C is unique if F, F1, …, Fd are continuous distribution functions. For our
investigation, it is sufficient to consider the bivariate case, as we need to link only two
variables to get the aggregated annual spread. For the bivariate case, we get the equation:
)}(),({),( 11 yFxFFvuC yx−−= , (6)
where F is the joint cumulative distribution function (cdf) of the random vector X=(X,Y) and
Fx respectively Fy are the marginal cdfs of X and Y. Bivariate copulas further need to satisfy
three necessary and sufficient properties (Joe, 1995):
0),(lim),(lim 00 == →→ vuCvuC vu (7)
vvuCu =→ ),(lim 1 , uvuCv =→ ),(lim 1 (8)
0),(),(),(),( 22122111 ≥+−− vuCvuCvuCvuC ),(),,( 2211 vuvu∀ with 2121 , vvuu ≤≤ (9)
The choice of the copula function used to link together the marginals of two variates depends
on the nature of the considered data. Each copula implies a different type of dependence
between the variables. One way to identify the “right” copula function is to test several
standard distribution functions like Normal-, t-student-, Clayton- or Gumbel- distribution and

22
to select the one with the best fit (see Bastianin, 2009). Another approach is to derive copula
functions based on empirical data that describe the dependence structure between the
marginals. These empirical copula functions were introduced under the name “empirical
dependence structure” by a series of papers by Deheuvels, starting with Deheuvels (1979). In
our specific case, we apply empirical copula functions to describe the dependencies between
specific spread and utilization.
To gain the empirical copula function, we need to consider the cdfs F of the random vectors
Xj. The distribution function F is defined at each point x by the proportion of observations that
are not greater than x. If the observed values of the vectors Xj are xj1, …, xjn, and F1, …, Fd are
the marginal distributions, then the distribution F is mathematically given by
}{11
:),...,(1 1
1 ∑∏= =
≤=n
i
d
jjijd xX
nxxF . (10)
The empirical copula function Ĉ of F(x1, …, xd) is then, as any copula, defined through the
following identity:
)}(),...,({:),...,(ˆ 11
111 ddd uFuFFuuC −−= (11)
For the bivariate case relevant to our study, we get the following identities:
∑=
≤≤≡n
iii yyxx
nyxF
1
),(11
),( (12)
)}(),({),(ˆ 11 yFxFFvuC yx−−≡ . (13)
For further details and the theoretical background of empirical copula functions, we refer to
Gaenssler and Stute (1987), who have studied the empirical copula process in full generality.
To model the dependence structure between specific spread and utilization, we used the
commercial software ModelRisk 3.0 by Vose Software. This software is able to simulate the
dependence structure between the marginals based on empirical data.
23
Coal-fired power plants
1.00
0.80
0.60
0.40
0.20
0.000.00 0.20 0.40 0.60 0.80 1.00
1.00
0.80
0.60
0.40
0.20
0.000.00 0.20 0.40 0.60 0.80 1.00
(a) Original data (b) Simulated data via empirically fitted copula function
Gas-fired power plants
1.00
0.80
0.60
0.40
0.20
0.000.00 0.20 0.40 0.60 0.80 1.00
1.00
0.80
0.60
0.40
0.20
0.000.00 0.20 0.40 0.60 0.80 1.00
(c) Original data (d) Simulated data via empirically fitted copula function
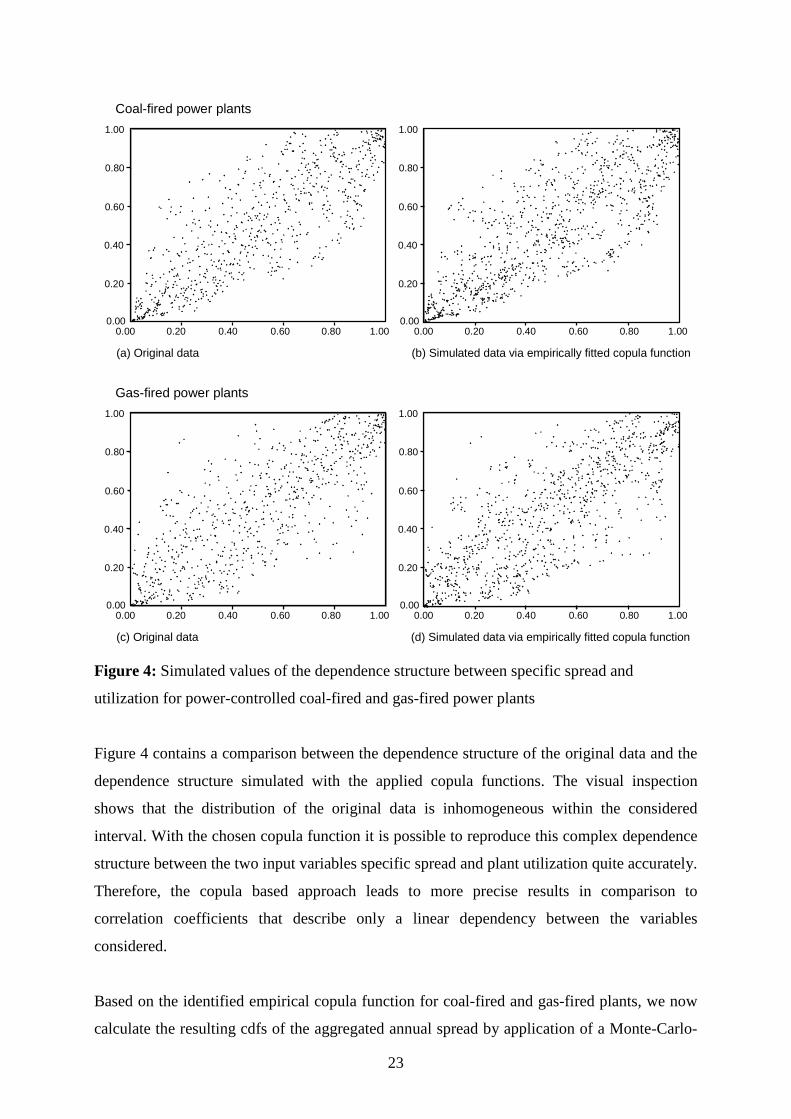
Figure 4: Simulated values of the dependence structure between specific spread and
utilization for power-controlled coal-fired and gas-fired power plants
Figure 4 contains a comparison between the dependence structure of the original data and the
dependence structure simulated with the applied copula functions. The visual inspection
shows that the distribution of the original data is inhomogeneous within the considered
interval. With the chosen copula function it is possible to reproduce this complex dependence
structure between the two input variables specific spread and plant utilization quite accurately.
Therefore, the copula based approach leads to more precise results in comparison to
correlation coefficients that describe only a linear dependency between the variables
considered.
Based on the identified empirical copula function for coal-fired and gas-fired plants, we now
calculate the resulting cdfs of the aggregated annual spread by application of a Monte-Carlo-

24
simulation with 50,000 runs. Figure 5 contains the probability distributions of the aggregated
annual spread for the defined technologies and the stochastic parameter based on the
calculation with empirical copula functions. The figure shows that the shape of the copula-
based probability distributions of the plants that are operated in the power control mode (coal-
fried condensing plant, coal-fired CHP plant and gas-fired condensing plan) is significantly
different from the distributions gained via application of correlation coefficients (see Figure
3). The distributions are less regular and lose their bell-shaped form of the Gaussian
distribution (except for gas-fired CHP). Additionally, the mean of the distributions is higher
and the tails are fatter, which means that also the standard deviation is higher. The copula-
based distribution of the gas-fired CHP plant shows the same shape as the distribution based
on correlation coefficients. This is due to our assumption that there are no interferences
between specific spread and utilization in the case where the plant is operated in heat control
mode.
Gas-fired CHP plant
0,0%
2,0%
4,0%
6,0%
8,0%
-500 -300 -100 100 300 500 700 900
Gas-fired condensing plant
0,0%
2,0%
4,0%
6,0%
8,0%
-500 -300 -100 100 300 500 700 900
Coal-fired CHP plant
0,0%
2,0%
4,0%
6,0%
8,0%
-500 -300 -100 100 300 500 700 900
Coal-fired condensing plant
0,0%
2,0%
4,0%
6,0%
8,0%
-500 -300 -100 100 300 500 700 900
Probability distribution [%]
Probability distribution [%]
Probability distribution [%]
Probability distribution [%]
Aggregated annual spread [ € / kW ]
Aggregated annual spread [ € / kW ]
Aggregated annual spread [ € / kW ]
Aggregated annual spread [ € / kW ]
8.0%
6.0%
4.0%
2.0%
0.0%
8.0%
6.0%
4.0%
2.0%
0.0%
8.0%
6.0%
4.0%
2.0%
0.0%
8.0%
6.0%
4.0%
2.0%
0.0%
Mean [€/kWel] 120.81Std. deviation [€/kWel] 155.95
Mean [€/kWel] 101.57Std. deviation [€/kWel] 167.57
Mean [€/kWel] 125.29Std. deviation [€/kWel] 144.95
Mean [€/kWel] 249.50Std. deviation [€/kWel] 191.54
Figure 5: Probability distributions and stochastic parameters of the aggregated annual spreads
based on copula functions
Source: Own illustration based on the Monte-Carlo simulation of the aggregated annual spread

25
5 Structure of the real options model
In this section, we apply real options theory and analyze the decision-making problem under
uncertainty of investors who have the choice between investments in CHP or investments in
condensing plant technology. We use a real options model that is analytically solvable and
described e.g. in the seminal book by Dixit and Pindyck (1994). The decision to invest is
profoundly affected by the opportunity costs of making a commitment now, and thereby
giving up the option of waiting for new information. In order to apply real options theory, two
preliminary conditions need to be fulfilled. First, the expenditure has to be at least partly
irreversible and, second, the exercising of the investment option can be delayed, so that the
investor has the opportunity to wait for new information about prices, costs, or changing
market conditions before resources are committed. Both preconditions are fulfilled in the
research question that we address here.
Our investigation is based on the aggregated annual spreads AASi, expressed in €/kW, as
defined in the preceding section. To the best of our knowledge this is a novel approach, as for
the first time we use an aggregated figure that includes information about commodity prices
(reflected in the specific spread) and plant utilization. The investigation of Fleten and
Näsäkkälä (2010), which applies the clean spark spread to derive option values of gas-fired
plants, does not explicitly include the plant utilization in the real options model. We assume
that the aggregated annual spread of technology i evolves according to the geometric
Brownian motion
dzdtAAS
dAASii AASAAS
i
i σα += , (14)
where αAASi and σAASi are constants that describe the drift and volatility of the aggregated
annual spread of generation technology i, dt is an infinitesimal time increment, and dz is the
increment of a Wiener process. The decisive parameter in our real options model is the
volatility of the aggregated annual spread, therefore we ignore in the following investigation
the drift and assume αAASi = 0.
In a simplified approach, we assume that the value of power plant Vi is equal to the net
present value of the aggregated annual spreads AASi during the entire lifetime of the plant:
26
Ε= −∫ dtetAASV t
T
itiρ
0
)( , (15)
where ρ is the discount rate of the investor and T is the plant lifetime. With this approach, we
neglect the fixed cost components that are not part of the spread. This simplification is
acceptable, as the impact of fixed cost on the volatility of the aggregated annual spread is
considerably lower than the impact of volatile commodity prices. The decision to invest in a
power plant can be interpreted as an optimal stopping problem, and can be solved by using a
dynamic programming approach. The value of the option to invest F(V) in a power plant is
given by the Bellman equation
ρF(V)dt = E[dF(V)] . (16)
This equation implies that holding an option with the value F(V) over the period dt yields an
expected gain of E[dF(V)]. The expected gain needs to be equal to the return ρF(V)dt. By
applying Itô’s lemma, we derive the partial differential equation
))((')²)(("21
)( dVVFdVVFVdF += . (17)
Substituting (14) into (17) and noting that E(dz) = 0, we obtain
dtVVFdtVFVVdFii AASAAS )(')("²²
21
)]([ ασ +=Ε . (18)
By substituting (18) into (16), we derive
0)()(')("²²21 =−+ VFVVFVFV
ii AASAAS ρασ . (19)
In addition, Vi must satisfy the following boundary conditions:
0)0( =F (20)

27
IVVF −= **)( (21)
1*)(' =VF . (22)
Condition (20) arises from the observation that if the value goes to zero, it will remain zero
(this is an implication of the stochastic process described in (14)). V* represents the critical
plant value at which it is optimal to invest and (21) is the value-matching condition that
defines the net payoff (V* - I) of the investor. Eq. (22) is the so-called smooth-pasting
condition that guarantees that the gradient of the first deviation is equal at the exertion point.
To get the value F(V) of the investment option, we need to solve (19) subject to the boundary
conditions (20)-(22). Eq. (19) represents a second-order homogeneous differential equation
that is linear in the dependent variable F and its derivatives. The general solution can be
expressed as a linear combination of two independent solutions and written as
2121)( ββ VAVAVF += , (23)
where A1 and A2 are constants and β1 and β2 are the roots of the quadratic function
0)()1(2
1 2 =−−+− ρβαρββσii AASAAS . (24)
Note that β1 and β2 depend on the parameters αAASi and σAASi of the differential equation and
the discount rate of the investor ρ in the following way:
12
2
1
2
12
2
22>+
−±−=
ii
i
i
i
AASAAS
AAS
AAS
AAS
i σρ
σα
σα
β . i = {1,2} (25)
In our case, boundary condition (20) implies that A2=0, so the solution takes the form
1)( βAVVF = . (26)
The remaining boundary conditions can be used to define the two remaining unknowns: the
critical value V* at which it is optimal to invest, and the constant A:

28
IV1
*1
1
−=
ββ
, (27)
11
11
11
1
1 )(
)1(
*)(
*−
−
⋅−
=−= ββ
β
β ββ
IV
IVA . (28)
Based on the given equations it is possible to analytically determine option values of the
above-described generation technologies.
6 Discussion and interpretation of the results
In this section, we present the results gained with our model and interpret them on two levels.
First, we describe the difference in the option value between condensing and CHP technology.
Then, we analyze how the option value of coal-fired CHP plants is influenced by the degree
of CHP generation. For both cases, we show the differences between the calculation based on
correlation coefficients and the calculation based on copula functions.
6.1 Difference between condensing plants and CHP plants
In our model, we investigated four different investment options: coal-fired condensing plant,
coal-fired CHP plant, gas-fired CCGT condensing plant, and gas-fired CCGT-CHP plant. The
option values of investment with the same fuel type differ significantly between condensing
plants and CHP plants. Figure 6 shows the option value as a function of the aggregated annual
spread.

29
0
25
50
75
100
125
0 25 50 75 100 125 150
Aggregated annual spread [€/kW]
Opt
ion
valu
e [€
/kW
]
Condensing plant
CHP plant
Intrinsic value
0
25
50
75
100
125
0 25 50 75 100 125 150
Aggregated annual spread [€/kW]
Opt
ion
valu
e [€
/kW
]
Condensing plant
CHP plant
Intrinsic value
0
25
50
75
100
125
0 25 50 75 100 125 150
Aggregated annual spread [€/kW]
Opt
ion
valu
e [€
/kW
]
Condensing plant
CHP plant
Intrinsic value
0
25
50
75
100
125
0 25 50 75 100 125 150
Aggregated annual spread [€/kW]
Opt
ion
valu
e [€
/kW
] Condensing plant
CHP plant
Intrinsic value
(a) Coal-fired plants, correlation coefficient (b) Coal-fired plants, copula function
(c) Gas-fired plants, correlation coefficient (d) Gas-fired plants, copula function
0
25
50
75
100
125
0 25 50 75 100 125 150
Aggregated annual spread [€/kW]
Opt
ion
valu
e [€
/kW
]
Condensing plant
CHP plant
Intrinsic value
0
25
50
75
100
125
0 25 50 75 100 125 150
Aggregated annual spread [€/kW]
Opt
ion
valu
e [€
/kW
]
Condensing plant
CHP plant
Intrinsic value
0
25
50
75
100
125
0 25 50 75 100 125 150
Aggregated annual spread [€/kW]
Opt
ion
valu
e [€
/kW
]
Condensing plant
CHP plant
Intrinsic value
0
25
50
75
100
125
0 25 50 75 100 125 150
Aggregated annual spread [€/kW]
Opt
ion
valu
e [€
/kW
] Condensing plant
CHP plant
Intrinsic value
(a) Coal-fired plants, correlation coefficient (b) Coal-fired plants, copula function
(c) Gas-fired plants, correlation coefficient (d) Gas-fired plants, copula function
Figure 6: Option value of investment decisions for CHP and condensing plants as a function
of the aggregated annual spread
The option values of condensing plants, irrespective of whether they are coal-fired or gas-
fired, are higher than the option value of the respective CHP plant. For coal-fired plants the
difference between condensing and CHP technology at the strike price of 70 €/kW amounts to
7.7 €/kW in the correlation based case (4.2 €/kW in the copula based case). For gas-fired
CCGT plants the difference between condensing and CHP technology at the strike price of 66
€/kW amounts to 19.2 €/kW in correlation based case (13.5 €/kW in the copula based case).
The differences in the strike price result from the energy economical assumptions for the
various plant types as described in section 4. For investors, this is an indication that the
uncertainty and risks involved with investments in condensing plants are higher compared to
CHP generation. According to the results of our model it is, therefore, more likely that
investment decisions in condensing plants will be postponed or even cancelled. On the other
hand, the investment decision for CHP plants might be executed earlier, as the option value (i.
e. the value of waiting) is lower. These findings can motivate utilities to invest in CHP
generation instead of condensing plants, especially in periods with a high degree of
uncertainty.

30
For coal-fired plants, the difference in the option value between condensing technology and
CHP technology is smaller than for gas-fired CCGT plants. The major reason for this is that
the share of CHP power generation in the coal-fired plant, due to the specific characteristics
and the defined operation mode, is lower than in the gas-fired CCGT plant. Therefore, risk-
averse utilities that aim to invest promptly in new generation technologies will prefer CHP
plants with a high share of CHP generation. For both fuel types, we calculated the option
values based on the distributions gained by the application of correlation coefficients and the
distributions gained via copula functions. The results show basically the same tendency, but
the application of copula functions leads to less significant differences between condensing
and CHP plants. This effect is more distinctive for gas-fired power plants than for coal-fired
plants.
6.2 Influence of CHP generation on investment decisions in coal plants
Large coal-fired CHP plants, such as the generic plant defined in this paper, are often operated
in the power control mode and produce heat as a by-product of the generated power. In many
cases, there exists no heat sink close to the plant site that is large enough to allow for a
complete utilization of the waste heat. The transport of heat to remote sites with an additional
demand is economically less attractive due to the high losses of heat transportation over long
distances. In many applications, the degree of CHP generation in a coal-fired power plant is
therefore limited by the local heat demand in the area where the plant is located. The fuel
utilization of a modern coal-fired CHP plant depends on the degree of CHP generation and
varies in a range between 45% in the case of pure power generation, and up to 85% in a plant
with the maximum possible degree of heat utilization. Typical sites for efficient coal-fired
CHP plants with a high degree of CHP generation (and consequently high fuel utilization) are
close to big factories, industrial parks with high heat demand, or near to big cities using the
produced heat for district heating. With our model, we analyze the influence of the degree of
CHP generation on the option value of the investment and thus on the rational decision-
making of an investor. In order to quantify this effect, we vary the degree of fuel utilization by
starting with a pure condensing plant until we reach a value of 85%, and calculate with our
spread-based model the option value of the investment options concerned. In this context, we
need to consider how the volatility of the specific spread S is affected by the total fuel
utilization ζ of the coal-fired CHP plant, which is illustrated in Figure 7. The figure shows that
spread-volatility decreases if fuel utilization (or the share of CHP generation respectively)

31
increases. The reason behind this characteristic is that with an increase in CHP generation the
share of stable revenue components, such as CHP promotion, also increases, which reduces
the volatility of the spread and, as a consequence, also the risk exposure of the investor.
0
5
10
15
20
25
30
0,40 0,45 0,50 0,55 0,60 0,65 0,70 0,75 0,80 0,85 0,90
Fuel utilization ζ
Std
. dev
iatio
n of
spe
cific
spr
ead
[€/M
Wh]
0.40 0.45 0.50 0.55 0.60 0.65 0.70 0.75 0.80 0.85 0.90
0
5
10
15
20
25
30
0,40 0,45 0,50 0,55 0,60 0,65 0,70 0,75 0,80 0,85 0,90
Fuel utilization ζ
Std
. dev
iatio
n of
spe
cific
spr
ead
[€/M
Wh]
0.40 0.45 0.50 0.55 0.60 0.65 0.70 0.75 0.80 0.85 0.90
Figure 7: Relation between standard deviation of the specific spread and fuel utilization for a
coal-fired CHP plant
In a next step, we derive with our model the option values of coal-fired plants in dependence
of the fuel utilization that is, as mentioned above, strongly correlated with the degree of CHP
generation. Figure 8 depicts the option values as a function of the aggregated annual spread.
The figure again illustrates the differences between the calculation based on correlation
coefficients and the calculation based on copula functions.
0
25
50
75
100
125
0 25 50 75 100 125 150
Aggregated annual spread [€/kW]
Opt
ion
valu
e [€
/kW
]
Condensation plant (ζ =0.45)CHP plant (ζ = 0.6)CHP plant (ζ = 0.85)Intrinsic value
0
25
50
75
100
125
0 25 50 75 100 125 150
Aggregated annual spread [ € / MW ]
Opt
ion
valu
e [ €
/ M
W ]
Condensation plant (ζ =0,45)CHP plant (ζ = 0,6)CHP plant (ζ = 0,85)Intrinsic value
(a) Calculation based on correlation coefficient (b) Calculation based on copula function
Aggregated annual spread [€/kW] Aggregated annual spread [€/kW]
Opt
ion
valu
e [€
/kW
]
Opt
ion
valu
e [€
/kW
] Condensing plant (ζ=0.45)
CHP plant (ζ=0.60)
CHP plant (ζ=0.85)
Intrinsic value
Condensing plant (ζ=0.45)CHP plant (ζ=0.60)
CHP plant (ζ=0.85)Intrinsic value
0
25
50
75
100
125
0 25 50 75 100 125 150
Aggregated annual spread [€/kW]
Opt
ion
valu
e [€
/kW
]
Condensation plant (ζ =0.45)CHP plant (ζ = 0.6)CHP plant (ζ = 0.85)Intrinsic value
0
25
50
75
100
125
0 25 50 75 100 125 150
Aggregated annual spread [ € / MW ]
Opt
ion
valu
e [ €
/ M
W ]
Condensation plant (ζ =0,45)CHP plant (ζ = 0,6)CHP plant (ζ = 0,85)Intrinsic value
(a) Calculation based on correlation coefficient (b) Calculation based on copula function
Aggregated annual spread [€/kW] Aggregated annual spread [€/kW]
Opt
ion
valu
e [€
/kW
]
Opt
ion
valu
e [€
/kW
] Condensing plant (ζ=0.45)
CHP plant (ζ=0.60)
CHP plant (ζ=0.85)
Intrinsic value
Condensing plant (ζ=0.45)CHP plant (ζ=0.60)
CHP plant (ζ=0.85)Intrinsic value
Figure 8: Option value of coal-fired plants in dependence of the fuel utilization as a function
of the specific aggregated annual spread
The results show that the uncertainty involved with new investments in coal-fired plants is
reduced if the heat of the plant is also utilized. The higher the share of CHP generation of a
coal-fired power plant, the lower the uncertainty for the investor is. An increase in the degree
of fuel utilization from 60% to 85%, which is directly correlated to the share of CHP

32
generation, reduces the option value at the strike price from 50.0 €/kW to 41.7 €/kW in the
case based on correlation coefficients (from 53.3 €/kW to 43.3 €/kW in the case based on
copula functions, respectively). In the practical application, this means that it is beneficial if
the sites of large coal-fired plants are close to sizable heat sinks that can utilize as much as
possible of the heat produced. In the case where the dependence structure is modeled via
copula functions, the observed effect is again less pronounced than by application of
correlation coefficients.
7 Conclusions
In this paper we have applied real options theory on investment decisions of new fossil-fired
power plants and have derived some conclusions about the uncertainty related with different
investment options. Our model is calibrated for the German power market. For other countries
the results may deviate from our findings as commodity prices levels and CHP promotion
schemes are different (Westner and Madlener, 2009). Our investigation puts a focus on CHP
generation in comparison to condensing plants. Due to their specific characteristics, such as
additional revenues from heat sales, CHP promotion schemes, specific operational features,
and a beneficial allocation of CO2 allowances, CHP plants have considerably different risk
profiles compared to condensing plants. These specifics can affect the decision-making
process of an investor. The real options model applied is based on aggregated annual spreads
used to calculate the value of various investment options. We take the aggregated annual
spread as an assessment criterion since it contains the relevant volatile input parameters that
have an impact on the valuation of investment decisions. We determined the aggregated
annual spread independently in two different ways, by the application of correlation
coefficients and copula functions, and show the deviation between these two approaches. The
copula-based approach is able to better reproduce the complex dependence structure between
the input variables and, therefore, leads to more precise results in comparison to the
correlation-based investigation that considers only a linear dependency. The results gained by
the real options model provide some insights for investors who intend to invest in new power
generation capacity in Germany. We show that the option values of fossil-fired power plants
with CHP generation are lower than those of the same technology without heat utilization. As
a consequence, the value of waiting of investment decisions in CHP plants is lower, and
investing utilities can decide with less uncertainty whether they want to make a commitment

33
for a new plant. Another finding of our research is that the option value depends on the
operation mode of the plant and on fuel-type-specific characteristics. An expansion of the
degree of CHP generation at coal-fired plants reduces the option value and therefore reduces
uncertainty for the investor. Our findings could have an impact on the evaluation of the siting
for new large-scale fossil power plants. As the possible degree of CHP generation depends
significantly on the local heat demand in the surrounding of the plant site, the size of the heat
sink available could therefore gain more relevance in the future in comparison to other
selection criteria for plant sites. The results obtained are only conditionally transferable to
other countries, as some of the risk-reducing effects of CHP generation depend on the
country-specific frameworks, which can differ significantly.
In addition to the specific characteristics of CHP generation, which are considered in our
investigation, there are two further aspects that could also contribute towards decreasing the
risk exposure of CHP generation. These are privileged feed-in conditions and a better public
acceptance. Grid operators in Germany are legally obliged to purchase the power produced in
CHP plants prior to other kinds of conventional generation (preferential dispatch). This is an
advantage especially in areas where conventional power plants are often re-dispatched due to
limitations in the transmission grid. Especially if the fluctuating wind generation in Northern
Germany increases further, the privileged feed-in conditions of CHP generation could become
a significant benefit. Additionally, CHP generation faces in comparison to condensing plants
less resistance from the public. High efficiency and less environmental impacts (e.g.
abandonment of cooling towers) increase public acceptance and reduce the risks of legal
disputes or building freezes for the investing utilities. Our research puts its major focus on the
energy economic aspects and does not consider the advantages through the power purchase
obligation or the better public acceptance of CHP generation, which leaves room for further
investigation.
References
Bastianin, A., 2009. Modelling asymmetric dependence using copula functions: an application
to value-at-risk in the energy sector. Working Paper 2009.24, Fondazione Eni Enrico
Mattei.

34
Black, F., Scholes, M., 1973. The pricing of options and corporate liabilities. Journal of
Political Economy, I 81, 637–659.
Blok, K., Turkenburg, W., 1994. CO2 emission reduction by means of industrial CHP in the
Netherlands. Energy Conversion and Management, 35 (4), 317–340.
Blyth, W., Bradley, R., Bunn, D., Clarke, C., Wilson, T., Yang, M., 2007. Investment risks
under uncertain climate change policy. Energy Policy, 35 (11), 5766–5773.
BMU, 2006. Nationaler Allokationsplan 2008-2012 für die Bundesrepublik Deutschland,
Bundesministerium für Umwelt, Naturschutz und Reaktorsicherheit (BMU), Berlin,
June.
Copeland, T., Antikarov, V., 2001. Real Options: A Practitioner’s Guide. WW Norton & Co,
New York City.
Deheuvels, P., 1979. La fonction de dépendance empirique et ses propriétés. Un test
nonparamétrique d’indépendance. Bulletin de la Classe des Sciences, Académie Royale
de Belgique, 65 (6), 274–292.
Denault, M., Dupuis, D., Couture-Cardinal, S., 2009. Complementarity of hydro and wind
power: Improving the risk profile of energy inflows. Energy Policy, 37 (12), 5376-5384.
Dittmann, A., Sander, T., Menzler, G., 2009. Die ökologische Bewertung von Wärme und
Elektroenergie ein Instrument zur Erhöhung der Akzeptanz der Kraft-Wärme-Kopplung.
VIK Mitteilungen – Sonderdruck, Juni 2009.
Dixit, A.K., Pindyck, R.S., 1994. Investment under Uncertainty. Princeton University Press,
Princeton, NJ.
EEG, 2008. Gesetz für den Vorrang Erneuerbarer Energien vom 25.10.2008 (BGBl. I S.
2074), Berlin.
EU, 2009. Directive 2009/29/EC amending Directive 2003/87/EC so as to improve and
extend the greenhouse gas emission allowance trading scheme of the Community.
Commission of the European Communities, Brussels, April 23, 2009.
Fleten, S.E., Näsäkkälä, E., 2010. Gas-fired power plants: investment timing, operating
flexibility and CO2 capture. Energy Economics 32 (4), 805–816.
Gaenssler, P., Stute, W., 1987. Seminar on Empirical Processes. DMV Seminar 9, Birkhäuser
Verlag, Basel.
Hlouskova, J., Kossmeier, S., Obersteiner, M., Schnabl, A., 2005. Real options and the value
of generation capacity in the German electricity market. Review of Financial
Economics, 14 (3–4), 297–310.

35
International Energy Agency (IEA), 2007. Modelling investment risks and uncertainties with
real options approach. IEA Working Paper Series LTO/2007/WP01, February.
International Energy Agency (IEA), 2008a. World Energy Outlook 2009. OECD/IEA, Paris.
International Energy Agency (IEA), 2008b. Combined Heat and Power. OECD/IEA, Paris.
Ishii, J., Yan, J., 2004. Investment under regulatory uncertainty: US electricity generation
investment since 1996. Center for the Study of Energy Markets, University of California
Energy Institute, Berkeley, CSEM Working Paper 127, March 2004.
Joe, H., 1997. Multivariate Models and Dependence Concepts, Chapman & Hall, London.
Kumbaroğlu, G., Madlener, R., Demirel, M., 2008. A real options evaluation model for the
diffusion prospects of new renewable power generation technologies. Energy
Economics, 30 (4), 1882–1908.
KWK-Gesetz, 2008. Gesetz zur Förderung der Kraft-Wärme-Kopplung vom 25. Oktober
2008 (BGBl. I S. 2101), Berlin.
McDonald, R., Siegel, D., 1986. The value of waiting to invest. Quarterly Journal of
Economics, 101 (4), 707–723.
Merton, R., 1973. The theory of rational option pricing. Journal of Economic Management
Science, 4 (1), 141–183.
Murto, P., Nese, G., 2003. Input price risk and optimal timing of energy investment: choice
between fossil and biofuels. Working Paper No. 25/02, Institute for Research in
Economics and Business Administration, Bergen, Norway.
Nelsen, R., 1999. An Introduction to Copulas. Springer Verlag, New York.
Näsäkkälä, E., Fleten, S.E., 2005. Flexibility and technology choice in gas-fired power plant
investments. Review of Financial Economics, 14 (3-4), 371–393.
Pahle, M., 2010. Germany’s dash for coal: Exploring drivers and factors. Energy Policy, 38
(7), 3431–3442.
Pindyck, R., 1988. Irreversible investment, capacity choice, and the value of the firm.
American Economic Review 79 (5), 969–985.
Pindyck, R., 1991. Irreversibility, uncertainty and investment. Journal of Economic Literature,
29 (3), 1110–1152.
Pindyck, R., 1993. Investments of uncertain cost. Journal of Financial Economics, 34 (1), 53–
76.
Roques, F.A., Savva, N.S., 2006. Price cap regulation and investment incentives under
demand uncertainty. Working Paper CWPE 0636 and EPRG 0616, Electricity Policy
Research Group, University of Cambridge, Cambridge, May.

36
Rothwell, T., 2006. A real options approach to evaluating new nuclear power plants. The
Energy Journal, 27 (1), 37–54.
Valizadeh Haghi, H., Tavakoli Bina, M., Golkar, M.A., Moghaddas-Tafreshi, S.M., 2010.
Using copulas for analysis of large datasets in renewable distributed generation: PV and
wind power integration in Iran, Renewable Energy, 35 (9), 1991–2000.
Siddiqui, A.S., Maribu, K., 2009. Investment and upgrade in distributed generation under
uncertainty. Energy Economics, 31 (1), 25–31.
Sklar, A., 1959. Fonctions de répartition à n dimensions et leurs marges. Publications de
l’Institut de Statistique de l’Université de Paris, Volume 8, 229–231.
Sundberg, G., Sjödin, J., 2003. Project financing consequences on cogeneration: industrial
plant and municipal utility co-operation in Sweden. Energy Policy, 31 (6), 491–503.
Trigeorgis, L., 1996. Real Options - Managerial Flexibility and Strategy in Resource
Allocation. MIT Press, Cambridge, MA.
Westner, G., Madlener, R., 2009. The benefit of regional diversification of CHP investments
in Europe: A Mean-Variance Portfolio analysis. FCN Working Paper No. 5/2009,
Institute for Future Energy Consumer Needs and Behavior (FCN), RWTH Aachen
University, November.
Wickart, M., Madlener, R., 2007. Optimal technology choice and investment timing: A
stochastic model of industrial cogeneration vs. heat-only production. Energy Economics,
29 (4), 934–952.
Yang, M., Blyth, W., Bradley, R., Bunn, D., Clarke, C., Wilson, T., 2008. Evaluating the
power investment options with uncertainty in climate policy. Energy Economics, 30 (4),
1933–1950.
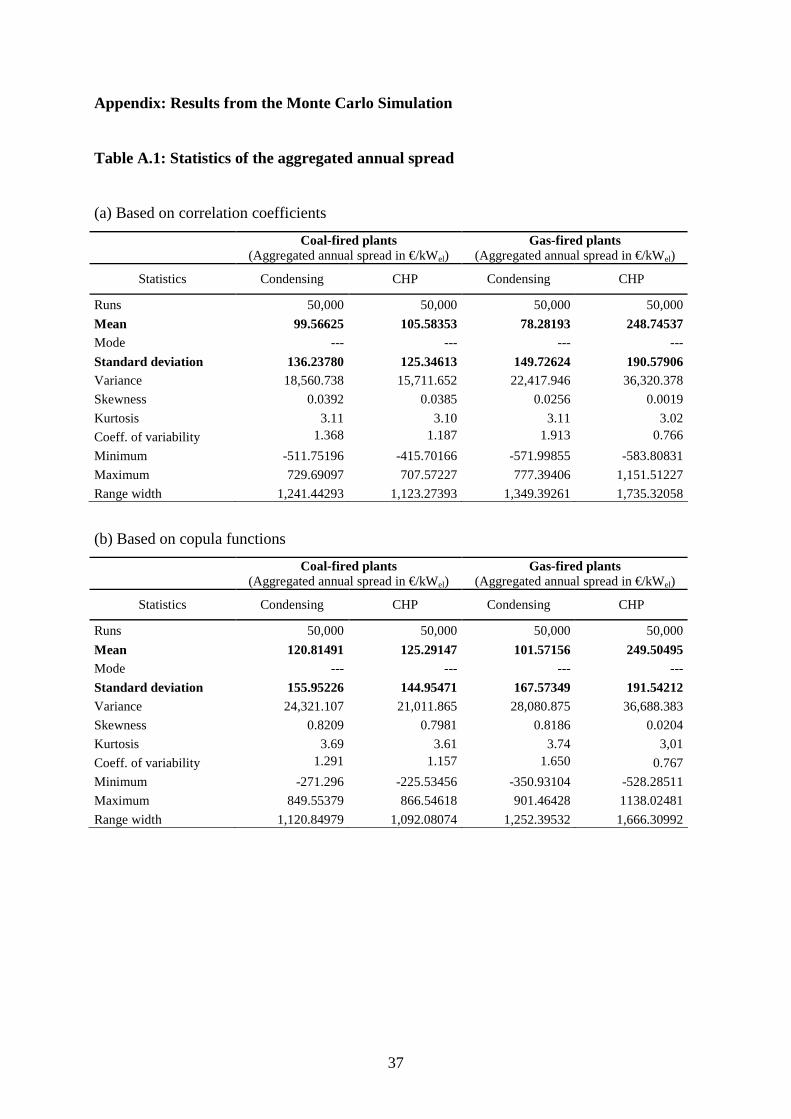
37
Appendix: Results from the Monte Carlo Simulation
Table A.1: Statistics of the aggregated annual spread
(a) Based on correlation coefficients
Coal-fired plants (Aggregated annual spread in €/kWel)
Gas-fired plants (Aggregated annual spread in €/kWel)
Statistics Condensing CHP Condensing CHP
Runs 50,000 50,000 50,000 50,000
Mean 99.56625 105.58353 78.28193 248.74537 Mode --- --- --- ---
Standard deviation 136.23780 125.34613 149.72624 190.57906 Variance 18,560.738 15,711.652 22,417.946 36,320.378
Skewness 0.0392 0.0385 0.0256 0.0019
Kurtosis 3.11 3.10 3.11 3.02
Coeff. of variability 1.368 1.187 1.913 0.766
Minimum -511.75196 -415.70166 -571.99855 -583.80831
Maximum 729.69097 707.57227 777.39406 1,151.51227
Range width 1,241.44293 1,123.27393 1,349.39261 1,735.32058
(b) Based on copula functions
Coal-fired plants (Aggregated annual spread in €/kWel)
Gas-fired plants (Aggregated annual spread in €/kWel)
Statistics Condensing CHP Condensing CHP
Runs 50,000 50,000 50,000 50,000
Mean 120.81491 125.29147 101.57156 249.50495 Mode --- --- --- ---
Standard deviation 155.95226 144.95471 167.57349 191.54212 Variance 24,321.107 21,011.865 28,080.875 36,688.383
Skewness 0.8209 0.7981 0.8186 0.0204
Kurtosis 3.69 3.61 3.74 3,01
Coeff. of variability 1.291 1.157 1.650 0.767
Minimum -271.296 -225.53456 -350.93104 -528.28511
Maximum 849.55379 866.54618 901.46428 1138.02481
Range width 1,120.84979 1,092.08074 1,252.39532 1,666.30992

List of FCN Working Papers
2010 Westner G., Madlener R. (2010). Investment in New Power Generation under Uncertainty: Benefits of CHP vs
Condensing Plants in a Copula-Based Analysis, FCN Working Paper No. 12/2010, Institute for Future Energy Consumer Needs and Behavior, RWTH Aachen University, September.
Lang J., Madlener R. (2010). Relevance of Risk Capital and Margining for the Valuation of Power Plants: Cash
Requirements for Credit Risk Mitigation, FCN Working Paper No. 1/2010, Institute for Future Energy Consumer Needs and Behavior, RWTH Aachen University, February.
Michelsen C., Madlener R. (2010). Integrated Theoretical Framework for a Homeowner’s Decision in Favor of an
Innovative Residential Heating System, FCN Working Paper No. 2/2010, Institute for Future Energy Consumer Needs and Behavior, RWTH Aachen University, February.
Harmsen - van Hout M.J.W., Herings P.J.-J., Dellaert B.G.C. (2010). The Structure of Online Consumer
Communication Networks, FCN Working Paper No. 3/2010, Institute for Future Energy Consumer Needs and Behavior, RWTH Aachen University, March.
Madlener R., Neustadt I. (2010). Renewable Energy Policy in the Presence of Innovation: Does Government Pre-
Commitment Matter?, FCN Working Paper No. 4/2010, Institute for Future Energy Consumer Needs and Behavior, RWTH Aachen University, April (revised June 2010).
Harmsen-van Hout M.J.W., Dellaert B.G.C., Herings, P.J.-J. (2010). Behavioral Effects in Individual Decisions of
Network Formation: Complexity Reduces Payoff Orientation and Social Preferences, FCN Working Paper No. 5/2010, Institute for Future Energy Consumer Needs and Behavior, RWTH Aachen University, May.
Lohwasser R., Madlener R. (2010). Relating R&D and Investment Policies to CCS Market Diffusion Through Two-
Factor Learning, FCN Working Paper No. 6/2010, Institute for Future Energy Consumer Needs and Behavior, RWTH Aachen University, June.
Rohlfs W., Madlener R. (2010). Valuation of CCS-Ready Coal-Fired Power Plants: A Multi-Dimensional Real
Options Approach, FCN Working Paper No. 7/2010, Institute for Future Energy Consumer Needs and Behavior, RWTH Aachen University, July.
Rohlfs W., Madlener R. (2010). Cost Effectiveness of Carbon Capture-Ready Coal Power Plants with Delayed
Retrofit, FCN Working Paper No. 8/2010, Institute for Future Energy Consumer Needs and Behavior, RWTH Aachen University, August.
Gampert M., Madlener R. (2010). Pan-European Management of Electricity Portfolios: Risks and Opportunities of
Contract Bundling, FCN Working Paper No. 9/2010, Institute for Future Energy Consumer Needs and Behavior, RWTH Aachen University, August.
Glensk B., Madlener R. (2010). Fuzzy Portfolio Optimization for Power Generation Assets, FCN Working Paper
No. 10/2010, Institute for Future Energy Consumer Needs and Behavior, RWTH Aachen University, August. Lang J., Madlener R. (2010). Credit Risk Mitigation Applying Margining: Impact on Power Plant Portfolio
Selection, FCN Working Paper No. 11/2010, Institute for Future Energy Consumer Needs and Behavior, RWTH Aachen University, September.
Lang J., Madlener R. (2010). Investment in New Power Generation Under Uncertainty: Benefits of CHP vs.
Condensing Plants in a Copula-Based Analysis, FCN Working Paper No. 12/2010, Institute for Future Energy Consumer Needs and Behavior, RWTH Aachen University, September.

2009 Madlener R., Mathar T. (2009). Development Trends and Economics of Concentrating Solar Power Generation
Technologies: A Comparative Analysis, FCN Working Paper No. 1/2009, Institute for Future Energy Consumer Needs and Behavior, RWTH Aachen University, November.
Madlener R., Latz J. (2009). Centralized and Integrated Decentralized Compressed Air Energy Storage for
Enhanced Grid Integration of Wind Power, FCN Working Paper No. 2/2009, Institute for Future Energy Consumer Needs and Behavior, RWTH Aachen University, November (revised September 2010).
Kraemer C., Madlener R. (2009). Using Fuzzy Real Options Valuation for Assessing Investments in NGCC and
CCS Energy Conversion Technology, FCN Working Paper No. 3/2009, Institute for Future Energy Consumer Needs and Behavior, RWTH Aachen University, November.
Westner G., Madlener R. (2009). Development of Cogeneration in Germany: A Dynamic Portfolio Analysis Based
on the New Regulatory Framework, FCN Working Paper No. 4/2009, Institute for Future Energy Consumer Needs and Behavior, RWTH Aachen University, November (revised March 2010).
Westner G., Madlener R. (2009). The Benefit of Regional Diversification of Cogeneration Investments in Europe:
A Mean-Variance Portfolio Analysis, FCN Working Paper No. 5/2009, Institute for Future Energy Consumer Needs and Behavior, RWTH Aachen University, November (revised March 2010).
Lohwasser R., Madlener R. (2009). Simulation of the European Electricity Market and CCS Development with the
HECTOR Model, FCN Working Paper No. 6/2009, Institute for Future Energy Consumer Needs and Behavior, RWTH Aachen University, November.
Lohwasser R., Madlener R. (2009). Impact of CCS on the Economics of Coal-Fired Power Plants – Why
Investment Costs Do and Efficiency Doesn’t Matter, FCN Working Paper No. 7/2009, Institute for Future Energy Consumer Needs and Behavior, RWTH Aachen University, November.
Holtermann T., Madlener R. (2009). Assessment of the Technological Development and Economic Potential of
Photobioreactors, FCN Working Paper No. 8/2009, Institute for Future Energy Consumer Needs and Behavior, RWTH Aachen University, November.
Ghosh G., Carriazo F. (2009). A Comparison of Three Methods of Estimation in the Context of Spatial Modeling,
FCN Working Paper No. 9/2009, Institute for Future Energy Consumer Needs and Behavior, RWTH Aachen University, November.
Ghosh G., Shortle J. (2009). Water Quality Trading when Nonpoint Pollution Loads are Stochastic, FCN Working
Paper No. 10/2009, Institute for Future Energy Consumer Needs and Behavior, RWTH Aachen University, November.
Ghosh G., Ribaudo M., Shortle J. (2009). Do Baseline Requirements hinder Trades in Water Quality Trading
Programs?, FCN Working Paper No. 11/2009, Institute for Future Energy Consumer Needs and Behavior, RWTH Aachen University, November.
Madlener R., Glensk B., Raymond P. (2009). Investigation of E.ON’s Power Generation Assets by Using Mean-
Variance Portfolio Analysis, FCN Working Paper No. 12/2009, Institute for Future Energy Consumer Needs and Behavior, RWTH Aachen University, November.

FCN Working Papers are free of charge. They can mostly be downloaded in pdf format from the FCN / E.ON ERC Website (www.eonerc.rwth-aachen.de/fcn) and the SSRN Website (www.ssrn.com), respectively. Alternatively, they may also be ordered as hardcopies from Ms Sabine Schill (Phone: +49 (0) 241-80 49820, E-mail: [email protected]), RWTH Aachen University, Institute for Future Energy Consumer Needs and Behavior (FCN), Chair of Energy Economics and Management (Prof. Dr. Reinhard Madlener), Mathieustrasse 6, 52074 Aachen, Germany.
2008 Madlener R., Gao W., Neustadt I., Zweifel P. (2008). Promoting Renewable Electricity Generation in Imperfect
Markets: Price vs. Quantity Policies, FCN Working Paper No. 1/2008, Institute for Future Energy Consumer Needs and Behavior, RWTH Aachen University, July (revised May 2009).
Madlener R., Wenk C. (2008). Efficient Investment Portfolios for the Swiss Electricity Supply Sector, FCN Working
Paper No. 2/2008, Institute for Future Energy Consumer Needs and Behavior, RWTH Aachen University, August.
Omann I., Kowalski K., Bohunovsky L., Madlener R., Stagl S. (2008). The Influence of Social Preferences on
Multi-Criteria Evaluation of Energy Scenarios, FCN Working Paper No. 3/2008, Institute for Future Energy Consumer Needs and Behavior, RWTH Aachen University, August.
Bernstein R., Madlener R. (2008). The Impact of Disaggregated ICT Capital on Electricity Intensity of Production:
Econometric Analysis of Major European Industries, FCN Working Paper No. 4/2008, Institute for Future Energy Consumer Needs and Behavior, RWTH Aachen University, September.
Erber G., Madlener R. (2008). Impact of ICT and Human Skills on the European Financial Intermediation Sector,
FCN Working Paper No. 5/2008, Institute for Future Energy Consumer Needs and Behavior, RWTH Aachen University, September.