
Investment Climate and Employment Growth: The …ftp.iza.org/dp3138.pdf · Investment Climate and...
45
IZA DP No. 3138 Investment Climate and Employment Growth: The Impact of Access to Finance, Corruption and Regulations Across Firms Reyes Aterido Mary Hallward-Driemeier Carmen Pagés DISCUSSION PAPER SERIES Forschungsinstitut zur Zukunft der Arbeit Institute for the Study of Labor November 2007
Transcript of Investment Climate and Employment Growth: The …ftp.iza.org/dp3138.pdf · Investment Climate and...

IZA DP No. 3138
Investment Climate and Employment Growth:The Impact of Access to Finance, Corruption andRegulations Across Firms
Reyes AteridoMary Hallward-DriemeierCarmen Pagés
DI
SC
US
SI
ON
PA
PE
R S
ER
IE
S
Forschungsinstitutzur Zukunft der ArbeitInstitute for the Studyof Labor
November 2007
Investment Climate and Employment
Growth: The Impact of Access to Finance, Corruption and Regulations Across Firms
Reyes Aterido World Bank
Mary Hallward-Driemeier
World Bank
Carmen Pagés Inter-American Development Bank
and IZA
Discussion Paper No. 3138 November 2007
IZA
P.O. Box 7240 53072 Bonn
Germany
Phone: +49-228-3894-0 Fax: +49-228-3894-180
E-mail: [email protected]
Any opinions expressed here are those of the author(s) and not those of the institute. Research disseminated by IZA may include views on policy, but the institute itself takes no institutional policy positions. The Institute for the Study of Labor (IZA) in Bonn is a local and virtual international research center and a place of communication between science, politics and business. IZA is an independent nonprofit company supported by Deutsche Post World Net. The center is associated with the University of Bonn and offers a stimulating research environment through its research networks, research support, and visitors and doctoral programs. IZA engages in (i) original and internationally competitive research in all fields of labor economics, (ii) development of policy concepts, and (iii) dissemination of research results and concepts to the interested public. IZA Discussion Papers often represent preliminary work and are circulated to encourage discussion. Citation of such a paper should account for its provisional character. A revised version may be available directly from the author.

IZA Discussion Paper No. 3138 November 2007
ABSTRACT
Investment Climate and Employment Growth: The Impact of Access to Finance, Corruption and Regulations Across Firms*
Using firm level data on 70,000 enterprises in 107 countries, this paper finds important effects of access to finance, business regulations, corruption, and to a lesser extent, infrastructure bottlenecks in explaining patterns of job creation at the firm level. The paper focuses on how the impact of the investment climate varies across sizes of firms. The differences across size categories come from two sources. First, objective conditions of the business environment do vary systematically by firm types. Micro and small firms have less access to formal finance, pay more in bribes than do larger firms, and face greater interruptions in infrastructure services. Larger firms spend significantly more time dealing with officials and red tape. Second, even controlling for these differences in objective conditions, there is evidence of significant non-linearities in their impact on employment growth. The results suggest strong composition effects: A weak business environment shifts downward the size distribution of firms. In the case of finance and business regulations this occurs by reducing the employment growth of all firms, particularly micro and small firms. On the other hand, corruption and poor access to infrastructure reduce employment growth by affecting the growth of medium size and large firms. With significant differences between firms with less than 10 employees and SMEs, these results indicate significant reforms are needed to spur micro firms to grow into the ranks of the SMEs. JEL Classification: J23 Keywords: employment growth, investment climate, corruption, regulatory framework,
finance Corresponding author: Carmen Pagés Inter-American Development Bank 1300 New York Avenue Washington, D.C. 20577 USA E-mail: [email protected]
* The views expressed here do not necessarily represent the views of either the World Bank, the Inter-American Development Bank or their Boards of Executive Directors. The authors would like to thank participants at IADB seminars and at the LACEA conference in Bogota for valuable comments and suggestions.
1. Introduction An issue of particular relevance for economic growth is how the development of markets and
institutional infrastructure influence the growth of firms. This issue is even more important in
developing countries, where markets and institutional infrastructure are less developed. A
related concern is whether an adverse business environment shifts the size distribution of firms,
affecting the size, the efficiency and the dynamism of the business sector. This paper uses firm-
level data on approximately 70,000 enterprises in 102 developing countries and five high-income
economies to assess the effects of the broader business environment on employment growth by
firms, focusing on the size dimension.
There are a number of recent studies that assess the effect of different dimensions of the
business environment on firms’ performance. Several examine the effect of employment
regulations on firms’ adjustment and on labor market outcomes more generally.1 Others look at
the effect of regulations of entry of firms on firm creation and growth.2 A number of them
investigate the importance of access to finance for firm development and growth.3 Overall, these
studies indicate that regulations on labor, barriers of entry for firms, and financing conditions can
have a direct impact on firms’ employment decisions. However, other aspects of the business
environment can affect these decisions as well, raising costs and risks associated with doing
business or by creating barriers to competition. By affecting the overall growth prospects, issues
from the quality of infrastructure, the strength of property rights, the nature and enforcement of
business regulations and the overall openness in the management of public resources can all
affect firms’ growth (World Bank, 2004a). This paper looks at the joint and relative importance
of a number of dimensions of the business environment on firms’ growth.
A common theme emphasized in many of these studies is that the effect of the business
environment may not be neutral across firm size. Market failures, or policy created distortions
can create fixed costs in the operation of business creating cost disadvantages for smaller firms.
The costs of dealing with credit market information imperfections or with a complex and non-
transparent regulatory environment are some examples of such non-linearities. Large firms may
1 A few recent examples are: Botero et al. (2003), Besley and Burgess (2004), Almeida and Carneiro (2005), Haltiwanger, Scarpetta and Schweiger (2006), Micco and Pagés (2006), Petrin and Sivadasan (2006) and Autor, Kerr and Kugler (2007). 2 For example: Djankov et al (2003) and Klapper, Laeven and Rajan (2004). 3 For example: Beck, Demirgüç-Kunt and Maksimovic (2005) , Demirgüç-Kunt and Maksimovic (1998), Rajan and Zingales (1998), Galindo and Micco (2005).
2
also have more political influence and shape regulations and policies in their favor. On the other
hand, smaller firms may benefit from lax enforcement of regulations or lower harassment from
corrupted public officials. Across the world, a sizeable amount of public resources are devoted to
the development of micro, small and medium firms, yet unlocking potential constraints to their
performance is another, perhaps equally effective, development strategy.
This paper makes a number of contributions. Using newly available data from the World
Bank’s Enterprise Surveys (ES), the paper uses comparable firm-level data from over 100
countries. In addition to information contained in most firm-level data surveys (employment,
investment, sales), these data includes measures of multiple dimensions of the business
environment both objective and subjective at the individual firm level. This paper explores
whether such measures vary across types of firms as well as whether a given set of conditions
have a differential impact on performance across different types of firms. It emphasizes the
importance of looking at variations within countries, in particular exploring how size, but also
age, sector and ownership affect results.
Differential effects across firms of different size can stem from two sources. First, there
can be differences in the underlying objective conditions faced by firms. The paper does find
that micro and small firms have less access to formal finance, face significantly greater
interruptions in infrastructure services, and pay more in bribes—as a percentage of sales—than
than do larger firms. Larger firms spend significantly more time dealing with officials and red
tape. Second, the same conditions can potentially have differential or non-linear effects on
employment growth by size. Thus, it could be that the same extent of external finance is more
beneficial to smaller firms or that the same extent of power outages is less damaging to smaller
firms. Indeed, the paper does find that for finance, business regulations and corruption there are
non-linear effects, with smaller effects for infrastructure variables.
Taken together, the overall impact of the business environment on firm growth has
significant size effects. The paper focuses on four main areas: access to finance, the regulatory
environment, corruption and access to infrastructure. The results indicate significant differences
across size categories of firms—both in terms of differences in objective conditions faced by
firms, and non-linearities in the impact of these conditions. Poor access to finance, insufficient
or poorly developed business regulations, corruption, and infrastructure bottlenecks all shift the
size distribution of firms downward. Lack of finance and insufficient or ineffective business
3

regulations reduce employment growth in all firms, but especially in micro and small ones.
Corruption and poor infrastructure create growth bottlenecks for medium and large firms.
The results also show the importance of distinguishing between micro (less than 10
employees) and small firms (11-50 employees). Results show significant differences in the
marginal effects across these two size categories for finance, regulatory environment and
corruption. These differences extend to including the average differences in the objective
conditions facing these firms in assessing the overall impact of the business environment (i.e.,
evaluating the marginal effect at the average value of objective conditions for each size category
of firms). However, either excluding micro firms or combining them with small firms in a single
category loses the differential impact for finance and regulatory environment between the
smaller firms and larger ones, diluting the message that smaller firms would benefit from
business environment reforms.
There are some methodological issues that need to be addressed, including potential
measurement error, omitted variable bias and endogeneity. The analysis is conducted with
individual survey dummies so that the variation being exploited is within country and survey. In
addition to controlling for some potentially important omitted variables, this also controls for
fixed effects across surveys. Furthermore, to control for possible differences in demand
conditions, a fuller set of country-industry dummies are included. Incorporating multiple
dimensions of the broader business environment simultaneously deals seriously with concerns of
omitted variable bias of papers that include only a single dimension, such as labor regulations or
finance.
To address potential endogeneity, this paper takes two steps. First, it relies on objective
rather than subjective measures of the business environment. Thus, instead of using the extent to
which firms complain about finance or electricity, it uses information on the actual access to
trade credit or bank loans, and the frequency of outages and the costs associated with these
outages. Second, it uses location-sector-size averages (minus individual firms’ own responses)
of the business environment measures rather than individual firms’ own responses. This captures
the broader environment in which the firm operates and allows the individual firm’s own
contribution to the average to be excluded. To ensure adequate numbers of firms in each
location-sector-size cell average, if there were fewer than four observations dimensions were
4
combined for those firms in the small cell. The approach also has the benefit of not losing those
observations where a firm did not answer all the individual investment climate questions.4
The paper is structured as follows. Section 2 reviews the related literature. Section 3
describes the data. Section 4 examines how reported constraints vary by types of firms,
emphasizing the different patterns across different sizes of firms. Section 5 then looks at how
objective variables vary across firms, verifying that the subjective responses do reflect actual
variations in the conditions experienced by different types of firms. Including lagged
performance variables in these regressions reinforces the need to address endogeneity—and
indicate the likely directions that employment growth might have on different dimensions of the
business environment. Section 6 describes the impact of objective conditions on employment
growth using location-sector-size averages instead of individual firm responses. Section 7
conducts a number of robustness checks. Section 8 concludes.
2. Literature Review There is a growing literature that assesses the effects of the set factors, policies and institutions,
commonly known as business environment, on the performance of firms and economic growth.5
The methodologies used by these studies are very diverse. A number of studies have focused on
cross-country variation to identify the effect of labor regulations (Botero et al, 2004; Heckman
and Pagés, 2004), regulation of entry (Djankov et al., 2002) or a wide set of regulations (Loayza,
Oviedo and Servén, 2005). These studies relate objective (de jure) measures of regulation at the
country level to aggregate country outcomes. Although the results are suggestive of the
importance of appropriate regulations for business development, they suffer from important
methodological constraints ranging from omitted variable bias to endogeneity concerns.
Another group of studies employ a difference-in-differences method first developed by
Rajan and Zingales (1998). These studies analyze the effect of different aspects of the business
environment at the country-industry level. The underlying idea behind this method is that if a 4 This approach is very similar to using location-sector-size dummies as instruments (except that the firm’s own value is not excluded in this calculation, the number of observations averaged in a cell may be very small, and the additional observations cannot be recovered if a single investment climate variable is not available.). The test of overidentifying restrictions could not be estimated using the full specification due to the large number of dummies and instruments. However, in in specifications not using a full set of country-industry dummies, the restrictions could not be rejected at the 0.3 level. 5 Such set of conditions and policies is sometimes also referred as competitiveness (World Competitiveness Report, 2006-2007)
5
certain condition is restrictive for business development or growth, industries that are extremely
sensitive to that condition should be relatively more affected than others, and be relatively less
developed in countries where this issue is more restrictive. Rajan and Zingales (1998)) show that
industries that inherently require a high share of external financing grow faster in financially
developed markets. Beck et al. (2004) find that industries with higher shares of small firms grow
disproportionately faster with greater financial development using the US industry size
distribution as the ‘natural’ benchmark. Klapper, Laeven and Rajan (2004) show that industries
in which, due to structural or technological reasons firm entry is more important, exhibit less
growth in countries with important restrictions to firm entry. Finally, Micco and Pagés (2006)
show that industries that are inherently more volatile create fewer jobs and are less developed in
countries with very restrictive hiring and firing regulations.
While improving on cross-country studies, the former studies suffer from three potential
shortcomings that can be addressed in our study. First, in most cases variation in business
environment conditions is captured with country level variables that reflect de jure regulations or
conditions, that is, the procedures and costs that would be incurred if firms fully complied with
what is on the books. However, there can be large gaps between what is on the books and what
is experienced on the ground. This is particularly true in lower income countries and those with
higher levels of corruption. (Hallward-Driemeier and Aterido, 2007; Kaufmann and Kraay,
2004). In that regard, is desirable to have measures of de facto regulation.
Second, it is important to explore variation in the business environment not only across
countries but also within country boundaries—across sub-national areas and especially, across
firm size and ownership.6 Having disaggregated variables allows for hypotheses to be tested
without having to assume that one country is the benchmark or “best” case against which to
compare other countries.
Third, with a few exceptions, studies tend to focus on one given factor or policy, such as
firing and hiring regulations, regulations on new businesses, or restricted access to finance. They
are, therefore, potentially liable to omitted variable bias, as other non-considered aspects of the
business environment can also affect firms’ decisions. While we look at the effects of individual
6 A few studies assess differences in business environment conditions within countries. Besley and Burgess (2004) and Ahmad and Pagés (2007) exploit differences in labor market regulations across Indian states to assess how different labor market regulations affect economic performance across Indian states. Almeida and Carneiro (2005) assess the effect of variation of enforcement in labor regulations within Brazil.
6
dimensions of the investment climate, our focus is on regressions that combine multiple
dimensions in a single regression. This not only addresses potential bias in the estimates, it
allows one to test directly which dimensions have the biggest impact on firm performance.
A number of recent studies make use of the World Business Environment Survey
(WBES)—a firm-level dataset with 4,000 firms across 54 countries7—to study the effect of the
business environment on firm growth. Using subjective firm-level data measures of the business
environment these studies show the importance of finance, corruption and property rights (Batra,
Kaufman and Stone, 2003; Ayyagari et al., 2006). Some other studies examine the relationship
between business environment and firm growth for individual or a small group of countries
(Dollar, Hallward-Driemeier and Megistae, 2005, for India, Pakistan, Bangladesh and China;
Fisman and Svensson, 2007, and Rienikka and Svensson, 2002, for Uganda; and Bigsten and
Soderbom, 2006, which reviews the literature for Africa).
One central area of focus for this paper is whether there are significant differences in the
impact across firm types, particularly by firm size. The literature has largely examined this issue
with regard to access to finance, generally finding smaller firms are more constrained (Galindo
and Micco, 2005; Clarke et al. (2001); Love and Mylenko (2003) and IDB (2004). Beck,
Demirgüç-Kunt and Maksimovic (2005) is of particular interest here, as these authors include
additional measures of corruption and property rights using a firm-level dataset with 4,000 firms
in 54 countries. Using firms’ perceptions on potential constraints, they also find patterns across
countries, with small firms benefiting most from greater financial and institutional development.
Our paper expands on this work in several dimensions. It looks at employment growth as well as
sales growth, and it nearly doubles the number of countries covered, with country samples
approximately five to 10 times larger. Whereas Beck, Demirgüç-Kunt and Maksimovic (2005)
use subjective firm responses as measures of the business environment at the firm level, we
include more objective measures (i.e., time spent with officials dealing with permits and licenses
rather than a ranking of how burdensome red tape is on a scale of 1-5). We also recognize that
measures of constraints could well be endogenous and thus control for this possibility throughout
the paper. We also use narrower bands on firm size categories, which leads to some interesting
7 The World Business Environment Survey is a precursor to the World Bank’s Enterprise Survey. The earlier round primarily collected perception data regarding constraints and some information on firm performance. In some regions firms only provided information on their employment range, i.e., small, medium, large, making it impossible to use that data to study differences between small firms below and above 10 employees.
7
extensions on their result. By including a “micro” category of firms with fewer than 10
employees, we find significant differences between them and small firms (11-50 workers). We
also find that smaller firms benefit most from improved access to finance, but that this is
particularly true for micro firms. Broadening the “small” definition actually loses the
significance of the differential impact of small and large firms. We also find a more nuanced set
of results on corruption. While bribe payments reduce growth of all firms, a more pervasive
culture of bribes actually raises the relative rates of growth of micro firms.
We also look at how results vary across country groupings, focusing on income levels
and find significant results, particularly for finance. We thus confirm and expand the set of
results, showing how the impact of investment climate conditions vary across firms, indicating
ways in which firms can benefit most from reforms.
3. The Data Our study is primarily based on the World Bank Enterprise Surveys (ES), a newly available
collection of firm-level datasets for 102 developing countries as well as five high-income
countries.8 Questionnaires are administered within a framework of common guidelines in the
design and implementation.9 The dataset is assembled using the core survey, which is a module
of identical questions included in all questionnaires, thereby enabling cross-country analyses.
The data include 69,305 firms from 107 countries in six different regions surveyed during
the period 2000-2006.10 Several countries have now conducted a second or third survey.11 The
median sample size is 350 firms, with several large countries having substantially larger samples
(Brazil, China, India, Turkey and Vietnam have samples over 1,500; see Table A1 in the annex.)
The sample of firms in each country is stratified by size, sector and location.12 Because of this
8 The terms Enterprise Surveys includes BEEPS, Investment Climate Surveys and RPED surveys. 9 From http://rru.worldbank.org/InvestmentClimate/Methodology.aspx10 The exact set of questions asked does have some variation across countries, particularly among the earlier surveys, so regressions with multiple investment climate variables are based on a smaller set of approximately 48,000 firms in 80 countries. 11 While efforts are shifting to building a panel dataset, most repeat surveys have been additional cross-sections. There are approximately 2,000 firms that enter twice in the dataset. 12 From http://www.enterprisesurveys.org/Methodology/default.aspx#weights: ES have been conducted following simple random sampling or random stratified sampling. In a simple random sample, all members of the population have the same probability of being selected and no weighting of the observations is necessary. In a stratified random sample, all population units are grouped within homogeneous groups and simple random samples are selected within each group
8
stratification, large enterprises are in general over-sampled in the ESs compared to their share in
the number of firms, but not in terms of their contribution to GDP. The unit of analysis is the
“Establishment” in the manufacture and service sectors.13 Most firms are registered with local
authorities, although they may be only in partial compliance with labor and tax authorities.
The ES data was developed to provide information on aspects of the investment climate
faced by firms as well as information on firms’ performance. It contains subjective and objective
information on the business climate faced by individual firms. Regarding subjective measures,
there is one question that asks firm managers the extent to which various aspects of the
investment climate are perceived as obstacles to firms’ operations and growth on a scale of 0 (no
constraint) to 4 (very severe). These perceptions are useful, as they implicitly include a measure
of impact. Firms are not asked to evaluate an issue in isolation, but rather in terms of how it
affects their ability to operate and grow their business. Thus, areas that may be associated with
long delays or high costs—but that that are of marginal interest to the firm or for which
alternatives are available—are not likely to score high on these constraints rankings. They also
give some insight into the likely areas where constraints are likely to be different by size of firm.
Access to finance, corruption, regulations and infrastructure are among the issues with the
biggest relative differences across size of firms, and particular attention is therefore focused on
these dimensions in their impact on firm growth.
However, there are potential drawbacks to using subjective data. There is a concern that
firms’ perceptions of the business environment reflect differences in firm types or firms’
performance. It is well known that successful entrepreneurs are by nature more adept at
responding to opportunities and overcoming barriers, and they may also see their environment as
less limiting than less successful entrepreneurs. We control for this by including firm
characteristics and measures of firm performance directly in the regression. We also control for
individual effects by looking at relative rankings. Respondents rank 17 issues on the same scale.
De-meaning the responses gives the relative importance of the issue to that firm. How well these
subjective rankings reflect actual conditions can also be tested for. Using 104 countries,
Hallward-Driemeier and Aterido (2007) find that the subjective rankings are highly correlated
13 In Europe and Central Asia, the unit is the “firm.” In all other regions it is the plant or establishment. As over 90 percent are single-plant firms, the distinction is not likely to affect the results.
9
with objective measures in 16 of the 17 variables.14 The subjective rankings are also
significantly correlated with external sources, including Doing Business indicators. Pierre and
Scarpetta (2004) use 38 countries and confirm that countries with more restrictive labor
regulations are associated with higher shares of firms reporting labor regulations as constraining.
The dataset also contains a set of objective measurements or time or monetary costs of
those same perceived aspects of the investment climate as they are being experienced by the
firm. The larger set of variables that measure finance, infrastructure, regulations and corruption
are in the Appendix.15 Our analysis uses subjective measures to gauge the relative importance of
each issue to a firm, and then uses the larger set of objective variables to measure the effect of
the business environment on employment growth. Endogeneity is likely to be more of a concern
if one were to use the perception data as independent variables. However, there is still some
concern that endogeneity is important in more objective measures too. The growth of the firm is
likely to affect whether the firm receives external finance and may well affect the extent to which
it needs to interact with officials or be subject to demands for “additional payments.” To control
for this, we use country-city-sector-size averages in place of the firm’s own values of the
investment climate variables. Averages are calculated based on actual size at period t and should
capture the environment in which a firm of a given size operates in period t while still excluding
the firm’s own values. Using averages also allows for some observations to be kept despite one
or more investment climate variables not being reported. As some country-city-sector-size cells
are small, a particular dimension was collapsed to ensure at least three firms other than the firm
in question were used in calculating the averages. In our estimates, we allow for clustering of the
error terms at the country-city-sector-size level.
The dataset includes information on many firm characteristics such as size, age, location,
export activity, ownership, and industry. This is an important feature of the data, which allows
expanding previous cross-country analyses attempting to assess the economic impact of
institutions. Institutions can differently affect different types of firms. Small firms, for instance,
face different constraints than large firms, and a capital-intensive manufacture firm may face
different restraints than a service-oriented firm. Likewise the degree of impact that a particular
business constraint has on a firm’s performance can be different for different types of firms. The
14 The one exception was finance; those with loans complained more about the cost of finance than those without loans. 15 See Table A2 for summary statistics of the list of investment climate variables: perceptions and costs
10
firm characteristics used in this study include: five size classes (micro 1-10 permanent
employees, small 11-50, medium 51-200, large 201-500, and very large firms -more than 500
employees); three age categories (young 1-5 years, mature 6-15, and older–more than 15); two
location types (capital or cities with 1 million population and cities with population less than 1
million); ownership (whether foreign or government represents 10 percent or more of
ownership); whether the firm is an exporter (10 percent or more of sales); and a two-digit
industry classification.
The sample contains a large proportion of small firms (63 percent, including 29 percent
micro and 34 percent small firms); only 14 percent are large and very large firms. The sample
also consists largely of young firms; 64 percent of the firms have been in operation only 15 years
or less (19 percent of the dataset five or fewer years and 45 percent between six and 15 years).16
According to the 10-percent thresholds noted above, 13 percent of the firms are foreign-owned,
7 percent are state-owned firms, and 20 percent of firms are exporters. By industry, 31 percent of
the sample includes capital-intensive manufacturing, 34 percent includes labor-intensive
manufacturing, and 27 percent consists of services.17
We focus on the employment growth of permanent workers as our outcome variable of
interest. We use permanent employment because this is most likely to reflect long-run
determinants of performance, because it more closely reflects the concerns of policymakers and
because there are differences in the consistency of reporting across some countries. Our measure
of employment growth is the change in the enterprise’s permanent employment during the period
t and three years before, divided by the firm’s simple average of permanent workers during the
same period.18 The measure is symmetric around zero and bounded by values -2, and +2. While
monotonically related to the conventional growth rate and a second order approximation of the
logarithmic first difference, this measure allows computing meaningful growth rates for firms
suffering sharp expansions or contractions, avoiding any arbitrary treatment of outliers. Thus,
even when by construction our sample does not have entry or exit of firms, some firms
experience sharp changes in employment due to its early/late stage of development. Young,
small firms may experience very large growth in their labor force; Bankrupt firms or firms on the 16 See Table A3 for a complete stratification of sample by firm characteristics 17 The remaining 8 percent represents activity. Classification adapted from PADI (Programa de Análisis de la Dinámica Industrial), ECLAC. See Katz and Stumpo (2001). 18 This measure has been extensively used to measure job creation and job destruction (see Davis and Haltiwanger, 1992, and Davis, Haltiwanger and Schuh, 1999)
11
verge of closure may suffer very large contractions prior to their final exit from the market. Due
to data availability, employment growth refers to different periods for different firms.
The regressions include individual country survey dummies. Thus the focus is on the
within-country variations rather than across countries. This decision reflects several factors.
First, there is substantial variation of investment climate indicators within countries and we want
to test if its impact is significant. Second, it controls for potential omitted variables at the
country level. Third, it could control for some possible measurement errors or differences in
implementation across countries. As Haltiwanger and Schweiger (2005) note, there are some
countries with particularly high net employment rates. However, there is a strong country-
specific component, such that country effects yield relative magnitudes of job creation and
employment growth. He also noted that the relationships of employment variations between size
and age classes appear right. Thus, small and younger firms have higher job creation and
destruction than older and larger firms within the country, when considering total employment.
Therefore, statistical methods that remove country level are appropriate to draw conclusions
within countries on the difference of the impact of Investment Climate on different types of
firms. To account for differences in demand conditions and productive structure, the regressions
also include a full set of industry-country dummies.
Table 1 reports the mean and standard deviation of the employment growth measure for
all relevant variables in the sample. There is positive employment growth across all firm sizes
and income levels. The average firm level employment growth, according to our measure, is
0.103; small and medium firms grew over the average, while micro and large firms grew below
average. Likewise, younger firms (0.193) grew faster than middle-age (0.10) and mature firms
(0.03).
4. Which Dimensions are Reported to be Most Constraining? Variations in Subjective Investment Climate Constraints by Firms
The ranking of potential constraints on the operations and growth of their business provide a
useful starting point in identifying areas of the investment climate that is worth investigating as
well as indicating areas where there are significant differences across types of firms. The
questions are asked in the same way so that it is possible to look at relative rankings (see Table 2
for a description of these and the rest of business environment variables used in this study).
12

Having the long list of issues allows for an individual fixed effect to be controlled for. This
removes concerns about different degrees of optimism or pessimism across individuals, as well
as any fixed effect stemming from their performance.
Table 3 reports the regressions of the relative ranking19 of key constraints on a large set of
individual firm characteristics at time t, lagged performance (t-1), sector dummies and country
dummies. The growth measure is lagged to have it be pre-determined, but the claims here are not
causal. We are simply interested in describing the patterns across firms.
It is striking that differences across current size are not consistent across subject areas.
Looking at the relative rankings of constraints, there are a number of areas that constrain the
micro firms more than their larger counterparts. These are: cost of and access to finance,
infrastructure (electricity) and corruption.20 By far the biggest difference is in access to finance
(Column 1). Whereas finance ranks among the top two issues for micro and small firms, it is
sixth for large firms. The average demeaned level of complaint is 0.32 (i.e., 0.32 units above the
average level of complaint), it is 0.05 units lower for small firms compared to micro, while it
falls more than 0.13 units for medium firms, and by 0.2 units for large and very large firms.21
Infrastructure is another area where small firms report the greatest relative constraints,
particularly for electricity (Column 5). The average relative complaint is -0.04, but it declines a
further 0.045 units for larger firms. Smaller firms are more likely to be in areas without access to
electricity or to be dependent on an unreliable public grid, given that they lack the scale
economies to make a generator cost effective.
A final area where micro and small firms are relatively more likely to report the issue as a
top constraint is corruption (Column 4). For very large firms, the rate falls by 0.075 units, from
an average of 0.28 to 0.205. This could reflect the fact that small firms face little recourse to
demands for bribes and thus they are easier targets for officials seeking additional funds. To the
extent that many are operating semi-informally they may face the need to pay bribes to avoid
higher penalties associated with non-compliance of tax or regulatory requirements. It is also
19 The relative value results from subtracting the mean value of all the obstacles from each individual answer. Consistency of regulations (in column 5) is part of a different set of questions and cannot be examined in relative terms. 20 Tax rates and administration, competition from informal firms and crime were other areas where smaller firms report relatively greater constraints. However, as we do not have as good objective measures corresponding to these issues, we concentrate on finance, corruption and reliable infrastructure. 21 Units here refer to a relative measure defined as y-x where y and x can take values between 1 to 4 and therefore y-x can take values between -3 and 3.
13

likely that bribes for particular services are a fixed sum, which will represent a higher share of
costs for small firms.
In turn, larger firms report being relatively more constrained by labor regulations
(Column 3). This could reflect higher exposure to enforcement—an issue examined in the next
section—or higher constraints on their activity. The differences are large, with the relative
complaint for large firms at about 0.20 units larger than for micro firms. The extent of the
relative constraint increases monotonically with size, consistent with enforcement increasing
with firm size.22 Yet, large firms are also relatively more likely to report regulations as being
applied consistently (Column 2). It would then appear than micro and small firms are less
constrained by (labor) regulations but are subjected to a higher degree of discretion in the
application of labor and other regulations. Higher discretion may be related to corruption, which
also appears as a top constraint for the smaller firms.
In most cases, the patterns with firm age mirror fairly closely those of size. Younger
firms are relatively more constrained by the cost and access to finance and by electricity
shortages.
5. Variations in Objective Investment Climate Conditions by Firms Differences in perceived constraints could be due to differences in the objective conditions
facing firms and/or due to differential impacts of the same condition on different firm’s
performance. Looking how objective measures vary across different types of firms there is a lot
of evidence that the former is true. This is also borne out by significant correlations between the
constraints and related objective measures. Within each of the categories for which we have
objective data, firms with the greatest delays and greatest costs are significantly more likely to
rank these issues as constraining (Hallward-Driemeier and Aterido, 2007). The next section then
looks at the extent to which the overall constraint affects performance as well as whether there
are non-linearities in these effects.
22 In unreported results, we also find that overall, micro firms report a lower level of constraints than larger firms. This finding is consistent with the view that many small firms remain very small or operate in the informal economy as a way to avoid higher regulatory burdens. It raises the challenge of how to increase the incentives of micro firms to grow and to comply with more of the regulatory requirements.
14
Table 4 reports how the objective measures of the investment climate vary across types
of firms. The table uses several variables within the same area of the business environment, i.e.,
multiple measures of access to finance, corruption, regulations, and infrastructure. The aim is to
show the consistency of results across the variables in the same general area. In later
regressions, a variable from each section will be regressed in combination with variables from
the other areas of the business environment, with substitutions made to indicate the robustness of
the results.
Table 4 demonstrates that there are significant differences across firms in most of the
variables in each of the four areas of the investment climate. Again, the focus is on differences
across firms of different size, measured by the level of employment at the time of the survey.
Micro firms have reported finance as particularly constraining and indeed, controlling for firm
characteristics and country dummies, large firms are 30 percent more likely to have overdraft
facilities and the share of investments financed by formal bank loans is 14 percent higher (or 50
percent more than small firms given retained earnings finance more than two-thirds of
investments). Access to formal financing of working capital is also significantly different, with
large firms’ levels triple that of small firms and quadruple that of micro firms. What is
interesting is that the share of sales sold on credit is significantly lower for micro firms, but there
are then no further differences across sizes of firms.
Corruption was another area where smaller firms complained more, and the objective
numbers show that small firms are slightly more likely to pay bribes than either micro firms or
large firms. However the real issue is that the size of bribes as a share of sales is almost one-
third higher for small and microfirms relative to medium and large firms. This can reflect fixed
payments being relatively larger for small firms, or that they have less recourse to avoid making
payments. The payments may also be correlated with the degree of compliance with regulations;
micro and small firms may not meet all of the requirements and have to pay officials to maintain
this position.
Larger firms reported being relatively more constrained by labor inspections and the
objective data shows that enforcement does increase with firm size, as shown by higher
frequency or length of visits by labor inspectors. This is also true of inspections overall, where
large firms spend 121 percent more time in such inspections relative to micro firms. There is also
evidence that large firms spend more time dealing with government authorities. On the flip side,
15
larger firms report less delays in getting through customs; either because with larger or more
regular shipments the clearance procedures are easier, or because larger firms are able to seek
better treatment (possibly including the payment of “grease” money).
For infrastructure, the frequency of outages hits small and medium firms hardest and very
large firms the least. In addition, the costs of these outages, as a percentage of sales, are
relatively larger for micro and small firms. They are less likely to have alternative sources of
electricity (given the costs of owning and operating a generator). It is also possible that larger
firms have a greater choice among possible locations and thus chose to operate in areas with
more reliable electricity, a hypothesis that is tested for below.
6. Impact of Investment Climate Conditions on Firm Employment Growth This section examines the impact of different measures of the investment climate on employment
growth, controlling for individual firm characteristics, a full set of country specific industry
dummies and survey fixed effects.23 As mentioned above, the possible endogeneity of the
reported business climate indicators is accounted for by (i) measuring business climate with
objective rather than subjective indicators, and (ii) averaging the reported measures by firm
location, industry and size cells, without using the firm’s own response. The specification is as
follows:
ijcttcjtcjijctijct
ijcijcijctijct
kiijcijckiijcijc
kiijctkiijctkiijct
ktijctijctijcttijct
ControlEGControlEG
noncapitalsmallgovernmentoldermature
iableICorterorteriableICforeignforeign
iableICeliableICmediumiableICsmall
iableICelmediumsmallEmpg
ελλλλλλββ
ββββ
ββββ
βββ
ββββ
+++++
+++++
++++
+++
++++=
−−
−−−
−−−−−
***)2()1(
_
var*expexpvar*
var*argvar*var*
vararg
1615
1413312311
,~109,~87
,~36,~35,~34
333231303,
where Empgijct,t-3 refers to the growth of employment of firm i in industry j in country c between
period t and t-3, small refers to firms between 11 and 50 employees, medium refers the firms
between 51 and 200 and large to firms above 200 employees. To avoid a possible feedback from
employment growth to size, size categories are measured at the initial period of observation
(generally three years before, but in a few cases, identified by Control EG(1) and Control EG(2), 23 Given that in many instances we have more than one survey per country, the specification includes a whole set of individual country-year survey dummies.
16
two or one period before, respectively). The omitted category is micro enterprises employing
between 1 and 10 employees. Age of the firm is specified in three categories: young, from 1 to 5
years old, mature, between 5 and 15 years old and older, above 15 years old. Similarly, Foreign
takes the value of 1 in firms with more than 10 percent participation of foreign capital and
exporter identifies firms that export more than 10 percent of their sales at the time of the survey.
Government identifies firms with participation of more than 10 percent from the government,
and small_noncapital identifies firms that are in small cities (less than one million habitants) and
are not in a capital city.
Additionally, different investment climate variables are interacted with selected relevant
firms’ characteristics to assess differences in the effect of business climate indicators across
different types of firms. ICvariable~i,k refers to an investment climate constraint, such as poor
infrastructure, or low enforcement of property rights, in city-sector-size-country cell k, with the
average excluding the firm’s own response. It should be noted that the IC averages are calculated
based on current sizes, but when included as explanatory variables, they are matched based on
the initial size of a firm. For example, if a firm was a micro firm three years ago, and three years
later, at the time of the survey, the firm has become small, the objective IC of this firm enters in
the computation of the average IC for small firms in cell k. Yet in the regression employment
growth of firm i is associated with the average IC corresponding to firms’ initial size category. In
the former example, the above-mentioned firm would be matched to the average IC for micro
firms. This assumes that within cell k, the conditions that matter for employment growth are
those prevalent in the past, and that objective conditions remain constant over time. These
hypotheses are convenient because they prevent reverse causality from employment growth to
the IC conditions, as firms may choose to grow/or not grow to face a determined set of IC.
Reassuringly, correlates of employment growth behave in the expected manner. Firm
characteristics, sectors and industry-country dummies are included in the tables, but not reported
due to space constraints. Employment growth declines monotonically with firm size and age.
Firms that export and firms with foreign participation grow faster than firms that do not export or
are domestically owned. Sectors such as leather, garments, wood & furniture as well as trade
(retail and wholesale) and hotels and restaurants grow at a slower rate than textiles (the omitted
sector category) while sectors such as agro-industry, beverages, chemicals and pharmacy, the
manufacturing of paper, construction, and quarrying and mining grow faster.
17
Table 5 shows the effects of the investment climate variables on employment growth. It
includes these variables one at a time to illustrate the robustness of the results across different
variables in the same subject area. However, while survey dummies control for a large host of
unobservable number of country and year characteristics, concerns that omitted variable bias
drives the results still remain. After all, environments characterized by ineffective business
regulations, or high incidence of corruption are also often characterized by poor infrastructure or
low access to finance. To overcome some of these concerns, we control for different indicators
of business climate conditions and their interactions with firm size simultaneously. Results are
reported in Table 6. Tables 8 and 9 show the robustness of results using alternative variables.
Results in Table 5 and 6 indicate that the effects of investment climate shortcomings
differ substantially across firm size. They also suggest strong composition effects: A weak
business environment shifts downward the size distribution of firms. However, the channels by
which this happens change across business environment dimensions.
Access to Finance
The impact of better access or lower cost of finances on firms’ growth has been studied by a
number of authors.24 Beck, Demirgüç-Kunt and Maksimovic (2005) argue that financial access
should favor small firms. In their work, they find that firms’ self reported constraints on access
and cost to finance are associated with lower growth of small firms (relative to large firms). The
results presented here use the actual access firms have to different types of finance, from trade
credit to formal financing of working capital and investments, averaging across location-sector-
size cells and excluding the own firm’s response to minimize possible endogeneity problems.
Table 4 showed that there are differences in the amounts of finance available, which could
already explain why smaller firms are more likely to complain about finance (Table 3). Here, we
test whether, even for the same amount of financing, the impact would be different across
different types of firms. The results show that it is. It is indeed the smallest (micro) firms that
gain the most. Larger firms also gain, but the benefit is about half that enjoyed by micro firms.
Interestingly, this effect seems to hold both for simpler forms of finance—such as sales on credit
24 See for example, Rajan and Zingales (1998), Demirgüç-Kunt and Maksimov (1998) and Beck Demirgüç-Kunt and Maksimovic (2005).
18
or overdraft facilities—as well as the more sophisticated bank instruments, such as external
financing for investments.
Our results also indicate a difference in impact between exporters and non-exporters.25
Improved access to capital markets appears to favor the growth of non exporters companies
relative to the growth of companies that cater to the international market. This suggests that
either exporting firms are better connected to international capital markets and therefore less
dependent on the mobilization of domestic funds, or, instead, that exporting firms in developing
countries are in sectors that are intrinsically less dependent on external capital.
Regulatory Environment
Measures of regulatory environment from Tables 5, 6 and 9 show two trends. First, they
reinforce the importance of the consistency of enforcement. Consistent enforcement is found to
help the growth of all firms, with particular benefits to small firms (Table 5, row 11). This is
particularly encouraging given small firms are the ones that are entering into greater regulatory
requirements. They also underscore that not all interactions with officials are detrimental. They
imply that some interactions with officials indicate firms are likely accessing needed services, or
that there is a public good component in increased enforcement of labor regulations or
regulations in general. Second, there are costs associated with pure red tape and bureaucratic
delays. This is seen most clearly in the costs of delays clearing customs (Table 5, rows 9-10).
Such delays do hurt all firms but the micro ones. Since very few micro firms engage in
international trade, they may benefit from the difficulties of competitor firms in getting goods
through customs.
What is interesting is that both of these effects can be seen in a broad measure of
regulatory environment, namely the share of time managers spend with officials dealing with
licensing, permits, regulations, etc. The overall effect is positive, consistent with some
enforcement being helpful; rather than being a pure measure of regulatory burdens and red tape,
time spent with authorities may also reflect being engaged with the state and accessing some
public goods. What is striking is that this is strongest for micro firms. Nonetheless, there are
limits. Including a quadratic term (Table 6, Column 5) shows that the benefits are offset as the
overall time managers spend with officials climbs. For small firms, the marginal contribution
25 Results are not reported due to space constraints. Results are available upon request.
19
starts to fall at the 15 percent mark. More than 20 percent of firms are in the range where the
marginal contribution is negative and 10 percent where the overall effect is negative.
Corruption
The composition effect is also very strong in environments with a high incidence of corruption.
Corruption hampers employment growth in small, medium and large firms. This is true
regardless of whether corruption is measured as incidence of bribes, bribes as percentage of
sales, incidence of “gifts” to government officials, or gifts as percentage of government
contracts. Moreover, for at least one of the measures—incidence of bribes—the effect of
corruption is to increase the growth of micro firms. (Table 5 rows 12-15). The latter effects
remain when other dimensions of the business environment are included in the specification
(Table 6, row 1).
The effect of corruption is large. It is estimated that an increase in the incidence of bribes
of 10 percentage points reduces the employment rate of large firms by approximately 1.4 points,
and increases the growth rate of micro firms by 1.4 percent (see Table 5, row 12).
Infrastructure
Losses associated with the power outages hurt all firms, with larger firms hurt relatively more
(Table 5, row 17). With more sophisticated production processes, the same interruption may
serve to raise the defect rates in a larger batch of output, or customers may be more sensitive to
delays in production. What is interesting, however, is that the response to the frequency of
outages is slightly different and indicates ways that firms respond to situations of unreliable
power. When included as the only investment climate constraint, the number of days without
power (or without water) serve to favor the growth of micro firms. This may be due to the fact
that many of the smallest firms chose production technologies that are less dependent on
electricity and are more labor intensive, so that outages actually favor their growth. However,
when infrastructure measures are included with the other investment climate measures (Tables 6,
8 and 9), the differences in effects across sizes of firms loose significance for all categories
except medium firms. Instead, the detrimental impact of outages is felt more keenly by exporters
and domestically owned firms regardless of size.
20
Testing for Significance of Overall Impact
These results show both that there are differences in the objective conditions facing firms and
that even the same objective conditions can translate into different impacts on firm employment
growth. To assess the overall impact combining the two types of differences, linear combination
tests are conducted. For each subject area, the first three tests assess whether the investment
climate variable has a significant impact on small, medium and large firms respectively. The
next three tests assess whether the combined (overall) impact of differences in objective
conditions and differences in the impact of equal conditions, differs across firm size. That is,
they test whether the following linear combinations hold 0=−wwvv sizesizesizesize CICI ββ , where
vsizeβ is the coefficient of the size-investment climate interactions for a given size v, presented in
Table 6, column 1, and vsizeCI is the sample average value of a given investment climate variable
for size v. The first test assesses whether the overall impact on large firms is significantly
different from that of micro firms, followed by whether it is between small and micro and finally,
between large and small.
The results, presented in the last column of table 6, indicate that the coefficients for
finance and regulations, presented in column (1) are significant for all size classes, while the
impact of bribes is significant for medium-sized and large firms and the effect of infrastructure is
only significant on medium-sized firms.
Regarding overall effects, for finance, while the effect of improved access to finance is
significant across all firms, and larger for micro enterprises, the overall effect is influenced by
the fact that access to finance increases with firm size. Overall, the combination of both effects
implies that small firms end up benefiting more, because they have higher access to finance than
micro firms.
For management time, the difference in overall impact between large and micro is
statistically significant. Micro firms have lower levels of interactions and have higher marginal
benefits from these interactions, while larger firms are facing the diminishing returns to even
more interactions with officials. However, the difference in impact between large and small is
not significant. This raises the importance of differentiating between size classes at the lower
end of the distribution, something that is examined in greater detail below.
21
For bribes, there is an important distinction between the impact of the pervasiveness of
corruption and the actual costs of corruption (Table 9, comparing columns 1, 2 and 3). The
impact of the pervasiveness of corruption hits larger firms relatively more, with smaller overall
effects on medium and small firms (Table 6, column 6). However, taking into account the actual
cost of bribes—and the fact that proportionally they are greater for small firms—the impact is
actually most detrimental on small firms (Table 9, test column 3). With micro firms actually less
hurt than small firms by both the incidence and costs of bribes, this is another area where
allowing for differentiated effects at the lower end of the size distribution is important.
Addressing Endogeneity
Table 6 also includes a number of specifications to address endogeneity concerns. The second
column includes estimates for the four measures of the investment climate, using the firms’ own
responses as independent variables. These results will likely be affected by feedback from a
firm’s growth experience. In order to properly compare coefficients, results with city-sector-size
averages (minus the firm’s own response), keeping the same sample size as in column (2), are
included in column (3). In addition to addressing endogeneity concerns, the benefit of using cell
averages instead of individual firm values is that it allows the sample to be increased to include
firms that failed to provide an answer to one or more of the investment climate questions. The
results with the expanded sample (column 1) are very similar to the results in column (3),
showing that the results are robust to changes in the sample.
Comparing the coefficients from the second and third columns gives some indication of
the extent to which there is a feedback from employment growth to individual responses to
investment climate measures. However, it should also be noted that the specifications are
measuring slightly different things and should thus be interpreted slightly differently. The
individual responses are significantly correlated with the cell averages, so the averages do serve
as a proxy. However, including the averages directly in the regression is really a test of the
importance of the broader investment climate experienced by similar types of firms to a firm’s
growth. The effect of the environment may indeed have larger effects.
In considering the possible feedback from employment growth to measures of the
investment climate, a case could be made for feedback to occur in either direction, making it an
empirical question as to which force is likely to dominate. For finance, one would expect that
22
firms that are growing would be better able to qualify for financing, making it more likely that
they would have external loans from banks. On the other hand, firms that are growing are also
likely to have higher revenues and retained earnings, making the need to secure external
financing less acute. Measures of lagged expansion included in the regressions presented in
Table 4 (objective conditions experienced by firms), indicate that contracting firms are actually
more likely to have external financing than expanding firms, and both are more likely than stable
firms to have external financing. Cell average yields substantially higher benefits of finance than
what would be estimated with individual firm level values. This suggests a negative feedback
from employment growth to external finance, which if not accounted for reduces the estimated
effect of access to finance on firm growth. It may also reflect a positive effect of improved
access to finance in other firms.
For corruption and interactions with government officials there are two potential
channels. On the one hand, growing firms may be targets for more demands for additional
payments and may need to get more permissions to expand their operations. On the other hand,
these firms may have greater recourse to avoiding demands for payments, and many of the more
time-consuming interactions may have to do with downsizing, such as restrictions on firing
workers or filing for protection from creditors. Again, looking at lagged growth, it is the
contracting firms that report significantly more demands for bribes, more frequent inspections
and longer times dealing with officials. In both cases, the coefficient for micro firms is positive
but larger when using IC averages. This suggests a negative feedback from employment growth
to corruption and regulations.
The feedback from employment growth to infrastructure is less clear. It is possible that
growing firms would have greater access to private solutions to failures in the public grid so that
controlling for endogeneity would raise the impact yet results do not suggest such effect as the
coefficient on power failures declines when using IC-variables. Growth externalities across firms
that fail to secure power may be driving this result.
There is another dimension along which endogeneity may matter, namely whether there
is a selection bias such that better performing firms select into better locations. To address this,
the regression is repeated, excluding those firms that are most likely to be mobile or choosing
among a number of locations in setting up their business. Column 4 in Table 6 thus excludes
foreign-owned firms and large firms, only including smaller domestic firms. Results hold,
23
except for infrastructure, where the effect of medium-sized firms ceases to be statistically
significant.
Alternative Definitions of Firm Size
Table 7 examines how sensitive our results are to the size category definitions and the
importance of the inclusion of firms with fewer than 10 employees. The results indicate that
there is a sharp divide between the effects of investment climate constrains on micro firms on
one side and small, medium and large firms on another. This insight can be lost if “small” firms
are either defined so broadly as to encompass micro firms, or simply exclude them.
To explore the differences within the smaller sizes of firm, Table 7 shows the results of
(1) excluding firms with fewer than five employees (column 1), (2) combining the remaining
micro and small into a single category (column 2), and (3) excluding all micro altogether
(column 3). Excluding firms with fewer than five employees from the sample hardly alters the
results, indicating that firms in the 1-4 employee range behave similar to firms in the 5-10 (see
Table 7, column 1, and Table 6, column 1).
Excluding firms with fewerthan 5 employees and combining the remaining micro and
small firms into a single category (column 2), mutes a number of messages. It is still the case
that it is the smallest category of firms that benefit most from additional access to finance, but
now the overall effect is smaller, as are the differences across size groups. The effects of
regulations are also different; the direct effect remains, but there is now no significant
differences across size categories in terms of coefficients or overall impact; the expanded
definition of “small” masks the differential impact between those with less or more than 10
employees. The differential impact of bribes is also more muted. Omitting all micro firms
altogether (column 3) provides very similar results; combining firms with 5-10 employees has an
effect similar to that of excluding them altogether, losing the richness of the differences of the
impact on micro and small firms.
7. Robustness The paper examines two issues in testing for the robustness of the results. First it looks at the
effects of using other investment climate variables to measure access to finance in the multiple
constraints specifications. Second, it looks to see how sensitive the results are to the exclusion of
a particular income group or regions.
24
Different Investment Climate Variables
Table 8 and 9 extend the results by substituting other variables within the four basic investment
climate areas. The results remain strong. Given the large number of possible combinations, we
focused on issues of finance (Table 8) and on issues of regulations and corruption (Table 9);
differences in the regulation variables have been discussed above. Comparing columns (1), (2)
and (3) in Table 8 demonstrates that each measure of finance is associated with benefits that
decline with size. Across measures, the benefits appear largest for access to external working
capital. Firms may be more likely to take on additional workers if they are able to pay wages on
a regular basis even in the face of uncertain cash flows. In terms of overall impact, all three
indicate significant differences in comparing micro and small firms, but not between micro and
large or small and large firms.
Different Samples
One important concern in cross-country analysis is that some outlier countries or regions drive
the results. This issue is addressed here by examining the robustness of the results to the
exclusion of one group of countries at the time (see table 10). Results are found to be very
robust. Excluding Eastern Europe and Central Asia (ECA) reduces somewhat the impact of
finance. It remains positive, but smaller and without the same variation across sizes of firms
when that region is excluded. Thus, that larger firms benefit somewhat less from greater access
to finance seems predominantly an effect in that region. The positive impact of bribes in
promoting micro firms is somewhat sensitive to the exclusion of regions, although the level of
significance is generally below 15 percent. Overall, the tables confirm that around the world,
better access to finance and better business regulations is associated with higher firm growth for
all firms, while lower corruption and, to a lesser extent, better access to infrastructure are
associated with higher employment growth in medium-sized and large firms.
8. Conclusion This paper has provided new evidence of the role of the investment climate on employment
growth. The results indicate significant differences across size categories of firms—both in terms
of differences in objective conditions faced by firms and in terms of non-linearities in the impact
25
of these conditions. Low access to finance, corruption, poorly developed business regulations
and infrastructure bottlenecks shift downward the size distribution of employment. Low access
to finance and ineffective business regulations reduce the growth of all firms, especially micro
and small firms. Corruption and poor infrastructure create growth bottlenecks for medium and
large firms. The results also reinforce the importance of differentiating the impact across size
classes of firms that allow for the micro firms (less than 10 employees) to be different from
“small” firms.
This paper confirms previous results on the importance of access to finance for micro and
small firms. It contributes to the existing knowledge in finance in various fronts. It shows that
the impact on employment growth of an extra unit of external finance is highest for these firms.
It also compares the effects of different forms of financing on employment growth and finds that
access to working capital has the highest effects of all. Firms may be more likely to take on
additional workers if they are able to pay wages on a regular basis even in the face of uncertain
cash flows.
What are the aggregate implications of these findings for the size, efficiency and
dynamism of the business sector in developing countries? Regarding size, our estimates suggest
that a weak investment climate reduces overall employment in the business sector. By way of
example, in Argentina and Mexico increasing the share of external financing for investments by
10 percentage points would increase overall employment by 5 percentage points. The same
increase in finance for working capital would raise employment by 8 percentage points. In
Argentina, reducing the incidence of corruption by 10 percentage points would increase overall
employment in the business sector by 0.5 percentage points.26
Concerning the efficiency and dynamism of the business sector, we can only make some
tentative points. As pointed out by Tybout (2000), it is not necessarily the case that small firms
are less efficient than large firms as long as they concentrate in the production of goods and
services with limited returns to scale. Yet, even if that is the case, our findings may have a
bearing on the dynamism and growth of the business sector. When the business climate is weak,
firms may be confined to industries with limited innovation and growth opportunities. In
addition, a larger share of firms may remain informal or semi-informal, reducing the capacity of
26 These computations make use of data on the size distribution of employment obtained from the database used by Barstelman, Haltiwanger and Scarpetta (2004 and 2005)
26

the state of collecting taxes and paying for fundamental inputs for development such as
education.
27
References Ahmad, A., and C. Pagés. 2007. “Are All Labor Regulations Equal? Assessing the Effects of
Job Security, Labor Dispute and Contract Labor Laws in India.” World Bank Policy
Research Working Paper 4259. Washington, DC, United States: World Bank.
Almeida, R. and P. Carneiro. 2005. “Enforcement of Regulation, Informal Labor and Firm
Performance.” Discussion Paper 1759. Bonn, Germany: Institute for the study of Labor
(IZA),
Autor, D.H., W.R. Kerr and A.D. Kugler. 2007. “Do Employment Protections Reduce
Productivity? Evidence from U.S. States.” NBER Working Paper 12860. Cambridge,
United States: National Bureau of Economic Research.
Bartelsman, E., J. Haltiwanger and S. Scarpetta. 2004. “Microeconomic Evidence of Creative
Destruction in Industrial and Developing Countries.” Discussion Paper 1374. Bonn,
Germany: Institute for the Study of Labor (IZA).
Bartelsman, E., J. Haltiwanger and S. Scarpetta. 2005. “Measuring and Analyzing Cross-country
Differences in Firm Dynamics.” Cambridge, United States: National Bureau of Economic
Research. http://www.nber.org/papers/c0480.
Batra, G., D. Kaufmann and A.H.W. Stone. 2003. Investment Climate Around the World: Voices
of the Firms from the World Business Environment Survey. Washington, DC, United
States: World Bank.
Beck, T. et al. 2004. “Finance, Firm Size and Growth.” NBER Working Paper10983.
Cambridge, United States: National Bureau of Economic Research.
Beck, T., A. Demirgüç-Kunt and V. Maksimovic. 2005. “Financial and Legal Constraints to
Growth: Does Firm Size Matter?” Journal of Finance 60(1): 131-177.
Besley, T., and R. Burgess. 2004. “Can Labor Regulation Hinder Economic Performance?
Evidence from India.” Quarterly Journal of Economics 119(1): 91-134.
Bigsten, A., and M. Söderbom. 2006. “What Have We Learned From a Decade of Manufacturing
Enterprise Surveys in Africa?” World Bank Research Observer 21(2): 241-265.
Botero, J. et al. 2003. “The Regulation of Labor.” NBER Working Paper 9756. Cambridge,
United States: National Bureau of Economic Research.
Davis, S.J., and J. Haltiwanger. 1992. “Gross Job Creation, Gross Job Destruction, and
Employment Reallocation.” Quarterly Journal of Economics 107(3): 819-863.
28
Davis, S.J., J.C. Haltiwanger and S. Schuh. 1999. “On the Driving Forces Behind Cyclical
Movements in Employment and Job Reallocation.” American Economic Review
89(5):1234-1258.
Demirgüç-Kunt, A. and V. Maksimovic. 1998. “Law, Finance and Firm Growth.” Journal of
Finance 53: 2107-2137
Djankov, S. et al. 2002. “The Regulation of Entry.” Quarterly Journal of Economics 117(1): 1-
37.
Dollar, D., M. Hallward-Driemeier and T. Mengistae. 2005. “Investment Climate and Firm
Performance in Developing Countries.” Economic Development and Cultural Change
54(1): 1-31.
Galindo, A., and A. Micco. 2005. “Bank Credit to Small and Medium-Sized Enterprises: The
Role of Creditor Protection.” Research Department Working Paper WP-527. Washington,
DC, United States: Inter-American Development Bank.
Fisman, R., and J. Svensson. 2007. “Are Corruption and Taxation Really Harmful to Growth?
Firm Level Evidence.” Journal of Development Economics 83(1): 63-75.
Hallward-Driemeier, M., and R. Aterido. 2007. “Comparing Apples with Apples: How to Make
(More) Sense of Subjective Rankings of Constraints to Business.” Paper presented at the
2006 Oxford Business and Economics Conference, Oxford University.
Haltiwanger, E., and H. Schweiger. 2005. “Allocative Efficiency and the Business Climate.”
College Park, Maryland, United States: University of Maryland. Mimeographed
document.
Haltiwanger, E., S. Scarpetta and H. Schweiger. 2006. “Assessing Job Flows across Countries:
The Role of Industry, Firm Size, and Regulations.” World Bank Policy Research
Working Paper 4070. Washington, DC, United States: World Bank.
Heckman, J., and C. Pagés. 2004. “Introductory Chapter.” In: J. Heckman and C. Pagés, editors.
Law and Employment: Lessons from the Latin America and the Caribbean. Cambridge
and Chicago, United States: National Bureau of Economic Research and University of
Chicago Press.
Katz, J., and G. Stumpo. 2001. “Regímenes Sectoriales, Productividad y Competitividad
Internacional.” Revista de la CEPAL 75: 137-159.
Kaufmann, D., A. Kraay and M. Mastruzzi. 2005. “Governance Matters IV: Governance Indicators
29
for 1996-2004.” World Bank Policy Research Working Paper 3630. Washington, DC,
United States: World Bank.
Klapper, L., L. Laeven and R.G. Rajan. 2004. “Business Environment and Firm Entry: Evidence
from International Data.” NBER Working Paper 10380. Cambridge, United States:
National Bureau of Economic Research.
Loayza, N., A. Oviedo and L. Servén. 2006. “The Impact of Regulation on Growth and
Informality: Cross-Country Evidence.” In: B. Guha-Khasnobis, R. Kanbur and E.
Ostrom. Linking the Formal and Informal Economy: Concepts and Policies. Oxford,
United Kingdom: Oxford University Press. Development Economics Research. EDGI-
WIDER.
Love, I., and N. Mylenko. 2003. “Credit Reporting and Financing Constraints.” Policy Research
Working Paper 3142. Washington, DC, United States: World Bank.
Micco, A., and C. Pagés. 2006. “The Economic Effects of Employment Protection: Evidence
from International Industry-Level Data.” Discussion Paper 2433. Bonn, Germany:
Institute for the Study of Labor (IGA).
Petrin, A., and J. Sivadasan. 2006. “Job Security Does affect Economic Efficiency: Theory, A
New Statistic, and Evidence from Chile.” NBER Working Paper 12757. Cambridge,
United States: National Bureau of Economic Research .
Pierre, G., and S. Scarpetta. 2004. “Employment Regulations through the Eyes of Employers: Do
They Matter and How Do Firms Respond to Them?” Discussion Paper 1424. Bonn,
Germany: Institute for the Study of Labor (IZA).
Rajan, G.R., and L. Zingales. 1998. “Financial Dependence and Growth.” American Economic
Review 88(3): 559-586.
Rienikka, R., and J. Svensson. 2002. “Coping with Poor Public Capital.” Journal of Development
Economics 69(1):, 51-69.
Tybout, J.R. 2000. “Manufacturing Firms in Developing Countries: How Well Do They Do, and
Why?” Journal of Economic Literature 38(1): 11-44.
World Bank. 2004a. Doing Business Database. www.doingbusiness.org. Washington, DC,
United States: World Bank.
----. 2004b. Investment Climate Surveys. http://iresearch.worldbank.org/ics/jsp/index.jsp.
Washington, DC, United States: World Bank.
30
----. 2004c. Doing Business in 2004: Understanding Regulation. New York, United States:
Oxford University Press.
----. 2004d. A Better Investment Climate for Everyone. World Development Report 2005.
Washington, DC, United States: World Bank.
----. 2007. The World Bank Enterprise Survey. www.enterprisesurveys.org. Washington, DC,
United States: World Bank.
31
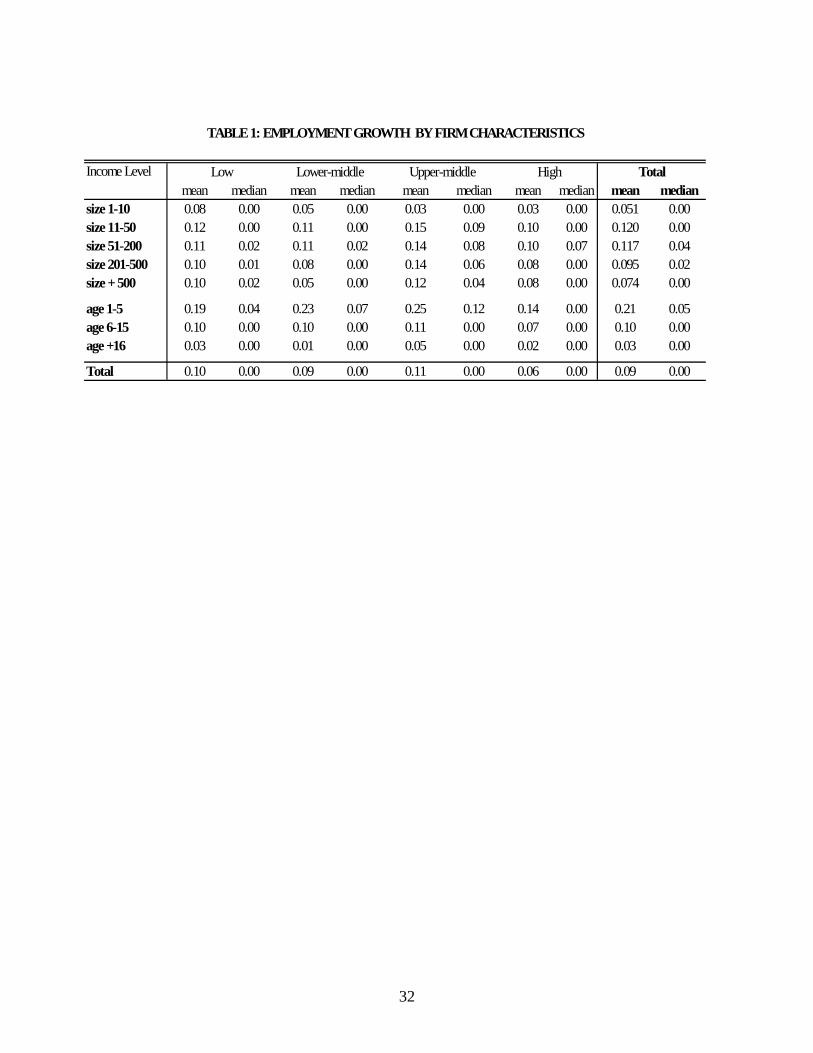
Income Level Low Lower-middle Upper-middle High Totalmean median mean median mean median mean median mean median
size 1-10 0.08 0.00 0.05 0.00 0.03 0.00 0.03 0.00 0.051 0.00size 11-50 0.12 0.00 0.11 0.00 0.15 0.09 0.10 0.00 0.120 0.00size 51-200 0.11 0.02 0.11 0.02 0.14 0.08 0.10 0.07 0.117 0.04size 201-500 0.10 0.01 0.08 0.00 0.14 0.06 0.08 0.00 0.095 0.02size + 500 0.10 0.02 0.05 0.00 0.12 0.04 0.08 0.00 0.074 0.00
age 1-5 0.19 0.04 0.23 0.07 0.25 0.12 0.14 0.00 0.21 0.05age 6-15 0.10 0.00 0.10 0.00 0.11 0.00 0.07 0.00 0.10 0.00age +16 0.03 0.00 0.01 0.00 0.05 0.00 0.02 0.00 0.03 0.00
Total 0.10 0.00 0.09 0.00 0.11 0.00 0.06 0.00 0.09 0.00
TABLE 1: EMPLOYMENT GROWTH BY FIRM CHARACTERISTICS
32
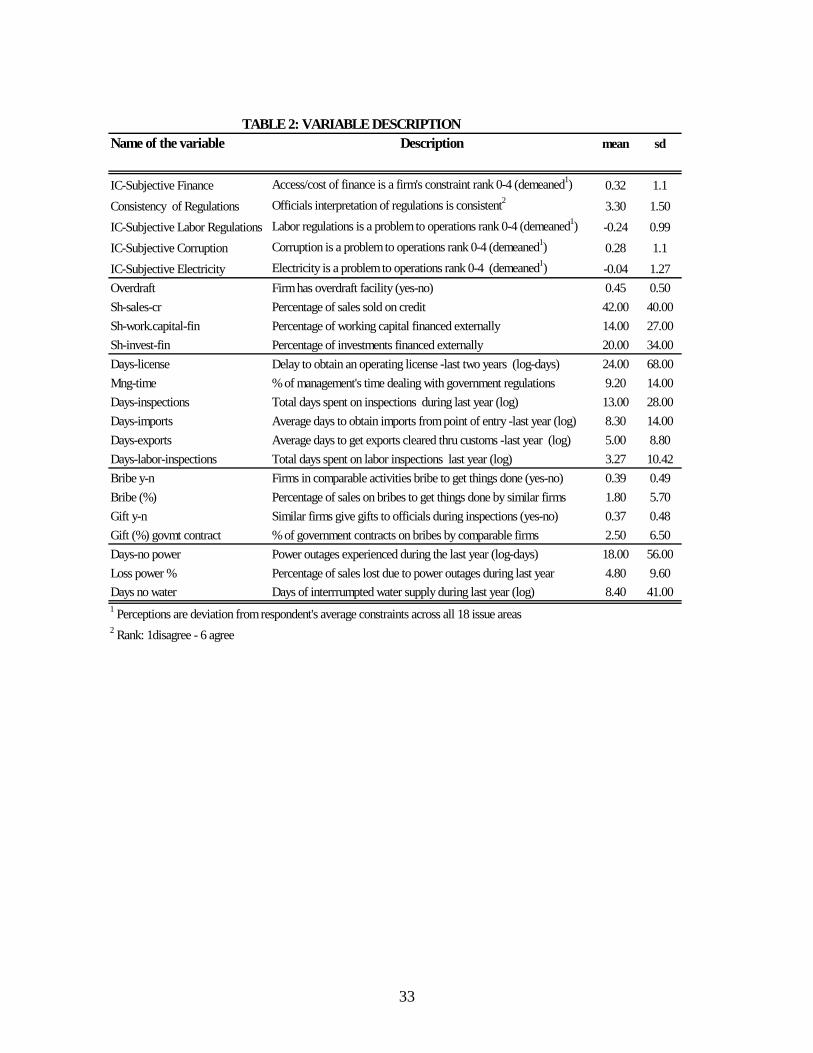
Name of the variable Description mean sd
IC-Subjective Finance Access/cost of finance is a firm's constraint rank 0-4 (demeaned1) 0.32 1.1Consistency of Regulations Officials interpretation of regulations is consistent2 3.30 1.50IC-Subjective Labor Regulations Labor regulations is a problem to operations rank 0-4 (demeaned1) -0.24 0.99IC-Subjective Corruption Corruption is a problem to operations rank 0-4 (demeaned1) 0.28 1.1IC-Subjective Electricity Electricity is a problem to operations rank 0-4 (demeaned1) -0.04 1.27Overdraft Firm has overdraft facility (yes-no) 0.45 0.50Sh-sales-cr Percentage of sales sold on credit 42.00 40.00Sh-work.capital-fin Percentage of working capital financed externally 14.00 27.00Sh-invest-fin Percentage of investments financed externally 20.00 34.00Days-license Delay to obtain an operating license -last two years (log-days) 24.00 68.00Mng-time % of management's time dealing with government regulations 9.20 14.00Days-inspections Total days spent on inspections during last year (log) 13.00 28.00Days-imports Average days to obtain imports from point of entry -last year (log) 8.30 14.00Days-exports Average days to get exports cleared thru customs -last year (log) 5.00 8.80Days-labor-inspections Total days spent on labor inspections last year (log) 3.27 10.42Bribe y-n Firms in comparable activities bribe to get things done (yes-no) 0.39 0.49Bribe (%) Percentage of sales on bribes to get things done by similar firms 1.80 5.70Gift y-n Similar firms give gifts to officials during inspections (yes-no) 0.37 0.48Gift (%) govmt contract % of government contracts on bribes by comparable firms 2.50 6.50Days-no power Power outages experienced during the last year (log-days) 18.00 56.00Loss power % Percentage of sales lost due to power outages during last year 4.80 9.60Days no water Days of interrrumpted water supply during last year (log) 8.40 41.001 Perceptions are deviation from respondent's average constraints across all 18 issue areas2 Rank: 1disagree - 6 agree
TABLE 2: VARIABLE DESCRIPTION
33
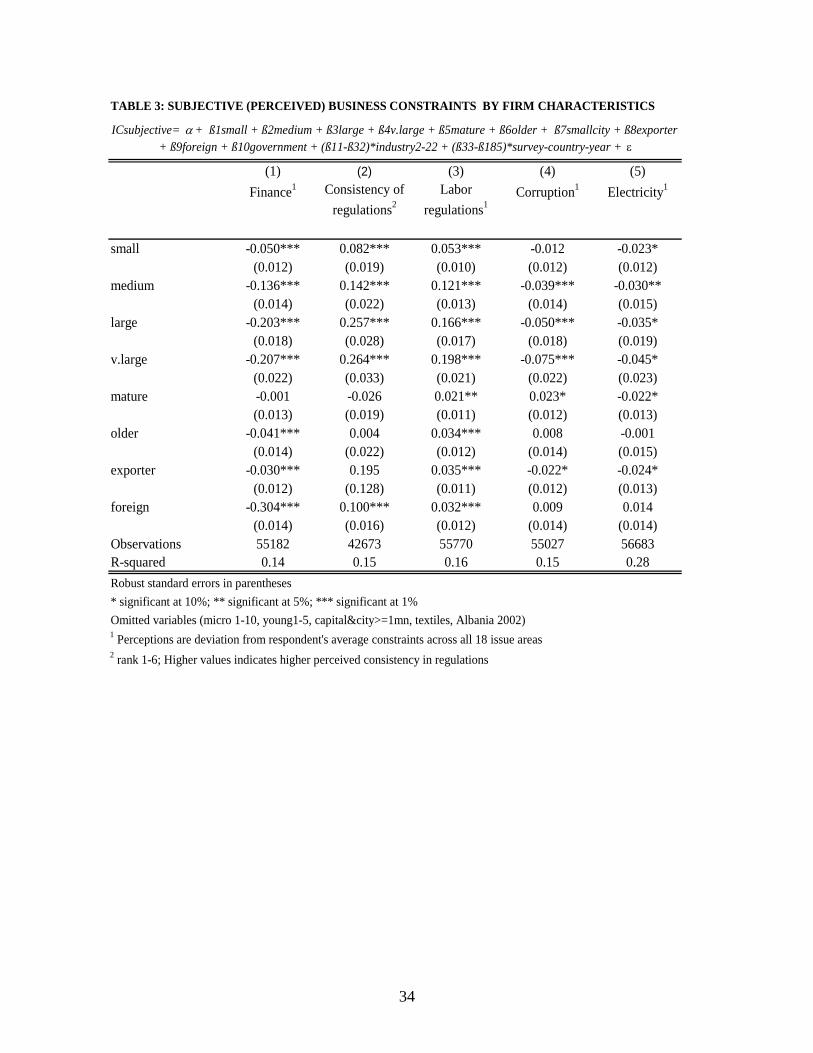
TABLE 3: SUBJECTIVE (PERCEIVED) BUSINESS CONSTRAINTS BY FIRM CHARACTERISTICS
ICsubjective= α+ ß1small + ß2medium + ß3large + ß4v.large + ß5mature + ß6older + ß7smallcity + ß8exporter + ß9foreign + ß10government + (ß11-ß32)*industry2-22 + (ß33-ß185)*survey-country-year + ε
(1) (2) (3) (4) (5)Finance1 Consistency of
regulations2Labor
regulations1Corruption1 Electricity1
small -0.050*** 0.082*** 0.053*** -0.012 -0.023*(0.012) (0.019) (0.010) (0.012) (0.012)
medium -0.136*** 0.142*** 0.121*** -0.039*** -0.030**(0.014) (0.022) (0.013) (0.014) (0.015)
large -0.203*** 0.257*** 0.166*** -0.050*** -0.035*(0.018) (0.028) (0.017) (0.018) (0.019)
v.large -0.207*** 0.264*** 0.198*** -0.075*** -0.045*(0.022) (0.033) (0.021) (0.022) (0.023)
mature -0.001 -0.026 0.021** 0.023* -0.022*(0.013) (0.019) (0.011) (0.012) (0.013)
older -0.041*** 0.004 0.034*** 0.008 -0.001(0.014) (0.022) (0.012) (0.014) (0.015)
exporter -0.030*** 0.195 0.035*** -0.022* -0.024*(0.012) (0.128) (0.011) (0.012) (0.013)
foreign -0.304*** 0.100*** 0.032*** 0.009 0.014(0.014) (0.016) (0.012) (0.014) (0.014)
Observations 55182 42673 55770 55027 56683R-squared 0.14 0.15 0.16 0.15 0.28Robust standard errors in parentheses* significant at 10%; ** significant at 5%; *** significant at 1%Omitted variables (micro 1-10, young1-5, capital&city>=1mn, textiles, Albania 2002)1 Perceptions are deviation from respondent's average constraints across all 18 issue areas2 rank 1-6; Higher values indicates higher perceived consistency in regulations
34
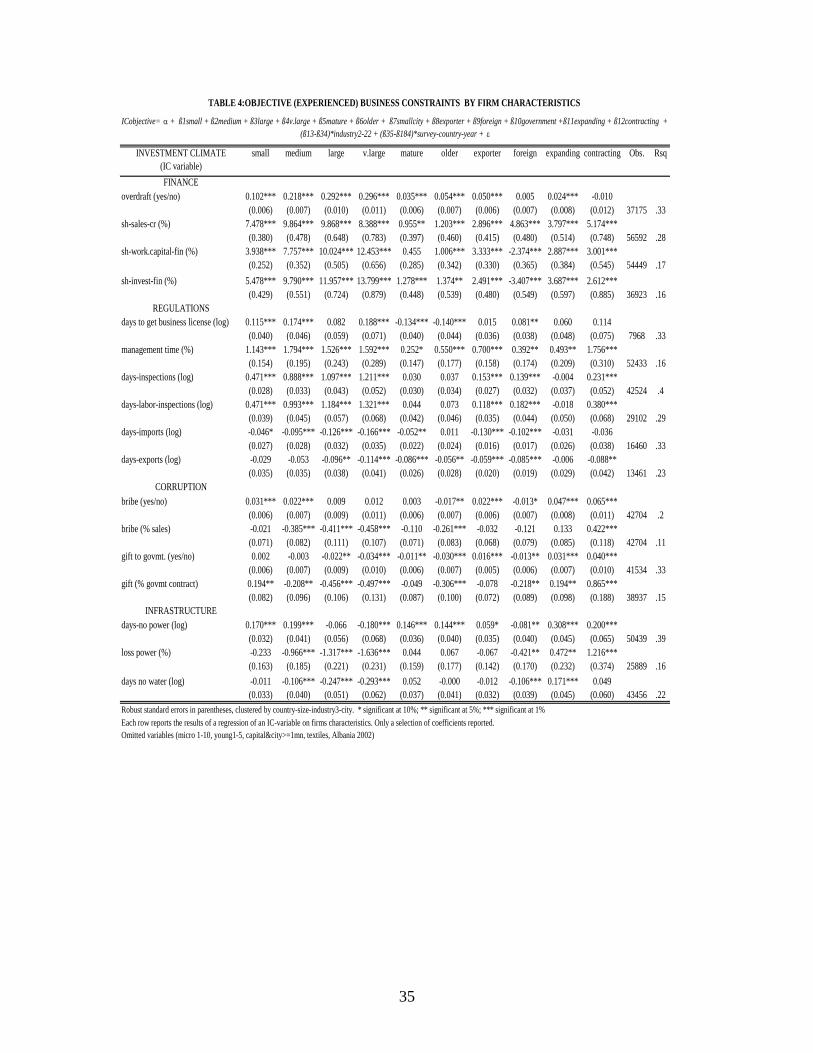
TABLE 4:OBJECTIVE (EXPERIENCED) BUSINESS CONSTRAINTS BY FIRM CHARACTERISTICS
INVESTMENT CLIMATE (IC variable)
small medium large v.large mature older exporter foreign expanding contracting Obs. Rsq
FINANCEoverdraft (yes/no) 0.102*** 0.218*** 0.292*** 0.296*** 0.035*** 0.054*** 0.050*** 0.005 0.024*** -0.010
(0.006) (0.007) (0.010) (0.011) (0.006) (0.007) (0.006) (0.007) (0.008) (0.012) 37175 .33sh-sales-cr (%) 7.478*** 9.864*** 9.868*** 8.388*** 0.955** 1.203*** 2.896*** 4.863*** 3.797*** 5.174***
(0.380) (0.478) (0.648) (0.783) (0.397) (0.460) (0.415) (0.480) (0.514) (0.748) 56592 .28sh-work.capital-fin (%) 3.938*** 7.757*** 10.024*** 12.453*** 0.455 1.006*** 3.333*** -2.374*** 2.887*** 3.001***
(0.252) (0.352) (0.505) (0.656) (0.285) (0.342) (0.330) (0.365) (0.384) (0.545) 54449 .17sh-invest-fin (%) 5.478*** 9.790*** 11.957*** 13.799*** 1.278*** 1.374** 2.491*** -3.407*** 3.687*** 2.612***
(0.429) (0.551) (0.724) (0.879) (0.448) (0.539) (0.480) (0.549) (0.597) (0.885) 36923 .16REGULATIONS
days to get business license (log) 0.115*** 0.174*** 0.082 0.188*** -0.134*** -0.140*** 0.015 0.081** 0.060 0.114(0.040) (0.046) (0.059) (0.071) (0.040) (0.044) (0.036) (0.038) (0.048) (0.075) 7968 .33
management time (%) 1.143*** 1.794*** 1.526*** 1.592*** 0.252* 0.550*** 0.700*** 0.392** 0.493** 1.756***(0.154) (0.195) (0.243) (0.289) (0.147) (0.177) (0.158) (0.174) (0.209) (0.310) 52433 .16
days-inspections (log) 0.471*** 0.888*** 1.097*** 1.211*** 0.030 0.037 0.153*** 0.139*** -0.004 0.231***(0.028) (0.033) (0.043) (0.052) (0.030) (0.034) (0.027) (0.032) (0.037) (0.052) 42524 .4
days-labor-inspections (log) 0.471*** 0.993*** 1.184*** 1.321*** 0.044 0.073 0.118*** 0.182*** -0.018 0.380***(0.039) (0.045) (0.057) (0.068) (0.042) (0.046) (0.035) (0.044) (0.050) (0.068) 29102 .29
days-imports (log) -0.046* -0.095*** -0.126*** -0.166*** -0.052** 0.011 -0.130*** -0.102*** -0.031 -0.036(0.027) (0.028) (0.032) (0.035) (0.022) (0.024) (0.016) (0.017) (0.026) (0.038) 16460 .33
days-exports (log) -0.029 -0.053 -0.096** -0.114*** -0.086*** -0.056** -0.059*** -0.085*** -0.006 -0.088**(0.035) (0.035) (0.038) (0.041) (0.026) (0.028) (0.020) (0.019) (0.029) (0.042) 13461 .23
CORRUPTIONbribe (yes/no) 0.031*** 0.022*** 0.009 0.012 0.003 -0.017** 0.022*** -0.013* 0.047*** 0.065***
(0.006) (0.007) (0.009) (0.011) (0.006) (0.007) (0.006) (0.007) (0.008) (0.011) 42704 .2bribe (% sales) -0.021 -0.385*** -0.411*** -0.458*** -0.110 -0.261*** -0.032 -0.121 0.133 0.422***
(0.071) (0.082) (0.111) (0.107) (0.071) (0.083) (0.068) (0.079) (0.085) (0.118) 42704 .11gift to govmt. (yes/no) 0.002 -0.003 -0.022** -0.034*** -0.011** -0.030*** 0.016*** -0.013** 0.031*** 0.040***
(0.006) (0.007) (0.009) (0.010) (0.006) (0.007) (0.005) (0.006) (0.007) (0.010) 41534 .33gift (% govmt contract) 0.194** -0.208** -0.456*** -0.497*** -0.049 -0.306*** -0.078 -0.218** 0.194** 0.865***
(0.082) (0.096) (0.106) (0.131) (0.087) (0.100) (0.072) (0.089) (0.098) (0.188) 38937 .15INFRASTRUCTURE
days-no power (log) 0.170*** 0.199*** -0.066 -0.180*** 0.146*** 0.144*** 0.059* -0.081** 0.308*** 0.200***(0.032) (0.041) (0.056) (0.068) (0.036) (0.040) (0.035) (0.040) (0.045) (0.065) 50439 .39
loss power (%) -0.233 -0.966*** -1.317*** -1.636*** 0.044 0.067 -0.067 -0.421** 0.472** 1.216***(0.163) (0.185) (0.221) (0.231) (0.159) (0.177) (0.142) (0.170) (0.232) (0.374) 25889 .16
days no water (log) -0.011 -0.106*** -0.247*** -0.293*** 0.052 -0.000 -0.012 -0.106*** 0.171*** 0.049(0.033) (0.040) (0.051) (0.062) (0.037) (0.041) (0.032) (0.039) (0.045) (0.060) 43456 .22
Robust standard errors in parentheses, clustered by country-size-industry3-city. * significant at 10%; ** significant at 5%; *** significant at 1%Each row reports the results of a regression of an IC-variable on firms characteristics. Only a selection of coefficients reported.Omitted variables (micro 1-10, young1-5, capital&city>=1mn, textiles, Albania 2002)
ICobjective= α + ß1small + ß2medium + ß3large + ß4v.large + ß5mature + ß6older + ß7smallcity + ß8exporter + ß9foreign + ß10government +ß11expanding + ß12contracting + (ß13-ß34)*industry2-22 + (ß35-ß184)*survey-country-year + ε
35
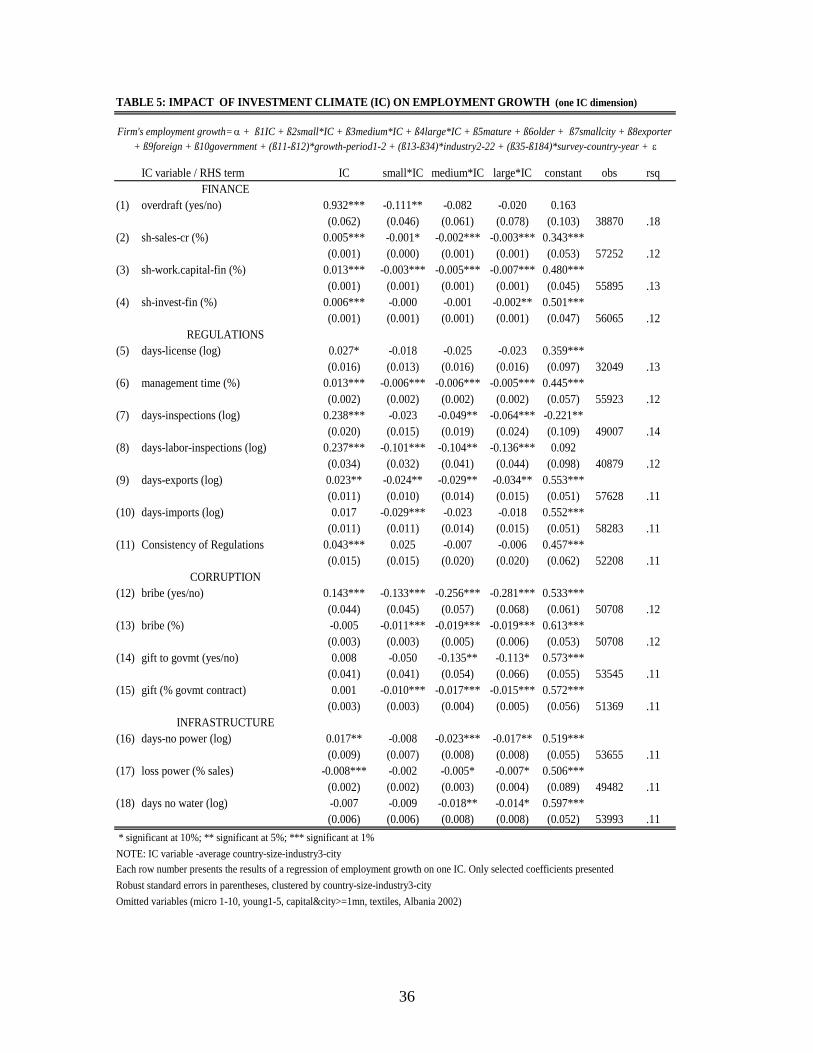
TABLE 5: IMPACT OF INVESTMENT CLIMATE (IC) ON EMPLOYMENT GROWTH (one IC dimension)
IC variable / RHS term IC small*IC medium*IC large*IC constant obs rsqFINANCE
(1) overdraft (yes/no) 0.932*** -0.111** -0.082 -0.020 0.163(0.062) (0.046) (0.061) (0.078) (0.103) 38870 .18
(2) sh-sales-cr (%) 0.005*** -0.001* -0.002*** -0.003*** 0.343***(0.001) (0.000) (0.001) (0.001) (0.053) 57252 .12
(3) sh-work.capital-fin (%) 0.013*** -0.003*** -0.005*** -0.007*** 0.480***(0.001) (0.001) (0.001) (0.001) (0.045) 55895 .13
(4) sh-invest-fin (%) 0.006*** -0.000 -0.001 -0.002** 0.501***(0.001) (0.001) (0.001) (0.001) (0.047) 56065 .12
REGULATIONS(5) days-license (log) 0.027* -0.018 -0.025 -0.023 0.359***
(0.016) (0.013) (0.016) (0.016) (0.097) 32049 .13(6) management time (%) 0.013*** -0.006*** -0.006*** -0.005*** 0.445***
(0.002) (0.002) (0.002) (0.002) (0.057) 55923 .12(7) days-inspections (log) 0.238*** -0.023 -0.049** -0.064*** -0.221**
(0.020) (0.015) (0.019) (0.024) (0.109) 49007 .14(8) days-labor-inspections (log) 0.237*** -0.101*** -0.104** -0.136*** 0.092
(0.034) (0.032) (0.041) (0.044) (0.098) 40879 .12(9) days-exports (log) 0.023** -0.024** -0.029** -0.034** 0.553***
(0.011) (0.010) (0.014) (0.015) (0.051) 57628 .11(10) days-imports (log) 0.017 -0.029*** -0.023 -0.018 0.552***
(0.011) (0.011) (0.014) (0.015) (0.051) 58283 .11(11) Consistency of Regulations 0.043*** 0.025 -0.007 -0.006 0.457***
(0.015) (0.015) (0.020) (0.020) (0.062) 52208 .11CORRUPTION
(12) bribe (yes/no) 0.143*** -0.133*** -0.256*** -0.281*** 0.533***(0.044) (0.045) (0.057) (0.068) (0.061) 50708 .12
(13) bribe (%) -0.005 -0.011*** -0.019*** -0.019*** 0.613***(0.003) (0.003) (0.005) (0.006) (0.053) 50708 .12
(14) gift to govmt (yes/no) 0.008 -0.050 -0.135** -0.113* 0.573***(0.041) (0.041) (0.054) (0.066) (0.055) 53545 .11
(15) gift (% govmt contract) 0.001 -0.010*** -0.017*** -0.015*** 0.572***(0.003) (0.003) (0.004) (0.005) (0.056) 51369 .11
INFRASTRUCTURE(16) days-no power (log) 0.017** -0.008 -0.023*** -0.017** 0.519***
(0.009) (0.007) (0.008) (0.008) (0.055) 53655 .11(17) loss power (% sales) -0.008*** -0.002 -0.005* -0.007* 0.506***
(0.002) (0.002) (0.003) (0.004) (0.089) 49482 .11(18) days no water (log) -0.007 -0.009 -0.018** -0.014* 0.597***
(0.006) (0.006) (0.008) (0.008) (0.052) 53993 .11 * significant at 10%; ** significant at 5%; *** significant at 1%NOTE: IC variable -average country-size-industry3-city Each row number presents the results of a regression of employment growth on one IC. Only selected coefficients presentedRobust standard errors in parentheses, clustered by country-size-industry3-cityOmitted variables (micro 1-10, young1-5, capital&city>=1mn, textiles, Albania 2002)
Firm's employment growth=α + ß1IC + ß2small*IC + ß3medium*IC + ß4large*IC + ß5mature + ß6older + ß7smallcity + ß8exporter + ß9foreign + ß10government + (ß11-ß12)*growth-period1-2 + (ß13-ß34)*industry2-22 + (ß35-ß184)*survey-country-year + ε
36
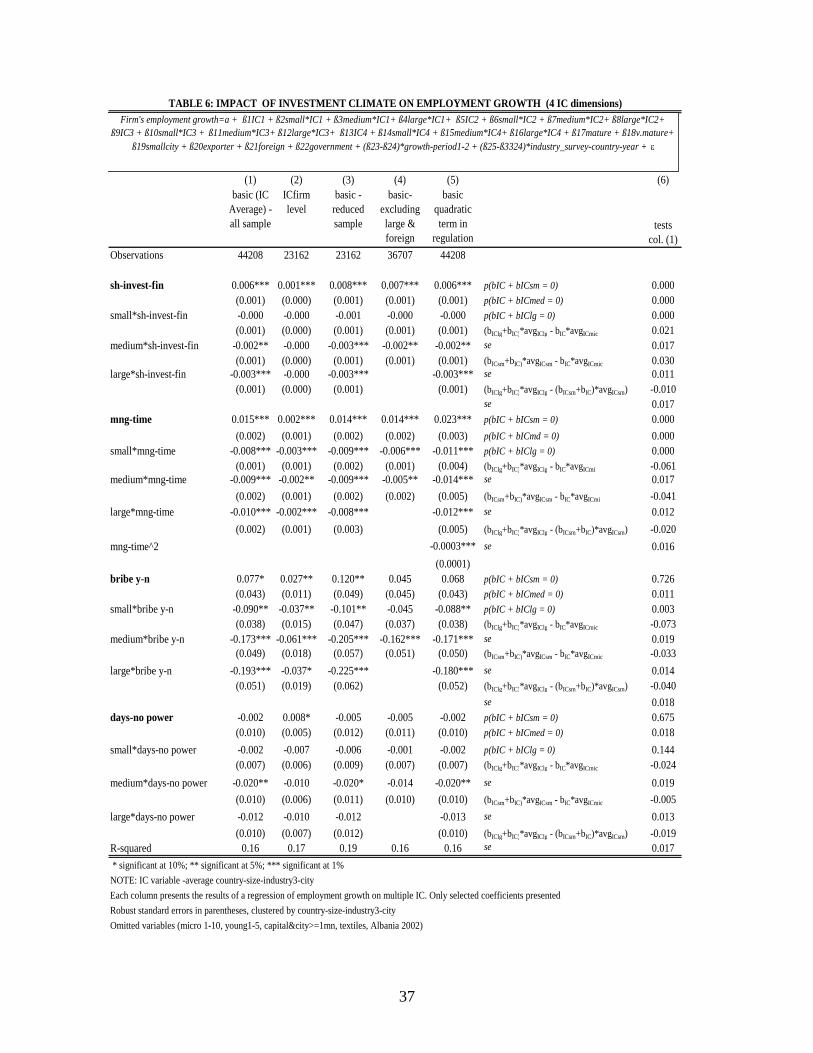
TABLE 6: IMPACT OF INVESTMENT CLIMATE ON EMPLOYMENT GROWTH (4 IC dimensions)
(1) (2) (3) (4) (5) (6)basic (IC
Average) - all sample
ICfirm level
basic -reduced sample
basic- excluding large & foreign
basic quadratic term in
regulationtests
col. (1)Observations 44208 23162 23162 36707 44208
sh-invest-fin 0.006*** 0.001*** 0.008*** 0.007*** 0.006*** p(bIC + bICsm = 0) 0.000(0.001) (0.000) (0.001) (0.001) (0.001) p(bIC + bICmed = 0) 0.000
small*sh-invest-fin -0.000 -0.000 -0.001 -0.000 -0.000 p(bIC + bIClg = 0) 0.000(0.001) (0.000) (0.001) (0.001) (0.001) (bIClg+bIC)*avgIClg - bIC*avgICmic 0.021
medium*sh-invest-fin -0.002** -0.000 -0.003*** -0.002** -0.002** se 0.017(0.001) (0.000) (0.001) (0.001) (0.001) (bICsm+bIC)*avgICsm - bIC*avgICmic 0.030
large*sh-invest-fin -0.003*** -0.000 -0.003*** -0.003*** se 0.011(0.001) (0.000) (0.001) (0.001) (bIClg+bIC)*avgIClg - (bICsm+bIC)*avgICsm) -0.010
se 0.017mng-time 0.015*** 0.002*** 0.014*** 0.014*** 0.023*** p(bIC + bICsm = 0) 0.000
(0.002) (0.001) (0.002) (0.002) (0.003) p(bIC + bICmd = 0) 0.000small*mng-time -0.008*** -0.003*** -0.009*** -0.006*** -0.011*** p(bIC + bIClg = 0) 0.000
(0.001) (0.001) (0.002) (0.001) (0.004) (bIClg+bIC)*avgIClg - bIC*avgICmi -0.061medium*mng-time -0.009*** -0.002** -0.009*** -0.005** -0.014*** se 0.017
(0.002) (0.001) (0.002) (0.002) (0.005) (bICsm+bIC)*avgICsm - bIC*avgICmi -0.041large*mng-time -0.010*** -0.002*** -0.008*** -0.012*** se 0.012
(0.002) (0.001) (0.003) (0.005) (bIClg+bIC)*avgIClg - (bICsm+bIC)*avgICsm) -0.020mng-time^2 -0.0003*** se 0.016
(0.0001)bribe y-n 0.077* 0.027** 0.120** 0.045 0.068 p(bIC + bICsm = 0) 0.726
(0.043) (0.011) (0.049) (0.045) (0.043) p(bIC + bICmed = 0) 0.011small*bribe y-n -0.090** -0.037** -0.101** -0.045 -0.088** p(bIC + bIClg = 0) 0.003
(0.038) (0.015) (0.047) (0.037) (0.038) (bIClg+bIC)*avgIClg - bIC*avgICmic -0.073medium*bribe y-n -0.173*** -0.061*** -0.205*** -0.162*** -0.171*** se 0.019
(0.049) (0.018) (0.057) (0.051) (0.050) (bICsm+bIC)*avgICsm - bIC*avgICmic -0.033large*bribe y-n -0.193*** -0.037* -0.225*** -0.180*** se 0.014
(0.051) (0.019) (0.062) (0.052) (bIClg+bIC)*avgIClg - (bICsm+bIC)*avgICsm) -0.040se 0.018
days-no power -0.002 0.008* -0.005 -0.005 -0.002 p(bIC + bICsm = 0) 0.675(0.010) (0.005) (0.012) (0.011) (0.010) p(bIC + bICmed = 0) 0.018
small*days-no power -0.002 -0.007 -0.006 -0.001 -0.002 p(bIC + bIClg = 0) 0.144(0.007) (0.006) (0.009) (0.007) (0.007) (bIClg+bIC)*avgIClg - bIC*avgICmic -0.024
medium*days-no power -0.020** -0.010 -0.020* -0.014 -0.020** se 0.019(0.010) (0.006) (0.011) (0.010) (0.010) (bICsm+bIC)*avgICsm - bIC*avgICmic -0.005
large*days-no power -0.012 -0.010 -0.012 -0.013 se 0.013(0.010) (0.007) (0.012) (0.010) (bIClg+bIC)*avgIClg - (bICsm+bIC)*avgICsm) -0.019
R-squared 0.16 0.17 0.19 0.16 0.16 se 0.017 * significant at 10%; ** significant at 5%; *** significant at 1%NOTE: IC variable -average country-size-industry3-city Each column presents the results of a regression of employment growth on multiple IC. Only selected coefficients presentedRobust standard errors in parentheses, clustered by country-size-industry3-cityOmitted variables (micro 1-10, young1-5, capital&city>=1mn, textiles, Albania 2002)
######################### ###################################
Firm's employment growth=a + ß1IC1 + ß2small*IC1 + ß3medium*IC1+ ß4large*IC1+ ß5IC2 + ß6small*IC2 + ß7medium*IC2+ ß8large*IC2+ ß9IC3 + ß10small*IC3 + ß11medium*IC3+ ß12large*IC3+ ß13IC4 + ß14small*IC4 + ß15medium*IC4+ ß16large*IC4 + ß17mature + ß18v.mature+
ß19smallcity + ß20exporter + ß21foreign + ß22government + (ß23-ß24)*growth-period1-2 + (ß25-ß3324)*industry_survey-country-year + ε
37
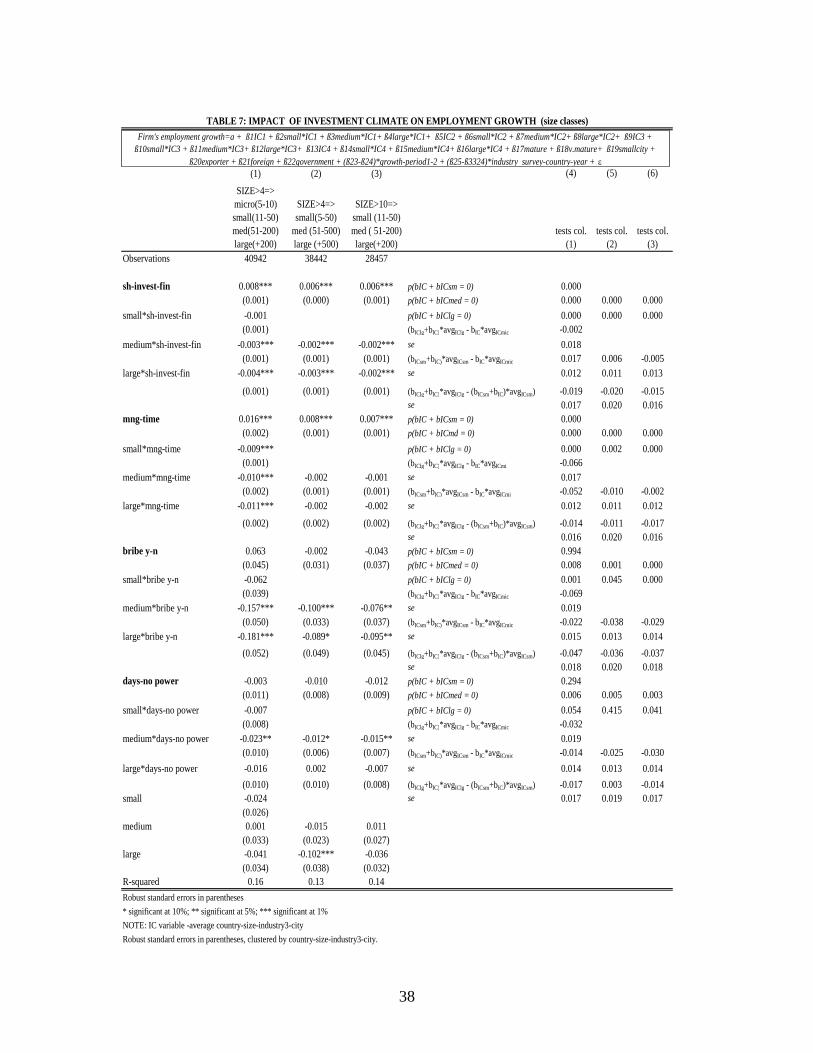
TABLE 7: IMPACT OF INVESTMENT CLIMATE ON EMPLOYMENT GROWTH (size classes)###############################################################
(1) (2) (3) (4) (5) (6)
SIZE>4=> micro(5-10) small(11-50) med(51-200) large(+200)
SIZE>4=> small(5-50)
med (51-500) large (+500)
SIZE>10=> small (11-50) med ( 51-200) large(+200)
tests col. (1)
tests col. (2)
tests col. (3)
Observations 40942 38442 28457
sh-invest-fin 0.008*** 0.006*** 0.006*** p(bIC + bICsm = 0) 0.000(0.001) (0.000) (0.001) p(bIC + bICmed = 0) 0.000 0.000 0.000
small*sh-invest-fin -0.001 p(bIC + bIClg = 0) 0.000 0.000 0.000(0.001) (bIClg+bIC)*avgIClg - bIC*avgICmic -0.002
medium*sh-invest-fin -0.003*** -0.002*** -0.002*** se 0.018(0.001) (0.001) (0.001) (bICsm+bIC)*avgICsm - bIC*avgICmic 0.017 0.006 -0.005
large*sh-invest-fin -0.004*** -0.003*** -0.002*** se 0.012 0.011 0.013
(0.001) (0.001) (0.001) (bIClg+bIC)*avgIClg - (bICsm+bIC)*avgICsm) -0.019 -0.020 -0.015se 0.017 0.020 0.016
mng-time 0.016*** 0.008*** 0.007*** p(bIC + bICsm = 0) 0.000(0.002) (0.001) (0.001) p(bIC + bICmd = 0) 0.000 0.000 0.000
small*mng-time -0.009*** p(bIC + bIClg = 0) 0.000 0.002 0.000(0.001) (bIClg+bIC)*avgIClg - bIC*avgICmi -0.066
medium*mng-time -0.010*** -0.002 -0.001 se 0.017(0.002) (0.001) (0.001) (bICsm+bIC)*avgICsm - bIC*avgICmi -0.052 -0.010 -0.002
large*mng-time -0.011*** -0.002 -0.002 se 0.012 0.011 0.012
(0.002) (0.002) (0.002) (bIClg+bIC)*avgIClg - (bICsm+bIC)*avgICsm) -0.014 -0.011 -0.017se 0.016 0.020 0.016
bribe y-n 0.063 -0.002 -0.043 p(bIC + bICsm = 0) 0.994(0.045) (0.031) (0.037) p(bIC + bICmed = 0) 0.008 0.001 0.000
small*bribe y-n -0.062 p(bIC + bIClg = 0) 0.001 0.045 0.000(0.039) (bIClg+bIC)*avgIClg - bIC*avgICmic -0.069
medium*bribe y-n -0.157*** -0.100*** -0.076** se 0.019(0.050) (0.033) (0.037) (bICsm+bIC)*avgICsm - bIC*avgICmic -0.022 -0.038 -0.029
large*bribe y-n -0.181*** -0.089* -0.095** se 0.015 0.013 0.014(0.052) (0.049) (0.045) (bIClg+bIC)*avgIClg - (bICsm+bIC)*avgICsm) -0.047 -0.036 -0.037
se 0.018 0.020 0.018days-no power -0.003 -0.010 -0.012 p(bIC + bICsm = 0) 0.294
(0.011) (0.008) (0.009) p(bIC + bICmed = 0) 0.006 0.005 0.003small*days-no power -0.007 p(bIC + bIClg = 0) 0.054 0.415 0.041
(0.008) (bIClg+bIC)*avgIClg - bIC*avgICmic -0.032medium*days-no power -0.023** -0.012* -0.015** se 0.019
(0.010) (0.006) (0.007) (bICsm+bIC)*avgICsm - bIC*avgICmic -0.014 -0.025 -0.030large*days-no power -0.016 0.002 -0.007 se 0.014 0.013 0.014
(0.010) (0.010) (0.008) (bIClg+bIC)*avgIClg - (bICsm+bIC)*avgICsm) -0.017 0.003 -0.014small -0.024 se 0.017 0.019 0.017
(0.026)medium 0.001 -0.015 0.011
(0.033) (0.023) (0.027)large -0.041 -0.102*** -0.036
(0.034) (0.038) (0.032)R-squared 0.16 0.13 0.14Robust standard errors in parentheses* significant at 10%; ** significant at 5%; *** significant at 1%NOTE: IC variable -average country-size-industry3-city Robust standard errors in parentheses, clustered by country-size-industry3-city.
Firm's employment growth=a + ß1IC1 + ß2small*IC1 + ß3medium*IC1+ ß4large*IC1+ ß5IC2 + ß6small*IC2 + ß7medium*IC2+ ß8large*IC2+ ß9IC3 + ß10small*IC3 + ß11medium*IC3+ ß12large*IC3+ ß13IC4 + ß14small*IC4 + ß15medium*IC4+ ß16large*IC4 + ß17mature + ß18v.mature+ ß19smallcity +
ß20exporter + ß21foreign + ß22government + (ß23-ß24)*growth-period1-2 + (ß25-ß3324)*industry survey-country-year + ε
38
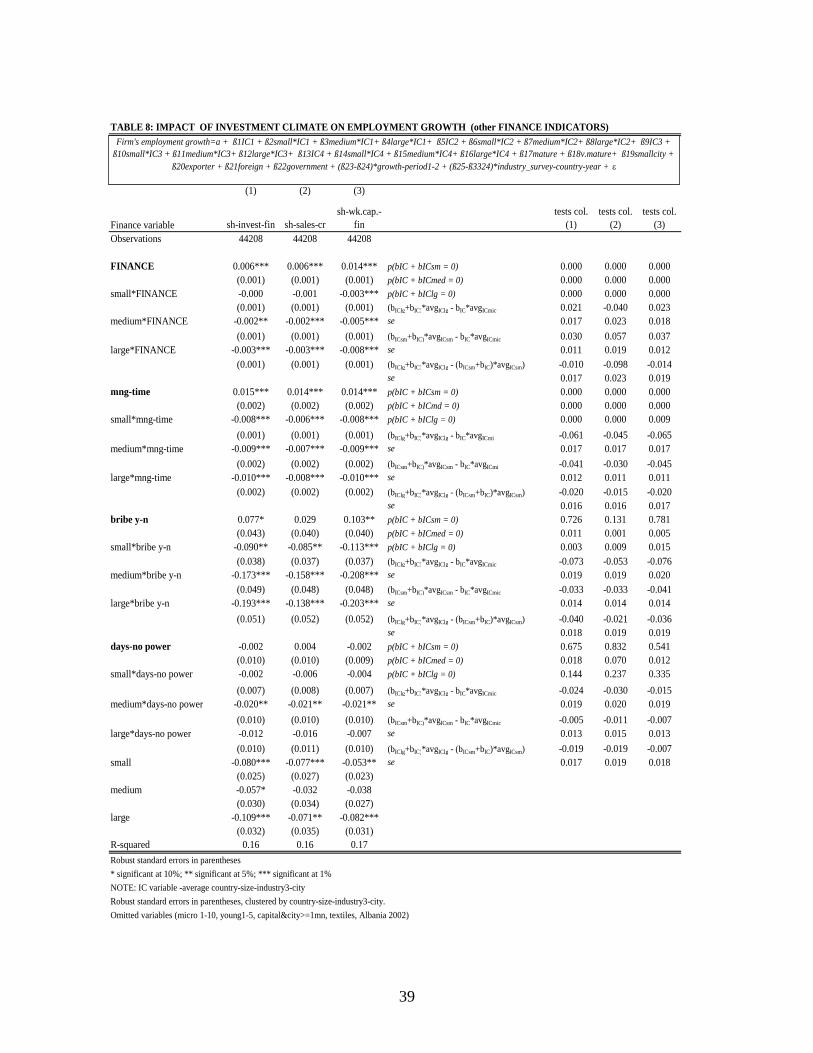
TABLE 8: IMPACT OF INVESTMENT CLIMATE ON EMPLOYMENT GROWTH (other FINANCE INDICATORS)########################################################################################
(1) (2) (3)
Finance variable sh-invest-fin sh-sales-crsh-wk.cap.-
fintests col.
(1)tests col.
(2)tests col.
(3)Observations 44208 44208 44208
FINANCE 0.006*** 0.006*** 0.014*** p(bIC + bICsm = 0) 0.000 0.000 0.000(0.001) (0.001) (0.001) p(bIC + bICmed = 0) 0.000 0.000 0.000
small*FINANCE -0.000 -0.001 -0.003*** p(bIC + bIClg = 0) 0.000 0.000 0.000(0.001) (0.001) (0.001) (bIClg+bIC)*avgIClg - bIC*avgICmic 0.021 -0.040 0.023
medium*FINANCE -0.002** -0.002*** -0.005*** se 0.017 0.023 0.018(0.001) (0.001) (0.001) (bICsm+bIC)*avgICsm - bIC*avgICmic 0.030 0.057 0.037
large*FINANCE -0.003*** -0.003*** -0.008*** se 0.011 0.019 0.012(0.001) (0.001) (0.001) (bIClg+bIC)*avgIClg - (bICsm+bIC)*avgICsm) -0.010 -0.098 -0.014
se 0.017 0.023 0.019mng-time 0.015*** 0.014*** 0.014*** p(bIC + bICsm = 0) 0.000 0.000 0.000
(0.002) (0.002) (0.002) p(bIC + bICmd = 0) 0.000 0.000 0.000small*mng-time -0.008*** -0.006*** -0.008*** p(bIC + bIClg = 0) 0.000 0.000 0.009
(0.001) (0.001) (0.001) (bIClg+bIC)*avgIClg - bIC*avgICmi -0.061 -0.045 -0.065medium*mng-time -0.009*** -0.007*** -0.009*** se 0.017 0.017 0.017
(0.002) (0.002) (0.002) (bICsm+bIC)*avgICsm - bIC*avgICmi -0.041 -0.030 -0.045large*mng-time -0.010*** -0.008*** -0.010*** se 0.012 0.011 0.011
(0.002) (0.002) (0.002) (bIClg+bIC)*avgIClg - (bICsm+bIC)*avgICsm) -0.020 -0.015 -0.020se 0.016 0.016 0.017
bribe y-n 0.077* 0.029 0.103** p(bIC + bICsm = 0) 0.726 0.131 0.781(0.043) (0.040) (0.040) p(bIC + bICmed = 0) 0.011 0.001 0.005
small*bribe y-n -0.090** -0.085** -0.113*** p(bIC + bIClg = 0) 0.003 0.009 0.015(0.038) (0.037) (0.037) (bIClg+bIC)*avgIClg - bIC*avgICmic -0.073 -0.053 -0.076
medium*bribe y-n -0.173*** -0.158*** -0.208*** se 0.019 0.019 0.020(0.049) (0.048) (0.048) (bICsm+bIC)*avgICsm - bIC*avgICmic -0.033 -0.033 -0.041
large*bribe y-n -0.193*** -0.138*** -0.203*** se 0.014 0.014 0.014(0.051) (0.052) (0.052) (bIClg+bIC)*avgIClg - (bICsm+bIC)*avgICsm) -0.040 -0.021 -0.036
se 0.018 0.019 0.019days-no power -0.002 0.004 -0.002 p(bIC + bICsm = 0) 0.675 0.832 0.541
(0.010) (0.010) (0.009) p(bIC + bICmed = 0) 0.018 0.070 0.012small*days-no power -0.002 -0.006 -0.004 p(bIC + bIClg = 0) 0.144 0.237 0.335
(0.007) (0.008) (0.007) (bIClg+bIC)*avgIClg - bIC*avgICmic -0.024 -0.030 -0.015medium*days-no power -0.020** -0.021** -0.021** se 0.019 0.020 0.019
(0.010) (0.010) (0.010) (bICsm+bIC)*avgICsm - bIC*avgICmic -0.005 -0.011 -0.007large*days-no power -0.012 -0.016 -0.007 se 0.013 0.015 0.013
(0.010) (0.011) (0.010) (bIClg+bIC)*avgIClg - (bICsm+bIC)*avgICsm) -0.019 -0.019 -0.007small -0.080*** -0.077*** -0.053** se 0.017 0.019 0.018
(0.025) (0.027) (0.023)medium -0.057* -0.032 -0.038
(0.030) (0.034) (0.027)large -0.109*** -0.071** -0.082***
(0.032) (0.035) (0.031)R-squared 0.16 0.16 0.17Robust standard errors in parentheses* significant at 10%; ** significant at 5%; *** significant at 1%NOTE: IC variable -average country-size-industry3-city Robust standard errors in parentheses, clustered by country-size-industry3-city. Omitted variables (micro 1-10, young1-5, capital&city>=1mn, textiles, Albania 2002)
Firm's employment growth=a + ß1IC1 + ß2small*IC1 + ß3medium*IC1+ ß4large*IC1+ ß5IC2 + ß6small*IC2 + ß7medium*IC2+ ß8large*IC2+ ß9IC3 + ß10small*IC3 + ß11medium*IC3+ ß12large*IC3+ ß13IC4 + ß14small*IC4 + ß15medium*IC4+ ß16large*IC4 + ß17mature + ß18v.mature+ ß19smallcity +
ß20exporter + ß21foreign + ß22government + (ß23-ß24)*growth-period1-2 + (ß25-ß3324)*industry_survey-country-year + ε
39
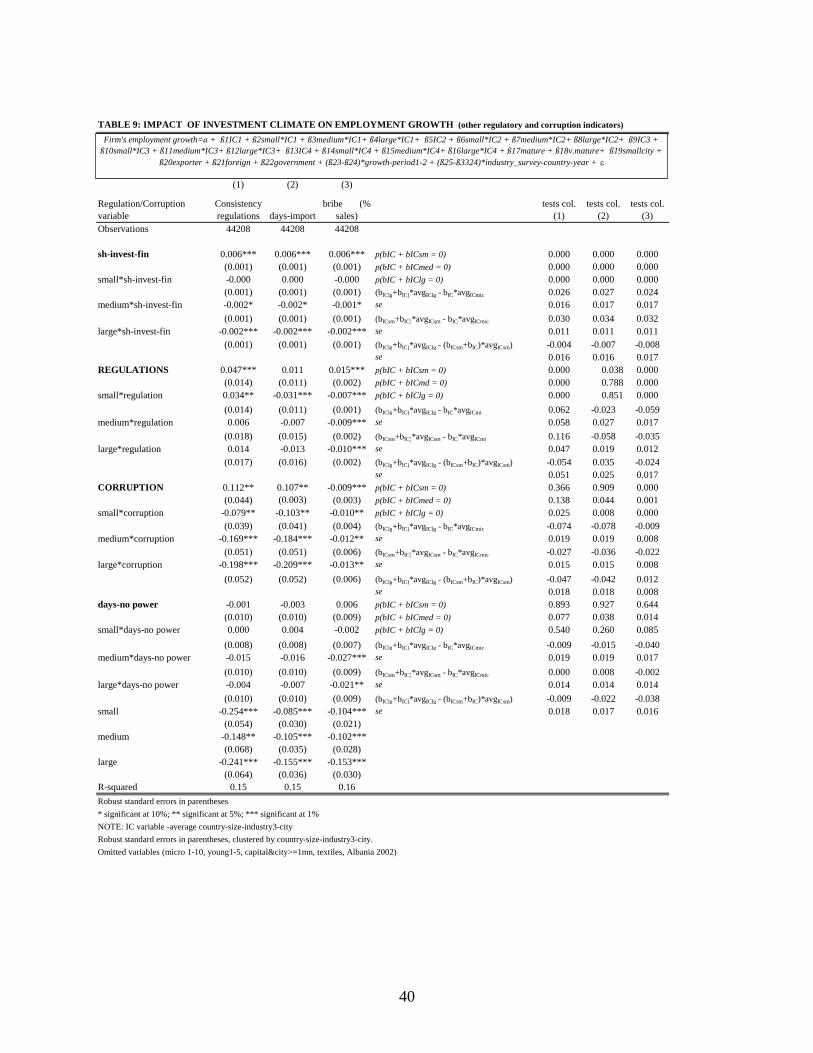
TABLE 9: IMPACT OF INVESTMENT CLIMATE ON EMPLOYMENT GROWTH (other regulatory and corruption indicators)
Firm's employment growth=a + ß1IC1 + ß2small*IC1 + ß3medium*IC1+ ß4large*IC1+ ß5IC2 + ß6small*IC2 + ß7medium*IC2+ ß8large*IC2+ ß9IC3 + ß10small*IC3 + ß11medium*IC3+ ß12large*IC3+ ß13IC4 + ß14small*IC4 +
ß15medium*IC4+ ß16large*IC4 + ß17mature + ß18old
(1) (2) (3)
Regulation/Corruption variable
Consistency regulations days-import
bribe (% sales)
tests col. (1)
tests col. (2)
tests col. (3)
Observations 44208 44208 44208
sh-invest-fin 0.006*** 0.006*** 0.006*** p(bIC + bICsm = 0) 0.000 0.000 0.000(0.001) (0.001) (0.001) p(bIC + bICmed = 0) 0.000 0.000 0.000
small*sh-invest-fin -0.000 0.000 -0.000 p(bIC + bIClg = 0) 0.000 0.000 0.000(0.001) (0.001) (0.001) (bIClg+bIC)*avgIClg - bIC*avgICmic 0.026 0.027 0.024
medium*sh-invest-fin -0.002* -0.002* -0.001* se 0.016 0.017 0.017(0.001) (0.001) (0.001) (bICsm+bIC)*avgICsm - bIC*avgICmic 0.030 0.034 0.032
large*sh-invest-fin -0.002*** -0.002*** -0.002*** se 0.011 0.011 0.011(0.001) (0.001) (0.001) (bIClg+bIC)*avgIClg - (bICsm+bIC)*avgICsm) -0.004 -0.007 -0.008
se 0.016 0.016 0.017REGULATIONS 0.047*** 0.011 0.015*** p(bIC + bICsm = 0) 0.000 0.038 0.000
(0.014) (0.011) (0.002) p(bIC + bICmd = 0) 0.000 0.788 0.000small*regulation 0.034** -0.031*** -0.007*** p(bIC + bIClg = 0) 0.000 0.851 0.000
(0.014) (0.011) (0.001) (bIClg+bIC)*avgIClg - bIC*avgICmi 0.062 -0.023 -0.059medium*regulation 0.006 -0.007 -0.009*** se 0.058 0.027 0.017
(0.018) (0.015) (0.002) (bICsm+bIC)*avgICsm - bIC*avgICmi 0.116 -0.058 -0.035large*regulation 0.014 -0.013 -0.010*** se 0.047 0.019 0.012
(0.017) (0.016) (0.002) (bIClg+bIC)*avgIClg - (bICsm+bIC)*avgICsm) -0.054 0.035 -0.024se 0.051 0.025 0.017
CORRUPTION 0.112** 0.107** -0.009*** p(bIC + bICsm = 0) 0.366 0.909 0.000(0.044) (0.003) (0.003) p(bIC + bICmed = 0) 0.138 0.044 0.001
small*corruption -0.079** -0.103** -0.010** p(bIC + bIClg = 0) 0.025 0.008 0.000(0.039) (0.041) (0.004) (bIClg+bIC)*avgIClg - bIC*avgICmic -0.074 -0.078 -0.009
medium*corruption -0.169*** -0.184*** -0.012** se 0.019 0.019 0.008(0.051) (0.051) (0.006) (bICsm+bIC)*avgICsm - bIC*avgICmic -0.027 -0.036 -0.022
large*corruption -0.198*** -0.209*** -0.013** se 0.015 0.015 0.008(0.052) (0.052) (0.006) (bIClg+bIC)*avgIClg - (bICsm+bIC)*avgICsm) -0.047 -0.042 0.012
se 0.018 0.018 0.008days-no power -0.001 -0.003 0.006 p(bIC + bICsm = 0) 0.893 0.927 0.644
(0.010) (0.010) (0.009) p(bIC + bICmed = 0) 0.077 0.038 0.014small*days-no power 0.000 0.004 -0.002 p(bIC + bIClg = 0) 0.540 0.260 0.085
(0.008) (0.008) (0.007) (bIClg+bIC)*avgIClg - bIC*avgICmic -0.009 -0.015 -0.040medium*days-no power -0.015 -0.016 -0.027*** se 0.019 0.019 0.017
(0.010) (0.010) (0.009) (bICsm+bIC)*avgICsm - bIC*avgICmic 0.000 0.008 -0.002large*days-no power -0.004 -0.007 -0.021** se 0.014 0.014 0.014
(0.010) (0.010) (0.009) (bIClg+bIC)*avgIClg - (bICsm+bIC)*avgICsm) -0.009 -0.022 -0.038small -0.254*** -0.085*** -0.104*** se 0.018 0.017 0.016
(0.054) (0.030) (0.021)medium -0.148** -0.105*** -0.102***
(0.068) (0.035) (0.028)large -0.241*** -0.155*** -0.153***
(0.064) (0.036) (0.030)R-squared 0.15 0.15 0.16Robust standard errors in parentheses* significant at 10%; ** significant at 5%; *** significant at 1%NOTE: IC variable -average country-size-industry3-city Robust standard errors in parentheses, clustered by country-size-industry3-city. Omitted variables (micro 1-10, young1-5, capital&city>=1mn, textiles, Albania 2002)
Firm's employment growth=a + ß1IC1 + ß2small*IC1 + ß3medium*IC1+ ß4large*IC1+ ß5IC2 + ß6small*IC2 + ß7medium*IC2+ ß8large*IC2+ ß9IC3 + ß10small*IC3 + ß11medium*IC3+ ß12large*IC3+ ß13IC4 + ß14small*IC4 + ß15medium*IC4+ ß16large*IC4 + ß17mature + ß18v.mature+ ß19smallcity +
ß20exporter + ß21foreign + ß22government + (ß23-ß24)*growth-period1-2 + (ß25-ß3324)*industry_survey-country-year + ε
40
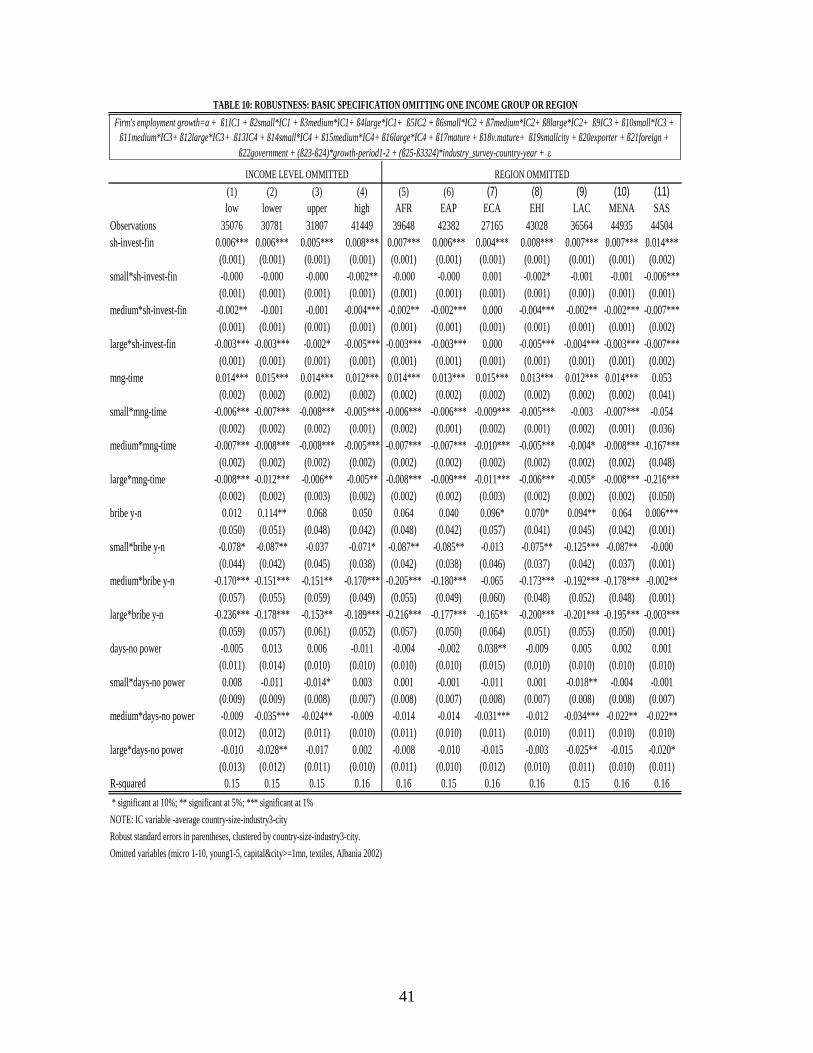
TABLE 10: ROBUSTNESS: BASIC SPECIFICATION OMITTING ONE INCOME GROUP OR REGION######################### ########################################
INCOME LEVEL OMMITTED REGION OMMITTED(1) (2) (3) (4) (5) (6) (7) (8) (9) (10) (11)low lower upper high AFR EAP ECA EHI LAC MENA SAS
Observations 35076 30781 31807 41449 39648 42382 27165 43028 36564 44935 44504sh-invest-fin 0.006*** 0.006*** 0.005*** 0.008*** 0.007*** 0.006*** 0.004*** 0.008*** 0.007*** 0.007*** 0.014***
(0.001) (0.001) (0.001) (0.001) (0.001) (0.001) (0.001) (0.001) (0.001) (0.001) (0.002)small*sh-invest-fin -0.000 -0.000 -0.000 -0.002** -0.000 -0.000 0.001 -0.002* -0.001 -0.001 -0.006***
(0.001) (0.001) (0.001) (0.001) (0.001) (0.001) (0.001) (0.001) (0.001) (0.001) (0.001)medium*sh-invest-fin -0.002** -0.001 -0.001 -0.004*** -0.002** -0.002*** 0.000 -0.004*** -0.002** -0.002*** -0.007***
(0.001) (0.001) (0.001) (0.001) (0.001) (0.001) (0.001) (0.001) (0.001) (0.001) (0.002)large*sh-invest-fin -0.003*** -0.003*** -0.002* -0.005*** -0.003*** -0.003*** 0.000 -0.005*** -0.004*** -0.003*** -0.007***
(0.001) (0.001) (0.001) (0.001) (0.001) (0.001) (0.001) (0.001) (0.001) (0.001) (0.002)mng-time 0.014*** 0.015*** 0.014*** 0.012*** 0.014*** 0.013*** 0.015*** 0.013*** 0.012*** 0.014*** 0.053
(0.002) (0.002) (0.002) (0.002) (0.002) (0.002) (0.002) (0.002) (0.002) (0.002) (0.041)small*mng-time -0.006*** -0.007*** -0.008*** -0.005*** -0.006*** -0.006*** -0.009*** -0.005*** -0.003 -0.007*** -0.054
(0.002) (0.002) (0.002) (0.001) (0.002) (0.001) (0.002) (0.001) (0.002) (0.001) (0.036)medium*mng-time -0.007*** -0.008*** -0.008*** -0.005*** -0.007*** -0.007*** -0.010*** -0.005*** -0.004* -0.008*** -0.167***
(0.002) (0.002) (0.002) (0.002) (0.002) (0.002) (0.002) (0.002) (0.002) (0.002) (0.048)large*mng-time -0.008*** -0.012*** -0.006** -0.005** -0.008*** -0.009*** -0.011*** -0.006*** -0.005* -0.008*** -0.216***
(0.002) (0.002) (0.003) (0.002) (0.002) (0.002) (0.003) (0.002) (0.002) (0.002) (0.050)bribe y-n 0.012 0.114** 0.068 0.050 0.064 0.040 0.096* 0.070* 0.094** 0.064 0.006***
(0.050) (0.051) (0.048) (0.042) (0.048) (0.042) (0.057) (0.041) (0.045) (0.042) (0.001)small*bribe y-n -0.078* -0.087** -0.037 -0.071* -0.087** -0.085** -0.013 -0.075** -0.125*** -0.087** -0.000
(0.044) (0.042) (0.045) (0.038) (0.042) (0.038) (0.046) (0.037) (0.042) (0.037) (0.001)medium*bribe y-n -0.170*** -0.151*** -0.151** -0.170*** -0.205*** -0.180*** -0.065 -0.173*** -0.192*** -0.178*** -0.002**
(0.057) (0.055) (0.059) (0.049) (0.055) (0.049) (0.060) (0.048) (0.052) (0.048) (0.001)large*bribe y-n -0.236*** -0.178*** -0.153** -0.189*** -0.216*** -0.177*** -0.165** -0.200*** -0.201*** -0.195*** -0.003***
(0.059) (0.057) (0.061) (0.052) (0.057) (0.050) (0.064) (0.051) (0.055) (0.050) (0.001)days-no power -0.005 0.013 0.006 -0.011 -0.004 -0.002 0.038** -0.009 0.005 0.002 0.001
(0.011) (0.014) (0.010) (0.010) (0.010) (0.010) (0.015) (0.010) (0.010) (0.010) (0.010)small*days-no power 0.008 -0.011 -0.014* 0.003 0.001 -0.001 -0.011 0.001 -0.018** -0.004 -0.001
(0.009) (0.009) (0.008) (0.007) (0.008) (0.007) (0.008) (0.007) (0.008) (0.008) (0.007)medium*days-no power -0.009 -0.035*** -0.024** -0.009 -0.014 -0.014 -0.031*** -0.012 -0.034*** -0.022** -0.022**
(0.012) (0.012) (0.011) (0.010) (0.011) (0.010) (0.011) (0.010) (0.011) (0.010) (0.010)large*days-no power -0.010 -0.028** -0.017 0.002 -0.008 -0.010 -0.015 -0.003 -0.025** -0.015 -0.020*
(0.013) (0.012) (0.011) (0.010) (0.011) (0.010) (0.012) (0.010) (0.011) (0.010) (0.011)R-squared 0.15 0.15 0.15 0.16 0.16 0.15 0.16 0.16 0.15 0.16 0.16 * significant at 10%; ** significant at 5%; *** significant at 1%NOTE: IC variable -average country-size-industry3-city Robust standard errors in parentheses, clustered by country-size-industry3-city. Omitted variables (micro 1-10, young1-5, capital&city>=1mn, textiles, Albania 2002)
Firm's employment growth=a + ß1IC1 + ß2small*IC1 + ß3medium*IC1+ ß4large*IC1+ ß5IC2 + ß6small*IC2 + ß7medium*IC2+ ß8large*IC2+ ß9IC3 + ß10small*IC3 + ß11medium*IC3+ ß12large*IC3+ ß13IC4 + ß14small*IC4 + ß15medium*IC4+ ß16large*IC4 + ß17mature + ß18v.mature+ ß19smallcity + ß20exporter + ß21foreign +
ß22government + (ß23-ß24)*growth-period1-2 + (ß25-ß3324)*industry_survey-country-year + ε
41
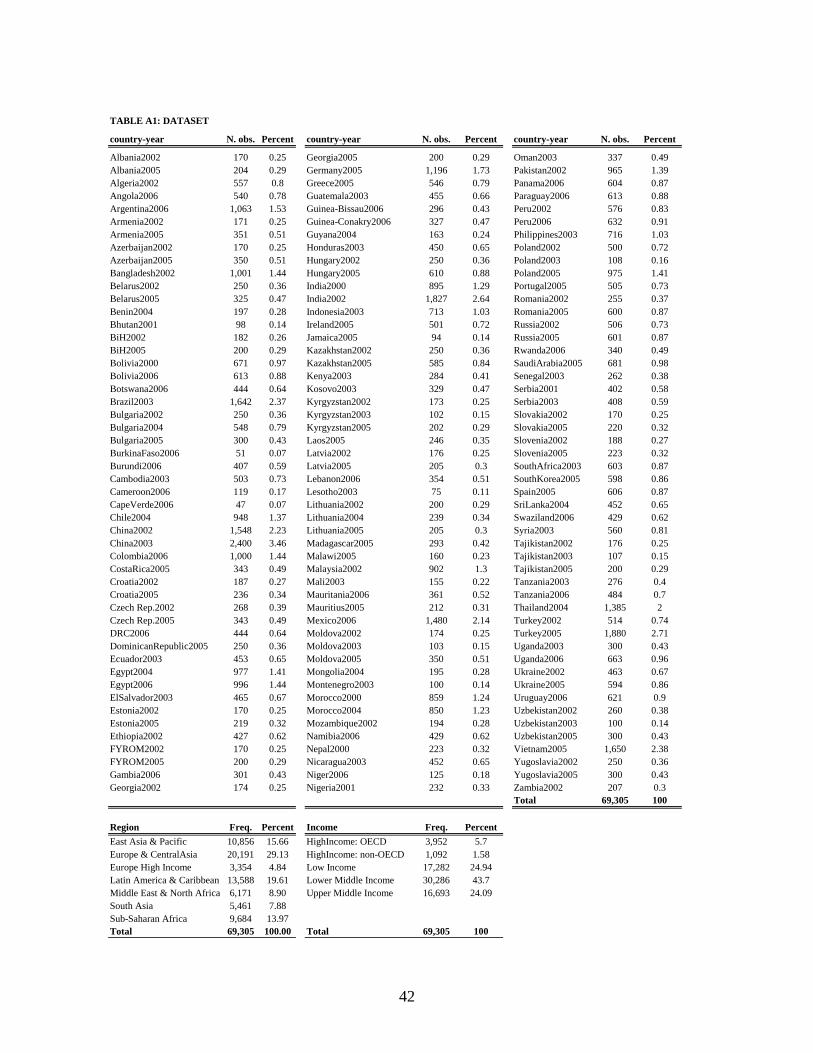
TABLE A1: DATASET
country-year N. obs. Percent country-year N. obs. Percent country-year N. obs. Percent
Albania2002 170 0.25 Georgia2005 200 0.29 Oman2003 337 0.49Albania2005 204 0.29 Germany2005 1,196 1.73 Pakistan2002 965 1.39Algeria2002 557 0.8 Greece2005 546 0.79 Panama2006 604 0.87Angola2006 540 0.78 Guatemala2003 455 0.66 Paraguay2006 613 0.88Argentina2006 1,063 1.53 Guinea-Bissau2006 296 0.43 Peru2002 576 0.83Armenia2002 171 0.25 Guinea-Conakry2006 327 0.47 Peru2006 632 0.91Armenia2005 351 0.51 Guyana2004 163 0.24 Philippines2003 716 1.03Azerbaijan2002 170 0.25 Honduras2003 450 0.65 Poland2002 500 0.72Azerbaijan2005 350 0.51 Hungary2002 250 0.36 Poland2003 108 0.16Bangladesh2002 1,001 1.44 Hungary2005 610 0.88 Poland2005 975 1.41Belarus2002 250 0.36 India2000 895 1.29 Portugal2005 505 0.73Belarus2005 325 0.47 India2002 1,827 2.64 Romania2002 255 0.37Benin2004 197 0.28 Indonesia2003 713 1.03 Romania2005 600 0.87Bhutan2001 98 0.14 Ireland2005 501 0.72 Russia2002 506 0.73BiH2002 182 0.26 Jamaica2005 94 0.14 Russia2005 601 0.87BiH2005 200 0.29 Kazakhstan2002 250 0.36 Rwanda2006 340 0.49Bolivia2000 671 0.97 Kazakhstan2005 585 0.84 SaudiArabia2005 681 0.98Bolivia2006 613 0.88 Kenya2003 284 0.41 Senegal2003 262 0.38Botswana2006 444 0.64 Kosovo2003 329 0.47 Serbia2001 402 0.58Brazil2003 1,642 2.37 Kyrgyzstan2002 173 0.25 Serbia2003 408 0.59Bulgaria2002 250 0.36 Kyrgyzstan2003 102 0.15 Slovakia2002 170 0.25Bulgaria2004 548 0.79 Kyrgyzstan2005 202 0.29 Slovakia2005 220 0.32Bulgaria2005 300 0.43 Laos2005 246 0.35 Slovenia2002 188 0.27BurkinaFaso2006 51 0.07 Latvia2002 176 0.25 Slovenia2005 223 0.32Burundi2006 407 0.59 Latvia2005 205 0.3 SouthAfrica2003 603 0.87Cambodia2003 503 0.73 Lebanon2006 354 0.51 SouthKorea2005 598 0.86Cameroon2006 119 0.17 Lesotho2003 75 0.11 Spain2005 606 0.87CapeVerde2006 47 0.07 Lithuania2002 200 0.29 SriLanka2004 452 0.65Chile2004 948 1.37 Lithuania2004 239 0.34 Swaziland2006 429 0.62China2002 1,548 2.23 Lithuania2005 205 0.3 Syria2003 560 0.81China2003 2,400 3.46 Madagascar2005 293 0.42 Tajikistan2002 176 0.25Colombia2006 1,000 1.44 Malawi2005 160 0.23 Tajikistan2003 107 0.15CostaRica2005 343 0.49 Malaysia2002 902 1.3 Tajikistan2005 200 0.29Croatia2002 187 0.27 Mali2003 155 0.22 Tanzania2003 276 0.4Croatia2005 236 0.34 Mauritania2006 361 0.52 Tanzania2006 484 0.7Czech Rep.2002 268 0.39 Mauritius2005 212 0.31 Thailand2004 1,385 2Czech Rep.2005 343 0.49 Mexico2006 1,480 2.14 Turkey2002 514 0.74DRC2006 444 0.64 Moldova2002 174 0.25 Turkey2005 1,880 2.71DominicanRepublic2005 250 0.36 Moldova2003 103 0.15 Uganda2003 300 0.43Ecuador2003 453 0.65 Moldova2005 350 0.51 Uganda2006 663 0.96Egypt2004 977 1.41 Mongolia2004 195 0.28 Ukraine2002 463 0.67Egypt2006 996 1.44 Montenegro2003 100 0.14 Ukraine2005 594 0.86ElSalvador2003 465 0.67 Morocco2000 859 1.24 Uruguay2006 621 0.9Estonia2002 170 0.25 Morocco2004 850 1.23 Uzbekistan2002 260 0.38Estonia2005 219 0.32 Mozambique2002 194 0.28 Uzbekistan2003 100 0.14Ethiopia2002 427 0.62 Namibia2006 429 0.62 Uzbekistan2005 300 0.43FYROM2002 170 0.25 Nepal2000 223 0.32 Vietnam2005 1,650 2.38FYROM2005 200 0.29 Nicaragua2003 452 0.65 Yugoslavia2002 250 0.36Gambia2006 301 0.43 Niger2006 125 0.18 Yugoslavia2005 300 0.43Georgia2002 174 0.25 Nigeria2001 232 0.33 Zambia2002 207 0.3
Total 69,305 100
Region Freq. Percent Income Freq. PercentEast Asia & Pacific 10,856 15.66 HighIncome: OECD 3,952 5.7Europe & CentralAsia 20,191 29.13 HighIncome: non-OECD 1,092 1.58Europe High Income 3,354 4.84 Low Income 17,282 24.94Latin America & Caribbean 13,588 19.61 Lower Middle Income 30,286 43.7Middle East & North Africa 6,171 8.90 Upper Middle Income 16,693 24.09South Asia 5,461 7.88Sub-Saharan Africa 9,684 13.97Total 69,305 100.00 Total 69,305 100
42

TABLE A2: STRATIFICATION OF DATA BY FIRM CHARACTERISTICS
SIZE CLASSES AGE CLASSESsize Freq. Percent Cum. age Freq. Percent Cum.micro 1-10 20,289 29.27 29.27 young 1-5 13,286 19.17 19.17small 11-50 23,770 34.3 63.57 mature 6-15 30,871 44.54 63.71medium 51-200 13,211 19.06 82.63 older +16 24,400 35.21 98.92large 201-500 5,650 8.15 90.79 unknown 748 1.08 100very large +500 3,904 5.63 96.42 Total 69,305 100unknown 2,481 3.58 100Total 69,305 100
EXPORT ACTIVITY FOREIGN OWNERSHIPFreq. Percent Cum. Freq. Percent Cum.
non-exporter 53,639 77.4 77.4 domestic 59,622 86.03 86.03exporter 13,609 19.64 97.03 foreign 8,806 12.71 98.73unknown 2,057 2.97 100 unknown 877 1.27 100Total 69,305 100 Total 69,305 100
EXPORT-FOREIGN (frequency) LOCATIONFreq. Percent Cum. Freq. Percent Cum.
domestic foreign Total capital/+1mn 36,623 52.84 52.84non-exporter 48,500 4,852 53,352 small city 27,200 39.25 92.09exporter 9,664 3,713 13,377 unknown 5,482 7.91 100Total 58,164 8,565 66,729 Total 69,305 100
INDUSTRY 2-DIGIT INDUSTRY-CLASSIFICATIONFreq. Percent Cum. Freq. Percent Cum.
Textiles 4,488 6.48 6.48 capital-intense 21,263 30.68 65Leather 1,255 1.81 8.29 labor-intense 23,783 34.32 34.32Garments 7,105 10.25 18.54 services 18,791 27.11 92.11Agroindustry 7,150 10.32 28.86 unknown 5,468 7.89 100Beverages 1,764 2.55 31.4 Total 69,305 100Metals&Machin 6,269 9.05 40.45Electronics 2,150 3.1 43.55Chem&Phamar 3,693 5.33 48.88Construction 3,519 5.08 53.95Wood&Furnit 3,847 5.55 59.51Non-metal&plastic 3,292 4.75 64.26Paper 677 0.98 65.23BusServices 2,953 4.26 69.49Other-Manufact 1,803 2.6 72.09Adds-Marketing 693 1 73.09otherservices 2,544 3.67 76.77Retail&wholesale 8,821 12.73 89.49Hotel&Restaurants 2,275 3.28 92.78Transport 1,505 2.17 94.95Mining&quarring 240 0.35 95.29OtherTransportEquip 1,553 2.24 97.53unknown 1,709 2.47 100Total 69,305 100
43