Investment and capacity trends in agricultural R&D: New evidence for West Asia and North Africa
21
Investment and capacity trends in agricultural R&D: New evidence for West Asia and North Africa USDA-ERS seminar Washington, DC | 18 May 2015 Gert-Jan Stads Senior Program Manager International Food Policy Research Institute Agricultural Science and Technology Indicators
-
Upload
asti -
Category
Economy & Finance
-
view
172 -
download
0
Transcript of Investment and capacity trends in agricultural R&D: New evidence for West Asia and North Africa
Investment and capacity trends in agricultural R&D: New evidence for West Asia and North Africa
USDA-ERS seminar
Washington, DC | 18 May 2015
Gert-Jan StadsSenior Program ManagerInternational Food Policy Research Institute
Agricultural Science and Technology Indicators

Why monitor agricultural R&D resources?
Challenges:
- Rapid population growth
- Climate change
- Degradation of land and water resources
- Food price volatility
Agricultural R&D is a major contributor to productivity growth, food security, and poverty reduction
Quantitative data are essential for stakeholders to be able to analyze trends in agricultural R&D capacity and investments; identify gaps; set future investment priorities; and better coordinate agricultural R&D across institutes, regions, and commodities
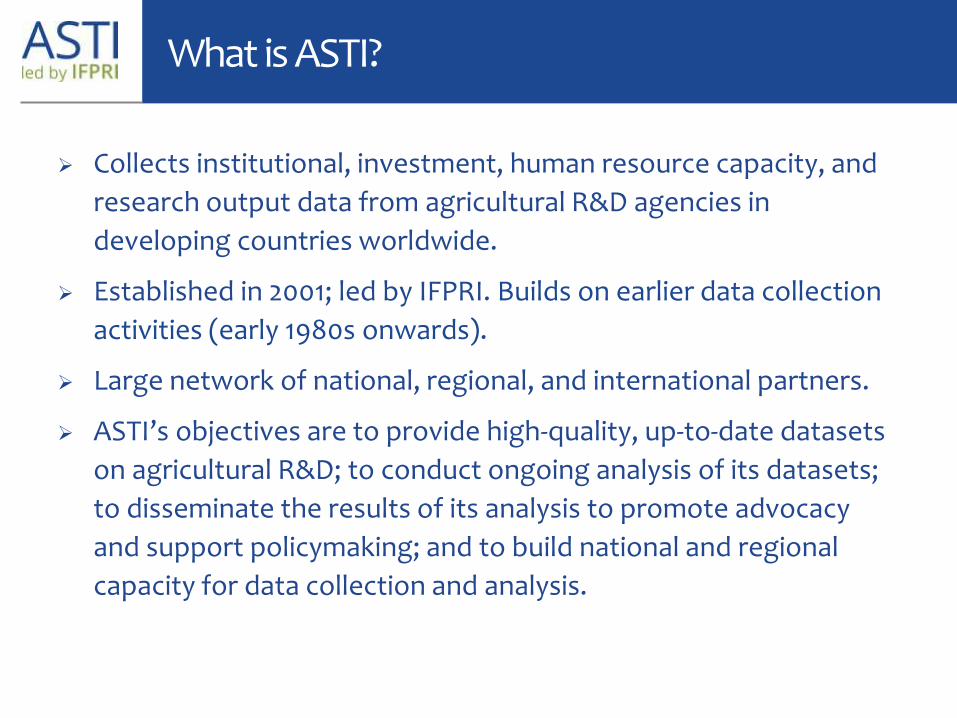
What is ASTI?
Collects institutional, investment, human resource capacity, and
research output data from agricultural R&D agencies in
developing countries worldwide.
Established in 2001; led by IFPRI. Builds on earlier data collection
activities (early 1980s onwards).
Large network of national, regional, and international partners.
ASTI’s objectives are to provide high-quality, up-to-date datasets
on agricultural R&D; to conduct ongoing analysis of its datasets;
to disseminate the results of its analysis to promote advocacy
and support policymaking; and to build national and regional
capacity for data collection and analysis.

ASTI Methodology
ASTI data collected based on internationally accepted
definitions and statistical procedures for compiling S&T
statistics (OECD’s Frascati Manual)
This facilitates comparisons of ASTI datasets with other
relevant S&T datasets
FAO definition of agriculture: crops, livestock, forestry,
fisheries, natural resources, etc.
ASTI provides:
Trends over time at country / regional levels
Comparisons within and across countries / regions

ASTI outputs
• Country factsheets
• Regional and global reports
• Downloadable datasets
• Analytical assessments
• Seminars and presentations
• Press releases/media outreach
• ASTI website (www.asti.cgiar.org)
ASTI indicators
• Institutional arrangements• R&D spending by cost category• Funding sources• R&D staff by degree, gender, and age• R&D focus by commodity and theme• Output indicators
ASTI outputs
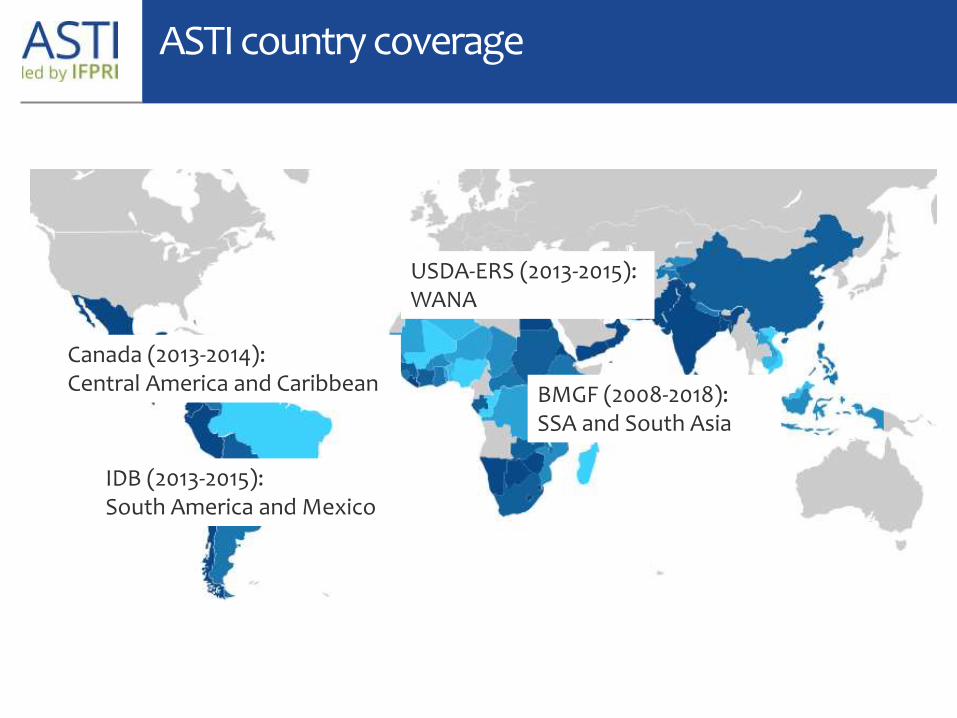
ASTI country coverage
BMGF (2008-2018):SSA and South Asia
USDA-ERS (2013-2015):WANA
IDB (2013-2015):South America and Mexico
Canada (2013-2014):Central America and Caribbean
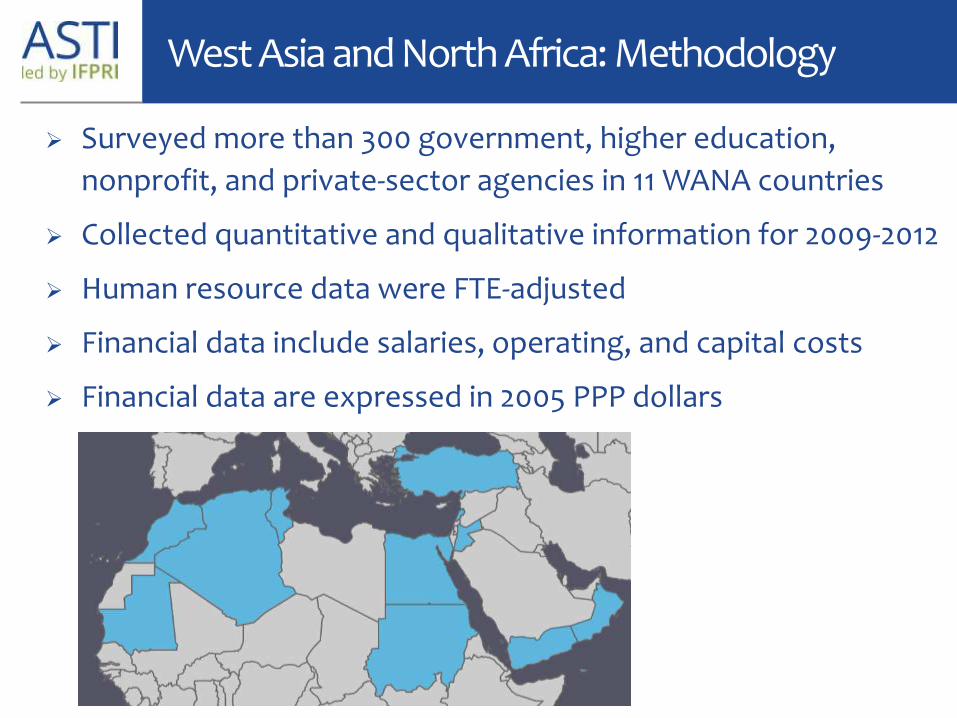
West Asia and North Africa: Methodology
Surveyed more than 300 government, higher education,
nonprofit, and private-sector agencies in 11 WANA countries
Collected quantitative and qualitative information for 2009-2012
Human resource data were FTE-adjusted
Financial data include salaries, operating, and capital costs
Financial data are expressed in 2005 PPP dollars

Policy Context of Agricultural R&D in WANA
Of the 11 countries included in ASTI analysis, 4 do not have official national science, technology, and innovation policies
In several of the countries that do, policies focus on innovation at the macro level without offering sufficient guidelines or incentives to individual sectors
Agriculture-related priorities are not always satisfactorily embedded within national S&T policies, with the result that decisionmaking is fragmented and coordination among relevant actors is lacking
Most countries in the region lack policies to stimulate private agricultural R&D and innovation
Morocco, Oman, Tunisia, and Turkey have strongest policy frameworks

Agricultural R&D remains a public-sector affair

Good news: Recent increases in R&D capacity
+26%
+61%
+26%
+1%
+8%
+26%
+7%
+16%
+1%
+17%
+30%
0 2,000 4,000 6,000 8,000 10,000
Mauritania
Lebanon
Oman
Jordan
Yemen
Tunisia
Morocco
Algeria
Sudan
Turkey
Egypt
Full-time equivalent agricultural researchers
2012 2009
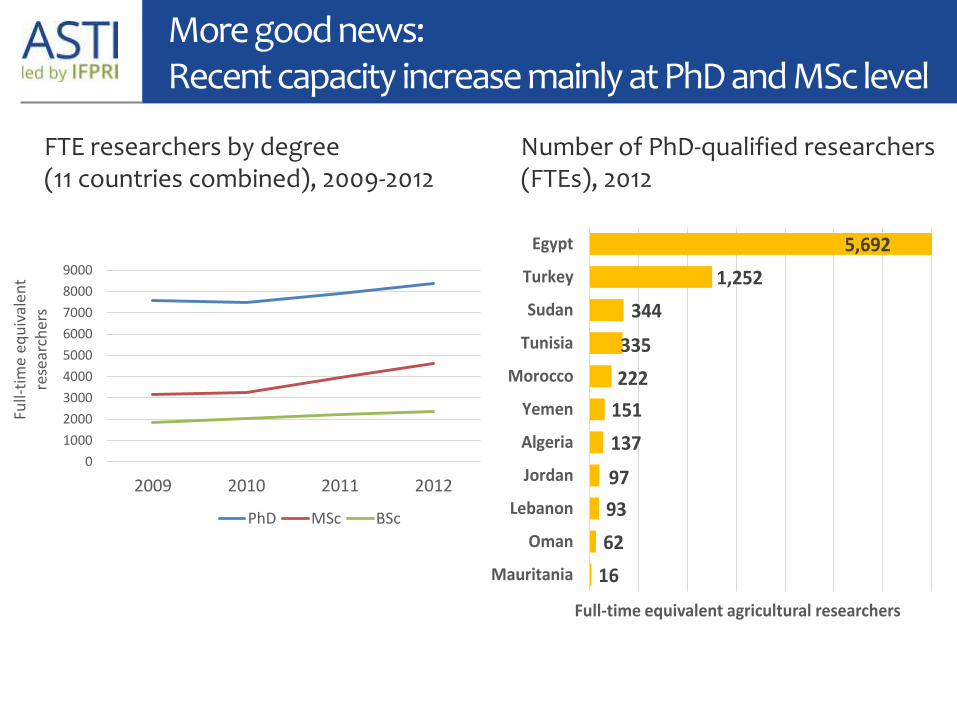
More good news: Recent capacity increase mainly at PhD and MSc level
0
1000
2000
3000
4000
5000
6000
7000
8000
9000
2009 2010 2011 2012
Full-
tim
e eq
uiv
ale
nt
rese
arch
ers
PhD MSc BSc
FTE researchers by degree (11 countries combined), 2009-2012
Number of PhD-qualified researchers (FTEs), 2012
16
62
93
97
137
151
222
335
344
1,252
5,692
Mauritania
Oman
Lebanon
Jordan
Algeria
Yemen
Morocco
Tunisia
Sudan
Turkey
Egypt
Full-time equivalent agricultural researchers
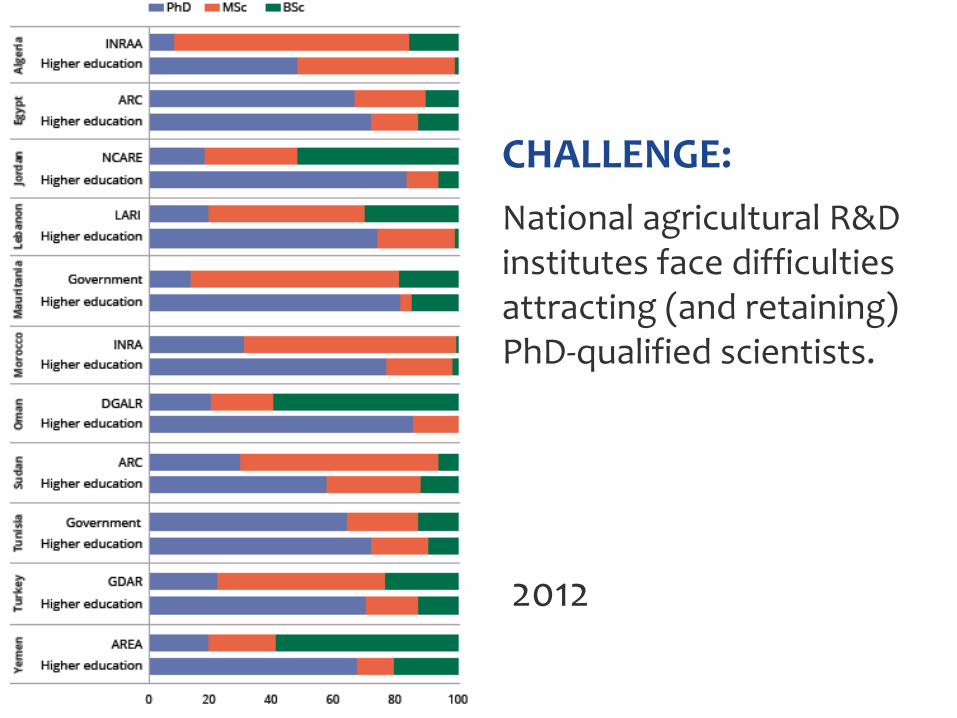
MAIN
CHALLENGE:
National agricultural R&D institutes face difficulties attracting (and retaining) PhD-qualified scientists.
2012
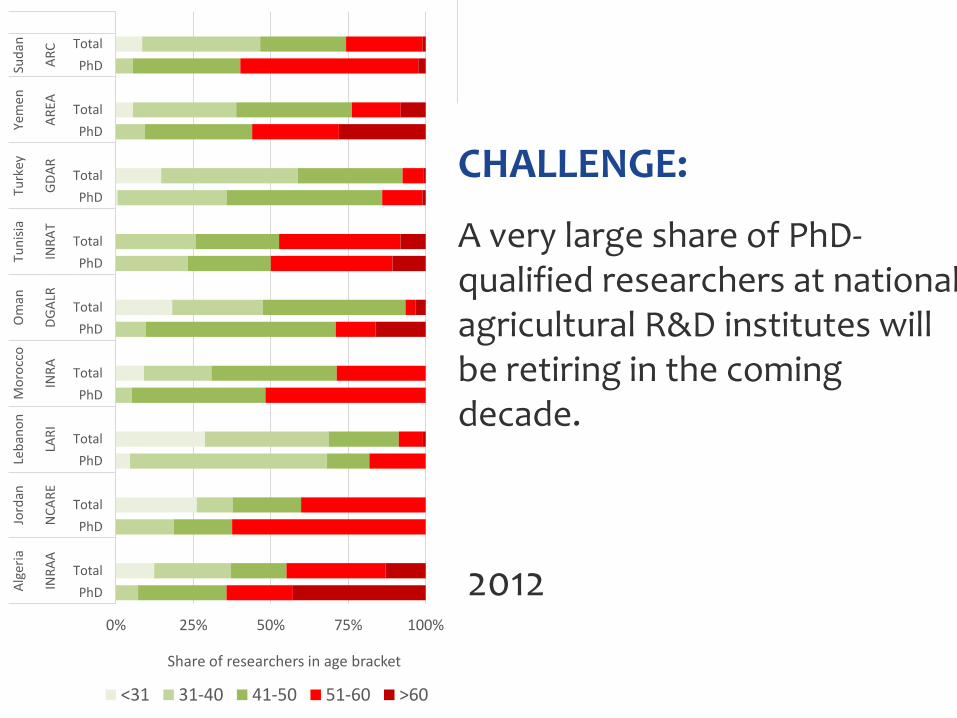
CHALLENGE:
A very large share of PhD-qualified researchers at national agricultural R&D institutes will be retiring in the coming decade.
0% 25% 50% 75% 100%
PhD
Total
PhD
Total
PhD
Total
PhD
Total
PhD
Total
PhD
Total
PhD
Total
PhD
Total
PhD
TotalIN
RA
AN
CA
RE
LAR
IIN
RA
DG
ALR
INR
AT
GD
AR
AR
EAA
RC
Alg
eria
Jord
anLe
ban
on
Mo
rocc
oO
man
Tun
isia
Turk
eyYe
me
nSu
dan
Share of researchers in age bracket
<31 31-40 41-50 51-60 >60
2012
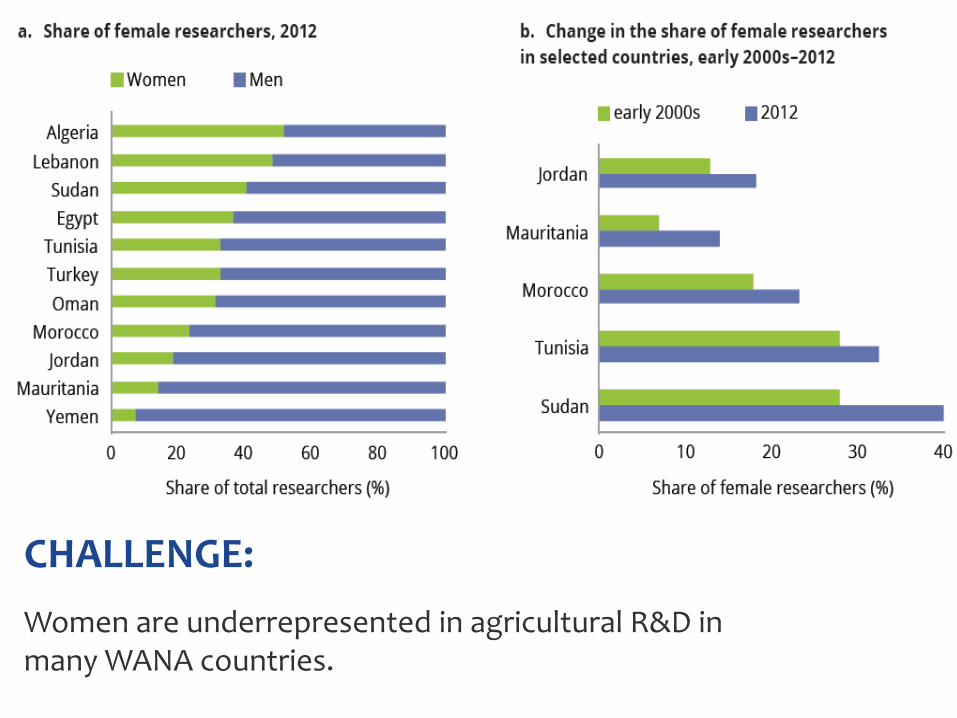
CHALLENGE:
Women are underrepresented in agricultural R&D in many WANA countries.

Uneven growth in agricultural R&D investment
-21%
-43%
-5%
+57%
-28%
+13%
+19%
+19%
+3%
0%
+24%
0 100 200 300 400 500
Mauritania
Sudan
Jordan
Lebanon
Yemen
Tunisia
Algeria
Oman
Morocco
Turkey
Egypt
million PPP dollars; 2005 prices
2012 2009

Widespread underinvestment prevails
0.19
0.21
0.440.49
0.51
0.56
0.64
0.800.95
1.84
6.51
0 1 2 3 4 5 6 7 8
Sudan
Algeria
Egypt
Morocco
Turkey
Yemen
Tunisia
Mauritania
Lebanon
Jordan
Oman
Agricultural R&D spending as apercentage of AgGDP (%)
Caution when analyzing research intensity ratios!
2012

Salaries account for bulk of R&D spending
Spending by cost category for main agricultural R&D agencies, 2009-2012
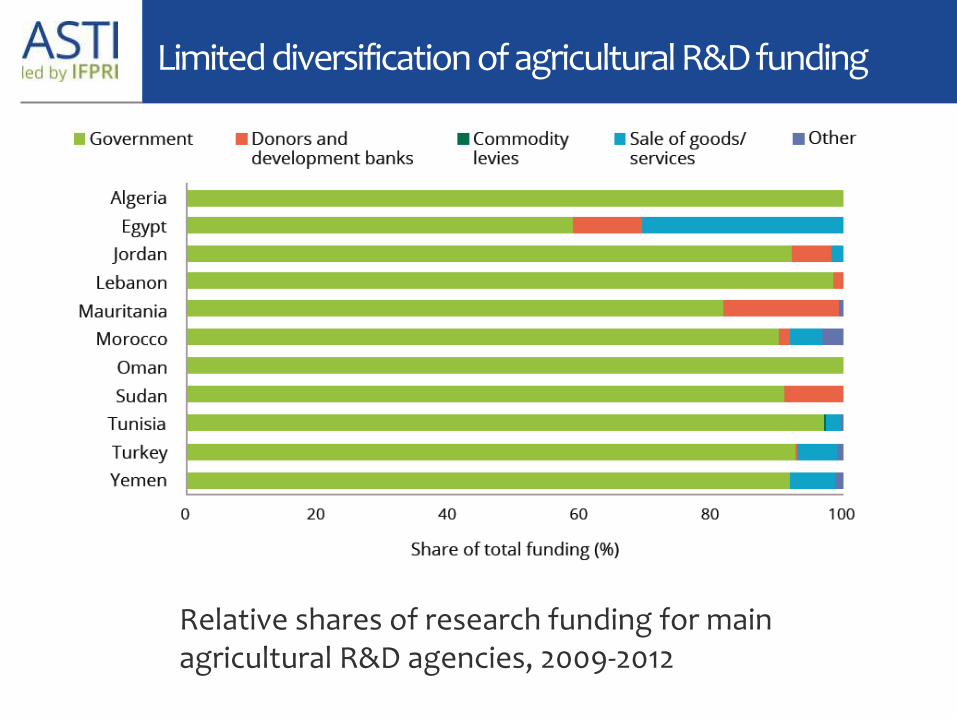
Limited diversification of agricultural R&D funding
Relative shares of research funding for main agricultural R&D agencies, 2009-2012

Policy Implications
Governments must address underinvestment in agricultural
R&D and take the necessary policy steps to diversify funding
sources
Governments must invest in training and capacity building and
remove status and salary discrepancies between government-
and university-based researchers
Governments must develop long-term national agricultural
research policy agendas and provide stronger institutional,
financial, and infrastructural support to NARIs
Governments must strengthen research linkages at the
regional and international level
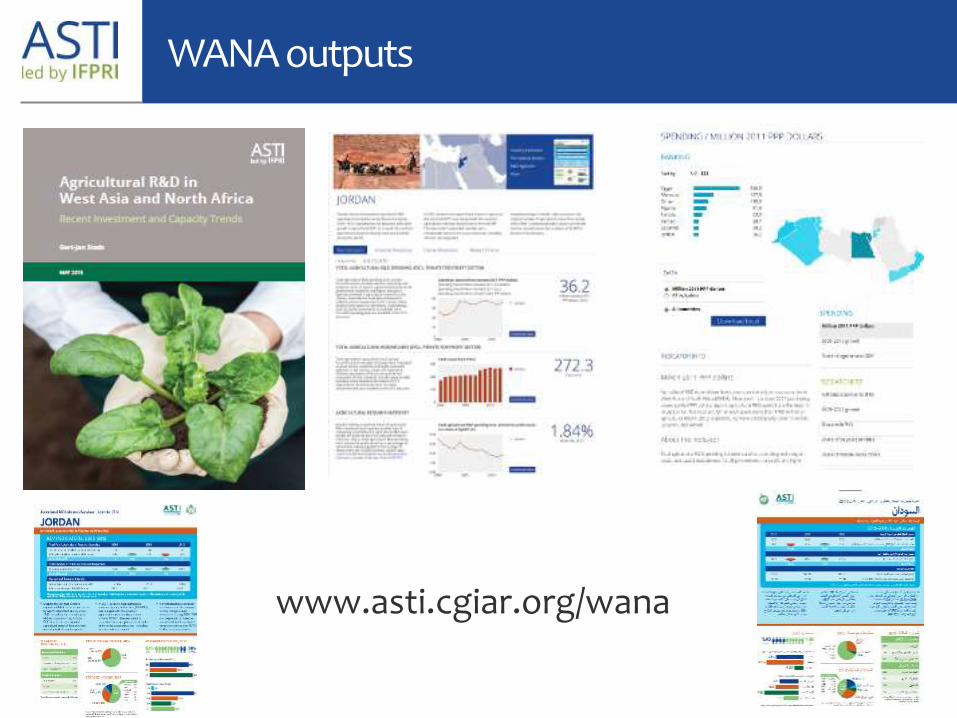
WANA outputs
www.asti.cgiar.org/wana

Thank you
www.asti.cgiar.org