
Investment Allocation and Performance in Venture Capital Equity/PE_Materials/9... · Investment...
55
Investment Allocation and Performance in Venture Capital Scott Hsu, Vikram Nanda, Qinghai Wang * February, 2018 Abstract We study venture capital investment decisions within and across funds of VC firms. We propose an investment allocation model in which VCs, with overlapping funds, are judged primarily on success of their newest funds. This induces VCs to allocate their best invest- ment opportunities to newly-raised funds. Empirical evidence is supportive: investments in a VC’s newly-raised funds are more successful than concurrent investments in older funds. Consequently, investment allocation leads to funds’ early investments being more successful than its later investments. Finally, VC performance persistence across successive funds is driven almost entirely by the success of early investments in these funds. Keywords: Venture Capital, Investment Decision, Investment Performance JEL Codes: G20, G24, G30 * Scott Hsu: Sam M. Walton College of Business, University of Arkansas, Fayetteville, AR 72701. Email: [email protected]; Phone: (479)575-2316. Vikram Nanda: Naveen Jindal School of Business, University of Texas at Dallas, 800 W Campbell Road, Richardson, TX 75080. E-mail: [email protected]. Phone: (972)883-5004; Qinghai Wang: College of Business Administration, University of Central Florida, P.O. Box 161400, Orlando, FL 32816. E-mail: [email protected]. Phone: (407)823-6453. We thank Bang Dang Nguyen, Vladimir Gatchev, Debarshi Nandy, Jay Ritter, Ajai Singh, Xuan Tian, and seminar participants at Georgia Institute of Technology, Tsinghua University, University of Central Florida, 2017 Financial Management Association Asia Annual Meetings, 2017 Northern Finance Association Annual Meetings for comments.
Transcript of Investment Allocation and Performance in Venture Capital Equity/PE_Materials/9... · Investment...

Investment Allocation and Performance in Venture Capital
Scott Hsu, Vikram Nanda, Qinghai Wang∗
February, 2018
Abstract
We study venture capital investment decisions within and across funds of VC firms. Wepropose an investment allocation model in which VCs, with overlapping funds, are judgedprimarily on success of their newest funds. This induces VCs to allocate their best invest-ment opportunities to newly-raised funds. Empirical evidence is supportive: investments ina VC’s newly-raised funds are more successful than concurrent investments in older funds.Consequently, investment allocation leads to funds’ early investments being more successfulthan its later investments. Finally, VC performance persistence across successive funds isdriven almost entirely by the success of early investments in these funds.
Keywords: Venture Capital, Investment Decision, Investment PerformanceJEL Codes: G20, G24, G30
∗Scott Hsu: Sam M. Walton College of Business, University of Arkansas, Fayetteville, AR 72701. Email:[email protected]; Phone: (479)575-2316. Vikram Nanda: Naveen Jindal School of Business, University ofTexas at Dallas, 800 W Campbell Road, Richardson, TX 75080. E-mail: [email protected]. Phone:(972)883-5004; Qinghai Wang: College of Business Administration, University of Central Florida, P.O. Box161400, Orlando, FL 32816. E-mail: [email protected]. Phone: (407)823-6453. We thank Bang DangNguyen, Vladimir Gatchev, Debarshi Nandy, Jay Ritter, Ajai Singh, Xuan Tian, and seminar participants atGeorgia Institute of Technology, Tsinghua University, University of Central Florida, 2017 Financial ManagementAssociation Asia Annual Meetings, 2017 Northern Finance Association Annual Meetings for comments.

Investment Allocation and Performance in Venture Capital
Abstract
We study venture capital investment decisions within and across funds of VC firms. We proposean investment allocation model in which VCs, with overlapping funds, are judged primarily onsuccess of their newest funds. This induces VCs to allocate their best investment opportunitiesto newly-raised funds. Empirical evidence is supportive: investments in a VC’s newly-raisedfunds are more successful than concurrent investments in older funds. Consequently, investmentallocation leads to funds’ early investments being more successful than its later investments.Finally, VC performance persistence across successive funds is driven almost entirely by thesuccess of early investments in these funds.
Keywords: Venture Capital, Investment Decision, Investment Performance
JEL Classification: G20, G24, G30
1 Introduction
The performance of venture capital (VC) funds is highly persistent across successive funds man-
aged by the same VC firm (see Kaplan and Sensoy (2015) for a review of evidence). Within
this overall pattern of performance predictability, however, we show that there is a stark con-
trast between the performance of investments within and across the funds of the VC firm.
First, there is no persistence in the performance of investments within the same fund. Early
investments of a VC fund are more likely to exit successfully via IPOs or acquisitions than its
later investments, but the success of the early investments does not predict the performance
of a fund’s later investments. Second, if a VC firm is successful in raising a new fund, the
performance of investments in the VC firm’s existing fund, over the same investment period,
compares extremely poorly with those in the new fund. Because of the lack of persistence in
investment performance within a VC fund, the documented persistence in performance across
VC funds is driven almost entirely by their early investments.
What might explain these seemingly contradictory performance patterns? We propose that
the sequential and overlapping manner in which funds are raised by VC firms affects their
investment decisions. VC funds, organized as limited partnerships, usually have a life of ten
years. VC firms that experience investment success, however, often return to investors to
obtain capital commitments for follow-on funds well before their existing funds are dissolved.
As a result, VC firms will often have overlapping funds and the choice of funds through which
to finance and monitor a particular investment. Our contention is that the VC’s ability to
allocate investments between its new and older funds can account for the empirical patterns
noted above. We argue that it may be optimal, in equilibrium, for VCs to direct their better
investment opportunities to newly raised funds, despite adverse performance consequences for
their older funds. Industry publications suggest that it is a familiar notion that VC funds may
be treated differently during periods with overlapping investments. A legal newsletter to VC
fund managers and investors, for instance, suggests the potential for conflicts of interest since
in “funds with overlapping investment periods... a manager can be incentivized to favor one or
more funds it manages over others... depending on how they have been performing or according
1

to their compensation structure.”1
We develop our arguments in the context of an equilibrium model in which market partic-
ipants learn about a VC’s ability based on the success of its investments. Investment failure
precludes the raising of new funds. Investment success, however, leads to a positive reassess-
ment of VC ability and enables the VC to raise a new fund, along with its existing fund. As new
investment opportunities arrive, the VC chooses between allocating more valuable investments
to the newly raised fund or its older fund. Our analysis suggests two reasons for why it may be
optimal for the VC to allocate higher quality investments to the newly raised fund. The first
reason is based on a co-ordination argument regarding learning about VC ability. A VC will
allocate higher quality investments and effort to the new fund if it expects to be primarily as-
sessed on success of its new fund’s investments. Sustaining the equilibrium, market participants
will be especially attentive to the success of the new fund’s investments, if these are the focus
of the VC’s effort and are informative about his ability. Second, the contractual terms (e.g.,
fund size and profit sharing) of the new fund will tend to be somewhat more favorable to the
VC than those of its existing fund. The reason is that the new fund is raised after a successful
investment outcome, when the VC is perceived as being of higher quality. These more favorable
terms will induce the VC to allocate higher quality investments to its new fund.
We show that investment allocation to favor newly established VC funds has some distinct,
testable implications for investment outcomes and fund performance. First, within a VC fund,
its earlier investments will be expected to be more successful than its later investments. As
VC firms direct their better opportunities to newly raised funds, the performance of later in-
vestments in their existing funds will be worse. Second, as a result of investment allocation by
VC firms, investments undertaken by a newly raised fund will perform better than concurrent
investments in its older funds. Finally, the persistence in performance between the early in-
vestments across successive funds of the same VC firm will be stronger than the performance
persistence between the early and later investments within the same fund.
For our empirical analysis, we use a sample of VC investments in 17,154 portfolio companies
by 4,578 funds that belong to 2,617 VC firms. We focus on investments of VC funds as lead VCs.
1See “Managing potential conflicts of interest in investment funds,” Lavery CAPITAL, October 2017.
2

We first document that the early investments of a VC fund are more likely to be successful than
its later investments. In particular, the first investment is more likely to exit through an IPO
or an acquisition than subsequent investments. We find similar evidence on the investment
outcome for a fund’s first year investments compared to its later investments. For the full
sample of VC investments, 37.1% of the first-year investments exit through IPOs or mergers
and acquisitions (M&As), while 28.6% of the later investments exit through the same channels.
The relation between the investment sequence of a VC fund and investment outcome cannot
be explained by VC firm or fund characteristics, VC fund investment horizon in the portfolio
company, or market conditions.
To examine whether and how VC investment allocation affects investment outcomes across
funds, we study investment outcomes in a sample of “paired” VC funds: Consecutive funds
with overlapping investment periods that are managed by the same VC firm. We focus on pairs
of consecutive funds managed by the same VC firm such that the later investment period of the
first (existing) fund corresponds to the early investment period of the second (new) fund. We
find that, for investments made during the overlapping period, the investments of the second
fund are significantly more likely to be successful than those of the first fund. During the
overlapping periods, 36.1% of the investments in the new funds exit via IPOs or acquisitions,
but only 13.7% of the investments in existing funds do so (9.1% vs. 3.5% in exits via IPOs).
The investment allocation effects are stronger if the early investments of the first fund are
eventually successful. When the early investments of the first fund are successful, particularly
via an IPO exit, there tends to be a substantial difference in the ensuing concurrent period
investment performance between the first and the follow-on funds. By contrast, there is consid-
erably less difference in the concurrent period investment outcomes when the early investments
of the first fund are not successful. We also find that the investment allocation effects are
more pronounced for experienced VC firms. These results provide additional support for the
investment allocation hypothesis. VC firms that have access to high quality projects are more
likely to allocate investments across funds.
The allocation of high quality projects across funds can contribute to performance persis-
tence across the successive VC funds. We confirm, using investment outcome as a measure of
3
VC investment performance, that investment performance is highly persistent across VC funds.
Our investigation reveals that such persistence, however, does not exist within a VC fund: early
investment success in a VC fund is not correlated with the outcome of its later investments.
Consistent with the model’s prediction, we show that the early investment success of the pre-
ceding fund strongly predicts the early investment success of the subsequent fund and that
performance persistence across successive funds is stronger for early investments. In fact, the
outcomes of early investments in VC funds are responsible for virtually all of the performance
persistence across successive funds.
VC firms typically seek to raise a new fund before the expiration of the existing fund’s
investment period, and well before the expiration of the existing fund (Gompers and Lerner,
2000). Hence, the outcome or the expected outcome of the early investments can play an
important role in attracting investors to a follow-on fund. Not surprisingly, our analysis on VC
fund raising shows that early investment outcomes in the current fund are positively correlated
with the probability of successful fund raising. The result holds after we include the performance
of the VC firm’s past funds in the regression. These results suggest that VCs may be especially
concerned about a fund’s early investment success and regard it as being critical for future
fundraising. The fact that information on the overall performance of the current VC fund is
unavailable to the market at the time of fund raising also makes such a scenario likely. An
emphasis on early success is consistent with the observed investment allocation across funds:
VC firms would want to allocate their highest quality investments to the fund that was newly
raised.
Overall, the empirical evidence is strongly supportive of the model’s predictions. Early
investments by a VC fund are more likely to exit successfully than its later investments and
the difference in investment performance is at least partly driven by the strategic allocation of
investments across successive VC funds. Because VC firms allocate high quality projects to their
new funds after investment success in existing funds, the probability of successful exits is much
higher for early investments in new funds than for concurrent investments in existing funds.
This investment allocation strategy leads to poor performance of later investments of a VC
fund, bolsters early investment success of the subsequent fund, and contributes to performance
4
persistence across funds of the same VC firm.
Our findings shed light into VC fund performance persistence. Existing studies generally at-
tribute VC fund performance persistence to VC managerial skills (see, e.g., Kaplan and Schoar,
2005, Harris et al., 2014, Ewens and Rhodes-Kropf (2015)) or the matching of VC skills with
the quality of portfolio firms (Sørensen, 2007). Our findings suggest that VC fund perfor-
mance persistence may be affected by factors other than just VC managerial skills. Strategic
investment allocation across funds by VC firms has the effect of smoothing performance across
funds and can contribute to observed fund performance persistence. Hochberg, Ljungqvist, and
Vissing-Jørgensen (2014) argues that investors (limited partners) in existing VC funds may en-
joy hold-up power over VC firms in fund raising and fee setting. While Hochberg, Ljungqvist,
and Vissing-Jørgensen (2014) intends to explain why VC investor demand does not eliminate
(after-fee) performance persistence, we show that VC investment allocation behavior directly
contributes to (before-fee) performance persistence. Furthermore, our model and evidence sug-
gest that VC firms, through investment allocation decisions, could constrain the hold-up power
of the existing investors.
The findings in the paper are particularly important for the interpretation of the evidence
on the performance persistence of overlapping funds. Phalippou (2010) and Korteweg and
Sørensen (2017) argue that exposure to common macroeconomic and financial conditions could
lead to spurious performance persistence in the partially overlapping funds. Korteweg and
Sørensen (2017) estimates that the overlapping effect accounts for a substantial portion (44%)
of the observed autocorrelation in VC fund returns. Our findings, based on the outcome of the
individual investments made during the overlapping period, show that there is little correlation
between the investment performance of the successive funds over the same period. The results
suggest that the overlapping effect in VC performance persistence is not solely due to the
exposure to common factors. The overlapping structure of successive funds can in fact help to
create correlations in returns through investment allocation across these funds.
Our paper is related to recent studies that examine how fundraising incentives affect the
actions of VC funds. Several papers suggest, for instance, that VC funds distort reported
performance prior to fund raising. Jenkinson et al. (2013) show that reported VC interim
5

returns are inflated during fundraising, and Chakraborty and Ewens (2015) find that VC firms
delay revealing negative information about fund performance until after a new fund is raised.
Barber and Yasuda (2017) find that some VC firms manage reported fund investment valuation
in order to raise new funds. These studies examine the effects of fundraising incentives on
investment valuation or reported returns by the VC firms. Our results show that such incentives
can affect VC investment decisions, both in the current fund and in the newly raised fund.
Our study on VC investment decisions expands the literature that examines agency problems
in VCs’ investment and exit decisions in relation to the finite life span of VC funds and the
fundraising incentives of VC firms. For example, Gompers (1996) and Lee and Wahal (2004)
document the effects on VC exit decisions, while Lerner (1995) and Tian (2012) provide evidence
on syndicate decisions. Kandel, Leshchinskii, and Yuklea (2011) show that the finite life span
of VC funds could lead to inefficient VC investment decisions, e.g., abandoning good projects
when VC funds “age.” We show that fund raising incentives have significant impacts on overall
VC investment decisions, both within and across VC funds.
The sequential and overlapping manner in VC fund raising and VC investments have aroused
concerns from investors and regulators. Recently, SEC’s enforcement program has targeted
“crossover” investments in the private equity industry.2 In these “crossover” investments, a
fund joins the follow-on financing rounds of investments made by another fund from its VC
firm. The success of the investment can then be shared by both funds. Conflicts of interest
issues can arise in “crossover” investments due to different investment horizons of the VC funds,
difficulties in the valuation of the portfolio company, and the distribution of costs and fees among
the funds. Compared with “crossover” investments by VC funds, investment allocation across
funds may not trigger immediate concerns of conflicts of interest, but could have implications
for both VC-investor relations and VC-entrepreneur matching.
2See, “Securities Enforcement Forum West 2016 Keynote Address: Private Equity Enforcement”,https://www.sec.gov/news/speech/private-equity-enforcement.html
6

2 A Model of VC Investment Allocation
We sketch a stylized model to develop our intuition and empirical predictions about VC invest-
ment allocation within and across successive funds of a VC firm. VC firms allocate high quality
projects to their newly raised funds in equilibrium. While investment quality is known only to
VCs, investors rationally anticipate the allocation of investments in equilibrium.
2.1 Set-up
We consider a VC firm that, conditional on the success of its investments, engages in raising
(and closing) funds over time. For simplicity, each fund is taken to have a fixed life of two
periods (with three dates). The VC can undertake investments in both periods of a fund. The
VC can also undertake concurrent investments in different funds, if more than one fund is being
managed. All agents are taken to be risk-neutral and the discount rate is set to zero.
Figure 1 illustrates the sequence of funds operated by the VC firm, with two funds operating
at a time. The two-fund assumption is made for tractability and can be justified (discussed
below) on account of limited investment opportunities and cost of fund raising. As shown in
the figure, the first investment round of a new fund (if successfully raised) is concurrent with
the second investment round of the prior fund. For instance, at T = 0, Fund-1 makes its first
investment while Fund-0 makes its second investment. This structure allows for concurrent
investments and, thereby, allocation of investments across funds (indicated by dotted lines in
Figure 1).
2.1.1 Fund Timing and Investments
We describe fund timing and investment in the context of a representative fund, say Fund-1
in Figure 1. Fund-1 is raised on date T = 0, while the prior fund, Fund-0, is in its second
period. At T = 0, Fund-1 makes its initial investment, while Fund-0 makes its second (and
final) investment. Investment outcomes become known one period after the investment is made.
For Fund-1 the outcomes of investments made on dates T = 0 and T = 1 become known to
the VC and Limited Partners (LPs) on dates T = 1 and T = 2, respectively. We assume that
there is no shirking, diversion or other types of agency problem between the VC and LPs. To
7

simplify the exposition, the capital required for each portfolio firm investment is normalized to
$1. To fix the size of each fund, we assume that in any period the first $2 can be raised from
LPs at a normalized cost of zero, with marginal costs increasing sharply thereafter, limiting the
viable size for a VC fund to $2. In addition, there is a fixed cost K associated with creating a
fund. We assume that the anticipated return to LPs can be normalized to 0.3
2.1.2 Investment Opportunities
Investment outcomes are affected by the VC’s ability that can be either g (good) or b (bad).
There are two types of investments: High-quality investments (type-H) and more “ordinary”
or mundane investments (type-O). Both investment types deliver a payoff of V if successful,
and zero otherwise. The quality of the investment is observable to the VC, though not to LPs
and other market participants. The type-O investment is successful with probability η > 0
and, given the mundane nature of the investment, its likelihood of success is not affected by
the VC’s ability. However, VC’s ability is critical for the success of type-H investments (these
require superior venture-related skills): a g-type VC (b-type VC) is successful with a type-H
3We abstract away from modeling bargaining between existing LPs and potential outside investors, as inHochberg, Ljungqvist, and Vissing-Jørgensen (2014). By assuming that existing LPs have better informationabout VC ability and fund outcome, it is possible to introduce bargaining in our model. However, this wouldnot provide any additional insight into investment allocation between funds, as long as it was not possible tocontract on project quality.
8

investment with probability πg (πb). We assume πg > η > πb > 0.
Market participants (including the VC) do not have precise knowledge of the VC’s ability
and update their beliefs based on investment outcomes over time. The likelihood of the VC
being g-type at time t is denoted by θt, which can be interpreted as a measure of the VC’s
reputation. The VC firm receives a flow of two potential investment opportunities on each
investment date, where one is of type-H, while the other is type-O. The NPV of the two types
of investments can be described as follows:
At T = 0, the VC has a perceived ability of θ0, where θ0 is assumed to be sufficiently high
to enable the VC to raise Fund-1. Investment by the VC in a type-H investment at T = 0 is
expected to generate a NPV of:
QH(θ0) = [θ0πg + (1 − θ0)πb]V − 1 (M1)
We define θ∗ such that QH(θ∗) = 0. Given fixed costs for raising a new fund, a VC that is
perceived as having ability θ ≤ θ∗ will no longer be able to raise a new fund on the basis of
type-H investments.
The other type of investment, type-O, is assumed to have a marginally positive NPV, i.e.,
QO = ηV − 1 > 0. The NPV of type-O investments is taken to be small so that VCs of low
ability (θ ≤ θ∗), who might be expected to invest only in type-O projects, are precluded from
raising funds. Specifically, the fixed cost of raising a fund exceeds the NPV of two type-O
investments: K > 2QO. As a result, a VC that is believed to be of low quality will be unable
to raise new funds.
2.1.3 Learning About VC ability
We next characterize learning about the VC’s ability. At T = 0, the VC’s perceived ability
θ0 is assumed to be sufficiently high so that it is optimal for the VC to undertake the type-H
investment at T = 0 (i.e., QH(θ0) > QO.) We analyze the conditions for an equilibrium in
which the VC always chooses to allocate the type-H investment to its newly raised fund – and
its ability is assessed on the basis of the outcomes of the investments in newly raised funds.
While the VC knows the investment type, LPs and other market participants assume that the
VC allocates the type-H investments to the new fund in equilibrium and update their view on
9
his ability accordingly. On date T = 1, when the outcome (success or failure) of the initial
Fund-1 investment becomes known, the VC and existing LPs update their beliefs regarding the
manager’s type using Bayes’s rule (recall that only type-H investments are informative of VC
ability).
If Fund-1’s initial investment fails at T=1
If the initial investment in Fund-1 fails, the posterior on the manager’s type will be:
θ−1 =θ0(1 − πg)
θ0(1 − πg) + (1 − θ0)(1 − πb)< θ0. (M2)
The updating is based on the expected equilibrium allocation by the VC. For simplicity, we
assume that the posterior θ−1 ≤ θ∗, which results in the VC being unable to raise follow-on
funds.4 The VC chooses the type-O investment in Fund-1 on date T = 1 (since theQH(θ−) < 0).
At date T = 2, the fund is closed, assets are distributed and the sequence of fund raising/closing
comes to an end.
If Fund-1’s initial investment is successful:
On the other hand, if the first investment is successful, the posterior on VC ability θ+1 is
given by:
θ+1 =θ0πg
θ0πg + (1 − θ0)πb> θ0. (M3)
In the above equation, the denominator represents the likelihood of a successful outcome, while
the numerator represents the likelihood that the successful outcome was associated with a
g-type VC.
If the initial Fund-1 investment is successful, the VC is expected to be able to raise the
follow-on Fund-2 at T = 1.5 As before, the VC firm is assumed to receive two potential
investment projects (of types H and O) at T = 1 . In the allocation equilibrium we propose
below, the VC firm will allocate the type-H investment to the new Fund-2 and allocate the
type-O investment to Fund-1.
4This will be the case if, for instance, 1−πb1−πg
is sufficiently large. With θ−1 ≤ θ∗ and the fixed cost of establishing
a new fund, the existing LPs will be unwilling to reinvest in the new fund. Hence, in equilibrium new investorswill also choose not to provide capital.
5This follows since θ+ > θ0 and the (starting) assumption is that Fund-1 was raised at t = 0 with VC abilityperceived to be θ0.
10

2.2 VC Firm Investment Allocation in Equilibrium
We propose the existence of an equilibrium, in which the VC firm allocates investments across
successive funds – and where its ability to raise a new fund is strongly affected by the success
of early investments in its funds. For expositional ease, we list below the salient attributes of
this allocation equilibrium. We follow the various stages of Fund-1 that is raised at date T = 0
(see Figure-1). In Appendix A, we discuss the attributes of the equilibrium more fully, along
with necessary conditions for such an equilibrium to exist.
Fund-1 Investment/Outcome Cycle (T=0,1 & 2)
1. On date T = 0:
• VC raises $2 for new Fund-1.
• VC firm allocates its type-H and type-O investments. Only VC knows investmenttype.
– Allocates Type-H investment to newly raised Fund-1.
– Allocates Type-O investment to the existing Fund-0 (its second and last invest-ment).
2. On date T = 1:
• Success or failure of Fund-1’s initial investment (type-H) observed by VC and LPs.
– If Fund-1’s initial investment is successful:
∗ LPs’ posterior on VC ability is higher (θ1 > θ0) and new Fund-2 is raised.
∗ Cycle of investment allocation repeats.
– If Fund-1’s initial investment fails:
∗ LPs’ posterior on VC ability: θ1 < θ∗. (assumption on model parameters).
∗ VC firm is unable to raise new Fund-2.
∗ VC firm allocates remaining $1 to type-O investment in Fund-1.6
• Fund-0 is closed & its assets distributed.
3. On date T = 2:
• On date T = 2, Fund-1 is closed and assets distributed.
6Since H-type investment has a negative NPV when θ1 < θ∗, the VC does not invest in any H-type invest-ments.
11

The equilibrium is discussed in more detail in Appendix A. As we discuss, there are two related
reasons for why it is incentive-compatible for VCs to allocate higher quality investments to newly
raised funds. The first is that a VC has no reason to deviate from the equilibrium allocation if
he expects to be primarily assessed by LPs on the basis of initial investments in the new fund.
Second, the contractual terms of new funds, since they tend to be raised following successful
outcomes in prior funds, will be somewhat more favorable to the VC than those on existing
funds. These more favorable terms will induce the VC to allocate higher quality investments
to its new fund.
2.3 Testable Predictions:
The above model delivers several predictions that we will test in our subsequent empirical
analyses. The first two predictions follow directly from the proposed equilibrium in which the
allocation results in the superior (H-type) investment being undertaken in the newly raised
fund.
Prediction-1: The success rate of the first project (or early projects) in a fund will be
greater than the success rate of the second project (or later projects) in the same fund.
Prediction-2: Among concurrent projects, better quality projects will be allocated to the
new fund, implying that the success rate of the new fund’s initial investments will be greater
than concurrent investments in the prior fund.
For our next prediction, we note that the difference in probability of success across concurrent
projects is expected to be greater when the VC’s assessed ability is higher. The reason is that
a larger θ is associated with a greater likelihood of success, while the type-O investment is
unaffected by θ. Hence, a greater difference in success outcomes will be evident for funds with
higher perceived VC ability. We state:
Prediction-3: The allocation effect across funds will be more apparent when the VC has
a greater assessed ability.
Finally,
12

Prediction-4: The persistence in performance between the first (or early) investments
across successive funds of the same VC firm will be stronger than the performance persistence
between the first (or early) and second (or later) investments in the same fund.
This follows directly from the nature of investment allocations in the proposed equilibrium.
The type-H investments tend to be early investments in newly formed funds, while the type-O
investments are taken up at later stages in the fund’s life. The correlation between the outcomes
of the early (H) investments in consecutive funds of a VC firm will be greater than between its
early (H) and later (O) same-fund investments.
3 Data
The data pertaining to the sample of VC-backed portfolio companies and their VC investors
(both at the fund and firm level) come from the SDC VentureXpert database. Most of the
VC funds are organized as limited partnerships with a 10-year horizon. Therefore, in order to
fully track the performance of a VC fund’s investment sequence over its 10-year life, we obtain
the data of all U.S. based VC funds that started between 1975 and 2000.7 For each VC fund,
we obtain the sample of portfolio companies for which the VC fund is the lead investor. We
focus on investments in which the VC fund serves as lead investor because of our interest in the
investment selection and allocation decisions of VC funds. Following the literature, we identify
the lead VC as the investor whose VC fund made the largest investment in the first financing
round of the portfolio company. If multiple VC funds meet this criterion, the one that made
the largest overall investments in the portfolio company in question is identified as the lead VC.
The final sample contains 17,154 portfolio companies lead-invested by 4,578 funds that belong
to 2,617 VC firms.
Table 1 provides the summary statistics of the characteristics of VC firms and their funds
and portfolio companies in the full sample. On average, a VC fund serves as the lead investor
of 3.75 portfolio companies throughout its life with a median of two portfolio companies. At
the VC firm level, the average number of companies invested in as a lead investor by a VC firm
7We define a fund’s starting year as the earlier of (1) the fund’s vintage year obtained in the VentureXpertdatabase, and (2) the year in which the fund makes its first investment.
13
amounts to 6.55 in the sample. In what follows, we describe in detail the variables we specify
at the VC fund, VC firm, and portfolio company levels.
3.1 VC funds and VC firms
We first describe the variables that represent the characteristics of VC funds and VC firms. At
the fund level, we obtain fund size and a seed or early stage fund dummy variable that is equal
to 1 if the fund’s investment focus is seed or early stage companies. These characteristics are
correlated with VC investment strategy and performance. The literature finds, for instance, that
the size of a VC fund is related to investment performance at the fund or portfolio company level
(Kaplan and Schoar, 2005, Sørensen, 2007, Hochberg, Ljungqvist, and Lu, 2007). On the other
hand, VC funds that focus on seed or early stage companies could perform worse because of the
high failure rates of these types of investments (Hochberg, Ljungqvist, and Lu, 2007). Table 1
reports that the average fund size in the sample is 250.24 million dollars. Further, 30.97% are
seed and early startup funds. At the firm level, the mean capital under management for the
VC firms is 1,069.99 million dollars based on information at the end of the sample period.8
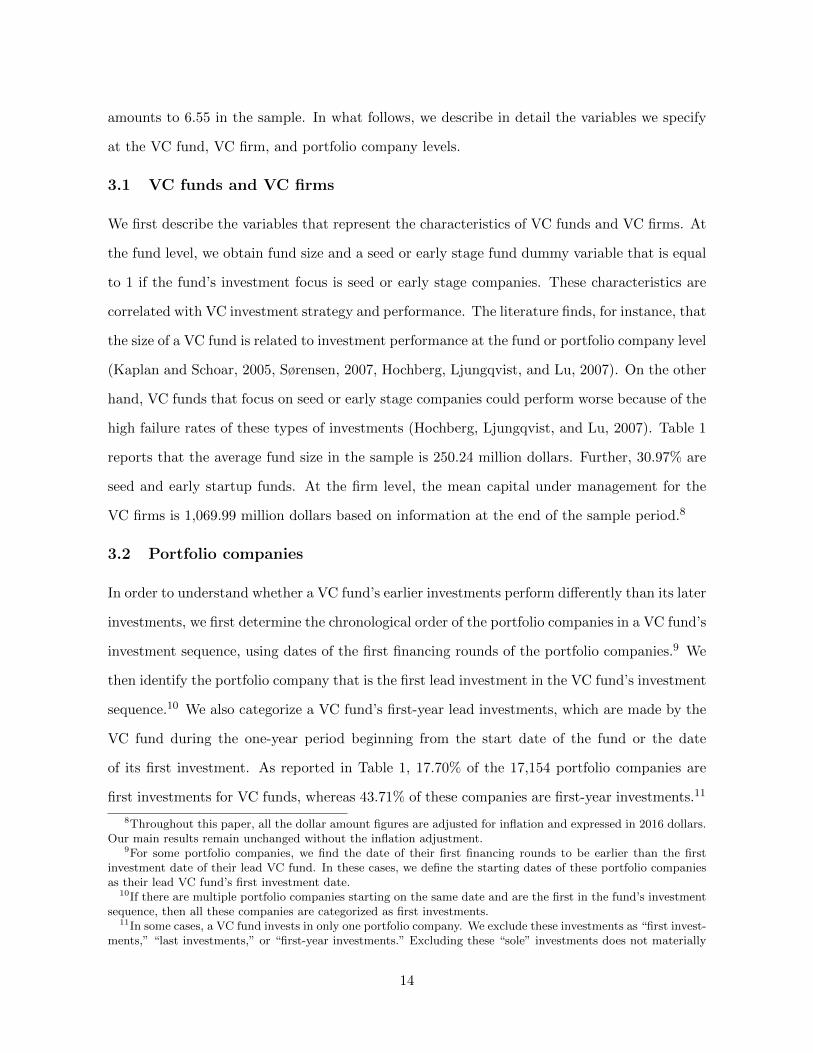
3.2 Portfolio companies
In order to understand whether a VC fund’s earlier investments perform differently than its later
investments, we first determine the chronological order of the portfolio companies in a VC fund’s
investment sequence, using dates of the first financing rounds of the portfolio companies.9 We
then identify the portfolio company that is the first lead investment in the VC fund’s investment
sequence.10 We also categorize a VC fund’s first-year lead investments, which are made by the
VC fund during the one-year period beginning from the start date of the fund or the date
of its first investment. As reported in Table 1, 17.70% of the 17,154 portfolio companies are
first investments for VC funds, whereas 43.71% of these companies are first-year investments.11
8Throughout this paper, all the dollar amount figures are adjusted for inflation and expressed in 2016 dollars.Our main results remain unchanged without the inflation adjustment.
9For some portfolio companies, we find the date of their first financing rounds to be earlier than the firstinvestment date of their lead VC fund. In these cases, we define the starting dates of these portfolio companiesas their lead VC fund’s first investment date.
10If there are multiple portfolio companies starting on the same date and are the first in the fund’s investmentsequence, then all these companies are categorized as first investments.
11In some cases, a VC fund invests in only one portfolio company. We exclude these investments as “first invest-ments,” “last investments,” or “first-year investments.” Excluding these “sole” investments does not materially
14
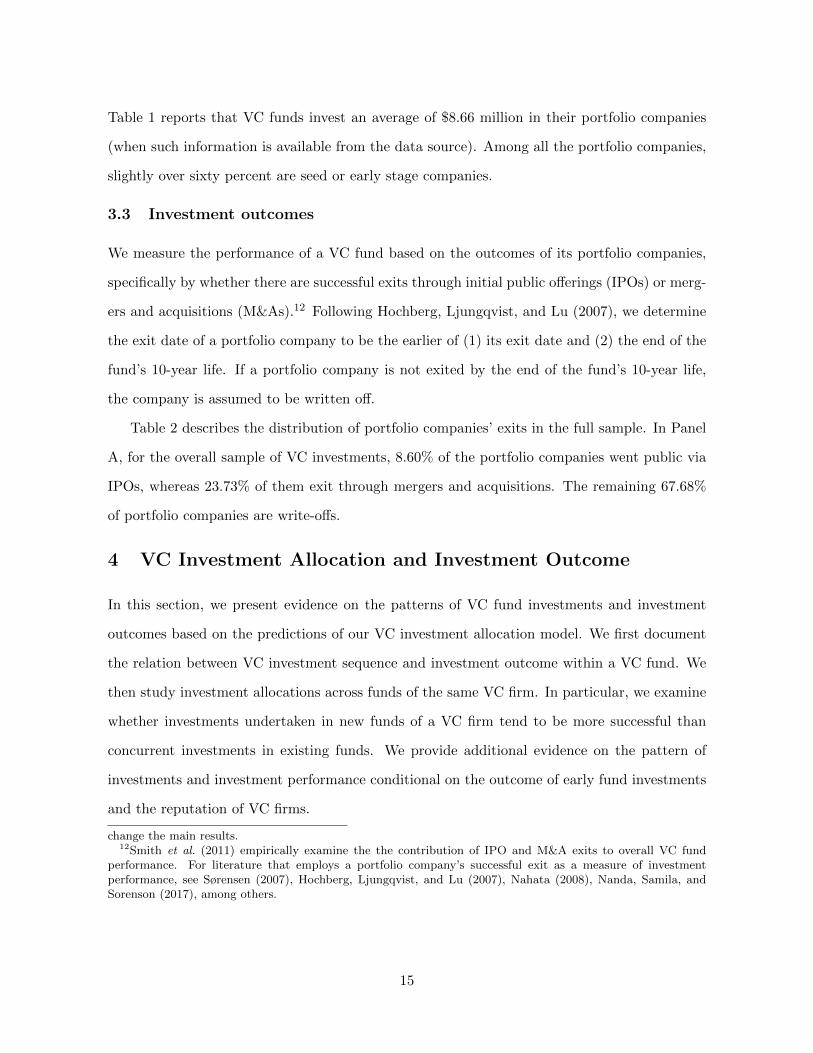
Table 1 reports that VC funds invest an average of $8.66 million in their portfolio companies
(when such information is available from the data source). Among all the portfolio companies,
slightly over sixty percent are seed or early stage companies.
3.3 Investment outcomes
We measure the performance of a VC fund based on the outcomes of its portfolio companies,
specifically by whether there are successful exits through initial public offerings (IPOs) or merg-
ers and acquisitions (M&As).12 Following Hochberg, Ljungqvist, and Lu (2007), we determine
the exit date of a portfolio company to be the earlier of (1) its exit date and (2) the end of the
fund’s 10-year life. If a portfolio company is not exited by the end of the fund’s 10-year life,
the company is assumed to be written off.
Table 2 describes the distribution of portfolio companies’ exits in the full sample. In Panel
A, for the overall sample of VC investments, 8.60% of the portfolio companies went public via
IPOs, whereas 23.73% of them exit through mergers and acquisitions. The remaining 67.68%
of portfolio companies are write-offs.
4 VC Investment Allocation and Investment Outcome
In this section, we present evidence on the patterns of VC fund investments and investment
outcomes based on the predictions of our VC investment allocation model. We first document
the relation between VC investment sequence and investment outcome within a VC fund. We
then study investment allocations across funds of the same VC firm. In particular, we examine
whether investments undertaken in new funds of a VC firm tend to be more successful than
concurrent investments in existing funds. We provide additional evidence on the pattern of
investments and investment performance conditional on the outcome of early fund investments
and the reputation of VC firms.
change the main results.12Smith et al. (2011) empirically examine the the contribution of IPO and M&A exits to overall VC fund
performance. For literature that employs a portfolio company’s successful exit as a measure of investmentperformance, see Sørensen (2007), Hochberg, Ljungqvist, and Lu (2007), Nahata (2008), Nanda, Samila, andSorenson (2017), among others.
15
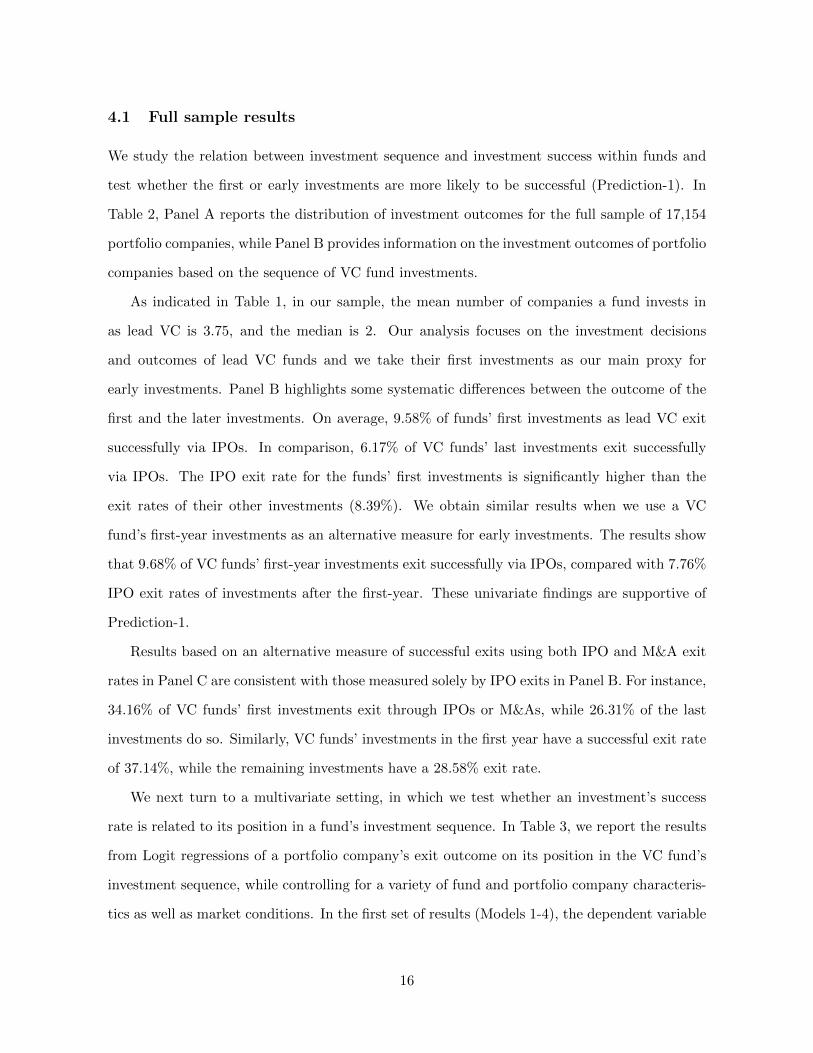
4.1 Full sample results
We study the relation between investment sequence and investment success within funds and
test whether the first or early investments are more likely to be successful (Prediction-1). In
Table 2, Panel A reports the distribution of investment outcomes for the full sample of 17,154
portfolio companies, while Panel B provides information on the investment outcomes of portfolio
companies based on the sequence of VC fund investments.
As indicated in Table 1, in our sample, the mean number of companies a fund invests in
as lead VC is 3.75, and the median is 2. Our analysis focuses on the investment decisions
and outcomes of lead VC funds and we take their first investments as our main proxy for
early investments. Panel B highlights some systematic differences between the outcome of the
first and the later investments. On average, 9.58% of funds’ first investments as lead VC exit
successfully via IPOs. In comparison, 6.17% of VC funds’ last investments exit successfully
via IPOs. The IPO exit rate for the funds’ first investments is significantly higher than the
exit rates of their other investments (8.39%). We obtain similar results when we use a VC
fund’s first-year investments as an alternative measure for early investments. The results show
that 9.68% of VC funds’ first-year investments exit successfully via IPOs, compared with 7.76%
IPO exit rates of investments after the first-year. These univariate findings are supportive of
Prediction-1.
Results based on an alternative measure of successful exits using both IPO and M&A exit
rates in Panel C are consistent with those measured solely by IPO exits in Panel B. For instance,
34.16% of VC funds’ first investments exit through IPOs or M&As, while 26.31% of the last
investments do so. Similarly, VC funds’ investments in the first year have a successful exit rate
of 37.14%, while the remaining investments have a 28.58% exit rate.
We next turn to a multivariate setting, in which we test whether an investment’s success
rate is related to its position in a fund’s investment sequence. In Table 3, we report the results
from Logit regressions of a portfolio company’s exit outcome on its position in the VC fund’s
investment sequence, while controlling for a variety of fund and portfolio company characteris-
tics as well as market conditions. In the first set of results (Models 1-4), the dependent variable
16
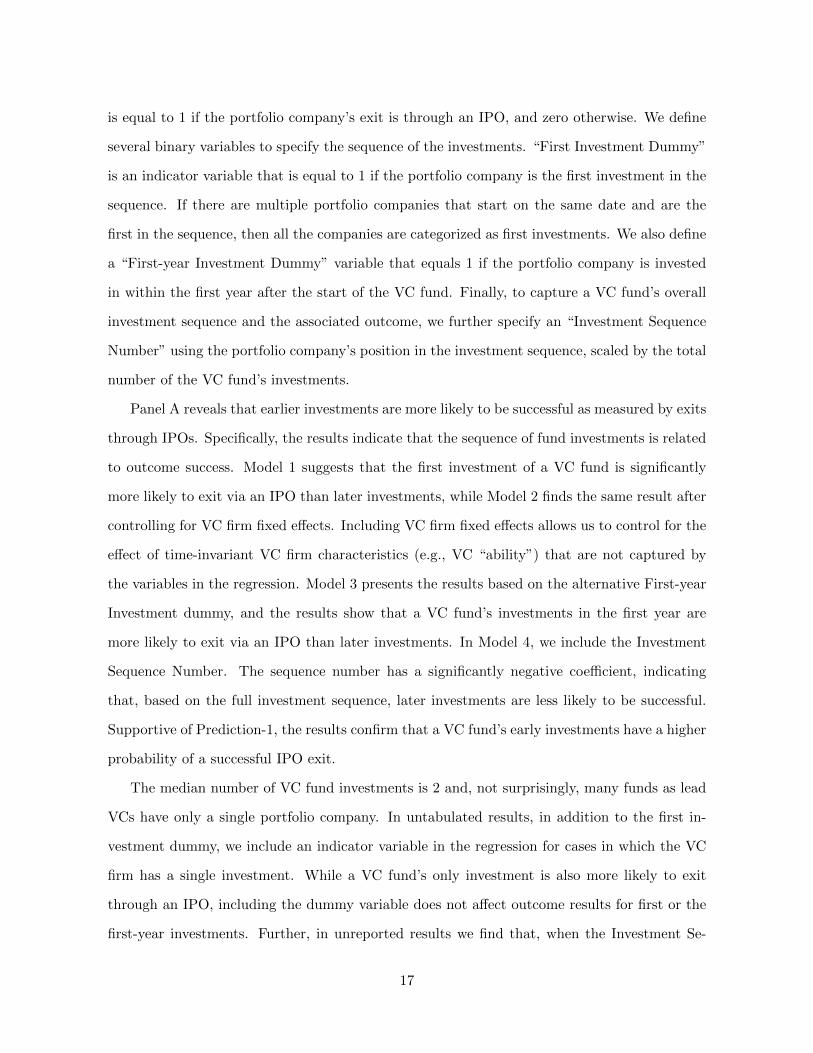
is equal to 1 if the portfolio company’s exit is through an IPO, and zero otherwise. We define
several binary variables to specify the sequence of the investments. “First Investment Dummy”
is an indicator variable that is equal to 1 if the portfolio company is the first investment in the
sequence. If there are multiple portfolio companies that start on the same date and are the
first in the sequence, then all the companies are categorized as first investments. We also define
a “First-year Investment Dummy” variable that equals 1 if the portfolio company is invested
in within the first year after the start of the VC fund. Finally, to capture a VC fund’s overall
investment sequence and the associated outcome, we further specify an “Investment Sequence
Number” using the portfolio company’s position in the investment sequence, scaled by the total
number of the VC fund’s investments.
Panel A reveals that earlier investments are more likely to be successful as measured by exits
through IPOs. Specifically, the results indicate that the sequence of fund investments is related
to outcome success. Model 1 suggests that the first investment of a VC fund is significantly
more likely to exit via an IPO than later investments, while Model 2 finds the same result after
controlling for VC firm fixed effects. Including VC firm fixed effects allows us to control for the
effect of time-invariant VC firm characteristics (e.g., VC “ability”) that are not captured by
the variables in the regression. Model 3 presents the results based on the alternative First-year
Investment dummy, and the results show that a VC fund’s investments in the first year are
more likely to exit via an IPO than later investments. In Model 4, we include the Investment
Sequence Number. The sequence number has a significantly negative coefficient, indicating
that, based on the full investment sequence, later investments are less likely to be successful.
Supportive of Prediction-1, the results confirm that a VC fund’s early investments have a higher
probability of a successful IPO exit.
The median number of VC fund investments is 2 and, not surprisingly, many funds as lead
VCs have only a single portfolio company. In untabulated results, in addition to the first in-
vestment dummy, we include an indicator variable in the regression for cases in which the VC
firm has a single investment. While a VC fund’s only investment is also more likely to exit
through an IPO, including the dummy variable does not affect outcome results for first or the
first-year investments. Further, in unreported results we find that, when the Investment Se-
17

quence Number and the First (or First-year) Investment dummy are included in the regression,
both of them remain significant. This finding suggests that the declining probability of success
is not restricted to the beginning of the investment sequence.
In the regressions in Table 3, we include a “Fund Sequence” variable that is related to VC
firm experience. “Fund Sequence” is the sequence number of a VC fund in the series of funds
raised by the VC firm. “Fund Sequence” is significantly related to investment outcome: VC
firms that have raised more funds in the past are more likely to exit their investment successfully.
Not surprisingly, after controlling for VC firm fixed effects, this variable loses significance. For
IPO exits, fund size is not related to investment outcome, but the dollar amount of investment
in the portfolio company predicts investment outcome. However, because fund investment in a
company reflects both the size of the initial investment and the later accumulated investments,
the investment size effect correlates highly with project quality (Nahata, 2008). We obtain
stronger results for early investments if we do not include the fund investment variable in the
regression. Finally, at the market level, overall IPO activity also has considerable impacts on
VC exits via IPOs (Gompers et al., 2008).
Acquisitions by both public and private companies constitute a sizable portion of VC in-
vestment exits, as indicated in Table 2. Though generally viewed as a less satisfactory outcome
than an IPO, particularly in the early periods of the venture capital industry (see Sahlman,
1990), exits through M&As appear to have replaced IPOs as the most important exit choice
by VCs. While IPOs typically generate the highest returns for VC investments, highly priced
acquisitions can also provide strong returns (Hall and Woodward, 2010). In Models 5 to 8 in
Table 3, Panel A, we report results based on Logit regressions where the dependent variable is
equal to 1 if the portfolio company’s exit is through an IPO or through an acquisition. Results
from this set of models are largely consistent with those based on IPO exits. The regression
results show that investment sequence has significant impacts on investment outcome and that
earlier investments are more likely to be successful through IPO or M&A exits. In the remain-
der of the paper, we use the term IPO/M&A to refer to portfolio company exit through IPOs
or M&As.
In our model we argue that the lower probability of success for a fund’s later investments
18
may result from VC firms allocating their better investments to new funds. However, there
may be non-mutually exclusive alternative explanations for the lower success rate. One such
alternative explanation is that earlier investments may be more likely to succeed as VC funds
have a longer investment management period with the earlier investments. Because the earlier
investments are less affected by the constraints of a 10-year horizon, the longer incubation
periods may allow VC funds to better nurture and develop their investment projects. Hsu
(2013) finds that, in a sample of VC-backed IPOs, investments with longer incubation periods
have more innovations and are more likely to be successful post-IPO. To examine whether the
investment sequence results in Panel A are materially affected by time horizon constraints, we
include a “Time to Investment” variable in the regression to control for such effects.
“Time to Investment” is the number of years from the fund’s starting year to the year of the
initial investment in the portfolio company. It thus provides a measure of the time constraint
the fund faces. Based on this measure, VC funds’ earlier investments have a shorter time to
investment and are less affected by the 10-year time horizon constraints. In all models in Table
3, Panel B, we include the “Time to Investment” variable along with the early investment
variables in the Logit regression. In specifications based on IPO exit (Models 1-4), the early
investment variables (i.e., First Investment, First-year Investments, and Investment Sequence)
remain highly significant, while the “Time to Investment” variable is insignificant. However,
in models based on IPO/M&A exit (Models 5-8), both the early investment variables and the
“Time to Investment” variable are significantly related to investment outcome. The results,
therefore, suggest that the relation between investment sequence and the investment outcome
is not simply driven by the time constraints VC funds face in nurturing their investments. While
such constraints could play a role in the investment outcome, investment sequence appears to
be a much stronger predictor of investment outcome than time constraints.
4.2 “Paired” sample results
Our results so far indicate that the investment sequence within a VC fund predicts the invest-
ment outcome, i.e., earlier fund investments are more likely to exit successfully. Our hypothesis
is that this pattern could be the result of VC firms steering the best investment opportunities
19
to their new funds (Prediction-2). However, a non-mutually exclusive explanation is that VCs
follow a strategy of first investing in the best projects available to them, while deferring less
attractive opportunities. The quality of available investments declines if, for instance, there is
insufficient arrival of new high quality firms seeking capital. As a result, it is conceivable that
VCs go down the ladder in terms of investment quality in their portfolio companies. This would
imply that later investments tend to be less successful than the earlier ones, whether undertaken
in the same fund or elsewhere in the VC firm. We refer to this as the “diminishing-quality”
alternative explanation. While the two explanations are not mutually exclusive, they offer dif-
ferent predictions on the relation between fund investment and investment outcome across VC
funds, the relation between early and later investment performance within a VC fund, and the
source of performance persistence across VC funds.
The inter-fund allocation prediction of our model offers sharply testable predictions on
the relation between investments and outcome success in concurrent periods across funds in
a VC firm. Further, if VC firms strategically allocate investment projects across their funds,
then any VC-skill-related performance persistence between early and later investments within
a fund will be substantially weakened, as indicated by Prediction-4. On the other hand, if
there is an overall decline in the quality of investments available to a VC family, as suggested
by the declining-quality explanation, we would expect concurrent investments across funds to
have similar success rates regardless of the fund sequence in the VC firm. In addition, if there
is persistence in outcome success on account of VC skills, we would expect early investment
outcomes of a fund to predict later investment outcomes. In this and the next subsection, we
seek to test between these explanations by investigating investment outcomes of different funds
of the same VC firm over the same time period.
To determine whether VC firms strategically allocate investments across funds, we study
VC investment decisions and their investment outcomes in a matched sample of VC funds.
From the full sample of VC funds, we form 1,942 “pairs” of sequential funds from the same
VC firms. To construct the sample, we select VC funds from the same VC firm based on their
funding date sequence, and form a “pair” of two VC funds if the start of the subsequent fund
20
falls within the investment period of its immediately preceding fund.13 This subsample includes
1,942 pairs and contains 2,847 unique funds invested by 905 VC firms. For ease of discussion,
we refer to the first fund in the pair (i.e., earlier in the VC firm’s fund sequence) simply as
the “first fund” and the second fund in the pair as the “second fund.” Note also that a fund
could be included in two pairs as it can be the second fund in one pair and the first fund in the
subsequent pair.
From the paired VC funds, we identify VC investments over concurrent investment time
periods. The concurrent period includes the two-year period following the start (or the first
investment date) of the second fund. The concurrent investments are defined as investments
made by both funds during this period. This subsample of funds with concurrent investments
includes 2,360 funds invested by the same 905 VCs. In unreported analyses, we adopt the
more conservative approach of including the investments of the first fund in the one year period
prior to and the one year period following the start of the second fund. Results based on this
alternative concurrent period definition are qualitatively similar.
Panel A of Table 4 provides some basic information about the paired sample of VC funds.
Because the paired sample is from the VC firms that have successfully raised (at least) a second
fund, VC funds in the paired sample are on average larger than the full sample of VC funds
and have more investments. The VC firms in the paired sub-sample are also larger than those
in the full sample and have more investments.
Panel B shows that the outcome of the investments of the “paired” funds and their invest-
ments made during the concurrent periods. Compared with the full sample results in Table 2,
the IPO exit rate of 9.13% is slightly higher than the full sample rate of 8.60%, and the M&A
rate of 25.01% is also slightly higher than the full sample rate of 23.73%. There is also some
difference between the outcome of all investments of the paired funds, and the outcome of the
concurrent investments by the paired funds. For concurrent investments, the IPO exit rate is
9.16% and the M&A rate is 26.70%.
13In the reported results, we do not explicitly define the investment period of the first fund as we examine theoutcome of the investments made by both funds during the same period. In separate tests, we find similar resultsby restricting the investment period to be the first five years of the first fund. Additionally, this restriction hasminimal impact on the sample.
21
Panel C compares the fund-level outcome of the concurrent investments between the first
and second funds in the pair. The IPO exit rate for the concurrent investments of the first
fund is 3.51%, while the rate is substantially higher at 9.11% for the second fund. Based on
IPO/M&A exits, the exit rate is 13.71% for the first fund, and 36.06% for the second fund.
These findings are consistent with Prediction-2 and counter to the declining quality alternative
explanation. There is also a notable difference between the outcome of the first fund’s pre-
concurrent investments and its investments during concurrent period.
Even though VC firms tend to focus on a small number of industries and do not deviate
from their key areas of competence (see, for example, Sorenson and Stuart, 2001), individual
funds of the same VC firm may choose to invest in portfolio companies of different industries.
If such industry switching strategy is actively pursued by the VC firms, it could constrain VC
investment allocation and may also affect the results we documented above. We examine VC
portfolio industry mix within and across successive VC funds based on the VentureXpert’s first-
level industry classification of the portfolio companies. For the “paired sample,” if we define
industry switching at the fund level, i.e., none of the second fund’s investments are in any of the
industries of the first fund’s investments, then almost zero percent of the funds switch industries
completely. If we define industry switching at the individual investment level, then close to one
quarter of the investments of the second funds are different from any of the industries of the first
fund’s investments. While the main concern for our analysis is binding industry constraint at the
fund level, we include a dummy for investment level industry switching in the regression analysis
described below (Table 5). The unreported results show that including the industry switching
dummy does not affect the investment allocation results. In fact, the second fund’s investments
that belong to the same industries of the first fund are more likely to exit successfully. The
result is consistent with the evidence documented in Nanda, Samila, and Sorenson (2017) that
industry focus is a main determinant of VC investment performance persistence.
Table 5 provides the regression results for the sample of concurrent investments of the paired
VC fund sample. For all the concurrent investments in the sample, we specify a dummy variable
based on the sequence of the two funds in the pair. If the investment is made by the second
fund, the Second Fund Investment dummy variable equals 1 and zero otherwise. The remaining
22

control variables in Table 5 are the same as those in Table 3 for the full sample. Again, we
control for VC firm fixed effects in all the regressions. In Models 1 and 3 in Table 5, the results
based on both IPO exits and IPO/M&A exits confirm that investments of the second fund are
more likely to exit successfully than the investments made by the first fund during the same
period, consistent with Prediction-2. We obtain similar results by using the number of financing
rounds as a measure of investment outcome in Model 5.
To ensure the robustness of the results, we re-estimate the models based on the sample of
investments of the second fund after excluding its first investment. Note that first investments
are more likely to be successful than other investments based on the full sample results. By
excluding the first investment of the second fund, we intend to assess whether the results are
due solely to the greater success of the first investment. Models 2, 4, and 6 of Table 5 report
the results. As we would expect, results from these models are weaker than those in Models
1, 3, and 5. However, even after excluding the first investment of the second fund, the other
investments of the second fund during the concurrent period are still more likely to be successful
than the investments of the first fund over the same period.
It is possible that, given the shortened investment horizon, the first VC funds may choose
to invest in “safer” projects that do not require a long incubation period. However, such an
investment strategy can lead to lower returns from the investments, not lower probability of
success as measured by the exit outcome. Because the “safer” investments could be more likely
to enjoy moderate success (such as M&A exit) and are less likely to be total write-offs. As
discussed earlier, using investment exit rather than fund return as a measure of investment
performance allows us to examine the outcome of the individual investment decisions.
The results based on the paired VC fund sample confirm the results from the full sample
that early investments by VC funds are more likely to be successful. More important, after
controlling for the time of investment, evidence on the higher probability of success in the earlier
investments of the second fund helps to test between the two explanations, as discussed above.
Supportive of Prediction-2, the results show that the relation between investment sequence and
investment outcome within a VC fund is not fully explained by a decline in investment quality.
The greater success of early investments of the second fund during the same time period when
23

both funds have access to the projects supports the explanation that VC firms strategically
allocate investment projects across VC funds.
4.3 Additional evidence
The results from the preceding subsections suggest that VC firms strategically allocate invest-
ment projects across funds. In this subsection, we study allocation decisions in the paired VC
fund sample, conditional on early investment outcomes and VC firm reputation.
We first examine whether the outcome of the early investment of the first fund affects the
VC firm’s investment allocation decision across funds. We use the VC fund’s first investment
to measure the success or failure of VC fund’s early investments because it is easy to quan-
tify the outcome of a single investment. In robustness tests, we obtain similar results using
the percentage of successful exits or a dummy variable for a successful exit in first-year VC
investments.14 The final outcome of the early investments may not be known to the market or
even to the VC managers when the VCs decide to invest in new projects. However, it is likely
that VC fund managers may have information on the likelihood of the eventual outcome of the
early investment projects. Consequently, the proxy we use to define the success or failure of
the project is the actual outcome of the investment.
We examine the outcome of the concurrent period investments by both the first and the
second fund, conditional on the early investment outcome of the first fund. Table 6 contains
estimates from regressions of the portfolio company’s exit for the two sub-samples of “paired”
VC funds. In the “Success” sample, the first investment of the first VC fund eventually exits
through an IPO. The “Failure” sample contains VC fund pairs where the first investment
of the first funds did not exit successfully via an IPO. Again, we include various company
characteristics variables and market condition variables in addition to the fund characteristics
variables in the regression.
Models 1 and 2 in Table 6 report the results for the “Success” sample. The results show
a strong investment allocation effect. If the first investment of the first fund eventually exits
successfully, the investments during the concurrent period by the second fund are significantly
14From Table 1, the mean number of companies VC funds invest in as lead VCs in is 3.75, and the median is2. So the first investment also represents a substantial portion of the VC fund portfolio.
24

more likely to be successful than other investments by the first fund over the same time frame.
The results hold for IPO exits and IPO/M&A exits. Note that, in the analysis, we are comparing
the investment outcome of two funds that belong to the same VC firms, so the greater success
of the second fund’s early investments are not due to differences of VC managerial skills across
firms. We further include VC firm fixed effects in the regression to control for unobservable
time-invariant heterogeneity.
Models 3 to 4 in Table 6 report the results for the “Failure” sample. The results are
considerably weaker than the “Success” sample results. When the first investment of the first
fund does not eventually exit successfully, the investment during the concurrent period by
the second fund is either not significantly different (using IPO exits) or more likely to be
successful (using IPO/M&A) than the investments of the first fund over the same time frame.
Overall, the investment allocation effects are not as strong in the “Failure” sample as in the
“Success” sample. A possible explanation for these weaker results is that the VC firm may be
reluctant (or unable) to allocate attractive investment opportunities to the second fund when
good performance of the first fund is still not secured.
We next examine whether the fund raising incentives can lead to noticeable differences in
investment allocation decisions between experienced and young VC firms. Our model predicts
(Prediction-3) that the allocation between funds is likely to be more evident when the VC firm
is more established and has stronger reputation. Young VC firms may be of lower ability than
established VC firms and, hence, less capable of successful outcomes for investments of similar
quality (see Nahata, 2008 and Krishnan et al., 2011). In addition, less reputed VCs may have
less access to high quality investment opportunities (see, for example, Hsu, 2004 and Sørensen,
2007). Hence, relative to younger and less reputable VC firms, we would expect the allocation
of investments across funds to be more apparent for experienced, more reputable VC firms.
In this paper, we construct the VC reputation (or experience) measure by obtaining, for each
portfolio company, the number of financing rounds the lead VC fund’s firm has participated in.
Such measure of VC reputation is widely used in the existing literature (see Sørensen, 2007,
Hochberg, Ljungqvist, and Lu, 2007, among others). As Table 1 shows, the sample average
number of financing rounds VC firms participate in is 141.26 with a median of 36. As our
25

sample period starts from 1975, fewer VC firms have substantial investment experience in the
early part of the sample. Throughout the paper, high versus low VC experience is based on the
median split.
Models 5 to 8 of Table 6 report the results for the sub-samples of VC firms with high
versus low experiences. The results show that experienced VC firms exhibit a greater difference
between the investment outcomes of the paired funds. For VC firms with an established history,
the investment during the concurrent period by the second fund is significantly more likely to
be successful than the investments by the first fund during the same time period. The results
again hold for IPO exits and IPO/M&A exits. For young VC firms, the results are considerably
weaker: There is no difference in the concurrent investment outcome of the first and second
fund based on both IPO exits and IPO/M&A exits in Models 7 and 8.
5 Investment Allocation and Performance Persistence
Existing studies show that VC performance is highly persistent across funds of the same VC
firms. The studies conclude that VCs possess specialized skills in project selection and/or
investment management, and these skills lead to persistence in the performance of their funds
over time. VC firms’, or more specifically, VC managers’ overall skills in attracting, selecting
and managing investments can all lead to performance persistence (see Ewens and Rhodes-
Kropf, 2015 and Bernstein, Giroud, and Townsend, 2016). Increasing competition among VC
firms over time, however, could reduce performance persistence (see Braun, Jenkinson, and
Stoff, 2017). In this section we examine whether and how VC firms’ investment allocation
across funds affects performance persistence and the fund raising activities by the VC firms.
5.1 Investment allocation and performance persistence
We first examine whether investment allocation across funds has any bearing on funds’ observed
performance persistence. If we start from the premise that performance persistence across
the funds of a VC firm is primarily a reflection of VC skills, we should expect there to be
persistence in the performance of investments undertaken within individual funds (if investment
allocation across funds is absent). Hence, the success of early investments of a VC fund should
26

be informative about the likelihood of its later investments being successful. However, if VC
firms actively allocate investments across funds, this could substantially weaken the potential
positive correlation between early and later investment outcomes within the same fund. The
prediction (Prediction-4) from our model is that persistence in performance between the early
and later investments in the same fund will be weaker than those between the first (or early)
investments across different funds of the same VC.15
Because we rely on investment exits as our measure of performance, we first establish evi-
dence on performance persistence across funds of VC firms based on such exits. The first four
models in Table 7 report the relation between the performance of sequential VC funds in our
sample based on IPO and IPO/M&A exits. We use dummy variables for IPO and IPO/M&A
exits as well as the number of these exits in our analysis. The models examine whether IPO
or IPO/M&A investment exits in the first fund predict investment exits in the second fund,
after controlling for both VC fund and investment characteristics. The results show that the
investment outcomes of the first fund are predictive of the investment outcomes of the second
fund, whether the investment outcomes are measured by IPO or IPO/M&A exits. These re-
sults on performance persistence based on portfolio company exits are consistent with existing
evidence based on VC fund returns. One difference between our results and prior results on
VC fund performance persistence is that, by using a VC fund’s internal rate of return (IRR),
prior studies measure fund performance net of management fee and carried interest, while our
measure of fund performance is unaffected by VC compensation.
After establishing the evidence of performance persistence across sequential VC funds in the
sample, we examine performance persistence within VC funds. Models 5 and 6 of Table 7 report
the results on the relation between early and later investments of the first fund in the paired
VC fund sample. We define “early investments” as the investments made by the first fund prior
to the concurrent period (as defined earlier) with a follow-on fund, and ”later investments”
as those during or after the concurrent period. The results show that, based on both IPO
15Nanda, Samila, and Sorenson (2017) also examine performance persistence based on the outcome of individualinvestments but do not distinguish investments across different funds or VC investments as lead VCs or syndicatemembers. They show that early investment success can affect deal flow and helps to generate VC firm levelperformance persistence.
27

and IPO/M&A exits, the outcome of early investments is unrelated to the outcome of later
investments. In unreported analyses, we find no relation between early and later investments
based on the number of IPOs or IPO/M&As (similar to Models 3 and 4), as very few VC funds
have multiple later investment successful exits. Overall, these findings are supportive of the
prediction (Prediction-4) from our model.
The contrast between performance persistence within and across VC funds suggests that
managerial skills alone do not fully account for the performance persistence across the sequential
VC funds.We next examine how investment allocation decisions can directly affect performance
persistence across VC funds. In the paired VC fund sample, we specify three investment periods
for the two funds: the pre-concurrent, or the early investment period of the first fund (we term
this as period A), the concurrent investment period of both the first and second fund, which
represents the late investment period of the first fund and the early investment period of the
second fund (we term this as period B), and the post-concurrent or late investment period of
the second fund (we term this as period C). We examine performance persistence of the VC
funds across the sub-periods.
Table 8 reports the results. In Models 1 and 2, we examine the relation between the
performance of the first fund’s early investments and that of the second fund’s early investments.
We again use the IPO or IPO/M&A dummies to measure the investment outcomes of the VC
funds. The early investments of the first fund are investments made during the period prior to
the concurrent period (period A) and the early investments of the second fund are investments
made during the concurrent period (period B). The results show that the early investment
outcomes of the first fund positively and significantly predict the early investment outcomes of
the second fund. The results hold for both IPO and IPO/M&A exits. Comparing the results
in these two models with those in Models 5 and 6 in Table 7, we find that even though the
early investment success of the first fund does not predict the outcome of later investments by
the same fund, it predicts the outcome of the early investments by the second fund of the same
firm, made during the concurrent period.
Models 3 and 4 in Table 8 examine the relation between the performance of the first fund’s
early investments and the overall investment performance of the second fund. We find a signifi-
28
cant and positive relation between the early investment success of the first fund and the overall
investment performance of the second fund for both definitions of success: exiting through IPO
and IPO/M&A. The findings in Models 1 to 4 thus support Prediction-4 of our model.
We further examine the extent to which the overall performance persistence between the
sequential funds is attributable to the predictive power of the early investment outcome of the
first fund. To this end, we consider both the early investment outcome and the later investment
outcome of the first fund in explaining the overall investment outcome of the second fund. We
again define the early investments as the investments made by the first fund prior to the
concurrent period (Period A) and the later investments as those made by the first fund during
the concurrent period (Period B).16 Models 5 and 6 report the results. Both the IPO exits and
IPO/M&A exits in the early investments of the first fund significantly predict corresponding
IPO exits and IPO/M&A exits in the second fund. In both models, the later investment
outcome of the first fund does not have any predictive power on the investment outcome of the
second fund when the early investment outcome of the first fund is included in the regression.
In Models 7 and 8, we examine whether the later investment outcome of the first fund alone,
in the absence of the early investment outcome, explains the overall investment outcome of
the second fund. The results suggest otherwise: later investment outcome of the first fund
has no predictive power for the overall performance of the second fund. We further examine
for evidence of performance persistence in a sample of sequential funds where the second fund
starts five years after the first fund starts and the two funds do not have overlapping investment
period. In un-tabulated results, we find weak evidence of performance persistence based on the
number of IPO/M&A exits and no evidence of performance persistence based on IPO exit or
IPO/M&A exit dummies or the number of IPOs.
Phalippou (2010) and Korteweg and Sørensen (2017) argue that exposure to common
macroeconomic and financial conditions can lead to spurious performance persistence in the
partially overlapping funds. Korteweg and Sørensen (2017), using data on VC fund returns,
estimate that the overlapping effect accounts for a substantial portion of the observed autocor-
16In a small number of cases, we observe that the first fund also invests in Period C. We did not consider theseinvestments in the reported analysis. But including these investments does not change the results.
29
relation in VC funds. We examine performance persistence between successive funds based on
the outcome of the individual investments during the overlapping period. The deal-level results
reveal that there is little correlation between the investment outcome of the successive funds
during the overlapping period. The findings in this paper suggest that investment allocation,
rather than exposure to common factors, may account for the increased correlations in VC fund
returns.17
In summary, the results from Tables 7 and 8 provide evidence that investment allocation
contributes directly to VC fund performance persistence. Investment performance does not
persist between the early and later investments of the same fund, but does persist between funds.
The evidence reveals that the performance persistence between the funds of the same VC firm is
largely driven by the performance of their early investments. Later investment performance of
the current fund, either alone or in combination with early investment performance, is unrelated
to the performance of subsequent funds.
5.2 Investment outcomes and fund raising activities
In the model, we hypothesize that fund raising incentives leads to allocation of investments
across VC funds. In this section, we study the relation between investment outcomes and fund
raising activities. Specifically, we examine the impact of early and later investment outcomes on
fund raising activities as well as the impact of the most recent investment performance and past
fund performance on fund raising. Such an analysis provides a direct link between investment
decisions and fund raising incentives and offers further insights on the interaction between fund
raising and VC investment decisions.
Efforts to raise new funds start soon after VC firms close the current funds. A VC firm that
raises a new fund successfully will typically have done so within three to five years after the
start of its previous fund. As a result, the performance of the early investments in the VC’s
current fund are likely to be particularly important for fund raising. In Panel A of Table 9, we
report the effects of early investment success on subsequent fund raising activities for the full
17In this paper, we only examine the outcome of the VC investments as lead VCs. The performance of VCinvestments as members of VC syndicates in which VCs do not exert control in investment allocation could bemore affected by common macroeconomic conditions in the overlapping period.
30
sample of VC funds and for sub-samples of high and low reputation VC funds.
Reputation can serve as an effective mechanism to mitigate the influence of fund raising
on investment decisions (see Barber and Yasuda, 2017). Young VCs are particularly subject
to effects of fund raising. For experienced VC firms, because they have a long track record
and have already established themselves as successful managers, the effects of fund raising on
investment decisions in the current fund are likely to be much weaker. Examining fund raising
activities and how investment outcomes affect such activities can help us to understand how
VC fund investors evaluate fund performance and make investment decisions based on the VC
firm’s current and past investment performance.
Panel A provides estimates from regressions of VC firms’ fund raising based on the outcome
of the fund’s first or first-year investments. We measure a VC firm’s fund raising activity in
the five-year period starting from the initial year of its current funds. The dependent variable
is equal to 1 if the VC raises the next fund in 5 years, and zero otherwise. Studies on VC
fund raising show that VC firms typically start their subsequent funds within three to five year
periods after the initiation of previous funds. We use two proxies for the success or failure of
the early investments: whether the early investments eventually exit through IPOs or M&As.
Table 9 reports results based on IPOs, though results based on IPO/M&As are qualitatively
similar. For early investments, we consider both the first investment and first-year investments
of the fund.
Panel A presents the main results on the relation between the early investment success
of the current VC fund and the subsequent fund raising outcome of the VC firm. For the
full sample of VC funds, early investment success in the current fund is positively associated
with the probability of successful fund raising. The results hold for both the first investment
and first-year investments. We find considerable differences in the relation between investment
outcomes and fund raising activity between the sub-samples of experienced and young VCs.
The outcome of the early investments has a far stronger effect on the fund raising outcome
for the young VCs than for experienced VCs. In Model 2, when early investment success is
defined as the IPO exit of first investment, the early investment outcome has a positive though
insignificant relation with fund raising outcome for high experience VC firms.
31

We conduct several additional analyses to verify the robustness of the results. First, we
measure fund raising outcomes during the three-year (instead of the five-year) period after the
initiation of the previous fund. Results based on fund raising outcome over the three-year
period are slightly more pronounced than those in Panel A, and the relation between early
investment outcome and fund raising is significant for both high- and low-experience VCs.
Second, we include both the early investment success (first and first-year investments) and late
investment outcome in the regression. For the full sample of VC funds, the early investment
success has positive impact on the probability of fund raising, while the later investment success
is marginally significant. To conserve space, we do not tabulate the results.
In Panel B, we include the overall investment performance of the previous VC fund in
the analysis to assess the joint effects of past investment performance and current investment
performance on fund raising activities. For Table 9, the previous fund is defined as the fund
immediately proceeding the current fund. All other variables are the same as in Panel A.
Because we require performance information for at least two sequential funds for the analysis,
the sample in Panel B is considerably smaller than the sample in Panel A. For the full sample
(Models 1 and 2), the results show that both the early investment outcome of the current fund
and the overall performance of the previous fund are positively associated with subsequent fund
raising. For young VCs, early investment outcome of the current fund seems to have a stronger
effect on fund raising. When combined with first-year investment outcome, the performance
of the preceding fund does not have any impact on fund raising. For experienced VCs, the
early investment outcome does not have significant impacts on fund raising, neither does the
performance of the immediate preceding fund.
The results in Table 9 confirm that the investment outcome has a significant impact on
fund raising activities. The impact differs for early and later investments and between young
and experienced VCs. Such evidence is important for at least two reasons. First, because the
outcome of the early investment appears to have a disproportionately large impact on fund
raising, VCs could have the incentive to generate early investment success. This could increase
the incentive to allocate high quality projects to second fund soon after its initiation. Second,
because both the current investment success and the past investment success play an important
32
role in fund raising activities, VCs have a strong incentive to move high quality projects to the
next fund after a successful investment in the current fund.
The fund raising results of experienced and young VCs differ from the results on investment
allocation for the two groups of VCs. In the fund raising results, early investment success in the
current fund is particularly important for young VCs in their fund raising activity. The results
suggest that young VCs face greater pressure to generate a successful early investment outcome.
They may thus have a stronger incentive to allocate high quality projects across funds than
experienced VCs. Our results indicate that experienced VCs, rather than young VCs, appear
to have a stronger tendency to allocate projects across funds. The two sets of results are not
necessarily inconsistent with each other. The observed investment allocation decisions could
indicate that experienced VCs are able to allocate high quality projects across funds because
they have better access to quality projects and, in any case, are more likely to be successful for
similar quality projects.
6 Discussion and Conclusion
This paper studies venture capital investment allocation decisions. We argue, by means of a
stylized model, that VC firms have the incentive to engage in strategic allocation of investment
projects across VC funds. In particular, following the success of early investments in a fund,
VCs are likely to raise financing for a new fund and to allocate higher quality projects to the
newly raised fund. As result of such allocation, the model’s prediction – for which we find
strong support – is that the first (or early) investment(s) of a fund will tend to be significantly
more likely to succeed than later investments. Consistent with the allocation across funds, we
find that the early investments of a newly formed follow-on fund are much more successful than
concurrent investments in a VC’s existing fund. Further, consistent with the predictions, these
patterns are shown to be more evident for more reputed VC firms.
We show that investment allocation affects VC fund performance persistence. Investment
performance does not persist between the early and later investments within the same fund,
but does persist across funds. The evidence reveals that much of the performance persistence
between the highly successful funds is driven by the success of their early investments and
33

investment allocation contributes to the persistence of overall VC fund performance.
Strategic investment allocations by VC firms could have implications for both VC-investor
relationships and VC-entrepreneur matching. The allocation of investments across funds could
be potentially problematic if investors regard this as a form of expropriation. This is less likely
to be a concern as long as successful VC firms – the ones with the ability to form new funds
– have a relatively stable investor base and the VC performance and fund flow relationship is
largely driven by existing investors.
34

References
Bernstein, S., X. Giroud, and R. Townsend, 2016, The impact of venture capital monitoring,Journal of Finance 71, 1591-1622.
Barber, B. and A. Yasuda, 2017, Interim fund performance and fundraising in private equity,Journal of Financial Economics 124, 172-194.
Braun, R., T. Jenkinson, and I. Stoff, 2017, How persistent is private equity performance?Evidence from deal-level data, Journal of Financial Economics 123, 273-291.
Chakraborty, I., and M. Ewens, 2016, Managing performance signals through delay: Evidencefrom venture capital, working paper, University of Miami.
Ewens, M., and M. Rhodes-Kropf, 2015, Is a VC partnership greater than the sum of itspartners? Journal of Finance 70, 1081-1113
Gompers, P. A., 1996, Grandstanding in the venture capital industry, Journal of FinancialEconomics 42, 133-56.
Gompers, P. A., A. Kovner, J. Lerner, and D. Scharfstein, 2008, Venture capital investmentcycles: the impact of public markets, Journal of Financial Economics 87, 1-23.
Gompers, P. A., and J. Lerner, 2000, Money chasing deals? The impact of fund inflows onprivate equity valuation, Journal of Financial Economics 55, 281-325.
Hall, R., and S. Woodward, 2010, The burden of the nondiversifiable risk of entrepreneurship,American Economic Review 100, 1163-94.
Harris, R., T. Jenkinson, and S. Kaplan, 2014, Private equity performance: What do we know?The Journal of Finance 69, 1851-1882.
Hochberg, Y., A. Ljungqvist,and Y. Lu, 2007, Whom you know matters: Venture capitalnetworks and investment performance, Journal of Finance 62, 251-301.
Hochberg, Y., A. Ljungqvist, and A. Vissing-Jørgensen, 2014, Informational hold-up andperformance persistence in venture capital, Review of Financial Studies 27, 102-152.
Hsu, D., 2004, What do entrepreneurs pay for venture capital affiliation? Journal of Finance59, 1805-1844.
Hsu, S., 2013, Technology timing of IPOs and venture capital incubation, Journal of CorporateFinance 19, 36-55.
Jenkinson, T., M. Sousa, and R. Stucke, 2013, How fair are the valuations of private equityfunds?, Working paper, University of Oxford.
Kandel, E., D. Leshchinskii, and H. Yuklea, 2011, VC funds: Aging brings myopia , Journalof Financial and Quantitative Analysis 46, 431-457.
Kaplan, S., and A. Schoar, 2005, Private equity performance: Returns, persistence, and capitalflows, Journal of Finance 60, 1791-1823.
35

Kaplan, S., and, B. Sensoy, 2015, Private equity performance: A survey, Annual Review ofFinancial Economics 7, 597-614.
Krishnan, C.N.V., R. Masulis, V. Ivanov and A. Singh, 2011, Venture capital reputation,Post-IPO Performance and corporate governance, Journal of Financial and QuantitativeAnalysis 46, 1295-1333.
Korteweg, A., and M. Sørensen, 2017, Skill and luck in private equity performance, Journalof Financial Economics 124, 535-562.
Lee, P. M., and S. Wahal, 2004, Grandstanding, certification and the underpricing of venturecapital backed IPOs, Journal of Financial Economics 73, 375-407.
Lerner, J., 1995, The syndication of venture capital investments, Financial Management 23,16-27
Nahata, R., 2008, Venture capital reputation and investment performance, Journal of Finan-cial Economics 90, 127-151.
Nanda, R., S. Samila, and O. Sorenson, 2017, The persistent effect of initial success: Evidencefrom venture capital, working paper, Harvard University.
Phalippou, L., 2010, Venture capital funds: flow-performance relationship and performancepersistence. Journal of Banking and Finance 34, 568-577.
Sahlman, W.A., 1990, The structure and governance of venture capital organizations, Journalof Financial Economics 27, 473-521.
Smith, R., R. Pedace, and V. Sathe, 2011, VC fund financial performance: The relative im-portance of IPO and M&A Exits and exercise of abandonment options, Financial Man-agement, 40, 1029-1065.
Sørensen, M., 2007, How smart is smart money? A two-sided matching model of venturecapital, Journal of Finance 62, 2725-2762.
Sorenson, O., and T. Stuart, 2001, Syndication networks and the spatial distribution of venturecapital investments, American Journal of Sociology 106, 1546-1588.
Tian, X., 2012, The role of venture capital syndication in value creation for entrepreneurialfirms, Review of Finance 16, 245-283.
36

Appendix A: Allocation Equilibrium
We obtain conditions for the existence of the allocation equilibrium described in Section2.2.
First, we determine conditions under which investors (existing LPs and new investors) wouldbe willing to invest in the VC’s Fund-1 at date T = 0. In making their capital commitment,investors/LPs correctly anticipate that, in equilibrium, the VC will allocate the H-type invest-ment to the new fund Fund-1 and the O-type investment to the prior fund Fund-0 at dateT = 0. Given the assumption that type-H investments are informative about the VC’s abilitywhile type-O are not, the VC’s ability will be reassessed on the basis of the outcome of thefirst investment in Fund-1. At T = 1, the cycle will repeat itself. If the VC raises a new fundFund-2, he is expected to allocate the type-H investment arriving at date T = 1 to next fundthat is raised (Fund-2), while allocating the type-O investment to Fund-1. Recall that qualityof the investment (H or O) is privately observed by the VC and not known to investors or othermarket participants. Hence, investors beliefs regarding the allocation of projects will stronglyaffect the updating of VC ability by investors.
Second, given investors beliefs regarding the allocation of investment types in equilibrium,we argue that it will be optimal for the VC (i.e., incentive compatible) to allocate the H-typeinvestment to Fund-1 on date T = 0 and to Fund-2 on date T = 1.
Capital Provision by Investors:
Under the assumption that investors correctly anticipate the investment allocation decisionsby the VC (that occur after Fund-1 is raised), we obtain the necessary conditions under whichcapital will be provided.
At date T = 0, the overall NPV of Fund-1 can be expressed as:
W0(θ0) = [θ0πG + (1 − θ0)πB]V + ηV − (2 +K) > 0 (M4)
In the equation above, the first term on the right-hand-side is the expected payoff from invest-ment in the type-H project at date T = 0, with the VC’s ability assessed at θ0. The secondterm (ηV ) represents the value from investment in a type-O project on date T = 1. As wehave seen, Fund-1 invests in a type-O project at date T = 1, irrespective of whether the fund’sinitial investment succeeds or not. Existing LPs will be willing to provide a capital of $2 if theVC offers them a contract in which they expect to recover their investment of $2. For instance,LPs could be offered a fraction β1 of the expected profits such that β1W0 = 2. The VC willreceive the rest of the expected value (1 − β1)W0.
As noted, if the initial project in Fund-1 fails, the assessment of VC’s ability falls below θ∗
(from Equation (M2)) and the expected (positive NPV) payoff from a type-O project will begreater than that from a low ability VC investing in a type-H project. If the initial investmentin Fund-1 succeeds, the VC’s ability will be perceived to be θ+1 (from Equation (M3)) and hewill be able to raise his next fund, Fund-2.
VC’s Allocation Decision:
We now discuss why it is rational for the VC to allocate the higher quality investment tothe new fund, Fund-1. There are two reasons that emerge from our analysis:
1. The first reason has to do with the updating of VC ability. While the VC is aware of thetype of investment, LPs are not. In equilibrium, investors update their assessment about
37

managerial ability solely based on the outcomes that they believe are influenced by VC’sability. Since, in the proposed equilibrium, the VC is expected to allocate the type-Hinvestment to the new fund, Fund-1, the outcome of the investment in Fund-1 will beimportant for updating VC’s perceived ability – while the outcome of the investment inFund-0 will be assumed by investors to be of type-O and will not affect their perceptionof VC ability.
The likelihood of investment success is characterized by πg > η > πb > 0. Further,Equation (M4) is satisfied in equilibrium. Note that the type-O investment is only slightlypositive NPV (not enough to overcome fixed costs K if the only investment is type-O), while from Equation (M4) the type-H investment is sufficiently positive NPV toovercome fixed costs. It follows that [θ0πG + (1 − θ0)πB]V > ηV , i.e., the likelihoodof a successful outcome with a type-H investment is greater than that with a type-Oinvestment: [θ0πG + (1 − θ0)πB] > η. Therefore, the ability of the VC to raise a newfund, Fund-2, at T = 1 will be greater with a type-H investment undertaken in Fund-1,than a type-O investment. Hence, the VC has no incentive to deviate from the proposedallocation equilibrium, in which his ability is updated based on the outcome of the firstinvestment in Fund-1 on date T = 0.
2. The second reason is that the terms on which the VC raises capital for Fund-1 will besomewhat more favorable than those of his prior fund, Fund-0. The reason is that inour set-up, new funds are raised only after a successful investment outcome. As a result,the VC’s ability is assessed to be stronger after a successful outcome at T = 0, i.e.,θ0 > θ−1, where θ−1 was the VC’s perceived ability at the time Fund-0 was raised. Itfollows, from Equation (M4), that an increase in perceived VC ability increases the NPVof the project: W0(θ0) > W−1(θ−1) and the share of the NPV (1−β1) received by the VCis correspondingly higher. While we have expressed the contract in Fund-1 to be betterthan Fund-0 in terms of profit sharing, there are several other features of VC contracts(e.g., the LPs’ rights in terms of the types of investment that can be undertaken) thatmay make the terms of a fund contract better for the VC. A VC that is perceived ashigher quality will presumably be in a stronger position to offer contractual terms thatfavor him more.
38

Appendix B: Data Filters
This appendix describes the VC fund samples and their investments used in the paper. Thefull sample of VC investments pertains to the universe of VC-backed portfolio companies andtheir VC investors (both at the fund and firm level) from the VentureXpert Database. In orderto fully track the performance of a VC fund’s investment sequence over its 10-year life, weobtain the data of all U.S. based VC funds that started from 1975 to 2000. For each VC fund,we obtain the sample of portfolio companies for which the VC fund is the lead investor. Thefinal sample contains 17,154 portfolio companies invested by 4,578 funds that belong to 2,617VC firms.
To further investigate the strategic investment allocation decisions by VC firms, we form1,942 pairs of “sequential funds” from the full sample of VC funds. For each pair, the fundsare managed by the same VC firms and the investment periods of the first and second fundoverlap. This subsample contains 2,847 funds managed by 905 VC firms. Finally, we form,within the sample of “sequential funds,” a sub-sample of concurrent investments by these funds.Concurrent investment period is defined as the two-year period following the start of the secondfund. This subsample further trims down to 2,360 funds invested by the same 905 VCs. Thissub-sample might introduce a selection bias, as a VC firm whose first fund is unsuccessful mightnot be able to raise a second fund. Therefore, first fund in this subsample is likely to have betterperformance than the unconditional average.
39

Table 1: Summary StatisticsTable 1 reports the characteristics of the full sample of 17,154 VC-backed portfolio companies, their lead VC
funds, and VC firms. The sample period is from 1975 to 2010. For a given VC fund, we only consider portfolio
companies for which the fund serves as the lead investor. No. of Investments Per Fund is the total number of
portfolio companies for which the fund serves as the lead investor. Fund Size is the fund’s amount of committed
capital reported by VentureXpert. Seed or Early Stage Funds are funds whose focus is on seed or early stage
investments. No. of Investments Per Firm is the total number of portfolio companies for which the VC firm’s
funds serve as lead investors. Firm Capital under Management is the amount of capital available to a management
team for investments as reported by the VC firm. VC Experience is the cumulative number of financing rounds
in which the VC firm has invested. Seed or Early Stage Company is a dummy variable equal to 1 if the company
was in a seed or early investment stage at the initial VC investment. Throughout this paper, all dollar figures
are adjusted for inflation and are expressed in 2016 dollars.
N Mean Median STD
VC Fund CharacteristicsNo. of Lead Investments Per Fund 4578 3.75 2 4.52Fund Size ($m) 2913 250.24 83.44 592.53Seed or Early Stage Fund (fraction, %) 4578 30.97%
VC Firm CharacteristicsNo. of Lead Investments Per Firm 2617 6.55 2 13.38Firm Capital under Management ($m) 1783 1069.99 123.32 4324.00VC Experience (No. of Lead Financing Rounds) 16945 141.26 36 267.21
Portfolio Company CharacteristicsIs the VC Fund’s First Investment 17154 17.70% 0.38Is the VC Fund’s First-Year Investment 17154 43.71% 0.50VC Fund’s Investment in the Company ($m) 14197 8.66 3.23 32.72Seed or Early Stage Company (fraction,%) 17154 60.70%
40
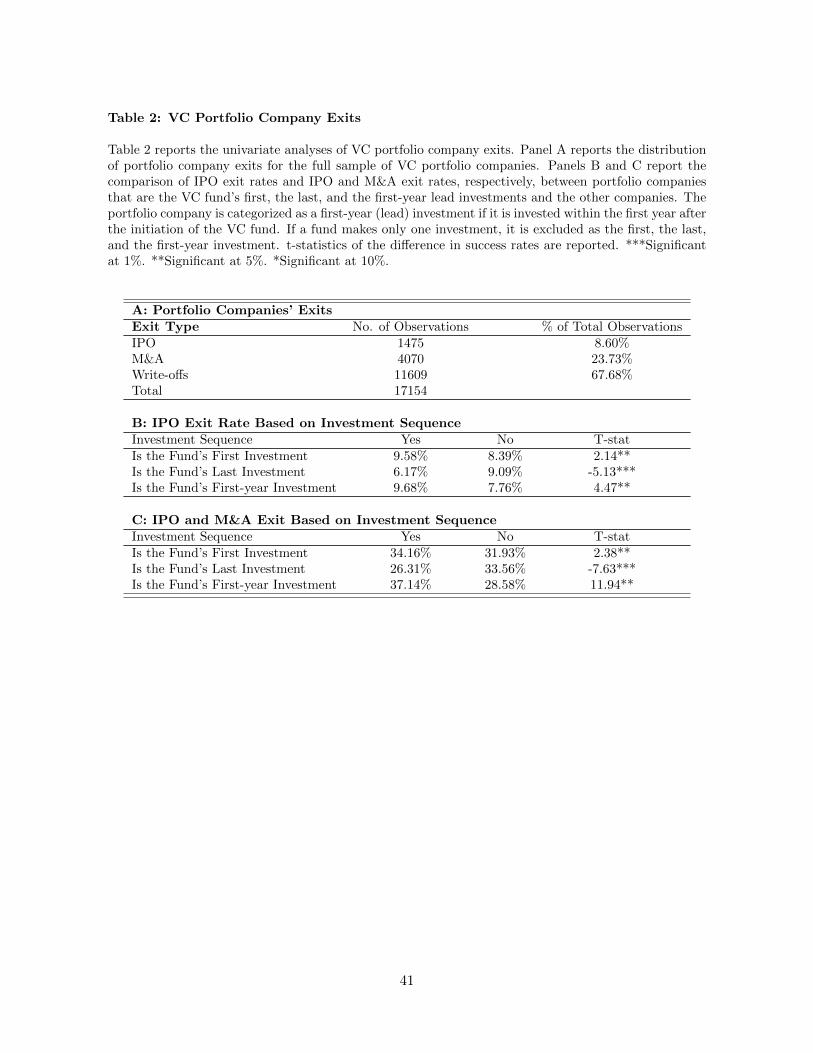
Table 2: VC Portfolio Company Exits
Table 2 reports the univariate analyses of VC portfolio company exits. Panel A reports the distributionof portfolio company exits for the full sample of VC portfolio companies. Panels B and C report thecomparison of IPO exit rates and IPO and M&A exit rates, respectively, between portfolio companiesthat are the VC fund’s first, the last, and the first-year lead investments and the other companies. Theportfolio company is categorized as a first-year (lead) investment if it is invested within the first year afterthe initiation of the VC fund. If a fund makes only one investment, it is excluded as the first, the last,and the first-year investment. t-statistics of the difference in success rates are reported. ***Significantat 1%. **Significant at 5%. *Significant at 10%.
A: Portfolio Companies’ ExitsExit Type No. of Observations % of Total ObservationsIPO 1475 8.60%M&A 4070 23.73%Write-offs 11609 67.68%Total 17154
B: IPO Exit Rate Based on Investment SequenceInvestment Sequence Yes No T-statIs the Fund’s First Investment 9.58% 8.39% 2.14**Is the Fund’s Last Investment 6.17% 9.09% -5.13***Is the Fund’s First-year Investment 9.68% 7.76% 4.47**
C: IPO and M&A Exit Based on Investment SequenceInvestment Sequence Yes No T-statIs the Fund’s First Investment 34.16% 31.93% 2.38**Is the Fund’s Last Investment 26.31% 33.56% -7.63***Is the Fund’s First-year Investment 37.14% 28.58% 11.94**
41

Tab
le3:
Rela
tion
betw
een
VC
Invest
ment
Sequ
en
ce
an
dIn
vest
ment
Ou
tcom
eT
able
3co
nta
ins
esti
mat
esfr
omL
ogit
regr
essi
on
sof
the
port
foli
oco
mp
any’s
succ
essf
ul
exit
on
its
ord
erin
the
VC
fun
d’s
inve
stm
ent
sequ
ence
.In
Mod
els
(1)
to(4
),th
ed
epen
den
tva
riab
leis
equ
al
to1
ifth
ep
ort
folio
com
pany
exit
sth
rou
gh
IPO
,an
dze
rooth
erw
ise.
InM
od
els
(5)
to(8
),th
ed
epen
den
tva
riab
leis
equ
alto
1if
the
por
tfol
ioco
mp
any
exit
thro
ugh
IPO
or
M&
As,
an
dze
rooth
erw
ise.
Fir
stIn
vest
men
tD
um
my
isa
bin
ary
vari
able
equ
alto
1if
the
por
tfol
ioco
mp
any
isth
efi
rst
inves
tmen
tin
the
VC
fun
d’s
inve
stm
ent
sequ
ence
.F
irst
-yea
rIn
vest
men
tsD
um
my
isa
bin
ary
vari
able
equ
alto
1if
the
por
tfol
ioco
mp
any
isin
vest
edw
ith
inon
eye
ar
aft
erth
ein
itia
tion
of
the
VC
fun
d.
Inves
tmen
tS
equ
ence
Nu
mb
eris
the
por
tfol
ioco
mp
any’s
nu
mb
erth
atfo
llow
sth
ech
ron
olo
gic
al
ord
erin
the
VC
fun
d’s
lead
inve
stm
ent
sequ
ence
,sc
ale
dby
tota
lnu
mb
erof
lead
inves
tmen
tsm
ade
by
the
fun
d.
Fu
nd
Seq
uen
ceis
the
nu
mb
erof
the
VC
fun
din
the
VC
firm
’sin
vest
men
tse
qu
ence
.In
Pan
elB
,T
ime
toIn
vest
men
tis
the
nu
mb
erof
year
sfr
omth
eV
Cfu
nd
’svin
tage
yea
rto
the
yea
rof
the
inve
stm
ent
of
the
com
pan
yin
qu
esti
on
.z-
stati
stic
sare
rep
orte
din
par
enth
eses
,af
ter
contr
olli
ng
for
clu
ster
edst
an
dard
erro
rsat
the
VC
firm
leve
l.***S
ign
ifica
nt
at
1%
.**S
ign
ifica
nt
at
5%
.*S
ign
ifica
nt
at10
%.
42

A.
Dep
en
dent
Vari
ab
le=
1if
IPO
=1
ifIP
Oor
M&
As
(Mod
els
(1)
to(4
))(M
od
els
(5)
to(8
))(1
)(2
)(3
)(4
)(5
)(6
)(7
)(8
)F
irst
Inves
tmen
tD
um
my
0.229***
0.3
03***
0.2
36***
0.2
94***
(2.6
5)
(3.3
4)
(4.1
2)
(4.8
7)
Fir
st-y
ear
Inve
stm
ents
Du
mm
y0.2
37***
0.2
70***
(3.0
4)
(4.8
4)
Inve
stm
ent
Seq
uen
ceN
um
ber
-0.6
15***
-0.5
81***
(-4.9
6)
(-7.1
6)
Fu
nd
Seq
uen
ce0.
073***
-0.0
05
-0.0
08
0.0
25
0.0
72***
0.0
39
0.0
37
0.0
47*
(3.5
8)
(-0.1
0)
(-0.1
5)
(0.4
6)
(6.8
8)
(1.5
1)
(1.4
1)
(1.6
5)
Ln
(Fu
nd
Siz
e)-0
.039
0.0
52
0.0
45
-0.0
91
0.2
12***
0.2
89**
0.2
77**
0.1
55
(-0.4
5)
(0.2
9)
(0.2
4)
(-0.3
6)
(3.3
9)
(2.1
6)
(1.9
8)
(0.9
4)
Ln
(Fu
nd
Siz
e)S
qu
ared
0.0
02
-0.0
30
-0.0
30
-0.0
26
-0.0
14**
-0.0
36**
-0.0
35**
-0.0
26
(0.1
5)
(-1.5
9)
(-1.5
2)
(-1.0
2)
(-2.0
5)
(-2.4
7)
(-2.3
2)
(-1.5
6)
See
dor
Ear
lyS
tage
Fu
nd
-0.2
44***
-0.2
86
-0.2
90
-0.2
45
0.0
05
-0.3
61***
-0.3
66***
-0.3
72***
(-2.7
3)
(-1.5
2)
(-1.5
3)
(-1.2
0)
(0.0
8)
(-3.0
7)
(-3.0
6)
(-2.9
6)
No.
ofIP
Os
(in
Th
ousa
nd
s)0.
934***
0.4
48***
0.4
11**
0.3
89**
0.3
21***
0.0
88
0.0
28
-0.0
28
pri
orto
the
Fun
d’s
Vin
tage
Yea
r(6
.55)
(2.6
7)
(2.4
7)
(2.2
7)
(3.2
8)
(0.7
7)
(0.2
4)
(-0.2
4)
Ln
(Fu
nd
Inve
stm
ent)
0.116***
0.1
40***
0.1
36**
0.1
16**
0.0
85***
0.0
67**
0.0
62**
0.0
28
(3.2
5)
(2.8
1)
(2.7
1)
(2.0
6)
(4.2
3)
(2.4
2)
(2.2
5)
(0.9
5)
Com
pan
y’s
Indu
stry
M/B
Rat
io-0
.268***
-0.0
91
-0.0
95
-0.0
81
0.0
60
0.1
51***
0.1
43***
0.1
87***
(-4.0
2)
(-1.1
2)
(-1.1
8)
(-0.9
5)
(1.4
7)
(3.1
5)
(2.9
5)
(3.7
1)
See
dor
Ear
lyS
tage
Com
pan
y-0
.046
-0.0
77
-0.0
89
-0.0
71
-0.0
33
-0.0
55
-0.0
67
-0.0
76
(-0.7
0)
(-0.9
7)
(-1.1
1)
(-0.8
6)
(-0.6
9)
(-1.0
8)
(-1.3
1)
(-1.4
6)
Inve
sted
in19
95-2
000
-0.4
19***
-0.1
03
-0.1
27
-0.1
10
-0.1
20**
-0.0
04
-0.0
32
0.0
09
(-4.6
3)
(-0.8
2)
(-1.0
0)
(-0.8
4)
(-2.1
6)
(-0.0
5)
(-0.4
6)
(0.1
3)
VC
Fir
mF
ixed
-eff
ects
No
Yes
Yes
Yes
No
Yes
Yes
Yes
R2
0.0
24
0.0
14
0.0
18
0.0
14
0.0
21
0.0
07
0.0
10
0.0
08
N11626
7617
7617
7327
11626
10110
10110
9703
43

Tab
le3
-C
onti
nu
ed
.
B.
Dep
en
dent
Vari
ab
le=
1if
IPO
=1
ifIP
Oor
M&
As
(Mod
els
(1)
to(4
))(M
od
els
(5)
to(8
))(1
)(2
)(3
)(4
)(5
)(6
)(7
)(8
)F
irst
Inve
stm
ent
Du
mm
y0.
291***
0.3
58***
0.3
00***
0.3
77***
(2.9
9)
(3.4
8)
(3.2
9)
(5.4
9)
Fir
st-y
ear
Inve
stm
ents
Du
mm
y0.2
01**
0.3
42***
(2.3
4)
(4.8
8)
Inve
stm
ent
Seq
uen
ceN
um
ber
-0.4
80***
-0.1
55
(-2.7
4)
(-1.4
6)
Tim
eto
Inve
stm
ent
-0.0
67
-0.0
66
-0.0
36
-0.0
52
0.1
31
-0.1
01**
-0.1
11*
-0.1
21***
(-1.3
0)
(-1.0
1)
(-1.1
3)
(-0.5
6)
(1.5
0)
(-2.3
6)
(-1.7
7)
(-5.6
3)
Fu
nd
Seq
uen
ce0.
072***
-0.0
05
0.0
69***
0.0
22
-0.0
06
0.0
38
0.0
36
0.0
34
(3.5
1)
(-0.1
1)
(3.3
6)
(0.4
0)
(-0.1
2)
(1.4
8)
(1.3
9)
(1.1
3)
Ln
(Fu
nd
Siz
e)-0
.041
0.0
40
-0.0
29
-0.1
06
0.0
52
0.2
74**
0.2
81**
0.0
91
(-0.4
8)
(0.2
2)
(-0.3
4)
(-0.4
2)
(0.2
9)
(2.0
6)
(2.0
0)
(0.5
4)
Ln
(Fu
nd
Siz
e)S
qu
ared
0.0
02
-0.0
29
0.0
00
-0.0
25
-0.0
30
-0.0
35**
-0.0
36***
-0.0
20
(0.1
6)
(-1.5
6)
(0.0
2)
(-0.9
6)
(-1.5
7)
(-2.4
1)
(-2.3
3)
(-1.1
4)
See
dor
Ear
lyS
tage
Fu
nd
-0.2
48***
-0.2
85
-0.2
58***
-0.2
47
-0.2
86
-0.3
61***
-0.3
68***
-0.3
85***
(-2.7
7)
(-1.5
2)
(-2.8
7)
(-1.2
0)
(-1.5
2)
(-3.0
7)
(-3.0
6)
(-2.9
8)
No.
ofIP
Os
(in
Th
ousa
nd
s)0.
923***
0.4
34**
0.8
91***
0.3
84**
0.4
42***
0.0
73
0.0
19
-0.0
64
pri
orto
the
Fu
nd
’sV
inta
geY
ear
(6.4
4)
(2.5
8)
(6.1
7)
(2.2
6)
(2.6
4)
(0.6
4)
(0.1
7)
(-0.5
4)
Ln
(Fu
nd
Inve
stm
ent)
0.114***
0.1
39***
0.1
14***
0.1
13**
0.1
38***
0.0
65**
0.0
62**
0.0
16
(3.2
0)
(2.7
8)
(3.2
1)
(1.9
7)
(2.7
6)
(2.3
7)
(2.2
4)
(0.5
3)
Com
pan
y’s
Ind
ust
ryM
/BR
atio
-0.2
69***
-0.0
89
-0.2
73***
-0.0
82
-0.0
92
0.1
52***
0.1
45***
0.1
81***
(-4.0
2)
(-1.1
0)
(-4.1
2)
(-0.9
7)
(-1.1
4)
(3.1
7)
(2.9
9)
(3.6
0)
See
dor
Ear
lyS
tage
Com
pan
y-0
.049
-0.0
77
-0.0
57
-0.0
76
-0.0
78
-0.0
55
-0.0
67
-0.0
92*
(-0.7
3)
(-0.9
7)
(-0.8
6)
(-0.9
3)
(-0.9
7)
(-1.0
8)
(-1.3
1)
(-1.7
4)
Inve
sted
in19
95-2
000
-0.4
19***
-0.1
03
-0.4
29***
-0.1
21
-0.1
06
-0.0
05
-0.0
40
-0.0
33
(-4.6
3)
(-0.8
2)
(-4.6
6)
(-0.9
1)
(-0.8
5)
(-0.0
7)
(-0.5
7)
(-0.4
8)
VC
Fir
mF
ixed
-eff
ects
No
Yes
Yes
Yes
No
Yes
Yes
Yes
R2
0.0
25
0.0
14
0.0
24
0.0
18
0.0
14
0.0
08
0.0
08
0.0
13
N11626
7617
11626
7327
7617
10110
10110
9703
44
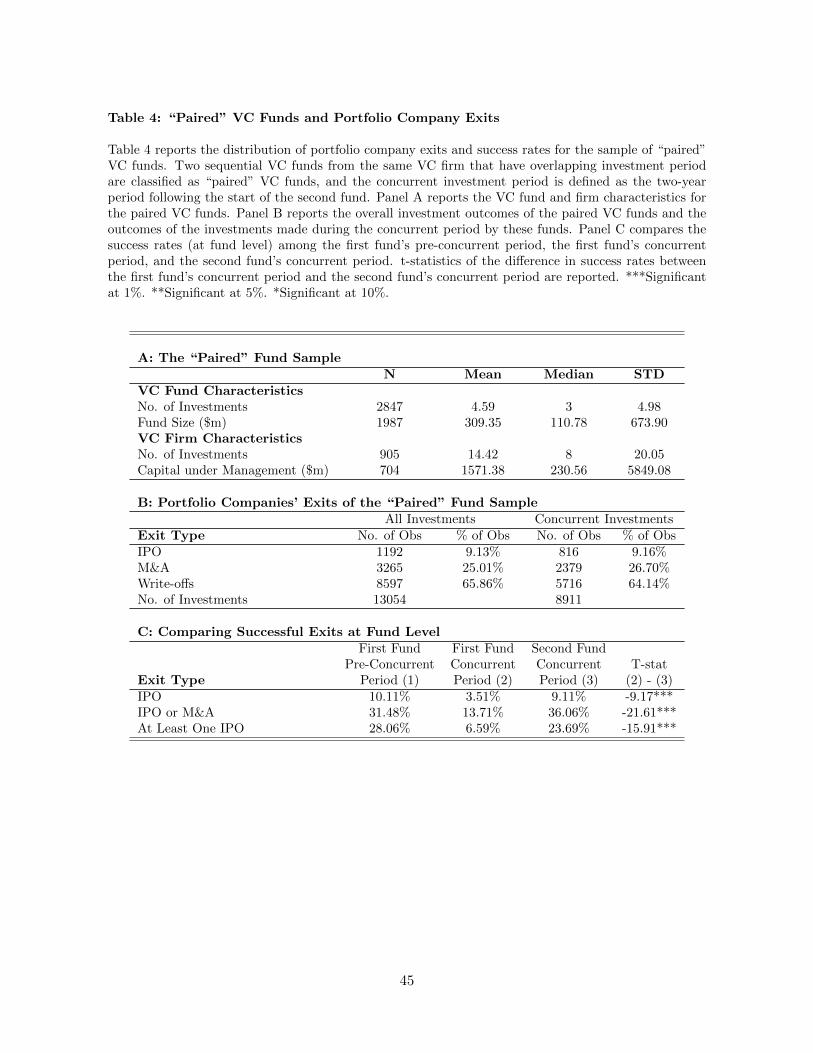
Table 4: “Paired” VC Funds and Portfolio Company Exits
Table 4 reports the distribution of portfolio company exits and success rates for the sample of “paired”VC funds. Two sequential VC funds from the same VC firm that have overlapping investment periodare classified as “paired” VC funds, and the concurrent investment period is defined as the two-yearperiod following the start of the second fund. Panel A reports the VC fund and firm characteristics forthe paired VC funds. Panel B reports the overall investment outcomes of the paired VC funds and theoutcomes of the investments made during the concurrent period by these funds. Panel C compares thesuccess rates (at fund level) among the first fund’s pre-concurrent period, the first fund’s concurrentperiod, and the second fund’s concurrent period. t-statistics of the difference in success rates betweenthe first fund’s concurrent period and the second fund’s concurrent period are reported. ***Significantat 1%. **Significant at 5%. *Significant at 10%.
A: The “Paired” Fund SampleN Mean Median STD
VC Fund CharacteristicsNo. of Investments 2847 4.59 3 4.98Fund Size ($m) 1987 309.35 110.78 673.90VC Firm CharacteristicsNo. of Investments 905 14.42 8 20.05Capital under Management ($m) 704 1571.38 230.56 5849.08
B: Portfolio Companies’ Exits of the “Paired” Fund SampleAll Investments Concurrent Investments
Exit Type No. of Obs % of Obs No. of Obs % of ObsIPO 1192 9.13% 816 9.16%M&A 3265 25.01% 2379 26.70%Write-offs 8597 65.86% 5716 64.14%No. of Investments 13054 8911
C: Comparing Successful Exits at Fund LevelFirst Fund First Fund Second Fund
Pre-Concurrent Concurrent Concurrent T-statExit Type Period (1) Period (2) Period (3) (2) - (3)IPO 10.11% 3.51% 9.11% -9.17***IPO or M&A 31.48% 13.71% 36.06% -21.61***At Least One IPO 28.06% 6.59% 23.69% -15.91***
45
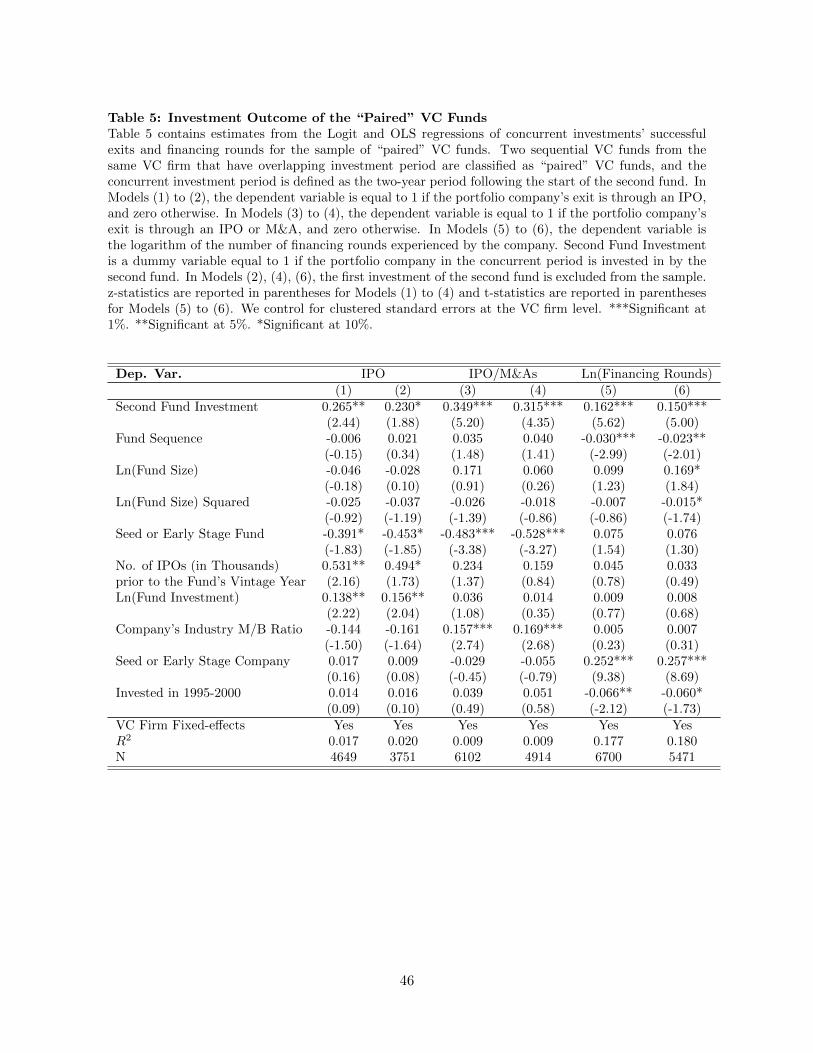
Table 5: Investment Outcome of the “Paired” VC FundsTable 5 contains estimates from the Logit and OLS regressions of concurrent investments’ successfulexits and financing rounds for the sample of “paired” VC funds. Two sequential VC funds from thesame VC firm that have overlapping investment period are classified as “paired” VC funds, and theconcurrent investment period is defined as the two-year period following the start of the second fund. InModels (1) to (2), the dependent variable is equal to 1 if the portfolio company’s exit is through an IPO,and zero otherwise. In Models (3) to (4), the dependent variable is equal to 1 if the portfolio company’sexit is through an IPO or M&A, and zero otherwise. In Models (5) to (6), the dependent variable isthe logarithm of the number of financing rounds experienced by the company. Second Fund Investmentis a dummy variable equal to 1 if the portfolio company in the concurrent period is invested in by thesecond fund. In Models (2), (4), (6), the first investment of the second fund is excluded from the sample.z-statistics are reported in parentheses for Models (1) to (4) and t-statistics are reported in parenthesesfor Models (5) to (6). We control for clustered standard errors at the VC firm level. ***Significant at1%. **Significant at 5%. *Significant at 10%.
Dep. Var. IPO IPO/M&As Ln(Financing Rounds)(1) (2) (3) (4) (5) (6)
Second Fund Investment 0.265** 0.230* 0.349*** 0.315*** 0.162*** 0.150***(2.44) (1.88) (5.20) (4.35) (5.62) (5.00)
Fund Sequence -0.006 0.021 0.035 0.040 -0.030*** -0.023**(-0.15) (0.34) (1.48) (1.41) (-2.99) (-2.01)
Ln(Fund Size) -0.046 -0.028 0.171 0.060 0.099 0.169*(-0.18) (0.10) (0.91) (0.26) (1.23) (1.84)
Ln(Fund Size) Squared -0.025 -0.037 -0.026 -0.018 -0.007 -0.015*(-0.92) (-1.19) (-1.39) (-0.86) (-0.86) (-1.74)
Seed or Early Stage Fund -0.391* -0.453* -0.483*** -0.528*** 0.075 0.076(-1.83) (-1.85) (-3.38) (-3.27) (1.54) (1.30)
No. of IPOs (in Thousands) 0.531** 0.494* 0.234 0.159 0.045 0.033prior to the Fund’s Vintage Year (2.16) (1.73) (1.37) (0.84) (0.78) (0.49)Ln(Fund Investment) 0.138** 0.156** 0.036 0.014 0.009 0.008
(2.22) (2.04) (1.08) (0.35) (0.77) (0.68)Company’s Industry M/B Ratio -0.144 -0.161 0.157*** 0.169*** 0.005 0.007
(-1.50) (-1.64) (2.74) (2.68) (0.23) (0.31)Seed or Early Stage Company 0.017 0.009 -0.029 -0.055 0.252*** 0.257***
(0.16) (0.08) (-0.45) (-0.79) (9.38) (8.69)Invested in 1995-2000 0.014 0.016 0.039 0.051 -0.066** -0.060*
(0.09) (0.10) (0.49) (0.58) (-2.12) (-1.73)VC Firm Fixed-effects Yes Yes Yes Yes Yes YesR2 0.017 0.020 0.009 0.009 0.177 0.180N 4649 3751 6102 4914 6700 5471
46
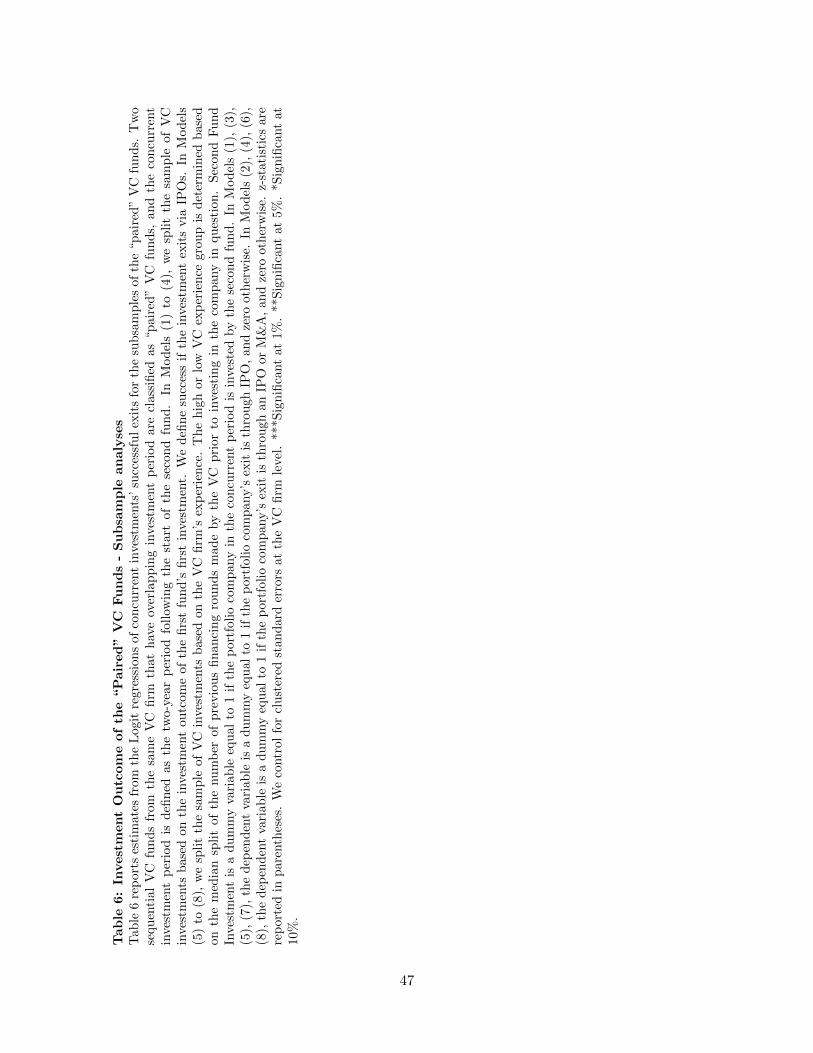
Tab
le6:
Invest
ment
Ou
tcom
eof
the
“P
air
ed
”V
CFu
nd
s-
Su
bsa
mp
lean
aly
ses
Tab
le6
rep
orts
esti
mat
esfr
omth
eL
ogit
regr
essi
on
sof
con
curr
ent
inves
tmen
ts’
succ
essf
ul
exit
sfo
rth
esu
bsa
mp
les
of
the
“p
air
ed”
VC
fun
ds.
Tw
ose
qu
enti
alV
Cfu
nd
sfr
omth
esa
me
VC
firm
that
hav
eov
erla
pp
ing
inve
stm
ent
per
iod
are
class
ified
as
“p
air
ed”
VC
fun
ds,
an
dth
eco
ncu
rren
tin
vest
men
tp
erio
dis
defi
ned
asth
etw
o-ye
arp
erio
dfo
llow
ing
the
start
of
the
seco
nd
fun
d.
InM
od
els
(1)
to(4
),w
esp
lit
the
sam
ple
of
VC
inve
stm
ents
bas
edon
the
inve
stm
ent
outc
ome
of
the
firs
tfu
nd
’sfi
rst
inves
tmen
t.W
ed
efin
esu
cces
sif
the
inve
stm
ent
exit
svia
IPO
s.In
Mod
els
(5)
to(8
),w
esp
lit
the
sam
ple
ofV
Cin
vest
men
tsb
ase
don
the
VC
firm
’sex
per
ien
ce.
Th
eh
igh
or
low
VC
exp
erie
nce
gro
up
isd
eter
min
edb
ase
don
the
med
ian
spli
tof
the
nu
mb
erof
pre
vio
us
fin
an
cin
gro
un
ds
mad
eby
the
VC
pri
or
toin
vest
ing
inth
eco
mp
any
inqu
esti
on
.S
econ
dF
un
dIn
vest
men
tis
ad
um
my
vari
able
equ
alto
1if
the
port
foli
oco
mp
any
inth
eco
ncu
rren
tp
erio
dis
inve
sted
by
the
seco
nd
fun
d.
InM
od
els
(1),
(3),
(5),
(7),
the
dep
end
ent
vari
able
isa
du
mm
yeq
ual
to1
ifth
ep
ort
foli
oco
mp
any’s
exit
isth
rou
gh
IPO
,an
dze
rooth
erw
ise.
InM
od
els
(2),
(4),
(6),
(8),
the
dep
end
ent
vari
able
isa
du
mm
yeq
ual
to1
ifth
ep
ort
foli
oco
mpany’s
exit
isth
rou
gh
an
IPO
or
M&
A,
an
dze
rooth
erw
ise.
z-st
ati
stic
sare
rep
orte
din
par
enth
eses
.W
eco
ntr
olfo
rcl
ust
ered
stan
dard
erro
rsat
the
VC
firm
leve
l.***S
ign
ifica
nt
at
1%
.**S
ign
ifica
nt
at
5%
.*S
ign
ifica
nt
at
10%
.
47
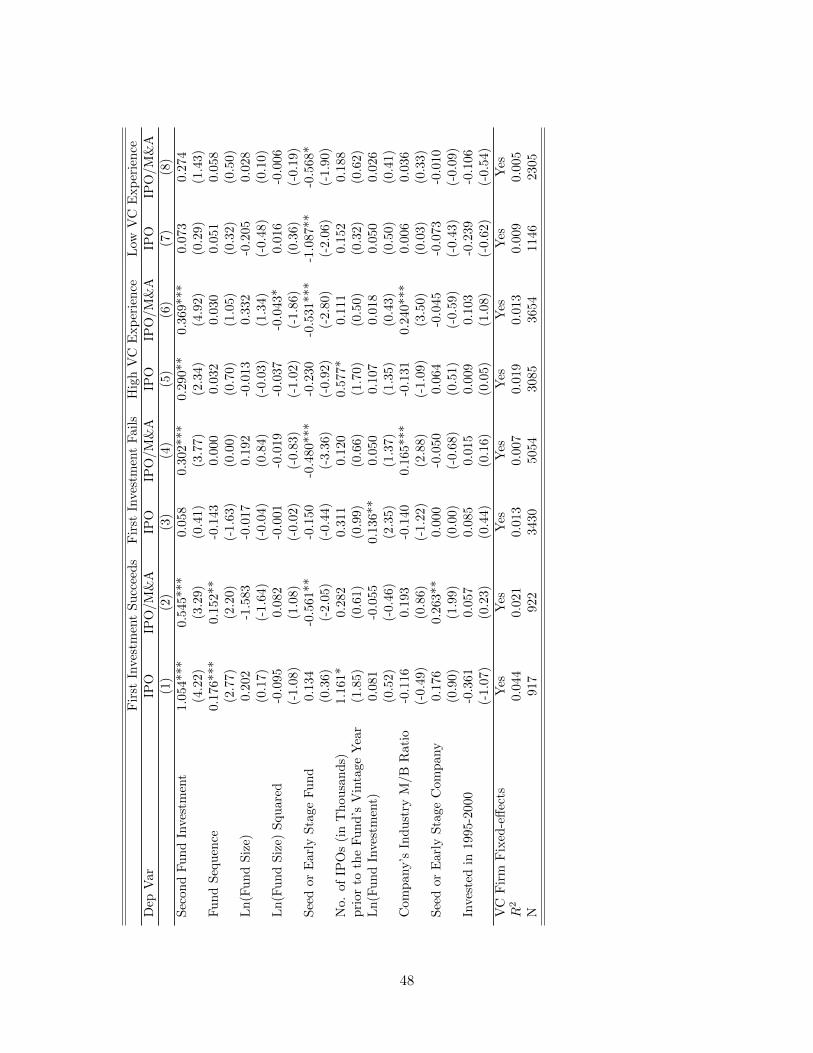
Fir
stIn
ves
tmen
tS
ucc
eed
sF
irst
Inve
stm
ent
Fail
sH
igh
VC
Exp
erie
nce
Low
VC
Exp
erie
nce
Dep
Var
IPO
IPO
/M
&A
IPO
IPO
/M
&A
IPO
IPO
/M
&A
IPO
IPO
/M
&A
(1)
(2)
(3)
(4)
(5)
(6)
(7)
(8)
Sec
ond
Fu
nd
Inves
tmen
t1.
054*
**
0.5
45***
0.0
58
0.3
02***
0.2
90**
0.3
69***
0.0
73
0.2
74
(4.2
2)
(3.2
9)
(0.4
1)
(3.7
7)
(2.3
4)
(4.9
2)
(0.2
9)
(1.4
3)
Fu
nd
Seq
uen
ce0.
176*
**
0.1
52**
-0.1
43
0.0
00
0.0
32
0.0
30
0.0
51
0.0
58
(2.7
7)
(2.2
0)
(-1.6
3)
(0.0
0)
(0.7
0)
(1.0
5)
(0.3
2)
(0.5
0)
Ln
(Fu
nd
Siz
e)0.
202
-1.5
83
-0.0
17
0.1
92
-0.0
13
0.3
32
-0.2
05
0.0
28
(0.1
7)
(-1.6
4)
(-0.0
4)
(0.8
4)
(-0.0
3)
(1.3
4)
(-0.4
8)
(0.1
0)
Ln
(Fu
nd
Siz
e)S
qu
ared
-0.0
95
0.0
82
-0.0
01
-0.0
19
-0.0
37
-0.0
43*
0.0
16
-0.0
06
(-1.
08)
(1.0
8)
(-0.0
2)
(-0.8
3)
(-1.0
2)
(-1.8
6)
(0.3
6)
(-0.1
9)
See
dor
Ear
lyS
tage
Fu
nd
0.13
4-0
.561**
-0.1
50
-0.4
80***
-0.2
30
-0.5
31***
-1.0
87**
-0.5
68*
(0.3
6)
(-2.0
5)
(-0.4
4)
(-3.3
6)
(-0.9
2)
(-2.8
0)
(-2.0
6)
(-1.9
0)
No.
ofIP
Os
(in
Th
ousa
nd
s)1.
161*
0.2
82
0.3
11
0.1
20
0.5
77*
0.1
11
0.1
52
0.1
88
pri
orto
the
Fun
d’s
Vin
tage
Yea
r(1
.85)
(0.6
1)
(0.9
9)
(0.6
6)
(1.7
0)
(0.5
0)
(0.3
2)
(0.6
2)
Ln
(Fu
nd
Inve
stm
ent)
0.08
1-0
.055
0.1
36**
0.0
50
0.1
07
0.0
18
0.0
50
0.0
26
(0.5
2)
(-0.4
6)
(2.3
5)
(1.3
7)
(1.3
5)
(0.4
3)
(0.5
0)
(0.4
1)
Com
pan
y’s
Indu
stry
M/B
Rat
io-0
.116
0.1
93
-0.1
40
0.1
65***
-0.1
31
0.2
40***
0.0
06
0.0
36
(-0.
49)
(0.8
6)
(-1.2
2)
(2.8
8)
(-1.0
9)
(3.5
0)
(0.0
3)
(0.3
3)
See
dor
Ear
lyS
tage
Com
pan
y0.
176
0.2
63**
0.0
00
-0.0
50
0.0
64
-0.0
45
-0.0
73
-0.0
10
(0.9
0)
(1.9
9)
(0.0
0)
(-0.6
8)
(0.5
1)
(-0.5
9)
(-0.4
3)
(-0.0
9)
Inve
sted
in19
95-2
000
-0.3
61
0.0
57
0.0
85
0.0
15
0.0
09
0.1
03
-0.2
39
-0.1
06
(-1.
07)
(0.2
3)
(0.4
4)
(0.1
6)
(0.0
5)
(1.0
8)
(-0.6
2)
(-0.5
4)
VC
Fir
mF
ixed
-eff
ects
Yes
Yes
Yes
Yes
Yes
Yes
Yes
Yes
R2
0.04
40.0
21
0.0
13
0.0
07
0.0
19
0.0
13
0.0
09
0.0
05
N91
7922
3430
5054
3085
3654
1146
2305
48

Tab
le7:
Perf
orm
an
ce
Pers
iste
nce
wit
hin
an
dacro
ssV
CFu
nd
sT
able
7re
por
tses
tim
ates
from
the
Log
itan
dn
egati
ve
bin
om
ial
regre
ssio
ns
of
inve
stm
ent
ou
tcom
ein
the
pair
edfu
nd
sam
ple
.M
od
els
1to
4ex
amin
eth
ere
lati
onb
etw
een
the
outc
omes
ofth
efi
rst
fun
din
vest
men
tsan
dth
ese
con
dfu
nd
inves
tmen
ts.
Mod
els
5an
d6
exam
ine
the
rela
tion
bet
wee
nth
eea
rly
inve
stm
ent
outc
ome
ofth
efi
rst
fun
dan
dit
sla
ter
inves
tmen
tou
tcom
e.F
irst
Fu
nd
Earl
yIn
vest
men
tsre
fer
toin
vest
men
tsm
ad
eby
the
firs
tfu
nd
pri
orto
the
con
curr
ent
per
iod
.In
Mod
els
1an
d5,
the
dep
end
ent
vari
ab
leis
equ
al
to1
ifth
ein
vest
men
tex
its
via
IPO
.In
Mod
els
2an
d6,
the
dep
end
ent
vari
able
iseq
ual
to1
ifth
ein
ves
tmen
tex
its
via
an
IPO
or
M&
A.
InM
od
els
3an
d4,
the
dep
end
ent
vari
ab
leis
the
nu
mb
erof
IPO
orIP
O/M
&A
exit
s,an
dw
eu
sen
egati
veb
inom
ial
regre
ssio
ns
fram
ework
.L
n(V
CIn
flow
s)is
the
logari
thm
of
the
aggre
gate
amou
nt
ofca
pit
alra
ised
by
oth
erV
Cfu
nd
sin
the
sam
ple
fun
d’s
vin
tage
year.
z-st
ati
stic
sare
rep
ort
edin
pare
nth
eses
,all
contr
oll
ing
for
clu
ster
edst
and
ard
erro
rsat
the
VC
firm
leve
l.**
*Sig
nifi
cant
at
1%
.**S
ign
ifica
nt
at
5%
.*S
ign
ifica
nt
at
10%
.
49

Sec
on
dF
un
dIn
ves
tmen
tsF
irst
Fu
nd
Late
rIn
ves
tmen
ts(M
od
els
(1)
to(4
))(M
od
els
(5)
to(6
)IP
OIP
O/M
&A
#IP
O#
IPO
/M
&A
IPO
IPO
/M
&A
(1)
(2)
(3)
(4)
(5)
(6)
IPO
inF
irst
Fun
dIn
vest
men
ts0.4
78***
0.4
08***
(3.3
2)
(3.6
9)
IPO
/M&
Ain
Fir
stF
un
dIn
vest
men
ts0.3
29***
0.2
78***
(2.6
2)
(3.4
0)
IPO
inF
irst
Fun
dE
arly
Inve
stm
ents
0.0
59(0
.21)
IPO
/M&
Ain
Fir
stF
un
dE
arly
Inve
stm
ents
-0.2
50
(-1.5
4)
Ln
(Fu
nd
Siz
e)0.6
51**
0.6
87***
0.6
82***
0.8
04***
-0.0
330.1
23
(2.5
6)
(3.3
7)
(2.7
5)
(4.5
7)
(-0.0
8)(0
.53)
Ln
(Fu
nd
Siz
e)S
qu
ared
-0.0
22
-0.0
25
-0.0
24
-0.0
37**
0.0
30
0.0
11
(-0.9
2)
(-1.1
8)
(-0.9
9)
(-2.0
4)
(0.8
1)(0
.47)
See
dor
Ear
lyS
tage
Fu
nd
0.1
10
0.4
32***
0.1
36
0.4
19***
-0.8
08**
0.0
06
(0.7
3)
(3.2
7)
(1.1
2)
(4.3
7)
(-2.4
0)(0
.03)
Ln
(VC
Inflow
s)-0
.671***
-0.2
87***
-0.6
66***
-0.3
28***
-0.1
340.1
07
(-11.0
1)
(-4.8
1)
(-10.9
8)
(-8.7
1)
(-1.3
6)(1
.49)
No.
ofIP
Os
(in
Th
ousa
nd
s)1.4
84***
-0.0
24
1.0
95***
0.4
36***
-0.2
99
-0.2
29
pri
orto
the
Fun
d’s
Vin
tage
Yea
r(4
.63)
(-0.0
8)
(4.6
3)
(2.7
6)
(-0.5
4)(-
0.6
0)
VC
Fir
mF
ixed
-eff
ects
Yes
Yes
Yes
Yes
Yes
Yes
R2
0.1
19
0.0
76
0.0
82
0.0
57
0.0
41
0.0
24
N1443
1443
1443
1443
1335
1335
50
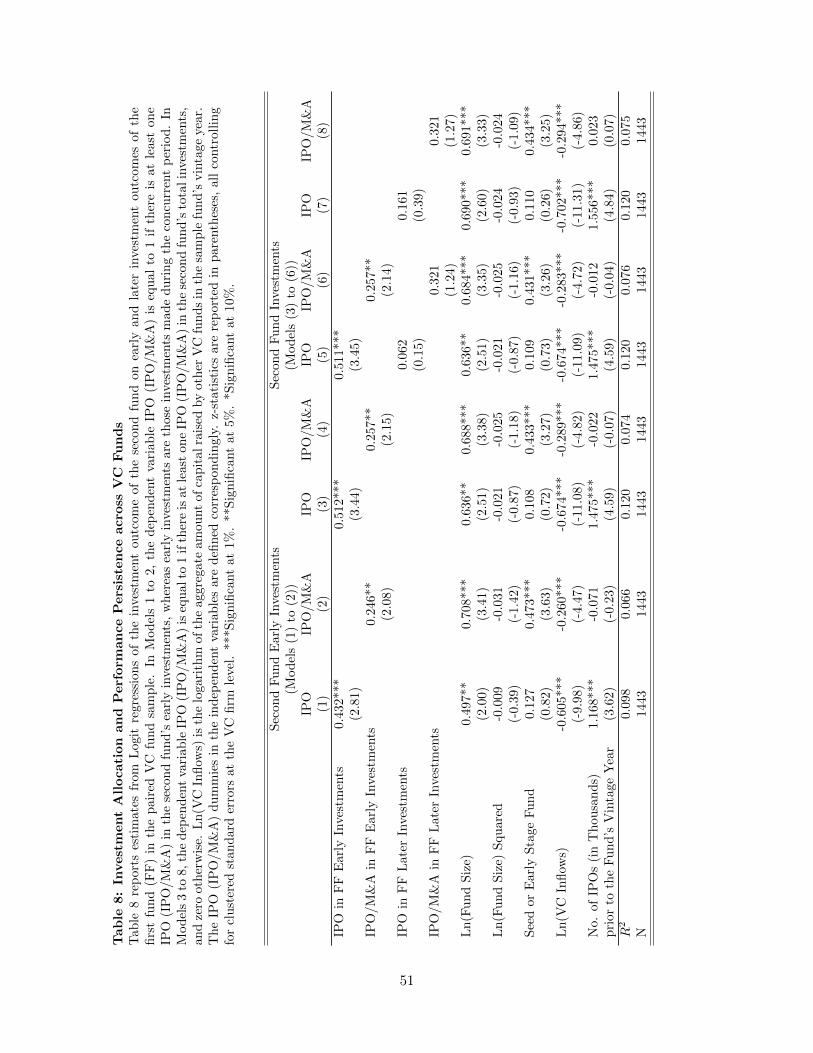
Tab
le8:
Invest
ment
All
ocati
on
an
dP
erf
orm
an
ce
Pers
iste
nce
acro
ssV
CFu
nd
sT
able
8re
por
tses
tim
ates
from
Log
itre
gres
sion
sof
the
inve
stm
ent
ou
tcom
eof
the
seco
nd
fund
on
earl
yan
dla
ter
inves
tmen
toutc
om
esof
the
firs
tfu
nd
(FF
)in
the
pai
red
VC
fun
dsa
mp
le.
InM
od
els
1to
2,
the
dep
end
ent
vari
ab
leIP
O(I
PO
/M
&A
)is
equ
al
to1
ifth
ere
isat
least
on
eIP
O(I
PO
/M&
A)
inth
ese
con
dfu
nd
’sea
rly
inve
stm
ents
,w
her
eas
earl
yin
vest
men
tsare
those
inve
stm
ents
mad
ed
uri
ng
the
con
curr
ent
per
iod
.In
Mod
els
3to
8,th
ed
epen
den
tva
riab
leIP
O(I
PO
/M
&A
)is
equ
alto
1if
ther
eis
at
least
on
eIP
O(I
PO
/M
&A
)in
the
seco
nd
fun
d’s
tota
lin
vest
men
ts,
and
zero
oth
erw
ise.
Ln
(VC
Infl
ows)
isth
elo
gari
thm
of
the
aggre
gate
am
ou
nt
of
cap
italra
ised
by
oth
erV
Cfu
nd
sin
the
sam
ple
fun
d’s
vin
tage
year.
Th
eIP
O(I
PO
/M&
A)
dum
mie
sin
the
ind
epen
den
tva
riab
les
are
defi
ned
corr
esp
on
din
gly
.z-
stati
stic
sare
rep
ort
edin
pare
nth
eses
,all
contr
oll
ing
for
clu
ster
edst
and
ard
erro
rsat
the
VC
firm
leve
l.***S
ign
ifica
nt
at
1%
.**S
ign
ifica
nt
at
5%
.*S
ign
ifica
nt
at
10%
.
Sec
ond
Fu
nd
Earl
yIn
vest
men
tsS
econ
dF
un
dIn
vest
men
ts(M
od
els
(1)
to(2
))(M
od
els
(3)
to(6
))IP
OIP
O/M
&A
IPO
IPO
/M
&A
IPO
IPO
/M
&A
IPO
IPO
/M
&A
(1)
(2)
(3)
(4)
(5)
(6)
(7)
(8)
IPO
inF
FE
arly
Inve
stm
ents
0.43
2***
0.5
12***
0.5
11***
(2.8
1)(3
.44)
(3.4
5)
IPO
/M&
Ain
FF
Ear
lyIn
vest
men
ts0.2
46**
0.2
57**
0.2
57**
(2.0
8)
(2.1
5)
(2.1
4)
IPO
inF
FL
ater
Inves
tmen
ts0.0
62
0.1
61
(0.1
5)
(0.3
9)
IPO
/M&
Ain
FF
Lat
erIn
ves
tmen
ts0.3
21
0.3
21
(1.2
4)
(1.2
7)
Ln
(Fu
nd
Siz
e)0.
497*
*0.7
08***
0.6
36**
0.6
88***
0.6
36**
0.6
84***
0.6
90***
0.6
91***
(2.0
0)(3
.41)
(2.5
1)
(3.3
8)
(2.5
1)
(3.3
5)
(2.6
0)
(3.3
3)
Ln
(Fu
nd
Siz
e)S
qu
ared
-0.0
09-0
.031
-0.0
21
-0.0
25
-0.0
21
-0.0
25
-0.0
24
-0.0
24
(-0.
39)
(-1.4
2)
(-0.8
7)
(-1.1
8)
(-0.8
7)
(-1.1
6)
(-0.9
3)
(-1.0
9)
See
dor
Ear
lyS
tage
Fu
nd
0.12
70.4
73***
0.1
08
0.4
33***
0.1
09
0.4
31***
0.1
10
0.4
34***
(0.8
2)(3
.63)
(0.7
2)
(3.2
7)
(0.7
3)
(3.2
6)
(0.2
6)
(3.2
5)
Ln
(VC
Infl
ows)
-0.6
05**
*-0
.260***
-0.6
74***
-0.2
89***
-0.6
74***
-0.2
83***
-0.7
02***
-0.2
94***
(-9.
98)
(-4.4
7)
(-11.0
8)
(-4.8
2)
(-11.0
9)
(-4.
72)
(-11.3
1)
(-4.8
6)
No.
ofIP
Os
(in
Th
ousa
nd
s)1.
168*
**-0
.071
1.4
75***
-0.0
22
1.4
75***
-0.0
12
1.5
56***
0.0
23
pri
orto
the
Fu
nd
’sV
inta
geY
ear
(3.6
2)(-
0.2
3)
(4.5
9)
(-0.0
7)
(4.5
9)
(-0.0
4)
(4.8
4)
(0.0
7)
R2
0.09
80.0
66
0.1
20
0.0
74
0.1
20
0.0
76
0.1
20
0.0
75
N14
431443
1443
1443
1443
1443
1443
1443
51

Table 9: Performance of VC Investments and VC Fund RaisingTable 9 reports estimates from regressions of the VC fund’s subsequent fundraising on the performanceof the VC fund’s first and first-year investments. The dependent variable is equal to 1 if the VC raisesthe next fund within 5 years of the initiation of the current fund, and zero otherwise. First InvestmentSuccess is a dummy variable that equals one if the first investment of the fund exits through an IPOor M&A, and zero otherwise. First-year Investment Success is a dummy variable that equals one if atleast one of the fund’s first year investments exit through an IPO or M&A, and zero otherwise. Highversus Low VC experience are based on a median split of cumulative financing rounds made by the VCfirm before investing in the fund in question. In Panel B, Performance of the Previous Fund is a dummyvariable equal to one if at least one of the previous fund’s investments exits through an IPO or M&A,and zero otherwise. Ln(VC Inflows) is the logarithm of the aggregate amount of capital raised by otherVC funds in the sample fund’s vintage year. z-statistics are reported in parentheses, all controlling forclustered standard errors at the VC firm level. ***Significant at 1%. **Significant at 5%. *Significantat 10%.
A: Dependent Variables =1 if the VC raises the next fund in 5 yearsAll VCs Hi-Exp VCs Lo-Exp VCs
(1) (2) (3) (4) (5) (6)First Investment Success 0.272*** 0.243 0.295***
(3.16) (1.57) (2.74)First-year Investment Success 0.527*** 0.379** 0.574***
(4.96) (2.05) (4.18)Ln(Fund Size) 0.643*** 0.792*** 0.103 0.237 0.744*** 0.879***
(7.03) (6.74) (0.50) (0.90) (6.31) (6.20)Ln(Fund Size) Squared -0.025** -0.027* 0.026 0.020 -0.049*** -0.047***
(-2.23) (-1.92) (1.11) (0.68) (-3.33) (-2.59)Seed or Early Stage Fund 0.285*** 0.279** 0.229 0.311 0.248** 0.205
(2.93) (2.26) (1.40) (1.49) (2.12) (1.36)Ln(VC Inflows) -0.136*** -0.257*** -0.184** -0.324*** -0.111** -0.215***
(-3.51) (-4.93) (-2.55) (-3.43) (-2.46) (-3.47)No. of IPOs (in Thousands) 0.773*** 0.650** 0.122 -0.035 1.044*** 0.956***prior to the Fund’s Vintage Year (3.78) (2.44) (0.35) (-0.08) (4.06) (2.88)R2 0.093 0.143 0.036 0.056 0.080 0.129N 2884 1883 1166 801 1718 1082
52
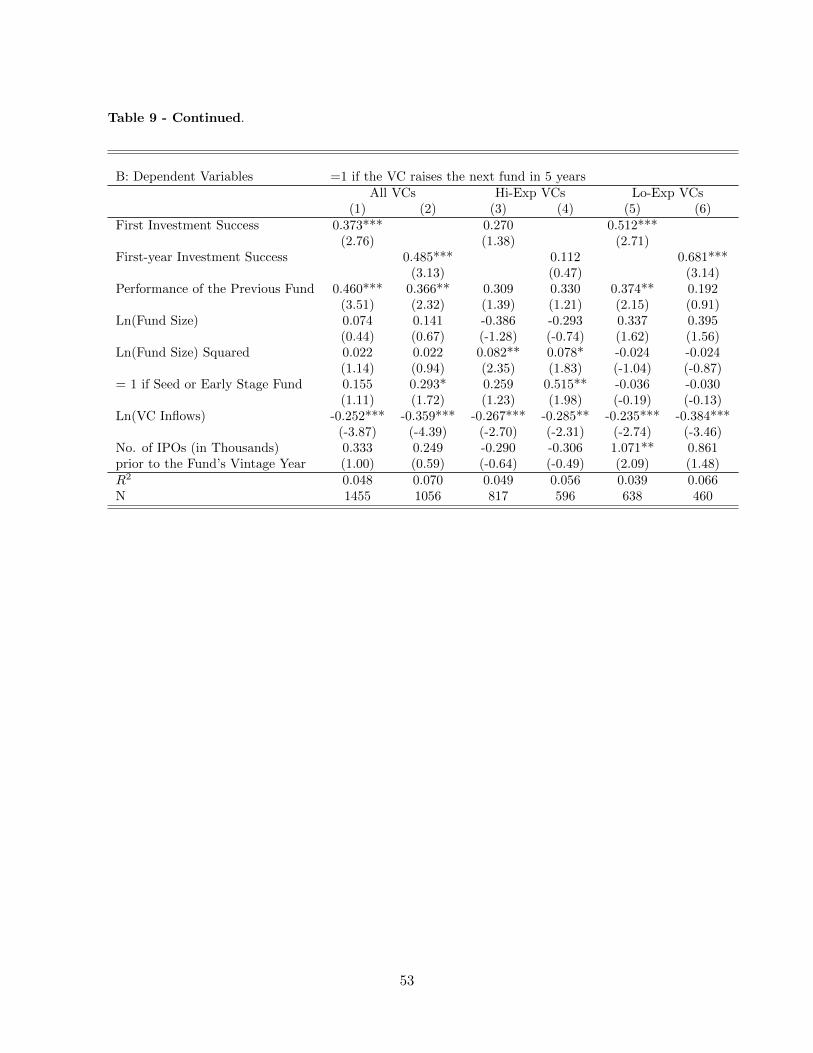
Table 9 - Continued.
B: Dependent Variables =1 if the VC raises the next fund in 5 yearsAll VCs Hi-Exp VCs Lo-Exp VCs
(1) (2) (3) (4) (5) (6)First Investment Success 0.373*** 0.270 0.512***
(2.76) (1.38) (2.71)First-year Investment Success 0.485*** 0.112 0.681***
(3.13) (0.47) (3.14)Performance of the Previous Fund 0.460*** 0.366** 0.309 0.330 0.374** 0.192
(3.51) (2.32) (1.39) (1.21) (2.15) (0.91)Ln(Fund Size) 0.074 0.141 -0.386 -0.293 0.337 0.395
(0.44) (0.67) (-1.28) (-0.74) (1.62) (1.56)Ln(Fund Size) Squared 0.022 0.022 0.082** 0.078* -0.024 -0.024
(1.14) (0.94) (2.35) (1.83) (-1.04) (-0.87)= 1 if Seed or Early Stage Fund 0.155 0.293* 0.259 0.515** -0.036 -0.030
(1.11) (1.72) (1.23) (1.98) (-0.19) (-0.13)Ln(VC Inflows) -0.252*** -0.359*** -0.267*** -0.285** -0.235*** -0.384***
(-3.87) (-4.39) (-2.70) (-2.31) (-2.74) (-3.46)No. of IPOs (in Thousands) 0.333 0.249 -0.290 -0.306 1.071** 0.861prior to the Fund’s Vintage Year (1.00) (0.59) (-0.64) (-0.49) (2.09) (1.48)R2 0.048 0.070 0.049 0.056 0.039 0.066N 1455 1056 817 596 638 460
53