
INVESTMENT ADVISER’S LETTER TO SHAREHOLDERS SEMI-ANNUAL REPORT€¦ · · 2015-11-23This...
60
TWEEDY, BROWNE FUND INC. This booklet consists of two separate documents: INVESTMENT ADVISER’S LETTER TO SHAREHOLDERS SEMI-ANNUAL REPORT Tweedy, Browne Global Value Fund (TBGVX) Tweedy, Browne Global Value Fund II – Currency Unhedged (TBCUX) Tweedy, Browne Value Fund (TWEBX) Tweedy, Browne Worldwide High Dividend Yield Value Fund (TBHDX) September 30, 2015
Transcript of INVESTMENT ADVISER’S LETTER TO SHAREHOLDERS SEMI-ANNUAL REPORT€¦ · · 2015-11-23This...
TWEEDY, BROWNE FUND INC.
This booklet consists of two separate documents:
INVESTMENT ADVISER’S LETTERTO SHAREHOLDERS
SEMI-ANNUAL REPORT
Tweedy, Browne Global Value Fund (TBGVX)Tweedy, Browne Global Value Fund II – Currency Unhedged (TBCUX)
Tweedy, Browne Value Fund (TWEBX)Tweedy, Browne Worldwide High Dividend Yield Value Fund (TBHDX)
September 30, 2015
TWEEDY, BROWNE FUND INC.
Investment Adviser’s Letter to Shareholders . . . . . . . . . . . . . . . . . . . . . . . . . . . . . . . . . . . . . I-1Different Perspectives on Investment Performance . . . . . . . . . . . . . . . . . . . . . . . . . . . . . Appendix
Semi-Annual Report . . . . . . . . . . . . . . . . . . . . . . . . . . . . . . . . . . . . . . . . . . . . . . . . . . . . . . . . . . II-1
Tweedy, Browne Fund Inc.Expense Information . . . . . . . . . . . . . . . . . . . . . . . . . . . . . . . . . . . . . . . . . . . . . . . . . . . . . II-2
Tweedy, Browne Global Value FundPortfolio of Investments . . . . . . . . . . . . . . . . . . . . . . . . . . . . . . . . . . . . . . . . . . . . . . . . . . . II-3Sector Diversification . . . . . . . . . . . . . . . . . . . . . . . . . . . . . . . . . . . . . . . . . . . . . . . . . . . . II-5Portfolio Composition . . . . . . . . . . . . . . . . . . . . . . . . . . . . . . . . . . . . . . . . . . . . . . . . . . . . II-5Schedule of Forward Exchange Contracts . . . . . . . . . . . . . . . . . . . . . . . . . . . . . . . . . . . . . II-5
Tweedy, Browne Global Value Fund II – Currency UnhedgedPortfolio of Investments . . . . . . . . . . . . . . . . . . . . . . . . . . . . . . . . . . . . . . . . . . . . . . . . . . . II-8Sector Diversification . . . . . . . . . . . . . . . . . . . . . . . . . . . . . . . . . . . . . . . . . . . . . . . . . . . . II-9Portfolio Composition . . . . . . . . . . . . . . . . . . . . . . . . . . . . . . . . . . . . . . . . . . . . . . . . . . . . II-9
Tweedy, Browne Value FundPortfolio of Investments . . . . . . . . . . . . . . . . . . . . . . . . . . . . . . . . . . . . . . . . . . . . . . . . . . . II-10Sector Diversification . . . . . . . . . . . . . . . . . . . . . . . . . . . . . . . . . . . . . . . . . . . . . . . . . . . . II-11Portfolio Composition . . . . . . . . . . . . . . . . . . . . . . . . . . . . . . . . . . . . . . . . . . . . . . . . . . . . II-11Schedule of Forward Exchange Contracts . . . . . . . . . . . . . . . . . . . . . . . . . . . . . . . . . . . . . II-11
Tweedy, Browne Worldwide High Dividend Yield Value FundPortfolio of Investments . . . . . . . . . . . . . . . . . . . . . . . . . . . . . . . . . . . . . . . . . . . . . . . . . . . II-12Sector Diversification . . . . . . . . . . . . . . . . . . . . . . . . . . . . . . . . . . . . . . . . . . . . . . . . . . . . II-13Portfolio Composition . . . . . . . . . . . . . . . . . . . . . . . . . . . . . . . . . . . . . . . . . . . . . . . . . . . . II-13
Tweedy, Browne Fund Inc.Statements of Assets and Liabilities . . . . . . . . . . . . . . . . . . . . . . . . . . . . . . . . . . . . . . . . . II-14Statements of Operations . . . . . . . . . . . . . . . . . . . . . . . . . . . . . . . . . . . . . . . . . . . . . . . . . II-15Statements of Changes in Net Assets . . . . . . . . . . . . . . . . . . . . . . . . . . . . . . . . . . . . . . . . II-16Financial Highlights . . . . . . . . . . . . . . . . . . . . . . . . . . . . . . . . . . . . . . . . . . . . . . . . . . . . . . II-18Notes to Financial Statements . . . . . . . . . . . . . . . . . . . . . . . . . . . . . . . . . . . . . . . . . . . . . . II-20Investment in the Fund by Managing Directors and Employees of the
Investment Adviser . . . . . . . . . . . . . . . . . . . . . . . . . . . . . . . . . . . . . . . . . . . . . . . . . . . . II-23Other Information . . . . . . . . . . . . . . . . . . . . . . . . . . . . . . . . . . . . . . . . . . . . . . . . . . . . . . . II-28
TWEEDY, BROWNE FUND INC.
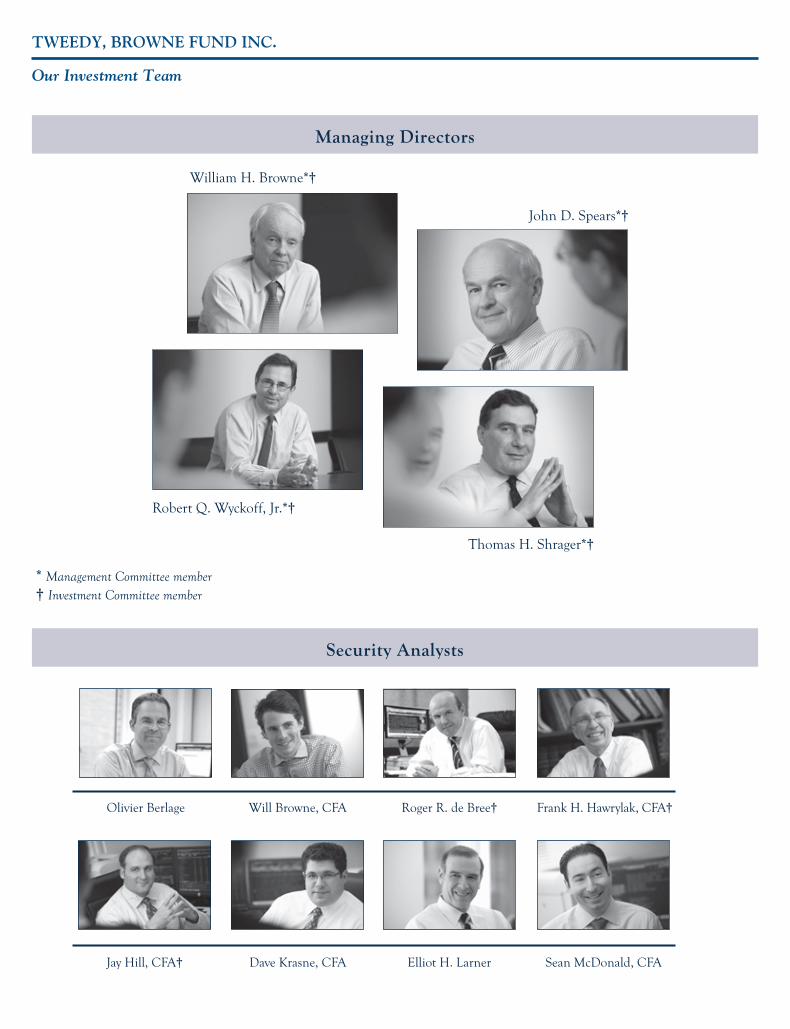
Our Investment Team
Managing Directors
William H. Browne*†
John D. Spears*†
Thomas H. Shrager*†
Robert Q. Wyckoff, Jr.*†
Olivier Berlage Frank H. Hawrylak, CFA†
Dave Krasne, CFA Elliot H. Larner Sean McDonald, CFAJay Hill, CFA†
Roger R. de Bree†Will Browne, CFA
Security Analysts
* Management Committee member† Investment Committee member

This page left blank intentionally.
TWEEDY, BROWNE FUND INC.
Investment Adviser’s Letter to Shareholders (Unaudited)
Slowing growth in China, the world’s second largesteconomy, coupled with uncertainty surrounding theprospective normalization of interest rates in theUnited States sent tremors through global equity markets overthe last several months. After a rather short lived and furiouscorrection in late August and early September, global equitymarkets regained their footing and, as we write, have takenback much of the ground they lost as summer came to an end.
For value investors such as ourselves, it remained businessas usual through this turbulence, although we would admit toa certain counterintuitive satisfaction as equity markets begantheir long overdue retreat. After six and a half years ofrelatively smooth sailing, setting aside a brief hiccup in 2011,it had become quite a challenging environment for valueinvestors. Bargains had become increasingly scarce and manyof our existing holdings were trading at or near our estimatesof their intrinsic value – consequently, we were selling andtrimming back a number of those positions. As a result, cashreserves had increased and our returns were somewhat dilutedwhile the bull markets and their associated benchmark indicesraged on. We were able to take some advantage of themarkets’ downside volatility in late summer. However, it didnot last long enough, nor was it steep enough, for us to makesignificant headway in putting our cash reserves to work.
As we have explained in previous letters, equity returnstreams are lumpy by their nature. We can identify companiesthat we believe are undervalued at purchase, but have nocontrol as to when (or if) that value gets recognized in public
markets. That recognition often occurs with a great deal ofrandomness. Therefore, in all investment records, there is anelement of both luck and skill. As we mentioned in last year’ssemi-annual report, since a multitude of variables move stockprices around, particularly in the short run, it is virtuallyimpossible to divine skill from luck without a large samplesize, i.e., a long record. One thing we have in abundance atTweedy, Browne, given our long history and pedigree, arelong, successful investment records. In the case of our mutualfunds, those records have bested benchmark indices sincetheir respective inceptions. However, those return streamshave been lumpy, with multiple interim periods ofunderperformance like the one we are going through now.And yet this periodic underperformance has been part andparcel, in our case, of long-term, successful performancerecords.
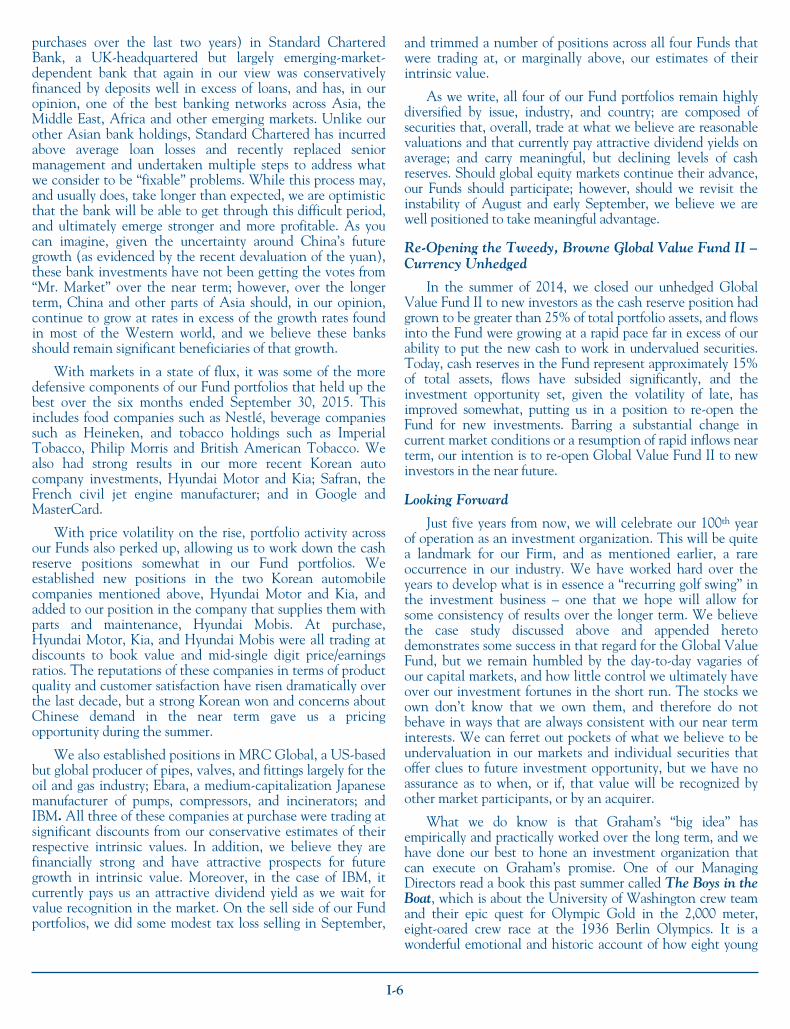
Included below is a chart that we believe providesadditional perspective on the Global Value Fund’s 22 plus-year investment record. It is in the form of a scatterplot, andexamines 3-year rolling returns since inception for the GlobalValue Fund as compared to the MSCI EAFE Index (Hedgedto US$) for different types of equity market environments.The chart illustrates that periods of relative outperformancefor the Fund have tended to occur in “down” and more“normal” market environments, while periods of relativeunderperformance have tended to cluster in very “robust,”more speculative market environments, like the one we havebeen in over the last three years.
I-1
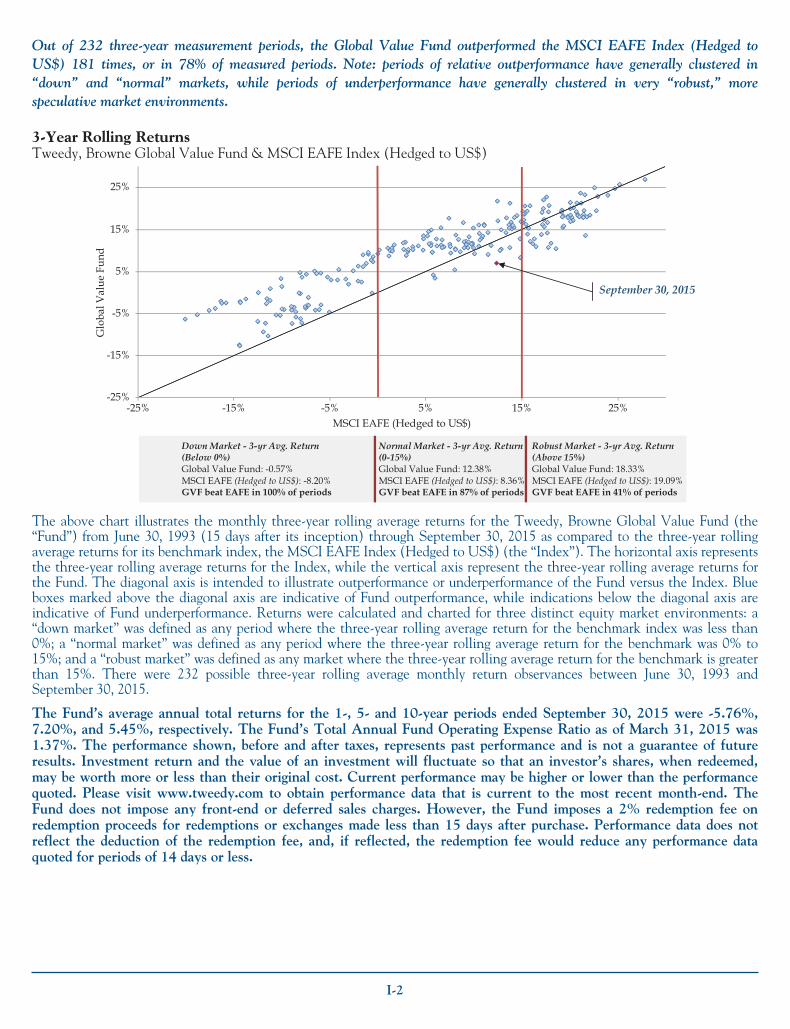
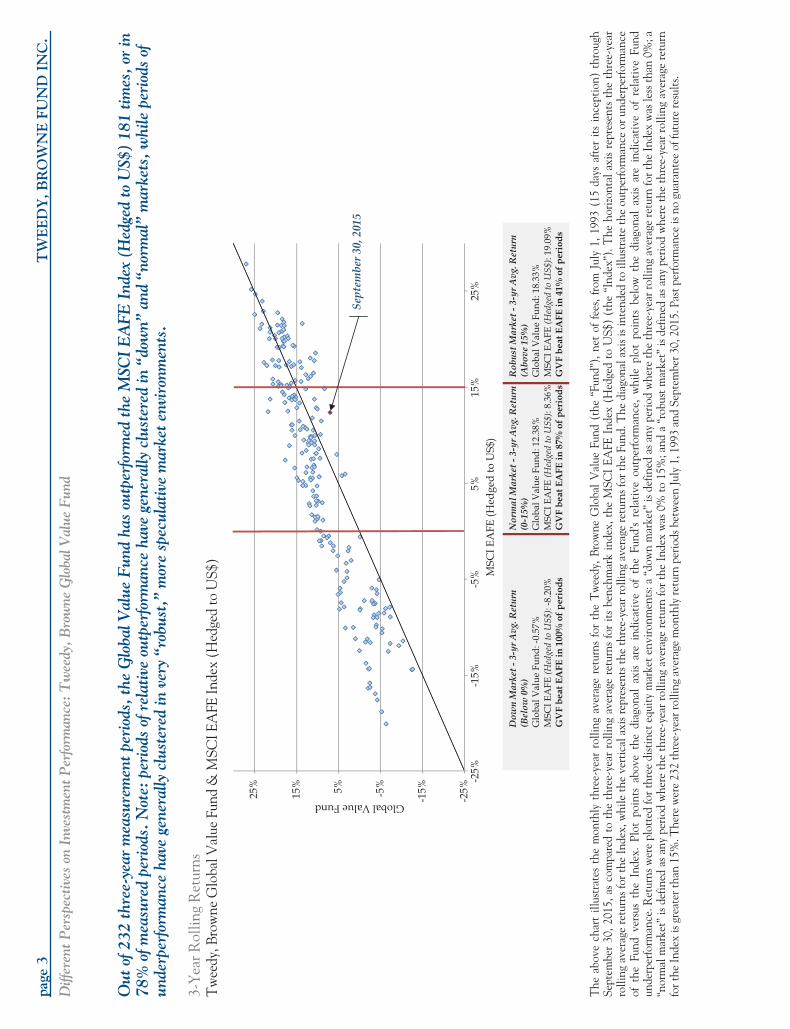
Out of 232 three-year measurement periods, the Global Value Fund outperformed the MSCI EAFE Index (Hedged toUS$) 181 times, or in 78% of measured periods. Note: periods of relative outperformance have generally clustered in“down” and “normal” markets, while periods of underperformance have generally clustered in very “robust,” morespeculative market environments.
3-Year Rolling ReturnsTweedy, Browne Global Value Fund & MSCI EAFE Index (Hedged to US$)
Down Market - 3-yr Avg. Return (Below 0%) Global Value Fund: -0.57% MSCI EAFE (Hedged to US$): -8.20%GVF beat EAFE in 100% of periods
Normal Market - 3-yr Avg. Return (0-15%) Global Value Fund: 12.38% MSCI EAFE (Hedged to US$): 8.36%GVF beat EAFE in 87% of periods
Robust Market - 3-yr Avg. Return (Above 15%) Global Value Fund: 18.33% MSCI EAFE (Hedged to US$): 19.09%GVF beat EAFE in 41% of periods
-25%
-15%
-5%
5%
15%
25%
25%15%5%-5%-15%-25%
Glo
bal V
alue
Fun
d
MSCI EAFE (Hedged to US$)
September 30, 2015
The above chart illustrates the monthly three-year rolling average returns for the Tweedy, Browne Global Value Fund (the“Fund”) from June 30, 1993 (15 days after its inception) through September 30, 2015 as compared to the three-year rollingaverage returns for its benchmark index, the MSCI EAFE Index (Hedged to US$) (the “Index”). The horizontal axis representsthe three-year rolling average returns for the Index, while the vertical axis represent the three-year rolling average returns forthe Fund. The diagonal axis is intended to illustrate outperformance or underperformance of the Fund versus the Index. Blueboxes marked above the diagonal axis are indicative of Fund outperformance, while indications below the diagonal axis areindicative of Fund underperformance. Returns were calculated and charted for three distinct equity market environments: a“down market” was defined as any period where the three-year rolling average return for the benchmark index was less than0%; a “normal market” was defined as any period where the three-year rolling average return for the benchmark was 0% to15%; and a “robust market” was defined as any market where the three-year rolling average return for the benchmark is greaterthan 15%. There were 232 possible three-year rolling average monthly return observances between June 30, 1993 andSeptember 30, 2015.
The Fund’s average annual total returns for the 1-, 5- and 10-year periods ended September 30, 2015 were -5.76%,7.20%, and 5.45%, respectively. The Fund’s Total Annual Fund Operating Expense Ratio as of March 31, 2015 was1.37%. The performance shown, before and after taxes, represents past performance and is not a guarantee of futureresults. Investment return and the value of an investment will fluctuate so that an investor’s shares, when redeemed,may be worth more or less than their original cost. Current performance may be higher or lower than the performancequoted. Please visit www.tweedy.com to obtain performance data that is current to the most recent month-end. TheFund does not impose any front-end or deferred sales charges. However, the Fund imposes a 2% redemption fee onredemption proceeds for redemptions or exchanges made less than 15 days after purchase. Performance data does notreflect the deduction of the redemption fee, and, if reflected, the redemption fee would reduce any performance dataquoted for periods of 14 days or less.
I-2
As the above chart demonstrates, the underperformanceof our value driven strategy in the Global Value Fund overthe last several years would appear to be quite normal and tobe expected in the later stages of a bull market, when equityvaluations become untethered from underlying estimatedintrinsic values. In fact, if we were “winning big” in thisenvironment, it would certainly seem out of step with thepattern of our historical returns, and would no doubt promptsome questions.
Following this letter is a study we’ve recently publishedentitled “Different Perspectives on Investment Performance –Tweedy, Browne Global Value Fund.” The study examines in-depth the long-term return history of our flagship Fund, theTweedy, Browne Global Value Fund, since its inception in thesummer of 1993. The study includes an analysis of rollingperiod results in different market environments, the variabilityof returns, down market performance, “peak-to-trough”declines and subsequent recovery, upside/downside captureratios, and after-tax returns.
We hope it provides some additional perspective on whathas been a long and successful, yet “lumpy” investmentexperience for Global Value Fund shareholders. Included inthe study are several rolling period return charts that illustratethat, the longer the measurement period, the greater theconsistency of outperformance of the Fund. We believe thesecharts provide interesting perspective about the returns of theGlobal Value Fund over long measurement periods. Since itsinception on June 15, 1993, an initial investment of $100,000in the Global Value Fund would be worth $739,293, as ofSeptember 30, 2015. By comparison, an investment onJune 15, 1993 in the MSCI EAFE Index (Hedged to US$)would be worth $339,350.
While there are no guarantees, the study also suggests thatthis difficult slice of time will eventually pass, and we willonce again have new opportunities. With the FederalReserve’s back against the wall and the Chinese economycontinuing to grind down, we suspect we have not seen theend of unsettled markets, and if the recent volatility persists,as we suspect it will, we feel we are well positioned to takemeaningful advantage. In times like these, we are once againreminded of Ben Graham’s cautionary parable of “Mr.Market,” the obliging, but moody fellow who turns up everyday at the shareholder’s door, offering to buy his shares at aprice. Depending on his mood, that price could be absurdlyhigh, perhaps about right, ridiculously low, or somewhere inbetween. As Warren Buffett has counseled:
Mr. Market is there to serve you, not to guide you. It ishis pocketbook, not his wisdom that you will finduseful. If he shows up someday in a particularly foolishmood, you are free to ignore him or to take advantageof him, but it will be disastrous if you fall under hisinfluence.
As your Fund manager, you can count on us to try to putMr. Market’s anxiety into perspective, and behave rationally,so that we can capture for you some of the rewards that webelieve will come in the future. We hope that, through ouractions and words, we are able to do just that.
Stability of People and Process
We thought it might make sense, in addition toruminating about our Funds and markets, to reflect upon theorganization to which you have entrusted a portion of yourhard-earned capital. We are rapidly approaching our 95th
birthday as an investment organization grounded in a deeplyrooted value oriented investment discipline that has provenits efficacy both empirically and in practice over the years. Aswe have said quite often, we remain deeply indebted toMessrs. Graham, Buffett, Munger and Schloss, our intellectualforebears, for having paved the way for multiple generationsof Tweedy, Browne employees. We are now fortunate to havea third generation of Brownes working at our firm.
While new investment products in the moneymanagement industry have multiplied and investor timehorizons have shortened, we have remained dedicated toGraham’s simple but elegant proposition that there are inessence two prices for every share of stock: the price listed onthe exchange on any given day, and the other price, the onethat would accrue to investors if the entire company werepurchased outright in an arms-length negotiated transactionbetween a knowledgeable buyer and seller. Graham referredto this price as the intrinsic value of the business, and to hisway of thinking, the essence of investment was to try toexploit discrepancies between these two prices – in otherwords, to try to take advantage of mis-pricings in public equitymarkets. To this day, judgments around these two prices formthe basis for everything that we do at Tweedy, Browne.Thank you, Ben.
Looking back, surviving intact for roughly 95 years is arather remarkable feat for an investment organization,particularly in this day and age. We believe the key to thissuccess has been our strict adherence to a highly efficaciousinvestment approach and process, stewardship by successivegenerations of partners who have been willing to subsumetheir individual egos for the sake of the firm as a whole, and ahealthy dollop of good luck. We have been incrediblyfortunate in running our business, relying on a collaborative,team-oriented approach that we feel provides a betterframework for investment decision-making than an approachbased on any one individual’s investment acumen. It hasbecome clear to us over time that the diversity of perspectivethat this structure provides often leads to unique insights,deeper understanding, and occasional breakthroughs inresearch, all necessary for high quality investment decisions. Ithas also become clear that maintaining a balance ofpersonalities and skill sets is essential in preserving theinterpersonal harmony necessary for long and successfulcareers at our firm. We feel we have been successful atcreating a culture that fosters cooperation for the good of thefirm with the result being that each individual is better for it.
Our Investment Committee today is comprised of our fourlong-serving Managing Directors, Will Browne, Tom Shrager,John Spears, and Bob Wyckoff, and three of our analysts,Roger de Bree, Frank Hawrylak, and Jay Hill, each of whomjoined our Investment Committee within the last two yearsafter many years of service to our firm. The four ManagingDirectors have worked together at Tweedy continuously for
I-3
between 24 and 41 years, while the analysts on theInvestment Committee have been on board for between 12and 29 years. No Managing Director or past partner ofTweedy, Browne has ever left the firm to take another job.All of the members of our Investment Committee haveownership stakes in the firm, and have a significant portion oftheir net worth invested alongside clients in the variousinvestment products that the firm offers. While none of us atthe Managing Director level have any immediate plans forretirement, our clients should be able to take comfort in thefact that, given the skill sets of our Investment Committeeanalysts, the transition to new leadership when the day comesshould once again be seamless.
The long tenure and dedication of personnel at Tweedy,Browne extends across virtually all departments. For example,the remaining five analysts who do not currently serve on ourInvestment Committee have been employed at Tweedy,Browne for between six and 28 years. The average time inservice at Tweedy of traders on our trading desk is 20 years,and the eight members of our Client Services team have beenat the firm for an average of 13 years. Jason Minard, whoheads our Client Services department, Glenn Finn, our ChiefOperations Officer, and Pat Rogers, our Chief Legal Counsel,are each in their 17th year at the firm; Jane Ciar, our MutualFund Coordinator, is in her 27th year; John Mullahey, thehead of our computer department, is in his 28th year; andMary Gaddist, our Librarian, is in her 36th year at Tweedy,Browne. We have also made it a practice that all departmentheads are responsible for grooming their potential successors,so that we have coverage in the event they get hit by theproverbial bus.
So while the near-term environment has beenchallenging for value investors such as ourselves, the longer-term results of the Funds continue to be strong. Themanagement team that produced these long-term records islargely the same management team that is in place today. Theinvestment approach and process have not changed, and wecontinue to hammer away at our business, day in and day out.
Performance Results
While the Tweedy, Browne Funds and their respectivebenchmark indices finished the six months endedSeptember 30 in the red, relative results for the Funds weremixed. Our two international Funds, the Tweedy, BrowneGlobal Value Fund and the Tweedy, Browne Global ValueFund II – Currency Unhedged, bested their respectivebenchmark indices by a considerable margin, while our twoglobal Funds, the Tweedy, Browne Value Fund and theTweedy, Browne Worldwide High Dividend Yield ValueFund, trailed their respective benchmarks for the period. Nearquarter-end, equity markets began to rebound, and as we writein October, they have regained much of the ground that waslost in August and early September, and the same holds truefor the Tweedy, Browne Funds. Longer-term comparisonsremain more favorable.
Presented below are the results of the Tweedy, Browne Fundsfor various periods through September 30, 2015, withcomparisons to indices we consider relevant.
Tweedy, Browne Global Value Fund
Period Ended9/30/15
ReturnbeforeTaxes*
Returnafter
Taxes onDistributions**
Return afterTaxes on
Distributions &Sale of Fund
Shares**
MSCIEAFE
Index(1)(2)
(Hedgedto US$)†
MSCIEAFE
Index(1)(2)
(in US$)†
6 Months -7.23% -7.23% -4.09% -10.73% -9.68%
1 Year -5.76 -6.48 -2.44 0.32 -8.66
3 Years 6.99 5.93 5.80 12.39 5.63
5 Years 7.20 6.48 6.03 7.62 3.98
10 Years 5.45 4.74 4.71 3.93 2.97
15 Years 6.07 5.26 5.08 2.22 3.03
20 Years 9.13 8.02 7.63 5.66 4.39
Since Inception(6/15/93)(3) 9.39 8.37 7.96 5.62 4.85
Total Annual Fund Operating Expense Ratio as of 3/31/15: 1.37%††
Tweedy, Browne Global Value Fund II –Currency Unhedged
Period Ended9/30/15
ReturnbeforeTaxes*
Returnafter
Taxes onDistributions**
Return afterTaxes on
Distributions &Sale of Fund
Shares**
MSCIEAFE
Index(1)(2)
(in US$)†
6 Months -7.13% -7.13% -4.04% -9.68%1 Year -10.55 -10.74 -5.62 -8.663 Years 4.20 4.03 3.41 5.635 Years 5.38 5.23 4.34 3.98Since Inception(10/26/09)(3) 5.63 5.50 4.54 3.63Gross Annual Fund Operating Expense Ratio as of 3/31/15: 1.37%††‡Net Annual Fund Operating Expense Ratio as of 3/31/15: 1.38%††‡
Tweedy, Browne Value Fund§
Period Ended9/30/15
ReturnbeforeTaxes*
Returnafter
Taxes onDistributions**
Return afterTaxes on
Distributions& Saleof FundShares**
MSCIWorldIndex
(Hedgedto
US$)(1)(5)†
S&P 500/MSCIWorldIndex
(Hedgedto
US$)(1)(4)(5)(6)†¶
6 Months -9.67% -9.67% -5.47% -8.40% -8.40%1 Year -10.21 -11.80 -4.24 -0.92 -0.923 Years 6.45 5.04 5.19 11.73 11.735 Years 7.35 6.19 5.96 9.96 9.96
10 Years 4.88 3.66 4.06 5.11 4.7515 Years 4.54 3.49 3.70 2.85 2.6320 Years 7.41 6.39 6.21 6.67 7.09
Since Inception(12/8/93)(3) 8.09 7.14 6.89 6.92 7.84
Total Annual Fund Operating Expense Ratio as of 3/31/15: 1.37%††¶ S&P 500 Index (12/8/93-12/31/06)/MSCI World Index (Hedged to US$)(1/1/07-present).
I-4
Tweedy, Browne WorldwideHigh Dividend Yield Value Fund§
Period Ended9/30/15
ReturnbeforeTaxes*
Returnafter
Taxes onDistributions**
Return afterTaxes on
Distributions &Sale of Fund
Shares**
MSCIWorld
Index(1)(5)
(in US$)†
6 Months -9.76% -10.13% -5.50% -8.16%1 Year -11.78 -13.42 -5.11 -5.093 Years 3.11 2.24 2.54 8.585 Years 5.38 4.76 4.36 8.29Since Inception(9/5/07)(3) 2.46 1.86 1.97 2.36Total Annual Fund Operating Expense Ratio as of 3/31/15: 1.36%††‡30-Day Standardized Yield as of 9/30/15: 2.30%
* The preceding performance data represent past performance andis not a guarantee of future results. Total return and principalvalue of an investment will fluctuate so that an investor’s shares,when redeemed, may be worth more or less than their original cost.The returns shown do not reflect the deduction of taxes that ashareholder would pay on Fund distributions or the redemption ofFund shares. Current performance may be lower or higher than theperformance data shown. Please visit www.tweedy.com to obtainperformance data that is current to the most recent month end. Seepages I-7 and I-8 for footnotes 1 through 6, which describe theindices and inception dates of the Funds. Results are annualized forall periods greater than one year.
** After-tax returns are calculated using the historical highestindividual federal marginal income tax rates, and do not reflect theimpact of state and local taxes. Returns after taxes on distributionsare adjusted for federal income taxes associated with Funddistributions, but do not reflect the federal income tax impact ofgains or losses recognized when Fund shares are sold. Returns aftertaxes on distributions and sale of Fund shares are adjusted forfederal income taxes associated with Fund distributions and reflectthe federal income tax impact of gains or losses recognized whenFund shares are sold. Actual after-tax returns depend on aninvestor’s tax situation and may differ from those shown, and theafter-tax returns shown are not relevant to investors who hold theirFund shares through tax-deferred arrangements such as 401(k)plans or individual retirement accounts.
† Investors cannot invest directly in an index, unlike an index fund.Index returns are not adjusted to reflect the deduction of taxes thatan investor would pay on distributions or the sale of securitiescomprising the index.
†† The Funds do not impose any front-end or deferred salescharges. However, the Global Value Fund, Global Value Fund II– Currency Unhedged and Worldwide High Dividend Yield ValueFund impose a 2% redemption fee on redemption proceeds forredemptions or exchanges made less than 15 days after purchase.Performance data does not reflect the deduction of the redemptionfee, and, if reflected, the redemption fee would reduce anyperformance data quoted for periods of 14 days or less. Theexpense ratios shown above reflect the inclusion of acquired fundfees and expenses (i.e., the fees and expenses attributable toinvesting cash balances in money market funds) and may differfrom those shown in the Funds’ financial statements.
‡ Prior to January 1, 2015, the Adviser had contractually agreed towaive its investment advisory fee and/or to reimburse expenses of the
Global Value Fund II – Currency Unhedged to the extent necessaryto maintain the total annual fund operating expenses (excluding feesand expenses from investments in other investment companies,brokerage, interest, taxes and extraordinary expenses (“excludedexpenses”)) at no more than 1.37%. This arrangement terminatedon December 31, 2014. The Global Value Fund II – CurrencyUnhedged has agreed, during the two-year period following anywaiver or reimbursement by the Adviser, to repay such amount tothe extent that, after giving effect to such repayment, the Fund’sadjusted total annual fund operating expenses, not including anyexcluded expenses, would not exceed 1.37% on an annualized basis.The performance data shown above would have been lower hadcertain fees and expenses not been waived and/or reimbursedthrough December 31, 2014.
§ The Value Fund’s and the Worldwide High Dividend YieldValue Fund’s performance data shown above would have beenlower had certain fees and expenses not been waived fromDecember 8, 1993 through March 31, 1999 (for the ValueFund) and from September 5, 2007 through December 31,2013 (for the Worldwide High Dividend Yield Value Fund).
/ /
Our Fund Portfolios
Please note that individual companies discussed herein representholdings in our Funds, but are not necessarily held in all four of ourFunds. Refer to footnote 7 at the end of the letter for the individualweightings of these companies in the respective Funds.
While we welcomed the volatility of the last two quartersfor the opportunities it often brings, our Funds did lose someground on an absolute basis. While companies around theglobe were negatively impacted by the markets’ decline, wegave up the most ground in our oil & gas and bank holdings.Oil prices were highly volatile over the last six months, anduncertainty surrounding China’s economy have cast a pallover commodities, Asian and emerging-market-relatedcompanies. Energy-related holdings such as Halliburton andoil & gas production companies such as Devon Energy, Total,and Royal Dutch were up and down as oil prices vacillatedbetween $48 and $66 per barrel. We continue to believe that,given industry demand and cost considerations, oil prices arelikely to move higher over the longer term, and, if that indeedbears out, we are well positioned in what we feel is adiversified and undervalued group of companies in the sector.We also have little doubt that our companies have thefinancial resources to weather this period of lower energyprices.
Prior to the recent correction, the only place where youcould uncover fear in the markets was in emerging marketcountries and in commodity-related businesses, and thatpretty much remains the case. We certainly witnessed thisover the last six months in our Asian-related bank holdings.As you know from past letters, we have had long andsuccessful investments in two Singapore banks, DBS Groupand United Overseas Bank, both of which in our view arehigh quality, conservatively financed, and well-managedbanking institutions that have significant growth prospectsand currently pay us very attractive, 4% plus annual dividendyields. We have also made an investment (in multiple lot
I-5
purchases over the last two years) in Standard CharteredBank, a UK-headquartered but largely emerging-market-dependent bank that again in our view was conservativelyfinanced by deposits well in excess of loans, and has, in ouropinion, one of the best banking networks across Asia, theMiddle East, Africa and other emerging markets. Unlike ourother Asian bank holdings, Standard Chartered has incurredabove average loan losses and recently replaced seniormanagement and undertaken multiple steps to address whatwe consider to be “fixable” problems. While this process may,and usually does, take longer than expected, we are optimisticthat the bank will be able to get through this difficult period,and ultimately emerge stronger and more profitable. As youcan imagine, given the uncertainty around China’s futuregrowth (as evidenced by the recent devaluation of the yuan),these bank investments have not been getting the votes from“Mr. Market” over the near term; however, over the longerterm, China and other parts of Asia should, in our opinion,continue to grow at rates in excess of the growth rates foundin most of the Western world, and we believe these banksshould remain significant beneficiaries of that growth.
With markets in a state of flux, it was some of the moredefensive components of our Fund portfolios that held up thebest over the six months ended September 30, 2015. Thisincludes food companies such as Nestlé, beverage companiessuch as Heineken, and tobacco holdings such as ImperialTobacco, Philip Morris and British American Tobacco. Wealso had strong results in our more recent Korean autocompany investments, Hyundai Motor and Kia; Safran, theFrench civil jet engine manufacturer; and in Google andMasterCard.
With price volatility on the rise, portfolio activity acrossour Funds also perked up, allowing us to work down the cashreserve positions somewhat in our Fund portfolios. Weestablished new positions in the two Korean automobilecompanies mentioned above, Hyundai Motor and Kia, andadded to our position in the company that supplies them withparts and maintenance, Hyundai Mobis. At purchase,Hyundai Motor, Kia, and Hyundai Mobis were all trading atdiscounts to book value and mid-single digit price/earningsratios. The reputations of these companies in terms of productquality and customer satisfaction have risen dramatically overthe last decade, but a strong Korean won and concerns aboutChinese demand in the near term gave us a pricingopportunity during the summer.
We also established positions in MRC Global, a US-basedbut global producer of pipes, valves, and fittings largely for theoil and gas industry; Ebara, a medium-capitalization Japanesemanufacturer of pumps, compressors, and incinerators; andIBM. All three of these companies at purchase were trading atsignificant discounts from our conservative estimates of theirrespective intrinsic values. In addition, we believe they arefinancially strong and have attractive prospects for futuregrowth in intrinsic value. Moreover, in the case of IBM, itcurrently pays us an attractive dividend yield as we wait forvalue recognition in the market. On the sell side of our Fundportfolios, we did some modest tax loss selling in September,
and trimmed a number of positions across all four Funds thatwere trading at, or marginally above, our estimates of theirintrinsic value.
As we write, all four of our Fund portfolios remain highlydiversified by issue, industry, and country; are composed ofsecurities that, overall, trade at what we believe are reasonablevaluations and that currently pay attractive dividend yields onaverage; and carry meaningful, but declining levels of cashreserves. Should global equity markets continue their advance,our Funds should participate; however, should we revisit theinstability of August and early September, we believe we arewell positioned to take meaningful advantage.
Re-Opening the Tweedy, Browne Global Value Fund II –Currency Unhedged
In the summer of 2014, we closed our unhedged GlobalValue Fund II to new investors as the cash reserve position hadgrown to be greater than 25% of total portfolio assets, and flowsinto the Fund were growing at a rapid pace far in excess of ourability to put the new cash to work in undervalued securities.Today, cash reserves in the Fund represent approximately 15%of total assets, flows have subsided significantly, and theinvestment opportunity set, given the volatility of late, hasimproved somewhat, putting us in a position to re-open theFund for new investments. Barring a substantial change incurrent market conditions or a resumption of rapid inflows nearterm, our intention is to re-open Global Value Fund II to newinvestors in the near future.
Looking Forward
Just five years from now, we will celebrate our 100th yearof operation as an investment organization. This will be quitea landmark for our Firm, and as mentioned earlier, a rareoccurrence in our industry. We have worked hard over theyears to develop what is in essence a “recurring golf swing” inthe investment business – one that we hope will allow forsome consistency of results over the longer term. We believethe case study discussed above and appended heretodemonstrates some success in that regard for the Global ValueFund, but we remain humbled by the day-to-day vagaries ofour capital markets, and how little control we ultimately haveover our investment fortunes in the short run. The stocks weown don’t know that we own them, and therefore do notbehave in ways that are always consistent with our near terminterests. We can ferret out pockets of what we believe to beundervaluation in our markets and individual securities thatoffer clues to future investment opportunity, but we have noassurance as to when, or if, that value will be recognized byother market participants, or by an acquirer.
What we do know is that Graham’s “big idea” hasempirically and practically worked over the long term, and wehave done our best to hone an investment organization thatcan execute on Graham’s promise. One of our ManagingDirectors read a book this past summer called The Boys in theBoat, which is about the University of Washington crew teamand their epic quest for Olympic Gold in the 2,000 meter,eight-oared crew race at the 1936 Berlin Olympics. It is awonderful emotional and historic account of how eight young
I-6
men, mostly from extraordinary hardscrabble backgrounds,came together for a remarkable and unexpected achievement.We were particularly struck by the author’s description of thebenefits associated with a diverse crew, and what it took forthem to find their “swing” on the water. We couldn’t help butthink about our many years at Tweedy, Browne and the crewsthat have made Tweedy what it is today:
Crew races are not won by clones. They are won bycrews, and great crews are carefully balanced blends ofboth physical abilities and personality types. In physicalterms, for instance, one rower’s arms might be longerthan another’s, but the latter might have a stronger backthan the former. Neither is necessarily a better or morevaluable oarsman than the other; both the long arms andthe strong back are assets to the boat. But if they are torow well together, each of these oarsmen must adjust tothe needs and capabilities of the other. Each must beprepared to compromise something in the way ofoptimizing his stroke for the overall benefit of the boat –the shorter-armed man reaching a little farther, thelonger-armed man foreshortening his reach just a bit – sothat both men’s oars remain parallel and both blades enterand exit the water at precisely the same moment …
… Good crews are good blends of personalities: someoneto lead the charge; someone to hold something in reserve;someone to pick a fight; someone to make peace;someone to think things through; someone to chargeahead without thinking. Somehow all this must mesh.That’s the steepest challenge. Even after the right mixtureis found, each man or woman in the boat must recognizehis or her place in the fabric of the crew, accept it, andaccept the others as they are. It is an exquisite thing whenit all comes together in just the right way. The intensebonding and the sense of exhilaration that results from itare what many oarsmen row for, far more than fortrophies or accolades. But it takes young men or womenof extraordinary character as well as extraordinaryphysical ability to pull it off.
- The Boys in the Boat by Daniel James Brown
Thank you for investing with us, and for your continuedconfidence.
Sincerely,
TWEEDY, BROWNE COMPANY LLC
William H. BrowneThomas H. ShragerJohn D. SpearsRobert Q. Wyckoff, Jr.Managing Directors
October 2015
Footnotes:(1) Indexes are unmanaged, and the figures for the indexes
shown include reinvestment of dividends and capital gainsdistributions and do not reflect any fees or expenses.Investors cannot invest directly in an index. We stronglyrecommend that these factors be considered before aninvestment decision is made.
(2) MSCI EAFE Index is an unmanaged capitalization-weighted index of companies representing the stock marketsof Europe, Australasia and the Far East. The MSCIEAFE Index (in US$) reflects the return of the MSCIEAFE Index for a U.S. dollar investor. The MSCI EAFEIndex (Hedged to US$) consists of the results of the MSCIEAFE Index hedged 100% back into U.S. dollars andaccounts for interest rate differentials in forward currencyexchange rates. Results for both indexes are inclusive ofdividends and net of foreign withholding taxes.
(3) Inception dates for the Global Value Fund, Global ValueFund II – Currency Unhedged, Value Fund andWorldwide High Dividend Yield Value Fund are June 15,1993, October 26, 2009, December 8, 1993, andSeptember 5, 2007, respectively. Prior to 2004,information with respect to the MSCI EAFE and MSCIWorld Indexes used was available at month end only;therefore, the since-inception performance of the MSCIEAFE Indexes quoted for the Global Value Fund reflectsperformance from May 31, 1993, the closest month end tothe Global Value Fund’s inception date, and the sinceinception performance of the MSCI World Index quoted forthe Value Fund reflects performance from November 30,1993, the closest month end to the Value Fund’s inceptiondate.
(4) The S&P 500/MSCI World Index (Hedged to US$) is acombination of the S&P 500 Index and the MSCI WorldIndex (Hedged to US$), linked together by Tweedy,Browne Company, and represents the performance of theS&P 500 Index for the periods 12/8/93 – 12/31/06 and theperformance of the MSCI World Index (Hedged to US$),beginning 1/01/07 and thereafter. For the period from theFund’s inception through 2006, the Investment Adviserchose the S&P 500 as the relevant market benchmark.Starting in mid-December 2006, the Fund’s investmentmandate changed from investing at least 80% of its assets inU.S. securities to investing no less than approximately 50%in U.S securities, and the Investment Adviser chose theMSCI World Index (Hedged to US$) as the most relevantbenchmark for the Fund starting January 1, 2007. EffectiveJuly 29, 2013, the Value Fund removed the 50%requirement, and continues to use the MSCI World Index(Hedged to US$) as the most relevant index.
(5) The MSCI World Index is a free float-adjusted unmanagedmarket capitalization weighted index that is designed tomeasure the equity market performance of developedmarkets. The MSCI World Index (in US$) reflects thereturn of this index for a U.S. dollar investor. The MSCIWorld Index (Hedged to US$) consists of the results of the
I-7
MSCI World Index with its foreign currency exposurehedged 100% back into U.S. dollars. The index accountsfor interest rate differentials in forward currency exchangerates. Results for each index are inclusive of dividends andnet of foreign withholding taxes.
(6) The S&P 500 Index is an unmanaged capitalizationweighted index composed of 500 widely held common stocksthat assumes the reinvestment of dividends. The index isgenerally considered representative of U.S. largecapitalization stocks.
(7) As of September 30, 2015, Tweedy, Browne Global ValueFund, Tweedy, Browne Global Value Fund II- CurrencyUnhedged, Tweedy, Browne Value Fund and Tweedy,Browne Worldwide High Dividend Yield Value Fund hadeach invested the following percentages of its net assets,respectively, in the following portfolio holdings: Halliburton(0.7%, 0.6%, 2.0%, 0.0%); Devon Energy (0.5%,0.0%, 2.0%, 0.0%); Total (2.3%, 2.3%, 3.4%, 4.1%);Royal Dutch (1.9%, 1.0%, 2.8%, 3.2%); DBS Group(1.4%, 1.7%, 0.0%, 2.5%); United Overseas Bank(1.4%, 1.5%, 1.3%, 3.2%); Standard Chartered (2.8%,1.9%, 2.6%, 3.1%); Nestlé (2.3%, 2.6%, 3.3%,4.3%); Heineken (2.5%, 1.1%, 3.9%, 0.0%); ImperialTobacco (0.6%, 1.5%, 0.0%, 2.1%); Philip Morris(0.8%, 0.6%, 1.0%, 2.1%); British American Tobacco(0.8%, 0.4%, 0.0%, 0.0%); Hyundai Motor (1.7%,1.8%, 1.6%, 0.0%); Kia (1.3%, 1.8%, 0.9%, 0.0%);Safran (3.3%, 3.0%, 0.0%, 0.0%); Google (1.1%,0.0%, 1.4%, 0.0%); MasterCard (0.0%, 0.8%, 1.7%,0.0%); Hyundai Mobis (0.5%, 0.5%, 0.0%, 0.0%);MRC Global (0.0%, 0.0%, 1.0%, 0.0%); Ebara (0.2%,0.5%, 0.0%, 0.0%); and IBM (0.2%, 0.0%, 0.0%,0.0%).
Current and future portfolio holdings are subject to risk.Investing in foreign securities involves additional risks beyondthe risks of investing in U.S. securities markets. These risksinclude currency fluctuations; political uncertainty; different
accounting and financial standards; different regulatoryenvironments; and different market and economic factors invarious non-U.S. countries. In addition, the securities ofsmall, less well known companies may be more volatile thanthose of larger companies. Value investing involves the riskthat the market will not recognize a security’s intrinsic valuefor a long time, or that a security thought to be undervaluedmay actually be appropriately priced when purchased.Dividends are not guaranteed, and a company currentlypaying dividends may cease paying dividends at any time.Diversification does not guarantee a profit and does notprotect against a loss in declining markets. Please refer to theFunds’ prospectus for a description of risk factors associatedwith investments in securities which may be held by theFunds.
Although the practice of hedging against currency exchangerate changes utilized by the Tweedy, Browne Global ValueFund and Tweedy, Browne Value Fund reduces the risk of lossfrom exchange rate movements, it also reduces the ability ofthe Funds to gain from favorable exchange rate movementswhen the U.S. dollar declines against the currencies in whichthe Funds’ investments are denominated and in some interestrate environments may impose out-of-pocket costs on theFunds.
This letter contains opinions and statements on investmenttechniques, economics, market conditions and other matters.Of course there is no guarantee that these opinions andstatements will prove to be correct, and some of them areinherently speculative. None of them should be relied upon asstatements of fact.
Tweedy, Browne Global Value Fund, Tweedy, Browne GlobalValue Fund II – Currency Unhedged, Tweedy, Browne ValueFund, and Tweedy, Browne Worldwide High Dividend YieldValue Fund are distributed by AMG Distributors, Inc.,Member FINRA/SIPC.
This material must be preceded or accompanied by a prospectus forTweedy, Browne Fund Inc.
I-8
TWEEDY, BROWNE FUND INC.
Different Perspectives on Investment PerformanceTweedy, Browne Global Value Fund
This booklet provides an historical perspective concerning the year-by-year variability of investment returnsfor the Tweedy, Browne Global Value Fund since its inception in 1993, as compared to benchmark indices.The Fund has had an excellent long-term record, which has bested its benchmark by a considerable margin,yet unquestionably the return stream has been lumpy, with numerous periods of underperformance followedby periods of outperformance. (Past performance is no guarantee of future results. See page 1 for the Fund’sperformance records.) We believe it is important for investors to be aware of the general pattern, sequence,and composition of investment returns for the many smaller periods of time that comprise a successful long-term investment track record. You can think of investing as a long-term journey, a veritable marathon, withmany starts, stops, changes of scenery and occasional bumps. Moreover, we believe you will be much morelikely to achieve your investment objectives if you know what to expect along the way. Your ownpsychology and ability to handle the emotional ups and downs of investing are likely to be importantdeterminants of your long-run investment success. If this booklet serves to keep you on your journey,especially when there are some bumps, then we at Tweedy, Browne will have served you well.
September 30, 2015
TWEEDY, BROWNE FUND INC.
Different Perspectives on Investment Performance: Tweedy, Browne Global Value Fund
Notes
Past performance is no guarantee of future results.A fund’s portfolio characteristics are subject to change at any time.
Current and future portfolio holdings are subject to risk. The securities of small, less well-known companies may be more volatilethan those of larger companies. In addition, investing in foreign securities involves additional risks beyond the risks of investing insecurities of U.S. markets. These risks include economic and political considerations not typically found in U.S. markets, includingcurrency fluctuation, political uncertainty and different financial standards, regulatory environments, and overall market andeconomic factors in the countries. These risks are magnified in emerging markets. Value investing involves the risk that the marketwill not recognize a security’s intrinsic value for a long time, or that a security thought to be undervalued may actually beappropriately priced when purchased. Investors should refer to the prospectus for a description of risk factors associated withinvestments in securities held by the Fund.
Although hedging against currency exchange rate changes reduces the risk of loss from exchange rate movements, it also reduces theability of a fund to gain from favorable exchange rate movements when the U.S. dollar declines against the currencies in which thefund’s investments are denominated and in some interest rate environments may impose out-of-pocket costs on the fund.
The MSCI EAFE Index (in US$) is an unmanaged capitalization-weighted index of companies representing the stock markets ofEurope, Australasia and the Far East. Index results are inclusive of dividends and net of foreign withholding taxes. The MSCIEAFE Index (Hedged to US$) consists of the results of the MSCI EAFE Index 100% hedged back into U.S. dollars and accountsfor interest differentials in forward currency exchange rates. Index results are inclusive of dividends and net of foreign withholdingtaxes. Index performance is not representative of Fund performance. Please call (800) 432-4789 or visit www.tweedy.com toobtain Fund performance information. An investor cannot invest directly in an index.
The Tweedy, Browne Global Value Fund, Tweedy, Browne Global Value Fund II – Currency Unhedged, Tweedy, BrowneValue Fund and Tweedy, Browne Worldwide High Dividend Yield Value Fund are distributed by AMG Distributors, Inc.,Member FINRA/SIPC.
This material must be preceded or accompanied by a current prospectus for Tweedy, Browne Fund Inc.
TWEEDY, BROWNE FUND INC.
Different Perspectives on Investment Performance: Tweedy, Browne Global Value Fund
Table of Contents
Page
Tweedy, Browne Global Value Fund Investment Results Since Inception . . . . . . . . . . . . . . . . . . . . . . . . . . . 1
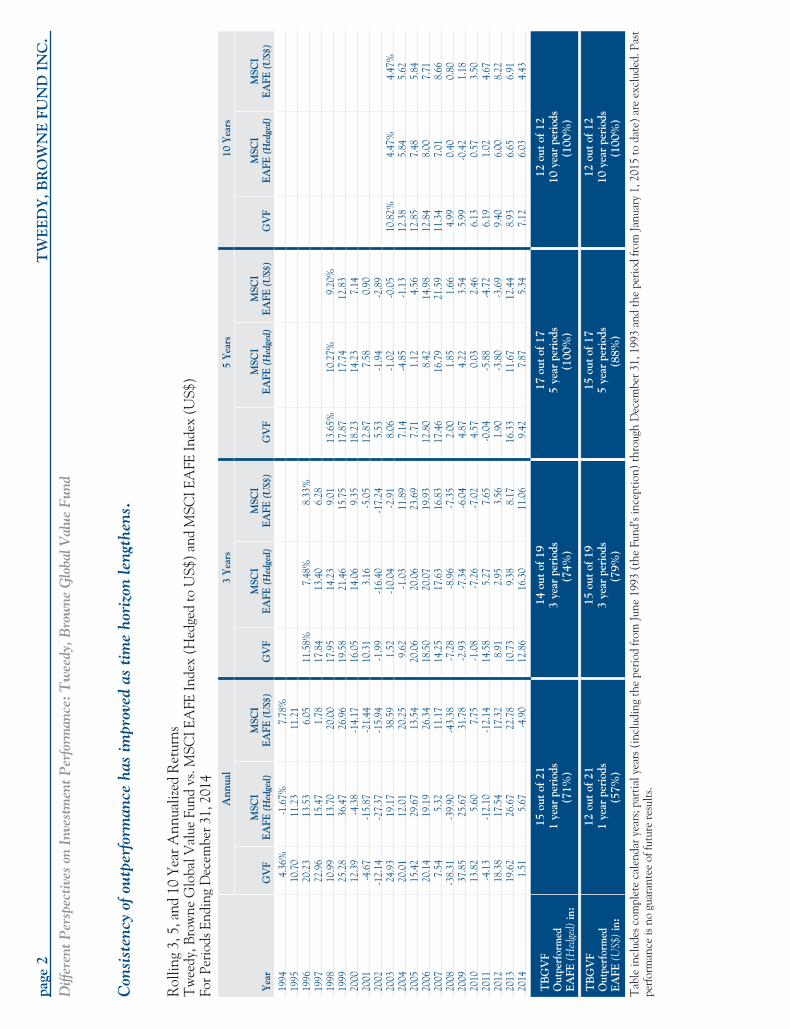
Consistency of outperformance: Rolling 3, 5, and 10 Year Annualized Returns . . . . . . . . . . . . . . . . . . . . . . . 2
Periods of underperformance have generally clustered in very “robust,” speculative market environments: 3-Yearand 5-Year Rolling Returns . . . . . . . . . . . . . . . . . . . . . . . . . . . . . . . . . . . . . . . . . . . . . . . . . . . . . . . . . . . . . . . 3-4
The Ups and Downs of the Tweedy, Browne Global Value Fund . . . . . . . . . . . . . . . . . . . . . . . . . . . . . . . . . 5
Performance in Down Market Years . . . . . . . . . . . . . . . . . . . . . . . . . . . . . . . . . . . . . . . . . . . . . . . . . . . . . . . 6
Drawdown: The peak-to-trough decline and subsequent recovery . . . . . . . . . . . . . . . . . . . . . . . . . . . . . . . . . . 7
Upside/Downside Capture Ratio . . . . . . . . . . . . . . . . . . . . . . . . . . . . . . . . . . . . . . . . . . . . . . . . . . . . . . . . . . 8
Tweedy, Browne Global Value Fund: After Tax Returns . . . . . . . . . . . . . . . . . . . . . . . . . . . . . . . . . . . . . . . 9
Different snapshots in time . . . . . . . . . . . . . . . . . . . . . . . . . . . . . . . . . . . . . . . . . . . . . . . . . . . . . . . . . . . . . . 10
Characteristics . . . . . . . . . . . . . . . . . . . . . . . . . . . . . . . . . . . . . . . . . . . . . . . . . . . . . . . . . . . . . . . . . . . . . . . 11
page 1 TWEEDY, BROWNE FUND INC.
Different Perspectives on Investment Performance: Tweedy, Browne Global Value Fund
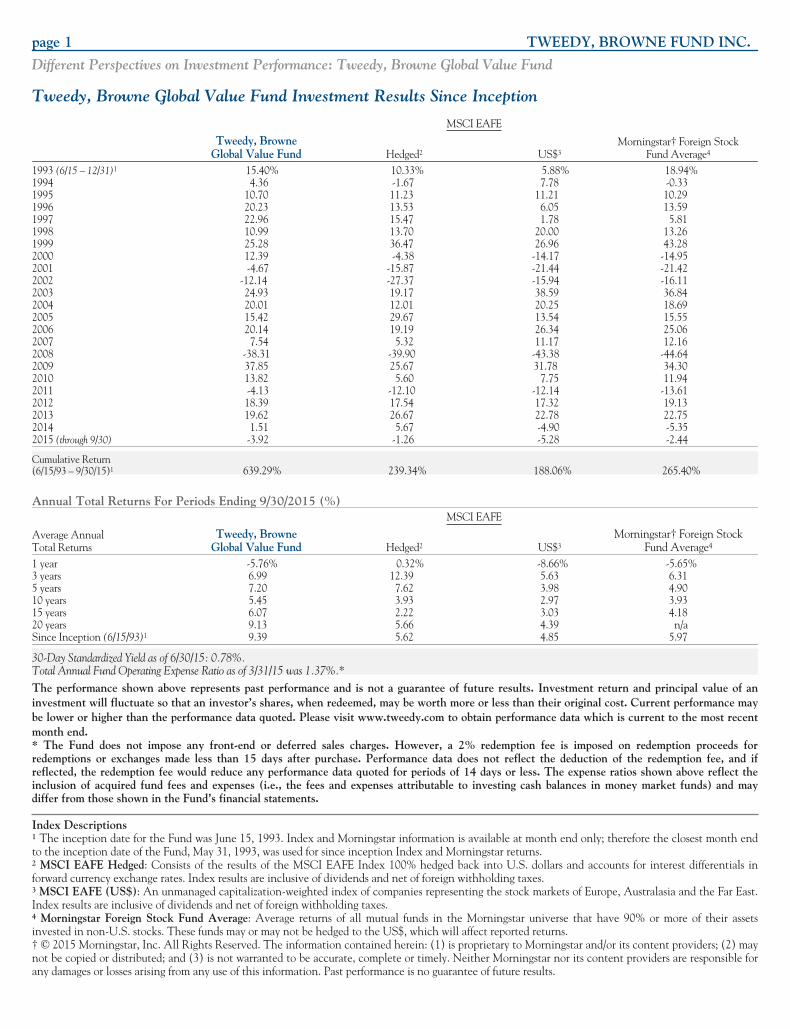
Tweedy, Browne Global Value Fund Investment Results Since Inception
MSCI EAFE
Tweedy, BrowneGlobal Value Fund Hedged2 US$3
Morningstar† Foreign StockFund Average4
1993 (6/15 – 12/31)1 15.40% 10.33% 5.88% 18.94%1994 4.36 -1.67 7.78 -0.331995 10.70 11.23 11.21 10.291996 20.23 13.53 6.05 13.591997 22.96 15.47 1.78 5.811998 10.99 13.70 20.00 13.261999 25.28 36.47 26.96 43.282000 12.39 -4.38 -14.17 -14.952001 -4.67 -15.87 -21.44 -21.422002 -12.14 -27.37 -15.94 -16.112003 24.93 19.17 38.59 36.842004 20.01 12.01 20.25 18.692005 15.42 29.67 13.54 15.552006 20.14 19.19 26.34 25.062007 7.54 5.32 11.17 12.162008 -38.31 -39.90 -43.38 -44.642009 37.85 25.67 31.78 34.302010 13.82 5.60 7.75 11.942011 -4.13 -12.10 -12.14 -13.612012 18.39 17.54 17.32 19.132013 19.62 26.67 22.78 22.752014 1.51 5.67 -4.90 -5.352015 (through 9/30) -3.92 -1.26 -5.28 -2.44
Cumulative Return(6/15/93 – 9/30/15)1 639.29% 239.34% 188.06% 265.40%
Annual Total Returns For Periods Ending 9/30/2015 (%)MSCI EAFE
Average AnnualTotal Returns
Tweedy, BrowneGlobal Value Fund Hedged2 US$3
Morningstar† Foreign StockFund Average4
1 year -5.76% 0.32% -8.66% -5.65%3 years 6.99 12.39 5.63 6.315 years 7.20 7.62 3.98 4.9010 years 5.45 3.93 2.97 3.9315 years 6.07 2.22 3.03 4.1820 years 9.13 5.66 4.39 n/aSince Inception (6/15/93)1 9.39 5.62 4.85 5.97
30-Day Standardized Yield as of 6/30/15: 0.78%.Total Annual Fund Operating Expense Ratio as of 3/31/15 was 1.37%.*The performance shown above represents past performance and is not a guarantee of future results. Investment return and principal value of aninvestment will fluctuate so that an investor’s shares, when redeemed, may be worth more or less than their original cost. Current performance maybe lower or higher than the performance data quoted. Please visit www.tweedy.com to obtain performance data which is current to the most recentmonth end.* The Fund does not impose any front-end or deferred sales charges. However, a 2% redemption fee is imposed on redemption proceeds forredemptions or exchanges made less than 15 days after purchase. Performance data does not reflect the deduction of the redemption fee, and ifreflected, the redemption fee would reduce any performance data quoted for periods of 14 days or less. The expense ratios shown above reflect theinclusion of acquired fund fees and expenses (i.e., the fees and expenses attributable to investing cash balances in money market funds) and maydiffer from those shown in the Fund’s financial statements.
Index Descriptions1 The inception date for the Fund was June 15, 1993. Index and Morningstar information is available at month end only; therefore the closest month endto the inception date of the Fund, May 31, 1993, was used for since inception Index and Morningstar returns.2 MSCI EAFE Hedged: Consists of the results of the MSCI EAFE Index 100% hedged back into U.S. dollars and accounts for interest differentials inforward currency exchange rates. Index results are inclusive of dividends and net of foreign withholding taxes.3 MSCI EAFE (US$): An unmanaged capitalization-weighted index of companies representing the stock markets of Europe, Australasia and the Far East.Index results are inclusive of dividends and net of foreign withholding taxes.4 Morningstar Foreign Stock Fund Average: Average returns of all mutual funds in the Morningstar universe that have 90% or more of their assetsinvested in non-U.S. stocks. These funds may or may not be hedged to the US$, which will affect reported returns.† © 2015 Morningstar, Inc. All Rights Reserved. The information contained herein: (1) is proprietary to Morningstar and/or its content providers; (2) maynot be copied or distributed; and (3) is not warranted to be accurate, complete or timely. Neither Morningstar nor its content providers are responsible forany damages or losses arising from any use of this information. Past performance is no guarantee of future results.
page
2T
WE
ED
Y,B
RO
WN
EFU
ND
INC
.
Diff
eren
tPer
spec
tives
onIn
vest
men
tPer
form
ance
:Tw
eedy
,Bro
wne
Glo
balV
alue
Fund
Con
sist
ency
ofou
tper
form
ance
has
impr
oved
asti
me
hori
zon
leng
then
s.
Rol
ling
3,5,
and
10Ye
arA
nnua
lized
Ret
urns
Tw
eedy
,Bro
wne
Glo
balV
alue
Fund
vs.M
SCIE
AFE
Inde
x(H
edge
dto
US$
)an
dM
SCIE
AFE
Inde
x(U
S$)
ForP
erio
dsEn
ding
Dec
embe
r31,
2014
Ann
ual
3Y
ears
5Y
ears
10Y
ears
Yea
rG
VF
MSC
IEA
FE(H
edge
d)M
SCI
EAFE
(US$
)G
VF
MSC
IEA
FE(H
edge
d)M
SCI
EAFE
(US$
)G
VF
MSC
IEA
FE(H
edge
d)M
SCI
EAFE
(US$
)G
VF
MSC
IEA
FE(H
edge
d)M
SCI
EAFE
(US$
)
1994
4.36
%-1
.67%
7.78
%19
9510
.70
11.2
311
.21
1996
20.2
313
.53
6.05
11.5
8%7.
48%
8.33
%19
9722
.96
15.4
71.
7817
.84
13.4
06.
2819
9810
.99
13.7
020
.00
17.9
514
.23
9.01
13.6
5%10
.27%
9.20
%19
9925
.28
36.4
726
.96
19.5
821
.46
15.7
517
.87
17.7
412
.83
2000
12.3
9-4
.38
-14.
1716
.05
14.0
69.
3518
.23
14.2
37.
1420
01-4
.67
-15.
87-2
1.44
10.3
13.
16-5
.05
12.8
77.
580.
9020
02-1
2.14
-27.
37-1
5.94
-1.9
9-1
6.40
-17.
245.
53-1
.94
-2.8
920
0324
.93
19.1
738
.59
1.52
-10.
04-2
.91
8.06
-1.0
2-0
.05
10.8
2%4.
47%
4.47
%20
0420
.01
12.0
120
.25
9.62
-1.0
311
.89
7.14
-4.8
5-1
.13
12.3
85.
845.
6220
0515
.42
29.6
713
.54
20.0
620
.06
23.6
97.
711.
124.
5612
.85
7.48
5.84
2006
20.1
419
.19
26.3
418
.50
20.0
719
.93
12.8
08.
4214
.98
12.8
48.
007.
7120
077.
545.
3211
.17
14.2
517
.63
16.8
317
.46
16.7
921
.59
11.3
47.
018.
6620
08-3
8.31
-39.
90-4
3.38
-7.2
8-8
.96
-7.3
52.
001.
851.
664.
990.
400.
8020
0937
.85
25.6
731
.78
-2.9
3-7
.34
-6.0
44.
874.
223.
545.
99-0
.42
1.18
2010
13.8
25.
607.
75-1
.08
-7.2
6-7
.02
4.57
0.03
2.46
6.13
0.57
3.50
2011
-4.1
3-1
2.10
-12.
1414
.58
5.27
7.65
-0.0
4-5
.88
-4.7
26.
191.
024.
6720
1218
.38
17.5
417
.32
8.91
2.95
3.56
1.90
-3.8
0-3
.69
9.40
6.00
8.22
2013
19.6
226
.67
22.7
810
.73
9.38
8.17
16.3
311
.67
12.4
48.
936.
656.
9120
141.
515.
67-4
.90
12.8
616
.30
11.0
69.
427.
875.
347.
126.
034.
43
TB
GV
FO
utpe
rfor
med
EAFE
(Hed
ged)
in:
15ou
tof2
11
year
peri
ods
(71%
)
14ou
tof1
93
year
peri
ods
(74%
)
17ou
tof1
75
year
peri
ods
(100
%)
12ou
tof1
210
year
peri
ods
(100
%)
TB
GV
FO
utpe
rfor
med
EAFE
(US$
)in
:
12ou
tof2
11
year
peri
ods
(57%
)
15ou
tof1
93
year
peri
ods
(79%
)
15ou
tof1
75
year
peri
ods
(88%
)
12ou
tof1
210
year
peri
ods
(100
%)
Tab
lein
clud
esco
mpl
ete
cale
ndar
year
s;pa
rtia
lyea
rs(i
nclu
ding
the
perio
dfro
mJu
ne19
93(t
heFu
nd’s
ince
ptio
n)th
roug
hD
ecem
ber3
1,19
93an
dth
epe
riod
from
Janu
ary
1,20
15to
date
)ar
eex
clud
ed.P
ast
perfo
rman
ceis
nogu
aran
tee
offu
ture
resu
lts.
page
3T
WE
ED
Y,B
RO
WN
EFU
ND
INC
.
Diff
eren
tPer
spec
tives
onIn
vest
men
tPer
form
ance
:Tw
eedy
,Bro
wne
Glo
balV
alue
Fund
Out
of23
2th
ree-
year
mea
sure
men
tper
iods
,the
Glo
balV
alue
Fund
has
outp
erfo
rmed
the
MSC
IE
AFE
Inde
x(H
edge
dto
US$
)18
1tim
es,o
rin
78%
ofm
easu
red
peri
ods.
Not
e:pe
riod
sof
rela
tive
outp
erfo
rman
ceha
vege
nera
llycl
uste
red
in“d
own”
and
“nor
mal
”m
arke
ts,w
hile
peri
ods
ofun
derp
erfo
rman
ceha
vege
nera
llycl
uste
red
inve
ry“r
obus
t,”
mor
esp
ecul
ativ
em
arke
tenv
iron
men
ts.
3-Y
earR
ollin
gR
etur
nsT
wee
dy,B
row
neG
loba
lVal
ueFu
nd&
MSC
IEA
FEIn
dex
(Hed
ged
toU
S$)
Dow
n M
arke
t - 3
-yr A
vg. R
etur
n
(Bel
ow 0
%)
Glo
bal V
alue
Fun
d: -0
.57%
M
SCI E
AFE
(Hed
ged
to U
S$):
-8.2
0%G
VF
beat
EA
FE in
100
% o
f per
iods
Nor
mal
Mar
ket -
3-y
r Avg
. Ret
urn
(0-1
5%)
Glo
bal V
alue
Fun
d: 1
2.38
%
MSC
I EA
FE (H
edge
d to
US$
): 8.
36%
GV
F be
at E
AFE
in 8
7% o
f per
iods
Rob
ust M
arke
t - 3
-yr A
vg. R
etur
n (A
bove
15%
) G
loba
l Val
ue F
und:
18.
33%
M
SCI E
AFE
(Hed
ged
to U
S$):
19.0
9%G
VF
beat
EA
FE in
41%
of p
erio
ds
-25%
-15%-5%5%15%
25%
25%
15%
5%-5
%-1
5%-2
5%
Global Value Fund
MSC
I EA
FE (H
edge
d to
US$
)
Sept
embe
r 30,
201
5
The
abov
ech
art
illus
trat
esth
em
onth
lyth
ree-
year
rolli
ngav
erag
ere
turn
sfo
rth
eT
wee
dy,B
row
neG
loba
lV
alue
Fund
(the
“Fun
d”),
net
offe
es,f
rom
July
1,19
93(1
5da
ysaf
ter
itsin
cept
ion)
thro
ugh
Sept
embe
r30
,201
5,as
com
pare
dto
the
thre
e-ye
arro
lling
aver
age
retu
rns
for
itsbe
nchm
ark
inde
x,th
eM
SCI
EAFE
Inde
x(H
edge
dto
US$
)(t
he“I
ndex
”).T
heho
rizon
tala
xis
repr
esen
tsth
eth
ree-
year
rolli
ngav
erag
ere
turn
sfor
the
Inde
x,w
hile
the
vert
ical
axis
repr
esen
tsth
eth
ree-
year
rolli
ngav
erag
ere
turn
sfor
the
Fund
.The
diag
onal
axis
isin
tend
edto
illus
trat
eth
eou
tper
form
ance
orun
derp
erfo
rman
ceof
the
Fund
vers
usth
eIn
dex.
Plot
poin
tsab
ove
the
diag
onal
axis
are
indi
cativ
eof
the
Fund
’sre
lativ
eou
tper
form
ance
,w
hile
plot
poin
tsbe
low
the
diag
onal
axis
are
indi
cativ
eof
rela
tive
Fund
unde
rper
form
ance
.Ret
urns
wer
epl
otte
dfo
rthr
eedi
stin
cteq
uity
mar
kete
nviro
nmen
ts:a
“dow
nm
arke
t”is
defin
edas
any
perio
dw
here
the
thre
e-ye
arro
lling
aver
age
retu
rnfo
rthe
Inde
xw
asle
ssth
an0%
;a“n
orm
alm
arke
t”is
defin
edas
any
perio
dw
here
the
thre
e-ye
arro
lling
aver
age
retu
rnfo
rth
eIn
dex
was
0%to
15%
;and
a“r
obus
tmar
ket”
isde
fined
asan
ype
riod
whe
reth
eth
ree-
year
rolli
ngav
erag
ere
turn
fort
heIn
dex
isgr
eate
rtha
n15
%.T
here
wer
e23
2th
ree-
year
rolli
ngav
erag
em
onth
lyre
turn
perio
dsbe
twee
nJu
ly1,
1993
and
Sept
embe
r30,
2015
.Pas
tper
form
ance
isno
guar
ante
eof
futu
rere
sults
.
page
4T
WE
ED
Y,B
RO
WN
EFU
ND
INC
.
Diff
eren
tPer
spec
tives
onIn
vest
men
tPer
form
ance
:Tw
eedy
,Bro
wne
Glo
balV
alue
Fund
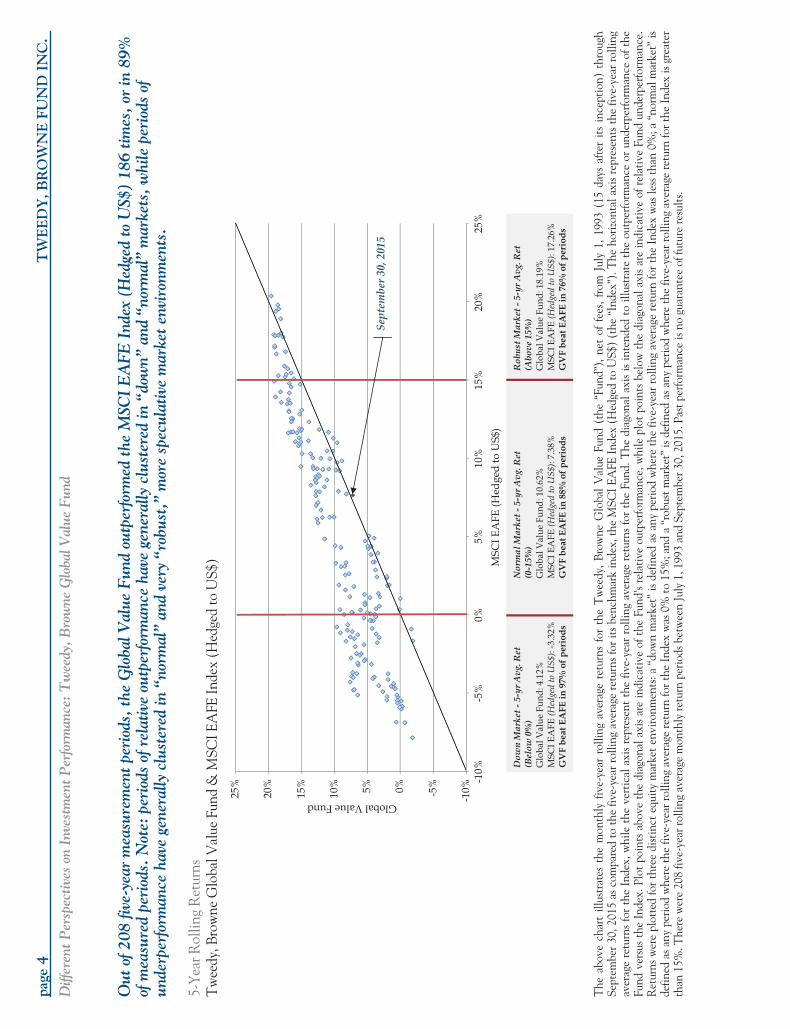
Out
of20
8fiv
e-ye
arm
easu
rem
entp
erio
ds,t
heG
loba
lVal
ueFu
ndou
tper
form
edth
eM
SCI
EA
FEIn
dex
(Hed
ged
toU
S$)
186
times
,or
in89
%of
mea
sure
dpe
riod
s.N
ote:
peri
ods
ofre
lativ
eou
tper
form
ance
have
gene
rally
clus
tere
din
“dow
n”an
d“n
orm
al”
mar
kets
,whi
lepe
riod
sof
unde
rper
form
ance
have
gene
rally
clus
tere
din
“nor
mal
”an
dve
ry“r
obus
t,”
mor
esp
ecul
ativ
em
arke
tenv
iron
men
ts.
5-Ye
arR
ollin
gR
etur
nsT
wee
dy,B
row
neG
loba
lVal
ueFu
nd&
MSC
IEA
FEIn
dex
(Hed
ged
toU
S$)
Dow
n M
arke
t - 5
-yr A
vg. R
et
(Bel
ow 0
%)
Glo
bal V
alue
Fun
d: 4
.12%
M
SCI E
AFE
(Hed
ged
to U
S$):
-3.3
2%
GV
F be
at E
AFE
in 9
7% o
f per
iods
Nor
mal
Mar
ket -
5-y
r Avg
. Ret
(0
-15%
) G
loba
l Val
ue F
und:
10.
62%
M
SCI E
AFE
(Hed
ged
to U
S$):
7.38
%
GV
F be
at E
AFE
in 8
8% o
f per
iods
Rob
ust M
arke
t - 5
-yr A
vg. R
et
(Abo
ve 1
5%)
Glo
bal V
alue
Fun
d: 1
8.19
%
MSC
I EA
FE (H
edge
d to
US$
): 17
.26%
G
VF
beat
EA
FE in
76%
of p
erio
ds
-10%-5%0%5%10%
15%
20%
25% -1
0%
Global Value Fund
MSC
I EA
FE (H
edge
d to
US$
)
Sept
embe
r 30,
201
5
25%
20%
15%
10%
5%0%
-5%
The
abov
ech
art
illus
trat
esth
em
onth
lyfiv
e-ye
arro
lling
aver
age
retu
rns
for
the
Tw
eedy
,B
row
neG
loba
lV
alue
Fund
(the
“Fun
d”),
net
offe
es,
from
July
1,19
93(1
5da
ysaf
ter
itsin
cept
ion)
thro
ugh
Sept
embe
r30
,201
5as
com
pare
dto
the
five-
year
rolli
ngav
erag
ere
turn
sfor
itsbe
nchm
ark
inde
x,th
eM
SCIE
AFE
Inde
x(H
edge
dto
US$
)(t
he“I
ndex
”).T
heho
rizon
tala
xisr
epre
sent
sthe
five-
year
rolli
ngav
erag
ere
turn
sfo
rth
eIn
dex,
whi
leth
eve
rtic
alax
isre
pres
ent
the
five-
year
rolli
ngav
erag
ere
turn
sfo
rth
eFu
nd.T
hedi
agon
alax
isis
inte
nded
toill
ustr
ate
the
outp
erfo
rman
ceor
unde
rper
form
ance
ofth
eFu
ndve
rsus
the
Inde
x.Pl
otpo
ints
abov
eth
edi
agon
alax
isar
ein
dica
tive
ofth
eFu
nd’s
rela
tive
outp
erfo
rman
ce,w
hile
plot
poin
tsbe
low
the
diag
onal
axis
are
indi
cativ
eof
rela
tive
Fund
unde
rper
form
ance
.R
etur
nsw
ere
plot
ted
for
thre
edi
stin
cteq
uity
mar
ket
envi
ronm
ents
:a“d
own
mar
ket”
isde
fined
asan
ype
riod
whe
reth
efiv
e-ye
arro
lling
aver
age
retu
rnfo
rth
eIn
dex
was
less
than
0%;a
“nor
mal
mar
ket”
isde
fined
asan
ype
riod
whe
reth
efiv
e-ye
arro
lling
aver
age
retu
rnfo
rthe
Inde
xw
as0%
to15
%;a
nda
“rob
ustm
arke
t”is
defin
edas
any
perio
dw
here
the
five-
year
rolli
ngav
erag
ere
turn
fort
heIn
dex
isgr
eate
rth
an15
%.T
here
wer
e20
8fiv
e-ye
arro
lling
aver
age
mon
thly
retu
rnpe
riods
betw
een
July
1,19
93an
dSe
ptem
ber3
0,20
15.P
astp
erfo
rman
ceis
nogu
aran
tee
offu
ture
resu
lts.
page 5 TWEEDY, BROWNE FUND INC.
Different Perspectives on Investment Performance: Tweedy, Browne Global Value Fund
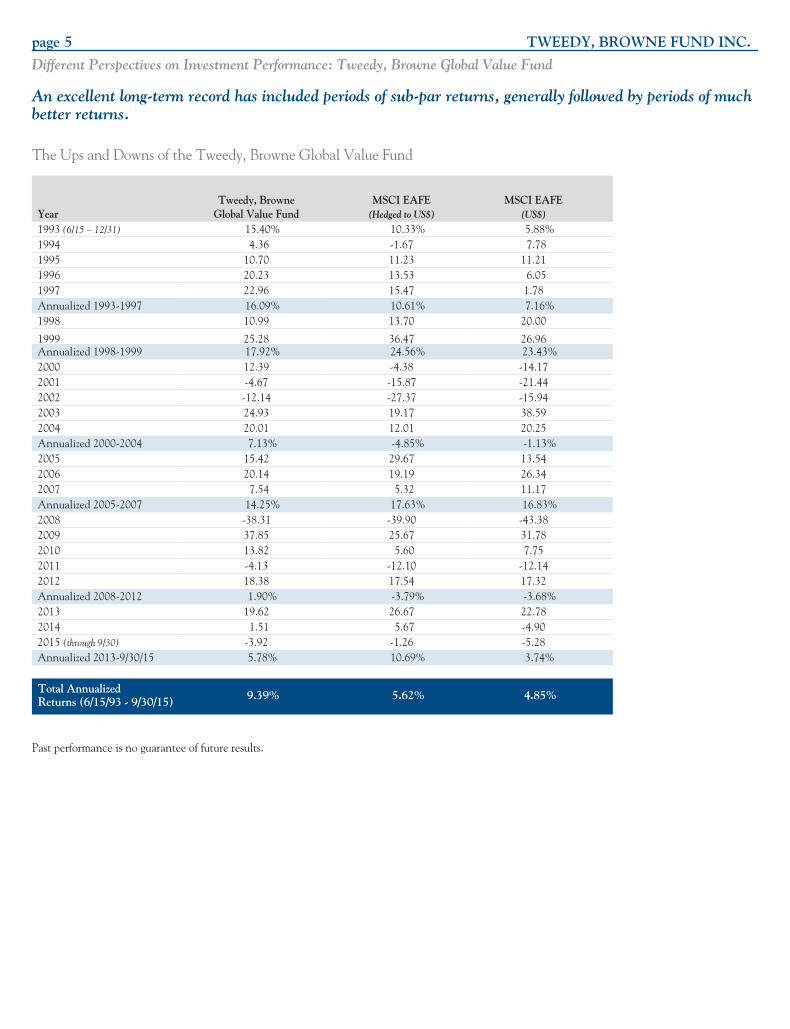
An excellent long-term record has included periods of sub-par returns, generally followed by periods of muchbetter returns.
The Ups and Downs of the Tweedy, Browne Global Value Fund
YearTweedy, Browne
Global Value FundMSCI EAFE
(Hedged to US$)MSCI EAFE
(US$)
1993 (6/15 – 12/31) 15.40% 10.33% 5.88%1994 4.36 -1.67 7.781995 10.70 11.23 11.211996 20.23 13.53 6.051997 22.96 15.47 1.78Annualized 1993-1997 16.09% 10.61% 7.16%1998 10.99 13.70 20.00
1999 25.28 36.47 26.96Annualized 1998-1999 17.92% 24.56% 23.43%2000 12.39 -4.38 -14.172001 -4.67 -15.87 -21.442002 -12.14 -27.37 -15.942003 24.93 19.17 38.592004 20.01 12.01 20.25Annualized 2000-2004 7.13% -4.85% -1.13%2005 15.42 29.67 13.542006 20.14 19.19 26.342007 7.54 5.32 11.17Annualized 2005-2007 14.25% 17.63% 16.83%2008 -38.31 -39.90 -43.382009 37.85 25.67 31.782010 13.82 5.60 7.752011 -4.13 -12.10 -12.142012 18.38 17.54 17.32Annualized 2008-2012 1.90% -3.79% -3.68%2013 19.62 26.67 22.782014 1.51 5.67 -4.902015 (through 9/30) -3.92 -1.26 -5.28Annualized 2013-9/30/15 5.78% 10.69% 3.74%
Total AnnualizedReturns (6/15/93 - 9/30/15) 9.39% 5.62% 4.85%
Past performance is no guarantee of future results.
page 6 TWEEDY, BROWNE FUND INC.
Different Perspectives on Investment Performance: Tweedy, Browne Global Value Fund
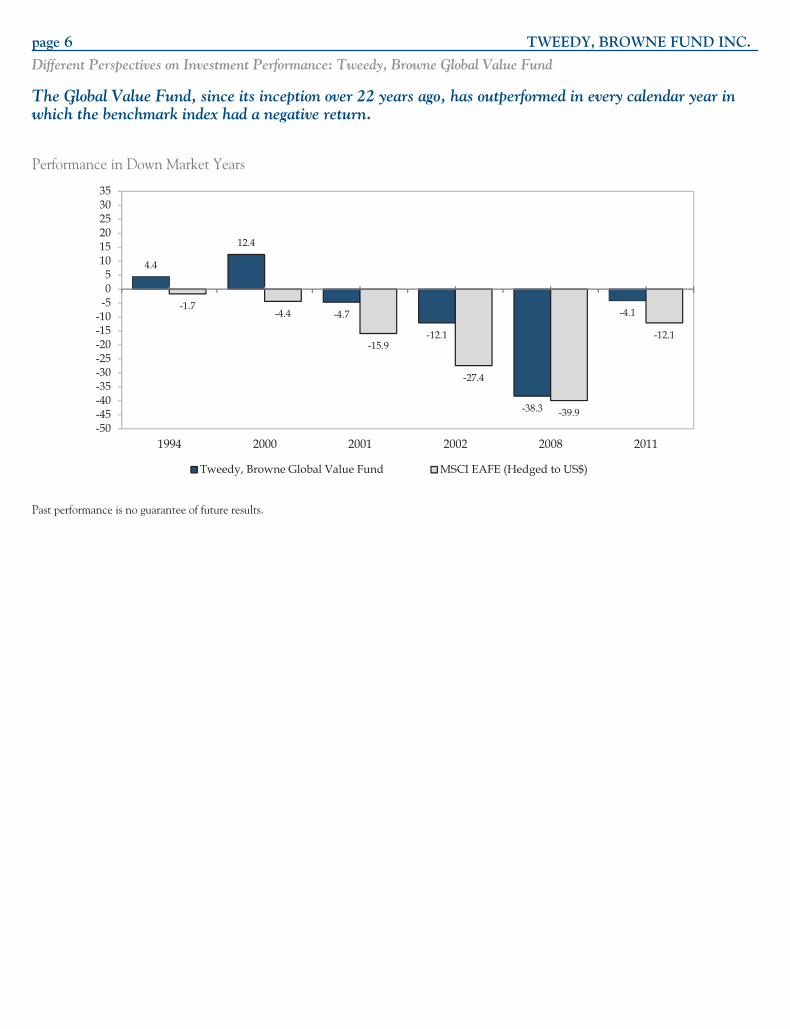
The Global Value Fund, since its inception over 22 years ago, has outperformed in every calendar year inwhich the benchmark index had a negative return.
Performance in Down Market Years
4.4
12.4
-4.7
-12.1
-38.3
-4.1-1.7-4.4
-15.9
-27.4
-39.9
-12.1
-50-45-40-35-30-25-20-15-10
-505
101520253035
1994
Tweedy, Browne Global Value Fund MSCI EAFE (Hedged to US$)
20112008200220012000
Past performance is no guarantee of future results.
page 7 TWEEDY, BROWNE FUND INC.
Different Perspectives on Investment Performance: Tweedy, Browne Global Value Fund
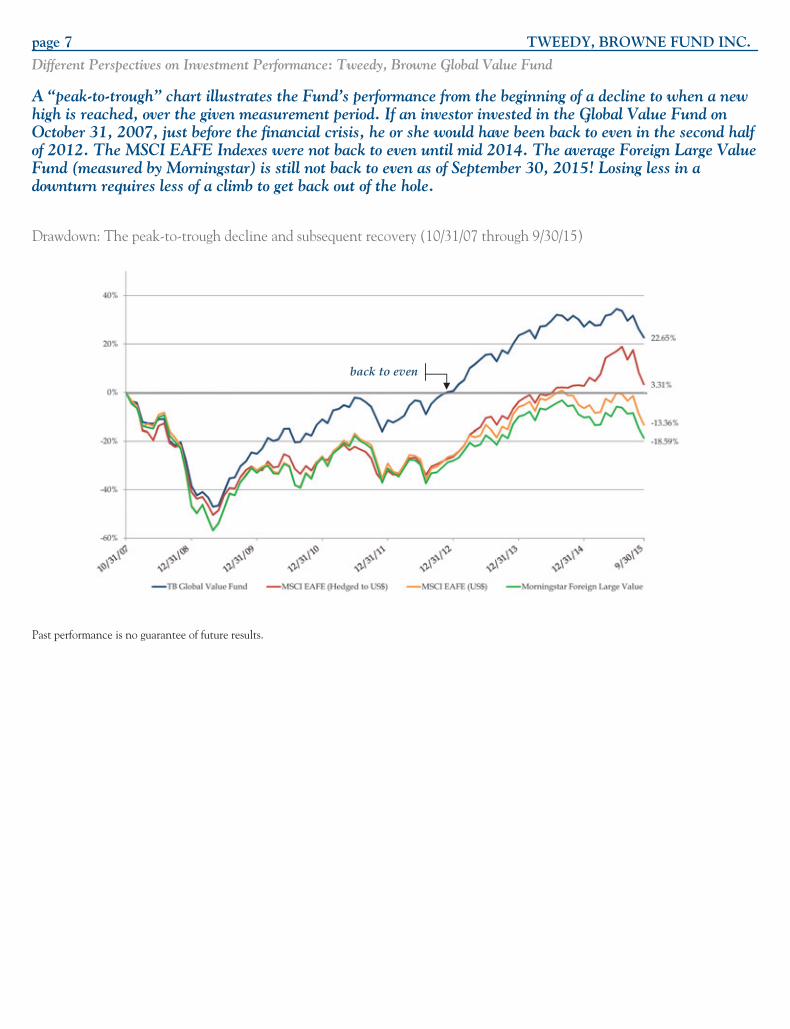
A “peak-to-trough” chart illustrates the Fund’s performance from the beginning of a decline to when a newhigh is reached, over the given measurement period. If an investor invested in the Global Value Fund onOctober 31, 2007, just before the financial crisis, he or she would have been back to even in the second halfof 2012. The MSCI EAFE Indexes were not back to even until mid 2014. The average Foreign Large ValueFund (measured by Morningstar) is still not back to even as of September 30, 2015! Losing less in adownturn requires less of a climb to get back out of the hole.
Drawdown: The peak-to-trough decline and subsequent recovery (10/31/07 through 9/30/15)
back to even
Past performance is no guarantee of future results.
page 8 TWEEDY, BROWNE FUND INC.
Different Perspectives on Investment Performance: Tweedy, Browne Global Value Fund
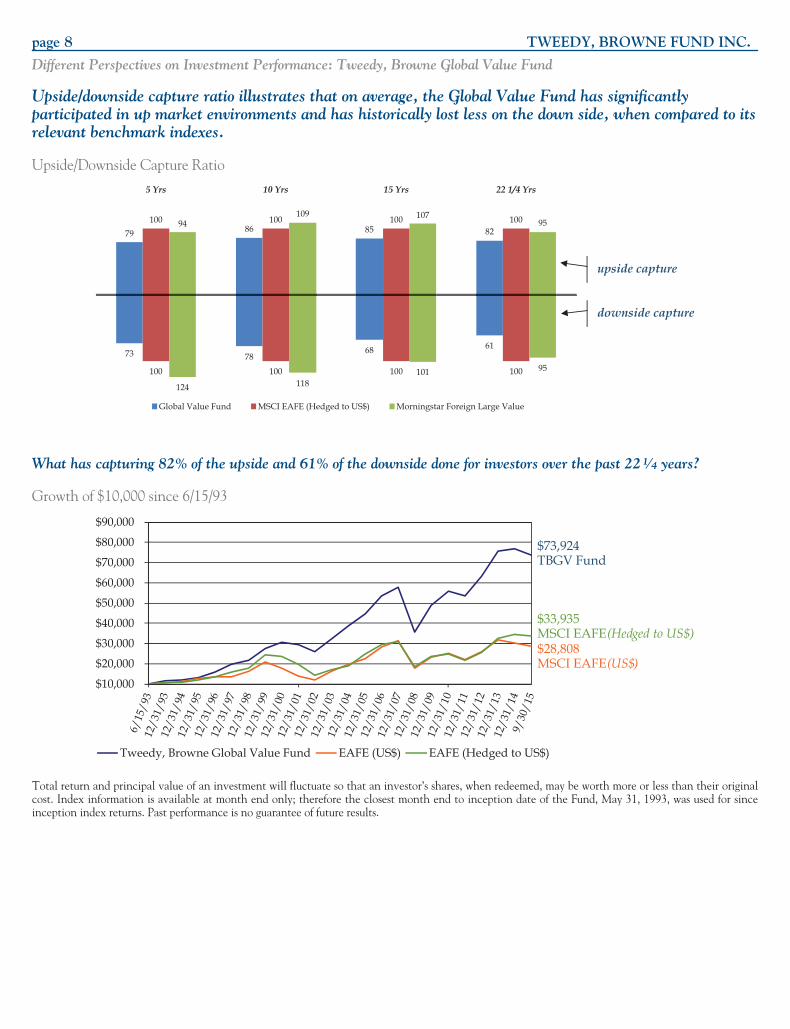
Upside/downside capture ratio illustrates that on average, the Global Value Fund has significantlyparticipated in up market environments and has historically lost less on the down side, when compared to itsrelevant benchmark indexes.
Upside/Downside Capture Ratio
79 86 85 82100100100100 94
109 10795
73 7868 61
100100100100
124 118101 95
22 1/4 Yrs15 Yrs10 Yrs5 Yrs
Global Value Fund MSCI EAFE (Hedged to US$) Morningstar Foreign Large Value
upside capture
downside capture
What has capturing 82% of the upside and 61% of the downside done for investors over the past 221⁄4 years?
Growth of $10,000 since 6/15/93
$10,000
$20,000
$30,000
$40,000
$50,000
$60,000
$70,000
$80,000
$90,000
Tweedy, Browne Global Value Fund EAFE (US$) EAFE (Hedged to US$)
$73,924 TBGV Fund
$33,935 MSCI EAFE (Hedged to US$)$28,808 MSCI EAFE (US$)
Total return and principal value of an investment will fluctuate so that an investor’s shares, when redeemed, may be worth more or less than their originalcost. Index information is available at month end only; therefore the closest month end to inception date of the Fund, May 31, 1993, was used for sinceinception index returns. Past performance is no guarantee of future results.
page 9 TWEEDY, BROWNE FUND INC.
Different Perspectives on Investment Performance: Tweedy, Browne Global Value Fund
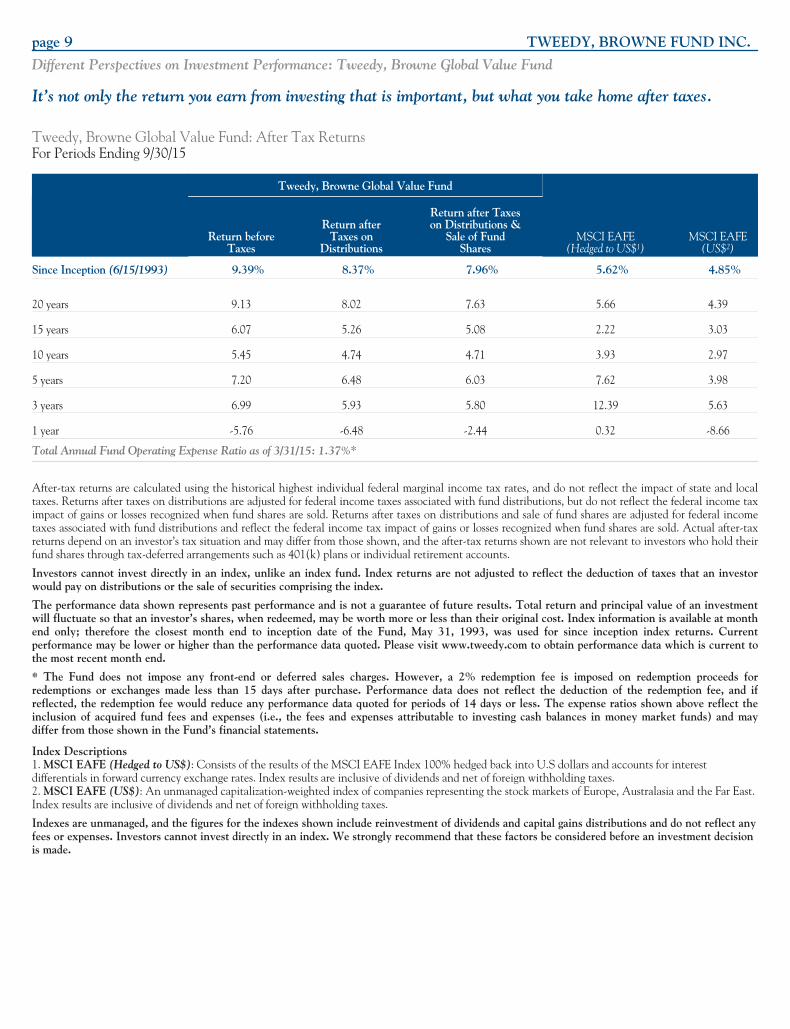
It’s not only the return you earn from investing that is important, but what you take home after taxes.
Tweedy, Browne Global Value Fund: After Tax ReturnsFor Periods Ending 9/30/15
Tweedy, Browne Global Value Fund
MSCI EAFE(Hedged to US$1)
MSCI EAFE(US$2)
Return beforeTaxes
Return afterTaxes on
Distributions
Return after Taxeson Distributions &
Sale of FundShares
Since Inception (6/15/1993) 9.39% 8.37% 7.96% 5.62% 4.85%
20 years 9.13 8.02 7.63 5.66 4.39
15 years 6.07 5.26 5.08 2.22 3.03
10 years 5.45 4.74 4.71 3.93 2.97
5 years 7.20 6.48 6.03 7.62 3.98
3 years 6.99 5.93 5.80 12.39 5.63
1 year -5.76 -6.48 -2.44 0.32 -8.66
Total Annual Fund Operating Expense Ratio as of 3/31/15: 1.37%*
After-tax returns are calculated using the historical highest individual federal marginal income tax rates, and do not reflect the impact of state and localtaxes. Returns after taxes on distributions are adjusted for federal income taxes associated with fund distributions, but do not reflect the federal income taximpact of gains or losses recognized when fund shares are sold. Returns after taxes on distributions and sale of fund shares are adjusted for federal incometaxes associated with fund distributions and reflect the federal income tax impact of gains or losses recognized when fund shares are sold. Actual after-taxreturns depend on an investor’s tax situation and may differ from those shown, and the after-tax returns shown are not relevant to investors who hold theirfund shares through tax-deferred arrangements such as 401(k) plans or individual retirement accounts.
Investors cannot invest directly in an index, unlike an index fund. Index returns are not adjusted to reflect the deduction of taxes that an investorwould pay on distributions or the sale of securities comprising the index.
The performance data shown represents past performance and is not a guarantee of future results. Total return and principal value of an investmentwill fluctuate so that an investor’s shares, when redeemed, may be worth more or less than their original cost. Index information is available at monthend only; therefore the closest month end to inception date of the Fund, May 31, 1993, was used for since inception index returns. Currentperformance may be lower or higher than the performance data quoted. Please visit www.tweedy.com to obtain performance data which is current tothe most recent month end.
* The Fund does not impose any front-end or deferred sales charges. However, a 2% redemption fee is imposed on redemption proceeds forredemptions or exchanges made less than 15 days after purchase. Performance data does not reflect the deduction of the redemption fee, and ifreflected, the redemption fee would reduce any performance data quoted for periods of 14 days or less. The expense ratios shown above reflect theinclusion of acquired fund fees and expenses (i.e., the fees and expenses attributable to investing cash balances in money market funds) and maydiffer from those shown in the Fund’s financial statements.
Index Descriptions1. MSCI EAFE (Hedged to US$): Consists of the results of the MSCI EAFE Index 100% hedged back into U.S dollars and accounts for interestdifferentials in forward currency exchange rates. Index results are inclusive of dividends and net of foreign withholding taxes.2. MSCI EAFE (US$): An unmanaged capitalization-weighted index of companies representing the stock markets of Europe, Australasia and the Far East.Index results are inclusive of dividends and net of foreign withholding taxes.
Indexes are unmanaged, and the figures for the indexes shown include reinvestment of dividends and capital gains distributions and do not reflect anyfees or expenses. Investors cannot invest directly in an index. We strongly recommend that these factors be considered before an investment decisionis made.
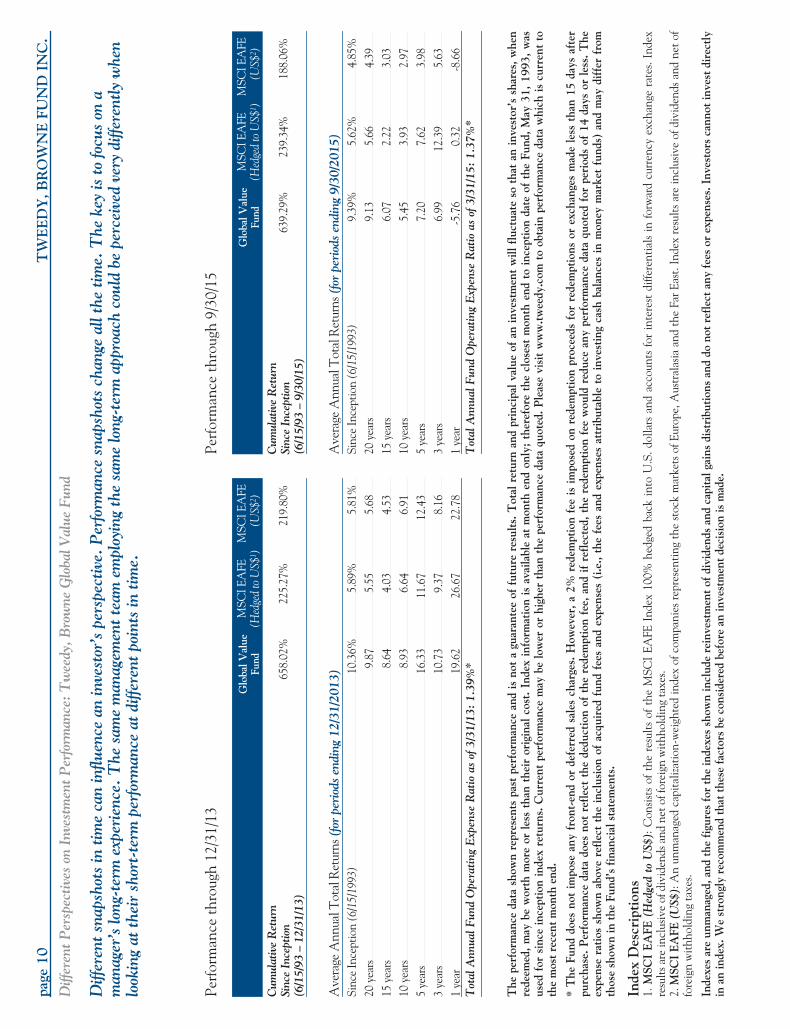
page
10T
WE
ED
Y,B
RO
WN
EFU
ND
INC
.
Diff
eren
tPer
spec
tives
onIn
vest
men
tPer
form
ance
:Tw
eedy
,Bro
wne
Glo
balV
alue
Fund
Diff
eren
tsna
psho
tsin
time
can
influ
ence
anin
vest
or’s
pers
pect
ive.
Per
form
ance
snap
shot
sch
ange
allt
hetim
e.T
heke
yis
tofo
cus
ona
man
ager
’slo
ng-t
erm
expe
rien
ce.T
hesa
me
man
agem
entt
eam
empl
oyin
gth
esa
me
long
-ter
map
proa
chco
uld
bepe
rcei
ved
very
diffe
rent
lyw
hen
look
ing
atth
eir
shor
t-te
rmpe
rfor
man
ceat
diffe
rent
poin
tsin
time.
Perf
orm
ance
thro
ugh
12/3
1/13
Glo
balV
alue
Fund
MSC
IEA
FE(H
edge
dto
US$
1 )M
SCIE
AFE
(US$
2 )C
umul
ativ
eR
etur
nSi
nce
Ince
ptio
n(6
/15/
93–
12/3
1/13
)65
8.02
%22
5.27
%21
9.80
%
Ave
rage
Ann
ualT
otal
Ret
urns
(for
peri
ods
endi
ng12
/31/
2013
)Si
nce
Ince
ptio
n(6
/15/
1993
)10
.36%
5.89
%5.
81%
20ye
ars
9.87
5.55
5.68
15ye
ars
8.64
4.03
4.53
10ye
ars
8.93
6.64
6.91
5ye
ars
16.3
311
.67
12.4
33
year
s10
.73
9.37
8.16
1ye
ar19
.62
26.6
722
.78
Tot
alA
nnua
lFun
dO
pera
ting
Exp
ense
Rat
ioas
of3/
31/1
3:1.
39%
*
Perf
orm
ance
thro
ugh
9/30
/15
Glo
balV
alue
Fund
MSC
IEA
FE(H
edge
dto
US$
1 )M
SCIE
AFE
(US$
2 )C
umul
ativ
eR
etur
nSi
nce
Ince
ptio
n(6
/15/
93–
9/30
/15)
639.
29%
239.
34%
188.
06%
Ave
rage
Ann
ualT
otal
Ret
urns
(for
peri
ods
endi
ng9/
30/2
015)
Sinc
eIn
cept
ion
(6/1
5/19
93)
9.39
%5.
62%
4.85
%20
year
s9.
135.
664.
3915
year
s6.
072.
223.
0310
year
s5.
453.
932.
975
year
s7.
207.
623.
983
year
s6.
9912
.39
5.63
1ye
ar-5
.76
0.32
-8.6
6T
otal
Ann
ualF
und
Ope
ratin
gE
xpen
seR
atio
asof
3/31
/15:
1.37
%*
The
perf
orm
ance
data
show
nre
pres
ents
past
perf
orm
ance
and
isno
ta
guar
ante
eof
futu
rere
sult
s.T
otal
retu
rnan
dpr
inci
palv
alue
ofan
inve
stm
ent
will
fluc
tuat
eso
that
anin
vest
or’s
shar
es,w
hen
rede
emed
,m
aybe
wor
thm
ore
orle
ssth
anth
eir
orig
inal
cost
.In
dex
info
rmat
ion
isav
aila
ble
atm
onth
end
only
;th
eref
ore
the
clos
est
mon
then
dto
ince
ptio
nda
teof
the
Fund
,M
ay31
,19
93,
was
used
for
sinc
ein
cept
ion
inde
xre
turn
s.C
urre
ntpe
rfor
man
cem
aybe
low
eror
high
erth
anth
epe
rfor
man
ceda
taqu
oted
.Ple
ase
visi
tw
ww
.tw
eedy
.com
toob
tain
perf
orm
ance
data
whi
chis
curr
ent
toth
em
ost
rece
ntm
onth
end.
*T
heFu
nddo
esno
tim
pose
any
fron
t-en
dor
defe
rred
sale
sch
arge
s.H
owev
er,
a2%
rede
mpt
ion
fee
isim
pose
don
rede
mpt
ion
proc
eeds
for
rede
mpt
ions
orex
chan
ges
mad
ele
ssth
an15
days
afte
rpu
rcha
se.
Per
form
ance
data
does
not
refl
ect
the
dedu
ctio
nof
the
rede
mpt
ion
fee,
and
ifre
flec
ted,
the
rede
mpt
ion
fee
wou
ldre
duce
any
perf
orm
ance
data
quot
edfo
rpe
riod
sof
14da
ysor
less
.T
heex
pens
era
tios
show
nab
ove
refle
ctth
ein
clus
ion
ofac
quir
edfu
ndfe
esan
dex
pens
es(i
.e.,
the
fees
and
expe
nses
attr
ibut
able
toin
vest
ing
cash
bala
nces
inm
oney
mar
ket
fund
s)an
dm
aydi
ffer
from
thos
esh
own
inth
eFu
nd’s
fina
ncia
lsta
tem
ents
.
Inde
xD
escr
ipti
ons
1.M
SCI
EA
FE(H
edge
dto
US$
):C
onsis
tsof
the
resu
ltsof
the
MSC
IEA
FEIn
dex
100%
hedg
edba
ckin
toU
.S.d
olla
rsan
dac
coun
tsfo
rin
tere
stdi
ffere
ntia
lsin
forw
ard
curr
ency
exch
ange
rate
s.In
dex
resu
ltsar
ein
clus
ive
ofdi
vide
ndsa
ndne
toff
orei
gnw
ithho
ldin
gta
xes.
2.M
SCI
EA
FE(U
S$):
An
unm
anag
edca
pita
lizat
ion-
wei
ghte
din
dex
ofco
mpa
nies
repr
esen
ting
the
stoc
km
arke
tsof
Euro
pe,A
ustr
alas
iaan
dth
eFa
rEas
t.In
dex
resu
ltsar
ein
clus
ive
ofdi
vide
ndsa
ndne
tof
fore
ign
with
hold
ing
taxe
s.
Inde
xes
are
unm
anag
ed,a
ndth
efi
gure
sfo
rth
ein
dexe
ssh
own
incl
ude
rein
vest
men
tof
divi
dend
san
dca
pita
lgai
nsdi
stri
buti
ons
and
dono
tre
flec
tan
yfe
esor
expe
nses
.Inv
esto
rsca
nnot
inve
stdi
rect
lyin
anin
dex.
We
stro
ngly
reco
mm
end
that
thes
efa
ctor
sbe
cons
ider
edbe
fore
anin
vest
men
tde
cisi
onis
mad
e.
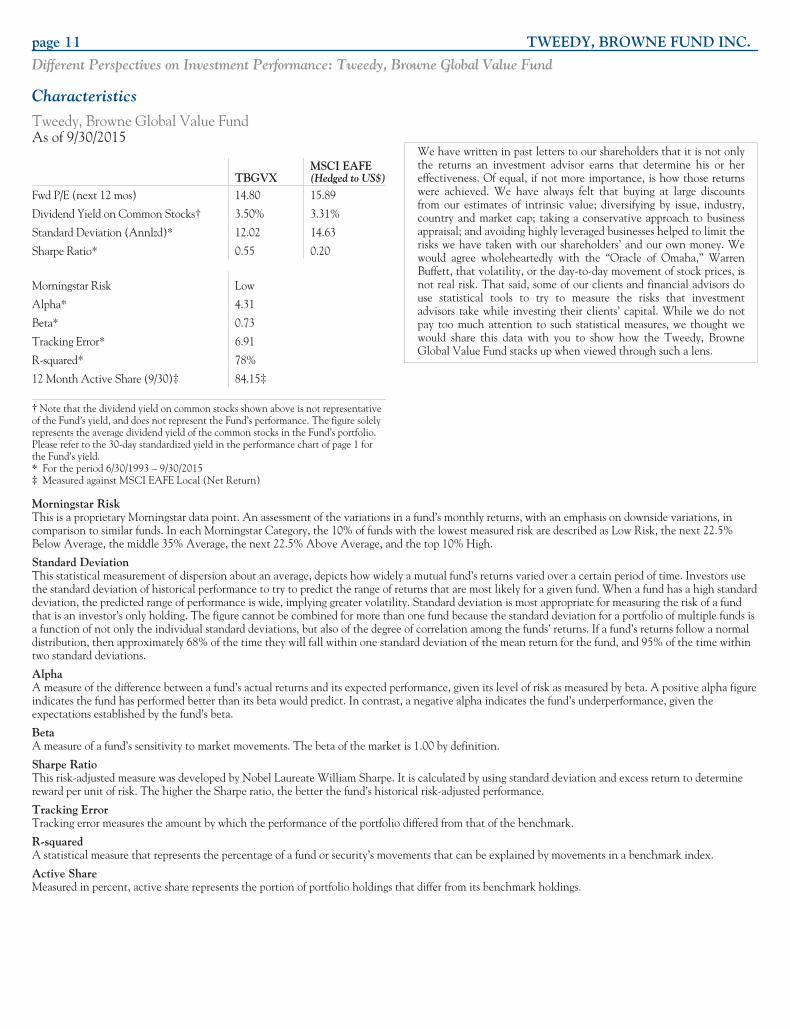
page 11 TWEEDY, BROWNE FUND INC.
Different Perspectives on Investment Performance: Tweedy, Browne Global Value Fund
CharacteristicsTweedy, Browne Global Value FundAs of 9/30/2015
TBGVXMSCI EAFE(Hedged to US$)
Fwd P/E (next 12 mos) 14.80 15.89
Dividend Yield on Common Stocks† 3.50% 3.31%
Standard Deviation (Annlzd)* 12.02 14.63
Sharpe Ratio* 0.55 0.20
Morningstar Risk Low
Alpha* 4.31
Beta* 0.73
Tracking Error* 6.91
R-squared* 78%
12 Month Active Share (9/30)‡ 84.15‡
† Note that the dividend yield on common stocks shown above is not representativeof the Fund’s yield, and does not represent the Fund’s performance. The figure solelyrepresents the average dividend yield of the common stocks in the Fund’s portfolio.Please refer to the 30-day standardized yield in the performance chart of page 1 forthe Fund’s yield.* For the period 6/30/1993 – 9/30/2015‡ Measured against MSCI EAFE Local (Net Return)
We have written in past letters to our shareholders that it is not onlythe returns an investment advisor earns that determine his or hereffectiveness. Of equal, if not more importance, is how those returnswere achieved. We have always felt that buying at large discountsfrom our estimates of intrinsic value; diversifying by issue, industry,country and market cap; taking a conservative approach to businessappraisal; and avoiding highly leveraged businesses helped to limit therisks we have taken with our shareholders’ and our own money. Wewould agree wholeheartedly with the “Oracle of Omaha,” WarrenBuffett, that volatility, or the day-to-day movement of stock prices, isnot real risk. That said, some of our clients and financial advisors douse statistical tools to try to measure the risks that investmentadvisors take while investing their clients’ capital. While we do notpay too much attention to such statistical measures, we thought wewould share this data with you to show how the Tweedy, BrowneGlobal Value Fund stacks up when viewed through such a lens.
Morningstar RiskThis is a proprietary Morningstar data point. An assessment of the variations in a fund’s monthly returns, with an emphasis on downside variations, incomparison to similar funds. In each Morningstar Category, the 10% of funds with the lowest measured risk are described as Low Risk, the next 22.5%Below Average, the middle 35% Average, the next 22.5% Above Average, and the top 10% High.
Standard DeviationThis statistical measurement of dispersion about an average, depicts how widely a mutual fund’s returns varied over a certain period of time. Investors usethe standard deviation of historical performance to try to predict the range of returns that are most likely for a given fund. When a fund has a high standarddeviation, the predicted range of performance is wide, implying greater volatility. Standard deviation is most appropriate for measuring the risk of a fundthat is an investor’s only holding. The figure cannot be combined for more than one fund because the standard deviation for a portfolio of multiple funds isa function of not only the individual standard deviations, but also of the degree of correlation among the funds’ returns. If a fund’s returns follow a normaldistribution, then approximately 68% of the time they will fall within one standard deviation of the mean return for the fund, and 95% of the time withintwo standard deviations.
AlphaA measure of the difference between a fund’s actual returns and its expected performance, given its level of risk as measured by beta. A positive alpha figureindicates the fund has performed better than its beta would predict. In contrast, a negative alpha indicates the fund’s underperformance, given theexpectations established by the fund’s beta.
BetaA measure of a fund’s sensitivity to market movements. The beta of the market is 1.00 by definition.
Sharpe RatioThis risk-adjusted measure was developed by Nobel Laureate William Sharpe. It is calculated by using standard deviation and excess return to determinereward per unit of risk. The higher the Sharpe ratio, the better the fund’s historical risk-adjusted performance.
Tracking ErrorTracking error measures the amount by which the performance of the portfolio differed from that of the benchmark.
R-squaredA statistical measure that represents the percentage of a fund or security’s movements that can be explained by movements in a benchmark index.
Active ShareMeasured in percent, active share represents the portion of portfolio holdings that differ from its benchmark holdings.
TWEEDY, BROWNE FUND INC.
Tweedy, Browne Global Value FundTweedy, Browne Global Value Fund II – Currency UnhedgedTweedy, Browne Value FundTweedy, Browne Worldwide High Dividend Yield Value Fund
SEMI-ANNUAL REPORT
September 30, 2015
II-1
TWEEDY, BROWNE FUND INC.
Expense Information (Unaudited)
A shareholder of the Global Value Fund, Global ValueFund II – Currency Unhedged, Value Fund or WorldwideHigh Dividend Yield Value Fund (collectively, the “Funds”)incurs two types of costs: (1) transaction costs and(2) ongoing costs, including management fees and otherFund expenses. The Example below is intended to help ashareholder understand the ongoing costs (in U.S. dollars) ofinvesting in the Funds and to compare these costs with theongoing costs of investing in other mutual funds.
The Example is based on an investment of $1,000invested at the beginning of the period and held for theentire period of April 1, 2015 to September 30, 2015.
Actual Expenses. The first part of the table presentedbelow, under the heading “Actual Expenses,” providesinformation about actual account values and actualexpenses. The information in this line may be used with theamount a shareholder invested to estimate the expenses thatwere paid by the shareholder over the period. Simply dividethe shareholder’s account value by $1,000 (for example, an$8,600 account value divided by $1,000 = 8.6), thenmultiply the result by the number in the first line under theheading entitled “Expenses Paid During Period” to estimatethe expenses paid during this period.
Hypothetical Example for Comparison Purposes. Thesecond part of the table presented below, under the heading“Hypothetical Expenses,” provides information abouthypothetical account values and hypothetical expensesbased on each Fund’s actual expense ratio and an assumedrate of return of 5% per year before expenses, which is not
each Fund’s actual return. The hypothetical account valuesand expenses may not be used to estimate the actual endingaccount balance or expenses paid by the shareholder of theFunds for the period. This information may be used tocompare the ongoing costs of investing in the Funds to otherfunds. To do so, compare this 5% hypothetical example withthe 5% hypothetical examples that appear in theshareholder reports of the other funds.
Please note that the expenses shown in the table beloware meant to highlight a shareholder’s ongoing costs onlyand do not reflect redemption fees. Redemptions from theGlobal Value Fund, the Global Value Fund II – CurrencyUnhedged and the Worldwide High Dividend Yield ValueFund, including exchange redemptions, made less than15 days after purchase are subject to a redemption fee equalto 2% of the redemption proceeds, which will be retained bythe Funds. (Redemptions, including exchanges, made priorto September 1, 2015 were subject to the same redemptionfee if held less than 60 days.) There are no othertransactional expenses associated with the purchase and saleof shares charged by any of the Funds, such as commissions,sales loads and/or redemption fees on shares held longer than14 days. Other mutual funds may have such transactionalcharges. Therefore, the second part of the table is useful incomparing ongoing costs only, and will not help ashareholder determine the relative total costs of owningdifferent funds. In addition, if redemption fees wereincluded, a shareholder’s costs (if the shareholder redeemedduring the applicable redemption period) would have beenhigher.
Actual ExpensesHypothetical Expenses
(5% Return before Expenses)
BeginningAccountValue4/1/15
EndingAccountValue
9/30/15
ExpensesPaid During
Period*4/1/15 –9/30/15
BeginningAccountValue4/1/15
EndingAccountValue
9/30/15
ExpensesPaid During
Period*4/1/15 –9/30/15
AnnualizedExpense
Ratio
Global Value Fund $1,000.00 $927.70 $6.55 $1,000.00 $1,018.20 $6.86 1.36%
Global Value Fund II –Currency Unhedged $1,000.00 $928.70 $6.61 $1,000.00 $1,018.15 $6.91 1.37%
Value Fund $1,000.00 $903.30 $6.42 $1,000.00 $1,018.25 $6.81 1.35%
Worldwide High DividendYield Value Fund $1,000.00 $902.40 $6.47 $1,000.00 $1,018.20 $6.86 1.36%
* Expenses are equal to each Fund’s annualized expense ratio, multiplied by the average account value over the period,multiplied by the number of days in the period, divided by 366 (to reflect the one-half year period).
II-2
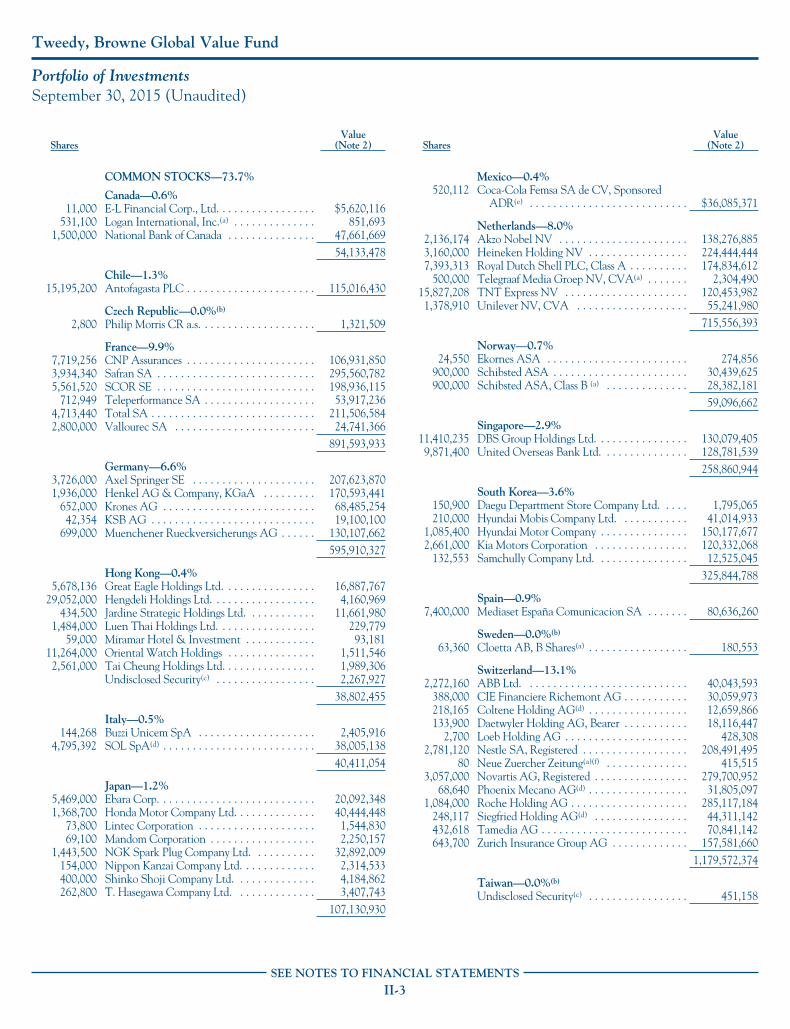
Tweedy, Browne Global Value Fund
Portfolio of InvestmentsSeptember 30, 2015 (Unaudited)
SharesValue
(Note 2)
COMMON STOCKS—73.7%
Canada—0.6%11,000 E-L Financial Corp., Ltd. . . . . . . . . . . . . . . . . $5,620,116
531,100 Logan International, Inc.(a) . . . . . . . . . . . . . . 851,6931,500,000 National Bank of Canada . . . . . . . . . . . . . . . 47,661,669
54,133,478
Chile—1.3%15,195,200 Antofagasta PLC . . . . . . . . . . . . . . . . . . . . . . 115,016,430
Czech Republic—0.0%(b)
2,800 Philip Morris CR a.s. . . . . . . . . . . . . . . . . . . . 1,321,509
France—9.9%7,719,256 CNP Assurances . . . . . . . . . . . . . . . . . . . . . . 106,931,8503,934,340 Safran SA . . . . . . . . . . . . . . . . . . . . . . . . . . . 295,560,7825,561,520 SCOR SE . . . . . . . . . . . . . . . . . . . . . . . . . . . 198,936,115
712,949 Teleperformance SA . . . . . . . . . . . . . . . . . . . 53,917,2364,713,440 Total SA . . . . . . . . . . . . . . . . . . . . . . . . . . . . 211,506,5842,800,000 Vallourec SA . . . . . . . . . . . . . . . . . . . . . . . . 24,741,366
891,593,933
Germany—6.6%3,726,000 Axel Springer SE . . . . . . . . . . . . . . . . . . . . . 207,623,8701,936,000 Henkel AG & Company, KGaA . . . . . . . . . 170,593,441
652,000 Krones AG . . . . . . . . . . . . . . . . . . . . . . . . . . 68,485,25442,354 KSB AG . . . . . . . . . . . . . . . . . . . . . . . . . . . . 19,100,100
699,000 Muenchener Rueckversicherungs AG . . . . . . 130,107,662595,910,327
Hong Kong—0.4%5,678,136 Great Eagle Holdings Ltd. . . . . . . . . . . . . . . . 16,887,767
29,052,000 Hengdeli Holdings Ltd. . . . . . . . . . . . . . . . . . 4,160,969434,500 Jardine Strategic Holdings Ltd. . . . . . . . . . . . 11,661,980
1,484,000 Luen Thai Holdings Ltd. . . . . . . . . . . . . . . . . 229,77959,000 Miramar Hotel & Investment . . . . . . . . . . . . 93,181
11,264,000 Oriental Watch Holdings . . . . . . . . . . . . . . . 1,511,5462,561,000 Tai Cheung Holdings Ltd. . . . . . . . . . . . . . . . 1,989,306
Undisclosed Security(c) . . . . . . . . . . . . . . . . . 2,267,92738,802,455
Italy—0.5%144,268 Buzzi Unicem SpA . . . . . . . . . . . . . . . . . . . . 2,405,916
4,795,392 SOL SpA(d) . . . . . . . . . . . . . . . . . . . . . . . . . . 38,005,13840,411,054
Japan—1.2%5,469,000 Ebara Corp. . . . . . . . . . . . . . . . . . . . . . . . . . . 20,092,3481,368,700 Honda Motor Company Ltd. . . . . . . . . . . . . . 40,444,448
73,800 Lintec Corporation . . . . . . . . . . . . . . . . . . . . 1,544,83069,100 Mandom Corporation . . . . . . . . . . . . . . . . . . 2,250,157
1,443,500 NGK Spark Plug Company Ltd. . . . . . . . . . . 32,892,009154,000 Nippon Kanzai Company Ltd. . . . . . . . . . . . . 2,314,533400,000 Shinko Shoji Company Ltd. . . . . . . . . . . . . . 4,184,862262,800 T. Hasegawa Company Ltd. . . . . . . . . . . . . . 3,407,743
107,130,930
SharesValue
(Note 2)
Mexico—0.4%520,112 Coca-Cola Femsa SA de CV, Sponsored
ADR(e) . . . . . . . . . . . . . . . . . . . . . . . . . . . $36,085,371
Netherlands—8.0%2,136,174 Akzo Nobel NV . . . . . . . . . . . . . . . . . . . . . . 138,276,8853,160,000 Heineken Holding NV . . . . . . . . . . . . . . . . . 224,444,4447,393,313 Royal Dutch Shell PLC, Class A . . . . . . . . . . 174,834,612
500,000 Telegraaf Media Groep NV, CVA(a) . . . . . . . 2,304,49015,827,208 TNT Express NV . . . . . . . . . . . . . . . . . . . . . 120,453,9821,378,910 Unilever NV, CVA . . . . . . . . . . . . . . . . . . . 55,241,980
715,556,393
Norway—0.7%24,550 Ekornes ASA . . . . . . . . . . . . . . . . . . . . . . . . 274,856
900,000 Schibsted ASA . . . . . . . . . . . . . . . . . . . . . . . 30,439,625900,000 Schibsted ASA, Class B (a) . . . . . . . . . . . . . . 28,382,181
59,096,662
Singapore—2.9%11,410,235 DBS Group Holdings Ltd. . . . . . . . . . . . . . . . 130,079,4059,871,400 United Overseas Bank Ltd. . . . . . . . . . . . . . . 128,781,539
258,860,944
South Korea—3.6%150,900 Daegu Department Store Company Ltd. . . . . 1,795,065210,000 Hyundai Mobis Company Ltd. . . . . . . . . . . . 41,014,933
1,085,400 Hyundai Motor Company . . . . . . . . . . . . . . . 150,177,6772,661,000 Kia Motors Corporation . . . . . . . . . . . . . . . . 120,332,068
132,553 Samchully Company Ltd. . . . . . . . . . . . . . . . 12,525,045325,844,788
Spain—0.9%7,400,000 Mediaset España Comunicacion SA . . . . . . . 80,636,260
Sweden—0.0%(b)
63,360 Cloetta AB, B Shares(a) . . . . . . . . . . . . . . . . . 180,553
Switzerland—13.1%2,272,160 ABB Ltd. . . . . . . . . . . . . . . . . . . . . . . . . . . . 40,043,593
388,000 CIE Financiere Richemont AG . . . . . . . . . . . 30,059,973218,165 Coltene Holding AG(d) . . . . . . . . . . . . . . . . . 12,659,866133,900 Daetwyler Holding AG, Bearer . . . . . . . . . . . 18,116,447
2,700 Loeb Holding AG . . . . . . . . . . . . . . . . . . . . . 428,3082,781,120 Nestle SA, Registered . . . . . . . . . . . . . . . . . . 208,491,495
80 Neue Zuercher Zeitung(a)(f) . . . . . . . . . . . . . . 415,5153,057,000 Novartis AG, Registered . . . . . . . . . . . . . . . . 279,700,952
68,640 Phoenix Mecano AG(d) . . . . . . . . . . . . . . . . . 31,805,0971,084,000 Roche Holding AG . . . . . . . . . . . . . . . . . . . . 285,117,184
248,117 Siegfried Holding AG(d) . . . . . . . . . . . . . . . . 44,311,142432,618 Tamedia AG . . . . . . . . . . . . . . . . . . . . . . . . . 70,841,142643,700 Zurich Insurance Group AG . . . . . . . . . . . . . 157,581,660
1,179,572,374
Taiwan—0.0%(b)
Undisclosed Security(c) . . . . . . . . . . . . . . . . . 451,158
SEE NOTES TO FINANCIAL STATEMENTSII-3
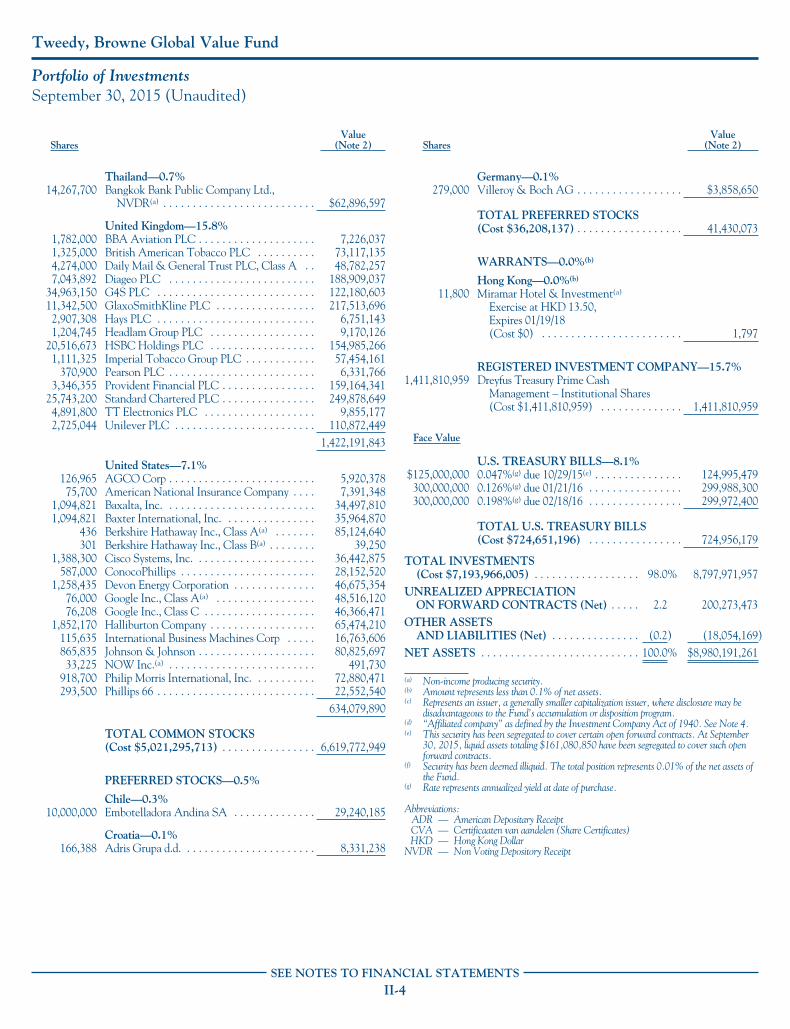
Tweedy, Browne Global Value Fund
Portfolio of InvestmentsSeptember 30, 2015 (Unaudited)
SharesValue
(Note 2)
Thailand—0.7%14,267,700 Bangkok Bank Public Company Ltd.,
NVDR(a) . . . . . . . . . . . . . . . . . . . . . . . . . . $62,896,597
United Kingdom—15.8%1,782,000 BBA Aviation PLC . . . . . . . . . . . . . . . . . . . . 7,226,0371,325,000 British American Tobacco PLC . . . . . . . . . . 73,117,1354,274,000 Daily Mail & General Trust PLC, Class A . . 48,782,2577,043,892 Diageo PLC . . . . . . . . . . . . . . . . . . . . . . . . . 188,909,037
34,963,150 G4S PLC . . . . . . . . . . . . . . . . . . . . . . . . . . . 122,180,60311,342,500 GlaxoSmithKline PLC . . . . . . . . . . . . . . . . . 217,513,6962,907,308 Hays PLC . . . . . . . . . . . . . . . . . . . . . . . . . . . 6,751,1431,204,745 Headlam Group PLC . . . . . . . . . . . . . . . . . . 9,170,126
20,516,673 HSBC Holdings PLC . . . . . . . . . . . . . . . . . . 154,985,2661,111,325 Imperial Tobacco Group PLC . . . . . . . . . . . . 57,454,161
370,900 Pearson PLC . . . . . . . . . . . . . . . . . . . . . . . . . 6,331,7663,346,355 Provident Financial PLC . . . . . . . . . . . . . . . . 159,164,341
25,743,200 Standard Chartered PLC . . . . . . . . . . . . . . . . 249,878,6494,891,800 TT Electronics PLC . . . . . . . . . . . . . . . . . . . 9,855,1772,725,044 Unilever PLC . . . . . . . . . . . . . . . . . . . . . . . . 110,872,449
1,422,191,843
United States—7.1%126,965 AGCO Corp . . . . . . . . . . . . . . . . . . . . . . . . . 5,920,37875,700 American National Insurance Company . . . . 7,391,348
1,094,821 Baxalta, Inc. . . . . . . . . . . . . . . . . . . . . . . . . . 34,497,8101,094,821 Baxter International, Inc. . . . . . . . . . . . . . . . 35,964,870
436 Berkshire Hathaway Inc., Class A(a) . . . . . . . 85,124,640301 Berkshire Hathaway Inc., Class B(a) . . . . . . . . 39,250
1,388,300 Cisco Systems, Inc. . . . . . . . . . . . . . . . . . . . . 36,442,875587,000 ConocoPhillips . . . . . . . . . . . . . . . . . . . . . . . 28,152,520
1,258,435 Devon Energy Corporation . . . . . . . . . . . . . . 46,675,35476,000 Google Inc., Class A(a) . . . . . . . . . . . . . . . . . 48,516,12076,208 Google Inc., Class C . . . . . . . . . . . . . . . . . . . 46,366,471
1,852,170 Halliburton Company . . . . . . . . . . . . . . . . . . 65,474,210115,635 International Business Machines Corp . . . . . 16,763,606865,835 Johnson & Johnson . . . . . . . . . . . . . . . . . . . . 80,825,69733,225 NOW Inc.(a) . . . . . . . . . . . . . . . . . . . . . . . . . 491,730
918,700 Philip Morris International, Inc. . . . . . . . . . . 72,880,471293,500 Phillips 66 . . . . . . . . . . . . . . . . . . . . . . . . . . . 22,552,540
634,079,890
TOTAL COMMON STOCKS(Cost $5,021,295,713) . . . . . . . . . . . . . . . . 6,619,772,949
PREFERRED STOCKS—0.5%
Chile—0.3%10,000,000 Embotelladora Andina SA . . . . . . . . . . . . . . 29,240,185
Croatia—0.1%166,388 Adris Grupa d.d. . . . . . . . . . . . . . . . . . . . . . . 8,331,238
SharesValue
(Note 2)
Germany—0.1%279,000 Villeroy & Boch AG . . . . . . . . . . . . . . . . . . $3,858,650
TOTAL PREFERRED STOCKS(Cost $36,208,137) . . . . . . . . . . . . . . . . . . 41,430,073
WARRANTS—0.0%(b)
Hong Kong—0.0%(b)
11,800 Miramar Hotel & Investment(a)
Exercise at HKD 13.50,Expires 01/19/18(Cost $0) . . . . . . . . . . . . . . . . . . . . . . . . 1,797
REGISTERED INVESTMENT COMPANY—15.7%1,411,810,959 Dreyfus Treasury Prime Cash
Management – Institutional Shares(Cost $1,411,810,959) . . . . . . . . . . . . . . 1,411,810,959
Face Value
U.S. TREASURY BILLS—8.1%$125,000,000 0.047%(g) due 10/29/15(e) . . . . . . . . . . . . . . . 124,995,479300,000,000 0.126%(g) due 01/21/16 . . . . . . . . . . . . . . . . 299,988,300300,000,000 0.198%(g) due 02/18/16 . . . . . . . . . . . . . . . . 299,972,400
TOTAL U.S. TREASURY BILLS(Cost $724,651,196) . . . . . . . . . . . . . . . . 724,956,179
TOTAL INVESTMENTS(Cost $7,193,966,005) . . . . . . . . . . . . . . . . . . 98.0% 8,797,971,957
UNREALIZED APPRECIATIONON FORWARD CONTRACTS (Net) . . . . . 2.2 200,273,473
OTHER ASSETSAND LIABILITIES (Net) . . . . . . . . . . . . . . . (0.2) (18,054,169)
NET ASSETS . . . . . . . . . . . . . . . . . . . . . . . . . . . 100.0% $8,980,191,261
(a) Non-income producing security.(b) Amount represents less than 0.1% of net assets.(c) Represents an issuer, a generally smaller capitalization issuer, where disclosure may be
disadvantageous to the Fund’s accumulation or disposition program.(d) “Affiliated company” as defined by the Investment Company Act of 1940. See Note 4.(e) This security has been segregated to cover certain open forward contracts. At September
30, 2015, liquid assets totaling $161,080,850 have been segregated to cover such openforward contracts.
(f) Security has been deemed illiquid. The total position represents 0.01% of the net assets ofthe Fund.
(g) Rate represents annualized yield at date of purchase.
Abbreviations:ADR — American Depositary ReceiptCVA — Certificaaten van aandelen (Share Certificates)HKD — Hong Kong Dollar
NVDR — Non Voting Depository Receipt
SEE NOTES TO FINANCIAL STATEMENTSII-4
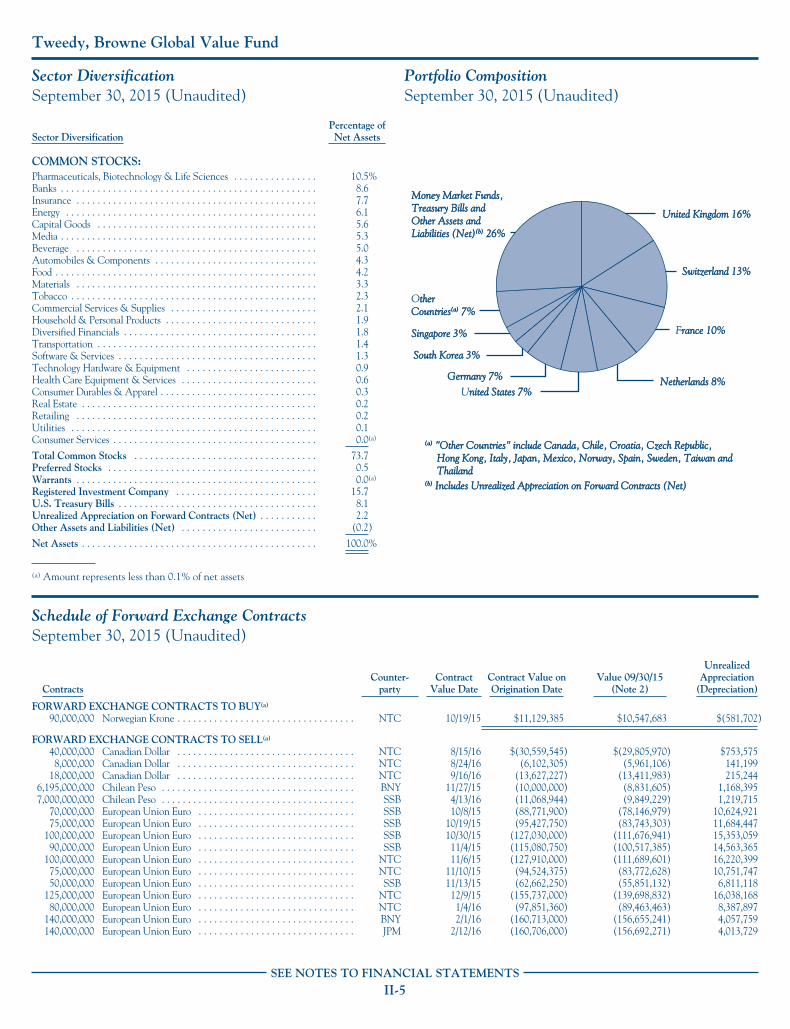
Tweedy, Browne Global Value Fund
Sector DiversificationSeptember 30, 2015 (Unaudited)
Sector DiversificationPercentage ofNet Assets
COMMON STOCKS:Pharmaceuticals, Biotechnology & Life Sciences . . . . . . . . . . . . . . . . 10.5%Banks . . . . . . . . . . . . . . . . . . . . . . . . . . . . . . . . . . . . . . . . . . . . . . . . . 8.6Insurance . . . . . . . . . . . . . . . . . . . . . . . . . . . . . . . . . . . . . . . . . . . . . . 7.7Energy . . . . . . . . . . . . . . . . . . . . . . . . . . . . . . . . . . . . . . . . . . . . . . . . 6.1Capital Goods . . . . . . . . . . . . . . . . . . . . . . . . . . . . . . . . . . . . . . . . . . 5.6Media . . . . . . . . . . . . . . . . . . . . . . . . . . . . . . . . . . . . . . . . . . . . . . . . . 5.3Beverage . . . . . . . . . . . . . . . . . . . . . . . . . . . . . . . . . . . . . . . . . . . . . . 5.0Automobiles & Components . . . . . . . . . . . . . . . . . . . . . . . . . . . . . . . 4.3Food . . . . . . . . . . . . . . . . . . . . . . . . . . . . . . . . . . . . . . . . . . . . . . . . . . 4.2Materials . . . . . . . . . . . . . . . . . . . . . . . . . . . . . . . . . . . . . . . . . . . . . . 3.3Tobacco . . . . . . . . . . . . . . . . . . . . . . . . . . . . . . . . . . . . . . . . . . . . . . . 2.3Commercial Services & Supplies . . . . . . . . . . . . . . . . . . . . . . . . . . . . 2.1Household & Personal Products . . . . . . . . . . . . . . . . . . . . . . . . . . . . . 1.9Diversified Financials . . . . . . . . . . . . . . . . . . . . . . . . . . . . . . . . . . . . . 1.8Transportation . . . . . . . . . . . . . . . . . . . . . . . . . . . . . . . . . . . . . . . . . . 1.4Software & Services . . . . . . . . . . . . . . . . . . . . . . . . . . . . . . . . . . . . . . 1.3Technology Hardware & Equipment . . . . . . . . . . . . . . . . . . . . . . . . . 0.9Health Care Equipment & Services . . . . . . . . . . . . . . . . . . . . . . . . . . 0.6Consumer Durables & Apparel . . . . . . . . . . . . . . . . . . . . . . . . . . . . . . 0.3Real Estate . . . . . . . . . . . . . . . . . . . . . . . . . . . . . . . . . . . . . . . . . . . . . 0.2Retailing . . . . . . . . . . . . . . . . . . . . . . . . . . . . . . . . . . . . . . . . . . . . . . 0.2Utilities . . . . . . . . . . . . . . . . . . . . . . . . . . . . . . . . . . . . . . . . . . . . . . . 0.1Consumer Services . . . . . . . . . . . . . . . . . . . . . . . . . . . . . . . . . . . . . . . 0.0(a)
Total Common Stocks . . . . . . . . . . . . . . . . . . . . . . . . . . . . . . . . . . . 73.7Preferred Stocks . . . . . . . . . . . . . . . . . . . . . . . . . . . . . . . . . . . . . . . . 0.5Warrants . . . . . . . . . . . . . . . . . . . . . . . . . . . . . . . . . . . . . . . . . . . . . . 0.0(a)
Registered Investment Company . . . . . . . . . . . . . . . . . . . . . . . . . . . 15.7U.S. Treasury Bills . . . . . . . . . . . . . . . . . . . . . . . . . . . . . . . . . . . . . . 8.1Unrealized Appreciation on Forward Contracts (Net) . . . . . . . . . . . 2.2Other Assets and Liabilities (Net) . . . . . . . . . . . . . . . . . . . . . . . . . . (0.2)
Net Assets . . . . . . . . . . . . . . . . . . . . . . . . . . . . . . . . . . . . . . . . . . . . . 100.0%
(a) Amount represents less than 0.1% of net assets
Portfolio CompositionSeptember 30, 2015 (Unaudited)
(b)(b) Includes Unrealized Appreciation on Forward Contracts (Net)Includes Unrealized Appreciation on Forward Contracts (Net)
Money Market Funds, Money Market Funds, Treasury Bills andTreasury Bills andOther Assets andOther Assets andLiabilities (Net)Liabilities (Net)(b)(b) 26% 26%
Switzerland Switzerland 13%13%
United Kingdom United Kingdom 16%16%
United States nited States 7%7%Netherlands Netherlands 8%8%
France rance 10%10%
South KoreaSouth Korea 3%3%
SingaporeSingapore 3%3%
Germany Germany 7%7%
OthertherCountriesCountries(a)(a) 7%7%
(a)(a) "Other Countries" include Canada, Chile, Croatia, Czech Republic,"Other Countries" include Canada, Chile, Croatia, Czech Republic, Hong Kong, Italy, Japan, Mexico, Norway, Spain, Sweden, Taiwan andHong Kong, Italy, Japan, Mexico, Norway, Spain, Sweden, Taiwan and Thailand Thailand
Schedule of Forward Exchange ContractsSeptember 30, 2015 (Unaudited)
ContractsCounter-
partyContract
Value DateContract Value onOrigination Date
Value 09/30/15(Note 2)
UnrealizedAppreciation
(Depreciation)
FORWARD EXCHANGE CONTRACTS TO BUY(a)
90,000,000 Norwegian Krone . . . . . . . . . . . . . . . . . . . . . . . . . . . . . . . . . . NTC 10/19/15 $11,129,385 $10,547,683 $(581,702)
FORWARD EXCHANGE CONTRACTS TO SELL(a)
40,000,000 Canadian Dollar . . . . . . . . . . . . . . . . . . . . . . . . . . . . . . . . . . NTC 8/15/16 $(30,559,545) $(29,805,970) $753,5758,000,000 Canadian Dollar . . . . . . . . . . . . . . . . . . . . . . . . . . . . . . . . . . NTC 8/24/16 (6,102,305) (5,961,106) 141,199
18,000,000 Canadian Dollar . . . . . . . . . . . . . . . . . . . . . . . . . . . . . . . . . . NTC 9/16/16 (13,627,227) (13,411,983) 215,2446,195,000,000 Chilean Peso . . . . . . . . . . . . . . . . . . . . . . . . . . . . . . . . . . . . . BNY 11/27/15 (10,000,000) (8,831,605) 1,168,3957,000,000,000 Chilean Peso . . . . . . . . . . . . . . . . . . . . . . . . . . . . . . . . . . . . . SSB 4/13/16 (11,068,944) (9,849,229) 1,219,715
70,000,000 European Union Euro . . . . . . . . . . . . . . . . . . . . . . . . . . . . . . SSB 10/8/15 (88,771,900) (78,146,979) 10,624,92175,000,000 European Union Euro . . . . . . . . . . . . . . . . . . . . . . . . . . . . . . SSB 10/19/15 (95,427,750) (83,743,303) 11,684,447
100,000,000 European Union Euro . . . . . . . . . . . . . . . . . . . . . . . . . . . . . . SSB 10/30/15 (127,030,000) (111,676,941) 15,353,05990,000,000 European Union Euro . . . . . . . . . . . . . . . . . . . . . . . . . . . . . . SSB 11/4/15 (115,080,750) (100,517,385) 14,563,365
100,000,000 European Union Euro . . . . . . . . . . . . . . . . . . . . . . . . . . . . . . NTC 11/6/15 (127,910,000) (111,689,601) 16,220,39975,000,000 European Union Euro . . . . . . . . . . . . . . . . . . . . . . . . . . . . . . NTC 11/10/15 (94,524,375) (83,772,628) 10,751,74750,000,000 European Union Euro . . . . . . . . . . . . . . . . . . . . . . . . . . . . . . SSB 11/13/15 (62,662,250) (55,851,132) 6,811,118
125,000,000 European Union Euro . . . . . . . . . . . . . . . . . . . . . . . . . . . . . . NTC 12/9/15 (155,737,000) (139,698,832) 16,038,16880,000,000 European Union Euro . . . . . . . . . . . . . . . . . . . . . . . . . . . . . . NTC 1/4/16 (97,851,360) (89,463,463) 8,387,897
140,000,000 European Union Euro . . . . . . . . . . . . . . . . . . . . . . . . . . . . . . BNY 2/1/16 (160,713,000) (156,655,241) 4,057,759140,000,000 European Union Euro . . . . . . . . . . . . . . . . . . . . . . . . . . . . . . JPM 2/12/16 (160,706,000) (156,692,271) 4,013,729
SEE NOTES TO FINANCIAL STATEMENTSII-5
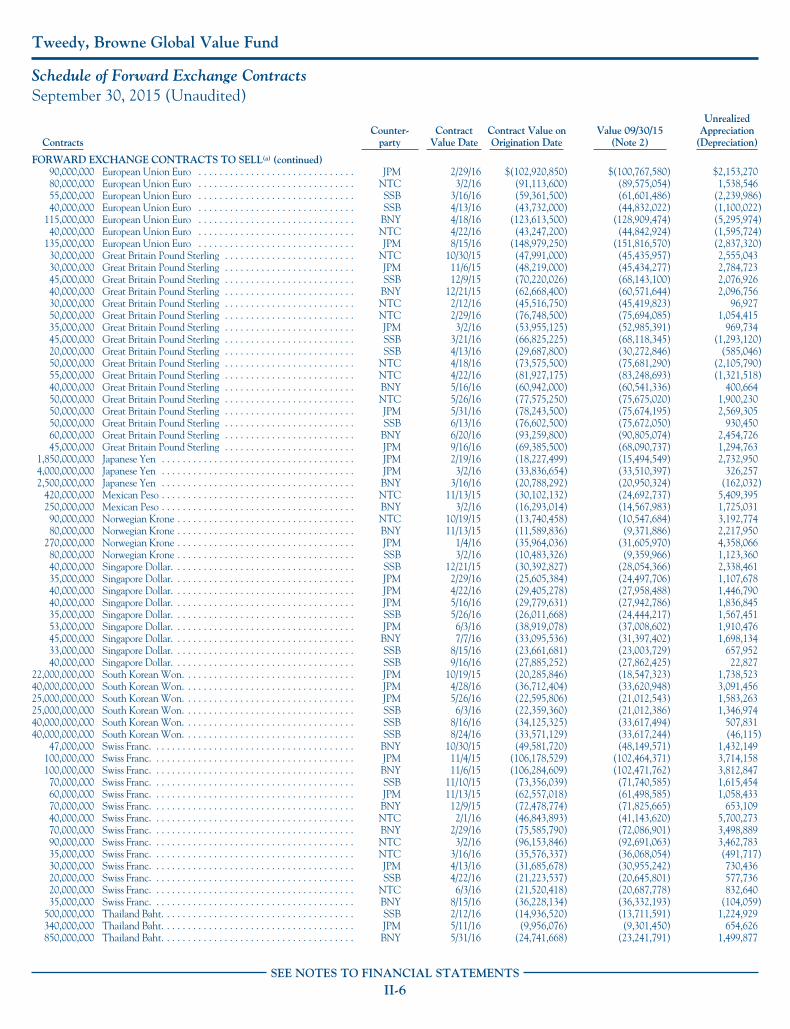
Tweedy, Browne Global Value Fund
Schedule of Forward Exchange ContractsSeptember 30, 2015 (Unaudited)
ContractsCounter-
partyContract
Value DateContract Value onOrigination Date
Value 09/30/15(Note 2)
UnrealizedAppreciation
(Depreciation)
FORWARD EXCHANGE CONTRACTS TO SELL(a) (continued)90,000,000 European Union Euro . . . . . . . . . . . . . . . . . . . . . . . . . . . . . . JPM 2/29/16 $(102,920,850) $(100,767,580) $2,153,27080,000,000 European Union Euro . . . . . . . . . . . . . . . . . . . . . . . . . . . . . . NTC 3/2/16 (91,113,600) (89,575,054) 1,538,54655,000,000 European Union Euro . . . . . . . . . . . . . . . . . . . . . . . . . . . . . . SSB 3/16/16 (59,361,500) (61,601,486) (2,239,986)40,000,000 European Union Euro . . . . . . . . . . . . . . . . . . . . . . . . . . . . . . SSB 4/13/16 (43,732,000) (44,832,022) (1,100,022)
115,000,000 European Union Euro . . . . . . . . . . . . . . . . . . . . . . . . . . . . . . BNY 4/18/16 (123,613,500) (128,909,474) (5,295,974)40,000,000 European Union Euro . . . . . . . . . . . . . . . . . . . . . . . . . . . . . . NTC 4/22/16 (43,247,200) (44,842,924) (1,595,724)
135,000,000 European Union Euro . . . . . . . . . . . . . . . . . . . . . . . . . . . . . . JPM 8/15/16 (148,979,250) (151,816,570) (2,837,320)30,000,000 Great Britain Pound Sterling . . . . . . . . . . . . . . . . . . . . . . . . . NTC 10/30/15 (47,991,000) (45,435,957) 2,555,04330,000,000 Great Britain Pound Sterling . . . . . . . . . . . . . . . . . . . . . . . . . JPM 11/6/15 (48,219,000) (45,434,277) 2,784,72345,000,000 Great Britain Pound Sterling . . . . . . . . . . . . . . . . . . . . . . . . . SSB 12/9/15 (70,220,026) (68,143,100) 2,076,92640,000,000 Great Britain Pound Sterling . . . . . . . . . . . . . . . . . . . . . . . . . BNY 12/21/15 (62,668,400) (60,571,644) 2,096,75630,000,000 Great Britain Pound Sterling . . . . . . . . . . . . . . . . . . . . . . . . . NTC 2/12/16 (45,516,750) (45,419,823) 96,92750,000,000 Great Britain Pound Sterling . . . . . . . . . . . . . . . . . . . . . . . . . NTC 2/29/16 (76,748,500) (75,694,085) 1,054,41535,000,000 Great Britain Pound Sterling . . . . . . . . . . . . . . . . . . . . . . . . . JPM 3/2/16 (53,955,125) (52,985,391) 969,73445,000,000 Great Britain Pound Sterling . . . . . . . . . . . . . . . . . . . . . . . . . SSB 3/21/16 (66,825,225) (68,118,345) (1,293,120)20,000,000 Great Britain Pound Sterling . . . . . . . . . . . . . . . . . . . . . . . . . SSB 4/13/16 (29,687,800) (30,272,846) (585,046)50,000,000 Great Britain Pound Sterling . . . . . . . . . . . . . . . . . . . . . . . . . NTC 4/18/16 (73,575,500) (75,681,290) (2,105,790)55,000,000 Great Britain Pound Sterling . . . . . . . . . . . . . . . . . . . . . . . . . NTC 4/22/16 (81,927,175) (83,248,693) (1,321,518)40,000,000 Great Britain Pound Sterling . . . . . . . . . . . . . . . . . . . . . . . . . BNY 5/16/16 (60,942,000) (60,541,336) 400,66450,000,000 Great Britain Pound Sterling . . . . . . . . . . . . . . . . . . . . . . . . . NTC 5/26/16 (77,575,250) (75,675,020) 1,900,23050,000,000 Great Britain Pound Sterling . . . . . . . . . . . . . . . . . . . . . . . . . JPM 5/31/16 (78,243,500) (75,674,195) 2,569,30550,000,000 Great Britain Pound Sterling . . . . . . . . . . . . . . . . . . . . . . . . . SSB 6/13/16 (76,602,500) (75,672,050) 930,45060,000,000 Great Britain Pound Sterling . . . . . . . . . . . . . . . . . . . . . . . . . BNY 6/20/16 (93,259,800) (90,805,074) 2,454,72645,000,000 Great Britain Pound Sterling . . . . . . . . . . . . . . . . . . . . . . . . . JPM 9/16/16 (69,385,500) (68,090,737) 1,294,763
1,850,000,000 Japanese Yen . . . . . . . . . . . . . . . . . . . . . . . . . . . . . . . . . . . . . JPM 2/19/16 (18,227,499) (15,494,549) 2,732,9504,000,000,000 Japanese Yen . . . . . . . . . . . . . . . . . . . . . . . . . . . . . . . . . . . . . JPM 3/2/16 (33,836,654) (33,510,397) 326,2572,500,000,000 Japanese Yen . . . . . . . . . . . . . . . . . . . . . . . . . . . . . . . . . . . . . BNY 3/16/16 (20,788,292) (20,950,324) (162,032)
420,000,000 Mexican Peso . . . . . . . . . . . . . . . . . . . . . . . . . . . . . . . . . . . . . NTC 11/13/15 (30,102,132) (24,692,737) 5,409,395250,000,000 Mexican Peso . . . . . . . . . . . . . . . . . . . . . . . . . . . . . . . . . . . . . BNY 3/2/16 (16,293,014) (14,567,983) 1,725,03190,000,000 Norwegian Krone . . . . . . . . . . . . . . . . . . . . . . . . . . . . . . . . . . NTC 10/19/15 (13,740,458) (10,547,684) 3,192,77480,000,000 Norwegian Krone . . . . . . . . . . . . . . . . . . . . . . . . . . . . . . . . . . BNY 11/13/15 (11,589,836) (9,371,886) 2,217,950
270,000,000 Norwegian Krone . . . . . . . . . . . . . . . . . . . . . . . . . . . . . . . . . . JPM 1/4/16 (35,964,036) (31,605,970) 4,358,06680,000,000 Norwegian Krone . . . . . . . . . . . . . . . . . . . . . . . . . . . . . . . . . . SSB 3/2/16 (10,483,326) (9,359,966) 1,123,36040,000,000 Singapore Dollar. . . . . . . . . . . . . . . . . . . . . . . . . . . . . . . . . . . SSB 12/21/15 (30,392,827) (28,054,366) 2,338,46135,000,000 Singapore Dollar. . . . . . . . . . . . . . . . . . . . . . . . . . . . . . . . . . . JPM 2/29/16 (25,605,384) (24,497,706) 1,107,67840,000,000 Singapore Dollar. . . . . . . . . . . . . . . . . . . . . . . . . . . . . . . . . . . JPM 4/22/16 (29,405,278) (27,958,488) 1,446,79040,000,000 Singapore Dollar. . . . . . . . . . . . . . . . . . . . . . . . . . . . . . . . . . . JPM 5/16/16 (29,779,631) (27,942,786) 1,836,84535,000,000 Singapore Dollar. . . . . . . . . . . . . . . . . . . . . . . . . . . . . . . . . . . SSB 5/26/16 (26,011,668) (24,444,217) 1,567,45153,000,000 Singapore Dollar. . . . . . . . . . . . . . . . . . . . . . . . . . . . . . . . . . . JPM 6/3/16 (38,919,078) (37,008,602) 1,910,47645,000,000 Singapore Dollar. . . . . . . . . . . . . . . . . . . . . . . . . . . . . . . . . . . BNY 7/7/16 (33,095,536) (31,397,402) 1,698,13433,000,000 Singapore Dollar. . . . . . . . . . . . . . . . . . . . . . . . . . . . . . . . . . . SSB 8/15/16 (23,661,681) (23,003,729) 657,95240,000,000 Singapore Dollar. . . . . . . . . . . . . . . . . . . . . . . . . . . . . . . . . . . SSB 9/16/16 (27,885,252) (27,862,425) 22,827
22,000,000,000 South Korean Won. . . . . . . . . . . . . . . . . . . . . . . . . . . . . . . . . JPM 10/19/15 (20,285,846) (18,547,323) 1,738,52340,000,000,000 South Korean Won. . . . . . . . . . . . . . . . . . . . . . . . . . . . . . . . . JPM 4/28/16 (36,712,404) (33,620,948) 3,091,45625,000,000,000 South Korean Won. . . . . . . . . . . . . . . . . . . . . . . . . . . . . . . . . JPM 5/26/16 (22,595,806) (21,012,543) 1,583,26325,000,000,000 South Korean Won. . . . . . . . . . . . . . . . . . . . . . . . . . . . . . . . . SSB 6/3/16 (22,359,360) (21,012,386) 1,346,97440,000,000,000 South Korean Won. . . . . . . . . . . . . . . . . . . . . . . . . . . . . . . . . SSB 8/16/16 (34,125,325) (33,617,494) 507,83140,000,000,000 South Korean Won. . . . . . . . . . . . . . . . . . . . . . . . . . . . . . . . . SSB 8/24/16 (33,571,129) (33,617,244) (46,115)
47,000,000 Swiss Franc. . . . . . . . . . . . . . . . . . . . . . . . . . . . . . . . . . . . . . . BNY 10/30/15 (49,581,720) (48,149,571) 1,432,149100,000,000 Swiss Franc. . . . . . . . . . . . . . . . . . . . . . . . . . . . . . . . . . . . . . . JPM 11/4/15 (106,178,529) (102,464,371) 3,714,158100,000,000 Swiss Franc. . . . . . . . . . . . . . . . . . . . . . . . . . . . . . . . . . . . . . . BNY 11/6/15 (106,284,609) (102,471,762) 3,812,84770,000,000 Swiss Franc. . . . . . . . . . . . . . . . . . . . . . . . . . . . . . . . . . . . . . . SSB 11/10/15 (73,356,039) (71,740,585) 1,615,45460,000,000 Swiss Franc. . . . . . . . . . . . . . . . . . . . . . . . . . . . . . . . . . . . . . . JPM 11/13/15 (62,557,018) (61,498,585) 1,058,43370,000,000 Swiss Franc. . . . . . . . . . . . . . . . . . . . . . . . . . . . . . . . . . . . . . . BNY 12/9/15 (72,478,774) (71,825,665) 653,10940,000,000 Swiss Franc. . . . . . . . . . . . . . . . . . . . . . . . . . . . . . . . . . . . . . . NTC 2/1/16 (46,843,893) (41,143,620) 5,700,27370,000,000 Swiss Franc. . . . . . . . . . . . . . . . . . . . . . . . . . . . . . . . . . . . . . . BNY 2/29/16 (75,585,790) (72,086,901) 3,498,88990,000,000 Swiss Franc. . . . . . . . . . . . . . . . . . . . . . . . . . . . . . . . . . . . . . . NTC 3/2/16 (96,153,846) (92,691,063) 3,462,78335,000,000 Swiss Franc. . . . . . . . . . . . . . . . . . . . . . . . . . . . . . . . . . . . . . . NTC 3/16/16 (35,576,337) (36,068,054) (491,717)30,000,000 Swiss Franc. . . . . . . . . . . . . . . . . . . . . . . . . . . . . . . . . . . . . . . JPM 4/13/16 (31,685,678) (30,955,242) 730,43620,000,000 Swiss Franc. . . . . . . . . . . . . . . . . . . . . . . . . . . . . . . . . . . . . . . SSB 4/22/16 (21,223,537) (20,645,801) 577,73620,000,000 Swiss Franc. . . . . . . . . . . . . . . . . . . . . . . . . . . . . . . . . . . . . . . NTC 6/3/16 (21,520,418) (20,687,778) 832,64035,000,000 Swiss Franc. . . . . . . . . . . . . . . . . . . . . . . . . . . . . . . . . . . . . . . BNY 8/15/16 (36,228,134) (36,332,193) (104,059)
500,000,000 Thailand Baht. . . . . . . . . . . . . . . . . . . . . . . . . . . . . . . . . . . . . SSB 2/12/16 (14,936,520) (13,711,591) 1,224,929340,000,000 Thailand Baht. . . . . . . . . . . . . . . . . . . . . . . . . . . . . . . . . . . . . JPM 5/11/16 (9,956,076) (9,301,450) 654,626850,000,000 Thailand Baht. . . . . . . . . . . . . . . . . . . . . . . . . . . . . . . . . . . . . BNY 5/31/16 (24,741,668) (23,241,791) 1,499,877
SEE NOTES TO FINANCIAL STATEMENTSII-6
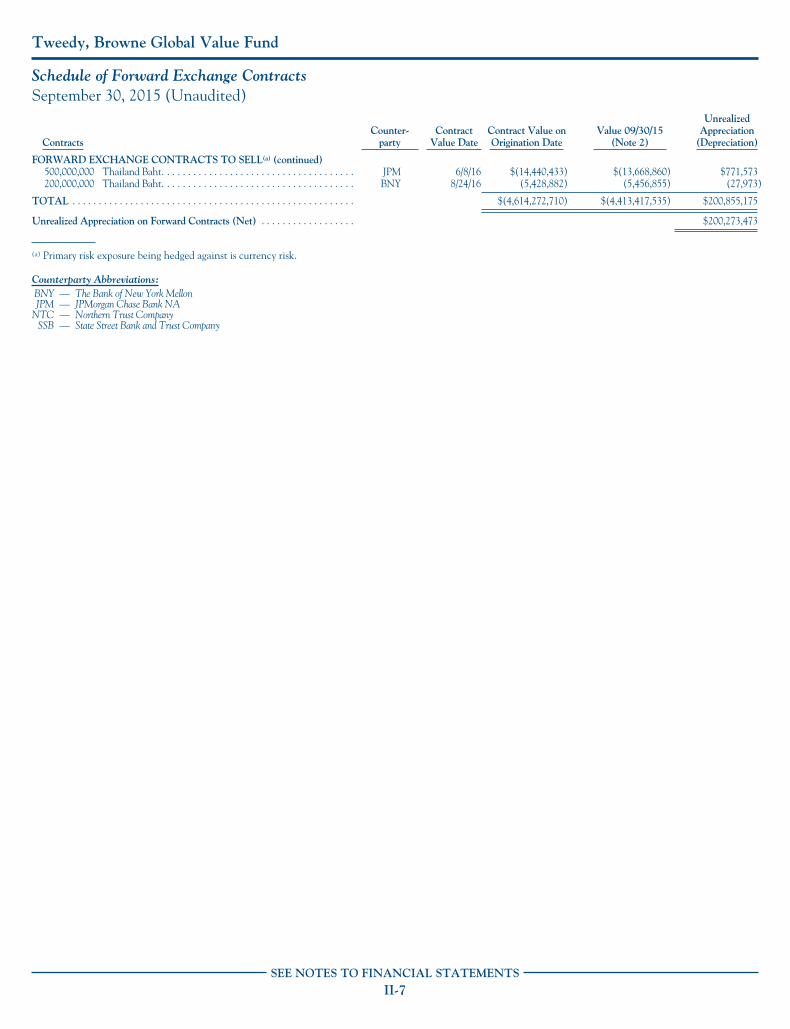
Tweedy, Browne Global Value Fund
Schedule of Forward Exchange ContractsSeptember 30, 2015 (Unaudited)
ContractsCounter-
partyContract
Value DateContract Value onOrigination Date
Value 09/30/15(Note 2)
UnrealizedAppreciation
(Depreciation)
FORWARD EXCHANGE CONTRACTS TO SELL(a) (continued)500,000,000 Thailand Baht. . . . . . . . . . . . . . . . . . . . . . . . . . . . . . . . . . . . . JPM 6/8/16 $(14,440,433) $(13,668,860) $771,573200,000,000 Thailand Baht. . . . . . . . . . . . . . . . . . . . . . . . . . . . . . . . . . . . . BNY 8/24/16 (5,428,882) (5,456,855) (27,973)
TOTAL . . . . . . . . . . . . . . . . . . . . . . . . . . . . . . . . . . . . . . . . . . . . . . . . . . . . . . $(4,614,272,710) $(4,413,417,535) $200,855,175
Unrealized Appreciation on Forward Contracts (Net) . . . . . . . . . . . . . . . . . . $200,273,473
(a) Primary risk exposure being hedged against is currency risk.
Counterparty Abbreviations:BNY — The Bank of New York MellonJPM — JPMorgan Chase Bank NA
NTC — Northern Trust CompanySSB — State Street Bank and Trust Company
SEE NOTES TO FINANCIAL STATEMENTSII-7
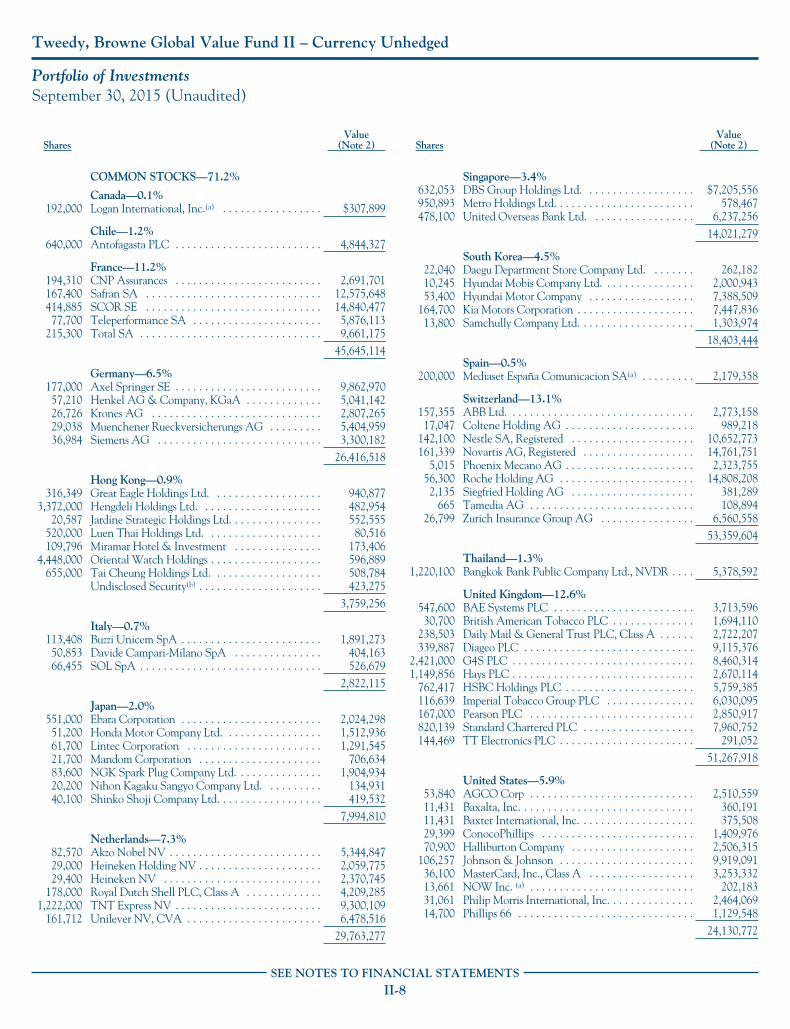
Tweedy, Browne Global Value Fund II – Currency Unhedged
Portfolio of InvestmentsSeptember 30, 2015 (Unaudited)
SharesValue
(Note 2)
COMMON STOCKS—71.2%
Canada—0.1%192,000 Logan International, Inc.(a) . . . . . . . . . . . . . . . . . $307,899
Chile—1.2%640,000 Antofagasta PLC . . . . . . . . . . . . . . . . . . . . . . . . . 4,844,327
France—11.2%194,310 CNP Assurances . . . . . . . . . . . . . . . . . . . . . . . . . 2,691,701167,400 Safran SA . . . . . . . . . . . . . . . . . . . . . . . . . . . . . . 12,575,648414,885 SCOR SE . . . . . . . . . . . . . . . . . . . . . . . . . . . . . . 14,840,47777,700 Teleperformance SA . . . . . . . . . . . . . . . . . . . . . . 5,876,113
215,300 Total SA . . . . . . . . . . . . . . . . . . . . . . . . . . . . . . . 9,661,17545,645,114
Germany—6.5%177,000 Axel Springer SE . . . . . . . . . . . . . . . . . . . . . . . . . 9,862,97057,210 Henkel AG & Company, KGaA . . . . . . . . . . . . . 5,041,14226,726 Krones AG . . . . . . . . . . . . . . . . . . . . . . . . . . . . . 2,807,26529,038 Muenchener Rueckversicherungs AG . . . . . . . . . 5,404,95936,984 Siemens AG . . . . . . . . . . . . . . . . . . . . . . . . . . . . 3,300,182
26,416,518
Hong Kong—0.9%316,349 Great Eagle Holdings Ltd. . . . . . . . . . . . . . . . . . . 940,877
3,372,000 Hengdeli Holdings Ltd. . . . . . . . . . . . . . . . . . . . . 482,95420,587 Jardine Strategic Holdings Ltd. . . . . . . . . . . . . . . . 552,555
520,000 Luen Thai Holdings Ltd. . . . . . . . . . . . . . . . . . . . 80,516109,796 Miramar Hotel & Investment . . . . . . . . . . . . . . . 173,406
4,448,000 Oriental Watch Holdings . . . . . . . . . . . . . . . . . . . 596,889655,000 Tai Cheung Holdings Ltd. . . . . . . . . . . . . . . . . . . 508,784
Undisclosed Security(b) . . . . . . . . . . . . . . . . . . . . . 423,2753,759,256
Italy—0.7%113,408 Buzzi Unicem SpA . . . . . . . . . . . . . . . . . . . . . . . . 1,891,27350,853 Davide Campari-Milano SpA . . . . . . . . . . . . . . . 404,16366,455 SOL SpA . . . . . . . . . . . . . . . . . . . . . . . . . . . . . . . 526,679
2,822,115
Japan—2.0%551,000 Ebara Corporation . . . . . . . . . . . . . . . . . . . . . . . . 2,024,29851,200 Honda Motor Company Ltd. . . . . . . . . . . . . . . . . 1,512,93661,700 Lintec Corporation . . . . . . . . . . . . . . . . . . . . . . . 1,291,54521,700 Mandom Corporation . . . . . . . . . . . . . . . . . . . . . 706,63483,600 NGK Spark Plug Company Ltd. . . . . . . . . . . . . . . 1,904,93420,200 Nihon Kagaku Sangyo Company Ltd. . . . . . . . . . 134,93140,100 Shinko Shoji Company Ltd. . . . . . . . . . . . . . . . . . 419,532
7,994,810
Netherlands—7.3%82,570 Akzo Nobel NV . . . . . . . . . . . . . . . . . . . . . . . . . . 5,344,84729,000 Heineken Holding NV . . . . . . . . . . . . . . . . . . . . . 2,059,77529,400 Heineken NV . . . . . . . . . . . . . . . . . . . . . . . . . . . 2,370,745
178,000 Royal Dutch Shell PLC, Class A . . . . . . . . . . . . . 4,209,2851,222,000 TNT Express NV . . . . . . . . . . . . . . . . . . . . . . . . . 9,300,109
161,712 Unilever NV, CVA . . . . . . . . . . . . . . . . . . . . . . . 6,478,51629,763,277
SharesValue
(Note 2)
Singapore—3.4%632,053 DBS Group Holdings Ltd. . . . . . . . . . . . . . . . . . . $7,205,556950,893 Metro Holdings Ltd. . . . . . . . . . . . . . . . . . . . . . . . 578,467478,100 United Overseas Bank Ltd. . . . . . . . . . . . . . . . . . 6,237,256
14,021,279
South Korea—4.5%22,040 Daegu Department Store Company Ltd. . . . . . . . 262,18210,245 Hyundai Mobis Company Ltd. . . . . . . . . . . . . . . . 2,000,94353,400 Hyundai Motor Company . . . . . . . . . . . . . . . . . . 7,388,509
164,700 Kia Motors Corporation . . . . . . . . . . . . . . . . . . . . 7,447,83613,800 Samchully Company Ltd. . . . . . . . . . . . . . . . . . . . 1,303,974
18,403,444
Spain—0.5%200,000 Mediaset España Comunicacion SA(a) . . . . . . . . . 2,179,358
Switzerland—13.1%157,355 ABB Ltd. . . . . . . . . . . . . . . . . . . . . . . . . . . . . . . . 2,773,15817,047 Coltene Holding AG . . . . . . . . . . . . . . . . . . . . . . 989,218
142,100 Nestle SA, Registered . . . . . . . . . . . . . . . . . . . . . 10,652,773161,339 Novartis AG, Registered . . . . . . . . . . . . . . . . . . . 14,761,751
5,015 Phoenix Mecano AG . . . . . . . . . . . . . . . . . . . . . . 2,323,75556,300 Roche Holding AG . . . . . . . . . . . . . . . . . . . . . . . 14,808,2082,135 Siegfried Holding AG . . . . . . . . . . . . . . . . . . . . . 381,289
665 Tamedia AG . . . . . . . . . . . . . . . . . . . . . . . . . . . . 108,89426,799 Zurich Insurance Group AG . . . . . . . . . . . . . . . . 6,560,558
53,359,604
Thailand—1.3%1,220,100 Bangkok Bank Public Company Ltd., NVDR . . . . 5,378,592
United Kingdom—12.6%547,600 BAE Systems PLC . . . . . . . . . . . . . . . . . . . . . . . . 3,713,59630,700 British American Tobacco PLC . . . . . . . . . . . . . . 1,694,110
238,503 Daily Mail & General Trust PLC, Class A . . . . . . 2,722,207339,887 Diageo PLC . . . . . . . . . . . . . . . . . . . . . . . . . . . . . 9,115,376
2,421,000 G4S PLC . . . . . . . . . . . . . . . . . . . . . . . . . . . . . . . 8,460,3141,149,856 Hays PLC . . . . . . . . . . . . . . . . . . . . . . . . . . . . . . . 2,670,114
762,417 HSBC Holdings PLC . . . . . . . . . . . . . . . . . . . . . . 5,759,385116,639 Imperial Tobacco Group PLC . . . . . . . . . . . . . . . 6,030,095167,000 Pearson PLC . . . . . . . . . . . . . . . . . . . . . . . . . . . . 2,850,917820,139 Standard Chartered PLC . . . . . . . . . . . . . . . . . . . 7,960,752144,469 TT Electronics PLC . . . . . . . . . . . . . . . . . . . . . . . 291,052
51,267,918
United States—5.9%53,840 AGCO Corp . . . . . . . . . . . . . . . . . . . . . . . . . . . . 2,510,55911,431 Baxalta, Inc. . . . . . . . . . . . . . . . . . . . . . . . . . . . . . 360,19111,431 Baxter International, Inc. . . . . . . . . . . . . . . . . . . . 375,50829,399 ConocoPhillips . . . . . . . . . . . . . . . . . . . . . . . . . . 1,409,97670,900 Halliburton Company . . . . . . . . . . . . . . . . . . . . . 2,506,315
106,257 Johnson & Johnson . . . . . . . . . . . . . . . . . . . . . . . 9,919,09136,100 MasterCard, Inc., Class A . . . . . . . . . . . . . . . . . . 3,253,33213,661 NOW Inc. (a) . . . . . . . . . . . . . . . . . . . . . . . . . . . . 202,18331,061 Philip Morris International, Inc. . . . . . . . . . . . . . . 2,464,06914,700 Phillips 66 . . . . . . . . . . . . . . . . . . . . . . . . . . . . . . 1,129,548
24,130,772
SEE NOTES TO FINANCIAL STATEMENTSII-8
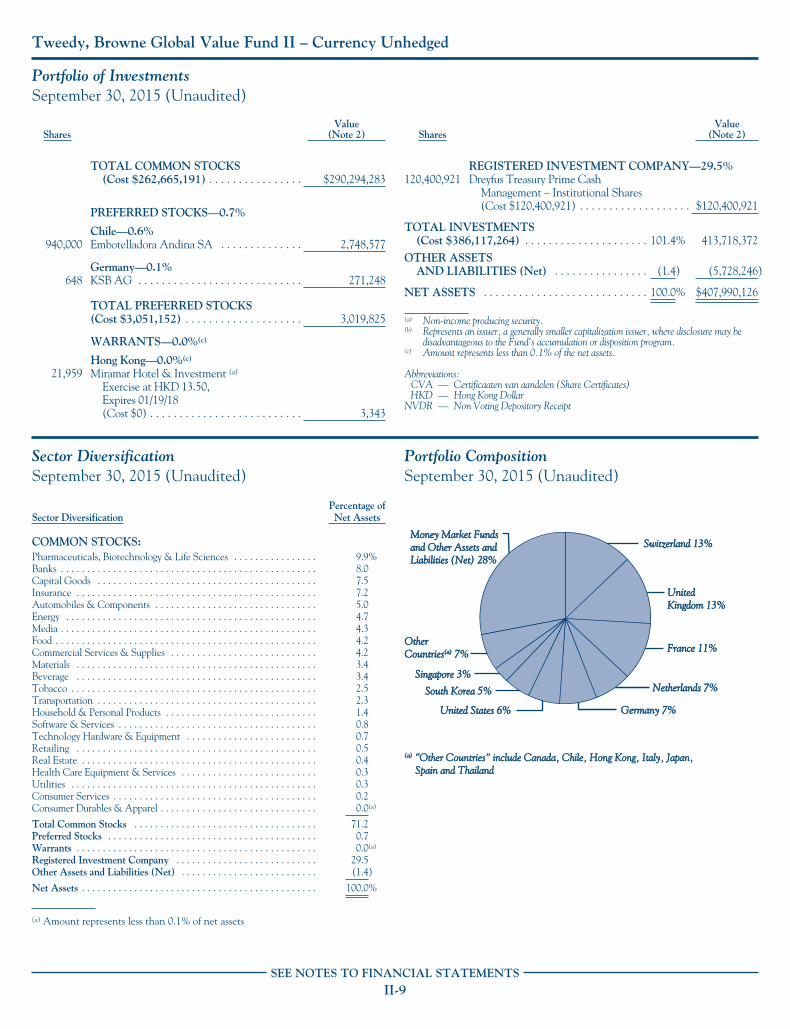
Tweedy, Browne Global Value Fund II – Currency Unhedged
Portfolio of InvestmentsSeptember 30, 2015 (Unaudited)
SharesValue
(Note 2)
TOTAL COMMON STOCKS(Cost $262,665,191) . . . . . . . . . . . . . . . . $290,294,283
PREFERRED STOCKS—0.7%
Chile—0.6%940,000 Embotelladora Andina SA . . . . . . . . . . . . . . 2,748,577
Germany—0.1%648 KSB AG . . . . . . . . . . . . . . . . . . . . . . . . . . . . 271,248
TOTAL PREFERRED STOCKS(Cost $3,051,152) . . . . . . . . . . . . . . . . . . . . 3,019,825
WARRANTS—0.0%(c)
Hong Kong—0.0%(c)
21,959 Miramar Hotel & Investment (a)
Exercise at HKD 13.50,Expires 01/19/18(Cost $0) . . . . . . . . . . . . . . . . . . . . . . . . . . 3,343
SharesValue
(Note 2)
REGISTERED INVESTMENT COMPANY—29.5%120,400,921 Dreyfus Treasury Prime Cash
Management – Institutional Shares(Cost $120,400,921) . . . . . . . . . . . . . . . . . . . $120,400,921
TOTAL INVESTMENTS(Cost $386,117,264) . . . . . . . . . . . . . . . . . . . . . 101.4% 413,718,372
OTHER ASSETSAND LIABILITIES (Net) . . . . . . . . . . . . . . . . (1.4) (5,728,246)
NET ASSETS . . . . . . . . . . . . . . . . . . . . . . . . . . . . 100.0% $407,990,126
(a) Non-income producing security.(b) Represents an issuer, a generally smaller capitalization issuer, where disclosure may be
disadvantageous to the Fund’s accumulation or disposition program.(c) Amount represents less than 0.1% of the net assets.
Abbreviations:CVA — Certificaaten van aandelen (Share Certificates)HKD — Hong Kong Dollar
NVDR — Non Voting Depository Receipt
Sector DiversificationSeptember 30, 2015 (Unaudited)
Sector DiversificationPercentage ofNet Assets
COMMON STOCKS:Pharmaceuticals, Biotechnology & Life Sciences . . . . . . . . . . . . . . . . 9.9%Banks . . . . . . . . . . . . . . . . . . . . . . . . . . . . . . . . . . . . . . . . . . . . . . . . . 8.0Capital Goods . . . . . . . . . . . . . . . . . . . . . . . . . . . . . . . . . . . . . . . . . . 7.5Insurance . . . . . . . . . . . . . . . . . . . . . . . . . . . . . . . . . . . . . . . . . . . . . . 7.2Automobiles & Components . . . . . . . . . . . . . . . . . . . . . . . . . . . . . . . 5.0Energy . . . . . . . . . . . . . . . . . . . . . . . . . . . . . . . . . . . . . . . . . . . . . . . . 4.7Media . . . . . . . . . . . . . . . . . . . . . . . . . . . . . . . . . . . . . . . . . . . . . . . . . 4.3Food . . . . . . . . . . . . . . . . . . . . . . . . . . . . . . . . . . . . . . . . . . . . . . . . . . 4.2Commercial Services & Supplies . . . . . . . . . . . . . . . . . . . . . . . . . . . . 4.2Materials . . . . . . . . . . . . . . . . . . . . . . . . . . . . . . . . . . . . . . . . . . . . . . 3.4Beverage . . . . . . . . . . . . . . . . . . . . . . . . . . . . . . . . . . . . . . . . . . . . . . 3.4Tobacco . . . . . . . . . . . . . . . . . . . . . . . . . . . . . . . . . . . . . . . . . . . . . . . 2.5Transportation . . . . . . . . . . . . . . . . . . . . . . . . . . . . . . . . . . . . . . . . . . 2.3Household & Personal Products . . . . . . . . . . . . . . . . . . . . . . . . . . . . . 1.4Software & Services . . . . . . . . . . . . . . . . . . . . . . . . . . . . . . . . . . . . . . 0.8Technology Hardware & Equipment . . . . . . . . . . . . . . . . . . . . . . . . . 0.7Retailing . . . . . . . . . . . . . . . . . . . . . . . . . . . . . . . . . . . . . . . . . . . . . . 0.5Real Estate . . . . . . . . . . . . . . . . . . . . . . . . . . . . . . . . . . . . . . . . . . . . . 0.4Health Care Equipment & Services . . . . . . . . . . . . . . . . . . . . . . . . . . 0.3Utilities . . . . . . . . . . . . . . . . . . . . . . . . . . . . . . . . . . . . . . . . . . . . . . . 0.3Consumer Services . . . . . . . . . . . . . . . . . . . . . . . . . . . . . . . . . . . . . . . 0.2Consumer Durables & Apparel . . . . . . . . . . . . . . . . . . . . . . . . . . . . . . 0.0(a)
Total Common Stocks . . . . . . . . . . . . . . . . . . . . . . . . . . . . . . . . . . . 71.2Preferred Stocks . . . . . . . . . . . . . . . . . . . . . . . . . . . . . . . . . . . . . . . . 0.7Warrants . . . . . . . . . . . . . . . . . . . . . . . . . . . . . . . . . . . . . . . . . . . . . . 0.0(a)
Registered Investment Company . . . . . . . . . . . . . . . . . . . . . . . . . . . 29.5Other Assets and Liabilities (Net) . . . . . . . . . . . . . . . . . . . . . . . . . . (1.4)
Net Assets . . . . . . . . . . . . . . . . . . . . . . . . . . . . . . . . . . . . . . . . . . . . . 100.0%
(a) Amount represents less than 0.1% of net assets
Portfolio CompositionSeptember 30, 2015 (Unaudited)
(a)(a) "Other Countries" include Canada, Chile, Hong Kong, Italy, Japan,"Other Countries" include Canada, Chile, Hong Kong, Italy, Japan, Spain and ThailandSpain and Thailand
Money Market FundsMoney Market Fundsand Other Assets andand Other Assets andLiabilities (Net) 28%Liabilities (Net) 28%
France 11%France 11%
UnitedUnitedKingdom 13%Kingdom 13%
Switzerland 13%Switzerland 13%
South Korea 5%South Korea 5%
United States 6%United States 6%
Singapore 3%Singapore 3%
OtherOtherCountriesCountries(a)(a) 7% 7%
Netherlands 7%Netherlands 7%
Germany 7%Germany 7%
SEE NOTES TO FINANCIAL STATEMENTSII-9
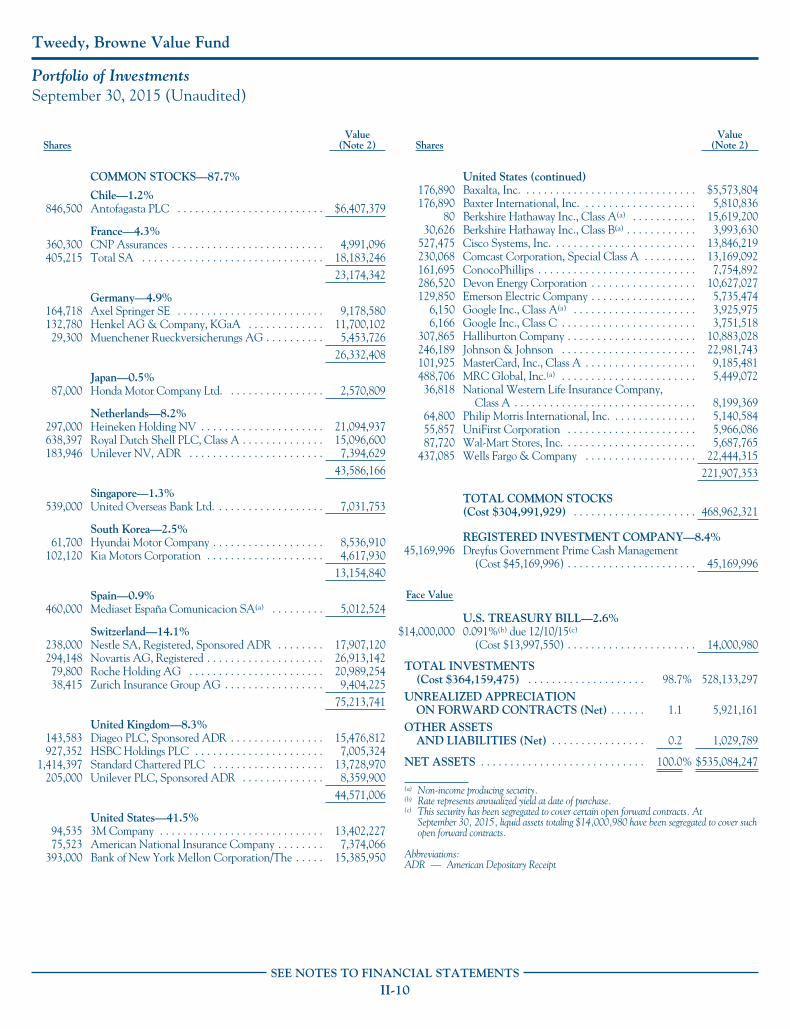
Tweedy, Browne Value Fund
Portfolio of InvestmentsSeptember 30, 2015 (Unaudited)
SharesValue
(Note 2)
COMMON STOCKS—87.7%
Chile—1.2%846,500 Antofagasta PLC . . . . . . . . . . . . . . . . . . . . . . . . . $6,407,379
France—4.3%360,300 CNP Assurances . . . . . . . . . . . . . . . . . . . . . . . . . . 4,991,096405,215 Total SA . . . . . . . . . . . . . . . . . . . . . . . . . . . . . . . 18,183,246
23,174,342
Germany—4.9%164,718 Axel Springer SE . . . . . . . . . . . . . . . . . . . . . . . . . 9,178,580132,780 Henkel AG & Company, KGaA . . . . . . . . . . . . . 11,700,10229,300 Muenchener Rueckversicherungs AG . . . . . . . . . . 5,453,726
26,332,408
Japan—0.5%87,000 Honda Motor Company Ltd. . . . . . . . . . . . . . . . . 2,570,809
Netherlands—8.2%297,000 Heineken Holding NV . . . . . . . . . . . . . . . . . . . . . 21,094,937638,397 Royal Dutch Shell PLC, Class A . . . . . . . . . . . . . . 15,096,600183,946 Unilever NV, ADR . . . . . . . . . . . . . . . . . . . . . . . 7,394,629
43,586,166
Singapore—1.3%539,000 United Overseas Bank Ltd. . . . . . . . . . . . . . . . . . . 7,031,753
South Korea—2.5%61,700 Hyundai Motor Company . . . . . . . . . . . . . . . . . . . 8,536,910
102,120 Kia Motors Corporation . . . . . . . . . . . . . . . . . . . . 4,617,93013,154,840
Spain—0.9%460,000 Mediaset España Comunicacion SA(a) . . . . . . . . . 5,012,524
Switzerland—14.1%238,000 Nestle SA, Registered, Sponsored ADR . . . . . . . . 17,907,120294,148 Novartis AG, Registered . . . . . . . . . . . . . . . . . . . . 26,913,14279,800 Roche Holding AG . . . . . . . . . . . . . . . . . . . . . . . 20,989,25438,415 Zurich Insurance Group AG . . . . . . . . . . . . . . . . . 9,404,225
75,213,741
United Kingdom—8.3%143,583 Diageo PLC, Sponsored ADR . . . . . . . . . . . . . . . . 15,476,812927,352 HSBC Holdings PLC . . . . . . . . . . . . . . . . . . . . . . 7,005,324
1,414,397 Standard Chartered PLC . . . . . . . . . . . . . . . . . . . 13,728,970205,000 Unilever PLC, Sponsored ADR . . . . . . . . . . . . . . 8,359,900
44,571,006
United States—41.5%94,535 3M Company . . . . . . . . . . . . . . . . . . . . . . . . . . . . 13,402,22775,523 American National Insurance Company . . . . . . . . 7,374,066
393,000 Bank of New York Mellon Corporation/The . . . . . 15,385,950
SharesValue
(Note 2)
United States (continued)176,890 Baxalta, Inc. . . . . . . . . . . . . . . . . . . . . . . . . . . . . . $5,573,804176,890 Baxter International, Inc. . . . . . . . . . . . . . . . . . . . 5,810,836
80 Berkshire Hathaway Inc., Class A(a) . . . . . . . . . . . 15,619,20030,626 Berkshire Hathaway Inc., Class B(a) . . . . . . . . . . . . 3,993,630
527,475 Cisco Systems, Inc. . . . . . . . . . . . . . . . . . . . . . . . . 13,846,219230,068 Comcast Corporation, Special Class A . . . . . . . . . 13,169,092161,695 ConocoPhillips . . . . . . . . . . . . . . . . . . . . . . . . . . . 7,754,892286,520 Devon Energy Corporation . . . . . . . . . . . . . . . . . . 10,627,027129,850 Emerson Electric Company . . . . . . . . . . . . . . . . . . 5,735,474
6,150 Google Inc., Class A(a) . . . . . . . . . . . . . . . . . . . . . 3,925,9756,166 Google Inc., Class C . . . . . . . . . . . . . . . . . . . . . . . 3,751,518
307,865 Halliburton Company . . . . . . . . . . . . . . . . . . . . . . 10,883,028246,189 Johnson & Johnson . . . . . . . . . . . . . . . . . . . . . . . 22,981,743101,925 MasterCard, Inc., Class A . . . . . . . . . . . . . . . . . . . 9,185,481488,706 MRC Global, Inc.(a) . . . . . . . . . . . . . . . . . . . . . . . 5,449,07236,818 National Western Life Insurance Company,
Class A . . . . . . . . . . . . . . . . . . . . . . . . . . . . . . . 8,199,36964,800 Philip Morris International, Inc. . . . . . . . . . . . . . . 5,140,58455,857 UniFirst Corporation . . . . . . . . . . . . . . . . . . . . . . 5,966,08687,720 Wal-Mart Stores, Inc. . . . . . . . . . . . . . . . . . . . . . . 5,687,765
437,085 Wells Fargo & Company . . . . . . . . . . . . . . . . . . . 22,444,315221,907,353
TOTAL COMMON STOCKS(Cost $304,991,929) . . . . . . . . . . . . . . . . . . . . . 468,962,321
REGISTERED INVESTMENT COMPANY—8.4%45,169,996 Dreyfus Government Prime Cash Management
(Cost $45,169,996) . . . . . . . . . . . . . . . . . . . . . . 45,169,996
Face Value
U.S. TREASURY BILL—2.6%$14,000,000 0.091%(b) due 12/10/15(c)
(Cost $13,997,550) . . . . . . . . . . . . . . . . . . . . . . 14,000,980
TOTAL INVESTMENTS(Cost $364,159,475) . . . . . . . . . . . . . . . . . . . . 98.7% 528,133,297
UNREALIZED APPRECIATIONON FORWARD CONTRACTS (Net) . . . . . . 1.1 5,921,161
OTHER ASSETSAND LIABILITIES (Net) . . . . . . . . . . . . . . . . 0.2 1,029,789
NET ASSETS . . . . . . . . . . . . . . . . . . . . . . . . . . . . 100.0% $535,084,247
(a) Non-income producing security.(b) Rate represents annualized yield at date of purchase.(c) This security has been segregated to cover certain open forward contracts. At
September 30, 2015, liquid assets totaling $14,000,980 have been segregated to cover suchopen forward contracts.
Abbreviations:ADR — American Depositary Receipt
SEE NOTES TO FINANCIAL STATEMENTSII-10
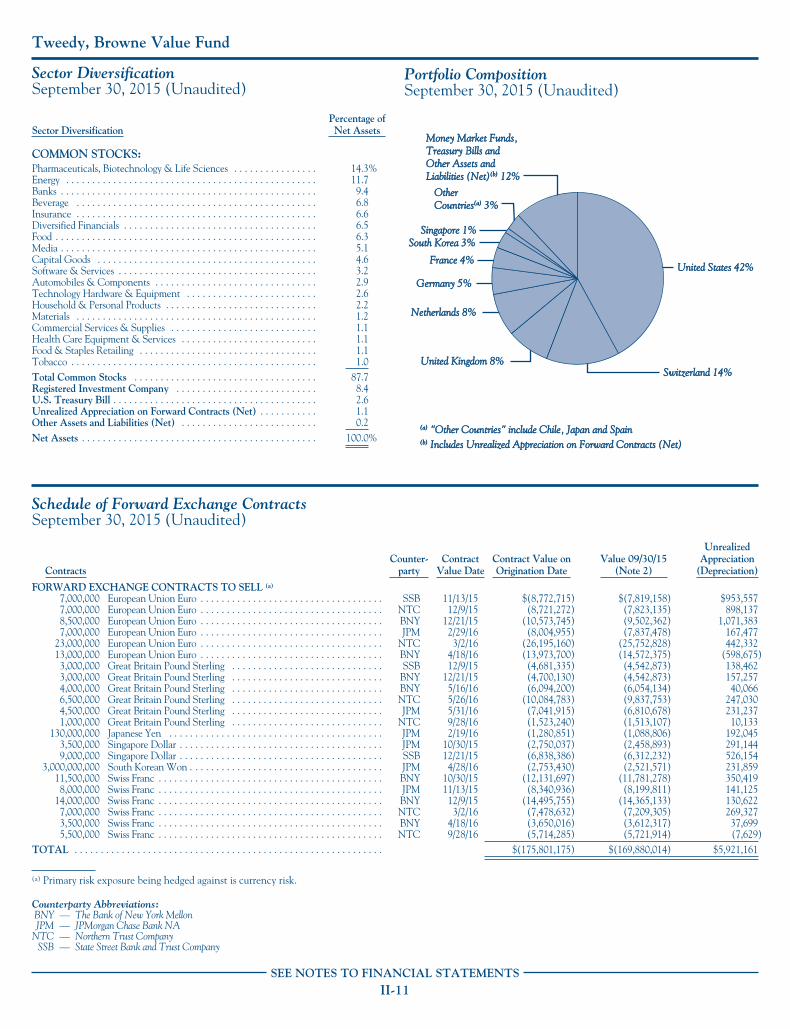
Tweedy, Browne Value Fund
Sector DiversificationSeptember 30, 2015 (Unaudited)
Sector DiversificationPercentage ofNet Assets
COMMON STOCKS:Pharmaceuticals, Biotechnology & Life Sciences . . . . . . . . . . . . . . . . 14.3%Energy . . . . . . . . . . . . . . . . . . . . . . . . . . . . . . . . . . . . . . . . . . . . . . . . 11.7Banks . . . . . . . . . . . . . . . . . . . . . . . . . . . . . . . . . . . . . . . . . . . . . . . . . 9.4Beverage . . . . . . . . . . . . . . . . . . . . . . . . . . . . . . . . . . . . . . . . . . . . . . 6.8Insurance . . . . . . . . . . . . . . . . . . . . . . . . . . . . . . . . . . . . . . . . . . . . . . 6.6Diversified Financials . . . . . . . . . . . . . . . . . . . . . . . . . . . . . . . . . . . . . 6.5Food . . . . . . . . . . . . . . . . . . . . . . . . . . . . . . . . . . . . . . . . . . . . . . . . . . 6.3Media . . . . . . . . . . . . . . . . . . . . . . . . . . . . . . . . . . . . . . . . . . . . . . . . . 5.1Capital Goods . . . . . . . . . . . . . . . . . . . . . . . . . . . . . . . . . . . . . . . . . . 4.6Software & Services . . . . . . . . . . . . . . . . . . . . . . . . . . . . . . . . . . . . . . 3.2Automobiles & Components . . . . . . . . . . . . . . . . . . . . . . . . . . . . . . . 2.9Technology Hardware & Equipment . . . . . . . . . . . . . . . . . . . . . . . . . 2.6Household & Personal Products . . . . . . . . . . . . . . . . . . . . . . . . . . . . . 2.2Materials . . . . . . . . . . . . . . . . . . . . . . . . . . . . . . . . . . . . . . . . . . . . . . 1.2Commercial Services & Supplies . . . . . . . . . . . . . . . . . . . . . . . . . . . . 1.1Health Care Equipment & Services . . . . . . . . . . . . . . . . . . . . . . . . . . 1.1Food & Staples Retailing . . . . . . . . . . . . . . . . . . . . . . . . . . . . . . . . . . 1.1Tobacco . . . . . . . . . . . . . . . . . . . . . . . . . . . . . . . . . . . . . . . . . . . . . . . 1.0Total Common Stocks . . . . . . . . . . . . . . . . . . . . . . . . . . . . . . . . . . . 87.7Registered Investment Company . . . . . . . . . . . . . . . . . . . . . . . . . . . 8.4U.S. Treasury Bill . . . . . . . . . . . . . . . . . . . . . . . . . . . . . . . . . . . . . . . 2.6Unrealized Appreciation on Forward Contracts (Net) . . . . . . . . . . . 1.1Other Assets and Liabilities (Net) . . . . . . . . . . . . . . . . . . . . . . . . . . 0.2Net Assets . . . . . . . . . . . . . . . . . . . . . . . . . . . . . . . . . . . . . . . . . . . . . 100.0%
Portfolio CompositionSeptember 30, 2015 (Unaudited)
South Korea 3%South Korea 3%
Money Market Funds,Money Market Funds,Treasury Bills andTreasury Bills andOther Assets andOther Assets andLiabilities (Net)Liabilities (Net)(b)(b) 12% 12%
United States 42%United States 42%France 4%France 4%
Switzerland 14%Switzerland 14%
OtherOtherCountriesCountries(a)(a) 3% 3%
Singapore 1%Singapore 1%
Netherlands 8%Netherlands 8%
United Kingdom 8%United Kingdom 8%
Germany 5%Germany 5%
(a)(a) "Other Countries" include Chile, Japan and Spain"Other Countries" include Chile, Japan and Spain(b)(b) Includes Unrealized Appreciation on Forward Contracts (Net)Includes Unrealized Appreciation on Forward Contracts (Net)
Schedule of Forward Exchange ContractsSeptember 30, 2015 (Unaudited)
ContractsCounter-
partyContract
Value DateContract Value onOrigination Date
Value 09/30/15(Note 2)
UnrealizedAppreciation
(Depreciation)
FORWARD EXCHANGE CONTRACTS TO SELL (a)
7,000,000 European Union Euro . . . . . . . . . . . . . . . . . . . . . . . . . . . . . . . . . . . SSB 11/13/15 $(8,772,715) $(7,819,158) $953,5577,000,000 European Union Euro . . . . . . . . . . . . . . . . . . . . . . . . . . . . . . . . . . . NTC 12/9/15 (8,721,272) (7,823,135) 898,1378,500,000 European Union Euro . . . . . . . . . . . . . . . . . . . . . . . . . . . . . . . . . . . BNY 12/21/15 (10,573,745) (9,502,362) 1,071,3837,000,000 European Union Euro . . . . . . . . . . . . . . . . . . . . . . . . . . . . . . . . . . . JPM 2/29/16 (8,004,955) (7,837,478) 167,477
23,000,000 European Union Euro . . . . . . . . . . . . . . . . . . . . . . . . . . . . . . . . . . . NTC 3/2/16 (26,195,160) (25,752,828) 442,33213,000,000 European Union Euro . . . . . . . . . . . . . . . . . . . . . . . . . . . . . . . . . . . BNY 4/18/16 (13,973,700) (14,572,375) (598,675)3,000,000 Great Britain Pound Sterling . . . . . . . . . . . . . . . . . . . . . . . . . . . . . SSB 12/9/15 (4,681,335) (4,542,873) 138,4623,000,000 Great Britain Pound Sterling . . . . . . . . . . . . . . . . . . . . . . . . . . . . . BNY 12/21/15 (4,700,130) (4,542,873) 157,2574,000,000 Great Britain Pound Sterling . . . . . . . . . . . . . . . . . . . . . . . . . . . . . BNY 5/16/16 (6,094,200) (6,054,134) 40,0666,500,000 Great Britain Pound Sterling . . . . . . . . . . . . . . . . . . . . . . . . . . . . . NTC 5/26/16 (10,084,783) (9,837,753) 247,0304,500,000 Great Britain Pound Sterling . . . . . . . . . . . . . . . . . . . . . . . . . . . . . JPM 5/31/16 (7,041,915) (6,810,678) 231,2371,000,000 Great Britain Pound Sterling . . . . . . . . . . . . . . . . . . . . . . . . . . . . . NTC 9/28/16 (1,523,240) (1,513,107) 10,133
130,000,000 Japanese Yen . . . . . . . . . . . . . . . . . . . . . . . . . . . . . . . . . . . . . . . . . JPM 2/19/16 (1,280,851) (1,088,806) 192,0453,500,000 Singapore Dollar . . . . . . . . . . . . . . . . . . . . . . . . . . . . . . . . . . . . . . . JPM 10/30/15 (2,750,037) (2,458,893) 291,1449,000,000 Singapore Dollar . . . . . . . . . . . . . . . . . . . . . . . . . . . . . . . . . . . . . . . SSB 12/21/15 (6,838,386) (6,312,232) 526,154
3,000,000,000 South Korean Won . . . . . . . . . . . . . . . . . . . . . . . . . . . . . . . . . . . . . JPM 4/28/16 (2,753,430) (2,521,571) 231,85911,500,000 Swiss Franc . . . . . . . . . . . . . . . . . . . . . . . . . . . . . . . . . . . . . . . . . . . BNY 10/30/15 (12,131,697) (11,781,278) 350,4198,000,000 Swiss Franc . . . . . . . . . . . . . . . . . . . . . . . . . . . . . . . . . . . . . . . . . . . JPM 11/13/15 (8,340,936) (8,199,811) 141,125
14,000,000 Swiss Franc . . . . . . . . . . . . . . . . . . . . . . . . . . . . . . . . . . . . . . . . . . . BNY 12/9/15 (14,495,755) (14,365,133) 130,6227,000,000 Swiss Franc . . . . . . . . . . . . . . . . . . . . . . . . . . . . . . . . . . . . . . . . . . . NTC 3/2/16 (7,478,632) (7,209,305) 269,3273,500,000 Swiss Franc . . . . . . . . . . . . . . . . . . . . . . . . . . . . . . . . . . . . . . . . . . . BNY 4/18/16 (3,650,016) (3,612,317) 37,6995,500,000 Swiss Franc . . . . . . . . . . . . . . . . . . . . . . . . . . . . . . . . . . . . . . . . . . . NTC 9/28/16 (5,714,285) (5,721,914) (7,629)
TOTAL . . . . . . . . . . . . . . . . . . . . . . . . . . . . . . . . . . . . . . . . . . . . . . . . . . . . . . . . . . . $(175,801,175) $(169,880,014) $5,921,161
(a) Primary risk exposure being hedged against is currency risk.
Counterparty Abbreviations:BNY — The Bank of New York MellonJPM — JPMorgan Chase Bank NA
NTC — Northern Trust CompanySSB — State Street Bank and Trust Company
SEE NOTES TO FINANCIAL STATEMENTSII-11
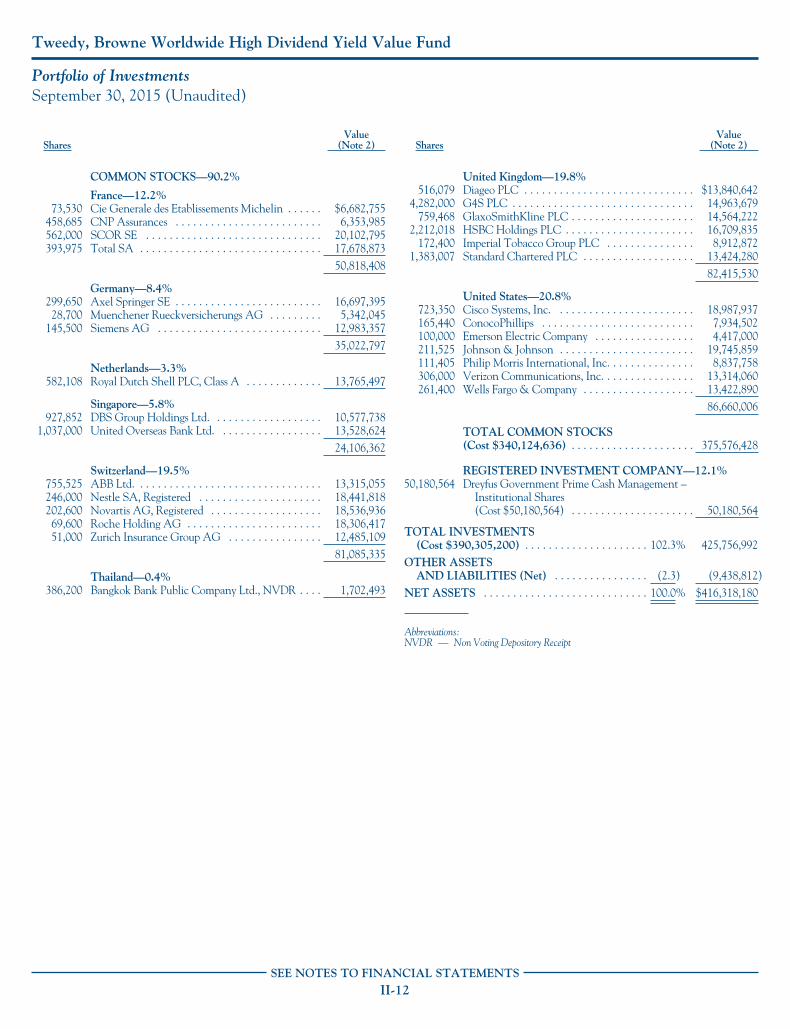
Tweedy, Browne Worldwide High Dividend Yield Value Fund
Portfolio of InvestmentsSeptember 30, 2015 (Unaudited)
SharesValue
(Note 2)
COMMON STOCKS—90.2%
France—12.2%73,530 Cie Generale des Etablissements Michelin . . . . . . $6,682,755
458,685 CNP Assurances . . . . . . . . . . . . . . . . . . . . . . . . . 6,353,985562,000 SCOR SE . . . . . . . . . . . . . . . . . . . . . . . . . . . . . . 20,102,795393,975 Total SA . . . . . . . . . . . . . . . . . . . . . . . . . . . . . . . 17,678,873
50,818,408
Germany—8.4%299,650 Axel Springer SE . . . . . . . . . . . . . . . . . . . . . . . . . 16,697,39528,700 Muenchener Rueckversicherungs AG . . . . . . . . . 5,342,045
145,500 Siemens AG . . . . . . . . . . . . . . . . . . . . . . . . . . . . 12,983,35735,022,797
Netherlands—3.3%582,108 Royal Dutch Shell PLC, Class A . . . . . . . . . . . . . 13,765,497
Singapore—5.8%927,852 DBS Group Holdings Ltd. . . . . . . . . . . . . . . . . . . 10,577,738
1,037,000 United Overseas Bank Ltd. . . . . . . . . . . . . . . . . . 13,528,62424,106,362
Switzerland—19.5%755,525 ABB Ltd. . . . . . . . . . . . . . . . . . . . . . . . . . . . . . . . 13,315,055246,000 Nestle SA, Registered . . . . . . . . . . . . . . . . . . . . . 18,441,818202,600 Novartis AG, Registered . . . . . . . . . . . . . . . . . . . 18,536,93669,600 Roche Holding AG . . . . . . . . . . . . . . . . . . . . . . . 18,306,41751,000 Zurich Insurance Group AG . . . . . . . . . . . . . . . . 12,485,109
81,085,335
Thailand—0.4%386,200 Bangkok Bank Public Company Ltd., NVDR . . . . 1,702,493
SharesValue
(Note 2)
United Kingdom—19.8%516,079 Diageo PLC . . . . . . . . . . . . . . . . . . . . . . . . . . . . . $13,840,642
4,282,000 G4S PLC . . . . . . . . . . . . . . . . . . . . . . . . . . . . . . . 14,963,679759,468 GlaxoSmithKline PLC . . . . . . . . . . . . . . . . . . . . . 14,564,222
2,212,018 HSBC Holdings PLC . . . . . . . . . . . . . . . . . . . . . . 16,709,835172,400 Imperial Tobacco Group PLC . . . . . . . . . . . . . . . 8,912,872
1,383,007 Standard Chartered PLC . . . . . . . . . . . . . . . . . . . 13,424,28082,415,530
United States—20.8%723,350 Cisco Systems, Inc. . . . . . . . . . . . . . . . . . . . . . . . 18,987,937165,440 ConocoPhillips . . . . . . . . . . . . . . . . . . . . . . . . . . 7,934,502100,000 Emerson Electric Company . . . . . . . . . . . . . . . . . 4,417,000211,525 Johnson & Johnson . . . . . . . . . . . . . . . . . . . . . . . 19,745,859111,405 Philip Morris International, Inc. . . . . . . . . . . . . . . 8,837,758306,000 Verizon Communications, Inc. . . . . . . . . . . . . . . . 13,314,060261,400 Wells Fargo & Company . . . . . . . . . . . . . . . . . . . 13,422,890
86,660,006
TOTAL COMMON STOCKS(Cost $340,124,636) . . . . . . . . . . . . . . . . . . . . . 375,576,428
REGISTERED INVESTMENT COMPANY—12.1%50,180,564 Dreyfus Government Prime Cash Management –
Institutional Shares(Cost $50,180,564) . . . . . . . . . . . . . . . . . . . . . 50,180,564
TOTAL INVESTMENTS(Cost $390,305,200) . . . . . . . . . . . . . . . . . . . . . 102.3% 425,756,992
OTHER ASSETSAND LIABILITIES (Net) . . . . . . . . . . . . . . . . (2.3) (9,438,812)
NET ASSETS . . . . . . . . . . . . . . . . . . . . . . . . . . . . 100.0% $416,318,180
Abbreviations:NVDR — Non Voting Depository Receipt
SEE NOTES TO FINANCIAL STATEMENTSII-12
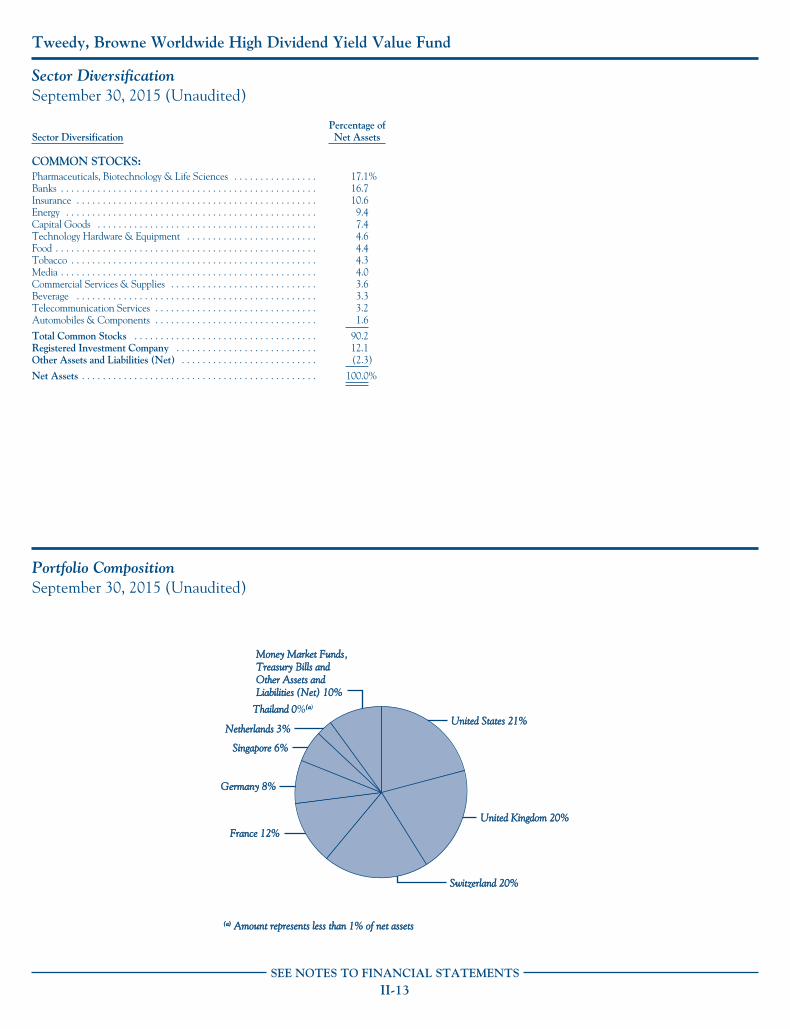
Tweedy, Browne Worldwide High Dividend Yield Value Fund
Sector DiversificationSeptember 30, 2015 (Unaudited)
Sector DiversificationPercentage ofNet Assets
COMMON STOCKS:Pharmaceuticals, Biotechnology & Life Sciences . . . . . . . . . . . . . . . . 17.1%Banks . . . . . . . . . . . . . . . . . . . . . . . . . . . . . . . . . . . . . . . . . . . . . . . . . 16.7Insurance . . . . . . . . . . . . . . . . . . . . . . . . . . . . . . . . . . . . . . . . . . . . . . 10.6Energy . . . . . . . . . . . . . . . . . . . . . . . . . . . . . . . . . . . . . . . . . . . . . . . . 9.4Capital Goods . . . . . . . . . . . . . . . . . . . . . . . . . . . . . . . . . . . . . . . . . . 7.4Technology Hardware & Equipment . . . . . . . . . . . . . . . . . . . . . . . . . 4.6Food . . . . . . . . . . . . . . . . . . . . . . . . . . . . . . . . . . . . . . . . . . . . . . . . . . 4.4Tobacco . . . . . . . . . . . . . . . . . . . . . . . . . . . . . . . . . . . . . . . . . . . . . . . 4.3Media . . . . . . . . . . . . . . . . . . . . . . . . . . . . . . . . . . . . . . . . . . . . . . . . . 4.0Commercial Services & Supplies . . . . . . . . . . . . . . . . . . . . . . . . . . . . 3.6Beverage . . . . . . . . . . . . . . . . . . . . . . . . . . . . . . . . . . . . . . . . . . . . . . 3.3Telecommunication Services . . . . . . . . . . . . . . . . . . . . . . . . . . . . . . . 3.2Automobiles & Components . . . . . . . . . . . . . . . . . . . . . . . . . . . . . . . 1.6
Total Common Stocks . . . . . . . . . . . . . . . . . . . . . . . . . . . . . . . . . . . 90.2Registered Investment Company . . . . . . . . . . . . . . . . . . . . . . . . . . . 12.1Other Assets and Liabilities (Net) . . . . . . . . . . . . . . . . . . . . . . . . . . (2.3)
Net Assets . . . . . . . . . . . . . . . . . . . . . . . . . . . . . . . . . . . . . . . . . . . . . 100.0%
Portfolio CompositionSeptember 30, 2015 (Unaudited)
Money Market Funds,Money Market Funds,Treasury Bills andTreasury Bills andOther Assets and Other Assets and Liabilities (Net) 10%Liabilities (Net) 10%
United Kingdom 20%United Kingdom 20%
United States 21%United States 21%
Switzerland 20%Switzerland 20%
Germany 8%Germany 8%
France 12%France 12%
Singapore 6%Singapore 6%
Netherlands 3%Netherlands 3%
Thailand 0Thailand 0%(a(a)
(a)(a) Amount represents less than 1% of net assetsAmount represents less than 1% of net assets
SEE NOTES TO FINANCIAL STATEMENTSII-13
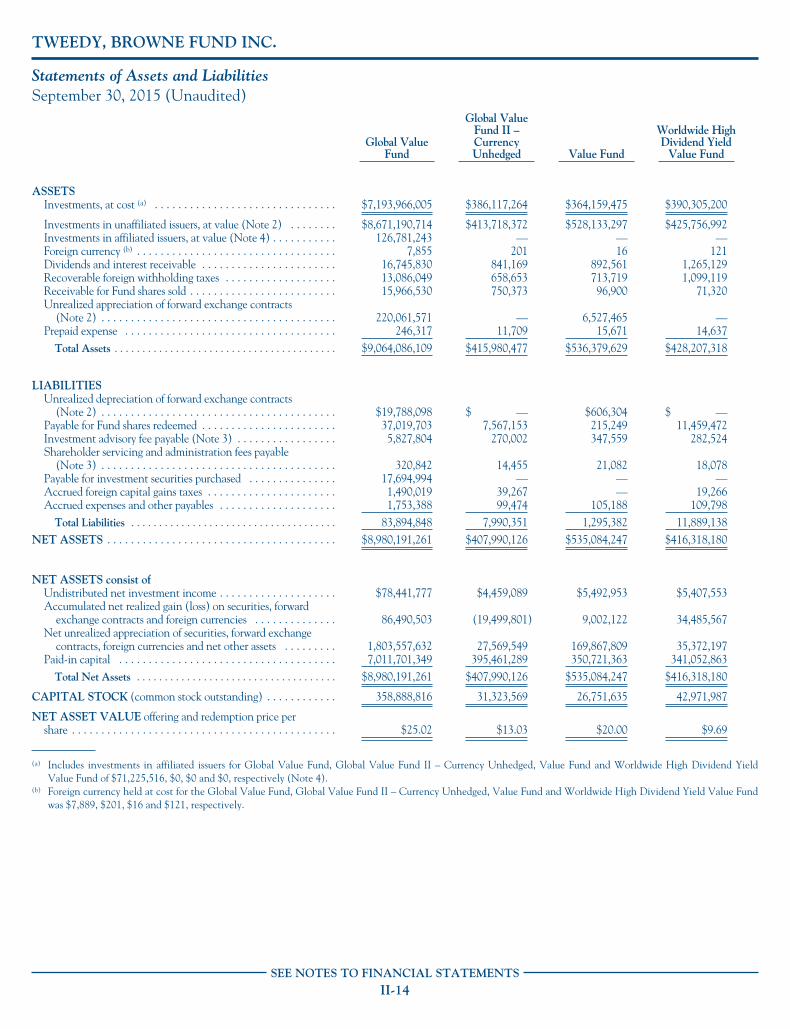
TWEEDY, BROWNE FUND INC.
Statements of Assets and LiabilitiesSeptember 30, 2015 (Unaudited)
Global ValueFund
Global ValueFund II –CurrencyUnhedged Value Fund
Worldwide HighDividend Yield
Value Fund
ASSETSInvestments, at cost (a) . . . . . . . . . . . . . . . . . . . . . . . . . . . . . . . $7,193,966,005 $386,117,264 $364,159,475 $390,305,200
Investments in unaffiliated issuers, at value (Note 2) . . . . . . . . $8,671,190,714 $413,718,372 $528,133,297 $425,756,992Investments in affiliated issuers, at value (Note 4) . . . . . . . . . . . 126,781,243 — — —Foreign currency (b) . . . . . . . . . . . . . . . . . . . . . . . . . . . . . . . . . . 7,855 201 16 121Dividends and interest receivable . . . . . . . . . . . . . . . . . . . . . . . 16,745,830 841,169 892,561 1,265,129Recoverable foreign withholding taxes . . . . . . . . . . . . . . . . . . . 13,086,049 658,653 713,719 1,099,119Receivable for Fund shares sold . . . . . . . . . . . . . . . . . . . . . . . . . 15,966,530 750,373 96,900 71,320Unrealized appreciation of forward exchange contracts
(Note 2) . . . . . . . . . . . . . . . . . . . . . . . . . . . . . . . . . . . . . . . . 220,061,571 — 6,527,465 —Prepaid expense . . . . . . . . . . . . . . . . . . . . . . . . . . . . . . . . . . . . 246,317 11,709 15,671 14,637
Total Assets . . . . . . . . . . . . . . . . . . . . . . . . . . . . . . . . . . . . . . . . $9,064,086,109 $415,980,477 $536,379,629 $428,207,318
LIABILITIESUnrealized depreciation of forward exchange contracts
(Note 2) . . . . . . . . . . . . . . . . . . . . . . . . . . . . . . . . . . . . . . . . $19,788,098 $ — $606,304 $ —Payable for Fund shares redeemed . . . . . . . . . . . . . . . . . . . . . . . 37,019,703 7,567,153 215,249 11,459,472Investment advisory fee payable (Note 3) . . . . . . . . . . . . . . . . . 5,827,804 270,002 347,559 282,524Shareholder servicing and administration fees payable
(Note 3) . . . . . . . . . . . . . . . . . . . . . . . . . . . . . . . . . . . . . . . . 320,842 14,455 21,082 18,078Payable for investment securities purchased . . . . . . . . . . . . . . . 17,694,994 — — —Accrued foreign capital gains taxes . . . . . . . . . . . . . . . . . . . . . . 1,490,019 39,267 — 19,266Accrued expenses and other payables . . . . . . . . . . . . . . . . . . . . 1,753,388 99,474 105,188 109,798
Total Liabilities . . . . . . . . . . . . . . . . . . . . . . . . . . . . . . . . . . . . . 83,894,848 7,990,351 1,295,382 11,889,138NET ASSETS . . . . . . . . . . . . . . . . . . . . . . . . . . . . . . . . . . . . . . . $8,980,191,261 $407,990,126 $535,084,247 $416,318,180
NET ASSETS consist ofUndistributed net investment income . . . . . . . . . . . . . . . . . . . . $78,441,777 $4,459,089 $5,492,953 $5,407,553Accumulated net realized gain (loss) on securities, forward
exchange contracts and foreign currencies . . . . . . . . . . . . . . 86,490,503 (19,499,801) 9,002,122 34,485,567Net unrealized appreciation of securities, forward exchange
contracts, foreign currencies and net other assets . . . . . . . . . 1,803,557,632 27,569,549 169,867,809 35,372,197Paid-in capital . . . . . . . . . . . . . . . . . . . . . . . . . . . . . . . . . . . . . 7,011,701,349 395,461,289 350,721,363 341,052,863
Total Net Assets . . . . . . . . . . . . . . . . . . . . . . . . . . . . . . . . . . . . $8,980,191,261 $407,990,126 $535,084,247 $416,318,180
CAPITAL STOCK (common stock outstanding) . . . . . . . . . . . . 358,888,816 31,323,569 26,751,635 42,971,987
NET ASSET VALUE offering and redemption price pershare . . . . . . . . . . . . . . . . . . . . . . . . . . . . . . . . . . . . . . . . . . . . . $25.02 $13.03 $20.00 $9.69
(a) Includes investments in affiliated issuers for Global Value Fund, Global Value Fund II – Currency Unhedged, Value Fund and Worldwide High Dividend YieldValue Fund of $71,225,516, $0, $0 and $0, respectively (Note 4).
(b) Foreign currency held at cost for the Global Value Fund, Global Value Fund II – Currency Unhedged, Value Fund and Worldwide High Dividend Yield Value Fundwas $7,889, $201, $16 and $121, respectively.
SEE NOTES TO FINANCIAL STATEMENTSII-14
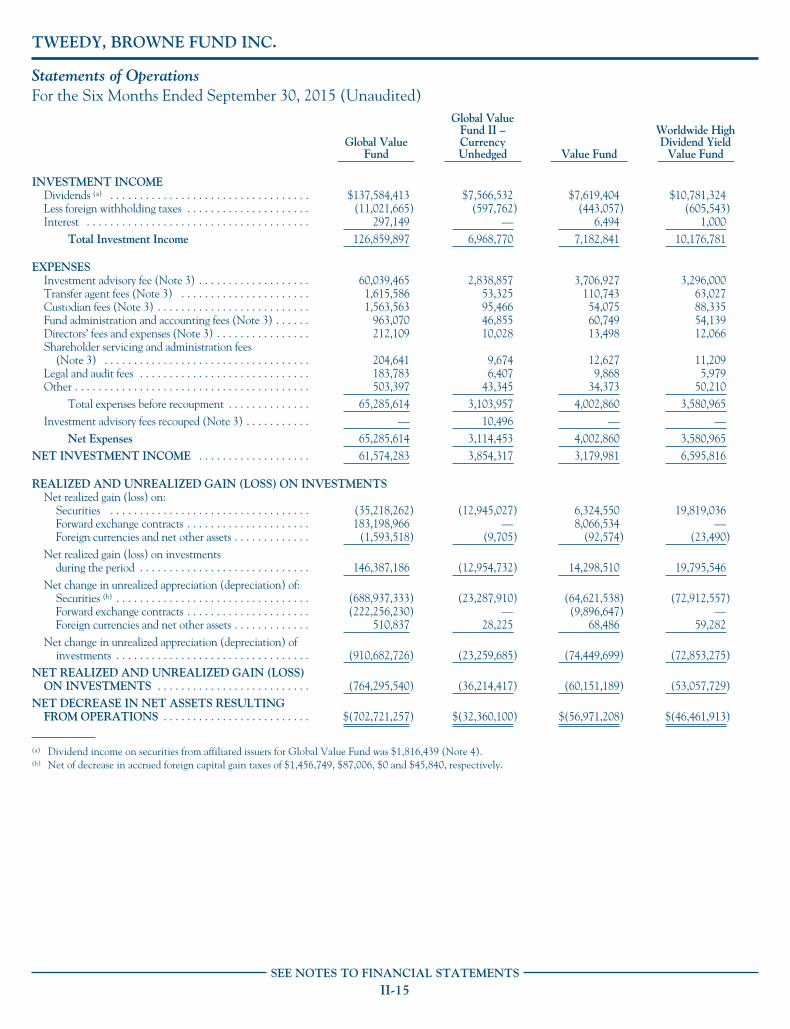
TWEEDY, BROWNE FUND INC.
Statements of OperationsFor the Six Months Ended September 30, 2015 (Unaudited)
Global ValueFund
Global ValueFund II –CurrencyUnhedged Value Fund
Worldwide HighDividend Yield
Value Fund
INVESTMENT INCOMEDividends (a) . . . . . . . . . . . . . . . . . . . . . . . . . . . . . . . . . . $137,584,413 $7,566,532 $7,619,404 $10,781,324Less foreign withholding taxes . . . . . . . . . . . . . . . . . . . . . (11,021,665) (597,762) (443,057) (605,543)Interest . . . . . . . . . . . . . . . . . . . . . . . . . . . . . . . . . . . . . . 297,149 — 6,494 1,000
Total Investment Income 126,859,897 6,968,770 7,182,841 10,176,781
EXPENSESInvestment advisory fee (Note 3) . . . . . . . . . . . . . . . . . . . 60,039,465 2,838,857 3,706,927 3,296,000Transfer agent fees (Note 3) . . . . . . . . . . . . . . . . . . . . . . 1,615,586 53,325 110,743 63,027Custodian fees (Note 3) . . . . . . . . . . . . . . . . . . . . . . . . . . 1,563,563 95,466 54,075 88,335Fund administration and accounting fees (Note 3) . . . . . . 963,070 46,855 60,749 54,139Directors’ fees and expenses (Note 3) . . . . . . . . . . . . . . . . 212,109 10,028 13,498 12,066Shareholder servicing and administration fees
(Note 3) . . . . . . . . . . . . . . . . . . . . . . . . . . . . . . . . . . . 204,641 9,674 12,627 11,209Legal and audit fees . . . . . . . . . . . . . . . . . . . . . . . . . . . . . 183,783 6,407 9,868 5,979Other . . . . . . . . . . . . . . . . . . . . . . . . . . . . . . . . . . . . . . . . 503,397 43,345 34,373 50,210
Total expenses before recoupment . . . . . . . . . . . . . . 65,285,614 3,103,957 4,002,860 3,580,965Investment advisory fees recouped (Note 3) . . . . . . . . . . . — 10,496 — —
Net Expenses 65,285,614 3,114,453 4,002,860 3,580,965NET INVESTMENT INCOME . . . . . . . . . . . . . . . . . . . 61,574,283 3,854,317 3,179,981 6,595,816
REALIZED AND UNREALIZED GAIN (LOSS) ON INVESTMENTSNet realized gain (loss) on:
Securities . . . . . . . . . . . . . . . . . . . . . . . . . . . . . . . . . . (35,218,262) (12,945,027) 6,324,550 19,819,036Forward exchange contracts . . . . . . . . . . . . . . . . . . . . . 183,198,966 — 8,066,534 —Foreign currencies and net other assets . . . . . . . . . . . . . (1,593,518) (9,705) (92,574) (23,490)
Net realized gain (loss) on investmentsduring the period . . . . . . . . . . . . . . . . . . . . . . . . . . . . . 146,387,186 (12,954,732) 14,298,510 19,795,546
Net change in unrealized appreciation (depreciation) of:Securities (b) . . . . . . . . . . . . . . . . . . . . . . . . . . . . . . . . . (688,937,333) (23,287,910) (64,621,538) (72,912,557)Forward exchange contracts . . . . . . . . . . . . . . . . . . . . . (222,256,230) — (9,896,647) —Foreign currencies and net other assets . . . . . . . . . . . . . 510,837 28,225 68,486 59,282
Net change in unrealized appreciation (depreciation) ofinvestments . . . . . . . . . . . . . . . . . . . . . . . . . . . . . . . . . (910,682,726) (23,259,685) (74,449,699) (72,853,275)
NET REALIZED AND UNREALIZED GAIN (LOSS)ON INVESTMENTS . . . . . . . . . . . . . . . . . . . . . . . . . . (764,295,540) (36,214,417) (60,151,189) (53,057,729)
NET DECREASE IN NET ASSETS RESULTINGFROM OPERATIONS . . . . . . . . . . . . . . . . . . . . . . . . . $(702,721,257) $(32,360,100) $(56,971,208) $(46,461,913)
(a) Dividend income on securities from affiliated issuers for Global Value Fund was $1,816,439 (Note 4).(b) Net of decrease in accrued foreign capital gain taxes of $1,456,749, $87,006, $0 and $45,840, respectively.
SEE NOTES TO FINANCIAL STATEMENTSII-15
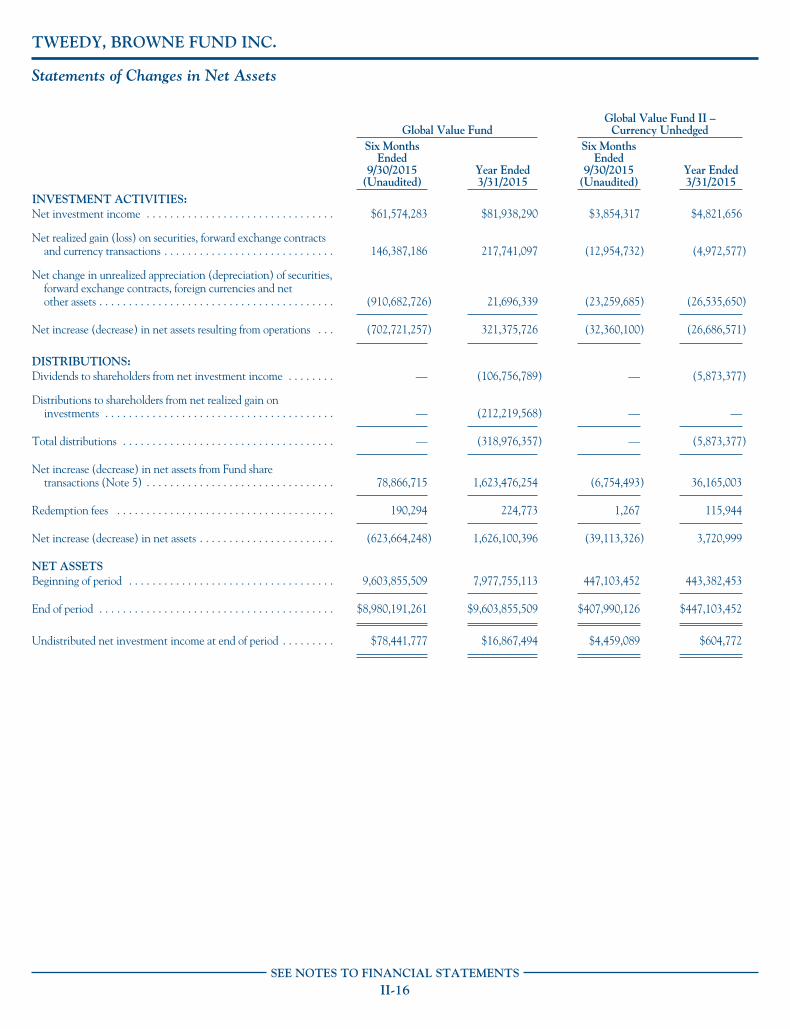
TWEEDY, BROWNE FUND INC.
Statements of Changes in Net Assets
Global Value FundGlobal Value Fund II –
Currency UnhedgedSix Months
Ended9/30/2015
(Unaudited)Year Ended3/31/2015
Six MonthsEnded
9/30/2015(Unaudited)
Year Ended3/31/2015
INVESTMENT ACTIVITIES:Net investment income . . . . . . . . . . . . . . . . . . . . . . . . . . . . . . . . $61,574,283 $81,938,290 $3,854,317 $4,821,656
Net realized gain (loss) on securities, forward exchange contractsand currency transactions . . . . . . . . . . . . . . . . . . . . . . . . . . . . . 146,387,186 217,741,097 (12,954,732) (4,972,577)
Net change in unrealized appreciation (depreciation) of securities,forward exchange contracts, foreign currencies and netother assets . . . . . . . . . . . . . . . . . . . . . . . . . . . . . . . . . . . . . . . . (910,682,726) 21,696,339 (23,259,685) (26,535,650)
Net increase (decrease) in net assets resulting from operations . . . (702,721,257) 321,375,726 (32,360,100) (26,686,571)
DISTRIBUTIONS:Dividends to shareholders from net investment income . . . . . . . . — (106,756,789) — (5,873,377)
Distributions to shareholders from net realized gain oninvestments . . . . . . . . . . . . . . . . . . . . . . . . . . . . . . . . . . . . . . . — (212,219,568) — —
Total distributions . . . . . . . . . . . . . . . . . . . . . . . . . . . . . . . . . . . . — (318,976,357) — (5,873,377)
Net increase (decrease) in net assets from Fund sharetransactions (Note 5) . . . . . . . . . . . . . . . . . . . . . . . . . . . . . . . . 78,866,715 1,623,476,254 (6,754,493) 36,165,003
Redemption fees . . . . . . . . . . . . . . . . . . . . . . . . . . . . . . . . . . . . . 190,294 224,773 1,267 115,944
Net increase (decrease) in net assets . . . . . . . . . . . . . . . . . . . . . . . (623,664,248) 1,626,100,396 (39,113,326) 3,720,999
NET ASSETSBeginning of period . . . . . . . . . . . . . . . . . . . . . . . . . . . . . . . . . . . 9,603,855,509 7,977,755,113 447,103,452 443,382,453
End of period . . . . . . . . . . . . . . . . . . . . . . . . . . . . . . . . . . . . . . . . $8,980,191,261 $9,603,855,509 $407,990,126 $447,103,452
Undistributed net investment income at end of period . . . . . . . . . $78,441,777 $16,867,494 $4,459,089 $604,772
SEE NOTES TO FINANCIAL STATEMENTSII-16
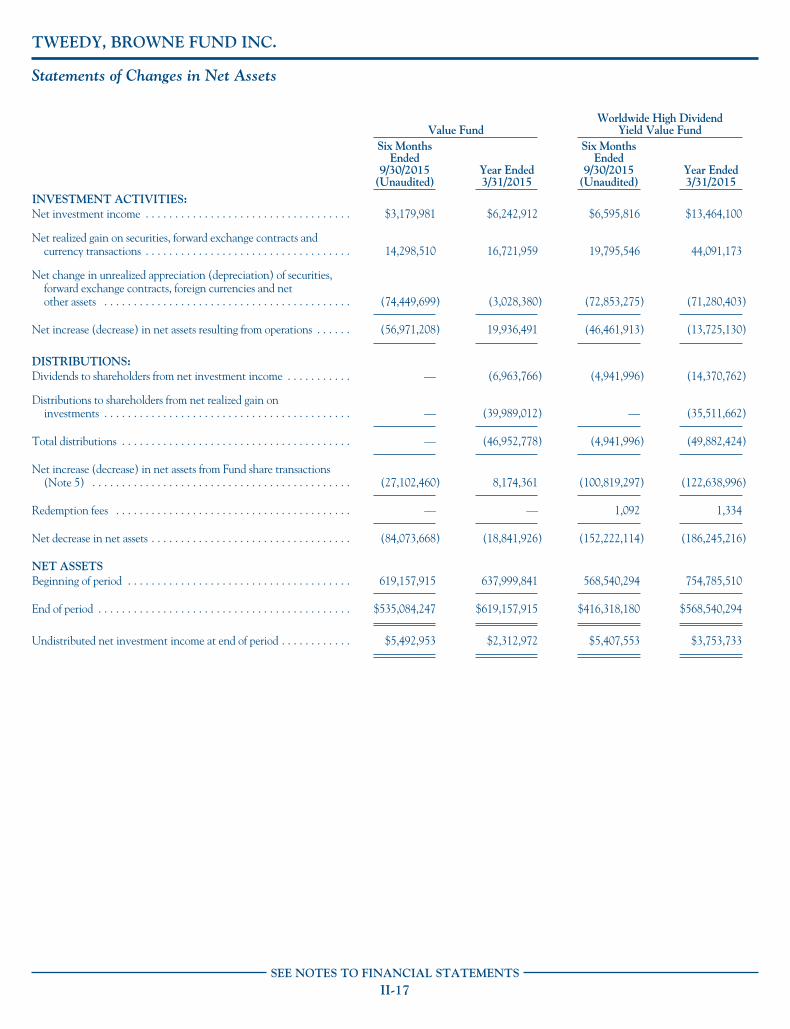
TWEEDY, BROWNE FUND INC.
Statements of Changes in Net Assets
Value FundWorldwide High Dividend
Yield Value FundSix Months
Ended9/30/2015
(Unaudited)Year Ended3/31/2015
Six MonthsEnded
9/30/2015(Unaudited)
Year Ended3/31/2015
INVESTMENT ACTIVITIES:Net investment income . . . . . . . . . . . . . . . . . . . . . . . . . . . . . . . . . . . $3,179,981 $6,242,912 $6,595,816 $13,464,100
Net realized gain on securities, forward exchange contracts andcurrency transactions . . . . . . . . . . . . . . . . . . . . . . . . . . . . . . . . . . . 14,298,510 16,721,959 19,795,546 44,091,173
Net change in unrealized appreciation (depreciation) of securities,forward exchange contracts, foreign currencies and netother assets . . . . . . . . . . . . . . . . . . . . . . . . . . . . . . . . . . . . . . . . . . (74,449,699) (3,028,380) (72,853,275) (71,280,403)
Net increase (decrease) in net assets resulting from operations . . . . . . (56,971,208) 19,936,491 (46,461,913) (13,725,130)
DISTRIBUTIONS:Dividends to shareholders from net investment income . . . . . . . . . . . — (6,963,766) (4,941,996) (14,370,762)
Distributions to shareholders from net realized gain oninvestments . . . . . . . . . . . . . . . . . . . . . . . . . . . . . . . . . . . . . . . . . . — (39,989,012) — (35,511,662)
Total distributions . . . . . . . . . . . . . . . . . . . . . . . . . . . . . . . . . . . . . . . — (46,952,778) (4,941,996) (49,882,424)
Net increase (decrease) in net assets from Fund share transactions(Note 5) . . . . . . . . . . . . . . . . . . . . . . . . . . . . . . . . . . . . . . . . . . . . (27,102,460) 8,174,361 (100,819,297) (122,638,996)
Redemption fees . . . . . . . . . . . . . . . . . . . . . . . . . . . . . . . . . . . . . . . . — — 1,092 1,334
Net decrease in net assets . . . . . . . . . . . . . . . . . . . . . . . . . . . . . . . . . . (84,073,668) (18,841,926) (152,222,114) (186,245,216)
NET ASSETSBeginning of period . . . . . . . . . . . . . . . . . . . . . . . . . . . . . . . . . . . . . . 619,157,915 637,999,841 568,540,294 754,785,510
End of period . . . . . . . . . . . . . . . . . . . . . . . . . . . . . . . . . . . . . . . . . . . $535,084,247 $619,157,915 $416,318,180 $568,540,294
Undistributed net investment income at end of period . . . . . . . . . . . . $5,492,953 $2,312,972 $5,407,553 $3,753,733
SEE NOTES TO FINANCIAL STATEMENTSII-17
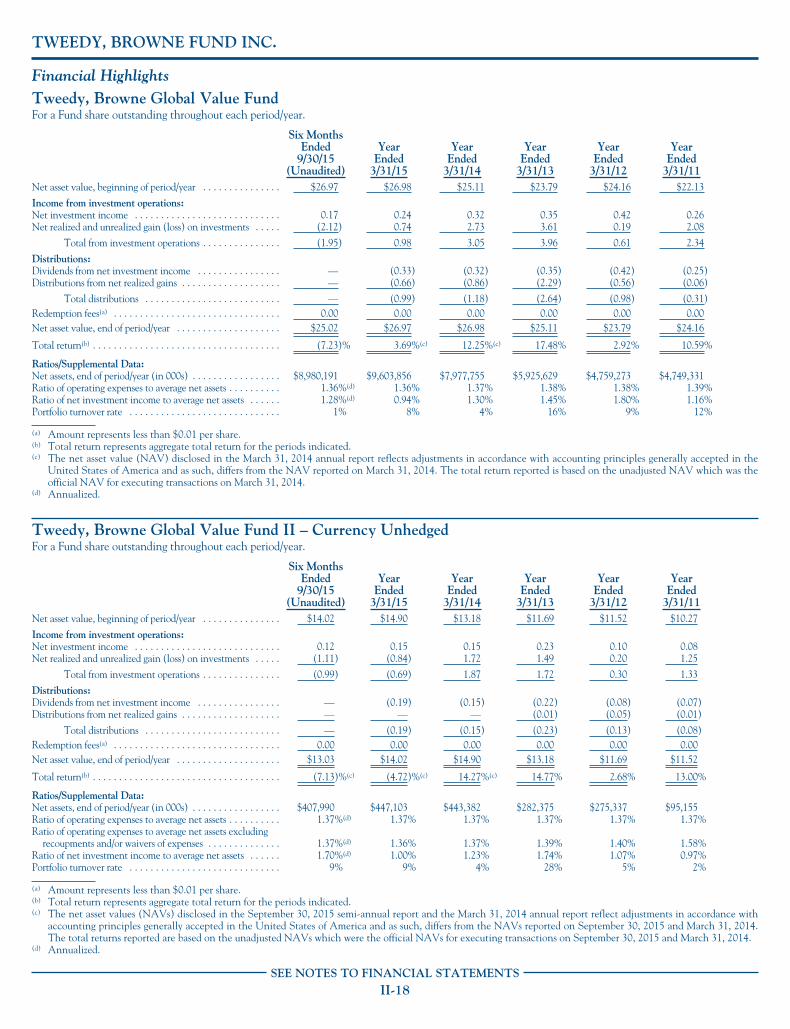
TWEEDY, BROWNE FUND INC.
Financial HighlightsTweedy, Browne Global Value FundFor a Fund share outstanding throughout each period/year.
Six MonthsEnded
9/30/15(Unaudited)
YearEnded
3/31/15
YearEnded
3/31/14
YearEnded
3/31/13
YearEnded
3/31/12
YearEnded
3/31/11Net asset value, beginning of period/year . . . . . . . . . . . . . . . $26.97 $26.98 $25.11 $23.79 $24.16 $22.13
Income from investment operations:Net investment income . . . . . . . . . . . . . . . . . . . . . . . . . . . . 0.17 0.24 0.32 0.35 0.42 0.26Net realized and unrealized gain (loss) on investments . . . . . (2.12) 0.74 2.73 3.61 0.19 2.08
Total from investment operations . . . . . . . . . . . . . . . (1.95) 0.98 3.05 3.96 0.61 2.34
Distributions:Dividends from net investment income . . . . . . . . . . . . . . . . — (0.33) (0.32) (0.35) (0.42) (0.25)Distributions from net realized gains . . . . . . . . . . . . . . . . . . . — (0.66) (0.86) (2.29) (0.56) (0.06)
Total distributions . . . . . . . . . . . . . . . . . . . . . . . . . . — (0.99) (1.18) (2.64) (0.98) (0.31)Redemption fees(a) . . . . . . . . . . . . . . . . . . . . . . . . . . . . . . . . 0.00 0.00 0.00 0.00 0.00 0.00Net asset value, end of period/year . . . . . . . . . . . . . . . . . . . . $25.02 $26.97 $26.98 $25.11 $23.79 $24.16
Total return(b) . . . . . . . . . . . . . . . . . . . . . . . . . . . . . . . . . . . . (7.23)% 3.69%(c) 12.25%(c) 17.48% 2.92% 10.59%
Ratios/Supplemental Data:Net assets, end of period/year (in 000s) . . . . . . . . . . . . . . . . . $8,980,191 $9,603,856 $7,977,755 $5,925,629 $4,759,273 $4,749,331Ratio of operating expenses to average net assets . . . . . . . . . . 1.36%(d) 1.36% 1.37% 1.38% 1.38% 1.39%Ratio of net investment income to average net assets . . . . . . 1.28%(d) 0.94% 1.30% 1.45% 1.80% 1.16%Portfolio turnover rate . . . . . . . . . . . . . . . . . . . . . . . . . . . . . 1% 8% 4% 16% 9% 12%
(a) Amount represents less than $0.01 per share.(b) Total return represents aggregate total return for the periods indicated.(c) The net asset value (NAV) disclosed in the March 31, 2014 annual report reflects adjustments in accordance with accounting principles generally accepted in the
United States of America and as such, differs from the NAV reported on March 31, 2014. The total return reported is based on the unadjusted NAV which was theofficial NAV for executing transactions on March 31, 2014.
(d) Annualized.
Tweedy, Browne Global Value Fund II – Currency UnhedgedFor a Fund share outstanding throughout each period/year.
Six MonthsEnded
9/30/15(Unaudited)
YearEnded
3/31/15
YearEnded
3/31/14
YearEnded
3/31/13
YearEnded
3/31/12
YearEnded
3/31/11Net asset value, beginning of period/year . . . . . . . . . . . . . . . $14.02 $14.90 $13.18 $11.69 $11.52 $10.27
Income from investment operations:Net investment income . . . . . . . . . . . . . . . . . . . . . . . . . . . . 0.12 0.15 0.15 0.23 0.10 0.08Net realized and unrealized gain (loss) on investments . . . . . (1.11) (0.84) 1.72 1.49 0.20 1.25
Total from investment operations . . . . . . . . . . . . . . . (0.99) (0.69) 1.87 1.72 0.30 1.33
Distributions:Dividends from net investment income . . . . . . . . . . . . . . . . — (0.19) (0.15) (0.22) (0.08) (0.07)Distributions from net realized gains . . . . . . . . . . . . . . . . . . . — — — (0.01) (0.05) (0.01)
Total distributions . . . . . . . . . . . . . . . . . . . . . . . . . . — (0.19) (0.15) (0.23) (0.13) (0.08)Redemption fees(a) . . . . . . . . . . . . . . . . . . . . . . . . . . . . . . . . 0.00 0.00 0.00 0.00 0.00 0.00Net asset value, end of period/year . . . . . . . . . . . . . . . . . . . . $13.03 $14.02 $14.90 $13.18 $11.69 $11.52
Total return(b) . . . . . . . . . . . . . . . . . . . . . . . . . . . . . . . . . . . . (7.13)%(c) (4.72)%(c) 14.27%(c) 14.77% 2.68% 13.00%
Ratios/Supplemental Data:Net assets, end of period/year (in 000s) . . . . . . . . . . . . . . . . . $407,990 $447,103 $443,382 $282,375 $275,337 $95,155Ratio of operating expenses to average net assets . . . . . . . . . . 1.37%(d) 1.37% 1.37% 1.37% 1.37% 1.37%Ratio of operating expenses to average net assets excluding
recoupments and/or waivers of expenses . . . . . . . . . . . . . . 1.37%(d) 1.36% 1.37% 1.39% 1.40% 1.58%Ratio of net investment income to average net assets . . . . . . 1.70%(d) 1.00% 1.23% 1.74% 1.07% 0.97%Portfolio turnover rate . . . . . . . . . . . . . . . . . . . . . . . . . . . . . 9% 9% 4% 28% 5% 2%
(a) Amount represents less than $0.01 per share.(b) Total return represents aggregate total return for the periods indicated.(c) The net asset values (NAVs) disclosed in the September 30, 2015 semi-annual report and the March 31, 2014 annual report reflect adjustments in accordance with
accounting principles generally accepted in the United States of America and as such, differs from the NAVs reported on September 30, 2015 and March 31, 2014.The total returns reported are based on the unadjusted NAVs which were the official NAVs for executing transactions on September 30, 2015 and March 31, 2014.
(d) Annualized.
SEE NOTES TO FINANCIAL STATEMENTSII-18
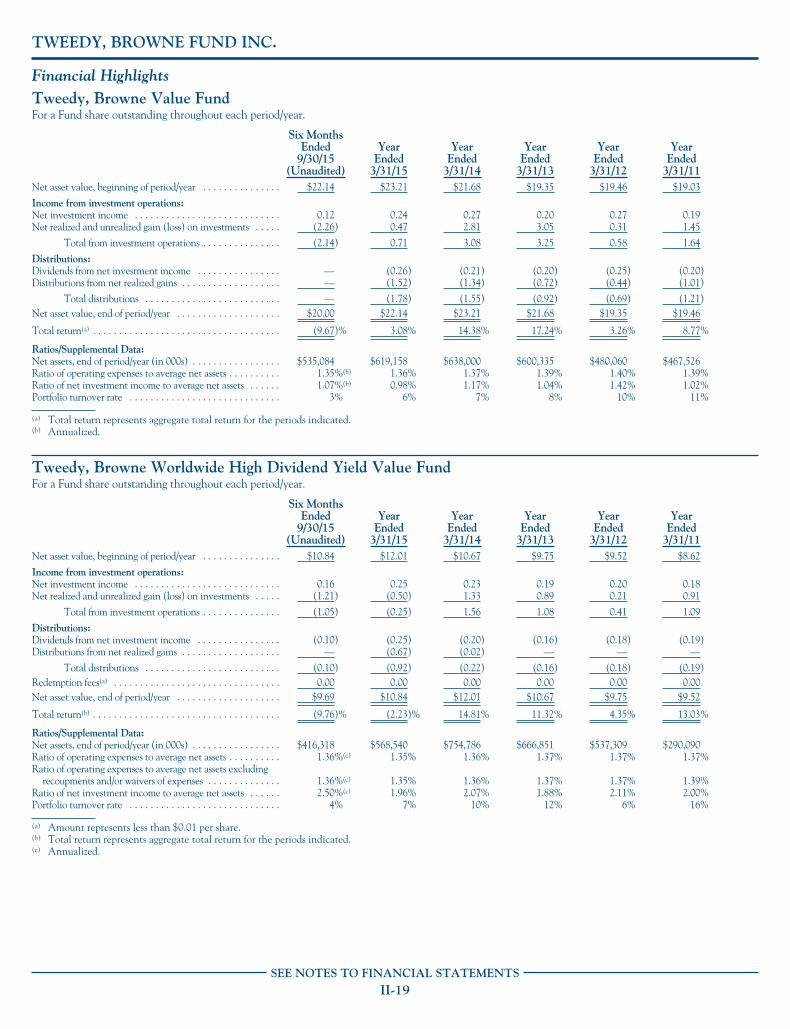
TWEEDY, BROWNE FUND INC.
Financial HighlightsTweedy, Browne Value FundFor a Fund share outstanding throughout each period/year.
Six MonthsEnded
9/30/15(Unaudited)
YearEnded
3/31/15
YearEnded
3/31/14
YearEnded
3/31/13
YearEnded
3/31/12
YearEnded
3/31/11Net asset value, beginning of period/year . . . . . . . . . . . . . . . $22.14 $23.21 $21.68 $19.35 $19.46 $19.03
Income from investment operations:Net investment income . . . . . . . . . . . . . . . . . . . . . . . . . . . . 0.12 0.24 0.27 0.20 0.27 0.19Net realized and unrealized gain (loss) on investments . . . . . (2.26) 0.47 2.81 3.05 0.31 1.45
Total from investment operations . . . . . . . . . . . . . . . (2.14) 0.71 3.08 3.25 0.58 1.64
Distributions:Dividends from net investment income . . . . . . . . . . . . . . . . — (0.26) (0.21) (0.20) (0.25) (0.20)Distributions from net realized gains . . . . . . . . . . . . . . . . . . . — (1.52) (1.34) (0.72) (0.44) (1.01)
Total distributions . . . . . . . . . . . . . . . . . . . . . . . . . . — (1.78) (1.55) (0.92) (0.69) (1.21)Net asset value, end of period/year . . . . . . . . . . . . . . . . . . . . $20.00 $22.14 $23.21 $21.68 $19.35 $19.46
Total return(a) . . . . . . . . . . . . . . . . . . . . . . . . . . . . . . . . . . . . (9.67)% 3.08% 14.38% 17.24% 3.26% 8.77%
Ratios/Supplemental Data:Net assets, end of period/year (in 000s) . . . . . . . . . . . . . . . . . $535,084 $619,158 $638,000 $600,335 $480,060 $467,526Ratio of operating expenses to average net assets . . . . . . . . . . 1.35%(b) 1.36% 1.37% 1.39% 1.40% 1.39%Ratio of net investment income to average net assets . . . . . . 1.07%(b) 0.98% 1.17% 1.04% 1.42% 1.02%Portfolio turnover rate . . . . . . . . . . . . . . . . . . . . . . . . . . . . . 3% 6% 7% 8% 10% 11%
(a) Total return represents aggregate total return for the periods indicated.(b) Annualized.
Tweedy, Browne Worldwide High Dividend Yield Value FundFor a Fund share outstanding throughout each period/year.
Six MonthsEnded
9/30/15(Unaudited)
YearEnded
3/31/15
YearEnded
3/31/14
YearEnded
3/31/13
YearEnded
3/31/12
YearEnded
3/31/11Net asset value, beginning of period/year . . . . . . . . . . . . . . . $10.84 $12.01 $10.67 $9.75 $9.52 $8.62
Income from investment operations:Net investment income . . . . . . . . . . . . . . . . . . . . . . . . . . . . 0.16 0.25 0.23 0.19 0.20 0.18Net realized and unrealized gain (loss) on investments . . . . . (1.21) (0.50) 1.33 0.89 0.21 0.91
Total from investment operations . . . . . . . . . . . . . . . (1.05) (0.25) 1.56 1.08 0.41 1.09
Distributions:Dividends from net investment income . . . . . . . . . . . . . . . . (0.10) (0.25) (0.20) (0.16) (0.18) (0.19)Distributions from net realized gains . . . . . . . . . . . . . . . . . . . — (0.67) (0.02) — — —
Total distributions . . . . . . . . . . . . . . . . . . . . . . . . . . (0.10) (0.92) (0.22) (0.16) (0.18) (0.19)Redemption fees(a) . . . . . . . . . . . . . . . . . . . . . . . . . . . . . . . . 0.00 0.00 0.00 0.00 0.00 0.00Net asset value, end of period/year . . . . . . . . . . . . . . . . . . . . $9.69 $10.84 $12.01 $10.67 $9.75 $9.52
Total return(b) . . . . . . . . . . . . . . . . . . . . . . . . . . . . . . . . . . . . (9.76)% (2.23)% 14.81% 11.32% 4.35% 13.03%
Ratios/Supplemental Data:Net assets, end of period/year (in 000s) . . . . . . . . . . . . . . . . . $416,318 $568,540 $754,786 $666,851 $537,309 $290,090Ratio of operating expenses to average net assets . . . . . . . . . . 1.36%(c) 1.35% 1.36% 1.37% 1.37% 1.37%Ratio of operating expenses to average net assets excluding
recoupments and/or waivers of expenses . . . . . . . . . . . . . . 1.36%(c) 1.35% 1.36% 1.37% 1.37% 1.39%Ratio of net investment income to average net assets . . . . . . 2.50%(c) 1.96% 2.07% 1.88% 2.11% 2.00%Portfolio turnover rate . . . . . . . . . . . . . . . . . . . . . . . . . . . . . 4% 7% 10% 12% 6% 16%
(a) Amount represents less than $0.01 per share.(b) Total return represents aggregate total return for the periods indicated.(c) Annualized.
SEE NOTES TO FINANCIAL STATEMENTSII-19
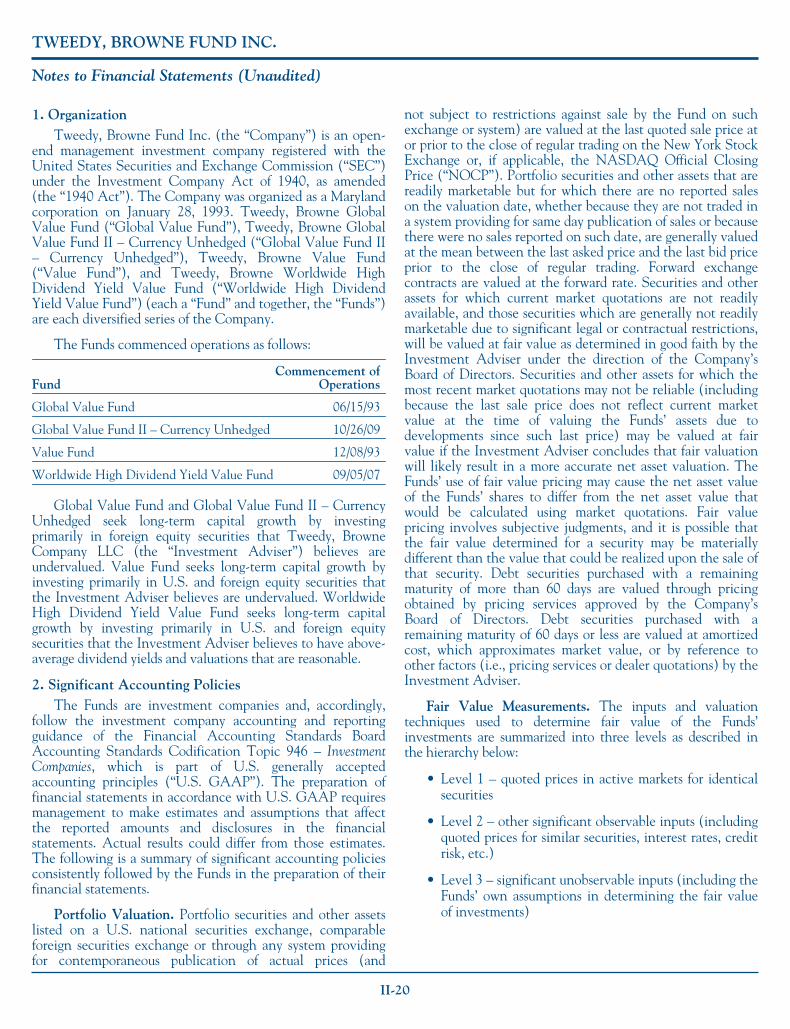
TWEEDY, BROWNE FUND INC.
Notes to Financial Statements (Unaudited)
1. OrganizationTweedy, Browne Fund Inc. (the “Company”) is an open-
end management investment company registered with theUnited States Securities and Exchange Commission (“SEC”)under the Investment Company Act of 1940, as amended(the “1940 Act”). The Company was organized as a Marylandcorporation on January 28, 1993. Tweedy, Browne GlobalValue Fund (“Global Value Fund”), Tweedy, Browne GlobalValue Fund II – Currency Unhedged (“Global Value Fund II– Currency Unhedged”), Tweedy, Browne Value Fund(“Value Fund”), and Tweedy, Browne Worldwide HighDividend Yield Value Fund (“Worldwide High DividendYield Value Fund”) (each a “Fund” and together, the “Funds”)are each diversified series of the Company.
The Funds commenced operations as follows:
FundCommencement of
Operations
Global Value Fund 06/15/93
Global Value Fund II – Currency Unhedged 10/26/09
Value Fund 12/08/93
Worldwide High Dividend Yield Value Fund 09/05/07
Global Value Fund and Global Value Fund II – CurrencyUnhedged seek long-term capital growth by investingprimarily in foreign equity securities that Tweedy, BrowneCompany LLC (the “Investment Adviser”) believes areundervalued. Value Fund seeks long-term capital growth byinvesting primarily in U.S. and foreign equity securities thatthe Investment Adviser believes are undervalued. WorldwideHigh Dividend Yield Value Fund seeks long-term capitalgrowth by investing primarily in U.S. and foreign equitysecurities that the Investment Adviser believes to have above-average dividend yields and valuations that are reasonable.
2. Significant Accounting PoliciesThe Funds are investment companies and, accordingly,
follow the investment company accounting and reportingguidance of the Financial Accounting Standards BoardAccounting Standards Codification Topic 946 – InvestmentCompanies, which is part of U.S. generally acceptedaccounting principles (“U.S. GAAP”). The preparation offinancial statements in accordance with U.S. GAAP requiresmanagement to make estimates and assumptions that affectthe reported amounts and disclosures in the financialstatements. Actual results could differ from those estimates.The following is a summary of significant accounting policiesconsistently followed by the Funds in the preparation of theirfinancial statements.
Portfolio Valuation. Portfolio securities and other assetslisted on a U.S. national securities exchange, comparableforeign securities exchange or through any system providingfor contemporaneous publication of actual prices (and
not subject to restrictions against sale by the Fund on suchexchange or system) are valued at the last quoted sale price ator prior to the close of regular trading on the New York StockExchange or, if applicable, the NASDAQ Official ClosingPrice (“NOCP”). Portfolio securities and other assets that arereadily marketable but for which there are no reported saleson the valuation date, whether because they are not traded ina system providing for same day publication of sales or becausethere were no sales reported on such date, are generally valuedat the mean between the last asked price and the last bid priceprior to the close of regular trading. Forward exchangecontracts are valued at the forward rate. Securities and otherassets for which current market quotations are not readilyavailable, and those securities which are generally not readilymarketable due to significant legal or contractual restrictions,will be valued at fair value as determined in good faith by theInvestment Adviser under the direction of the Company’sBoard of Directors. Securities and other assets for which themost recent market quotations may not be reliable (includingbecause the last sale price does not reflect current marketvalue at the time of valuing the Funds’ assets due todevelopments since such last price) may be valued at fairvalue if the Investment Adviser concludes that fair valuationwill likely result in a more accurate net asset valuation. TheFunds’ use of fair value pricing may cause the net asset valueof the Funds’ shares to differ from the net asset value thatwould be calculated using market quotations. Fair valuepricing involves subjective judgments, and it is possible thatthe fair value determined for a security may be materiallydifferent than the value that could be realized upon the sale ofthat security. Debt securities purchased with a remainingmaturity of more than 60 days are valued through pricingobtained by pricing services approved by the Company’sBoard of Directors. Debt securities purchased with aremaining maturity of 60 days or less are valued at amortizedcost, which approximates market value, or by reference toother factors (i.e., pricing services or dealer quotations) by theInvestment Adviser.
Fair Value Measurements. The inputs and valuationtechniques used to determine fair value of the Funds’investments are summarized into three levels as described inthe hierarchy below:
• Level 1 – quoted prices in active markets for identicalsecurities
• Level 2 – other significant observable inputs (includingquoted prices for similar securities, interest rates, creditrisk, etc.)
• Level 3 – significant unobservable inputs (including theFunds’ own assumptions in determining the fair valueof investments)
II-20
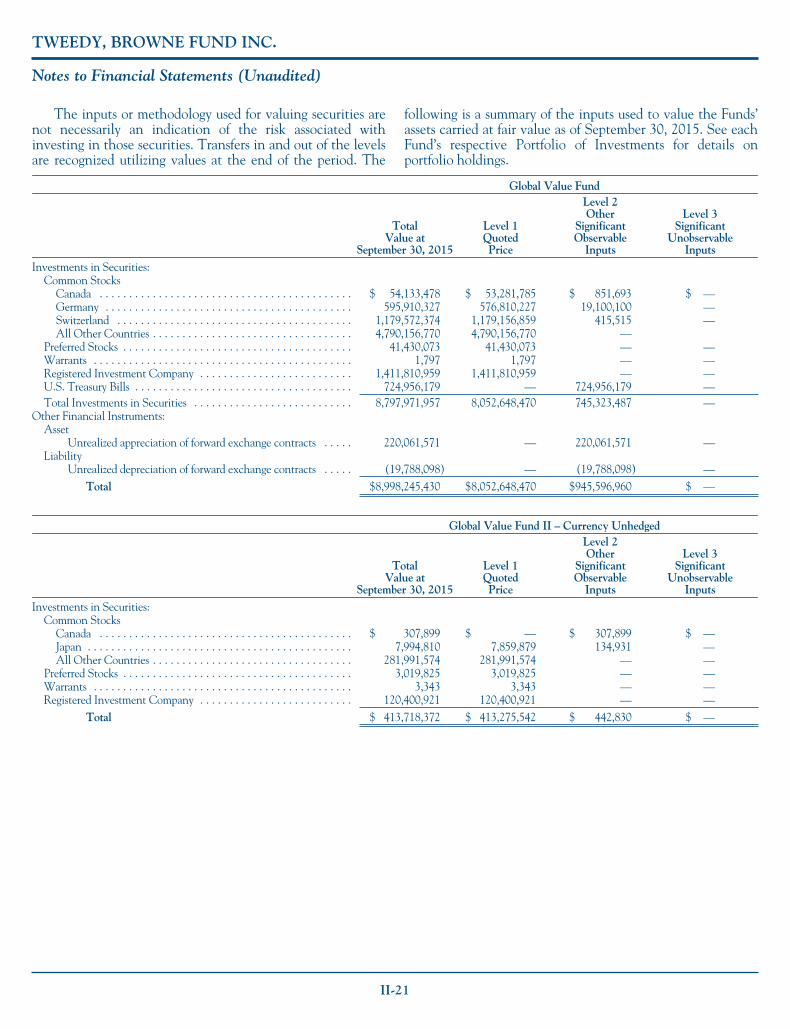
TWEEDY, BROWNE FUND INC.
Notes to Financial Statements (Unaudited)
The inputs or methodology used for valuing securities arenot necessarily an indication of the risk associated withinvesting in those securities. Transfers in and out of the levelsare recognized utilizing values at the end of the period. The
following is a summary of the inputs used to value the Funds’assets carried at fair value as of September 30, 2015. See eachFund’s respective Portfolio of Investments for details onportfolio holdings.
Global Value Fund
TotalValue at
September 30, 2015
Level 1QuotedPrice
Level 2Other
SignificantObservable
Inputs
Level 3Significant
UnobservableInputs
Investments in Securities:Common Stocks
Canada . . . . . . . . . . . . . . . . . . . . . . . . . . . . . . . . . . . . . . . . . . . $ 54,133,478 $ 53,281,785 $ 851,693 $ —Germany . . . . . . . . . . . . . . . . . . . . . . . . . . . . . . . . . . . . . . . . . . 595,910,327 576,810,227 19,100,100 —Switzerland . . . . . . . . . . . . . . . . . . . . . . . . . . . . . . . . . . . . . . . . 1,179,572,374 1,179,156,859 415,515 —All Other Countries . . . . . . . . . . . . . . . . . . . . . . . . . . . . . . . . . . 4,790,156,770 4,790,156,770 —
Preferred Stocks . . . . . . . . . . . . . . . . . . . . . . . . . . . . . . . . . . . . . . . 41,430,073 41,430,073 — —Warrants . . . . . . . . . . . . . . . . . . . . . . . . . . . . . . . . . . . . . . . . . . . . 1,797 1,797 — —Registered Investment Company . . . . . . . . . . . . . . . . . . . . . . . . . . 1,411,810,959 1,411,810,959 — —U.S. Treasury Bills . . . . . . . . . . . . . . . . . . . . . . . . . . . . . . . . . . . . . 724,956,179 — 724,956,179 —Total Investments in Securities . . . . . . . . . . . . . . . . . . . . . . . . . . . 8,797,971,957 8,052,648,470 745,323,487 —
Other Financial Instruments:Asset
Unrealized appreciation of forward exchange contracts . . . . . 220,061,571 — 220,061,571 —Liability
Unrealized depreciation of forward exchange contracts . . . . . (19,788,098) — (19,788,098) —Total $8,998,245,430 $8,052,648,470 $945,596,960 $ —
Global Value Fund II – Currency Unhedged
TotalValue at
September 30, 2015
Level 1QuotedPrice
Level 2Other
SignificantObservable
Inputs
Level 3Significant
UnobservableInputs
Investments in Securities:Common Stocks
Canada . . . . . . . . . . . . . . . . . . . . . . . . . . . . . . . . . . . . . . . . . . . $ 307,899 $ — $ 307,899 $ —Japan . . . . . . . . . . . . . . . . . . . . . . . . . . . . . . . . . . . . . . . . . . . . . 7,994,810 7,859,879 134,931 —All Other Countries . . . . . . . . . . . . . . . . . . . . . . . . . . . . . . . . . . 281,991,574 281,991,574 — —
Preferred Stocks . . . . . . . . . . . . . . . . . . . . . . . . . . . . . . . . . . . . . . . 3,019,825 3,019,825 — —Warrants . . . . . . . . . . . . . . . . . . . . . . . . . . . . . . . . . . . . . . . . . . . . 3,343 3,343 — —Registered Investment Company . . . . . . . . . . . . . . . . . . . . . . . . . . 120,400,921 120,400,921 — —
Total $ 413,718,372 $ 413,275,542 $ 442,830 $ —
II-21
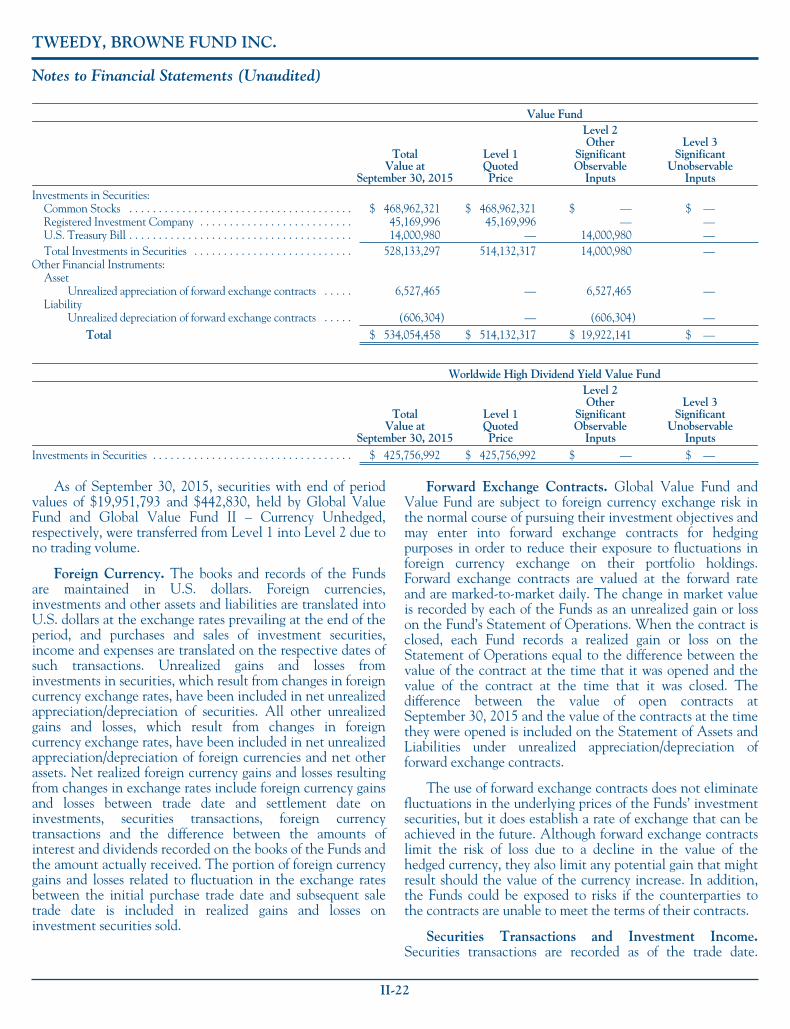
TWEEDY, BROWNE FUND INC.
Notes to Financial Statements (Unaudited)
Value Fund
TotalValue at
September 30, 2015
Level 1QuotedPrice
Level 2Other
SignificantObservable
Inputs
Level 3Significant
UnobservableInputs
Investments in Securities:Common Stocks . . . . . . . . . . . . . . . . . . . . . . . . . . . . . . . . . . . . . . $ 468,962,321 $ 468,962,321 $ — $ —Registered Investment Company . . . . . . . . . . . . . . . . . . . . . . . . . . 45,169,996 45,169,996 — —U.S. Treasury Bill . . . . . . . . . . . . . . . . . . . . . . . . . . . . . . . . . . . . . . 14,000,980 — 14,000,980 —Total Investments in Securities . . . . . . . . . . . . . . . . . . . . . . . . . . . 528,133,297 514,132,317 14,000,980 —
Other Financial Instruments:Asset
Unrealized appreciation of forward exchange contracts . . . . . 6,527,465 — 6,527,465 —Liability
Unrealized depreciation of forward exchange contracts . . . . . (606,304) — (606,304) —Total $ 534,054,458 $ 514,132,317 $ 19,922,141 $ —
Worldwide High Dividend Yield Value Fund
TotalValue at
September 30, 2015
Level 1QuotedPrice
Level 2Other
SignificantObservable
Inputs
Level 3Significant
UnobservableInputs
Investments in Securities . . . . . . . . . . . . . . . . . . . . . . . . . . . . . . . . . . $ 425,756,992 $ 425,756,992 $ — $ —
As of September 30, 2015, securities with end of periodvalues of $19,951,793 and $442,830, held by Global ValueFund and Global Value Fund II – Currency Unhedged,respectively, were transferred from Level 1 into Level 2 due tono trading volume.
Foreign Currency. The books and records of the Fundsare maintained in U.S. dollars. Foreign currencies,investments and other assets and liabilities are translated intoU.S. dollars at the exchange rates prevailing at the end of theperiod, and purchases and sales of investment securities,income and expenses are translated on the respective dates ofsuch transactions. Unrealized gains and losses frominvestments in securities, which result from changes in foreigncurrency exchange rates, have been included in net unrealizedappreciation/depreciation of securities. All other unrealizedgains and losses, which result from changes in foreigncurrency exchange rates, have been included in net unrealizedappreciation/depreciation of foreign currencies and net otherassets. Net realized foreign currency gains and losses resultingfrom changes in exchange rates include foreign currency gainsand losses between trade date and settlement date oninvestments, securities transactions, foreign currencytransactions and the difference between the amounts ofinterest and dividends recorded on the books of the Funds andthe amount actually received. The portion of foreign currencygains and losses related to fluctuation in the exchange ratesbetween the initial purchase trade date and subsequent saletrade date is included in realized gains and losses oninvestment securities sold.
Forward Exchange Contracts. Global Value Fund andValue Fund are subject to foreign currency exchange risk inthe normal course of pursuing their investment objectives andmay enter into forward exchange contracts for hedgingpurposes in order to reduce their exposure to fluctuations inforeign currency exchange on their portfolio holdings.Forward exchange contracts are valued at the forward rateand are marked-to-market daily. The change in market valueis recorded by each of the Funds as an unrealized gain or losson the Fund’s Statement of Operations. When the contract isclosed, each Fund records a realized gain or loss on theStatement of Operations equal to the difference between thevalue of the contract at the time that it was opened and thevalue of the contract at the time that it was closed. Thedifference between the value of open contracts atSeptember 30, 2015 and the value of the contracts at the timethey were opened is included on the Statement of Assets andLiabilities under unrealized appreciation/depreciation offorward exchange contracts.
The use of forward exchange contracts does not eliminatefluctuations in the underlying prices of the Funds’ investmentsecurities, but it does establish a rate of exchange that can beachieved in the future. Although forward exchange contractslimit the risk of loss due to a decline in the value of thehedged currency, they also limit any potential gain that mightresult should the value of the currency increase. In addition,the Funds could be exposed to risks if the counterparties tothe contracts are unable to meet the terms of their contracts.
Securities Transactions and Investment Income.Securities transactions are recorded as of the trade date.
II-22
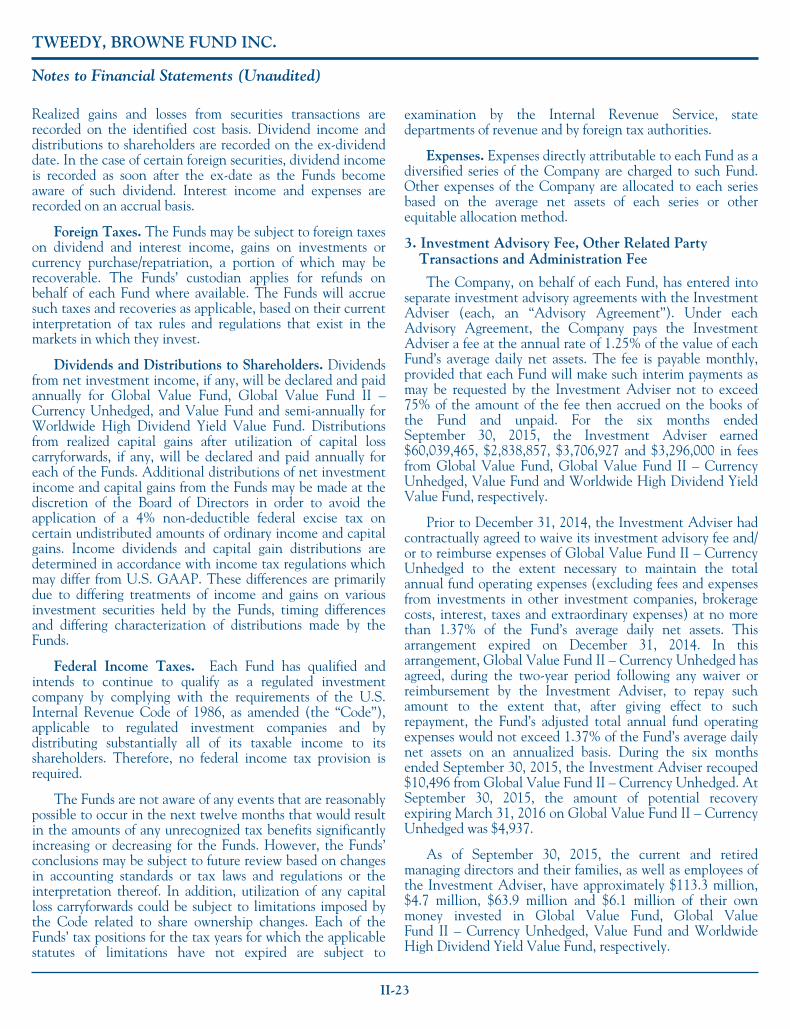
TWEEDY, BROWNE FUND INC.
Notes to Financial Statements (Unaudited)
Realized gains and losses from securities transactions arerecorded on the identified cost basis. Dividend income anddistributions to shareholders are recorded on the ex-dividenddate. In the case of certain foreign securities, dividend incomeis recorded as soon after the ex-date as the Funds becomeaware of such dividend. Interest income and expenses arerecorded on an accrual basis.
Foreign Taxes. The Funds may be subject to foreign taxeson dividend and interest income, gains on investments orcurrency purchase/repatriation, a portion of which may berecoverable. The Funds’ custodian applies for refunds onbehalf of each Fund where available. The Funds will accruesuch taxes and recoveries as applicable, based on their currentinterpretation of tax rules and regulations that exist in themarkets in which they invest.
Dividends and Distributions to Shareholders. Dividendsfrom net investment income, if any, will be declared and paidannually for Global Value Fund, Global Value Fund II –Currency Unhedged, and Value Fund and semi-annually forWorldwide High Dividend Yield Value Fund. Distributionsfrom realized capital gains after utilization of capital losscarryforwards, if any, will be declared and paid annually foreach of the Funds. Additional distributions of net investmentincome and capital gains from the Funds may be made at thediscretion of the Board of Directors in order to avoid theapplication of a 4% non-deductible federal excise tax oncertain undistributed amounts of ordinary income and capitalgains. Income dividends and capital gain distributions aredetermined in accordance with income tax regulations whichmay differ from U.S. GAAP. These differences are primarilydue to differing treatments of income and gains on variousinvestment securities held by the Funds, timing differencesand differing characterization of distributions made by theFunds.
Federal Income Taxes. Each Fund has qualified andintends to continue to qualify as a regulated investmentcompany by complying with the requirements of the U.S.Internal Revenue Code of 1986, as amended (the “Code”),applicable to regulated investment companies and bydistributing substantially all of its taxable income to itsshareholders. Therefore, no federal income tax provision isrequired.
The Funds are not aware of any events that are reasonablypossible to occur in the next twelve months that would resultin the amounts of any unrecognized tax benefits significantlyincreasing or decreasing for the Funds. However, the Funds’conclusions may be subject to future review based on changesin accounting standards or tax laws and regulations or theinterpretation thereof. In addition, utilization of any capitalloss carryforwards could be subject to limitations imposed bythe Code related to share ownership changes. Each of theFunds’ tax positions for the tax years for which the applicablestatutes of limitations have not expired are subject to
examination by the Internal Revenue Service, statedepartments of revenue and by foreign tax authorities.
Expenses. Expenses directly attributable to each Fund as adiversified series of the Company are charged to such Fund.Other expenses of the Company are allocated to each seriesbased on the average net assets of each series or otherequitable allocation method.
3. Investment Advisory Fee, Other Related PartyTransactions and Administration Fee
The Company, on behalf of each Fund, has entered intoseparate investment advisory agreements with the InvestmentAdviser (each, an “Advisory Agreement”). Under eachAdvisory Agreement, the Company pays the InvestmentAdviser a fee at the annual rate of 1.25% of the value of eachFund’s average daily net assets. The fee is payable monthly,provided that each Fund will make such interim payments asmay be requested by the Investment Adviser not to exceed75% of the amount of the fee then accrued on the books ofthe Fund and unpaid. For the six months endedSeptember 30, 2015, the Investment Adviser earned$60,039,465, $2,838,857, $3,706,927 and $3,296,000 in feesfrom Global Value Fund, Global Value Fund II – CurrencyUnhedged, Value Fund and Worldwide High Dividend YieldValue Fund, respectively.
Prior to December 31, 2014, the Investment Adviser hadcontractually agreed to waive its investment advisory fee and/or to reimburse expenses of Global Value Fund II – CurrencyUnhedged to the extent necessary to maintain the totalannual fund operating expenses (excluding fees and expensesfrom investments in other investment companies, brokeragecosts, interest, taxes and extraordinary expenses) at no morethan 1.37% of the Fund’s average daily net assets. Thisarrangement expired on December 31, 2014. In thisarrangement, Global Value Fund II – Currency Unhedged hasagreed, during the two-year period following any waiver orreimbursement by the Investment Adviser, to repay suchamount to the extent that, after giving effect to suchrepayment, the Fund’s adjusted total annual fund operatingexpenses would not exceed 1.37% of the Fund’s average dailynet assets on an annualized basis. During the six monthsended September 30, 2015, the Investment Adviser recouped$10,496 from Global Value Fund II – Currency Unhedged. AtSeptember 30, 2015, the amount of potential recoveryexpiring March 31, 2016 on Global Value Fund II – CurrencyUnhedged was $4,937.
As of September 30, 2015, the current and retiredmanaging directors and their families, as well as employees ofthe Investment Adviser, have approximately $113.3 million,$4.7 million, $63.9 million and $6.1 million of their ownmoney invested in Global Value Fund, Global ValueFund II – Currency Unhedged, Value Fund and WorldwideHigh Dividend Yield Value Fund, respectively.
II-23
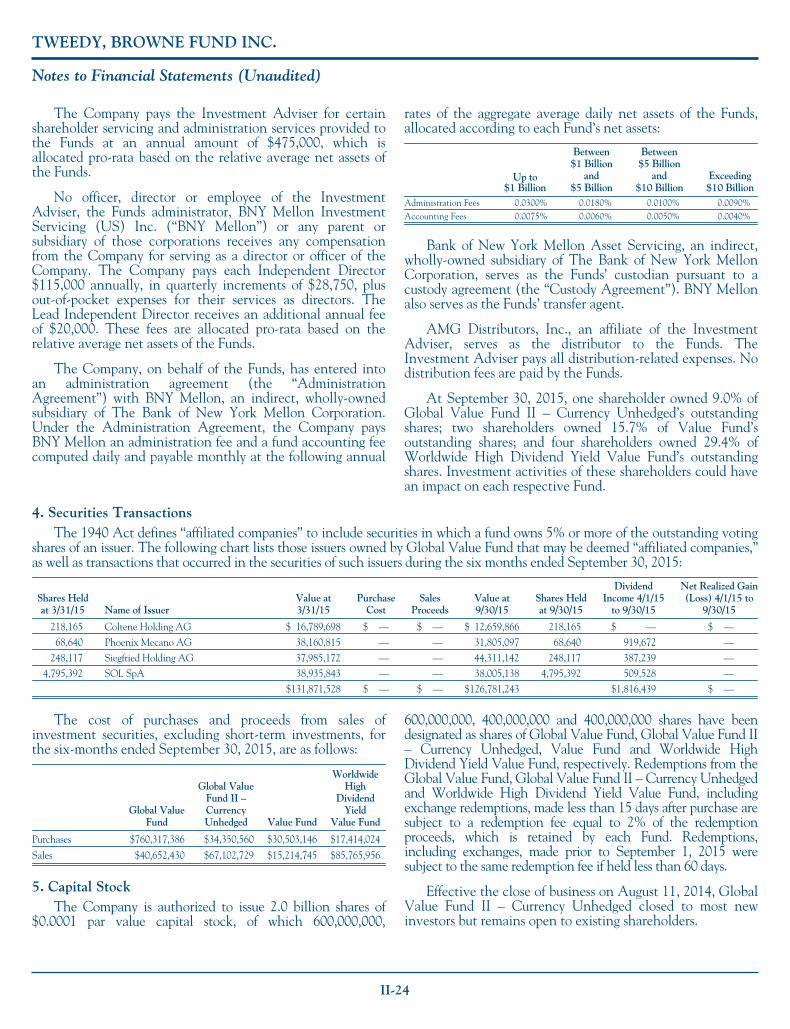
TWEEDY, BROWNE FUND INC.
Notes to Financial Statements (Unaudited)
The Company pays the Investment Adviser for certainshareholder servicing and administration services provided tothe Funds at an annual amount of $475,000, which isallocated pro-rata based on the relative average net assets ofthe Funds.
No officer, director or employee of the InvestmentAdviser, the Funds administrator, BNY Mellon InvestmentServicing (US) Inc. (“BNY Mellon”) or any parent orsubsidiary of those corporations receives any compensationfrom the Company for serving as a director or officer of theCompany. The Company pays each Independent Director$115,000 annually, in quarterly increments of $28,750, plusout-of-pocket expenses for their services as directors. TheLead Independent Director receives an additional annual feeof $20,000. These fees are allocated pro-rata based on therelative average net assets of the Funds.
The Company, on behalf of the Funds, has entered intoan administration agreement (the “AdministrationAgreement”) with BNY Mellon, an indirect, wholly-ownedsubsidiary of The Bank of New York Mellon Corporation.Under the Administration Agreement, the Company paysBNY Mellon an administration fee and a fund accounting feecomputed daily and payable monthly at the following annual
rates of the aggregate average daily net assets of the Funds,allocated according to each Fund’s net assets:
Up to$1 Billion
Between$1 Billion
and$5 Billion
Between$5 Billion
and$10 Billion
Exceeding$10 Billion
Administration Fees 0.0300% 0.0180% 0.0100% 0.0090%Accounting Fees 0.0075% 0.0060% 0.0050% 0.0040%
Bank of New York Mellon Asset Servicing, an indirect,wholly-owned subsidiary of The Bank of New York MellonCorporation, serves as the Funds’ custodian pursuant to acustody agreement (the “Custody Agreement”). BNY Mellonalso serves as the Funds’ transfer agent.
AMG Distributors, Inc., an affiliate of the InvestmentAdviser, serves as the distributor to the Funds. TheInvestment Adviser pays all distribution-related expenses. Nodistribution fees are paid by the Funds.
At September 30, 2015, one shareholder owned 9.0% ofGlobal Value Fund II – Currency Unhedged’s outstandingshares; two shareholders owned 15.7% of Value Fund’soutstanding shares; and four shareholders owned 29.4% ofWorldwide High Dividend Yield Value Fund’s outstandingshares. Investment activities of these shareholders could havean impact on each respective Fund.
4. Securities TransactionsThe 1940 Act defines “affiliated companies” to include securities in which a fund owns 5% or more of the outstanding voting
shares of an issuer. The following chart lists those issuers owned by Global Value Fund that may be deemed “affiliated companies,”as well as transactions that occurred in the securities of such issuers during the six months ended September 30, 2015:
Shares Heldat 3/31/15 Name of Issuer
Value at3/31/15
PurchaseCost
SalesProceeds
Value at9/30/15
Shares Heldat 9/30/15
DividendIncome 4/1/15
to 9/30/15
Net Realized Gain(Loss) 4/1/15 to
9/30/15
218,165 Coltene Holding AG $ 16,789,698 $ — $ — $ 12,659,866 218,165 $ — $ —68,640 Phoenix Mecano AG 38,160,815 — — 31,805,097 68,640 919,672 —
248,117 Siegfried Holding AG 37,985,172 — — 44,311,142 248,117 387,239 —4,795,392 SOL SpA 38,935,843 — — 38,005,138 4,795,392 509,528 —
$131,871,528 $ — $ — $126,781,243 $1,816,439 $ —
The cost of purchases and proceeds from sales ofinvestment securities, excluding short-term investments, forthe six-months ended September 30, 2015, are as follows:
Global ValueFund
Global ValueFund II –CurrencyUnhedged Value Fund
WorldwideHigh
DividendYield
Value Fund
Purchases $760,317,386 $34,350,560 $30,503,146 $17,414,024
Sales $40,652,430 $67,102,729 $15,214,745 $85,765,956
5. Capital StockThe Company is authorized to issue 2.0 billion shares of
$0.0001 par value capital stock, of which 600,000,000,
600,000,000, 400,000,000 and 400,000,000 shares have beendesignated as shares of Global Value Fund, Global Value Fund II– Currency Unhedged, Value Fund and Worldwide HighDividend Yield Value Fund, respectively. Redemptions from theGlobal Value Fund, Global Value Fund II – Currency Unhedgedand Worldwide High Dividend Yield Value Fund, includingexchange redemptions, made less than 15 days after purchase aresubject to a redemption fee equal to 2% of the redemptionproceeds, which is retained by each Fund. Redemptions,including exchanges, made prior to September 1, 2015 weresubject to the same redemption fee if held less than 60 days.
Effective the close of business on August 11, 2014, GlobalValue Fund II – Currency Unhedged closed to most newinvestors but remains open to existing shareholders.
II-24
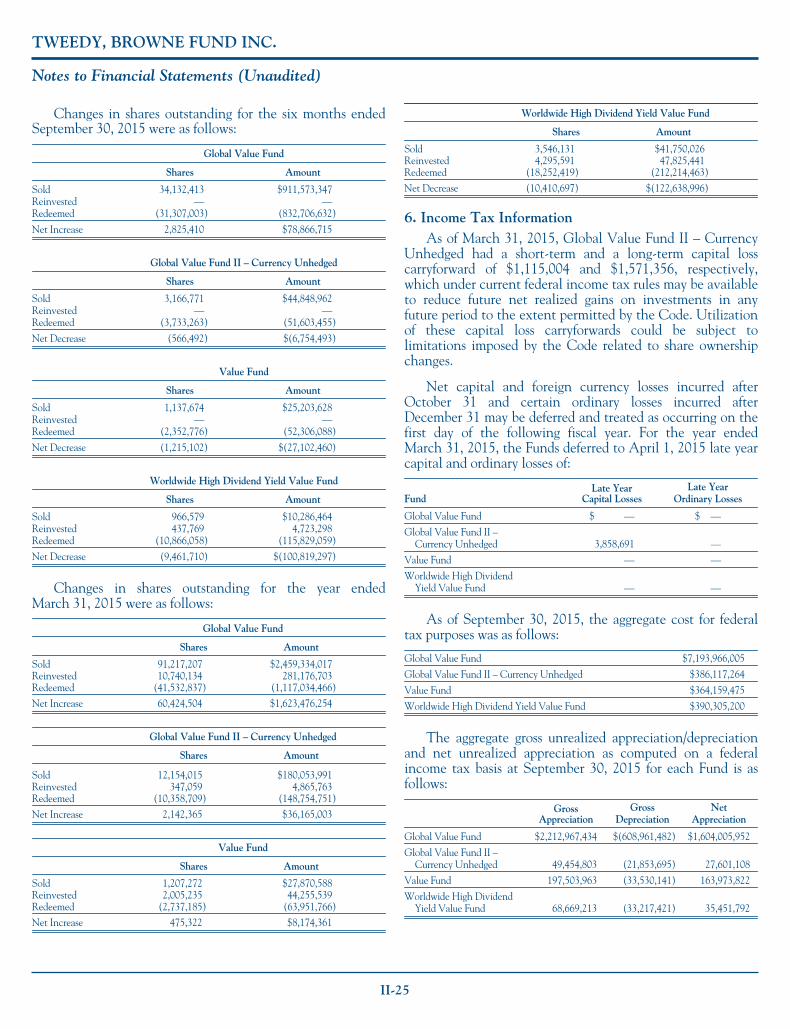
TWEEDY, BROWNE FUND INC.
Notes to Financial Statements (Unaudited)
Changes in shares outstanding for the six months endedSeptember 30, 2015 were as follows:
Global Value Fund
Shares Amount
Sold 34,132,413 $911,573,347Reinvested — —Redeemed (31,307,003) (832,706,632)
Net Increase 2,825,410 $78,866,715
Global Value Fund II – Currency Unhedged
Shares Amount
Sold 3,166,771 $44,848,962Reinvested — —Redeemed (3,733,263) (51,603,455)
Net Decrease (566,492) $(6,754,493)
Value Fund
Shares Amount
Sold 1,137,674 $25,203,628Reinvested — —Redeemed (2,352,776) (52,306,088)
Net Decrease (1,215,102) $(27,102,460)
Worldwide High Dividend Yield Value Fund
Shares Amount
Sold 966,579 $10,286,464Reinvested 437,769 4,723,298Redeemed (10,866,058) (115,829,059)
Net Decrease (9,461,710) $(100,819,297)
Changes in shares outstanding for the year endedMarch 31, 2015 were as follows:
Global Value Fund
Shares Amount
Sold 91,217,207 $2,459,334,017Reinvested 10,740,134 281,176,703Redeemed (41,532,837) (1,117,034,466)
Net Increase 60,424,504 $1,623,476,254
Global Value Fund II – Currency Unhedged
Shares Amount
Sold 12,154,015 $180,053,991Reinvested 347,059 4,865,763Redeemed (10,358,709) (148,754,751)
Net Increase 2,142,365 $36,165,003
Value Fund
Shares Amount
Sold 1,207,272 $27,870,588Reinvested 2,005,235 44,255,539Redeemed (2,737,185) (63,951,766)
Net Increase 475,322 $8,174,361
Worldwide High Dividend Yield Value Fund
Shares Amount
Sold 3,546,131 $41,750,026Reinvested 4,295,591 47,825,441Redeemed (18,252,419) (212,214,463)
Net Decrease (10,410,697) $(122,638,996)
6. Income Tax InformationAs of March 31, 2015, Global Value Fund II – Currency
Unhedged had a short-term and a long-term capital losscarryforward of $1,115,004 and $1,571,356, respectively,which under current federal income tax rules may be availableto reduce future net realized gains on investments in anyfuture period to the extent permitted by the Code. Utilizationof these capital loss carryforwards could be subject tolimitations imposed by the Code related to share ownershipchanges.
Net capital and foreign currency losses incurred afterOctober 31 and certain ordinary losses incurred afterDecember 31 may be deferred and treated as occurring on thefirst day of the following fiscal year. For the year endedMarch 31, 2015, the Funds deferred to April 1, 2015 late yearcapital and ordinary losses of:
FundLate Year
Capital LossesLate Year
Ordinary Losses
Global Value Fund $ — $ —
Global Value Fund II –Currency Unhedged 3,858,691 —
Value Fund — —
Worldwide High DividendYield Value Fund — —
As of September 30, 2015, the aggregate cost for federaltax purposes was as follows:
Global Value Fund $7,193,966,005
Global Value Fund II – Currency Unhedged $386,117,264
Value Fund $364,159,475
Worldwide High Dividend Yield Value Fund $390,305,200
The aggregate gross unrealized appreciation/depreciationand net unrealized appreciation as computed on a federalincome tax basis at September 30, 2015 for each Fund is asfollows:
GrossAppreciation
GrossDepreciation
NetAppreciation
Global Value Fund $2,212,967,434 $(608,961,482) $1,604,005,952
Global Value Fund II –Currency Unhedged 49,454,803 (21,853,695) 27,601,108
Value Fund 197,503,963 (33,530,141) 163,973,822
Worldwide High DividendYield Value Fund 68,669,213 (33,217,421) 35,451,792
II-25
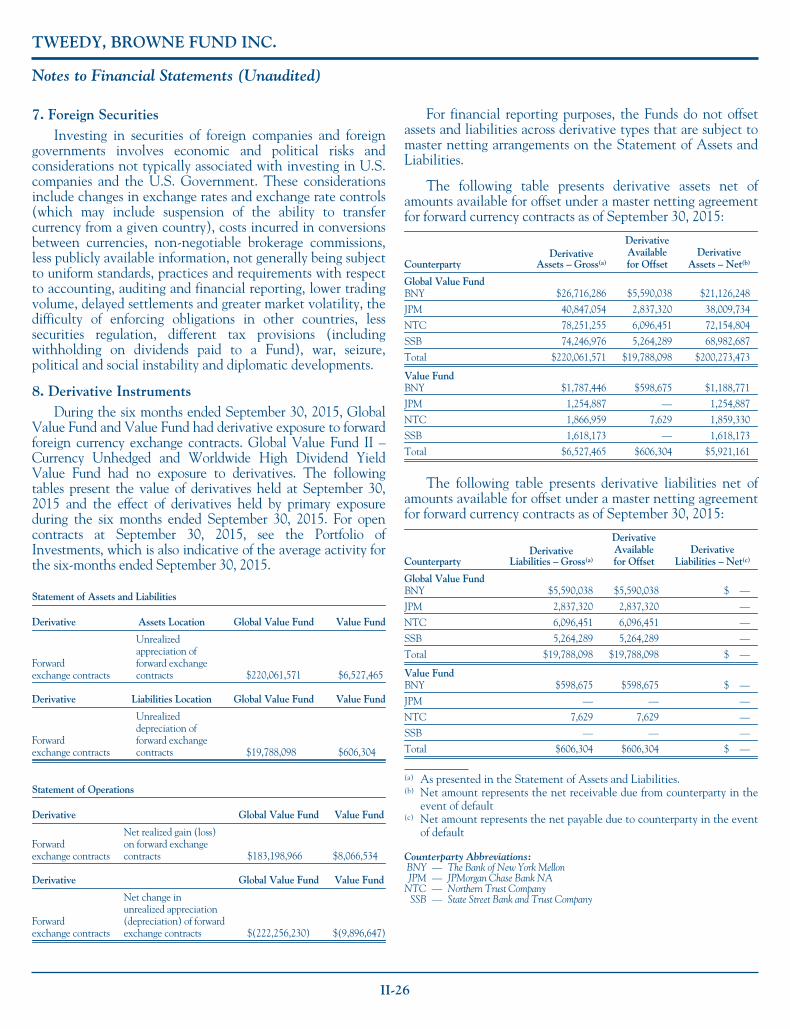
TWEEDY, BROWNE FUND INC.
Notes to Financial Statements (Unaudited)
7. Foreign SecuritiesInvesting in securities of foreign companies and foreign
governments involves economic and political risks andconsiderations not typically associated with investing in U.S.companies and the U.S. Government. These considerationsinclude changes in exchange rates and exchange rate controls(which may include suspension of the ability to transfercurrency from a given country), costs incurred in conversionsbetween currencies, non-negotiable brokerage commissions,less publicly available information, not generally being subjectto uniform standards, practices and requirements with respectto accounting, auditing and financial reporting, lower tradingvolume, delayed settlements and greater market volatility, thedifficulty of enforcing obligations in other countries, lesssecurities regulation, different tax provisions (includingwithholding on dividends paid to a Fund), war, seizure,political and social instability and diplomatic developments.
8. Derivative InstrumentsDuring the six months ended September 30, 2015, Global
Value Fund and Value Fund had derivative exposure to forwardforeign currency exchange contracts. Global Value Fund II –Currency Unhedged and Worldwide High Dividend YieldValue Fund had no exposure to derivatives. The followingtables present the value of derivatives held at September 30,2015 and the effect of derivatives held by primary exposureduring the six months ended September 30, 2015. For opencontracts at September 30, 2015, see the Portfolio ofInvestments, which is also indicative of the average activity forthe six-months ended September 30, 2015.
Statement of Assets and Liabilities
Derivative Assets Location Global Value Fund Value Fund
Forwardexchange contracts
Unrealizedappreciation offorward exchangecontracts $220,061,571 $6,527,465
Derivative Liabilities Location Global Value Fund Value Fund
Forwardexchange contracts
Unrealizeddepreciation offorward exchangecontracts $19,788,098 $606,304
Statement of Operations
Derivative Global Value Fund Value Fund
Forwardexchange contracts
Net realized gain (loss)on forward exchangecontracts $183,198,966 $8,066,534
Derivative Global Value Fund Value Fund
Forwardexchange contracts
Net change inunrealized appreciation(depreciation) of forwardexchange contracts $(222,256,230) $(9,896,647)
For financial reporting purposes, the Funds do not offsetassets and liabilities across derivative types that are subject tomaster netting arrangements on the Statement of Assets andLiabilities.
The following table presents derivative assets net ofamounts available for offset under a master netting agreementfor forward currency contracts as of September 30, 2015:
CounterpartyDerivative
Assets – Gross(a)
DerivativeAvailablefor Offset
DerivativeAssets – Net(b)
Global Value FundBNY $26,716,286 $5,590,038 $21,126,248
JPM 40,847,054 2,837,320 38,009,734
NTC 78,251,255 6,096,451 72,154,804
SSB 74,246,976 5,264,289 68,982,687
Total $220,061,571 $19,788,098 $200,273,473
Value FundBNY $1,787,446 $598,675 $1,188,771
JPM 1,254,887 — 1,254,887
NTC 1,866,959 7,629 1,859,330
SSB 1,618,173 — 1,618,173
Total $6,527,465 $606,304 $5,921,161
The following table presents derivative liabilities net ofamounts available for offset under a master netting agreementfor forward currency contracts as of September 30, 2015:
CounterpartyDerivative
Liabilities – Gross(a)
DerivativeAvailablefor Offset
DerivativeLiabilities – Net(c)
Global Value FundBNY $5,590,038 $5,590,038 $ —
JPM 2,837,320 2,837,320 —
NTC 6,096,451 6,096,451 —
SSB 5,264,289 5,264,289 —
Total $19,788,098 $19,788,098 $ —
Value FundBNY $598,675 $598,675 $ —
JPM — — —
NTC 7,629 7,629 —
SSB — — —
Total $606,304 $606,304 $ —
(a) As presented in the Statement of Assets and Liabilities.(b) Net amount represents the net receivable due from counterparty in the
event of default(c) Net amount represents the net payable due to counterparty in the event
of default
Counterparty Abbreviations:BNY — The Bank of New York MellonJPM — JPMorgan Chase Bank NA
NTC — Northern Trust CompanySSB — State Street Bank and Trust Company
II-26
TWEEDY, BROWNE FUND INC.
Notes to Financial Statements (Unaudited)
9. LitigationCertain holders of notes issued by Tribune Company
initiated litigation against Value Fund and thousands of otherpublic shareholders, seeking to recover payments made toTribune Company shareholders in connection with the 2007leveraged buyout of Tribune Company. A litigation trustarising out of the Tribune Company bankruptcy proceedingalso initiated claims against a substantially similar group ofpublic shareholders, including Value Fund. The claims werepursued in a consolidated multidistrict litigation format. Theclaims asserted by the noteholders have been dismissed by theU.S. District Court, but the decision to dismiss is now onappeal to the U.S. Court of Appeals. Briefing is complete and
on November 5, 2014, the Second Circuit Court of Appealsheard oral arguments. The timetable for a decision isunknown. The claims by the litigation trust are still pendingin pre-trial proceedings before the U.S. District Court. ValueFund tendered its shares in a tender offer from TribuneCompany and received proceeds of approximately$3.4 million. The plaintiffs’ claims allege that the shareholderpayments were made in violation of various laws prohibitingconstructive and/or actual fraudulent transfers. Thecomplaints allege no misconduct by Value Fund or anymember of the putative defendant class. The outcome of theproceedings cannot be predicted at this time and nocontingency has been recorded on the books of Value Fund.
II-27
TWEEDY, BROWNE FUND INC.
Other Information (Unaudited)
1. Portfolio InformationThe Company files each Fund’s complete schedule of
portfolio holdings with the SEC for the first and third quartersof each fiscal year on Form N-Q. The Company’s Form N-Qis available (1) on the SEC’s website at http://www.sec.gov;(2) for review and copying at the SEC’s Public ReferenceRoom (“PRR”) in Washington, DC; or (3) by calling theFund at 800-432-4789. Information regarding the operation ofthe PRR may be obtained by calling 202-551-8090.
2. Proxy Voting InformationThe policies and procedures that the Company uses to
determine how to vote proxies relating to portfolio securitiesheld by the Funds are included in the Company’s Statementof Additional Information, which is available without chargeand upon request by calling the Funds at 800-432-4789 or byvisiting the Funds’ website at www.tweedy.com. Informationregarding how the Funds voted proxies relating to portfoliosecurities during the most recent twelve-month period endedJune 30 is available, without charge, at http://www.sec.gov.
3. Advisory Agreement
Approval of the Renewal of the Investment AdvisoryAgreement for Each Fund
On May 19, 2015, the Board of Directors (the “Board”) ofTweedy, Browne Fund Inc. (the “Company”), including amajority of the Independent Directors, approved the renewalof the Investment Advisory Agreements (the “AdvisoryAgreements”) between Tweedy, Browne Company LLC(“Tweedy, Browne”) and the Company on behalf of theTweedy, Browne Global Value Fund (the “Global ValueFund”), the Tweedy, Browne Value Fund (the “Value Fund”),the Tweedy, Browne Worldwide High Dividend Yield ValueFund (the “Worldwide High Dividend Yield Value Fund”)and the Tweedy, Browne Global Value Fund II – CurrencyUnhedged (the “Global Value Fund II”) (each a “Fund” andcollectively, the “Funds”) for an additional one-year term. Inconsidering whether to approve the continuation of theAdvisory Agreements, the Board reviewed materials providedfor its evaluation, and the Independent Directors were advisedby independent legal counsel with respect to these and otherrelevant matters. The information, material factors andconclusions that formed the basis for the Board’s approval aredescribed below.
A. Information ReceivedDuring the course of each year, the Board receives a wide
variety of materials relating to the services provided byTweedy, Browne. In considering whether to approve therenewal of the Advisory Agreements, the Board reviewedmaterials provided in advance of the meeting, which includeda memorandum from independent legal counsel regardingduties and standards of review in connection with theconsideration of continuation of the Advisory Agreementsand a narrative discussion prepared by Tweedy, Browne
describing factors relevant to the 2015 contract renewalprocess. In addition, the Board reviewed supplementaryinformation, including (without limitation) comparativeinformation regarding the performance, fees and expenseratios of the Global Value Fund, the Value Fund, the HighDividend Yield Value Fund and the Global Value Fund IIthat were included in the Board materials and, in the case ofthe Value Fund and Worldwide High Dividend Yield ValueFund, updated comparative data from Morningstar that washanded out and discussed at the Meeting; sample reportsdemonstrating Tweedy, Browne’s extensive research process;fact sheets and performance histories for each of the Fundssince inception; information for several of Tweedy, Browne’smanaged account performance composites; fee schedules; areport on fees paid to intermediaries; a description of keypersonnel of Tweedy, Browne; a profitability analysis ofTweedy, Browne; a Statement of Financial Condition forTweedy, Browne; memoranda and related information fromTweedy, Browne concerning Tweedy, Browne’s brokerageallocation practices and best execution and brokeragecommissions policies; the Form ADV of Tweedy, Browne; andcopies of the Advisory Agreements. The Board consideredthese materials provided by Tweedy, Browne for itsevaluation, and the Independent Directors were advised bytheir independent legal counsel, with respect to these andother relevant matters.
At the meeting, the Independent Directors listened to asupplemental oral presentation by representatives of Tweedy,Browne and were given the opportunity to ask questions andmake observations.
B. Nature, Extent and Quality of ServicesThe Board considered a variety of factors in determining
whether to approve the continuation of the AdvisoryAgreements. First, the Board considered the nature, extentand quality of the services provided by Tweedy, Browne tothe Funds. In considering Tweedy, Browne’s management ofthe Funds’ portfolios, the Board reviewed the narrativediscussion provided by Tweedy, Browne that describedTweedy, Browne’s research process and investment approach.
The Board considered a variety of services provided byTweedy, Browne to the Funds, including: “behind the scenes”services, such as those provided by Tweedy, Browne’s orderdesk, which seeks best execution for transactions effected onbehalf of the Funds; monitoring of the Funds’ serviceproviders and the performance of shadowing functions;monitoring of information with respect to corporatereorganizations involving portfolio companies; preparing theFunds’ semi-annual and annual reports to shareholders andthe accompanying adviser’s letters; monitoring of aspects oftransfer agency services on a daily basis; assisting brokers,consultants, financial advisors, intermediaries and third partyadministrators with questions or problems of an operationalnature; developing and enforcing procedures to monitortrading activity in the Funds; monitoring the collection of
II-28
TWEEDY, BROWNE FUND INC.
Other Information (Unaudited)
redemption fees for the Global Value Fund, Global ValueFund II and High Dividend Yield Value Fund; monitoring13D-like filing requirements in 29 foreign jurisdictions;arranging for proxy voting of portfolio securities; qualifyingthe Funds as approved purchasers in certain foreignjurisdictions; where necessary, hiring an accounting firm toassist with certain fund accounting reviews andimplementation of related processes and procedures; andactively monitoring and assessing valuation issues for theFunds, including comparing each security position held byeach Fund with records maintained by BNY Mellon in orderto identify potential valuation errors and reviewing theimpact of the utilization of fair value pricing and back-testingfair valuation determinations. The Board noted actions thathave been or will be taken in the future by Tweedy, Browneto comply with various regulatory requirements, including thehiring of law firms and compliance consultants in response tochanges in Securities and Exchange Commission (“SEC”)rules and regulations.
In addition, the Board noted that Tweedy, Browneprovides a variety of administrative services not otherwiseprovided by the Funds’ third party service providers,including: preparing Board reports; overseeing the preparationand submission of regulatory filings; overseeing and assistingin the annual audit of the Funds’ financial statements;maintaining the Funds’ website; assisting with the preparationand filing of the Funds’ tax returns; monitoring theregistration of shares of the Funds under applicable federaland state securities laws; assisting in the resolution ofaccounting and legal issues; establishing and monitoring theFunds’ operating budgets; approving, auditing and processingthe payment of the Funds’ bills; assisting the Funds in, andotherwise arranging for, the payment of distributions anddividends; communicating with the Funds’ shareholders withmarket commentary; participating in ongoing training andmonitoring of BNY Mellon’s shareholder servicesrepresentatives; and generally assisting each Fund in theconduct of its business.
The Board noted that Tweedy, Browne resigned as theFunds’ Distributor effective September 30, 2014, and thatcertain Tweedy, Browne personnel are now associated withthe Funds’ new Distributor, AMG Distributors, Inc.(“AMGDI”).
The Board discussed with management various issuesrelating to Tweedy, Browne’s ability to continue to providehigh quality advisory and administrative services to the Funds,including staffing, long-term planning and contingencyplanning at Tweedy, Browne. In particular, the Board notedthat the senior members of Tweedy, Browne’s investmentteam (Will Browne, Tom Shrager, Bob Wyckoff and JohnSpears) have worked together at Tweedy, Browne for between24 and 41 years, and that Tweedy, Browne generallymaintained a consistent management approach that wasfacilitated by the very low personnel turnover at the firm. The
Board discussed the fact that the Funds’ management teamwas nominated and considered for the Morningstar“International Manager of the Year” award in 2008 and wasnamed Morningstar’s “International Manager of the Year” in2011 and The Street’s “Best Funds 2012” award winner in thecategory of International Core Stock for its management ofthe Global Value Fund. The Board also discussed withmanagement the hiring and professional development ofjunior staff in all areas of Tweedy, Browne’s advisory business,including investment analysis and advice, trading, clientrelations, accounting and administrative support, andoperations.
In considering Tweedy, Browne’s services in managing theFunds’ portfolios and overseeing all aspects of the Funds’business, the Board concluded that Tweedy, Browne wasproviding essential services to the Funds, and that it was likelyto be in a position to continue doing so in the long term.
C. Investment PerformanceThe Board considered the Funds’ performance, both in
absolute terms and relative terms to the various benchmarksagainst which the Funds were compared. In considering theGlobal Value Fund’s performance, the Board considered theAdviser’s analysis that the Fund had exhibited excellentabsolute and relative performance since its inception, notingthat the Fund’s annualized rate of return of 9.99% (net of allfees and expenses) from inception through March 31, 2015had significantly exceeded the returns of relevant indices inU.S. dollars (both hedged and unhedged). The Board notedthe Global Value Fund’s policy to have its perceived non-U.S. currency exposure hedged to the extent practicable backto the U.S. dollar, and thus considered the Fund’s totalreturns against the returns of the MSCI EAFE Index (Hedgedto U.S.$), noting that the Fund outperformed that Index as ofMarch 31, 2015 for the 5-year, 10-year, 15-year, 20-year andsince inception periods. The Board also noted that the GlobalValue Fund had outperformed its benchmark index in twelveout of the last fifteen calendar years.
The Board considered Tweedy, Browne’s analysis that,over the long term, the Global Value Fund had enjoyedfavorable performance when compared to other funds in itspeer group. The Board examined the Global Value Fund’srankings versus all Foreign Stock Funds, noting that the Fundhas outperformed the Morningstar Foreign Stock Fundsaverage over the past 1-year, 3-year, 5-year, 10-year, 15-year,and 20-year periods. In addition, the Board noted that theFund consistently ranks near the top in terms of low risk inMorningstar’s Risk Ratings. It was noted that for the past3-year, 5-year and 10-year periods the Global Value Fund hasbeen categorized as “low risk” by Morningstar’s Risk Ratings,which means it is in the top 10% of funds within its categorywith respect to lowest measured risk.
The Board also discussed the Fund’s improved Morningstarranking, from a 2 star rating to a 5 star rating in the past seven
II-29
TWEEDY, BROWNE FUND INC.
Other Information (Unaudited)
years. The Board noted that the Global Value Fund had closedto new investors in May 2005 and reopened in January 2008,when Tweedy, Browne believed that the economic landscapeproduced new investment opportunities and would offerattractive discounts from intrinsic value estimates.
The Board then examined the Value Fund’s performance,noting that the Fund had enjoyed good relative performancein many measurement periods in comparison to its relevantbenchmark indices. In particular, the Board noted that as ofMarch 31, 2015, the Value Fund’s total returns outperformeda combined index of the S&P 500 Index and MSCI WorldIndex (Hedged to U.S.$) over the past 10-year, 15-year,20-year and since inception periods, although the Boardnoted that the Fund had underperformed over the 1-year,3-year, and 5-year periods.
The Board noted the Adviser’s analysis that the ValueFund has exhibited good relative performance and has held upwell in down market environments. It was noted that theValue Fund is categorized as a World Stock Fund within theMorningstar universe. The Board took note of the fact thatthe Fund outperformed the Morningstar average of all WorldStock Funds by 17.54% in calendar year 2008. In 2009, theValue Fund returned 27.6%, while the World Stock Fundaverage category return was 35.27%, for a net outperformanceof the Value Fund over the two-year period of 9.87%. FromFebruary 28, 2009 through March 31, 2015, the Fundreturned 143.9% versus the 166.6% return of the MSCIWorld Index (Hedged to US$).
The Board also noted that the Value Fund has beencharacterized as “low risk” for the last 3-year, 5-year and10-year periods by Morningstar’s Risk Ratings, which means itis in the top 10% of funds within Morningstar’s domesticequity category in terms of low risk. The Board further notedthat the Fund, which was closed to most new investors in May2005, was re-opened to new investors in May 2007 followinga change in the Fund’s investment strategy to permit holdingmore non-U.S. stocks, which afforded Tweedy, Brownegreater flexibility in managing the Value Fund.
It was noted that the Value Fund was a finalist in theGlobal Equity category for Standard & Poor’s (“S&P”) MutualFund Excellence Awards in 2010, which recognizes funds thathave achieved the highest overall ranking on the mostconsistent basis during the previous year. Among the factorsconsidered by S&P were: consistently strong performance; highquality holdings as measured by S&P STARS (StockAppreciation Ranking System); S&P Credit Ratings; S&PQuality Ranks; and favorable cost factors. Lastly, the Boardnoted that the Fund’s ability to hold up so well on a relativebasis in 2008 qualified Tweedy, Browne for the “Manager of theYear” nomination by Morningstar.
The Board examined the performance of the HighDividend Yield Value Fund, noting that the Fundcommenced operations on September 5, 2007. The Board
noted that since the High Dividend Yield Value Fund’sinception date, the Fund has gained 34.85% versus a gain of31.46% for the MSCI World Index (in U.S.$). During 2009,the High Dividend Yield Value Fund was up 28.18%compared to a gain of 29.99% for the MSCI World Index (inU.S.$). The Board then considered the long termperformance history of Tweedy, Browne’s Global HighDividend Strategy, which has been implemented by Tweedy,Browne since 1979 and on which the High Dividend YieldValue Fund’s investment strategy is based. Since its inceptionin 1979 through March 31, 2015, the Global High DividendStrategy has compounded at an annualized rate of return of12.55% (net of actual and hypothetical fees) which hadoutpaced the S&P 500 Index and the MSCI World Index (inU.S.$), on an annualized basis, by 0.72% and 2.78%,respectively. It was noted that Tweedy, Browne’s Global HighDividend Strategy has performed well in down market years.In addition, the Board noted that the Fund had ranked in thetop 20% (for the 3-year period) and in the top 10% (for the 5-year period) in terms of low risk in Morningstar’s RiskRatings.
The Board examined the performance of the GlobalValue Fund II, noting that the Fund commenced operationson October 26, 2009. The Board noted that the Global ValueFund II has performed well since its inception through March31, 2015, gaining 48.98% compared to 36.79% for the MSCIEAFE Index (in U.S.$) for the period. The Board thenconsidered the performance of the Global Value Fund, whichis managed using the same philosophy and approach as theGlobal Value Fund II, and Tweedy, Browne’s unhedgedinternational separate accounts, which provide substantiveinformation about the ability and quality of Tweedy, Browne’smanagement team and justification for the management ofanother international fund without a currency hedge. It wasnoted that while short term performance of the Global ValueFund II may vary considerably from that of the Global ValueFund due to currency fluctuations, the long term performanceof the Funds is expected to be similar. The Board consideredthat Tweedy, Browne’s International Equity Composite (inU.S.$), which has returns that are similar to those of theGlobal Value Fund, has outperformed the MSCI EAFE Index(in U.S.$) for the last 5-year, 10-year, 15-year and sinceinception periods ended March 31, 2015. The Board notedthat the Fund had ranked in the top 10% in terms of low riskby Morningstar’s Risk Ratings for both the 3-year and 5-yearperiods.
In addition, it was noted that the long-term performanceof the Global Value Fund II should correlate to theperformance of Tweedy, Browne’s unhedged internationalseparate accounts. The Board considered that a composite ofTweedy, Browne’s unhedged international separate accountshas exhibited both good absolute and relative performancesince inception in July 1995. The composite’s annualized rateof return of 9.67% (after assumed fees and expenses) throughMarch 31, 2015 significantly exceeded relevant indices on
II-30
TWEEDY, BROWNE FUND INC.
Other Information (Unaudited)
both a U.S. dollar hedged and non-hedged basis. In contrast,the MSCI EAFE Index returned 5.20% in U.S. dollars and6.92% unhedged to the U.S. dollar for the period (before anyallowance for fees and expenses). It was noted that theunhedged international separate accounts participated stronglyduring positive market periods and that the composite’s relativeresults are significantly better for the down markets thatoccurred in 2000, 2001, 2002, 2008 and 2011.
D. Advisory Fees and Total ExpensesThe Board reviewed the advisory fees and total expenses
of the Funds. In so doing, the Board reviewed several sets ofinformation, including comparative fee and expense data forcomparable funds and the costs associated with Tweedy,Browne’s management of non-fund accounts. It was notedthat the Adviser has approximately 427 separate clientrelationships, including partnerships and offshore funds. TheBoard considered that the Adviser generally charges astandard fee rate of 1.50% for most fully-invested domestic,international and global separate account portfolios and1.25% for fully-invested separate accounts in the global highdividend strategy, subject to (i) breakpoints in each of thedomestic and global high dividend strategies and (ii) a 10%discount for eleemosynary accounts invested in any strategy.The Board noted in this regard that there is no charge on cashreserves. The Board also considered that the Adviser chargesa standard fee rate of 1.25% for offshore funds. With respectto seven notable account exceptions to the standard fee ratesfor which the Adviser charges a lower fee, the Board notedthat six of these accounts are distinguishable from the Fundsby the difference in the level of services required to manageand administer the accounts, and that these efficiencies arenot available in the management of the Funds. In addition tothese efficiencies, the Board further noted that the seventhaccount employs an investment strategy that isdistinguishable and significantly less demanding than thatemployed in the management of other separately managedaccounts and the Funds.
The Board considered the narrative discussion providedby Tweedy, Browne that examined the Funds’ portfolioturnover rates and brokerage commission data. The Boardconsidered that, as of December 2014, the average domesticequity fund in the Morningstar database had a 56% annualportfolio turnover rate. The Board noted that the GlobalValue Fund’s portfolio turnover rate was 8% (resulting in anestimated 1.6 basis points of commission drag) and the ValueFund’s portfolio turnover rate was 6% (resulting in less than 1basis point (estimated) of commission drag) for the fiscal yearended March 31, 2015. The Board also noted that the HighDividend Yield Value Fund’s average annual portfolioturnover rate was 7% (resulting in an estimated 2 basis pointsof commission drag) and the Global Value Fund II’s averageannual portfolio turnover rate was 9% (resulting in anestimated 2 basis points of commission drag) for the fiscal yearended March 31, 2015.
The Board examined comparative fund fee information,and noted at the outset that, although the Funds pay higherinvestment advisory fees than certain other peer funds, theFunds’ overall expense ratios were competitive with peer fundsand represented a good deal for investors in light of the Funds’performance and investor services. In considering thecomparative fee data provided by Tweedy, Browne, the Boardnoted that the Global Value Fund’s expense ratio has declined22.3% from its expense ratio at inception of 1.75%. Inparticular, the Board also noted that the Global Value Fund’stotal expense ratio of 1.36% (excluding acquired fund fees andexpenses), as of March 31, 2015, was 5 basis points higher thanthe average net expense ratio of the Morningstar Foreign StockFunds category average, 1 basis point lower than the Fund’stotal expense ratio in the previous fiscal year and 2 basis pointslower than the 2013 fiscal year.
The Board considered the comparative fee data regardingthe Global Value Fund II and noted that the Fund’s expenseratio of 1.37% (excluding acquired fund fees and expenses) asof March 31, 2015 is 7 basis points higher than the averagenet expense ratio of the Morningstar Foreign Stock Fundscategory average and 10 basis points higher than the averagenet expense ratio of a sampling of the Fund’s directcompetitors based on data from Morningstar. The Boardnoted that, since inception, Tweedy, Browne waived advisoryfees of $321,998 to keep the Fund’s overall expense ratio inline with the expense ratio of the Global Value Fund. It wasnoted that the fee waiver agreement had terminated onDecember 31, 2014, as the Fund no longer needed the feewaiver to maintain the Fund’s total annual fund operatingexpenses at no more than 1.37% (excluding acquired fundfees and expenses, brokerage, interest, taxes and extraordinaryexpenses).
The Board considered the comparative fee data regardingthe Value Fund and noted that the Value Fund’s expenseratio of 1.36% (excluding acquired fund fees and expenses) asof March 31, 2015 was 5 basis points higher than the averageexpense ratio of the Morningstar World Stock Fund categoryaverage and 2 basis points lower than the average net expenseratio for its direct competitors based on data fromMorningstar. The Board further noted that the total expenseratio for the Value Fund had declined 22.3% from itsinception expense ratio of 1.75%.
The Board considered comparative fee data regarding theHigh Dividend Yield Value Fund and noted that the expenseratio of the Fund as of March 31, 2015 was 1.35% (excludingacquired fund fees and expenses). The Board then noted thatthe 1.35% expense ratio for the High Dividend Yield ValueFund was 4 basis points higher than the average expense ratioof the Morningstar World Stock Funds category and 17 basispoints higher than the average net expense ratio of a samplingof the Fund’s direct competitors based on data fromMorningstar.
II-31
TWEEDY, BROWNE FUND INC.
Other Information (Unaudited)
E. Adviser Costs, Level of Profits and Economies ofScale
The Board reviewed information regarding Tweedy,Browne’s costs of providing services to the Funds, as well as theresulting level of profits to Tweedy, Browne. In so doing, theBoard reviewed materials relating to Tweedy, Browne’sfinancial condition and reviewed the wide variety of servicesand intensive research performed for the Funds. The Board alsonoted that Tweedy, Browne has a dedicated mutual funddepartment composed of six employees. Pursuant to a ServiceAgreement approved annually by the Board, the Fundsreimburse the Adviser on an at cost basis for certain legalcompliance, shareholder servicing and fund accounting servicesperformed by three of these employees who are not officers ordirectors of the Company and who devote a majority of theirtime to these services for the Company. The Board noted thatthe amount to be reimbursed in 2015, $475,000, was approvedby the Board at its meeting in December 2014. In addition, theBoard noted that most of the Adviser’s other employees alsowork on Fund-related issues or projects on a regular basis.
The Board then considered materials regarding theprofitability of Tweedy, Browne’s relationship with the Fundsas a whole, and with each of the Funds separately. The Boardplaced significance on the fact that Tweedy, Browne haselected not to take actions to increase the profitability of itsrelationship with the Funds, such as reducing the fees chargedto the Funds and, through the Distributor, increasingmarketing of the Funds in order to substantially increase assetsunder management at the possible expense of Fundperformance and investor services.
The Board then considered Tweedy, Browne’s researchprocess and, in particular, Tweedy, Browne’s research withregard to non-U.S. securities. The Board considered Tweedy,Browne’s investment discipline for the Global Value Fund,Value Fund and Global Value Fund II with respect to smallerand medium market capitalization issues, and noted that thecost of research per dollar of assets under management for thoseFunds is likely higher than it would be for an investmentadviser that invests in concentrated positions and/or only inlarger market capitalization companies. With respect topotential economies of scale, the Board concluded that this
process is likely not conducive to economies of scale that wouldbe potentially realizable in the management of large pools ofcapital invested exclusively in large market capitalizationstocks. With respect to the High Dividend Yield Value Fund,which generally has a higher proportion of large marketcapitalization holdings in its portfolio (because smallercapitalization companies usually do not pay above-averagedividends), the Board noted that Tweedy, Browne must stillperform extensive research regarding companies that payabove-average dividends and that satisfy a different level ofundervaluation than Tweedy, Browne requires for the otherFunds. The Board determined that such research wouldtherefore not be less intensive or less expensive than theresearch performed for the other three Funds. After discussion,the Independent Directors concluded that Tweedy, Browne’sprofitability from its relationship with the Funds is reasonable,fair and consistent with the anticipated results of an arm’s-length negotiation.
F. Ancillary BenefitsThe Board considered a variety of other benefits received
by Tweedy, Browne as a result of its relationship with theFunds, including any benefits derived by Tweedy, Browne fromsoft dollar arrangements with broker-dealers. In particular, theBoard considered materials concerning Tweedy, Browne’sbrokerage allocation policies. The Board also reviewed Tweedy,Browne’s policies and procedures prohibiting the use ofbrokerage commissions to finance the distribution of fundshares.
G. ConclusionBased on its review, including consideration of each of the
factors noted above, the Board concluded that the nature,extent and quality of the services rendered to each Fundfavored renewal of the Advisory Agreements. The Boardconcluded that the Advisory Agreements continued to be fairand reasonable to the Funds and their shareholders, that theFunds’ shareholders received reasonable value in return forthe advisory fees and other amounts paid to Tweedy, Browneby the Funds, and that the renewal of the AdvisoryAgreements at the present contractual rates was in the bestinterests of each Fund and its shareholders.
II-32


TWEEDY, BROWNE FUND INC.One Station Place, Stamford, CT 06902
800-432-4789www.tweedy.com
TB-SA-0915


![· Interim Report and Unaudited Accounts [1] Contents General Information 2 Chairman’s Letter to Shareholders 5 Investment Adviser’s Report 7 Statement of Net Assets 12 Three](https://static.fdocuments.in/doc/165x107/604b7f370098861141399dec/interim-report-and-unaudited-accounts-1-contents-general-information-2-chairmanas.jpg)