
INVESTING ON THE RIGHT SIDE OF CHANGE - Xyvid · · 2017-08-09INVESTING ON THE RIGHT SIDE OF...
29
INVESTING ON THE RIGHT SIDE OF CHANGE Chris Dillon, Fixed Income Portfolio Specialist Jennifer O’Hara Martin, Equity Portfolio Specialist Steven Norwitz, Investment Content Editorial August 10, 2017
Transcript of INVESTING ON THE RIGHT SIDE OF CHANGE - Xyvid · · 2017-08-09INVESTING ON THE RIGHT SIDE OF...

INVESTING ON THE RIGHT SIDE OF CHANGE Chris Dillon, Fixed Income Portfolio Specialist Jennifer O’Hara Martin, Equity Portfolio Specialist Steven Norwitz, Investment Content Editorial August 10, 2017

2
Amid a Sluggish Global Economy, Tech Can Still Drive Its Own Profit Growth
MSCI ACWI PROFITS EP
S G
row
th R
ate
(%)
MSCI ACWI Sector Forward EPS 2-Year Compound Annual Growth Rate Median Growth Since 2002 June 30, 2002 through 31 Dec 2016
Highest median EPS growth rates
0.0%
2.0%
4.0%
6.0%
8.0%
10.0%
12.0%
14.0%
Technology Discretionary Health Care Materials Industrials MSCI WorldIndex
Staples Energy Telecom Utilities
Past performance cannot guarantee future results. Analysis by T. Rowe Price Associates. Source for MSCI data: MSCI. MSCI makes no express or implied warranties or representations and shall have no liability whatsoever with respect to any MSCI data contained herein. The MSCI data may not be further redistributed or used as a basis for other indices or any securities or financial products. This report is not approved, reviewed, or produced by MSCI.
MSCI World Index Sectors

3 3
Golden Age of Innovation and Global Adoption
Sources: Michael Felton, The New York Times, and HBR.org.
CONSUMPTION SPREADS FASTER TODAY
Change is accelerating due to tremendous amount of innovation led by technology.
Dishwasher

4
Gaming
Digital/ Social Media
The Impact of Innovation on Incumbents
Innovation can disrupt an existing industry or create a new industry.
Mobile Computing
3D Printing
Autonomous Vehicles
Wearables
Virtual Reality
Sharing Economy
EMERGING ESTABLISHED MATURE
SOME OF THE CHANGES INVESTORS BENEFITED FROM INCLUDE:
E-Commerce
Electronic Payments
Robotic/ Automation
Cloud Computing
Sources: FactSet. Data analysis by T. Rowe Price as of December 31, 2016. This information is not intended to be a recommendation to take any particular investment action and is subject to change. No assumptions should be made that the securities identified and discussed above were or will be profitable. All trademarks cited herein are the property of their respective owners. Use of any such trademarks does not imply endorsement.

5 5
Looking for Companies on the Right Side of Change
Unique and transformative invention
Total addressable market
Great business model
Visionary founder and capable CEO
Related and valuable call options
Reasonable valuation

6 6
Technology Is the Largest Industry in the World
As of March 31, 2017
Source: FactSet. This information is not intended to be a recommendation to take any particular investment action and is subject to change. No assumptions should be made that the securities identified and discussed were or will be profitable. All trademarks cited herein are the property of their respective owners. Use of any such trademarks does not imply endorsement.
TOP FIVE PUBLICLY TRADED COMPANIES (BY MARKET CAP)
Tech Other
$440.1B $364.5B $252.3B $246.8B $246.6B
$766.0B $508.7B $486.5B $358.1B $340.1B
2007
2017

7
Gaming
Digital/ Social Media
The Impact of Innovation on Incumbents
Innovation can disrupt an existing industry or create a new industry.
Mobile Computing
3D Printing
Autonomous Vehicles
Wearables
Virtual Reality
Sharing Economy
EMERGING ESTABLISHED MATURE
SOME OF THE CHANGES INVESTORS BENEFITED FROM INCLUDE:
E-Commerce
Electronic Payments
Robotic/ Automation
Cloud Computing
Sources: FactSet. Data analysis by T. Rowe Price as of December 31, 2016. This information is not intended to be a recommendation to take any particular investment action and is subject to change. No assumptions should be made that the securities identified and discussed above were or will be profitable. All trademarks cited herein are the property of their respective owners. Use of any such trademarks does not imply endorsement.

DISRUPTION IN GAMING

9 9
Transformation of Gaming
As of December 31, 2016
Source: EA investor presentation.
The video game industry has expanded every year, and the smartphone has been a key accelerator—gaming is now a mainstream form of entertainment.
0
20
40
60
80
100
120
2000 2001 2002 2003 2004 2005 2006 2007 2008 2009 2010 2011 2012 2013 2014 2015 2016 2017
GLOBAL VIDEO GAME SPEND US$ billions
Xbox One S (Microsoft)
Xbox One (Microsoft)
PS4 (Sony)
PS2 (Sony)
iPad (Apple) Wii (Nintendo)
PS3 (Sony) Xbox 360 (Microsoft)
iPhone 3 (Apple)
Samsung Smartphone
(E)

10 10
What’s Next? Competitive Gaming
Source: EA website.
Finals DEC 2016
Finals FEB 2017
Finals APR 2017
Finals MAY 2017
eSports provides another avenue for EA to tap in to its ecosystem to drive value.

11 11
Digital Opportunity
As of December 31, 2016
Source: EA investor presentation. Data analysis by T. Rowe Price.
Game monetization is no longer a one-time transaction. The transition to digital downloads results in greater economics to game publishers.
29%
71%
2010 56%
44% 2016
Physical Digital
0%
20%
40%
60%
80%
2010 2015 2020E
EA GROSS MARGIN

12 12
Electronic Arts
Source: EA investor presentation.
Electronic Arts is a durable gaming company based on its broad title portfolio, licensed IP, and defensible sports titles.
HD Mobile PC Free to Play

13 13
Why Should a Portfolio Want Exposure to Technology?
RETURNS AND VOLATILITY Median Return Over the Past 20 Years
Past performance cannot guarantee future results. Source: T. Rowe Price.
January 31, 1995 through June 30, 2016
Over the past 20 years, technology had the highest median returns and volatility, which we believe provides opportunity for active management.

14 14
0
2
4
6
8
10
12
14
16
18
20
EM Local EM Dollar Global HighYield
EM Corporate Global Agg. U.S. High Yield Munis U.S. Corp CMBS U.S. Agg. U.S. Treasuries TIPS MBS ABS
Ret
urn
(%)
TOTAL RETURNS BY SECTOR
YTD 2017 2016
A weaker U.S. dollar, the search for yield, and “recovery” for munis have dominated YTD global fixed income returns As of May 31, 2017
Past performance cannot guarantee future results. Indexes Used: EM Local = JP Morgan Emerging Markets Bond Index Global, EM Dollar = JP Morgan EMBI Global Index, EM Corporate = JP Morgan CEMBI Broad Diversified Index, Global High Yield = Barclays Global High Yield Index, U.S. High Yield = Barclays U.S. High Yield Index, Global Agg. = Barclays Global Aggregate Bond Index, U.S. Agg. = Barclays U.S. Aggregate Bond Index, U.S. Corp = Barclays U.S. Investment Grade Corporate Bond Index, CMBS = Barclays CMBS ERISA-Eligible Index, U.S. Treasuries= Barclays U.S. Treasury, ABS = Barclays Asset Backed Securities Index, MBS = Barclays Mortgage-Backed Securities Index, Municipals = Barclays Municipal Bond Index, TIPS = U.S. Treasury TIPS (1-5 Year) Index. Sources: Bloomberg Barclays, Bloomberg Index Services Ltd. Copyright © 2017, Bloomberg Index Services Ltd. Used with permission. Copyright © 2017, FactSet Research Systems Inc. All rights reserved. Information has been obtained from sources believed to be reliable, but J.P. Morgan does not warrant its completeness or accuracy. The index is used with permission. The Index may not be copied, used, or distributed without J.P. Morgan’s prior written approval. Copyright © 2017, J.P. Morgan Chase & Co. All rights reserved.

15 15
With heavy seasonal variation, the U.S. economy is still growing at around 2%, while lower oil prices have helped drive CPI lower for now As of June 16, 2017
-0.25
0.25
0.75
1.25
1.75
2.25
2.75
3.25
3.75
4.25
1/4/2013 1/4/2014 1/4/2015 1/4/2016 1/4/2017
Atlanta Federal Reserve Bank GDPNow Forecast Average
Source: Bloomberg and T. Rowe Price.
25
35
45
55
65
75
85
95
105
115
-0.5
0
0.5
1
1.5
2
2.5
3
06/0
1/20
12
08/0
1/20
12
10/0
1/20
12
12/0
1/20
12
02/0
1/20
13
04/0
1/20
13
06/0
1/20
13
08/0
1/20
13
10/0
1/20
13
12/0
1/20
13
02/0
1/20
14
04/0
1/20
14
06/0
1/20
14
08/0
1/20
14
10/0
1/20
14
12/0
1/20
14
02/0
1/20
15
04/0
1/20
15
06/0
1/20
15
08/0
1/20
15
10/0
1/20
15
12/0
1/20
15
02/0
1/20
16
04/0
1/20
16
06/0
1/20
16
08/0
1/20
16
10/0
1/20
16
12/0
1/20
16
02/0
1/20
17
04/0
1/20
17
U.S. CPI YoverY WTI Oil Price
As of May 31, 2017
Source: Bloomberg and T. Rowe Price.
U.S. CPI YoY vs. Oil Price Trend
Atlanta Fed U.S. GDPNow Forecast Analysis
16 16
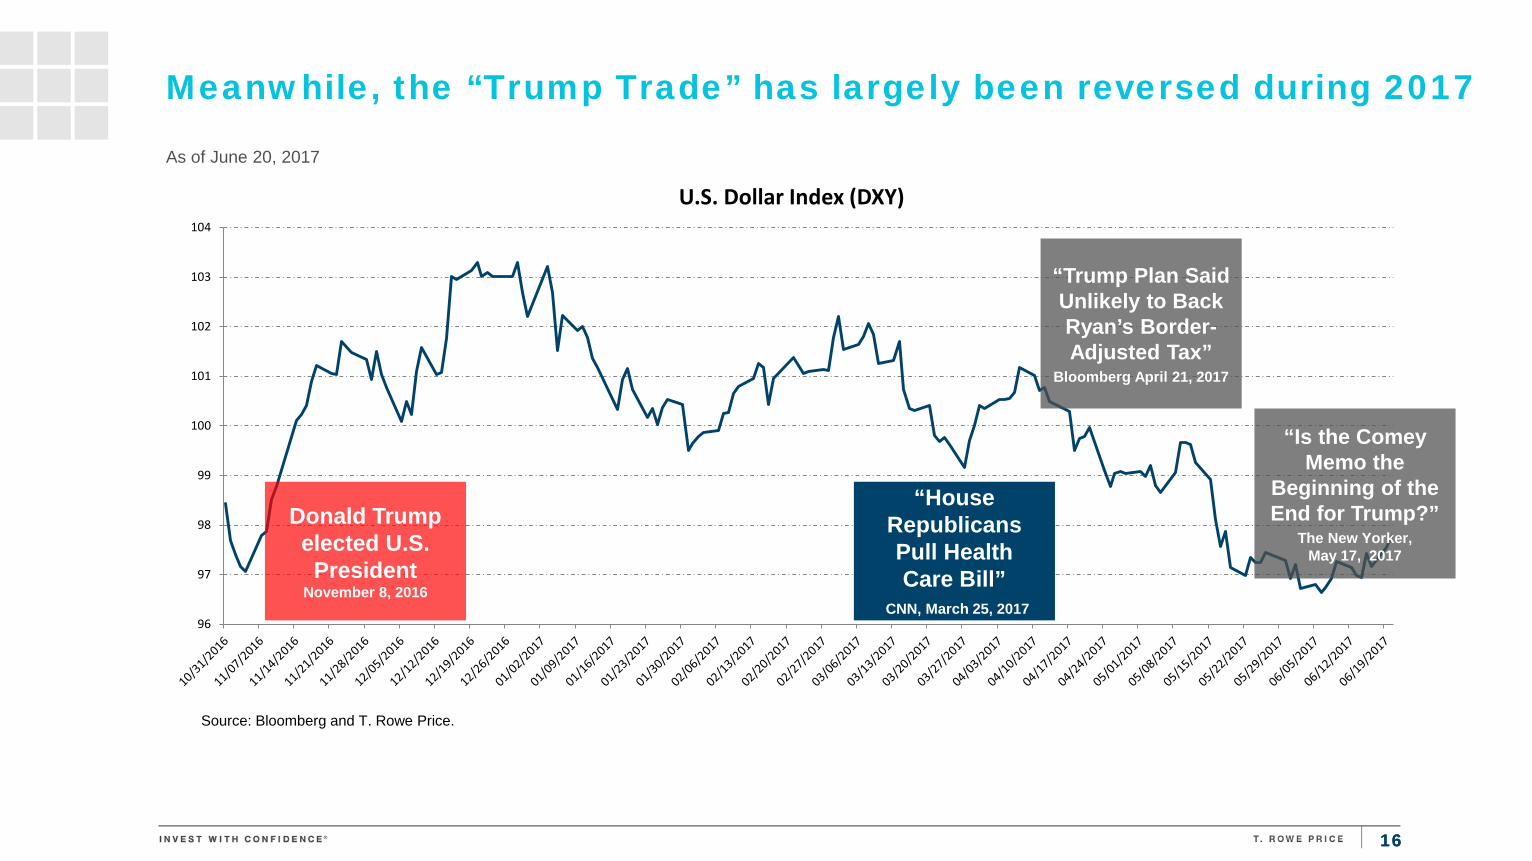
Meanwhile, the “Trump Trade” has largely been reversed during 2017
As of June 20, 2017
96
97
98
99
100
101
102
103
104
U.S. Dollar Index (DXY)
Donald Trump elected U.S.
President November 8, 2016
“House Republicans Pull Health Care Bill”
CNN, March 25, 2017
“Trump Plan Said Unlikely to Back Ryan’s Border-Adjusted Tax”
Bloomberg April 21, 2017
Source: Bloomberg and T. Rowe Price.
“Is the Comey Memo the
Beginning of the End for Trump?”
The New Yorker, May 17, 2017

17 17
And yet a chasm now exists between market expectations and where the Fed wants to go
1
1.2
1.4
1.6
1.8
2
2.2
2.4
2.6
2.8
3
2017 2018 2019 Longer Term
Median Dot Plot
Implied Fed Funds Futures
U.S. Overnight Index Swap Rate
Source: Bloomberg and T. Rowe Price.
“…the era of low interest rates in the United States and elsewhere poses financial stability risks and…central bankers must factor such concerns into their decision-making.” "Monetary policy is less capable of offsetting negative shocks when rates are already low."
Source: "Fed's Rosengren: Low interest rates pose financial stability risks," Reuters Business News, by Lindsay Dunsmuir, June 20, 2017.
As of June 14, 2017

18 18
Not surprisingly, uncertainty pervades today’s U.S. rate conversation
As of June 20, 2016
2.00
3.00
4.00
5.00
6.00
7.00
8.00
9.00
1.00
2.00
3.00
4.00
5.00
6.00
7.00
8.00
12/0
1/19
9011
/01/
1991
10/0
1/19
9209
/01/
1993
08/0
1/19
9407
/01/
1995
06/0
1/19
9605
/01/
1997
04/0
1/19
9803
/01/
1999
02/0
1/20
0001
/01/
2001
12/0
1/20
0111
/01/
2002
10/0
1/20
0309
/01/
2004
08/0
1/20
0507
/01/
2006
06/0
1/20
0705
/01/
2008
04/0
1/20
0903
/01/
2010
02/0
1/20
1101
/01/
2012
12/0
1/20
1211
/01/
2013
10/0
1/20
1409
/01/
2015
08/0
1/20
16U.S. Nominal GDP Rolling Three Year average U.S. 10-Year Treasury Yield Rolling Three Year Average
-0.25
0.25
0.75
1.25
1.75
2.25
2.75
Yield Difference Between U.S. 30-Year Treasuries and Five-Year U.S. Treasuries Avg. Avg.
The historic relationship between U.S. nominal GDP and the U.S. 10-year Treasury yield is broken
The U.S. yield curve has been flattening since the first Fed move in December 2015
U.S. Nominal GDP Rolling Three-Year Average U.S. 10-Year Treasury Yield Rolling Three-Year Average

19 19
As of April 30, 2017
Past performance is not a reliable indicator of future performance. Sources: Haver Analytics, Eurostat, and T. Rowe Price.
GERMAN MANUFACTURING PMI VS. CHINA IMPORTS
0
200
400
600
800
1000
1200
1400
1600
30
35
40
45
50
55
60
65
70
Dec
-06
Dec
-07
Dec
-08
Dec
-09
Dec
-10
Dec
-11
Dec
-12
Dec
-13
Dec
-14
Dec
-15
Dec
-16
Germany PMI China Merchandise Imports
CHINA CAR SALES In Millions and Percentage, Year-on-Year Change
0%
10%
20%
30%
40%
50%
60%
0
5
10
15
20
25
30
2008 2009 2010 2011 2012 2013 2014 2015 2016 2017e 2018e
China Passenger Car Sales Growth
Rebound Due to Tax Cuts
Mill
ion
Car
s So
ld
Less political uncertainty and a strengthening economy favors Europe

20 20
As of April 30, 2017
Past performance is not a reliable indicator of future performance. Sources: Goldman Sachs and T. Rowe Price.
CHINA FISCAL DEFICITS (% GDP, Three-Month Moving Average)
CREDIT GAP (Total Credit to GDP Ratio)
-15%
-10%
-5%
0%
5%
Dec
-06
Dec
-07
Dec
-08
Dec
-09
Dec
-10
Dec
-11
Dec
-12
Dec
-13
Dec
-14
Dec
-15
Dec
-16
Off-Budget Deficit Official Fiscal Deficit
Augmented Fiscal Deficit
-30%
-25%
-20%
-15%
-10%
-5%
0%
5%
10%
15%
20%
25%
30%
35%
40%
Dec
-77
Dec
-79
Dec
-81
Dec
-83
Dec
-85
Dec
-87
Dec
-89
Dec
-91
Dec
-93
Dec
-95
Dec
-97
Dec
-99
Dec
-01
Dec
-03
Dec
-05
Dec
-07
Dec
-09
Dec
-11
Dec
-13
Dec
-15
China Credit Gap EM Ex-China Credit Gap
Rapid Deterioration
Augmented fiscal deficit includes local government deficits
And if all “roads” lead to China, “drivers” have reason to slow down

21 21
The 2017 Long-Term Budget Outlook
Source: The Congressional Budget Office (CBO).
“Asked on Thursday whether the United States needed to pay its debts in full, or whether he could negotiate a partial repayment, Mr. Trump told the cable network CNBC, “I would borrow, knowing that if the economy crashed, you could make a deal.” “Such remarks by a major presidential candidate have no modern precedent. The United States government is able to borrow money at very low interest rates because Treasury securities are regarded as a safe investment, and any cracks in investor confidence have a long history of costing American taxpayers a lot of money.” Source: The New York Times, May 6, 2016
As of March 31, 2017
While a 60/40 balanced construct has worked great since 1990, prospectively, the “40” may need help

22 22
Active management that casts a wider net warrants consideration As of May 31, 2017
Past performance cannot guarantee future results. Sources: U.S. Treasuries: Barclays U.S. Treasury Index; U.S. Aggregate: Barclays U.S. Aggregate; U.S. Corporates: Barclays U.S. Corp IG Index; U.S. High Yield: Barclays U.S. High Yield; EM Sovereign Hard Currency: JPM Emerging Market Global Diversified Bond Index; EM Corporates: JPM CEMBI Broad Diversified; EM Sovereign Local Currency: JPM; GBI EM GD Index; Global Bonds: Barclays Global Aggregate Index; International Bonds: Barclays Global Aggregate ex-U.S. Index; Euro Corporates: Barclays Euro Agg: Corporates Index; Euro HY: Barclays Pan-European High Yield; Euro Agg: Barclays Capital Euro Agg; JGB: Barclays Asian Pacific Japan; Bunds: Barclays Global Treasury Germany; UK Gilts: Barclays Global Treasury UK; Global High Yield: Barclays Global High Yield; Bank Loans: S&P/LSTA Performing Loan Index.
U.S. Treasuries
U.S. Corp I.G.
U.S. HY
EM Sov. Hard Curr. EM Corp.
EM Sov. Local Curr.
Global Corp I.G.
Global Agg. ex-U.S. Euro Corp I.G.
Euro HY
U.S. Agg.
Euro Agg.
JGB Bunds
UK GILTS
Global High Yield
Bank Loans
-1
0
1
2
3
4
5
6
7
0 1 2 3 4 5 6 7 8 9 10 11 12 13
YTM
(%)
Duration (Years)

23 23
Spread sector valuations are stretched, active management prospectively matters
200
300
400
500
600
700
800
900
JP Morgan Emerging Market Bond STW Avg. JP Morgan Global High Yield STW Avg.
As of June 20, 2017
Source: Bloomberg and T. Rowe Price.
High Yield vs. Emerging Market Debt STW Analysis

24 24
Active management prospectively matters across global fixed income
As of April 30, 2017
Past performance is not a reliable indicator of future performance. Sources: Haver Analytics and T. Rowe Price.
0
2
4
6
8
10
12
14
16
18
20
2010 2011 2012 2013 2014 2015 2016 2017
INDIA BRAZIL CHINA RUSSIA
EMERGING MARKET CENTRAL BANK RATES
PRIVATE DOMESTIC CREDIT GROWTH % of GDP
60%
80%
100%
120%
140%
160%
180%
200%
Deleveraging Countries Average Low Risk Countries Average
High Risk Countries Average
Low-Risk Counties Average
High-Risk Counties Average

25 25
0.00
1.00
2.00
3.00
4.00
5.00
6.00
10-Yr Taxable Illinois StateGO (BBB-)
10-Yr Argentina Sovereign(B)
10-Year Greece Sovereign(CCC)
10-Yr Tax-Exempt IllinoisState GO
Corporate BB 7-10 Year 10-Yr Portugal Sovereign(BB+)
10-Yr. Ireland Sovereign (A) 10-Yr Japan Sovereign
As of June 12, 2017
Source: JP Morgan.
A wake-up call for the state of Illinois?
Yiel
d
An interesting time for assessing global relative value

26
Amid a Sluggish Global Economy, Tech Can Still Drive Its Own Profit Growth
MSCI ACWI PROFITS EP
S G
row
th R
ate
(%)
MSCI ACWI Sector Forward EPS 2-Year Compound Annual Growth Rate Median Growth Since 2002 June 30, 2002 through 31 Dec 2016
Highest median EPS growth rates
0.0%
2.0%
4.0%
6.0%
8.0%
10.0%
12.0%
14.0%
Technology Discretionary Health Care Materials Industrials MSCI WorldIndex
Staples Energy Telecom Utilities
Past performance cannot guarantee future results. Analysis by T. Rowe Price Associates. Source for MSCI data: MSCI. MSCI makes no express or implied warranties or representations and shall have no liability whatsoever with respect to any MSCI data contained herein. The MSCI data may not be further redistributed or used as a basis for other indices or any securities or financial products. This report is not approved, reviewed, or produced by MSCI.
MSCI World Index Sectors

27 27
T. Rowe Price—A Partner for Your Asset Allocation Model Needs
troweprice.com MarketScene®
Insights T. Rowe Price
Sales Consultants
An experience that provides easy navigation to comprehensive sales tools and knowledgeable viewpoints to help you better serve your clients’ needs.
Allows easy access to T. Rowe Price’s Market Analysis and Asset Class Perspectives.
A dedicated resource that supports and helps grow your business.

28 28
Important Information This material being furnished for general informational purposes only. The material does not constitute or undertake to give advice of any nature, including fiduciary investment advice, and prospective investors are recommended to seek independent legal, financial, and tax advice before making any investment decision. The T. Rowe Price group of companies, including T. Rowe Price Associates, Inc., and/or its affiliates, receive revenue from T. Rowe Price investment products and services. Past performance is not a reliable indicator of future performance. The value of an investment and any income from it can go down as well as up. Investors may get back less than the amount invested. The top ten securities held in the Global Technology Fund as of 6/30/2017 are as follows: Salesforce.com 14.45%, Alphabet 8.51%, Taiwan Semiconductor Manufacturing 4.80%, Intuit 4.79%, Electronic Arts 4.76%, Liberty Global 4.69%, Alibaba Group Holding 4.68%, Workday 4.47%, Ultimate Software Group 3.79%, Microsoft 3.47%. The material does not constitute a distribution, an offer, an invitation, a personal or general recommendation, or a solicitation to sell or buy any securities or to conduct any particular investment activity. The material has not been reviewed by any regulatory authority. The trademarks shown above are the property of the respective owners. T. Rowe Price is not endorsed, sponsored, or otherwise affiliated with any of the trademark owners represented by the trademarks shown above. Information and opinions presented have been obtained or derived from sources believed to be reliable and current; however, we cannot guarantee the sources’ accuracy or completeness. There is no guarantee that any forecasts made will come to pass. The views contained herein are as of the date noted on the material and are subject to change without notice; these views may differ from those of other T. Rowe Price group companies and/or associates. Under no circumstances should the material, in whole or in part, be copied or redistributed without consent from T. Rowe Price. Barclays Global Family Indices. Copyright © 2017, Barclays Risk Analytics and Index Solutions Limited. Used with permission. Information has been obtained from sources believed to be reliable, but J.P. Morgan does not warrant its completeness or accuracy. The index is used with permission. The Index may not be copied, used, or distributed without J.P. Morgan’s prior written approval. Copyright © 2017, J.P. Morgan Chase & Co. All rights reserved. Copyright © 2017 FactSet Research Systems Inc. All rights reserved. International Monetary Fund/Haver Analytics. Copyright © 2017, T. Rowe Price Investment Services, Inc., Distributor. All Rights Reserved. T. Rowe Price, Invest With Confidence, and the bighorn sheep design are all registered trademarks of T. Rowe Price Group, Inc. All other trademarks are the property of their respective owners. The S&P Dow Jones indices (Index) is a product of S&P Dow Jones Indices LLC and/or its affiliates and has been licensed for use by T. Rowe Price. Copyright © 2017 S&P Dow Jones Indices LLC, a subsidiary of McGraw Hill Financial Inc., and/or its affiliates. All rights reserved. Redistribution, reproduction, and/or photocopying in whole or in part are prohibited without written permission of S&P Dow Jones Indices LLC. For more information on any of S&P Dow Jones Indices LLC’s indices, please visit spdji.com. S&P® is a registered trademark of Standard & Poor’s Financial Services LLC, and Dow Jones® is a registered trademark of Dow Jones Trademark Holdings LLC. Neither S&P Dow Jones Indices LLC, Dow Jones Trademark Holdings LLC, their affiliates, nor their third-party licensors make any representation or warranty, express or implied, as to the ability of any index to accurately represent the asset class or market sector that it purports to represent, and neither S&P Dow Jones Indices LLC, Dow Jones Trademark Holdings LLC, their affiliates, nor their third-party licensors shall have any liability for any errors, omissions, or interruptions of any index or the data included therein.
For Financial Advisor Use Only. Not for Further Distribution.

THANK YOU
C1S0YMTKE 201706-190239