Investing in Primary Care - Patient Centered Primary Care ... · primary care investment without...
40
PREPARED BY Made possible with support from the Milbank Memorial Fund July 2019 Investing in Primary Care A STATE-LEVEL ANALYSIS
Transcript of Investing in Primary Care - Patient Centered Primary Care ... · primary care investment without...
PREPARED BY
Made possible with support from the Milbank Memorial Fund
July 2019
Investing in Primary CareA STATE-LEVEL ANALYSIS
AuthorsYalda Jabbarpour, MD
Ann Greiner, MCP
Anuradha Jetty, MPH
Megan Coffman, MS
Charles Jose, MD
Stephen Petterson, PhD
Karen Pivaral
Robert Phillips, MD, MSPH
Andrew Bazemore, MD, MPH
Alyssa Neumann Kane
ReviewersMark Friedberg MD, MPP
Worthe S. Holt Jr., MD, MMM
Ira Klein MD, MBA
Bruce Landon MD, MBA, MsC
Lance Lang, MD
Special ThanksRachel Block
Stephanie Gold, MD
Chris Koller, MA
Sara Martin, MD
Karen Montemayor
Yolanda Raine
Investing in Primary Care: A State-Level AnalysisPAGE 2
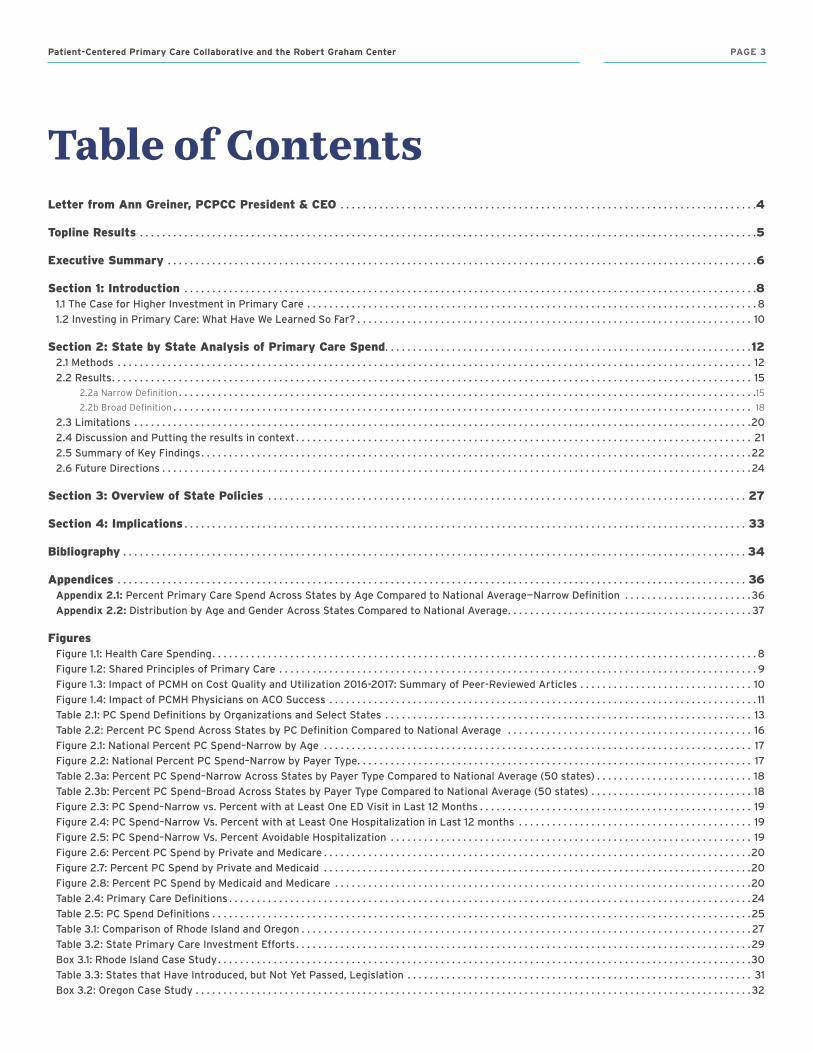
Table of ContentsLetter from Ann Greiner, PCPCC President & CEO . . . . . . . . . . . . . . . . . . . . . . . . . . . . . . . . . . . . . . . . . . . . . . . . . . . . . . . . . . . . . . . . . . . . . . . . . . .4
Topline Results . . . . . . . . . . . . . . . . . . . . . . . . . . . . . . . . . . . . . . . . . . . . . . . . . . . . . . . . . . . . . . . . . . . . . . . . . . . . . . . . . . . . . . . . . . . . . . . . . . . . . . . . . . . . . . . .5
Executive Summary . . . . . . . . . . . . . . . . . . . . . . . . . . . . . . . . . . . . . . . . . . . . . . . . . . . . . . . . . . . . . . . . . . . . . . . . . . . . . . . . . . . . . . . . . . . . . . . . . . . . . . . . . . .6
Section 1: Introduction . . . . . . . . . . . . . . . . . . . . . . . . . . . . . . . . . . . . . . . . . . . . . . . . . . . . . . . . . . . . . . . . . . . . . . . . . . . . . . . . . . . . . . . . . . . . . . . . . . . . . . . .81 .1 .The .Case .for .Higher .Investment .in .Primary .Care . . . . . . . . . . . . . . . . . . . . . . . . . . . . . . . . . . . . . . . . . . . . . . . . . . . . . . . . . . . . . . . . . . . . . . . . . . . . . . . . . . 8
1 .2 .Investing .in .Primary .Care: .What .Have .We .Learned .So .Far? . . . . . . . . . . . . . . . . . . . . . . . . . . . . . . . . . . . . . . . . . . . . . . . . . . . . . . . . . . . . . . . . . . . . . . . 10
Section 2: State by State Analysis of Primary Care Spend . . . . . . . . . . . . . . . . . . . . . . . . . . . . . . . . . . . . . . . . . . . . . . . . . . . . . . . . . . . . . . . . . .122 .1 .Methods . . . . . . . . . . . . . . . . . . . . . . . . . . . . . . . . . . . . . . . . . . . . . . . . . . . . . . . . . . . . . . . . . . . . . . . . . . . . . . . . . . . . . . . . . . . . . . . . . . . . . . . . . . . . . . . . . . . 12
2 .2 .Results . . . . . . . . . . . . . . . . . . . . . . . . . . . . . . . . . . . . . . . . . . . . . . . . . . . . . . . . . . . . . . . . . . . . . . . . . . . . . . . . . . . . . . . . . . . . . . . . . . . . . . . . . . . . . . . . . . . 152.2a Narrow Definition . . . . . . . . . . . . . . . . . . . . . . . . . . . . . . . . . . . . . . . . . . . . . . . . . . . . . . . . . . . . . . . . . . . . . . . . . . . . . . . . . . . . . . . . . . . . . . . . . . . . . . . .152.2b Broad Definition . . . . . . . . . . . . . . . . . . . . . . . . . . . . . . . . . . . . . . . . . . . . . . . . . . . . . . . . . . . . . . . . . . . . . . . . . . . . . . . . . . . . . . . . . . . . . . . . . . . . . . . . 18
2 .3 .Limitations . . . . . . . . . . . . . . . . . . . . . . . . . . . . . . . . . . . . . . . . . . . . . . . . . . . . . . . . . . . . . . . . . . . . . . . . . . . . . . . . . . . . . . . . . . . . . . . . . . . . . . . . . . . . . . . .20
2 .4 .Discussion .and .Putting .the .results .in .context . . . . . . . . . . . . . . . . . . . . . . . . . . . . . . . . . . . . . . . . . . . . . . . . . . . . . . . . . . . . . . . . . . . . . . . . . . . . . . . . . . 21
2 .5 .Summary .of .Key .Findings . . . . . . . . . . . . . . . . . . . . . . . . . . . . . . . . . . . . . . . . . . . . . . . . . . . . . . . . . . . . . . . . . . . . . . . . . . . . . . . . . . . . . . . . . . . . . . . . . . .22
2 .6 .Future .Directions . . . . . . . . . . . . . . . . . . . . . . . . . . . . . . . . . . . . . . . . . . . . . . . . . . . . . . . . . . . . . . . . . . . . . . . . . . . . . . . . . . . . . . . . . . . . . . . . . . . . . . . . . .24
Section 3: Overview of State Policies . . . . . . . . . . . . . . . . . . . . . . . . . . . . . . . . . . . . . . . . . . . . . . . . . . . . . . . . . . . . . . . . . . . . . . . . . . . . . . . . . . . . . . . 27
Section 4: Implications . . . . . . . . . . . . . . . . . . . . . . . . . . . . . . . . . . . . . . . . . . . . . . . . . . . . . . . . . . . . . . . . . . . . . . . . . . . . . . . . . . . . . . . . . . . . . . . . . . . . . 33
Bibliography . . . . . . . . . . . . . . . . . . . . . . . . . . . . . . . . . . . . . . . . . . . . . . . . . . . . . . . . . . . . . . . . . . . . . . . . . . . . . . . . . . . . . . . . . . . . . . . . . . . . . . . . . . . . . . . . . 34
Appendices . . . . . . . . . . . . . . . . . . . . . . . . . . . . . . . . . . . . . . . . . . . . . . . . . . . . . . . . . . . . . . . . . . . . . . . . . . . . . . . . . . . . . . . . . . . . . . . . . . . . . . . . . . . . . . . . . . 36Appendix 2.1: Percent .Primary .Care .Spend .Across .States .by .Age .Compared .to .National .Average—Narrow .Definition . . . . . . . . . . . . . . . . . . . . . . . .36
Appendix 2.2: Distribution .by .Age .and .Gender .Across .States .Compared .to .National .Average . . . . . . . . . . . . . . . . . . . . . . . . . . . . . . . . . . . . . . . . . . . . 37
FiguresFigure .1 .1: .Health .Care .Spending . . . . . . . . . . . . . . . . . . . . . . . . . . . . . . . . . . . . . . . . . . . . . . . . . . . . . . . . . . . . . . . . . . . . . . . . . . . . . . . . . . . . . . . . . . . . . . . . . . 8
Figure .1 .2: .Shared .Principles .of .Primary .Care . . . . . . . . . . . . . . . . . . . . . . . . . . . . . . . . . . . . . . . . . . . . . . . . . . . . . . . . . . . . . . . . . . . . . . . . . . . . . . . . . . . . . . . 9
Figure .1 .3: .Impact .of .PCMH .on .Cost .Quality .and .Utilization .2016-2017: .Summary .of .Peer-Reviewed .Articles . . . . . . . . . . . . . . . . . . . . . . . . . . . . . . . . 10
Figure .1 .4: .Impact .of .PCMH .Physicians .on .ACO .Success . . . . . . . . . . . . . . . . . . . . . . . . . . . . . . . . . . . . . . . . . . . . . . . . . . . . . . . . . . . . . . . . . . . . . . . . . . . . . . 11
Table .2 .1: .PC .Spend .Definitions .by .Organizations .and .Select .States . . . . . . . . . . . . . . . . . . . . . . . . . . . . . . . . . . . . . . . . . . . . . . . . . . . . . . . . . . . . . . . . . . . 13
Table .2 .2: .Percent .PC .Spend .Across .States .by .PC .Definition .Compared .to .National .Average . . . . . . . . . . . . . . . . . . . . . . . . . . . . . . . . . . . . . . . . . . . . . . 16
Figure .2 .1: .National .Percent .PC .Spend–Narrow .by .Age . . . . . . . . . . . . . . . . . . . . . . . . . . . . . . . . . . . . . . . . . . . . . . . . . . . . . . . . . . . . . . . . . . . . . . . . . . . . . . 17
Figure .2 .2: .National .Percent .PC .Spend–Narrow .by .Payer .Type . . . . . . . . . . . . . . . . . . . . . . . . . . . . . . . . . . . . . . . . . . . . . . . . . . . . . . . . . . . . . . . . . . . . . . . 17
Table .2 .3a: .Percent .PC .Spend–Narrow .Across .States .by .Payer .Type .Compared .to .National .Average .(50 .states) . . . . . . . . . . . . . . . . . . . . . . . . . . . . 18
Table .2 .3b: .Percent .PC .Spend–Broad .Across .States .by .Payer .Type .Compared .to .National .Average .(50 .states) . . . . . . . . . . . . . . . . . . . . . . . . . . . . . . . . 18
Figure .2 .3: .PC .Spend–Narrow .vs . .Percent .with .at .Least .One .ED .Visit .in .Last .12 .Months . . . . . . . . . . . . . . . . . . . . . . . . . . . . . . . . . . . . . . . . . . . . . . . . . 19
Figure .2 .4: .PC .Spend–Narrow .Vs . .Percent .with .at .Least .One .Hospitalization .in .Last .12 .months . . . . . . . . . . . . . . . . . . . . . . . . . . . . . . . . . . . . . . . . . . . 19
Figure .2 .5: .PC .Spend–Narrow .Vs . .Percent .Avoidable .Hospitalization . . . . . . . . . . . . . . . . . . . . . . . . . . . . . . . . . . . . . . . . . . . . . . . . . . . . . . . . . . . . . . . . . . 19
Figure .2 .6: .Percent .PC .Spend .by .Private .and .Medicare . . . . . . . . . . . . . . . . . . . . . . . . . . . . . . . . . . . . . . . . . . . . . . . . . . . . . . . . . . . . . . . . . . . . . . . . . . . . .20
Figure .2 .7: .Percent .PC .Spend .by .Private .and .Medicaid . . . . . . . . . . . . . . . . . . . . . . . . . . . . . . . . . . . . . . . . . . . . . . . . . . . . . . . . . . . . . . . . . . . . . . . . . . . . . .20
Figure .2 .8: .Percent .PC .Spend .by .Medicaid .and .Medicare . . . . . . . . . . . . . . . . . . . . . . . . . . . . . . . . . . . . . . . . . . . . . . . . . . . . . . . . . . . . . . . . . . . . . . . . . . . .20
Table .2 .4: .Primary .Care .Definitions . . . . . . . . . . . . . . . . . . . . . . . . . . . . . . . . . . . . . . . . . . . . . . . . . . . . . . . . . . . . . . . . . . . . . . . . . . . . . . . . . . . . . . . . . . . . . .24
Table .2 .5: .PC .Spend .Definitions . . . . . . . . . . . . . . . . . . . . . . . . . . . . . . . . . . . . . . . . . . . . . . . . . . . . . . . . . . . . . . . . . . . . . . . . . . . . . . . . . . . . . . . . . . . . . . . . .25
Table .3 .1: .Comparison .of .Rhode .Island .and .Oregon . . . . . . . . . . . . . . . . . . . . . . . . . . . . . . . . . . . . . . . . . . . . . . . . . . . . . . . . . . . . . . . . . . . . . . . . . . . . . . . . . 27
Table .3 .2: .State .Primary .Care .Investment .Efforts . . . . . . . . . . . . . . . . . . . . . . . . . . . . . . . . . . . . . . . . . . . . . . . . . . . . . . . . . . . . . . . . . . . . . . . . . . . . . . . . . .29
Box .3 .1: .Rhode .Island .Case .Study . . . . . . . . . . . . . . . . . . . . . . . . . . . . . . . . . . . . . . . . . . . . . . . . . . . . . . . . . . . . . . . . . . . . . . . . . . . . . . . . . . . . . . . . . . . . . . . .30
Table .3 .3: .States .that .Have .Introduced, .but .Not .Yet .Passed, .Legislation . . . . . . . . . . . . . . . . . . . . . . . . . . . . . . . . . . . . . . . . . . . . . . . . . . . . . . . . . . . . . . . 31
Box .3 .2: .Oregon .Case .Study . . . . . . . . . . . . . . . . . . . . . . . . . . . . . . . . . . . . . . . . . . . . . . . . . . . . . . . . . . . . . . . . . . . . . . . . . . . . . . . . . . . . . . . . . . . . . . . . . . . . . 32
Patient-Centered Primary Care Collaborative and the Robert Graham Center PAGE 3
Dear Colleagues:
2019 has been an important year for both federal and state efforts focused on strengthening primary care to enhance performance of the U.S. health system.
So far this year, the Center for Medicare & Medicaid Innovation (CMMI) has introduced five new voluntary primary care payment and delivery models. In addition, seven states have introduced/passed legislation or issued executive orders to measure, and eventually increase, primary care investment without growing overall health care spending. State leaders are focused on furthering population health within their jurisdictions and curbing cost increases.
This report—Investing in Primary Care: A State-Level Analysis—can inform the efforts of both state and national leaders. It provides quantitative data and analysis of primary care spend at the state and payer levels, as well as a window into the association between primary care spend and key patient outcomes. In short, the report shows that primary care investment as a percentage of total health care expenditures was low between 2011 and 2016, and it varied considerably across states and across payers. The analysis also shows an association between more primary care investment and better patient outcomes. Finally, the report includes a description of legislative/regulatory efforts in 10 states to measure and report on primary care spend and to shift more resources into primary care.
A review of state leaders’ efforts related to primary care investment shows that nearly all have set up multistakeholder collaboratives to guide their work. This is a strong signal to the broader community that it should be similarly collaborative, bringing a variety of unique contributions and expertise to the table to further primary care.
For example, health plans can build upon the support they provide to patient-centered medical homes (PCMHs) and work in conjunction with state leaders to provide analytic support for initiatives to measure and report on primary care spend. This includes informing efforts to account for non–claims-based primary care spending. Employers can evolve their benefit designs to reduce patient barriers to primary care. Those in self-insured arrangements can decide to report on primary care spend and adopt related targets, even while they are not required to do so. Researchers and quality measurement experts can advance the field by publishing new studies focused on primary care investment and by providing input to organizations working to establish a standard measure for primary care spend. Foundations can support efforts to gain consensus around a standard primary care spend measure, fund future research in this area, and support efforts to disseminate information across states to avoid reinventing the wheel.
The primary care community alone cannot reorient the U.S. health system towards primary care. It will take a village to be successful, but the benefits will accrue to the nation.
Kind regards,
Ann GreinerPresident and CEO, Patient-Centered Primary Care Collaborative
PAGE 4 Investing in Primary Care: A State-Level Analysis
Topline ResultsRelative to its international counterparts, the United States underinvests in primary care, as reflected in spending by both public and private payers. On average, the United States spends 5%-7% on primary care as a percentage of total health care spending. By comparison, Organisation for Economic Co-operation and Development (OECD) countries average 14% spending on primary care.
This underinvestment represents a major disconnect given the robust evidence base showing that health systems with a primary care orientation have superior patient outcomes, fewer inequities, and lower costs. On these key attributes, performance of the U.S. health system pales in comparison to systems in other industrialized nations.
In a first-of-its-kind study, the 2019 Patient-Centered Primary Care Collaborative (PCPCC) Evidence Report examines states’ primary care spending patterns, including spending across payer types, and considers the implications of these results for select patient outcomes.
More specifically, the 2019 PCPCC Evidence Report finds:
y There is a lack of agreement about how to measure primary care investment. Consequently, this report includes two leading approaches that reflect a narrow definition and a broad definition of primary care spend.
y Between 2011 and 2016, spending on primary care as a percentage of overall health care expenditures was low. It varied considerably across states, across payer types, and across age groups.
y The national average for primary care spend across public and private payers was 5.6% using a narrow definition, as compared to 10.2% using a broad definition.
y An association was found between increased primary care spend and fewer emergency department visits, total hospitalizations, and hospitalizations for ambulatory care-sensitive conditions. Given the limitations of our data set, we cannot conclude that this is causal, but it is a relationship replicated in the research literature.
y Minnesota had the highest percentage of primary care investment using both narrow and broad definitions, and performed well with respect to patient outcomes. Connecticut had the lowest primary care spend using the narrow definition. Using the broad definition, New Jersey’s primary care spend was lowest. No pattern was observed for primary care spend by region.
State leaders have a growing interest in using their legislative and regulatory authority to measure and report on primary care spend and, in some cases, to set targets for increasing investment in primary care over the coming years within their jurisdictions. This report provides a high-level description of such efforts in 10 states, seven of which initiated their efforts in 2019. This focus on primary care spend and primary care investment suggests policymakers have some momentum to shift the U.S. delivery system back to its primary care foundation, so that it can better address diverse patient needs across different age and sociodemographic groups.
Patient-Centered Primary Care Collaborative and the Robert Graham Center PAGE 5
Executive Summary
IMPORTANCE OF THE RESEARCH
Consistent and growing evidence shows that primary care-oriented systems achieve better health outcomes, more health equity, and lower costs. Yet, despite this strong evidence that primary care is associated with the outcomes that policymakers and patients seek, such care has been chronically underfunded in the United States. On average, the United States invests 5%-7% of total health care spending on primary care. Health systems in other industrialized nations spend twice that or more (e.g., the average among OECD countries is 14%) .
This underinvestment in primary care has significant consequences. It thwarts the ability of primary care practices to provide patients with the personal attention and scope of services that they want and need, and it has negative implications for the robustness of advanced primary care models such as the patient-centered medical home (PCMH). Underinvestment in primary care is related to the U.S. payment system, which is still largely focused on fee-for-service (FFS) payment. FFS payment rewards provision of more health care services rather than rewarding efforts to prevent patients from getting sick in the first place. It overvalues procedures and interventions at the expense of cognitive health care services that are key to the management of chronic conditions.
A number of national and state leaders are calling for a reorientation of the nation’s health care system toward primary care in light of the growing evidence base showing its value. This report provides quantitative data and analysis of primary care spend at the state and payer levels; a window into the
association between primary care spend and key patient outcomes; and a description of state-level efforts to measure primary care spend and shift more resources into primary care. This research is particularly useful for state-level policymakers who can influence health care spending priorities. These leaders are in the challenging position of having to balance their state’s budget—of which health care-related expenses are a large part—on an annual basis.
RESEARCH AND FINDINGS
Research Question. This analysis sought to report a national average for primary care spend and to understand if such spending differs across states and types of payers. Researchers also examined investment in primary care and its association with key patient outcomes. In addition, 10 recent state legislative and regulatory efforts to invest more in primary care were examined.
Methods. Researchers at The Robert Graham Center for Policy Studies in Family Medicine and Primary Care pooled data from the 2011-2016 Medical Expenditure Panel Survey (MEPS) to examine and compare cross-sectional variation in primary care investment at the state level. Given limitations of the MEPS data, they were able to report results for 29 out of 50 states and conduct subgroup analysis by the following payer types: commercial, Medicare, Medicaid/SCHIP, dual eligible, and the uninsured. MEPS is an annual survey of 30,000 to 35,000 U.S. civilians; it excludes those in institutions and oversamples for key demographic groups. Because MEPS provides national estimates of annual health care insurance coverage, utilization, and expenditures based on interviewee recall, the data have some limitations.
PAGE 6 Investing in Primary Care: A State-Level Analysis
Multiple definitions of primary care spend exist domestically and internationally, making comparisons of primary care spend challenging. To mitigate these challenges, researchers reported a narrow definition and a broad definition of primary care spend by state and by payer. Both measures were based on office-based and outpatient expenditures. The narrow definition focused on spending related to primary care physicians in offices and outpatient settings. The broad definition included all of the above, plus other members of the primary care clinical team, including nurses, nurse practitioners (NPs), physician assistants (PAs), OB/GYNs, and behavioral health professionals (i.e., psychiatrists, psychologists, and social workers). The PCPCC favors the broad definition and also sees merit in definitions of primary care spend that include non-clinical staff (e.g., community health workers) and infrastructure investments.
Results. Using aggregated data from 50 states, the analysis showed a national average for primary care investment of 5.6% using the narrow definition and 10.2% using the broad definition. There was significant variability across the 29 states included in the study. Minnesota had the highest primary care investment rate using both the narrow (7.6%) and broad definitions (14.0%). Connecticut had the lowest primary care spend (3.5%) using the narrow definition, and New Jersey had the lowest using the broad definition (8.2%).
Further analysis that examined associations between primary care investment and three outcomes—total hospitalizations, hospitalizations for ambulatory care-sensitive conditions, and emergency department visits—found an inverse association. In other words, as primary care investment increased, both hospital outcomes and emergency department visits decreased. Causality or directionality cannot
be inferred here because of an inability to control confounders other than population size. However, in the research literature, studies have shown this kind of relationship. The association between primary care investment and patient satisfaction was not statistically significant.
In addition, a review of legislative and regulatory efforts in 10 states showed that state policymakers had increased momentum, with efforts in seven of the 10 states initiated in 2019. A review of the seven initiatives that made it into law or executive order identified some common themes. These efforts generally included setting up some kind of multistakeholder collaboration in order to get diverse input on defining and measuring primary care spend and on establishing a mechanism for collecting and reporting related data. Some efforts set goals for what the community wishes to achieve with increased primary care investment, and some set primary care spend targets to achieve during a given time period. In many cases, the legislation that passed built on previous legislation or statutory efforts, with leaders iterating to reach future goals.
Implications. Regular measurement of primary care spend at the national and state levels can heighten visibility of how public and private payers value primary care over time and by comparison to their other health care expenditures. The PCPCC’s first-of-its-kind report demonstrates that such reporting is feasible. The robust and growing evidence base about the value of primary care underscores the importance of reporting such measures.
Given the growing number of states that have recently introduced bills, enacted legislation, or issued executive orders to measure primary care spend with the goal of increasing such investment, the findings in this report—both analytic and descriptive—are timely and relevant.
Patient-Centered Primary Care Collaborative and the Robert Graham Center PAGE 7
SECTION 1
Introduction1.1 THE CASE FOR HIGHER INVESTMENT IN PRIMARY CARE
There is consistent and growing evidence that primary care-oriented health care systems achieve better health outcomes, more health equity, and lower costs.1-5 In the United States and elsewhere, such systems are associated not only with lower mortality and fewer heart disease and cancer deaths, but also with decreased rates of low birthweight and infant mortality and increased self-rated health scores.1,4 Research published in 2019 found that having 10 additional primary care physicians in an area was associated with a 51.5-day increase in life expectancy. This compared to a much more modest 19.2-day increase when adding the same number of subspecialists.5
There is strong evidence that primary care is associated with the outcomes policymakers and patients seek, but such care has been chronically underfunded in the United States. This underinvestment
in primary care is multifaceted and is reflected in dollars invested, types of services rendered, organizational attention/prioritization, funding for residency training programs, and many other dimensions.
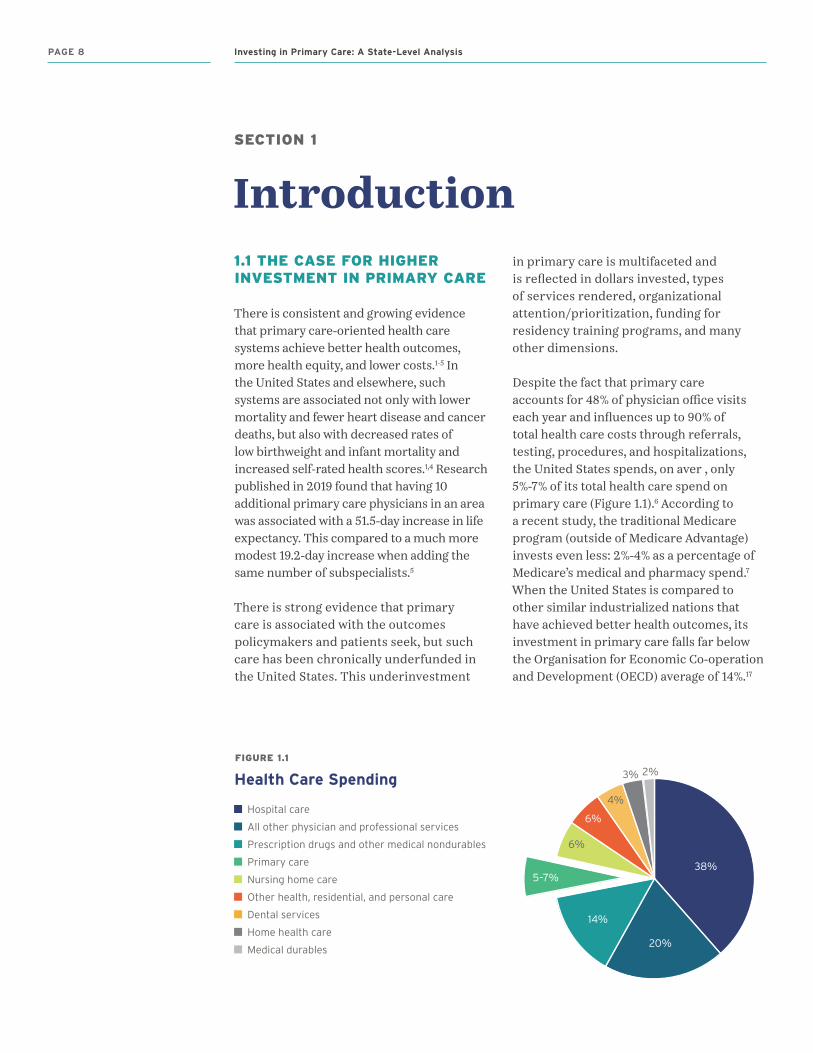
Despite the fact that primary care accounts for 48% of physician office visits each year and influences up to 90% of total health care costs through referrals, testing, procedures, and hospitalizations, the United States spends, on aver , only 5%-7% of its total health care spend on primary care (Figure 1.1).6 According to a recent study, the traditional Medicare program (outside of Medicare Advantage) invests even less: 2%-4% as a percentage of Medicare’s medical and pharmacy spend.7 When the United States is compared to other similar industrialized nations that have achieved better health outcomes, its investment in primary care falls far below the Organisation for Economic Co-operation and Development (OECD) average of 14%.17
FIGURE 1.1
Health Care Spending
Hospital care
All other physician and professional services
Prescription drugs and other medical nondurables
Primary care
Nursing home care
Other health, residential, and personal care
Dental services
Home health care
Medical durables
38%
20%
14%
5–7%
6%
6%
4%
3% 2%
PAGE 8 Investing in Primary Care: A State-Level Analysis
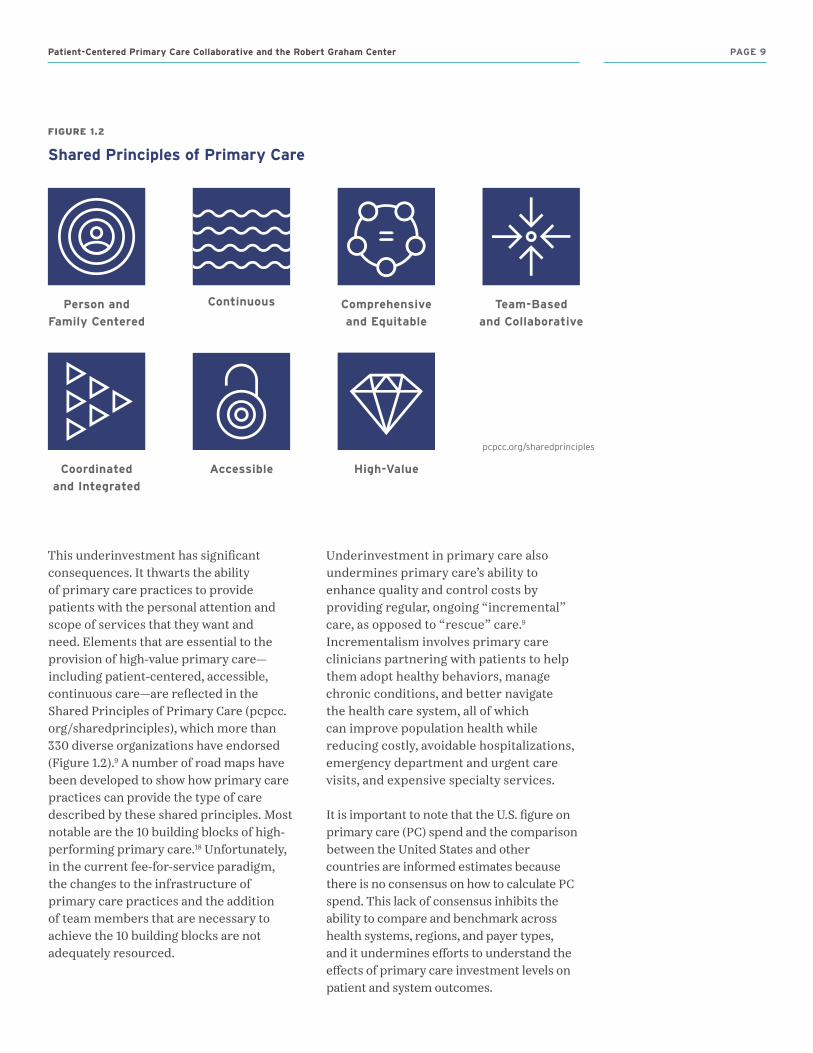
This underinvestment has significant consequences. It thwarts the ability of primary care practices to provide patients with the personal attention and scope of services that they want and need. Elements that are essential to the provision of high-value primary care—including patient-centered, accessible, continuous care—are reflected in the Shared Principles of Primary Care (pcpcc.org/sharedprinciples), which more than 330 diverse organizations have endorsed (Figure 1.2).9 A number of road maps have been developed to show how primary care practices can provide the type of care described by these shared principles. Most notable are the 10 building blocks of high-performing primary care.18 Unfortunately, in the current fee-for-service paradigm, the changes to the infrastructure of primary care practices and the addition of team members that are necessary to achieve the 10 building blocks are not adequately resourced.
Underinvestment in primary care also undermines primary care’s ability to enhance quality and control costs by providing regular, ongoing “incremental” care, as opposed to “rescue” care.9
Incrementalism involves primary care clinicians partnering with patients to help them adopt healthy behaviors, manage chronic conditions, and better navigate the health care system, all of which can improve population health while reducing costly, avoidable hospitalizations, emergency department and urgent care visits, and expensive specialty services.
It is important to note that the U.S. figure on primary care (PC) spend and the comparison between the United States and other countries are informed estimates because there is no consensus on how to calculate PC spend. This lack of consensus inhibits the ability to compare and benchmark across health systems, regions, and payer types, and it undermines efforts to understand the effects of primary care investment levels on patient and system outcomes.
FIGURE 1.2
Shared Principles of Primary Care
Person and
Family Centered
Continuous Comprehensive
and Equitable
Team-Based
and Collaborative
Coordinated
and Integrated
Accessible High-Value
pcpcc.org/sharedprinciples
Patient-Centered Primary Care Collaborative and the Robert Graham Center PAGE 9
1.2 INVESTING IN PRIMARY CARE: WHAT HAVE WE LEARNED SO FAR?
In 2007, to address the issue of chronic underinvestment in primary care and to improve primary care delivery, leaders of U.S. physician specialty societies joined with employers to identify the key structural and procedural components of comprehensive, high-quality primary care. They focused on an advanced primary care model called the patient-centered medical home (PCMH).10 The PCMH is a team-based health care delivery model that organizes care to be comprehensive, patient-centered, coordinated, accessible, and high quality. This model aims to maximize health outcomes by transforming primary care’s structure and delivery.11 The
Shared Principles, adopted by the PCPCC in 2017, build on the 2007 Patient-Centered Medical Home Joint Principles and include seven important attributes of advanced primary care: person and family centered, continuous, comprehensive and equitable, team based and collaborative, coordinated and integrated, accessible, and high value.
The PCMH has been widely adopted by health plans and states, and a version of the model—Comprehensive Primary Care Plus (CPC+)—has been promulgated by the Center for Medicare & Medicaid Innovation (pcpcc.org/2018EvidenceReport). Currently, close to 20% of primary care physicians practice in a PCMH.32
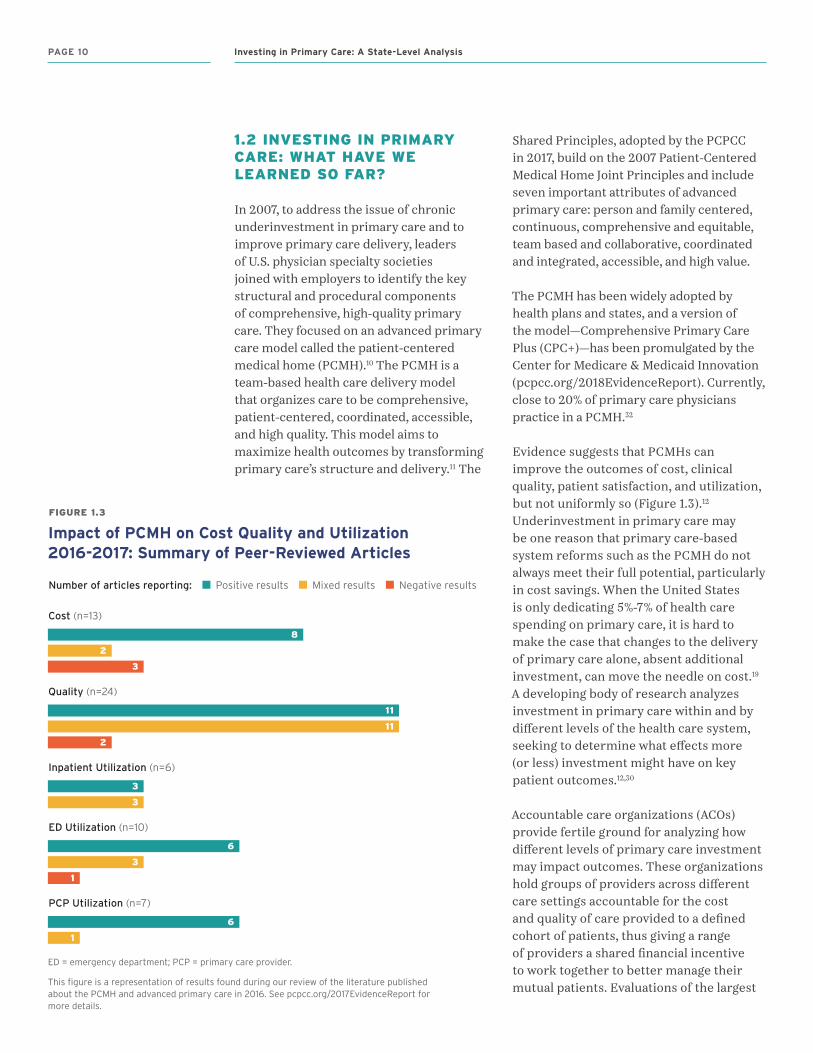
Evidence suggests that PCMHs can improve the outcomes of cost, clinical quality, patient satisfaction, and utilization, but not uniformly so (Figure 1.3).12 Underinvestment in primary care may be one reason that primary care-based system reforms such as the PCMH do not always meet their full potential, particularly in cost savings. When the United States is only dedicating 5%-7% of health care spending on primary care, it is hard to make the case that changes to the delivery of primary care alone, absent additional investment, can move the needle on cost.19 A developing body of research analyzes investment in primary care within and by different levels of the health care system, seeking to determine what effects more (or less) investment might have on key patient outcomes.12,30
Accountable care organizations (ACOs) provide fertile ground for analyzing how different levels of primary care investment may impact outcomes. These organizations hold groups of providers across different care settings accountable for the cost and quality of care provided to a defined cohort of patients, thus giving a range of providers a shared financial incentive to work together to better manage their mutual patients. Evaluations of the largest
FIGURE 1.3
Impact of PCMH on Cost Quality and Utilization 2016-2017: Summary of Peer-Reviewed Articles
Number .of .articles .reporting: . Positive results Mixed results Negative results
Cost .(n=13)
8
2
3
Quality .(n=24)
11
11
2
Inpatient .Utilization .(n=6)
3
3
ED .Utilization .(n=10)
6
3
1
PCP .Utilization .(n=7)
6
1
ED = emergency department; PCP = primary care provider.
This figure is a representation of results found during our review of the literature published about the PCMH and advanced primary care in 2016. See pcpcc.org/2017EvidenceReport for more details.
PAGE 10 Investing in Primary Care: A State-Level Analysis
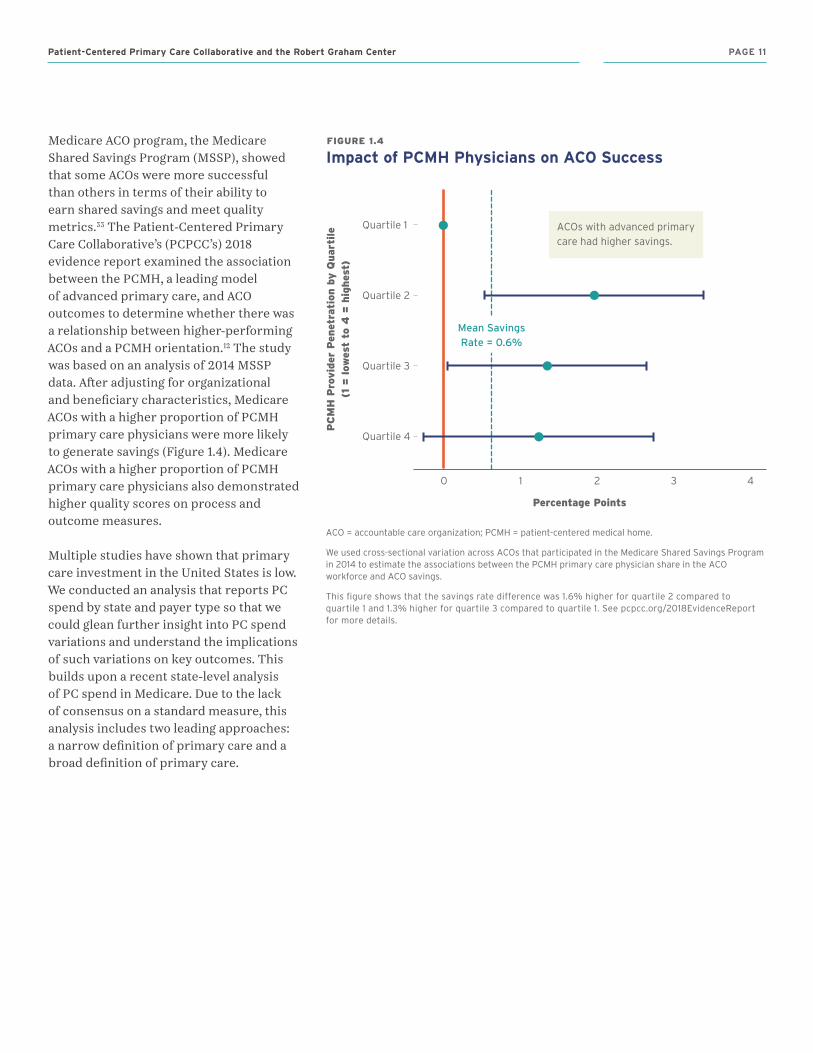
Medicare ACO program, the Medicare Shared Savings Program (MSSP), showed that some ACOs were more successful than others in terms of their ability to earn shared savings and meet quality metrics.33 The Patient-Centered Primary Care Collaborative’s (PCPCC’s) 2018 evidence report examined the association between the PCMH, a leading model of advanced primary care, and ACO outcomes to determine whether there was a relationship between higher-performing ACOs and a PCMH orientation.12 The study was based on an analysis of 2014 MSSP data. After adjusting for organizational and beneficiary characteristics, Medicare ACOs with a higher proportion of PCMH primary care physicians were more likely to generate savings (Figure 1.4). Medicare ACOs with a higher proportion of PCMH primary care physicians also demonstrated higher quality scores on process and outcome measures.
Multiple studies have shown that primary care investment in the United States is low. We conducted an analysis that reports PC spend by state and payer type so that we could glean further insight into PC spend variations and understand the implications of such variations on key outcomes. This builds upon a recent state-level analysis of PC spend in Medicare. Due to the lack of consensus on a standard measure, this analysis includes two leading approaches: a narrow definition of primary care and a broad definition of primary care.
FIGURE 1.4
Impact of PCMH Physicians on ACO Success
Quartile 1
Quartile 2
Quartile 3
Quartile 4
0 1 2 3 4
Percentage Points
PC
MH
Pro
vid
er P
enet
rati
on b
y Q
uar
tile
(1
= low
est
to 4
= h
ighes
t)
Mean .Savings . .Rate .= .0 .6%
ACOs with advanced primary care had higher savings.
ACO = accountable care organization; PCMH = patient-centered medical home.
We used cross-sectional variation across ACOs that participated in the Medicare Shared Savings Program in 2014 to estimate the associations between the PCMH primary care physician share in the ACO workforce and ACO savings.
This figure shows that the savings rate difference was 1.6% higher for quartile 2 compared to quartile 1 and 1.3% higher for quartile 3 compared to quartile 1. See pcpcc.org/2018EvidenceReport for more details.
Patient-Centered Primary Care Collaborative and the Robert Graham Center PAGE 11
SECTION 2
State by State Analysis of Primary Care SpendIn this section, we analyze the percent of primary care (PC) spend by state using the Medical Expenditure Panel Survey (MEPS). This analysis uses both a narrow definition and a broad definition of primary care to calculate PC spend. Since different states and researchers continue to have different definitions for PC spend, we felt it was important to use the two most prevalent approaches until a consensus is reached on a definition for primary care. We also use data from four different payer types in this analysis: (1) private insurance; (2) Medicare; (3) Medicaid, and (4) uninsured.
Previous analyses have calculated percent PC spend at a national level14 or a state level using a single payer.7 This novel analysis is the first attempt at calculating state-level PC spend by all payer types (private, public, and uninsured) and is an initial step toward highlighting state variation in PC spend level by payer and by state. We also assess associations between the PC spend in a state and utilization outcomes such as emergency department (ED) visits, ambulatory care-sensitive hospitalizations (ACSH), and total hospitalizations (TH).
2.1 METHODS
Data Source
Using pooled data from the 2011-2016 MEPS (N=216,814), we examined and compared cross-sectional variation in
state-level investment on primary care. In addition, we investigated the association between PC spend and three health care use measures: (1) ED use; (2) ambulatory care-sensitive hospitalizations; and (3) total hospitalizations. The American Academy of Family Physicians (AAFP) Institutional Review Board exempted this study because it involved secondary data analysis.
MEPS Details
During each round, using computer assisted personal interviewing technology, each respondent is asked their insurance status, health care use, and expenditures incurred for each of the services used. The data that is used to calculate expenditures is gathered from two sources, the household respondent and their providers. Prior to being surveyed, household respondents have received a packet of information that guides them in collecting and recording data about the services they have received during the year. Household respondents are asked to show their insurance card, policy booklet or medical expense reports to the MEPS interviewer for insurance validation purposes.
Data is then collected from a sample of providers that are identified by MEPS respondents (physicians, hospitals, home health agencies, and pharmacies) and is used to supplement and validate the respondents answers. In addition, the MEPS data is imputed based on known regional costs by condition, visit type and payer.
PAGE 12 Investing in Primary Care: A State-Level Analysis
Although MEPS is designed mainly to provide valid and representative estimates at the national and regional levels, it does allow estimation of select measures with enough precision for 29 larger states.13
Measures
Primary Care Definition
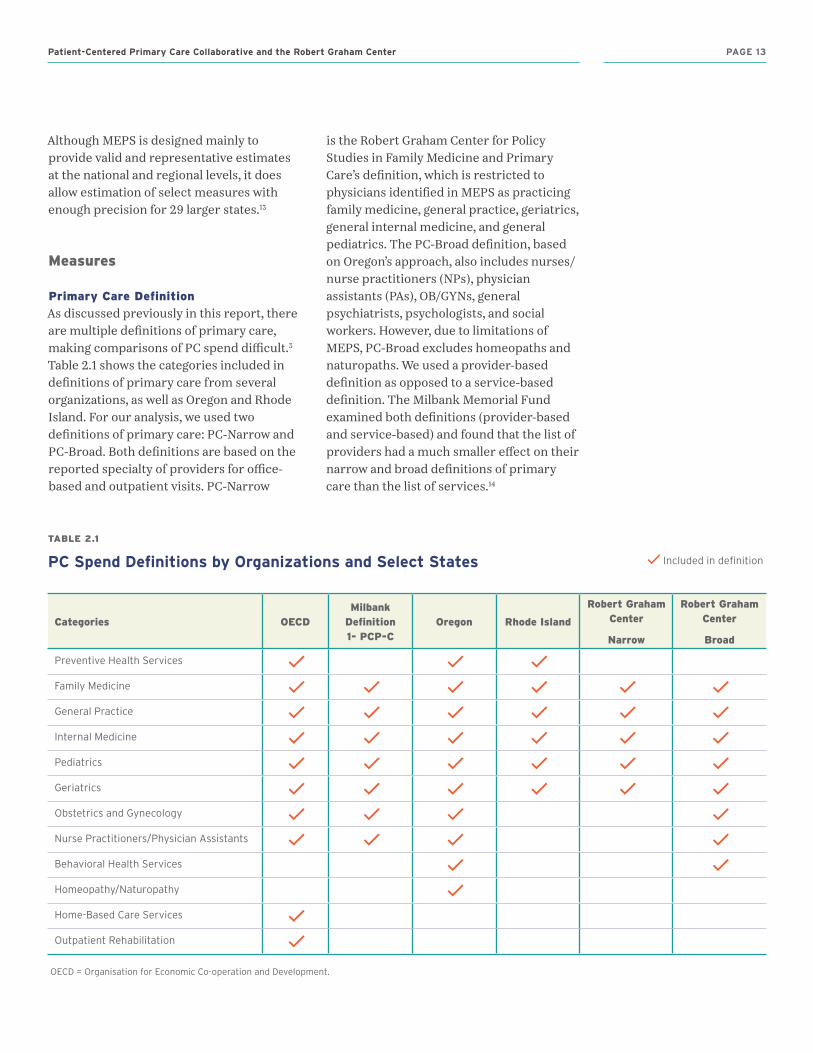
As discussed previously in this report, there are multiple definitions of primary care, making comparisons of PC spend difficult.3 Table 2.1 shows the categories included in definitions of primary care from several organizations, as well as Oregon and Rhode Island. For our analysis, we used two definitions of primary care: PC-Narrow and PC-Broad. Both definitions are based on the reported specialty of providers for office-based and outpatient visits. PC-Narrow
is the Robert Graham Center for Policy Studies in Family Medicine and Primary Care’s definition, which is restricted to physicians identified in MEPS as practicing family medicine, general practice, geriatrics, general internal medicine, and general pediatrics. The PC-Broad definition, based on Oregon’s approach, also includes nurses/nurse practitioners (NPs), physician assistants (PAs), OB/GYNs, general psychiatrists, psychologists, and social workers. However, due to limitations of MEPS, PC-Broad excludes homeopaths and naturopaths. We used a provider-based definition as opposed to a service-based definition. The Milbank Memorial Fund examined both definitions (provider-based and service-based) and found that the list of providers had a much smaller effect on their narrow and broad definitions of primary care than the list of services.14
TABLE 2.1
PC Spend Definitions by Organizations and Select States
Categories OECDMilbank
Definition 1- PCP-C
Oregon Rhode Island
Robert Graham Center
Narrow
Robert Graham Center
Broad
Preventive Health Services
Family Medicine
General Practice
Internal Medicine
Pediatrics
Geriatrics
Obstetrics and Gynecology
Nurse Practitioners/Physician Assistants
Behavioral Health Services
Homeopathy/Naturopathy
Home-Based Care Services
Outpatient Rehabilitation
OECD = Organisation for Economic Co-operation and Development.
Included in definition
Patient-Centered Primary Care Collaborative and the Robert Graham Center PAGE 13
Nurses/NPs/PAs were included as primary care providers irrespective of whether they practiced primary care or not because it is not possible within MEPS to designate the difference. In addition, in the hierarchy employed by MEPS, a visit that includes an encounter with a nurse/NP/PA and a physician is coded for the latter but not the former. Despite this limitation, we included NPs and PAs in the PC-Broad definition because many do practice in primary care.15
Similarly, for behavioral health services, we could not differentiate general psychiatry from subspecialties because MEPS does not code them separately.
Health Care Expenditures
MEPS includes health care expenditures for nine broad categories:
1. Outpatient2. Office-based 3. Hospitalizations 4. Emergency department 5. Prescription medications6. Vision care7. Dental care8. Home health care 9. Other medical category
We combined outpatient and office-based services, and we used provider type and physician specialty to identify spending associated with primary care (defined either broadly or narrowly), subspecialist physicians, and other non-physicians.
Demographic Characteristics
and Payer Type
Demographic characteristics included age and gender. To capture primary care spending, respondents were grouped into 12 age categories: under 5 years; 5-9 years; 10-14 years; 15-17 years; 18-24 years; 25-34 years; 35-44 years; 45-54 years; 55-64 years; 65-74 years; 75-84 years; and 85 years and older. Insurance coverage was divided into three types: (1) private; (2) public; and
(3) uninsured. The public category was further divided into Medicare or Medicaid/State Children’s Health Insurance Program (SCHIP) coverage. MEPS does not include a separate category for SCHIP because of the small cell sizes.
MEPS uses the following definitions for classifying insurance type:
y Private: Respondents who were covered by private insurance at any time during the calendar year
y Public: Respondents who were never covered by private insurance but were covered by public insurance at any time during the calendar year
y Uninsured: Respondents who were uninsured throughout the entire calendar year
Medicare and Medicaid/SCHIP designation is based on month-to-month coverage and imputations. Therefore, although the percentage of private, public, and uninsured respondents equaled 100%, the percentage of respondents covered by Medicare or Medicaid/SCHIP did not equal the percentage of respondents in the public category.
Health Outcomes
Our outcome variables were ED use, ambulatory care-sensitive hospitalizations, and total hospitalizations. We identified ambulatory care-sensitive conditions based on the AHRQ Prevention Quality Indicators (PQIs).16 MEPS restricts ICD-9 codes to three digits to preserve confidentiality of the respondents, so broader Clinical Classification Codes (CCCs) were used to identify ambulatory care-sensitive conditions.13 These conditions include diabetes, asthma, chronic obstructive pulmonary disease (COPD), hypertension, pneumonia, urinary tract infection (UTI),
PAGE 14 Investing in Primary Care: A State-Level Analysis
dehydration, pediatric gastroenteritis, perforated appendix, short-term and long-term complications of diabetes, angina without procedure, and congestive heart failure (CHF).16
Analysis
We carried out all the analysis using Stata 15.0 (College Station, TX) at AHRQ headquarters in Rockville, MD. Although respondents are sampled across all the states, AHRQ allows estimates that include only the 29 states with the largest populations because the sample sizes for the remaining states are smaller and estimates lack sufficient precision. Given the oversampling of certain populations, data were weighted.
We first calculated descriptive statistics for all the demographic characteristics, insurance coverage, and health outcomes within each state. Then, we calculated the share of PC spend out of the total health care expenditures.
To calculate the PC spend, we calculated the aggregate measures of spending for all nine expenditure categories for each of the 29 states. We summed them to obtain a state-level total health care expenditure, which was the denominator. The expenditure toward primary care was the numerator. For each of the 29 states, we calculated the share of PC spend by dividing the primary care expenditure by the total health care expenditure. We also calculated PC spend on the national level for both our narrow and broad definitions using aggregated data from all 50 states.
State-level percentages of PC spend were also calculated by gender, age, and payer type. Proportions were also calculated by state for gender, age level, and payer type.
For each of the 29 states, we calculated the percentage of the population with at least one ED visit and the percentage of the population with at least one hospitalization. The ambulatory care-sensitive (or preventable) hospitalizations measure was calculated by dividing the number of ASCH in each state by the total number of hospitalizations. We created a pairwise correlations matrix for all of the health outcomes and the share of PC spend to explore associations between the percent PC spend and each health outcome. We further examined the associations between the percent PC spend and each of the health outcomes by creating scatterplots, with each state plotted separately on the chart.
In addition, we tested associations between each payer type by creating three correlation matrices. First, we tested private PC spend against Medicare. Then, we tested private PC spend against Medicaid. Finally, we compared PC spend in Medicare and Medicaid. We created scatterplots to examine each association.
2.2 RESULTS
2.2a Narrow Definition
For the narrow definition of primary care, the calculated national average for primary care investment was 5.6% (Table 2.2). Among the states, we saw a great deal of variability in percent PC spend. Minnesota had the highest percent PC spend when using the narrow definition (7.56%) and Connecticut had the lowest percent PC spend (3.53%) In total, 11 states were above the national average for PC spend using the narrow definition: Minnesota, Oklahoma, Texas, Wisconsin, Alabama, California, Washington, North Carolina, Virginia, Georgia, and Florida.
Patient-Centered Primary Care Collaborative and the Robert Graham Center PAGE 15
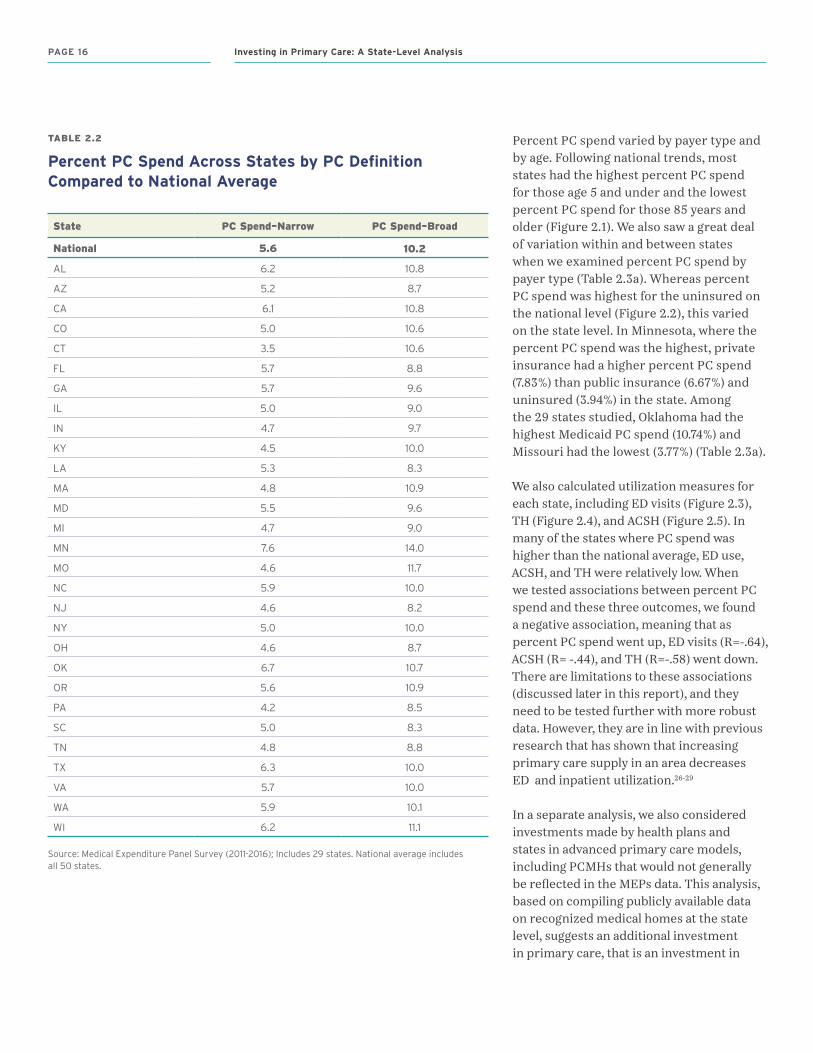
TABLE 2.2
Percent PC Spend Across States by PC Definition Compared to National Average
State PC Spend–Narrow PC Spend–Broad
National 5.6 10.2
AL 6.2 10.8
AZ 5.2 8.7
CA 6.1 10.8
CO 5.0 10.6
CT 3.5 10.6
FL 5.7 8.8
GA 5.7 9.6
IL 5.0 9.0
IN 4.7 9.7
KY 4.5 10.0
LA 5.3 8.3
MA 4.8 10.9
MD 5.5 9.6
MI 4.7 9.0
MN 7.6 14.0
MO 4.6 11.7
NC 5.9 10.0
NJ 4.6 8.2
NY 5.0 10.0
OH 4.6 8.7
OK 6.7 10.7
OR 5.6 10.9
PA 4.2 8.5
SC 5.0 8.3
TN 4.8 8.8
TX 6.3 10.0
VA 5.7 10.0
WA 5.9 10.1
WI 6.2 11.1
Source: Medical Expenditure Panel Survey (2011-2016); Includes 29 states. National average includes all 50 states.
Percent PC spend varied by payer type and by age. Following national trends, most states had the highest percent PC spend for those age 5 and under and the lowest percent PC spend for those 85 years and older (Figure 2.1). We also saw a great deal of variation within and between states when we examined percent PC spend by payer type (Table 2.3a). Whereas percent PC spend was highest for the uninsured on the national level (Figure 2.2), this varied on the state level. In Minnesota, where the percent PC spend was the highest, private insurance had a higher percent PC spend (7.83%) than public insurance (6.67%) and uninsured (3.94%) in the state. Among the 29 states studied, Oklahoma had the highest Medicaid PC spend (10.74%) and Missouri had the lowest (3.77%) (Table 2.3a).
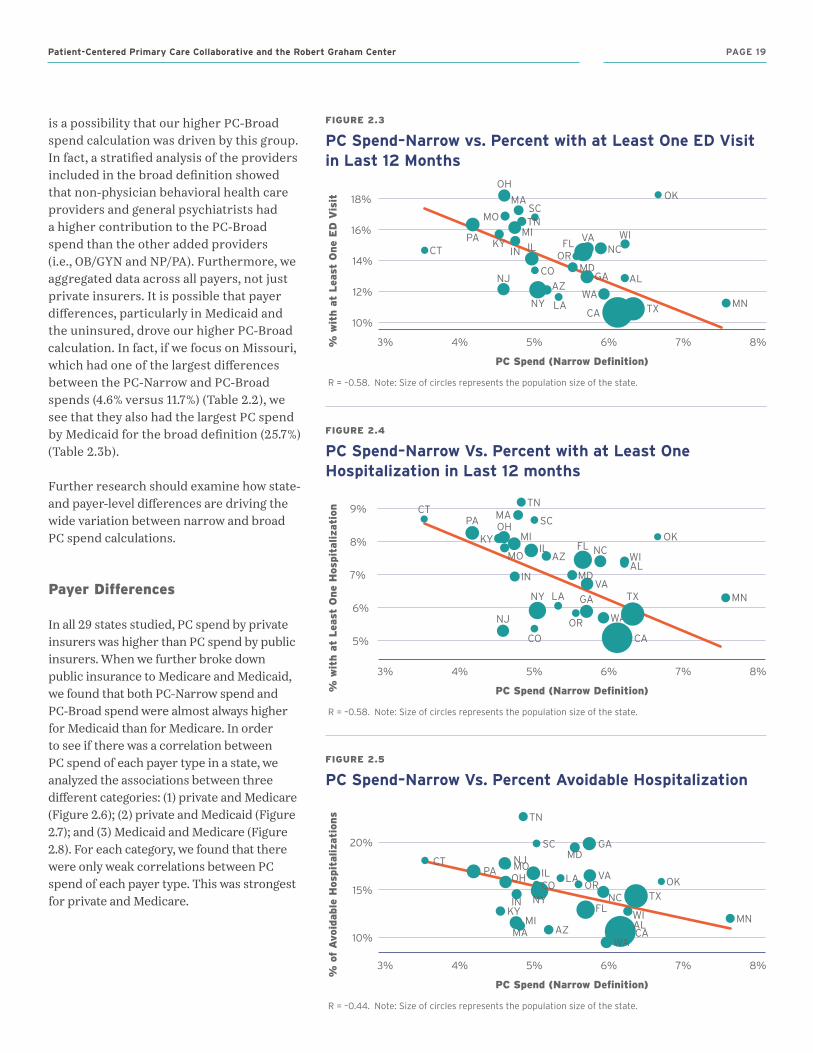
We also calculated utilization measures for each state, including ED visits (Figure 2.3), TH (Figure 2.4), and ACSH (Figure 2.5). In many of the states where PC spend was higher than the national average, ED use, ACSH, and TH were relatively low. When we tested associations between percent PC spend and these three outcomes, we found a negative association, meaning that as percent PC spend went up, ED visits (R=-.64), ACSH (R= -.44), and TH (R=-.58) went down. There are limitations to these associations (discussed later in this report), and they need to be tested further with more robust data. However, they are in line with previous research that has shown that increasing primary care supply in an area decreases ED and inpatient utilization.26-29
In a separate analysis, we also considered investments made by health plans and states in advanced primary care models, including PCMHs that would not generally be reflected in the MEPs data. This analysis, based on compiling publicly available data on recognized medical homes at the state level, suggests an additional investment in primary care, that is an investment in
PAGE 16 Investing in Primary Care: A State-Level Analysis
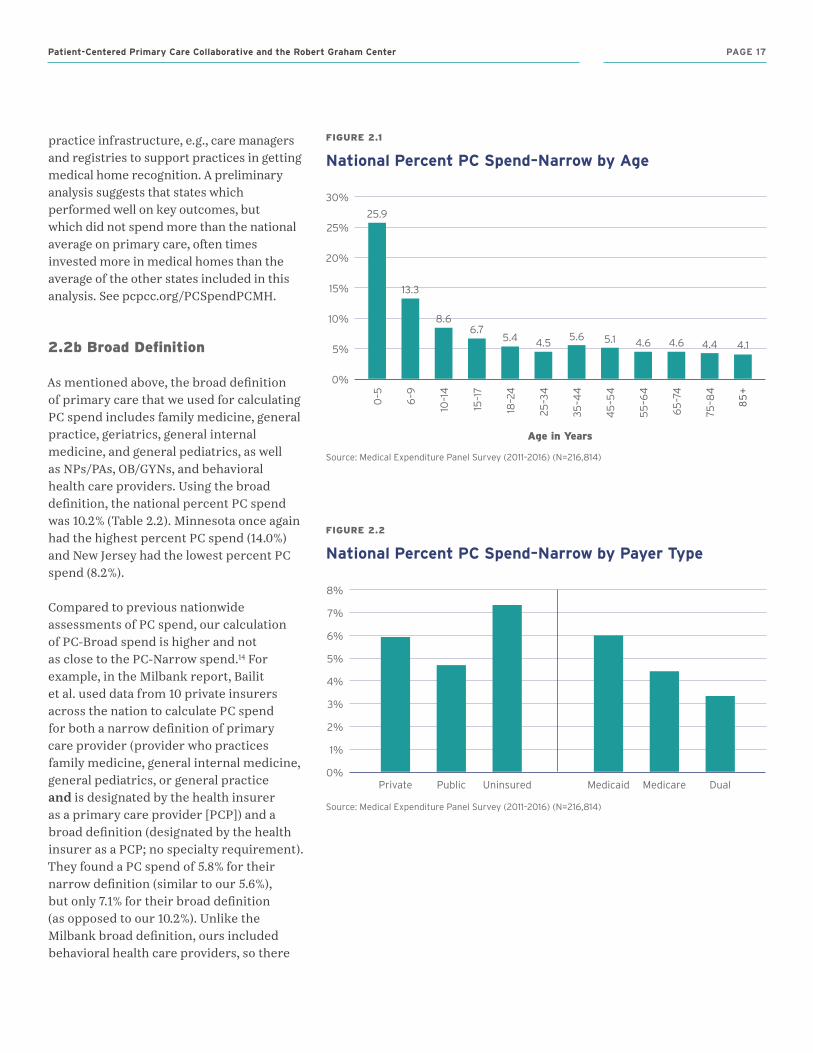
FIGURE 2.1
National Percent PC Spend–Narrow by Age
FIGURE 2.2
National Percent PC Spend–Narrow by Payer Type
0%0
–5
25.9
13.3
8.66.7
5.4 4.55.6 5.1 4.6 4.6 4.4 4.1
18–2
4
55
–64
6–9
25–3
4
Age in Years
65
–74
10–1
4
35–4
4
75–8
4
15–1
7
45
–54
85+
10%
15%
30%
25%
20%
5%
Source: Medical Expenditure Panel Survey (2011–2016) (N=216,814)
0%Private MedicarePublic DualUninsured Medicaid
4%
5%
8%
7%
6%
3%
2%
1%
Source: Medical Expenditure Panel Survey (2011–2016) (N=216,814)
practice infrastructure, e.g., care managers and registries to support practices in getting medical home recognition. A preliminary analysis suggests that states which performed well on key outcomes, but which did not spend more than the national average on primary care, often times invested more in medical homes than the average of the other states included in this analysis. See pcpcc.org/PCSpendPCMH.
2.2b Broad Definition
As mentioned above, the broad definition of primary care that we used for calculating PC spend includes family medicine, general practice, geriatrics, general internal medicine, and general pediatrics, as well as NPs/PAs, OB/GYNs, and behavioral health care providers. Using the broad definition, the national percent PC spend was 10.2% (Table 2.2). Minnesota once again had the highest percent PC spend (14.0%) and New Jersey had the lowest percent PC spend (8.2%).
Compared to previous nationwide assessments of PC spend, our calculation of PC-Broad spend is higher and not as close to the PC-Narrow spend.14 For example, in the Milbank report, Bailit et al. used data from 10 private insurers across the nation to calculate PC spend for both a narrow definition of primary care provider (provider who practices family medicine, general internal medicine, general pediatrics, or general practice and is designated by the health insurer as a primary care provider [PCP]) and a broad definition (designated by the health insurer as a PCP; no specialty requirement). They found a PC spend of 5.8% for their narrow definition (similar to our 5.6%), but only 7.1% for their broad definition (as opposed to our 10.2%). Unlike the Milbank broad definition, ours included behavioral health care providers, so there
Patient-Centered Primary Care Collaborative and the Robert Graham Center PAGE 17
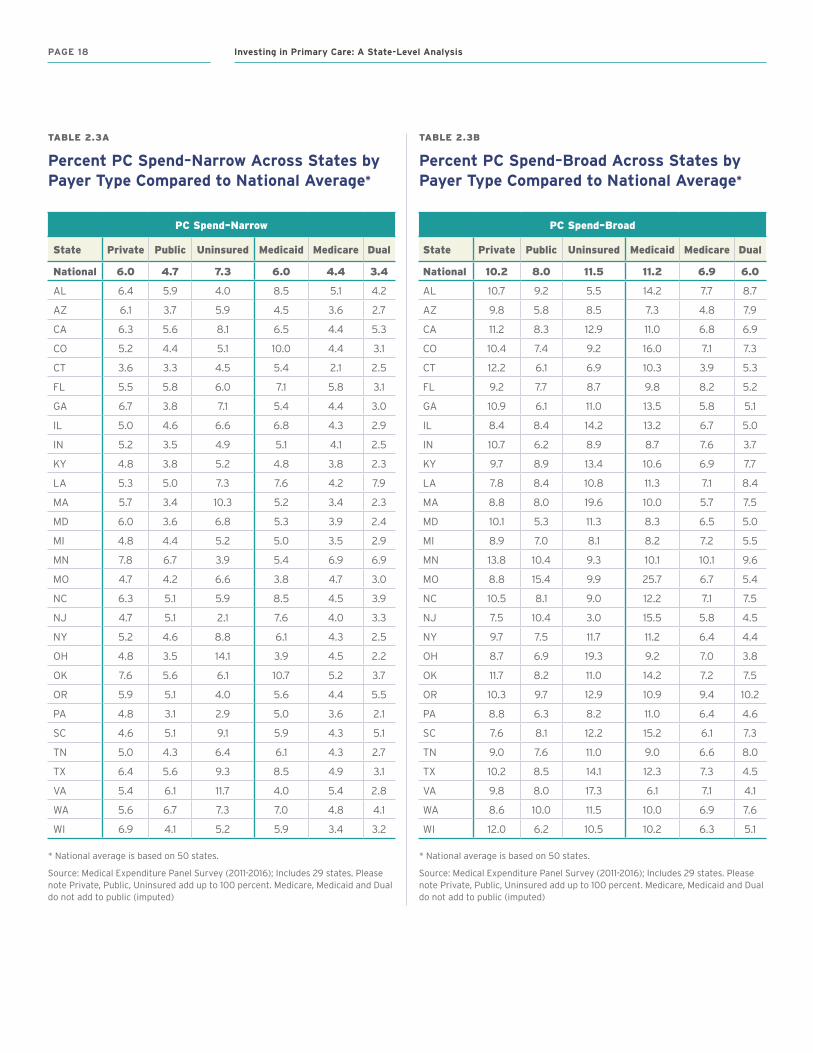
TABLE 2.3A
Percent PC Spend–Narrow Across States by Payer Type Compared to National Average*
PC Spend–Narrow
State Private Public Uninsured Medicaid Medicare Dual
National 6.0 4.7 7.3 6.0 4.4 3.4
AL 6.4 5.9 4.0 8.5 5.1 4.2
AZ 6.1 3.7 5.9 4.5 3.6 2.7
CA 6.3 5.6 8.1 6.5 4.4 5.3
CO 5.2 4.4 5.1 10.0 4.4 3.1
CT 3.6 3.3 4.5 5.4 2.1 2.5
FL 5.5 5.8 6.0 7.1 5.8 3.1
GA 6.7 3.8 7.1 5.4 4.4 3.0
IL 5.0 4.6 6.6 6.8 4.3 2.9
IN 5.2 3.5 4.9 5.1 4.1 2.5
KY 4.8 3.8 5.2 4.8 3.8 2.3
LA 5.3 5.0 7.3 7.6 4.2 7.9
MA 5.7 3.4 10.3 5.2 3.4 2.3
MD 6.0 3.6 6.8 5.3 3.9 2.4
MI 4.8 4.4 5.2 5.0 3.5 2.9
MN 7.8 6.7 3.9 5.4 6.9 6.9
MO 4.7 4.2 6.6 3.8 4.7 3.0
NC 6.3 5.1 5.9 8.5 4.5 3.9
NJ 4.7 5.1 2.1 7.6 4.0 3.3
NY 5.2 4.6 8.8 6.1 4.3 2.5
OH 4.8 3.5 14.1 3.9 4.5 2.2
OK 7.6 5.6 6.1 10.7 5.2 3.7
OR 5.9 5.1 4.0 5.6 4.4 5.5
PA 4.8 3.1 2.9 5.0 3.6 2.1
SC 4.6 5.1 9.1 5.9 4.3 5.1
TN 5.0 4.3 6.4 6.1 4.3 2.7
TX 6.4 5.6 9.3 8.5 4.9 3.1
VA 5.4 6.1 11.7 4.0 5.4 2.8
WA 5.6 6.7 7.3 7.0 4.8 4.1
WI 6.9 4.1 5.2 5.9 3.4 3.2
* National average is based on 50 states.
Source: Medical Expenditure Panel Survey (2011-2016); Includes 29 states. Please note Private, Public, Uninsured add up to 100 percent. Medicare, Medicaid and Dual do not add to public (imputed)
TABLE 2.3B
Percent PC Spend–Broad Across States by Payer Type Compared to National Average*
PC Spend–Broad
State Private Public Uninsured Medicaid Medicare Dual
National 10.2 8.0 11.5 11.2 6.9 6.0
AL 10.7 9.2 5.5 14.2 7.7 8.7
AZ 9.8 5.8 8.5 7.3 4.8 7.9
CA 11.2 8.3 12.9 11.0 6.8 6.9
CO 10.4 7.4 9.2 16.0 7.1 7.3
CT 12.2 6.1 6.9 10.3 3.9 5.3
FL 9.2 7.7 8.7 9.8 8.2 5.2
GA 10.9 6.1 11.0 13.5 5.8 5.1
IL 8.4 8.4 14.2 13.2 6.7 5.0
IN 10.7 6.2 8.9 8.7 7.6 3.7
KY 9.7 8.9 13.4 10.6 6.9 7.7
LA 7.8 8.4 10.8 11.3 7.1 8.4
MA 8.8 8.0 19.6 10.0 5.7 7.5
MD 10.1 5.3 11.3 8.3 6.5 5.0
MI 8.9 7.0 8.1 8.2 7.2 5.5
MN 13.8 10.4 9.3 10.1 10.1 9.6
MO 8.8 15.4 9.9 25.7 6.7 5.4
NC 10.5 8.1 9.0 12.2 7.1 7.5
NJ 7.5 10.4 3.0 15.5 5.8 4.5
NY 9.7 7.5 11.7 11.2 6.4 4.4
OH 8.7 6.9 19.3 9.2 7.0 3.8
OK 11.7 8.2 11.0 14.2 7.2 7.5
OR 10.3 9.7 12.9 10.9 9.4 10.2
PA 8.8 6.3 8.2 11.0 6.4 4.6
SC 7.6 8.1 12.2 15.2 6.1 7.3
TN 9.0 7.6 11.0 9.0 6.6 8.0
TX 10.2 8.5 14.1 12.3 7.3 4.5
VA 9.8 8.0 17.3 6.1 7.1 4.1
WA 8.6 10.0 11.5 10.0 6.9 7.6
WI 12.0 6.2 10.5 10.2 6.3 5.1
* National average is based on 50 states.
Source: Medical Expenditure Panel Survey (2011-2016); Includes 29 states. Please note Private, Public, Uninsured add up to 100 percent. Medicare, Medicaid and Dual do not add to public (imputed)
PAGE 18 Investing in Primary Care: A State-Level Analysis
PC Spend (Narrow Definition)% w
ith a
t Lea
st O
ne
Hos
pit
aliz
atio
n
5%
3% 4% 5% 6% 7% 8%
6%
8%
7%
9%
FIGURE 2.4
PC Spend–Narrow Vs. Percent with at Least One Hospitalization in Last 12 months
OK
MN
SC
TNCT
PA
NJ
IL
CO
OHMA
AZFL
ALWI
WA
CA
OR
VA
NC
TX
KY MI
MO
IN MD
GALANY
R = –0.58. Note: Size of circles represents the population size of the state.
OK
PC Spend (Narrow Definition)
% o
f A
void
able
Hos
pit
aliz
atio
ns
10%
3% 4% 5% 6% 7% 8%
15%
20%
R = –0.44. Note: Size of circles represents the population size of the state.
FIGURE 2.5
PC Spend–Narrow Vs. Percent Avoidable Hospitalization
MN
GAMD
SC
TN
CTPA
NJMO
IL LACO
OH
INKY
MIMA AZ
FL
ALWI
TX
WACA
NYOR
VA
NC
OK
% w
ith a
t Lea
st O
ne
ED
Vis
it10%
14%
16%
18%
PC Spend (Narrow Definition)
3% 4% 5% 6% 7% 8%
R = –0.58. Note: Size of circles represents the population size of the state.
FIGURE 2.3
PC Spend–Narrow vs. Percent with at Least One ED Visit in Last 12 Months
MN
SC
CTPA
NJ
MO
LA
CO
OH
MI
MA
AZ
FL
AL
WI
WA
CANY
OR
VANC
12%
GA
TX
MD
KY ILIN
TN
is a possibility that our higher PC-Broad spend calculation was driven by this group. In fact, a stratified analysis of the providers included in the broad definition showed that non-physician behavioral health care providers and general psychiatrists had a higher contribution to the PC-Broad spend than the other added providers (i.e., OB/GYN and NP/PA). Furthermore, we aggregated data across all payers, not just private insurers. It is possible that payer differences, particularly in Medicaid and the uninsured, drove our higher PC-Broad calculation. In fact, if we focus on Missouri, which had one of the largest differences between the PC-Narrow and PC-Broad spends (4.6% versus 11.7%) (Table 2.2), we see that they also had the largest PC spend by Medicaid for the broad definition (25.7%) (Table 2.3b).
Further research should examine how state- and payer-level differences are driving the wide variation between narrow and broad PC spend calculations.
Payer Differences
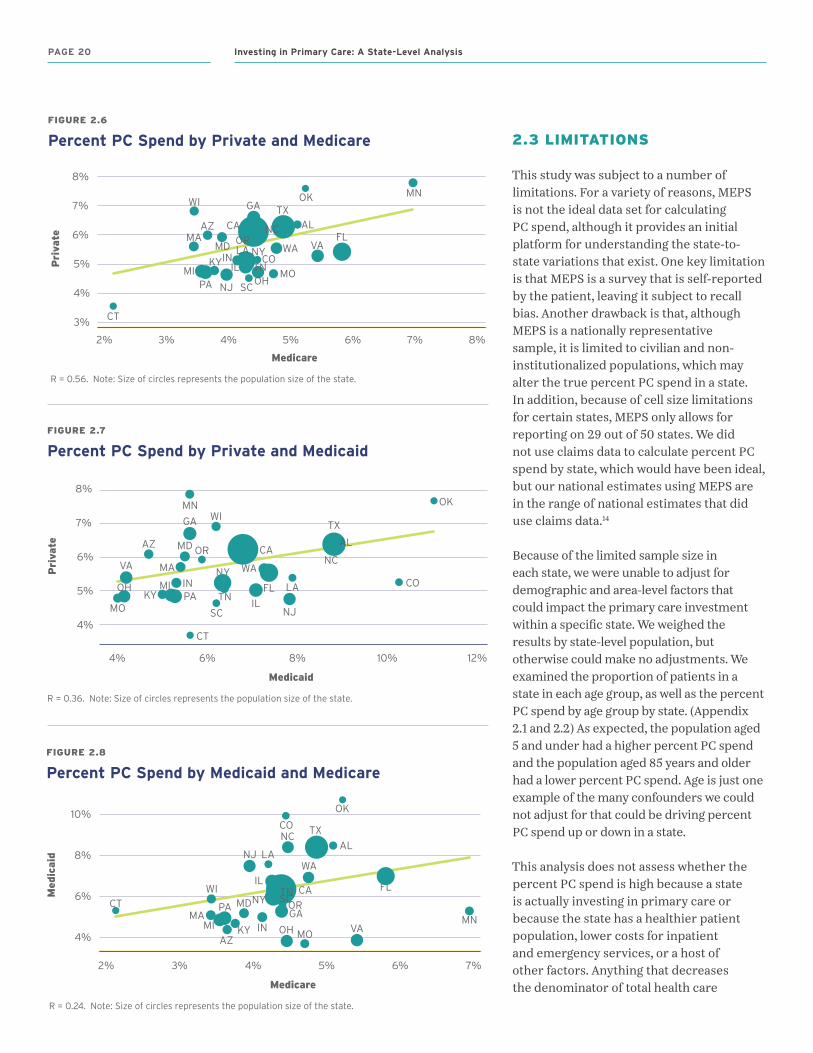
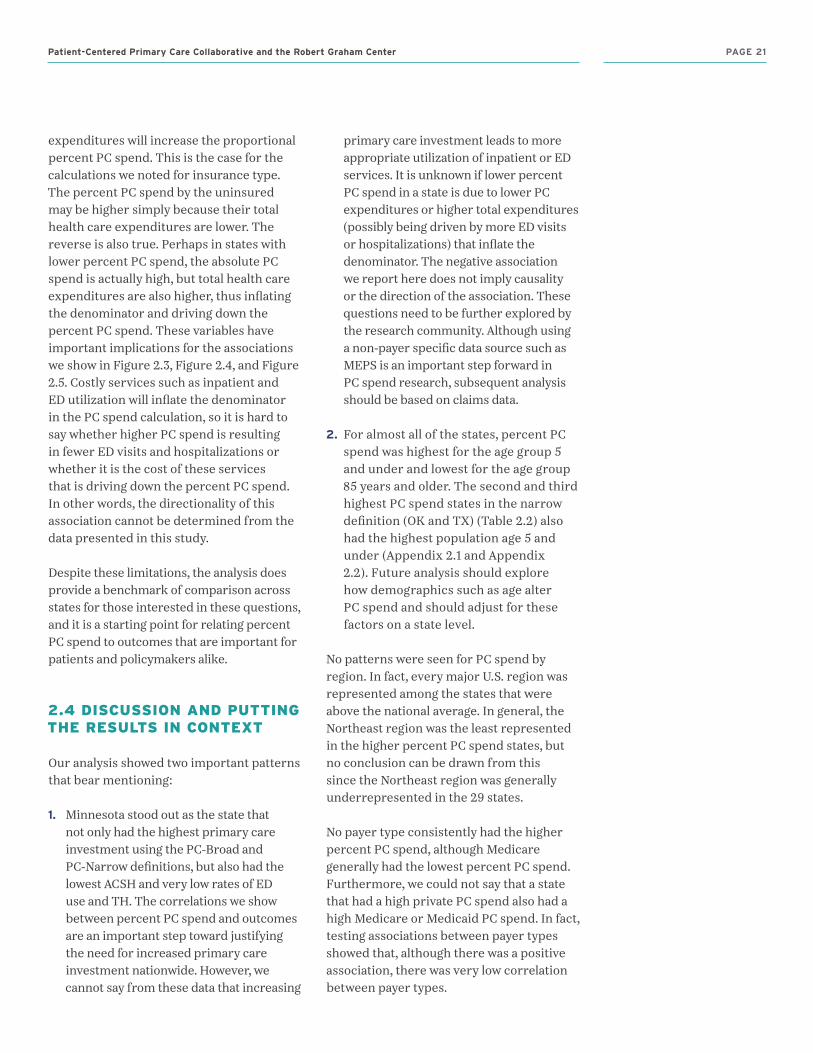
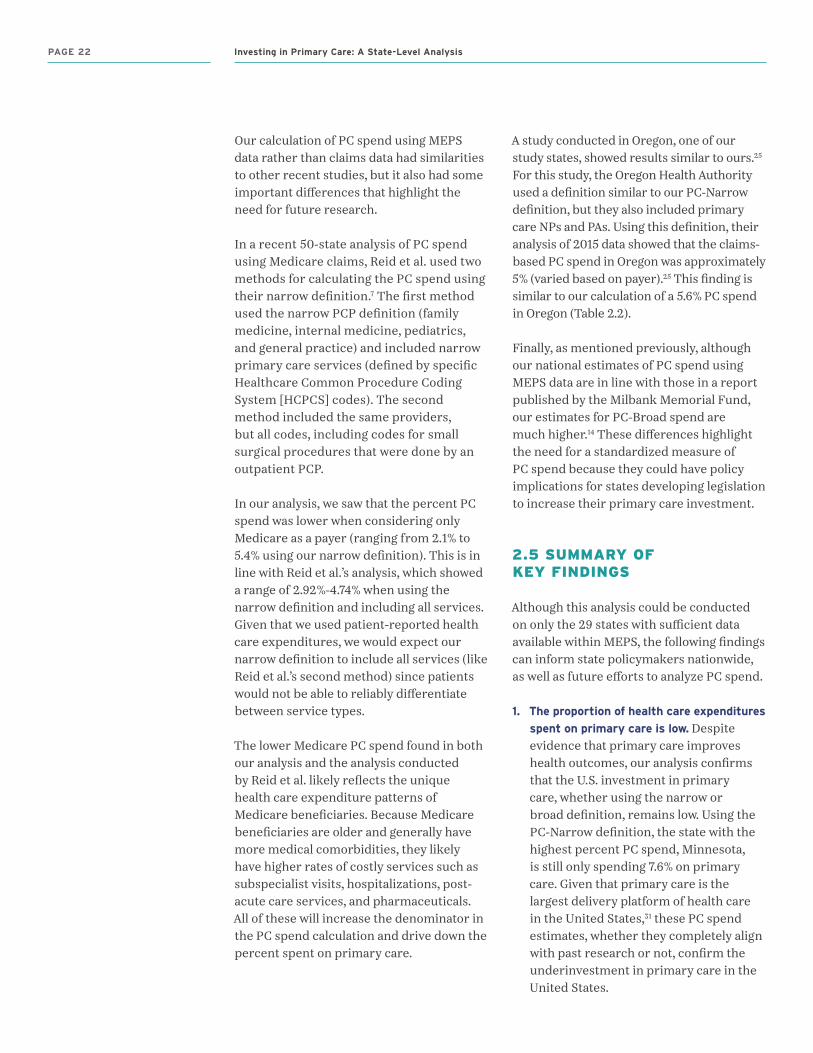
In all 29 states studied, PC spend by private insurers was higher than PC spend by public insurers. When we further broke down public insurance to Medicare and Medicaid, we found that both PC-Narrow spend and PC-Broad spend were almost always higher for Medicaid than for Medicare. In order to see if there was a correlation between PC spend of each payer type in a state, we analyzed the associations between three different categories: (1) private and Medicare (Figure 2.6); (2) private and Medicaid (Figure 2.7); and (3) Medicaid and Medicare (Figure 2.8). For each category, we found that there were only weak correlations between PC spend of each payer type. This was strongest for private and Medicare.
Patient-Centered Primary Care Collaborative and the Robert Graham Center PAGE 19
2.3 LIMITATIONS
This study was subject to a number of limitations. For a variety of reasons, MEPS is not the ideal data set for calculating PC spend, although it provides an initial platform for understanding the state-to-state variations that exist. One key limitation is that MEPS is a survey that is self-reported by the patient, leaving it subject to recall bias. Another drawback is that, although MEPS is a nationally representative sample, it is limited to civilian and non-institutionalized populations, which may alter the true percent PC spend in a state. In addition, because of cell size limitations for certain states, MEPS only allows for reporting on 29 out of 50 states. We did not use claims data to calculate percent PC spend by state, which would have been ideal, but our national estimates using MEPS are in the range of national estimates that did use claims data.14
Because of the limited sample size in each state, we were unable to adjust for demographic and area-level factors that could impact the primary care investment within a specific state. We weighed the results by state-level population, but otherwise could make no adjustments. We examined the proportion of patients in a state in each age group, as well as the percent PC spend by age group by state. (Appendix 2.1 and 2.2) As expected, the population aged 5 and under had a higher percent PC spend and the population aged 85 years and older had a lower percent PC spend. Age is just one example of the many confounders we could not adjust for that could be driving percent PC spend up or down in a state.
This analysis does not assess whether the percent PC spend is high because a state is actually investing in primary care or because the state has a healthier patient population, lower costs for inpatient and emergency services, or a host of other factors. Anything that decreases the denominator of total health care
Medicare
Pri
vate
R = 0.56. Note: Size of circles represents the population size of the state.
FIGURE 2.6
Percent PC Spend by Private and Medicare
3%
2% 3% 4% 5% 6% 7% 8%
5%
6%
8%
7%
4%
OK MNGA
MD
SC
TN
CT
PA NJMO
IL
LACO
OH
INKYMI
MAAZ
FLAL
WITX
WA
CA
NYOR VA
NC
OK
MN
CT
NJ
IL
LA
CO
FL
AL
WI
TX
WA
NC
Medicare
Med
icai
d
4%
2% 3% 4% 5% 6% 7%
10%
6%
8%
FIGURE 2.8
Percent PC Spend by Medicaid and Medicare
R = 0.24. Note: Size of circles represents the population size of the state.
GAMD SC
TN
PA
MOOHINKYMIMA
AZ
CANY OR
VA
4%
4% 6% 8% 10% 12%
6%
5%
7%
8%OKMN
MD
SC
TN
CT
PA
NJMO
COINKY
MA
AZ
TX
WA
CA
NYVA NC
AL
IL
WIGA
OR
OH MI
Medicaid
Pri
vate
R = 0.36. Note: Size of circles represents the population size of the state.
FIGURE 2.7
Percent PC Spend by Private and Medicaid
FL LA
PAGE 20 Investing in Primary Care: A State-Level Analysis
expenditures will increase the proportional percent PC spend. This is the case for the calculations we noted for insurance type. The percent PC spend by the uninsured may be higher simply because their total health care expenditures are lower. The reverse is also true. Perhaps in states with lower percent PC spend, the absolute PC spend is actually high, but total health care expenditures are also higher, thus inflating the denominator and driving down the percent PC spend. These variables have important implications for the associations we show in Figure 2.3, Figure 2.4, and Figure 2.5. Costly services such as inpatient and ED utilization will inflate the denominator in the PC spend calculation, so it is hard to say whether higher PC spend is resulting in fewer ED visits and hospitalizations or whether it is the cost of these services that is driving down the percent PC spend. In other words, the directionality of this association cannot be determined from the data presented in this study.
Despite these limitations, the analysis does provide a benchmark of comparison across states for those interested in these questions, and it is a starting point for relating percent PC spend to outcomes that are important for patients and policymakers alike.
2.4 DISCUSSION AND PUTTING THE RESULTS IN CONTEXT
Our analysis showed two important patterns that bear mentioning:
1. Minnesota stood out as the state that not only had the highest primary care investment using the PC-Broad and PC-Narrow definitions, but also had the lowest ACSH and very low rates of ED use and TH. The correlations we show between percent PC spend and outcomes are an important step toward justifying the need for increased primary care investment nationwide. However, we cannot say from these data that increasing
primary care investment leads to more appropriate utilization of inpatient or ED services. It is unknown if lower percent PC spend in a state is due to lower PC expenditures or higher total expenditures (possibly being driven by more ED visits or hospitalizations) that inflate the denominator. The negative association we report here does not imply causality or the direction of the association. These questions need to be further explored by the research community. Although using a non-payer specific data source such as MEPS is an important step forward in PC spend research, subsequent analysis should be based on claims data.
2. For almost all of the states, percent PC spend was highest for the age group 5 and under and lowest for the age group 85 years and older. The second and third highest PC spend states in the narrow definition (OK and TX) (Table 2.2) also had the highest population age 5 and under (Appendix 2.1 and Appendix 2.2). Future analysis should explore how demographics such as age alter PC spend and should adjust for these factors on a state level.
No patterns were seen for PC spend by region. In fact, every major U.S. region was represented among the states that were above the national average. In general, the Northeast region was the least represented in the higher percent PC spend states, but no conclusion can be drawn from this since the Northeast region was generally underrepresented in the 29 states.
No payer type consistently had the higher percent PC spend, although Medicare generally had the lowest percent PC spend. Furthermore, we could not say that a state that had a high private PC spend also had a high Medicare or Medicaid PC spend. In fact, testing associations between payer types showed that, although there was a positive association, there was very low correlation between payer types.
Patient-Centered Primary Care Collaborative and the Robert Graham Center PAGE 21
Our calculation of PC spend using MEPS data rather than claims data had similarities to other recent studies, but it also had some important differences that highlight the need for future research.
In a recent 50-state analysis of PC spend using Medicare claims, Reid et al. used two methods for calculating the PC spend using their narrow definition.7 The first method used the narrow PCP definition (family medicine, internal medicine, pediatrics, and general practice) and included narrow primary care services (defined by specific Healthcare Common Procedure Coding System [HCPCS] codes). The second method included the same providers, but all codes, including codes for small surgical procedures that were done by an outpatient PCP.
In our analysis, we saw that the percent PC spend was lower when considering only Medicare as a payer (ranging from 2.1% to 5.4% using our narrow definition). This is in line with Reid et al.’s analysis, which showed a range of 2.92%-4.74% when using the narrow definition and including all services. Given that we used patient-reported health care expenditures, we would expect our narrow definition to include all services (like Reid et al.’s second method) since patients would not be able to reliably differentiate between service types.
The lower Medicare PC spend found in both our analysis and the analysis conducted by Reid et al. likely reflects the unique health care expenditure patterns of Medicare beneficiaries. Because Medicare beneficiaries are older and generally have more medical comorbidities, they likely have higher rates of costly services such as subspecialist visits, hospitalizations, post-acute care services, and pharmaceuticals. All of these will increase the denominator in the PC spend calculation and drive down the percent spent on primary care.
A study conducted in Oregon, one of our study states, showed results similar to ours.25 For this study, the Oregon Health Authority used a definition similar to our PC-Narrow definition, but they also included primary care NPs and PAs. Using this definition, their analysis of 2015 data showed that the claims-based PC spend in Oregon was approximately 5% (varied based on payer).25 This finding is similar to our calculation of a 5.6% PC spend in Oregon (Table 2.2).
Finally, as mentioned previously, although our national estimates of PC spend using MEPS data are in line with those in a report published by the Milbank Memorial Fund, our estimates for PC-Broad spend are much higher.14 These differences highlight the need for a standardized measure of PC spend because they could have policy implications for states developing legislation to increase their primary care investment.
2.5 SUMMARY OF KEY FINDINGS
Although this analysis could be conducted on only the 29 states with sufficient data available within MEPS, the following findings can inform state policymakers nationwide, as well as future efforts to analyze PC spend.
1. The proportion of health care expenditures
spent on primary care is low. Despite evidence that primary care improves health outcomes, our analysis confirms that the U.S. investment in primary care, whether using the narrow or broad definition, remains low. Using the PC-Narrow definition, the state with the highest percent PC spend, Minnesota, is still only spending 7.6% on primary care. Given that primary care is the largest delivery platform of health care in the United States,31 these PC spend estimates, whether they completely align with past research or not, confirm the underinvestment in primary care in the United States.
PAGE 22 Investing in Primary Care: A State-Level Analysis
2. Considerable state variation exists in
percent PC spend for both the narrow
(3.5%-7.6%) and broad definitions
(8.2-14.0%) (Table 2.2). The 29 states presented in this analysis vary in many areas, including, but not limited to, the primary care orientation of their payers and state policies; age distribution within the state; and the general health of their state population. Past analyses of PC spend have demonstrated that older age and the presence of medical comorbidities will lower PC spend (as a proportion of total health care spend) by inflating the denominator. Thus, state-level variations in these factors would have an obvious influence on PC spend. State-level policies and the primary care orientation of payers can also have an influence on PC spend, as demonstrated by regulations put forth in states like Rhode Island and Oregon. This report can help state policymakers benchmark their state against others that are similar in terms of geography and population demographics.
3. There was only a weak correlation of
state-level PC spend by each payer type.
If PC spend was higher than the average for one payer type in a state, it was not necessarily higher for other payer types in the same state. This weak correlation may reflect a lack of coordinated strategy across payers in a state on their PC spend.
4. Large differences exist between the
PC-Narrow spend and the PC-Broad
spend for most states. Using the narrow definition of PC spend, states ranged from 3.5% to 7.6% (Table 2.2). Using the broad definition, the percent PC spend was higher, ranging from 8.2% to 14.0%. Our broad definition of primary care included OB/GYNs, NPs, PAs, and behavioral health care providers. With our current analysis, we cannot tell which type of provider is driving the large increase in PC spend. There is a strong possibility that this varies by
state. For example, in a state with a younger population of child-bearing age, it is possible that OB/GYN services are driving the increase in percent PC spend. In states that have been hit hard with the opioid epidemic, it is possible that behavioral health care providers are driving the increase. The broader definition is likely more reflective of the full primary care workforce and may more accurately capture the total primary care spend. State policymakers are better positioned to understand the nuances of their state demographics and health needs, and they should use these data to guide changes in primary care investment in their state.
5. There is a negative association
between PC spend and utilization
outcomes. Aggregate data for all 29 states demonstrate that as PC spend increases, ED use, TH, and ACSH decrease. Even though increases in expensive services such as ED and inpatient utilization would be expected to inflate the denominator, thereby decreasing PC spend, we cannot attribute the entire association to an inflation of the denominator. In fact, ED visits, which are less costly than hospitalizations on average, had the strongest association. This association is also in line with the literature, which has shown the positive impact primary care has on utilization outcomes.26-29 Nonetheless, these data do not imply causality, or even directionality, of the effect. More research is needed before we can definitively understand the impact increased primary care investment has on a state.
6. A standardized measure of PC spend
is needed. Using our definition of PC-Narrow spend, we find our results aligned with others that have measured PC spend on state and national levels. However, our definition of PC-Broad spend is less comparable. Although a
Patient-Centered Primary Care Collaborative and the Robert Graham Center PAGE 23
great deal of progress has been made toward reaching consensus on PC spend measurements, more work needs to be done, particularly when considering definitions that do not include the standard primary care providers.
2.6 FUTURE DIRECTIONS
In order to appropriately measure PC spend and successfully make the case for increases in primary care investment, we need a uniform definition of PC spend and a standardized method of calculating it. As highlighted in Section 2.4, our calculation of PC spend, though similar to others, also had some important differences. In particular, when more broad definitions of primary care or different payer types (e.g., private versus Medicare versus Medicaid) are considered, great variability becomes evident in the PC spend calculation among researchers. This variability underscores the need for a standardized method of calculating PC spend. While some progress
toward a standardized definition of primary care has been made, there is not yet consensus on the method of calculating— or even defining—primary care investment. Reaching consensus is complicated by varying definitions of primary care, as well as the lack of available, relevant data.
Arriving at a uniform PC spend methodology has important implications for policy and research. Standardizing the definition and calculation of percent PC spend will allow for benchmarking and comparisons across health plans, accountable care organizations (ACOs), and states. It will also allow further exploration of the relationship between percent PC spend, health outcomes, and cost. These types of analyses are important for policymakers in their role influencing resource allocation decisions, particularly as they make the case for increasing investment in primary care.
Clearly defining PC spend would allow for data to be gathered in a reliable, consistent manner for comparable analysis. The need
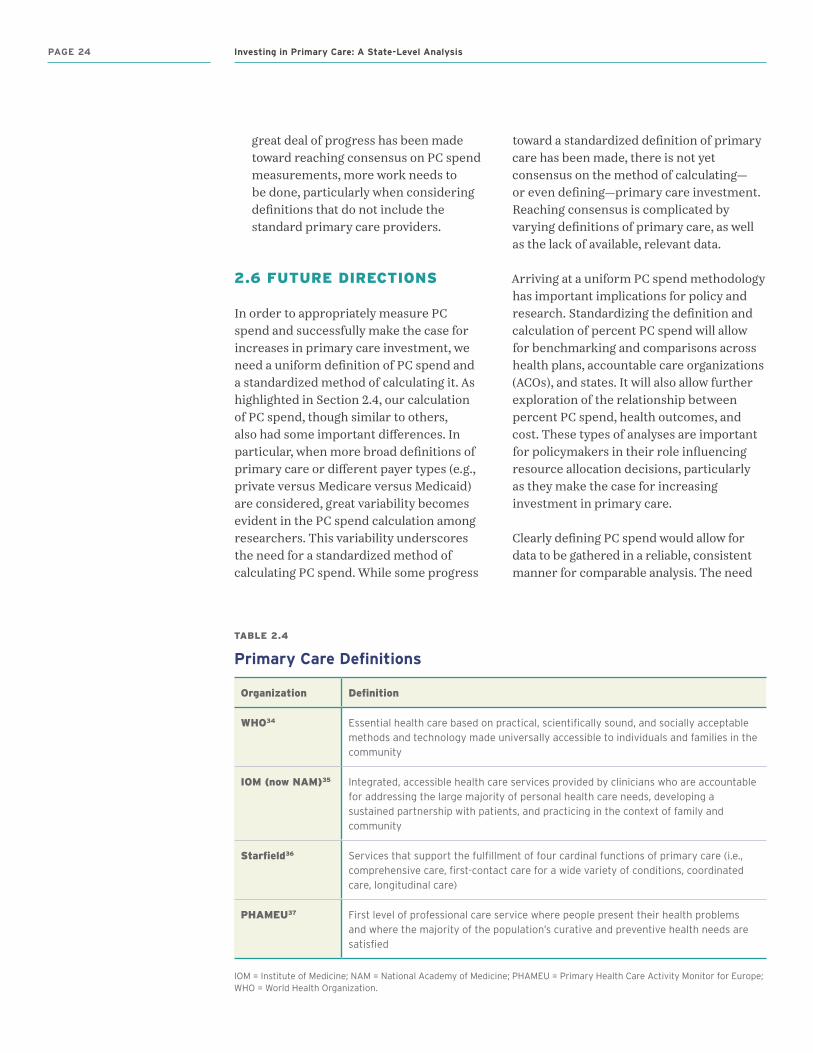
TABLE 2.4
Primary Care Definitions
Organization Definition
WHO34 Essential health care based on practical, scientifically sound, and socially acceptable methods and technology made universally accessible to individuals and families in the community
IOM (now NAM)35 Integrated, accessible health care services provided by clinicians who are accountable for addressing the large majority of personal health care needs, developing a sustained partnership with patients, and practicing in the context of family and community
Starfield36 Services that support the fulfillment of four cardinal functions of primary care (i.e., comprehensive care, first-contact care for a wide variety of conditions, coordinated care, longitudinal care)
PHAMEU37 First level of professional care service where people present their health problems and where the majority of the population’s curative and preventive health needs are satisfied
IOM = Institute of Medicine; NAM = National Academy of Medicine; PHAMEU = Primary Health Care Activity Monitor for Europe; WHO = World Health Organization.
PAGE 24 Investing in Primary Care: A State-Level Analysis
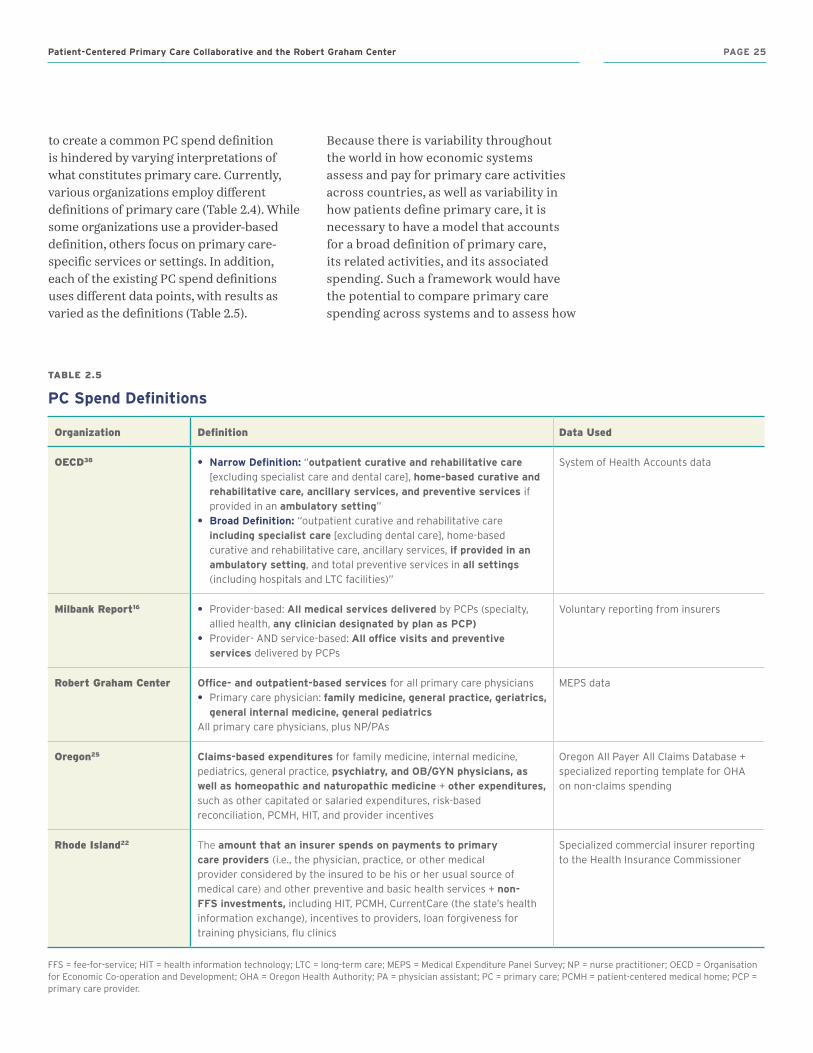
to create a common PC spend definition is hindered by varying interpretations of what constitutes primary care. Currently, various organizations employ different definitions of primary care (Table 2.4). While some organizations use a provider-based definition, others focus on primary care-specific services or settings. In addition, each of the existing PC spend definitions uses different data points, with results as varied as the definitions (Table 2.5).
Because there is variability throughout the world in how economic systems assess and pay for primary care activities across countries, as well as variability in how patients define primary care, it is necessary to have a model that accounts for a broad definition of primary care, its related activities, and its associated spending. Such a framework would have the potential to compare primary care spending across systems and to assess how
TABLE 2.5
PC Spend Definitions
Organization Definition Data Used
OECD38 • Narrow Definition: “outpatient curative and rehabilitative care [excluding specialist care and dental care], home-based curative and rehabilitative care, ancillary services, and preventive services if provided in an ambulatory setting”
• Broad Definition: “outpatient curative and rehabilitative care including specialist care [excluding dental care], home-based curative and rehabilitative care, ancillary services, if provided in an ambulatory setting, and total preventive services in all settings (including hospitals and LTC facilities)”
System of Health Accounts data
Milbank Report16 • Provider-based: All medical services delivered by PCPs (specialty, allied health, any clinician designated by plan as PCP)
• Provider- AND service-based: All office visits and preventive services delivered by PCPs
Voluntary reporting from insurers
Robert Graham Center Office- and outpatient-based services for all primary care physicians• Primary care physician: family medicine, general practice, geriatrics,
general internal medicine, general pediatricsAll primary care physicians, plus NP/PAs
MEPS data
Oregon25 Claims-based expenditures for family medicine, internal medicine, pediatrics, general practice, psychiatry, and OB/GYN physicians, as well as homeopathic and naturopathic medicine + other expenditures, such as other capitated or salaried expenditures, risk-based reconciliation, PCMH, HIT, and provider incentives
Oregon All Payer All Claims Database + specialized reporting template for OHA on non-claims spending
Rhode Island22 The amount that an insurer spends on payments to primary care providers (i.e., the physician, practice, or other medical provider considered by the insured to be his or her usual source of medical care) and other preventive and basic health services + non-FFS investments, including HIT, PCMH, CurrentCare (the state’s health information exchange), incentives to providers, loan forgiveness for training physicians, flu clinics
Specialized commercial insurer reporting to the Health Insurance Commissioner
FFS = fee-for-service; HIT = health information technology; LTC = long-term care; MEPS = Medical Expenditure Panel Survey; NP = nurse practitioner; OECD = Organisation for Economic Co-operation and Development; OHA = Oregon Health Authority; PA = physician assistant; PC = primary care; PCMH = patient-centered medical home; PCP = primary care provider.
Patient-Centered Primary Care Collaborative and the Robert Graham Center PAGE 25
much of the PC spend can be untangled from total health care expenditures. Understanding the need for a model that various international systems can apply in their calculation of PC spend, the Robert Graham Center and the American Board of Family Medicine (ABFM) hosted a methods conference on measurement of primary care spending in 2017. Attendees included international payment, policy, and primary care experts who came together to discuss the development of a common definition of PC spend to support international
comparisons, enable research on outcomes, and support policy development.
Clearly, variability continues to exist in how PC spend is defined, particularly for the broad definition. Differences in the broad definition used by organizations and researchers will be a challenge for state-level policymakers as they try to decide which additional providers to invest resources in to yield the best primary care-sensitive outcomes in their state.
PAGE 26 Investing in Primary Care: A State-Level Analysis
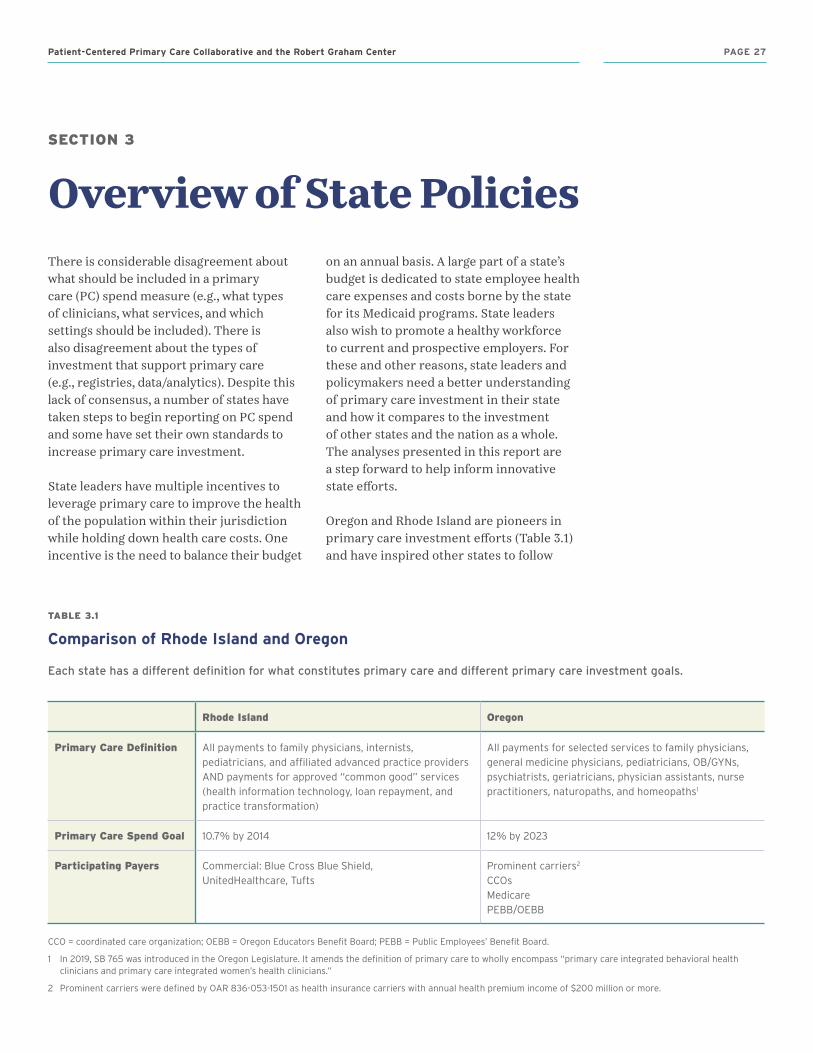
SECTION 3
Overview of State PoliciesThere is considerable disagreement about what should be included in a primary care (PC) spend measure (e.g., what types of clinicians, what services, and which settings should be included). There is also disagreement about the types of investment that support primary care (e.g., registries, data/analytics). Despite this lack of consensus, a number of states have taken steps to begin reporting on PC spend and some have set their own standards to increase primary care investment.
State leaders have multiple incentives to leverage primary care to improve the health of the population within their jurisdiction while holding down health care costs. One incentive is the need to balance their budget
on an annual basis. A large part of a state’s budget is dedicated to state employee health care expenses and costs borne by the state for its Medicaid programs. State leaders also wish to promote a healthy workforce to current and prospective employers. For these and other reasons, state leaders and policymakers need a better understanding of primary care investment in their state and how it compares to the investment of other states and the nation as a whole. The analyses presented in this report are a step forward to help inform innovative state efforts.
Oregon and Rhode Island are pioneers in primary care investment efforts (Table 3.1) and have inspired other states to follow
TABLE 3.1
Comparison of Rhode Island and Oregon
Each .state .has .a .different .definition .for .what .constitutes .primary .care .and .different .primary .care .investment .goals .
Rhode Island Oregon
Primary Care Definition All payments to family physicians, internists, pediatricians, and affiliated advanced practice providers AND payments for approved “common good” services (health information technology, loan repayment, and practice transformation)
All payments for selected services to family physicians, general medicine physicians, pediatricians, OB/GYNs, psychiatrists, geriatricians, physician assistants, nurse practitioners, naturopaths, and homeopaths1
Primary Care Spend Goal 10.7% by 2014 12% by 2023
Participating Payers Commercial: Blue Cross Blue Shield, UnitedHealthcare, Tufts
Prominent carriers2
CCOsMedicarePEBB/OEBB
CCO = coordinated care organization; OEBB = Oregon Educators Benefit Board; PEBB = Public Employees’ Benefit Board.
1 In 2019, SB 765 was introduced in the Oregon Legislature. It amends the definition of primary care to wholly encompass “primary care integrated behavioral health clinicians and primary care integrated women’s health clinicians.”
2 Prominent carriers were defined by OAR 836-053-1501 as health insurance carriers with annual health premium income of $200 million or more.
Patient-Centered Primary Care Collaborative and the Robert Graham Center PAGE 27
suit. This section provides a high-level summary of key state efforts to date. Case studies describing the efforts in Rhode Island and Oregon are provided on pages 30 and 32, respectively.
As of this writing, six other states have joined Oregon and Rhode Island in passing primary care investment legislation or have put into place an executive order related to primary care investment (Table 3.2). At least two other states are working on related legislation (Table 3.3). Given that most of these efforts have occurred in the 2018 and 2019 legislative cycles, there seems to be growing state momentum for this policy direction. It is important to note that, for a variety of reasons, the state leadership examples provided in this report do not constitute a comprehensive list. We have chosen to highlight examples with clearly citable public documents, published by either a state executive or legislative body. An ongoing, up-to-date list of primary care investment legislation is available on the Patient-Centered Primary Care Collaborative (PCPCC) website at pcpcc.org/primary-care-investment.
Multistakeholder collaboratives are beginning to work informally in several other states, and we expect these efforts to garner more attention going forward. For example, in 2017, the New England States Consortium Systems Organization (NESCSO)—a non-profit corporation organized by six New England Health and Human Services (HHS) agencies and the University of Massachusetts Medical School—launched the Primary Care Investments Workgroup. It includes representatives from Connecticut, Massachusetts, Maine, New Hampshire, Rhode Island, and Vermont who are working together to improve primary care in all of their states. In 2019 and beyond, the workgroup’s planned goal is to collaborate on ideas to increase primary care investment and evolve payment models.
Several other states (including Maryland and Connecticut) deserve credit for leveraging state programs and federal payment model support to make significant progress in primary care investment. Some state primary care advocates (e.g., California) have made the strategic decision to focus on advancing all-payer claims databases (APCDs), which many consider to be a prerequisite to an advanced conversation about primary care spending and efforts to shift investment.
3.1 CHARACTERIZING LEADING STATE PRIMARY CARE INVESTMENT EFFORTS
Because each of the eight states that have enacted primary care investment policies has a unique history, population, and delivery system, their strategies to strengthen primary care have varied. However, common themes have emerged across these efforts. Many of these themes align with the Consensus Recommendations on Primary Care Investment (pcpcc.org/ConsensusRecommendations) advanced by the PCPCC.
Multistakeholder collaboration—which includes engagement and participation by stakeholders representing all parts of the community and health care delivery system—is evident in most state efforts. More specifically, many of the leading states have formed multistakeholder collaboratives to come up with a definition for the kind of primary care they wish to have in their communities and recommendations for where investment is needed to achieve such care without expanding the total cost of care.
These multistakeholder discussions inevitably lead to conversations about measurement (i.e., how primary care investment should be tracked and reported using a standardized measure). Long-term, systemic change demands a system that
PAGE 28 Investing in Primary Care: A State-Level Analysis
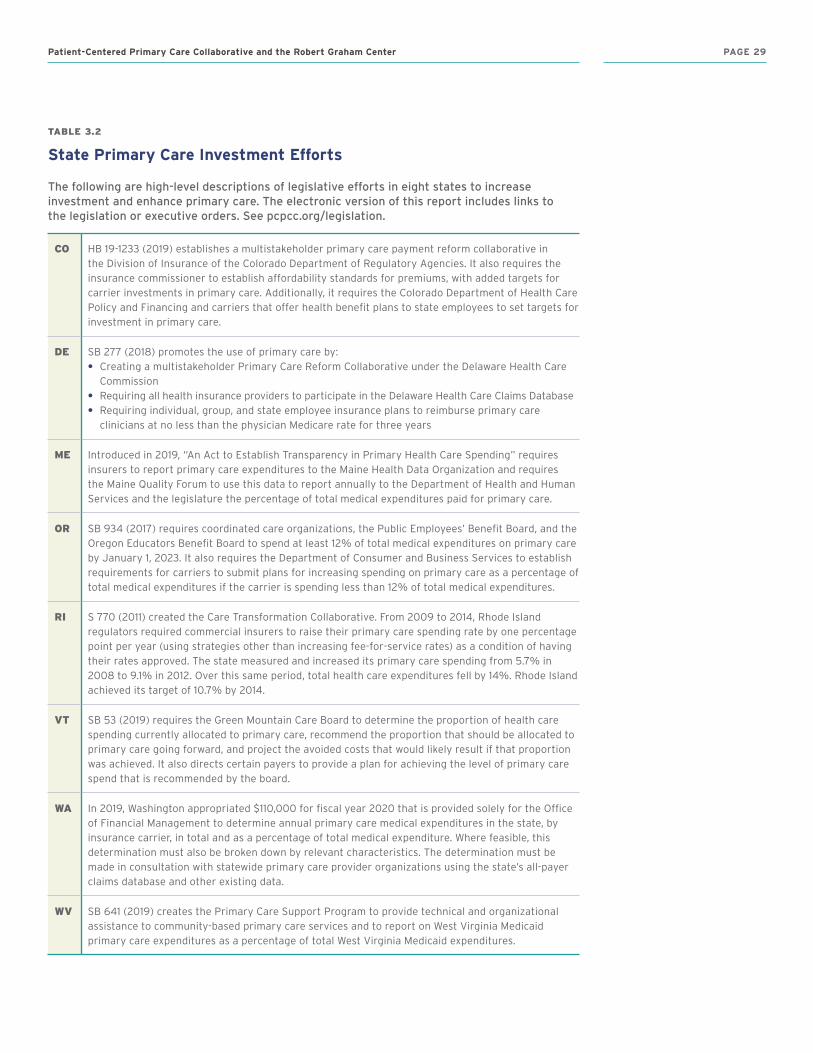
TABLE 3.2
State Primary Care Investment Efforts
The .following .are .high-level .descriptions .of .legislative .efforts .in .eight .states .to .increase .investment .and .enhance .primary .care . .The .electronic .version .of .this .report .includes .links .to . .the .legislation .or .executive .orders . .See .pcpcc .org/legislation . .
CO HB 19-1233 (2019) establishes a multistakeholder primary care payment reform collaborative in the Division of Insurance of the Colorado Department of Regulatory Agencies. It also requires the insurance commissioner to establish affordability standards for premiums, with added targets for carrier investments in primary care. Additionally, it requires the Colorado Department of Health Care Policy and Financing and carriers that offer health benefit plans to state employees to set targets for investment in primary care.
DE SB 277 (2018) promotes the use of primary care by:• Creating a multistakeholder Primary Care Reform Collaborative under the Delaware Health Care
Commission• Requiring all health insurance providers to participate in the Delaware Health Care Claims Database• Requiring individual, group, and state employee insurance plans to reimburse primary care
clinicians at no less than the physician Medicare rate for three years
ME Introduced in 2019, “An Act to Establish Transparency in Primary Health Care Spending” requires insurers to report primary care expenditures to the Maine Health Data Organization and requires the Maine Quality Forum to use this data to report annually to the Department of Health and Human Services and the legislature the percentage of total medical expenditures paid for primary care.
OR SB 934 (2017) requires coordinated care organizations, the Public Employees’ Benefit Board, and the Oregon Educators Benefit Board to spend at least 12% of total medical expenditures on primary care by January 1, 2023. It also requires the Department of Consumer and Business Services to establish requirements for carriers to submit plans for increasing spending on primary care as a percentage of total medical expenditures if the carrier is spending less than 12% of total medical expenditures.
RI S 770 (2011) created the Care Transformation Collaborative. From 2009 to 2014, Rhode Island regulators required commercial insurers to raise their primary care spending rate by one percentage point per year (using strategies other than increasing fee-for-service rates) as a condition of having their rates approved. The state measured and increased its primary care spending from 5.7% in 2008 to 9.1% in 2012. Over this same period, total health care expenditures fell by 14%. Rhode Island achieved its target of 10.7% by 2014.
VT SB 53 (2019) requires the Green Mountain Care Board to determine the proportion of health care spending currently allocated to primary care, recommend the proportion that should be allocated to primary care going forward, and project the avoided costs that would likely result if that proportion was achieved. It also directs certain payers to provide a plan for achieving the level of primary care spend that is recommended by the board.
WA In 2019, Washington appropriated $110,000 for fiscal year 2020 that is provided solely for the Office of Financial Management to determine annual primary care medical expenditures in the state, by insurance carrier, in total and as a percentage of total medical expenditure. Where feasible, this determination must also be broken down by relevant characteristics. The determination must be made in consultation with statewide primary care provider organizations using the state’s all-payer claims database and other existing data.
WV SB 641 (2019) creates the Primary Care Support Program to provide technical and organizational assistance to community-based primary care services and to report on West Virginia Medicaid primary care expenditures as a percentage of total West Virginia Medicaid expenditures.
Patient-Centered Primary Care Collaborative and the Robert Graham Center PAGE 29
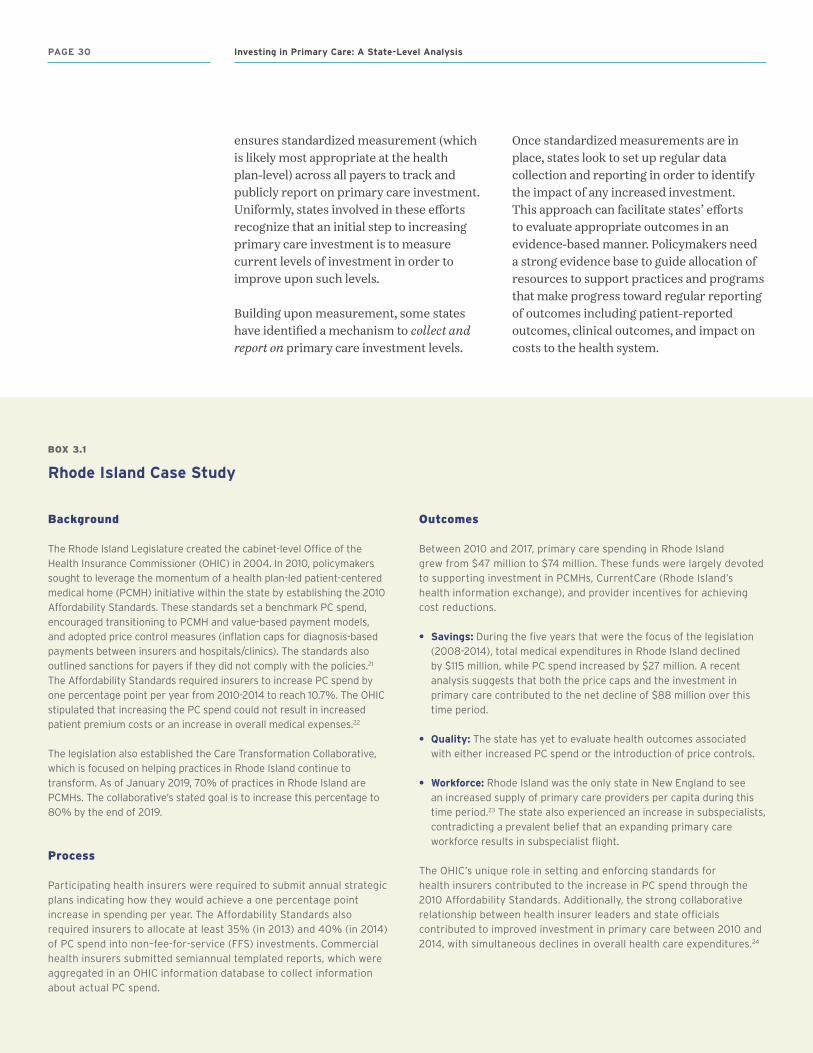
ensures standardized measurement (which is likely most appropriate at the health plan-level) across all payers to track and publicly report on primary care investment. Uniformly, states involved in these efforts recognize that an initial step to increasing primary care investment is to measure current levels of investment in order to improve upon such levels.
Building upon measurement, some states have identified a mechanism to collect and report on primary care investment levels.
Once standardized measurements are in place, states look to set up regular data collection and reporting in order to identify the impact of any increased investment. This approach can facilitate states’ efforts to evaluate appropriate outcomes in an evidence-based manner. Policymakers need a strong evidence base to guide allocation of resources to support practices and programs that make progress toward regular reporting of outcomes including patient-reported outcomes, clinical outcomes, and impact on costs to the health system.
BOX 3.1
Rhode Island Case Study
Background
The Rhode Island Legislature created the cabinet-level Office of the Health Insurance Commissioner (OHIC) in 2004. In 2010, policymakers sought to leverage the momentum of a health plan-led patient-centered medical home (PCMH) initiative within the state by establishing the 2010 Affordability Standards. These standards set a benchmark PC spend, encouraged transitioning to PCMH and value-based payment models, and adopted price control measures (inflation caps for diagnosis-based payments between insurers and hospitals/clinics). The standards also outlined sanctions for payers if they did not comply with the policies.21 The Affordability Standards required insurers to increase PC spend by one percentage point per year from 2010-2014 to reach 10.7%. The OHIC stipulated that increasing the PC spend could not result in increased patient premium costs or an increase in overall medical expenses.22
The legislation also established the Care Transformation Collaborative, which is focused on helping practices in Rhode Island continue to transform. As of January 2019, 70% of practices in Rhode Island are PCMHs. The collaborative’s stated goal is to increase this percentage to 80% by the end of 2019.
Process
Participating health insurers were required to submit annual strategic plans indicating how they would achieve a one percentage point increase in spending per year. The Affordability Standards also required insurers to allocate at least 35% (in 2013) and 40% (in 2014) of PC spend into non–fee-for-service (FFS) investments. Commercial health insurers submitted semiannual templated reports, which were aggregated in an OHIC information database to collect information about actual PC spend.
Outcomes
Between 2010 and 2017, primary care spending in Rhode Island grew from $47 million to $74 million. These funds were largely devoted to supporting investment in PCMHs, CurrentCare (Rhode Island’s health information exchange), and provider incentives for achieving cost reductions.
• Savings: During the five years that were the focus of the legislation (2008-2014), total medical expenditures in Rhode Island declined by $115 million, while PC spend increased by $27 million. A recent analysis suggests that both the price caps and the investment in primary care contributed to the net decline of $88 million over this time period.
• Quality: The state has yet to evaluate health outcomes associated with either increased PC spend or the introduction of price controls.
• Workforce: Rhode Island was the only state in New England to see an increased supply of primary care providers per capita during this time period.23 The state also experienced an increase in subspecialists, contradicting a prevalent belief that an expanding primary care workforce results in subspecialist flight.
The OHIC’s unique role in setting and enforcing standards for health insurers contributed to the increase in PC spend through the 2010 Affordability Standards. Additionally, the strong collaborative relationship between health insurer leaders and state officials contributed to improved investment in primary care between 2010 and 2014, with simultaneous declines in overall health care expenditures.24
PAGE 30 Investing in Primary Care: A State-Level Analysis
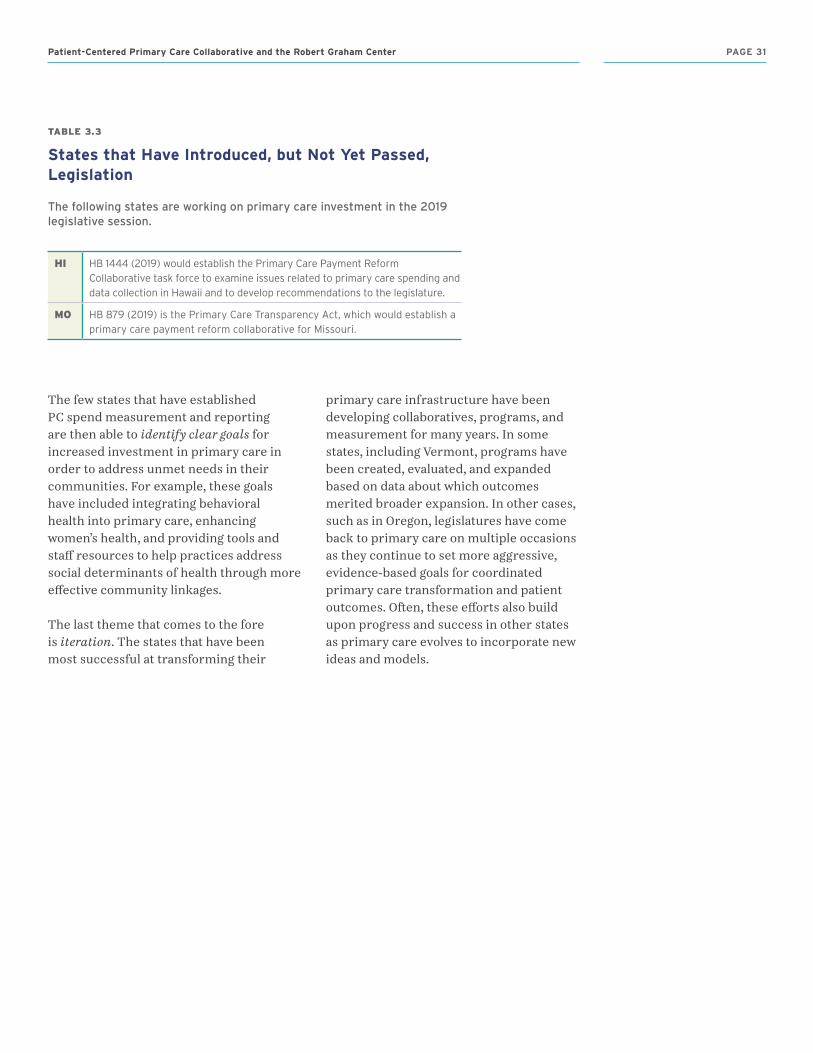
TABLE 3.3
States that Have Introduced, but Not Yet Passed, Legislation
The .following .states .are .working .on .primary .care .investment .in .the .2019 .legislative .session .
HI HB 1444 (2019) would establish the Primary Care Payment Reform Collaborative task force to examine issues related to primary care spending and data collection in Hawaii and to develop recommendations to the legislature.
MO HB 879 (2019) is the Primary Care Transparency Act, which would establish a primary care payment reform collaborative for Missouri.
The few states that have established PC spend measurement and reporting are then able to identify clear goals for increased investment in primary care in order to address unmet needs in their communities. For example, these goals have included integrating behavioral health into primary care, enhancing women’s health, and providing tools and staff resources to help practices address social determinants of health through more effective community linkages.
The last theme that comes to the fore is iteration. The states that have been most successful at transforming their
primary care infrastructure have been developing collaboratives, programs, and measurement for many years. In some states, including Vermont, programs have been created, evaluated, and expanded based on data about which outcomes merited broader expansion. In other cases, such as in Oregon, legislatures have come back to primary care on multiple occasions as they continue to set more aggressive, evidence-based goals for coordinated primary care transformation and patient outcomes. Often, these efforts also build upon progress and success in other states as primary care evolves to incorporate new ideas and models.
Patient-Centered Primary Care Collaborative and the Robert Graham Center PAGE 31
BOX 3.2
Oregon Case Study
Background
In 2009, Oregon’s legislature created the Patient-Centered Primary Care Home Program (PCPCH) and a task force that established a goal of 75% of state residents having access to a patient-centered primary care home by 2015. Eight years later, Portland State University issued an evaluation of the PCPCH that showed a shift in primary care practices toward population-based health strategies. The university also reported that for every additional dollar spent on PCPCHs in the state, $13 was saved in other services, including subspecialty, inpatient, and emergency care.20
In 2016, the Oregon Legislature passed SB 231, which requires reporting from public and private payers on the percentage of medical spending allocated to primary care. This legislation also established the Primary Care Payment Reform Collaborative (PCPRC) and tasked it with developing recommendations to effectively increase PC spend.
In 2017, not long after the aforementioned Portland State University evaluation report, the Oregon Legislature unanimously passed SB 934, mandating that public and private payers have a minimum PC spend rate of 12% by 2023. The legislation also extended the PCPRC through 2027.
In 2019, S.B. 765 was introduced in the Oregon legislature modifying the definitions of primary care (to include behavioral and women’s health clinicians integrated into an Oregon “medical home”) and total cost of medical expenditures (to include pharmaceutical spending) for purposes of public reporting. The 2019 bill passed one chamber but not the other and the legislative session was marked by differences across stakeholder groups about whether drug spending should be included. In a scenario where pharmacy spending is excluded, it deflates the denominator so much that many health plans meet or nearly meet the 12% primary care spend target established for 2023. The OR Collaborative intends to continue work on gaining consensus around primary care spend definitions and total cost of care measurement in the remainder of 2019 and into 2020.
Process
The PCPRC is required to submit an annual report about its progress and recommendations to the Oregon Health Policy Board and the Oregon Legislature. Data for the annual report are gathered from two major sources: 1) for claims payment information, the Oregon All Payer All Claims (APAC) Reporting Program; and 2) for non–claims-based payment information, a reporting template developed by the PCPRC. These data include information from 62% of Oregon’s population, which is roughly 2.5 million Oregonians.25
Outcomes
Unlike requirements developed in Rhode Island, PC spend regulations in Oregon did not require a proportion of PC spend allocation to non-FFS investments (i.e., non–claims-based payments). Despite the absence of such requirements, Oregon organically diverted a greater share of PC spend funds to non–claims-based payments.
• Areas of investment: In 2016, non–claims-based spending (i.e., non-FFS investments) as a percentage of total PC spend ranged from 33.2% to 64.3%, depending on payer source.(OR Report, 2018) For commercial insurers, non–claims-based funds were mostly spent on capitated or salaried payments for physicians, provider incentives, or PCMH recognition payments. Coordinated care organizations and the Oregon Educators Benefit Board (OEBB)/Public Employees’ Benefit Board (PEBB) spent a much larger proportion of non–claims-based investments on capitated or salaried payments for physicians, as well as provider incentives.
• Health care savings, health, and workforce: Given that it is very early days for the Oregon effort, the state has yet to measure key outcomes, but they are currently considering options for evaluating the effectiveness of various payment models
PAGE 32 Investing in Primary Care: A State-Level Analysis
SECTION 4
ImplicationsA number of national and state leaders are calling for a reorientation of the nation’s health care system toward primary care. This appears to be in response to the growing evidence base about the value of primary care, as well as information about the United States’ underinvestment in primary care.
This report provides quantitative data and analysis of primary care (PC) spend at the state and payer levels; a window into the association between PC spend and key patient outcomes; and a description of legislative and regulatory efforts in 10 states to measure PC spend and shift more resources into primary care.
Specifically, using both narrow and broad definitions of primary care, our study showed wide variation across states in primary care investment and differences between commercial insurance, Medicare, and Medicaid/State Children’s Health Insurance Program (SCHIP). The analysis also showed that higher primary care investment is associated with fewer total hospitalizations, emergency department visits, and ambulatory care-sensitive hospitalizations, although causation cannot be inferred. This association is consistent with the literature, which shows that a more primary care-oriented system is less costly and better for patients.
While there are previously discussed limitations with the Medical Expenditure Panel Survey (MEPS) data set used in this report, this initial analysis demonstrates that it is feasible to report PC spend and to identify variations at state and payer
levels. Future research about primary care investment should include results from all 50 states; leverage claims and non-claims payments to fully capture such investment; adjust to account for clinical and sociodemographic variables; and consider a broad range of key patient outcomes as a way to understand the implications of varying levels of primary care investment.
Identifying variations in PC spend is the first step. Then, the goal is to understand what that variation means for the health of a local population and for the cost of health care that the government, employers, patients, and others must bear. This information can inform policymakers’ decisions about resource allocation and prioritization.
As more researchers focus on this topic and the number of states pursuing primary care investment policies increases, the case for a consensus definition of primary care is getting stronger. A consensus definition would allow for comparisons and benchmarking across research studies and across states, health plans, and other entities reporting PC spend. It would reduce the cost, redundancy, and complexity associated with using different definitions and ways of measuring PC spend, as well as help to inform primary care investment policies.
Considerable work lies ahead to gain consensus among U.S. stakeholders on both a standardized definition of what constitutes primary care and a related PC spend measure. In the meantime, this report can inform state efforts to measure and increase primary care investment at the local level without increasing overall health spending.
Patient-Centered Primary Care Collaborative and the Robert Graham Center PAGE 33

Bibliography1. Shi L. Primary care, specialty care, and life chances.
Int J Health Serv. 1994;24(3):431-458.
2. Rasmussen SR, Thomsen JL, Kilsmark J, et al. Preventive health screenings and health consultations in primary care increase life expectancy without increasing costs. Scand J Public Health. 2007;35(4):365-372.
3. Starfield B. Primary care and health: a cross-national comparison. JAMA. 1991;266(16):2268-2671.
4. Macinko J, Starfield B, Shi L. The contribution of primary care systems to health outcomes within Organization for Economic Cooperation and Development (OECD) countries, 1970-1998. Health Serv Res. 2003;38(3):831-865.
5. Macinko J, Starfield B, Shi L. Quantifying the health benefits of primary care physician supply in the United States. Int J Health Serv. 2007;37(1):111-126.
6. Basu S, Berkowitz SA, Phillips RL, Bitton A, Landon BE, Phillips RS. Association of primary care physician supply with population mortality in the United States, 2005-2015. JAMA Intern Med. 2019;179(4):506-514.
7. Reid R, Damberg C, Friedberg MW. Primary care spending in the fee-for-service Medicare population [published online April 15, 2019]. JAMA Intern Med. Accessed June 27, 2019. https://jamanetwork.com/journals/jamainternalmedicine/fullarticle/2730351.
8. UnitedHealth Center for Health Reform & Modernization. Advancing primary care delivery: practical, proven, and scalable approaches. September 2014. Accessed May 24, 2019. https://www.unitedhealthgroup.com/content/dam/UHG/PDF/2014/UNH-Primary-Care-Report-Advancing-Primary-Care-Delivery.pdf.
9. Epperly T, Bechtel C, Sweeney R, et al. The shared principles of primary care: a multistakeholder initiative to find a common voice. Fam Med. 2019;59(2):179-184.
10. American Academy of Family Physicians, American Academy of Pediatrics, American College of Physicians, American Osteopathic Association. Joint principles of the patient-centered medical home. March 2007. Accessed May 24, 2019. https://www.aafp.org/dam/AAFP/documents/practice_management/pcmh/initiatives/PCMHJoint.pdf.
11. Agency for Healthcare Research and Quality. Defining the PCMH. Accessed May 24, 2019. https://pcmh.ahrq.gov/page/defining-pcmh.
12. Patient-Centered Primary Care Collaborative. The impact of primary care practice transformation on cost, quality, and utilization. July 2017. Accessed May 24, 2019. https://www.pcpcc.org/2017EvidenceReport.
13. Agency for Healthcare Research and Quality. Medical Expenditure Panel Survey download data files, documentation, and codebooks. Published January 3, 2019. https://meps.ahrq.gov/mepsweb/data_stats/download_data_files.jsp.
14. Bailit MH, Friedberg MW, Houy ML. Standardizing the measurement of commercial health plan primary care spending. New York, NY: Milbank Memorial Fund; 2017. Accessed May 24, 2019. https://www.milbank.org/publications/standardizing-measurement-commercial-health-plan-primary-care-spending/.
15. Agency for Healthcare Research and Quality. The number of nurse practitioners and physician assistants practicing primary care in the United States. Accessed April 15, 2019. https://www.ahrq.gov/research/findings/factsheets/primary/pcwork2/index.html.
16. Agency for Healthcare Research and Quality. Guide to prevention quality indicators: hospital admission for ambulatory care sensitive conditions. Rockville, Md.: Agency for Healthcare Research and Quality; 2001. Accessed May 24, 2019. https://www.ahrq.gov/downloads/pub/ahrqqi/pqiguide.pdf.
17. Organisation for Economic Co-operation and Development. Realising the full potential of primary health care. 2019. Accessed June 27, 2019. https://www.oecd.org/health/health-systems/OECD-Policy-Brief-Primary-Health-Care-May-2019.pdf.
18. Bodenheimer T, Ghorob A, Willard-Grace R, Grumbach K. The 10 building blocks of high-performing primary care. Ann Fam Med. 2014;12(2):166-171.
19. Pham H, Ginsburg PB. Payment and delivery-system reform–the next phase. N Engl J Med. 2018;379(17):1594-1596.
20. Gelmon S, Wallace N, Sandberg B, Petchel S, Bouranis N. Implementation of Oregon’s PCPCH program: exemplary practice and program findings. September 2016. Accessed June 27, 2019. https://www.oregon.gov/oha/HPA/dsi-pcpch/Documents/PCPCH-Program-Implementation-Report-Sept2016.pdf.
21. Baum A, Song Z, Landon BE, Phillips RS, Bitton A, Basu S. Health care spending slowed after Rhode Island applied affordability standards to commercial insurers. Health Aff (Millwood). 2019;38(2):237-245.
PAGE 34 Investing in Primary Care: A State-Level Analysis
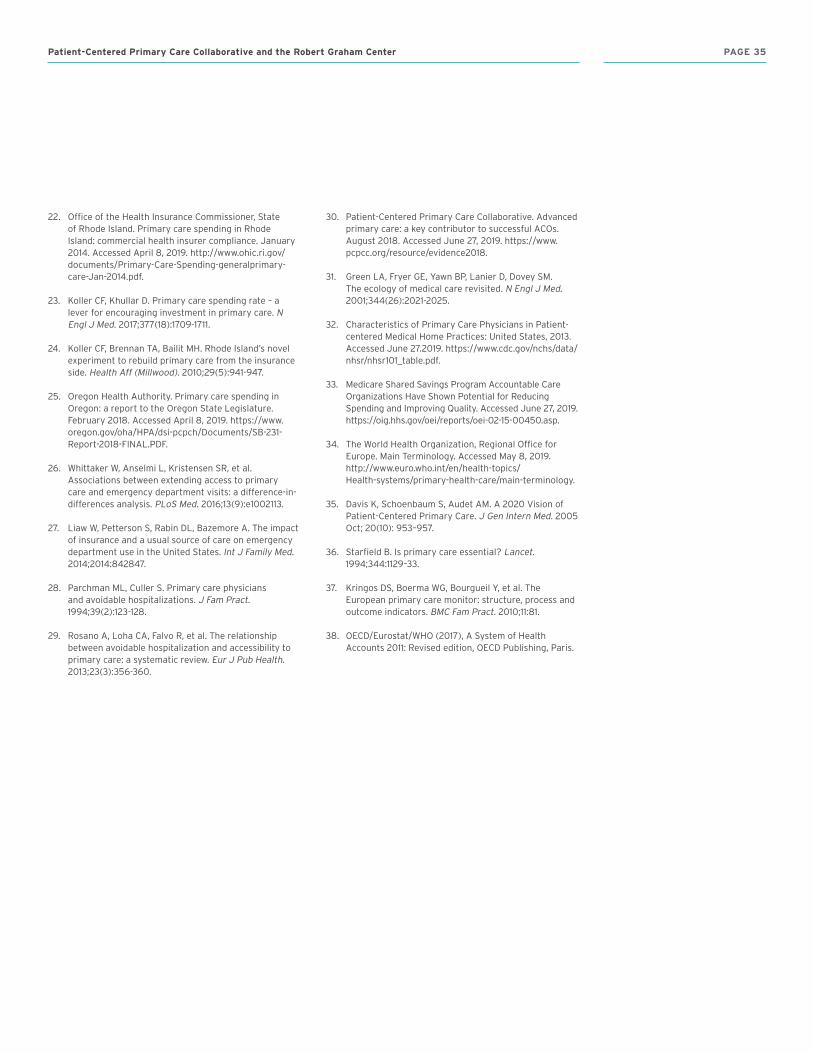
22. Office of the Health Insurance Commissioner, State of Rhode Island. Primary care spending in Rhode Island: commercial health insurer compliance. January 2014. Accessed April 8, 2019. http://www.ohic.ri.gov/documents/Primary-Care-Spending-generalprimary-care-Jan-2014.pdf.
23. Koller CF, Khullar D. Primary care spending rate – a lever for encouraging investment in primary care. N Engl J Med. 2017;377(18):1709-1711.
24. Koller CF, Brennan TA, Bailit MH. Rhode Island’s novel experiment to rebuild primary care from the insurance side. Health Aff (Millwood). 2010;29(5):941-947.
25. Oregon Health Authority. Primary care spending in Oregon: a report to the Oregon State Legislature. February 2018. Accessed April 8, 2019. https://www.oregon.gov/oha/HPA/dsi-pcpch/Documents/SB-231-Report-2018-FINAL.PDF.
26. Whittaker W, Anselmi L, Kristensen SR, et al. Associations between extending access to primary care and emergency department visits: a difference-in-differences analysis. PLoS Med. 2016;13(9):e1002113.
27. Liaw W, Petterson S, Rabin DL, Bazemore A. The impact of insurance and a usual source of care on emergency department use in the United States. Int J Family Med. 2014;2014:842847.
28. Parchman ML, Culler S. Primary care physicians and avoidable hospitalizations. J Fam Pract. 1994;39(2):123-128.
29. Rosano A, Loha CA, Falvo R, et al. The relationship between avoidable hospitalization and accessibility to primary care: a systematic review. Eur J Pub Health. 2013;23(3):356-360.
30. Patient-Centered Primary Care Collaborative. Advanced primary care: a key contributor to successful ACOs. August 2018. Accessed June 27, 2019. https://www.pcpcc.org/resource/evidence2018.
31. Green LA, Fryer GE, Yawn BP, Lanier D, Dovey SM. The ecology of medical care revisited. N Engl J Med. 2001;344(26):2021-2025.
32. Characteristics of Primary Care Physicians in Patient-centered Medical Home Practices: United States, 2013. Accessed June 27.2019. https://www.cdc.gov/nchs/data/nhsr/nhsr101_table.pdf.
33. Medicare Shared Savings Program Accountable Care Organizations Have Shown Potential for Reducing Spending and Improving Quality. Accessed June 27, 2019. https://oig.hhs.gov/oei/reports/oei-02-15-00450.asp.
34. The World Health Organization, Regional Office for Europe. Main Terminology. Accessed May 8, 2019. http://www.euro.who.int/en/health-topics/Health-systems/primary-health-care/main-terminology.
35. Davis K, Schoenbaum S, Audet AM. A 2020 Vision of Patient-Centered Primary Care. J Gen Intern Med. 2005 Oct; 20(10): 953–957.
36. Starfield B. Is primary care essential? Lancet. 1994;344:1129–33.
37. Kringos DS, Boerma WG, Bourgueil Y, et al. The European primary care monitor: structure, process and outcome indicators. BMC Fam Pract. 2010;11:81.
38. OECD/Eurostat/WHO (2017), A System of Health Accounts 2011: Revised edition, OECD Publishing, Paris.
Patient-Centered Primary Care Collaborative and the Robert Graham Center PAGE 35
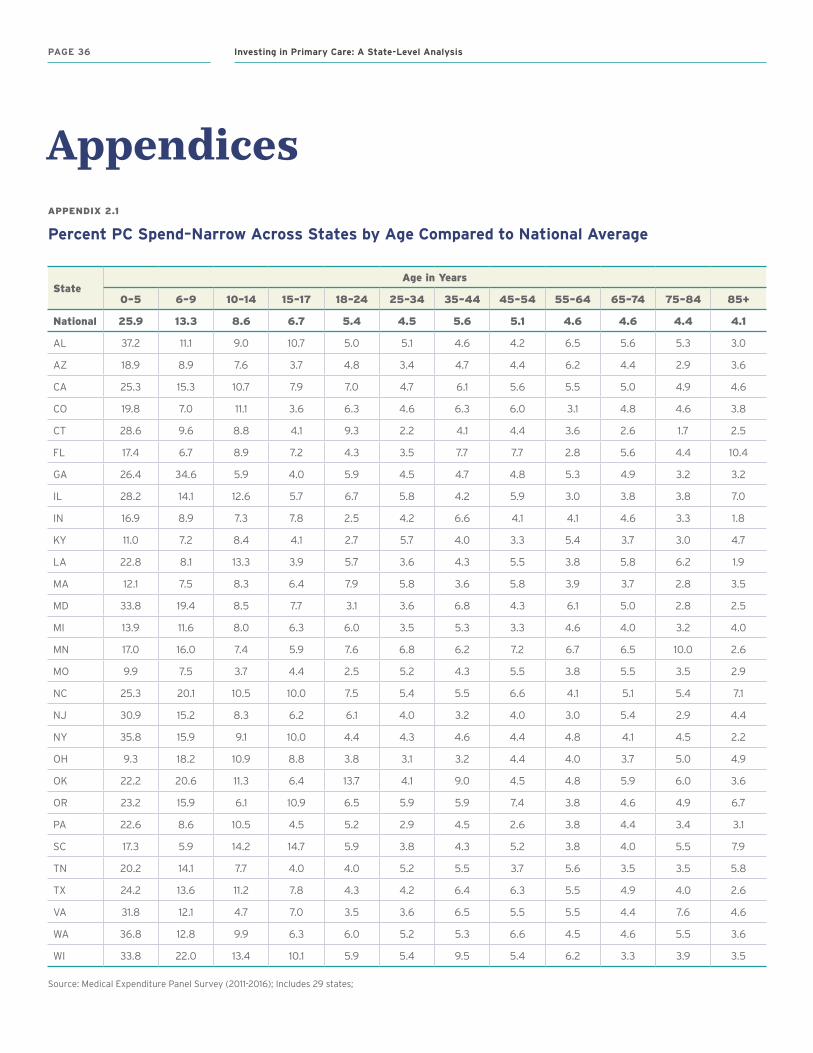
APPENDIX 2.1
Percent PC Spend–Narrow Across States by Age Compared to National Average
StateAge in Years
0–5 6–9 10–14 15–17 18–24 25–34 35–44 45–54 55–64 65–74 75–84 85+
National 25.9 13.3 8.6 6.7 5.4 4.5 5.6 5.1 4.6 4.6 4.4 4.1
AL 37.2 11.1 9.0 10.7 5.0 5.1 4.6 4.2 6.5 5.6 5.3 3.0
AZ 18.9 8.9 7.6 3.7 4.8 3.4 4.7 4.4 6.2 4.4 2.9 3.6
CA 25.3 15.3 10.7 7.9 7.0 4.7 6.1 5.6 5.5 5.0 4.9 4.6
CO 19.8 7.0 11.1 3.6 6.3 4.6 6.3 6.0 3.1 4.8 4.6 3.8
CT 28.6 9.6 8.8 4.1 9.3 2.2 4.1 4.4 3.6 2.6 1.7 2.5
FL 17.4 6.7 8.9 7.2 4.3 3.5 7.7 7.7 2.8 5.6 4.4 10.4
GA 26.4 34.6 5.9 4.0 5.9 4.5 4.7 4.8 5.3 4.9 3.2 3.2
IL 28.2 14.1 12.6 5.7 6.7 5.8 4.2 5.9 3.0 3.8 3.8 7.0
IN 16.9 8.9 7.3 7.8 2.5 4.2 6.6 4.1 4.1 4.6 3.3 1.8
KY 11.0 7.2 8.4 4.1 2.7 5.7 4.0 3.3 5.4 3.7 3.0 4.7
LA 22.8 8.1 13.3 3.9 5.7 3.6 4.3 5.5 3.8 5.8 6.2 1.9
MA 12.1 7.5 8.3 6.4 7.9 5.8 3.6 5.8 3.9 3.7 2.8 3.5
MD 33.8 19.4 8.5 7.7 3.1 3.6 6.8 4.3 6.1 5.0 2.8 2.5
MI 13.9 11.6 8.0 6.3 6.0 3.5 5.3 3.3 4.6 4.0 3.2 4.0
MN 17.0 16.0 7.4 5.9 7.6 6.8 6.2 7.2 6.7 6.5 10.0 2.6
MO 9.9 7.5 3.7 4.4 2.5 5.2 4.3 5.5 3.8 5.5 3.5 2.9
NC 25.3 20.1 10.5 10.0 7.5 5.4 5.5 6.6 4.1 5.1 5.4 7.1
NJ 30.9 15.2 8.3 6.2 6.1 4.0 3.2 4.0 3.0 5.4 2.9 4.4
NY 35.8 15.9 9.1 10.0 4.4 4.3 4.6 4.4 4.8 4.1 4.5 2.2
OH 9.3 18.2 10.9 8.8 3.8 3.1 3.2 4.4 4.0 3.7 5.0 4.9
OK 22.2 20.6 11.3 6.4 13.7 4.1 9.0 4.5 4.8 5.9 6.0 3.6
OR 23.2 15.9 6.1 10.9 6.5 5.9 5.9 7.4 3.8 4.6 4.9 6.7
PA 22.6 8.6 10.5 4.5 5.2 2.9 4.5 2.6 3.8 4.4 3.4 3.1
SC 17.3 5.9 14.2 14.7 5.9 3.8 4.3 5.2 3.8 4.0 5.5 7.9
TN 20.2 14.1 7.7 4.0 4.0 5.2 5.5 3.7 5.6 3.5 3.5 5.8
TX 24.2 13.6 11.2 7.8 4.3 4.2 6.4 6.3 5.5 4.9 4.0 2.6
VA 31.8 12.1 4.7 7.0 3.5 3.6 6.5 5.5 5.5 4.4 7.6 4.6
WA 36.8 12.8 9.9 6.3 6.0 5.2 5.3 6.6 4.5 4.6 5.5 3.6
WI 33.8 22.0 13.4 10.1 5.9 5.4 9.5 5.4 6.2 3.3 3.9 3.5
Source: Medical Expenditure Panel Survey (2011-2016); Includes 29 states;
Appendices
PAGE 36 Investing in Primary Care: A State-Level Analysis
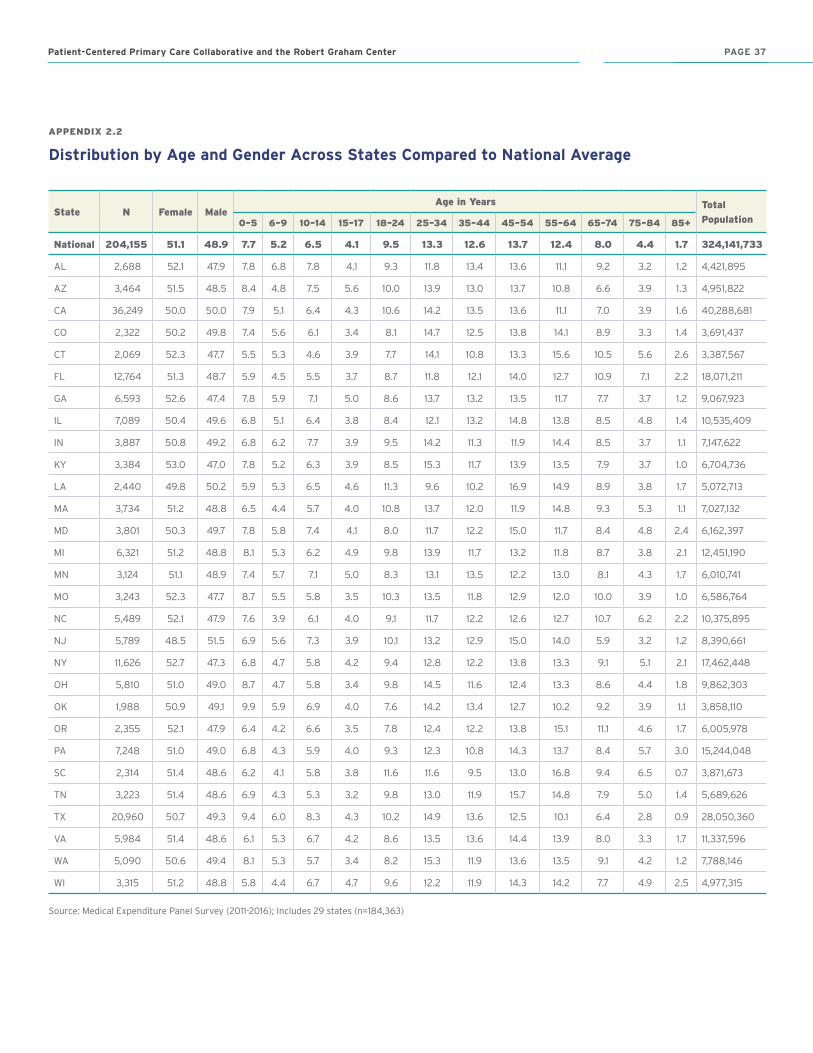
APPENDIX 2.2
Distribution by Age and Gender Across States Compared to National Average
State N Female MaleAge in Years Total
Population0–5 6–9 10–14 15–17 18–24 25–34 35–44 45–54 55–64 65–74 75–84 85+
National 204,155 51.1 48.9 7.7 5.2 6.5 4.1 9.5 13.3 12.6 13.7 12.4 8.0 4.4 1.7 324,141,733
AL 2,688 52.1 47.9 7.8 6.8 7.8 4.1 9.3 11.8 13.4 13.6 11.1 9.2 3.2 1.2 4,421,895
AZ 3,464 51.5 48.5 8.4 4.8 7.5 5.6 10.0 13.9 13.0 13.7 10.8 6.6 3.9 1.3 4,951,822
CA 36,249 50.0 50.0 7.9 5.1 6.4 4.3 10.6 14.2 13.5 13.6 11.1 7.0 3.9 1.6 40,288,681
CO 2,322 50.2 49.8 7.4 5.6 6.1 3.4 8.1 14.7 12.5 13.8 14.1 8.9 3.3 1.4 3,691,437
CT 2,069 52.3 47.7 5.5 5.3 4.6 3.9 7.7 14.1 10.8 13.3 15.6 10.5 5.6 2.6 3,387,567
FL 12,764 51.3 48.7 5.9 4.5 5.5 3.7 8.7 11.8 12.1 14.0 12.7 10.9 7.1 2.2 18,071,211
GA 6,593 52.6 47.4 7.8 5.9 7.1 5.0 8.6 13.7 13.2 13.5 11.7 7.7 3.7 1.2 9,067,923
IL 7,089 50.4 49.6 6.8 5.1 6.4 3.8 8.4 12.1 13.2 14.8 13.8 8.5 4.8 1.4 10,535,409
IN 3,887 50.8 49.2 6.8 6.2 7.7 3.9 9.5 14.2 11.3 11.9 14.4 8.5 3.7 1.1 7,147,622
KY 3,384 53.0 47.0 7.8 5.2 6.3 3.9 8.5 15.3 11.7 13.9 13.5 7.9 3.7 1.0 6,704,736
LA 2,440 49.8 50.2 5.9 5.3 6.5 4.6 11.3 9.6 10.2 16.9 14.9 8.9 3.8 1.7 5,072,713
MA 3,734 51.2 48.8 6.5 4.4 5.7 4.0 10.8 13.7 12.0 11.9 14.8 9.3 5.3 1.1 7,027,132
MD 3,801 50.3 49.7 7.8 5.8 7.4 4.1 8.0 11.7 12.2 15.0 11.7 8.4 4.8 2.4 6,162,397
MI 6,321 51.2 48.8 8.1 5.3 6.2 4.9 9.8 13.9 11.7 13.2 11.8 8.7 3.8 2.1 12,451,190
MN 3,124 51.1 48.9 7.4 5.7 7.1 5.0 8.3 13.1 13.5 12.2 13.0 8.1 4.3 1.7 6,010,741
MO 3,243 52.3 47.7 8.7 5.5 5.8 3.5 10.3 13.5 11.8 12.9 12.0 10.0 3.9 1.0 6,586,764
NC 5,489 52.1 47.9 7.6 3.9 6.1 4.0 9.1 11.7 12.2 12.6 12.7 10.7 6.2 2.2 10,375,895
NJ 5,789 48.5 51.5 6.9 5.6 7.3 3.9 10.1 13.2 12.9 15.0 14.0 5.9 3.2 1.2 8,390,661
NY 11,626 52.7 47.3 6.8 4.7 5.8 4.2 9.4 12.8 12.2 13.8 13.3 9.1 5.1 2.1 17,462,448
OH 5,810 51.0 49.0 8.7 4.7 5.8 3.4 9.8 14.5 11.6 12.4 13.3 8.6 4.4 1.8 9,862,303
OK 1,988 50.9 49.1 9.9 5.9 6.9 4.0 7.6 14.2 13.4 12.7 10.2 9.2 3.9 1.1 3,858,110
OR 2,355 52.1 47.9 6.4 4.2 6.6 3.5 7.8 12.4 12.2 13.8 15.1 11.1 4.6 1.7 6,005,978
PA 7,248 51.0 49.0 6.8 4.3 5.9 4.0 9.3 12.3 10.8 14.3 13.7 8.4 5.7 3.0 15,244,048
SC 2,314 51.4 48.6 6.2 4.1 5.8 3.8 11.6 11.6 9.5 13.0 16.8 9.4 6.5 0.7 3,871,673
TN 3,223 51.4 48.6 6.9 4.3 5.3 3.2 9.8 13.0 11.9 15.7 14.8 7.9 5.0 1.4 5,689,626
TX 20,960 50.7 49.3 9.4 6.0 8.3 4.3 10.2 14.9 13.6 12.5 10.1 6.4 2.8 0.9 28,050,360
VA 5,984 51.4 48.6 6.1 5.3 6.7 4.2 8.6 13.5 13.6 14.4 13.9 8.0 3.3 1.7 11,337,596
WA 5,090 50.6 49.4 8.1 5.3 5.7 3.4 8.2 15.3 11.9 13.6 13.5 9.1 4.2 1.2 7,788,146
WI 3,315 51.2 48.8 5.8 4.4 6.7 4.7 9.6 12.2 11.9 14.3 14.2 7.7 4.9 2.5 4,977,315
Source: Medical Expenditure Panel Survey (2011-2016); Includes 29 states (n=184,363)
Patient-Centered Primary Care Collaborative and the Robert Graham Center PAGE 37PAGE 37
About the Patient-Centered Primary Care CollaborativeFounded in 2006, the Patient-Centered Primary Care Collaborative (PCPCC) is a not-for-profit multi-stakeholder membership organization dedicated to advancing an effective and efficient health system built on a strong foundation of primary care and the patient-centered medical home. Representing a broad group of public and private organizations, PCPCC’s mission is to unify and engage diverse stakeholders in promoting policies and sharing best practices that support growth of high-performing primary care and achieve the “Quadruple Aim”: better care, better health, lower costs, and greater joy for clinicians and staff in delivery of care.
www.pcpcc.org
About the Robert Graham CenterThe Robert Graham Center aims to improve individual and population healthcare delivery through the generation or synthesis of evidence that brings a family medicine and primary care perspective to health policy deliberations from the local to international levels.
www.graham-center.org
About the Milbank Memorial FundThe Milbank Memorial Fund is an endowed operating foundation that works to improve the health of populations by connecting leaders and decision makers with the best available evidence and experience. Founded in 1905, the Fund engages in nonpartisan analysis, collaboration, and communication on significant issues in health policy. It does this work by publishing high-quality, evidence-based reports, books, and The Milbank Quarterly, a peer-reviewed journal of population health and health policy; convening state health policy decision makers on issues they identify as important to population health; and building communities of health policymakers to enhance their effectiveness.
www.milbank.org
Investing in Primary Care: A State-Level Analysis

AcknowledgmentsThis report would not have been possible without the support of the Milbank Memorial Fund, the Robert Graham Center, and the authors and reviewers.
Patient-Centered Primary Care Collaborative and the Robert Graham Center
PCPCC.ORG
601 Thirteenth Street, NW Suite 430 North Washington, DC 20005
GRAHAM-CENTER.ORG
1133 Connecticut Avenue, NWSuite 1100Washington, DC 20036
Made possible with support from:
MILBANK.ORG
645 Madison Avenue, 15th Floor New York, NY 10022