Investing in Genetics - wwszambia.com · Artificial Insemination – Cost vs Investment Financial...
38
Investing in Genetics Rebekah Mast Genetic Director
Transcript of Investing in Genetics - wwszambia.com · Artificial Insemination – Cost vs Investment Financial...
Investing in GeneticsRebekah Mast
Genetic Director

Artificial Insemination -
The AdvantagesThe three main advantages to using Artificial Insemination:1. Reduce the risk of spreading sexually transmitted
diseases.
2. Reduce the costs and dangers of maintaining a bull on the farm.
*Fewer herd bulls needed in cattle operation.
* Lower cost for feed, housing space, labor etc.
* Less risk of injury caused by bull aggression.
3. Genetic Advancement
* Use sires of superior genetic merit (the best bulls of the breed).
* Improve production traits in cattle operations.
* Mate specific sires to individual cows.

Artificial Insemination –
Cost vs InvestmentFinancial Estimate:
* A bull costs about $60 per lactating animal per year to house and use in your herd.
* 1:20 ratio bull:cows
* Feed cost for the bulls
* Displacing cows with bulls
* Studies show that 1 in 4 bulls are either sub-fertile or infertile
Assuming 3 straws of semen per pregnancy, that is at least $20 per unit of semen that you could instead invest in top level genetics.
Modern dairy producers see the use of A.I. as a critical investment for their success. Do not allow the genetics you use become a ceiling.
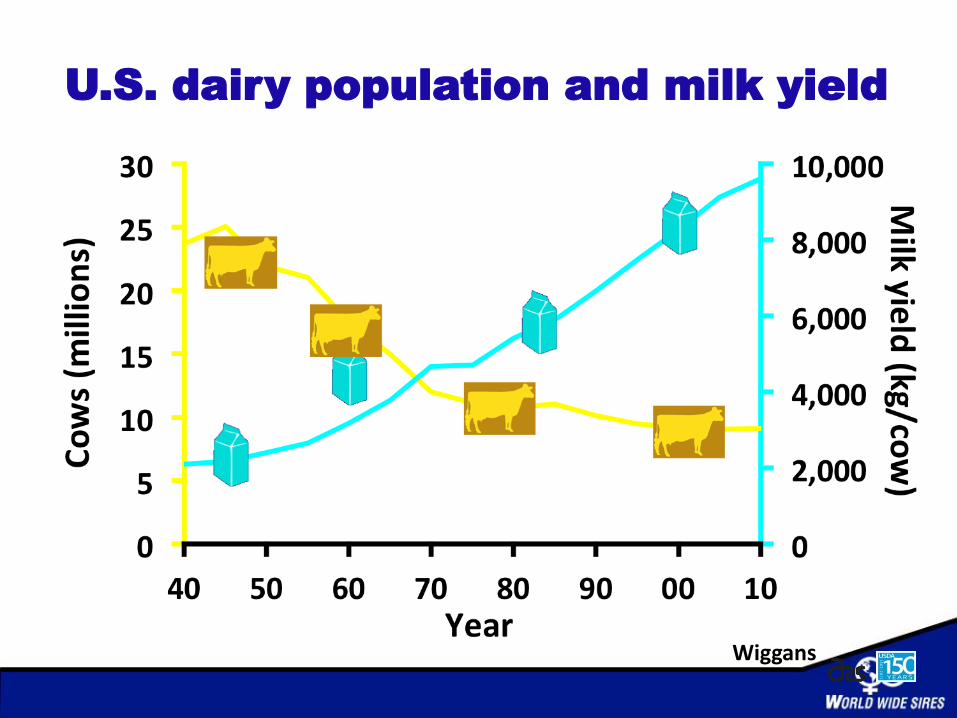
U.S. dairy population and milk yield
Wiggans

1930s – 1,500 kg of
milk/cow/year
1940s – 2,020 kg of
milk/cow/year
Genetic Advancement
1950s - 2,500 kg of
milk/cow/year
21st Century – 10,126 kg of
milk/cow/year

Where do the elite bulls come from?
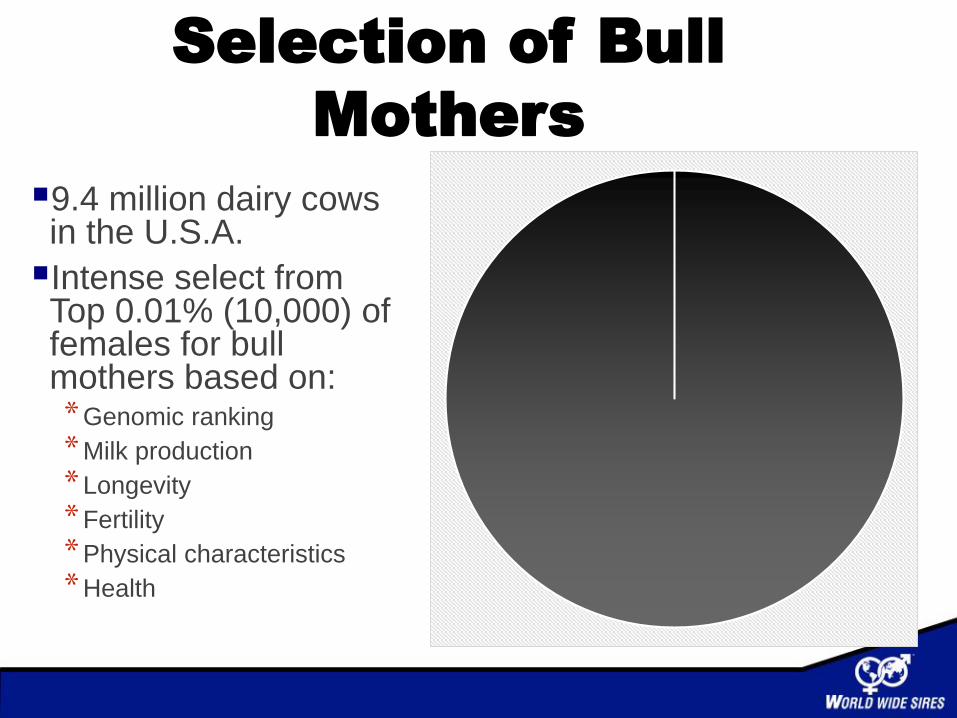
Selection of Bull
Mothers
9.4 million dairy cows in the U.S.A.
Intense select from Top 0.01% (10,000) of females for bull mothers based on:*Genomic ranking
*Milk production
*Longevity
*Fertility
*Physical characteristics
*Health
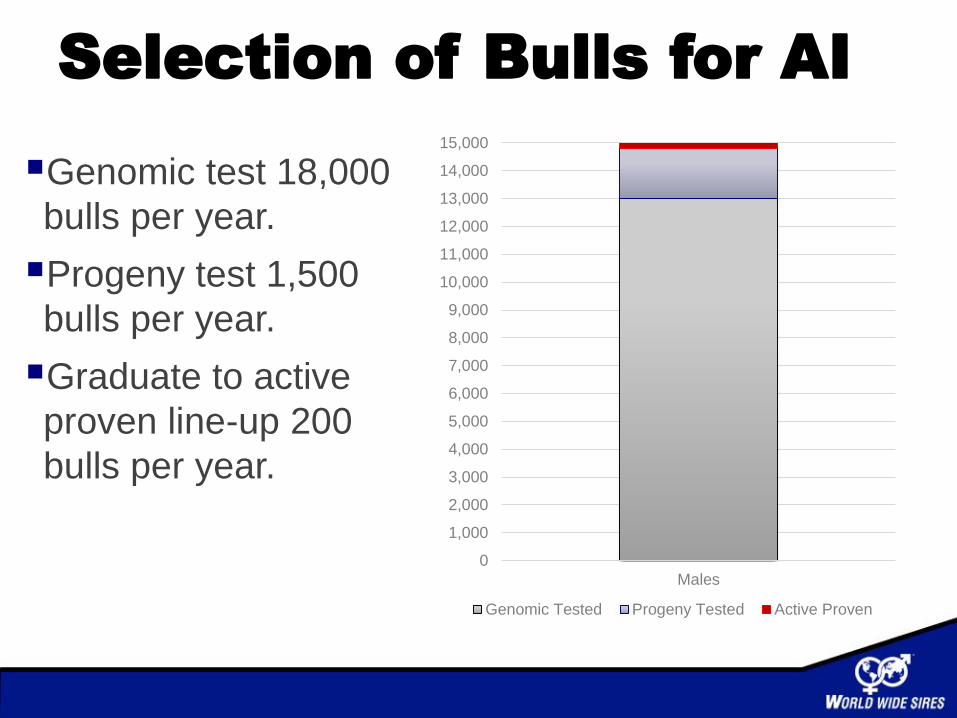
Selection of Bulls for AI
0
1,000
2,000
3,000
4,000
5,000
6,000
7,000
8,000
9,000
10,000
11,000
12,000
13,000
14,000
15,000
Males
Genomic Tested Progeny Tested Active Proven
Genomic test 18,000
bulls per year.
Progeny test 1,500
bulls per year.
Graduate to active
proven line-up 200
bulls per year.
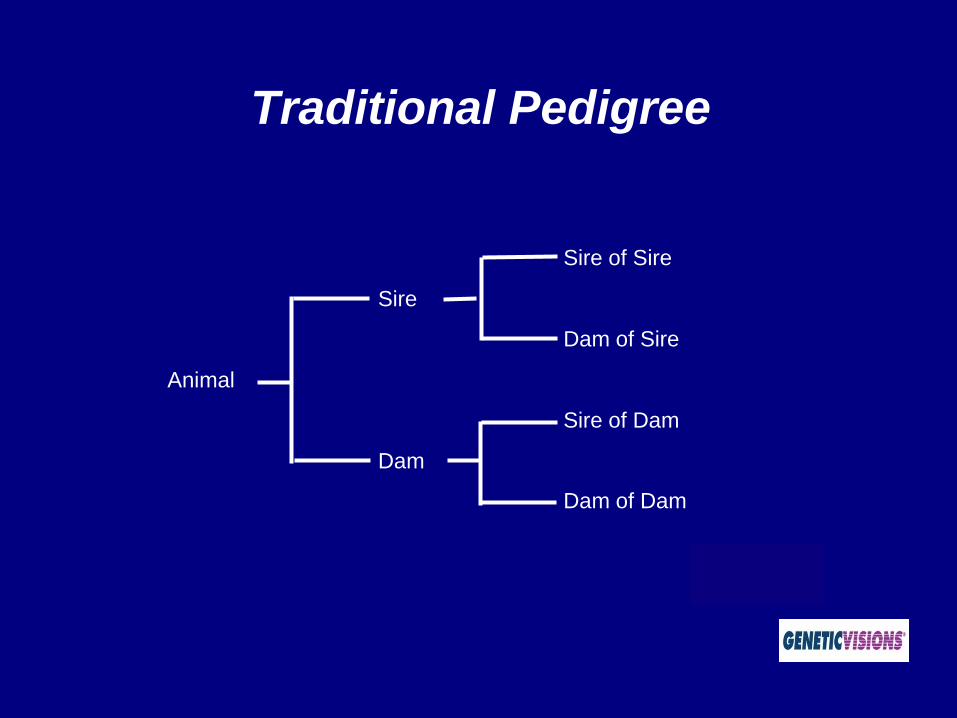
Traditional Pedigree
Dam of Dam
Sire of Dam
Dam of Sire
Sire of Sire
Dam
Animal
Sire

Real Life Example
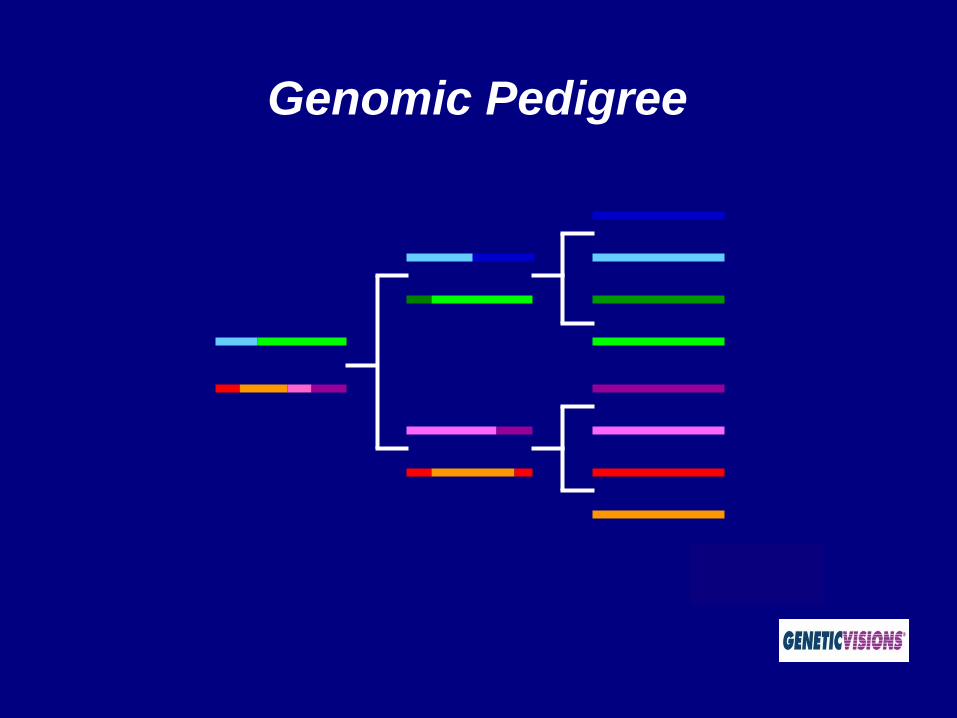
Genomic Pedigree
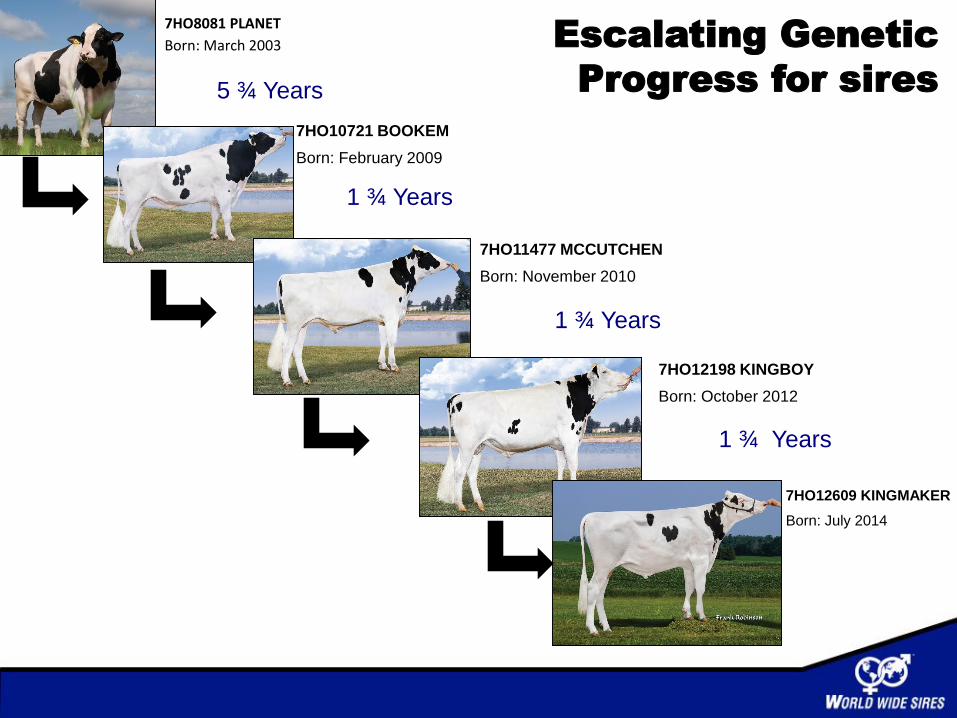
Escalating Genetic
Progress for sires
7HO8081 PLANET
Born: March 2003
7HO10721 BOOKEM
Born: February 2009
7HO11477 MCCUTCHEN
Born: November 2010
7HO12198 KINGBOY
Born: October 2012
7HO12609 KINGMAKER
Born: July 2014
5 ¾ Years
1 ¾ Years
1 ¾ Years
1 ¾ Years

NAAB number
Daughter Average
Registration numberSire Stack
Production Traits
Type Traits
Health Traits
Linear Type Traits
Wellness TraitsFertility Traits
Indexes

PTA: Predicted Transmitting Ability
Major Traits Measured in Holsteins
PTA Trait Avg. Low High
Milk (kg) 325 -934 1285
Fat (kg) 15 -27 42
Fat % .03 -.24 .37
Protein (kg) 11 -24 33
Protein % .01 -.17 .18
Type 1.60 -2.39 4.53
UDC 1.36 -2.45 3.94
FLC 1.36 -1.46 3.84
PL 1.6 -4.7 7.1
DPR -0.1 -4.1 3.5
SCS* 2.86 2.36 3.43
Estimate of genetic superiority that cow or bull will transmit to its offspring for a given trait.
Expressed as the difference between an animal’s offspring and entire breed population.
Used to rank cows and bulls by genetic merit.
* Lower values are better

Total Performance Index – commonly used index for ranking Holsteins. Combines type, production and health and fertility traits.
Net Merit $ – commonly used index for ranking dairy cattle of all breeds. Measures the expected lifetime profit that the offspring of an animal will provide over their lifetime based upon production, udder health, longevity, and body size.
The Feed Efficiency (FE) Index takes into account the individual feed costs to produce an extra pound of milk, fat and protein while accounting for differences in maintenance costs, housing costs and calving weights that may be attributed to the size of the cow. Cows that produce high volumes of milk without requiring high volumes of feed are rewarded in this index.
FE = (dollar value of milk produced) – (feed cost of extra milk) – (extra maintenance cost)
WT$ Places economic weights on wellness traits, directly estimating potential profit contribution of these traits for an individual animal. This multitraitselection index focuses solely on wellness traits:Mastitis 41%Lameness 27% Metritis 19%Retained Placenta 6%Displaced Abomasum 6%Ketosis 1%Economic value for Polled
DWP$ A multi-trait selection index that includes production, fertility, type, longevity, and the wellness traits, including Polled test results.Production 34%Wellness 30%Health and Calving 19%Type 10%Fertility 7%
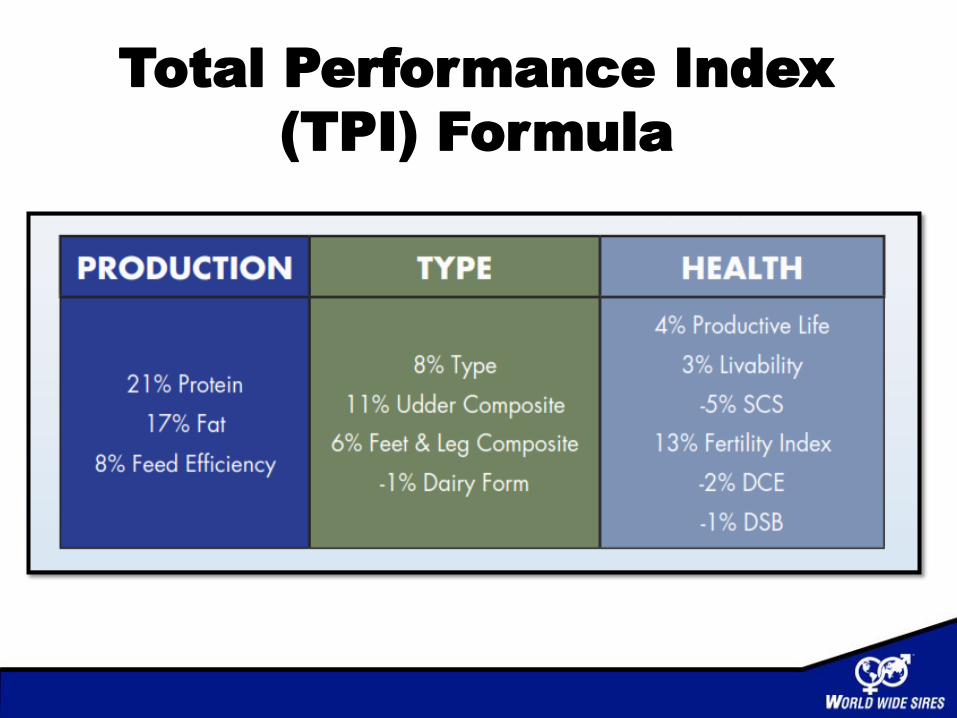
Total Performance Index
(TPI) Formula
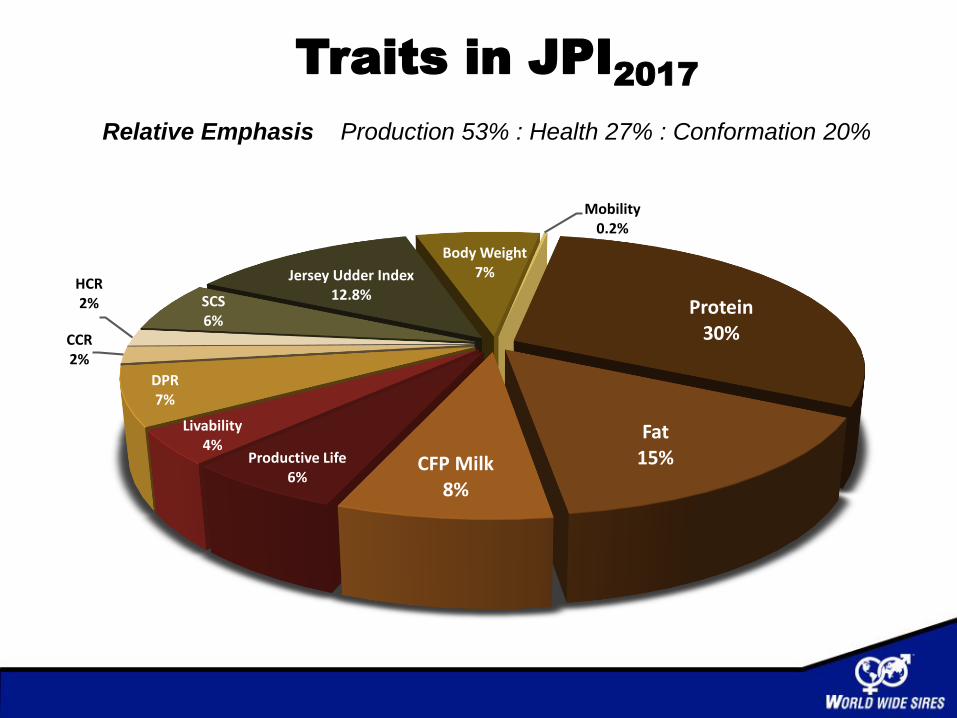
Traits in JPI2017
Relative Emphasis Production 53% : Health 27% : Conformation 20%
Protein30%
Fat15%CFP Milk
8%
Productive Life6%
Livability4%
DPR7%
CCR2%
HCR2% SCS
6%
Jersey Udder Index12.8%
Body Weight7%
Mobility0.2%
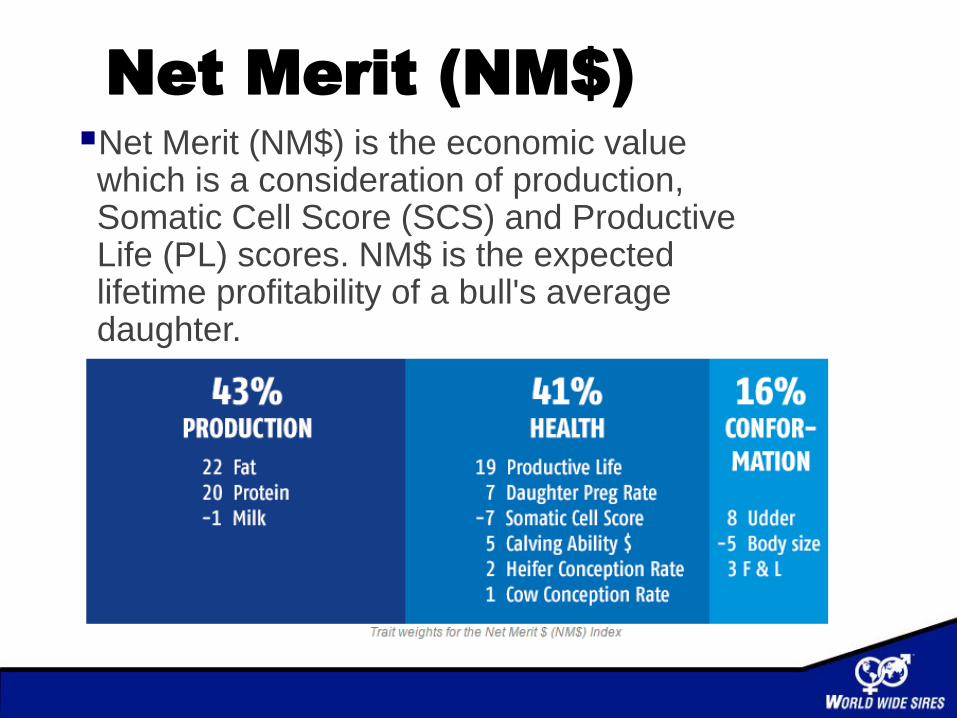
Net Merit (NM$)Net Merit (NM$) is the economic value which is a consideration of production, Somatic Cell Score (SCS) and Productive Life (PL) scores. NM$ is the expected lifetime profitability of a bull's average daughter.

Predicted Transmitting Ability for Protein and Fatpercent. This is an estimate of the percent of protein or fat in the milk that a daughter of the bull will produce throughout her lifetime.
Predicted Transmitting Ability for Milk, Protein and Fatpounds. This is an estimate of the pounds of milk, protein or fat that a daughter of the bull will produce, above or below the average population, throughout her lifetime. The level of confidence that
can be placed in a sire’s production data based on pedigree, genomic and daughter information.
Number of daughters in number of herds contributing daughter production information to milk, protein and fat PTA’s.

Number of daughters in number of herds contributing daughter information to Type PTA’s.
Percent reliability for type information based on pedigree and genomic information as well as the number of daughters in a bull’s proof.
Predicted Transmitting Ability for Type. The ability of an animal to transmit genetics for type or confirmation improvement traits to its offspring.
A composite score of udder traits as weighted by the contribution of each trait to increased longevity.
A composite score of foot angle, rear legs rear view, rear legs side view, and foot and leg score.
A composite score of linear frame traits including stature, strength, body depth and rump width.
A composite score of dairy form and strength.

Daughter
Pregnancy Rate
measures the
ability of a bulls’
daughters to
become pregnant.
Every 1% indicates
4 fewer days open.
Sire Conception Rate is an
indicator of the fertility of a bull
based upon conception rate
across all services.
Fertility Index combines values
from three measures of
reproductive performance to
provide one overall fertility
score. Fertility Index = 18%
HCR + 18% CCR + 64% DPR
HCR (Heifer Conception Rate)
measures the ability of virgin
heifers to conceive. An HCR of
1.0 equates to a 1% increase
in heifer conception rate.
CCR (Cow Conception Rate)
measures the ability of
lactating cows to conceive. A
CCR of 1.0 equates to a 1%
increase in cow conception
rate.

Sire Calving Ease – Percentage of assisted births expected when this bull is used on virgin heifers. The tendency of calves from a particular service sire to be born more or less easily than an average calf.
Daughter Calving Ease - Percentage of daughters of a particular sire that have more (or fewer) problems at calving time and produce calves that are born more or less easily than calves produced by an average cow.
Sire Still Births/Daughter Still Births – Measures the tendency of calves/daughters from a particular service sire to be stillborn or to give birth to stillborn calves.
Somatic Cell Score measures the ability of a bull’s daughters to resist mastitis.
The number of months that a cow is in production as compared to the average number of months in production for the breed.
PTA Livability (LIV) is the percent of a bull's daughters above or below the average of the breed that remain alive in the herd until they can be culled and provide a source of income for the herd.
Gestation Length is expressed as the number of days greater than or less than the average gestation length for the breed

STA:
Standard Transmitting Ability
Used for linear type traits: Udder Depth, Stature, etc.
Average score for all linear traits is 0
STA values generally range from –3 to +3
The greatest number of bulls are STA = 0 for each trait
68% of bulls are within 1 STA in each direction of the average

Linear Type Traits
Developing an Effective
Breeding Program
GENETICS ARE AN INVESTMENT
Major returns from one of the smallest
but best investments on the dairy.

Two Ways to Increase Genetic
Average
1. Improve the top genetics
*Sire selection
*Mating Program
2. Eliminate bottom genetics
*Cull or do not breed poor
cows
* Will she survive?
* Will she make money?
* Do I want to milk her heifers?

What Prevents
Achieving Our Goals?
Genetics
Inferior quality
Improper combination of traits
Management
Poor cow comfort
Inappropriate nutrition
Illness and injury

Moving Forward
Set Genetic Goals
Determine which cows are most profitable.
Consider milk market of 5-10 years in the future.
Select sires that are in line with genetic goals
Focus on traits that impact profitability.
Keep accurate records
Essential for tracking progress and properly
identifying the source of problems.
Beyond the Bull
Create a genetic plan.
Maximize genetic progress.
Escalate genetic advancement.
Goal = Improve the herd (or next generation) to
genetic levels at or above international
standards.
Implement strategies and advanced genetic
tools used by the world’s most elite dairies.

There Is No Shortage Of Semen

Building a Genetic Plan
Go beyond simply picking bulls for maximum milk production.
Use custom indexes tailored to your long term goals.
Create cows that will last a long time on your dairy.
Creating a Genetic
Plan
Evaluate your foundational herd.
Consider market dynamics.
Focus on your operation’s goals.
Develop a customized Index.
Select the best bulls for your genetic strategy.
Implement the plan and make genetic progress.

SCR measures the fertility of all bulls, foreign
and domestic, who have been used on the U.S.
dairy cattle population.
Not a genetic trait – so what makes the
difference?
*Semen Quality
*Lab Expertise
*Knowing what to discard and discarding it
*Concentration
SCR: Sire Conception
Rate

Fertility AdvantageWWS offers leading genetics and fertility.
*SCR is the industry standard for evaluating sire fertility, based on
hundreds of thousands of breedings. WWS is home to more high SCR
bulls than any other AI company.
0.01
-0.47
0.96
1.26
-0.43
1.44
-0.5 0 0.5 1 1.5
Stud E
Stud D
Stud C
Stud B
Stud A
*WWS
Industry Average
+0.42

The Result