Investigations on the phase transition of Mn-doped BaTiO3 ...
9
Journal of Sol-Gel Science and Technology (2018) 88:584–592 https://doi.org/10.1007/s10971-018-4835-3 ORIGINAL PAPER: SOL-GEL AND HYBRID MATERIALS FOR DIELECTRIC, ELECTRONIC, MAGNETIC AND FERROELECTRIC Investigations on the phase transition of Mn-doped BaTiO 3 multifunctional ferroelectric ceramics through Raman, dielectric, and magnetic studies K. Madhan 1 ● R. Thiyagarajan 2 ● C. Jagadeeshwaran 1 ● A. Paul Blessington Selvadurai 3 ● V. Pazhanivelu 1 ● K. Aravinth 4 ● Wenge Yang 2,5 ● R. Murugaraj 1 Received: 24 July 2018 / Accepted: 25 September 2018 / Published online: 4 October 2018 © Springer Science+Business Media, LLC, part of Springer Nature 2018 Abstract BaTiO 3 (BTO) and BaTi 1-x Mn x O 3 (x = 0.25, 0.50, 0.75 mol%) ceramic materials have been prepared by the sol–gel combustion method. X-ray diffraction (XRD) has been carried out to characterize the phase purity and crystal structure of the prepared compounds, and all XRD patterns suggest tetragonal structure with the phase group of P4mm. The variation in the estimated lattice parameters confirms the incorporation of Mn atoms at Ti site of BTO. Raman spectroscopy studies under various temperatures suggest a phase transition from tetragonal to cubic phase at ~433 K, identified by a distinct Raman mode at 308 cm -1 . As Raman modes are getting softened by Mn doping, phase transition temperature of the Mn-doped compounds is significantly decreased from 473 K (x = 0%) to 433 K (x = 0.75%). Dielectric properties such as permittivity and dielectric loss as the function of frequency under various temperatures have two distinct dielectric anomalies (i) at 393 K associated to tetragonal to cubic phase transition and (ii) at 550 K due to oxygen vacancy defect in the samples. Observation of weak ferromagnetism at 2, 300, and 400 K in the M (H) and ZFC-FC curve, suppose its origin due to an intriguing exchange interaction between Mn and oxygen vacancies. Graphical Abstract Highlights ● Mn-doped BaTiO 3 is prepared by sol–gel combustion method. ● The structural phase transition from tetragonal to cubic phase occurs at ~433 K. * R. Murugaraj [email protected] 1 Department of Physics, MIT Campus, Anna University, Chennai 600044, India 2 Center for High Pressure Science and Technology Advanced Research (HPSTAR), 201203 Shanghai, People’s Republic of China 3 Department of Nuclear Physics, University of Madras, Chennai 600025, India 4 SSN Research Center, SSN College of Engineering, Kalavakkam 603110, India 5 Center for the Study of Matter at Extreme Conditions, Florida International University, Miami, FL 33199, USA 1234567890();,: 1234567890();,:
Transcript of Investigations on the phase transition of Mn-doped BaTiO3 ...
Journal of Sol-Gel Science and Technology (2018) 88:584–592https://doi.org/10.1007/s10971-018-4835-3
ORIGINAL PAPER: SOL-GEL AND HYBRID MATERIALS FOR DIELECTRIC,ELECTRONIC, MAGNETIC AND FERROELECTRIC
Investigations on the phase transition of Mn-doped BaTiO3multifunctional ferroelectric ceramics through Raman, dielectric,and magnetic studies
K. Madhan1● R. Thiyagarajan2 ● C. Jagadeeshwaran1
● A. Paul Blessington Selvadurai3 ● V. Pazhanivelu1●
K. Aravinth4● Wenge Yang2,5
● R. Murugaraj 1
Received: 24 July 2018 / Accepted: 25 September 2018 / Published online: 4 October 2018© Springer Science+Business Media, LLC, part of Springer Nature 2018
AbstractBaTiO3 (BTO) and BaTi1−xMnxO3 (x= 0.25, 0.50, 0.75 mol%) ceramic materials have been prepared by the sol–gelcombustion method. X-ray diffraction (XRD) has been carried out to characterize the phase purity and crystal structure of theprepared compounds, and all XRD patterns suggest tetragonal structure with the phase group of P4mm. The variation in theestimated lattice parameters confirms the incorporation of Mn atoms at Ti site of BTO. Raman spectroscopy studies undervarious temperatures suggest a phase transition from tetragonal to cubic phase at ~433 K, identified by a distinct Ramanmode at 308 cm−1. As Raman modes are getting softened by Mn doping, phase transition temperature of the Mn-dopedcompounds is significantly decreased from 473 K (x= 0%) to 433 K (x= 0.75%). Dielectric properties such as permittivityand dielectric loss as the function of frequency under various temperatures have two distinct dielectric anomalies (i) at 393 Kassociated to tetragonal to cubic phase transition and (ii) at 550 K due to oxygen vacancy defect in the samples. Observationof weak ferromagnetism at 2, 300, and 400 K in the M (H) and ZFC-FC curve, suppose its origin due to an intriguingexchange interaction between Mn and oxygen vacancies.
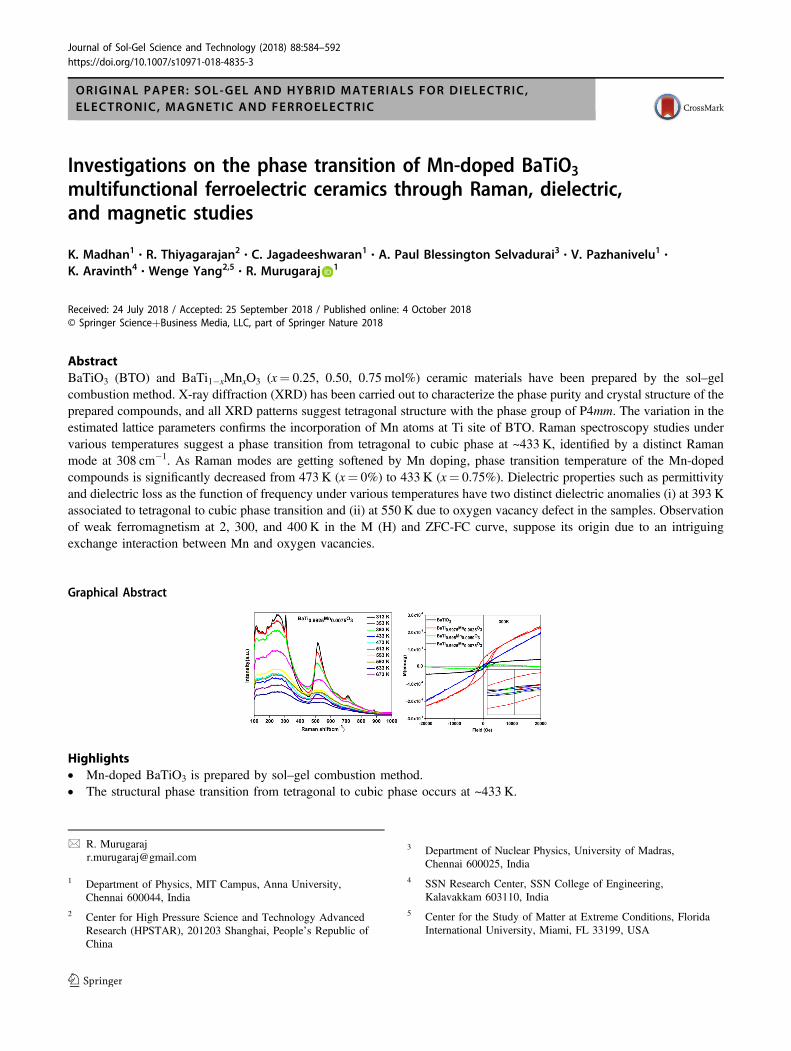
Graphical Abstract
Highlights● Mn-doped BaTiO3 is prepared by sol–gel combustion method.● The structural phase transition from tetragonal to cubic phase occurs at ~433 K.
* R. [email protected]
1 Department of Physics, MIT Campus, Anna University,Chennai 600044, India
2 Center for High Pressure Science and Technology AdvancedResearch (HPSTAR), 201203 Shanghai, People’s Republic ofChina
3 Department of Nuclear Physics, University of Madras,Chennai 600025, India
4 SSN Research Center, SSN College of Engineering,Kalavakkam 603110, India
5 Center for the Study of Matter at Extreme Conditions, FloridaInternational University, Miami, FL 33199, USA
1234
5678
90();,:
1234567890();,:
SH-USER1
Text Box
HPSTAR 661-2018
● Phase transition associated with a distinct Raman mode at ~308 cm−1.● M–H loop shows weak ferromagnetism with intriguing exchange interactions.
Keywords Sol–gel combustion ● Phase transition ● Raman and dielectric spectroscopy ● Ferromagnetism
1 Introduction
Ferroelectric materials in nanoceramic phase are becominga recent interest of research due to its complex physicalproperties and their applications in device fabrication suchas in nonlinear optics, multilayer ceramic capacitors,actuators, transducers, ferroelectric random access mem-ories, micro-electro-mechanical systems, positive tempera-ture co-efficient thermostats, microwave devices,spintronics, and infrared sensors etc [1, 2]. In particular,BaTiO3 (BTO) belongs to ABO3 perovskite-type ferro-electric material (A= Ba and B= Ti) with 12- and 6-foldcoordination of the oxygen in its structural framework [3].While increasing the temperature, it exhibits various struc-tures such as rhombohedral, orthorhombic, tetragonal,cubic, and hexagonal phases till 183, 273, 300, 403, and1773 K, respectively [4]. The phase transition temperatureand intricate electrical properties of BTO can be efficientlycontrolled by doping at Ba and/or Ti sites. In addition, wefound explicitly in the literature that the doping with tran-sition metal cations such as Mn, Cr, Fe, Co, Ni, and Cu at Tisite of BTO have shown significant enhancement in elec-trical and magnetic properties [5]. In particular, Mn dopingat Ti site has been extensively studied and reported byvarious groups [4, 6, 7] and suggested that doping of Mn inBTO acts as an acceptor type, and thereby enhances elec-trical resistivity near the Curie temperature (TC). Further, itfound that Mn doping in BTO induces ferromagnetic (FM)nature and escalates the grain size too. Also, Mn doping inBTO enriches its applicability towards the multifunctionalmaterials, and investigations are still going on.
Till now from most of the reports, Mn-doped BTOsamples were prepared with methods like solid-state reac-tion, hydrothermal synthesis, and thin film depositiontechnology, and focused only on the microstructural anddielectric properties [8–16]. On the other hand, there areonly a few reports on chemically prepared nanoceramics ofMn-doped BTO with the detailed study on structural andmagnetic phase transitions [5, 17]. Among various chemicalmethods, sol–gel combustion technique offers a goodcomposition, homogeneity, purity, and crystallite size of thenanoceramics at a microscopic level and moderate by thesintering temperature [18]. In addition, an inducement ofdefects in the sol–gel method is still a quest to study.Thereby, magnetic characteristics and structural phasetransition of Mn-doped BTO samples prepared by sol–gelcombustion method will be interesting. Herein the present
paper, we have investigated the phase transition of Mn-doped BTO through Raman, dielectric, and magnetic stu-dies under various temperatures, and origin of ferro-magnetism and its enhancement due to Mn doping in BTOare analyzed based on the role of defects.
2 Experimental details
BaTi1−xMnxO3 (x= 0.0, 0.25, 0.50, 0.75 mol%) samples aresynthesized by sol–gel combustion technique. The pre-cursors such as titanium isopropoxide, manganese acetate,barium nitrate, acetic acid, ethanol, polyethylene glycol(PEG), and citric acid are used without further purification,and ammonia solution is taken in corresponding stoichio-metric. In the present work, PEG: citrate ratio are main-tained at 1:2 and pH of the admixture solution were kept at~9. The solution is stirred, dried and burnt into the carbo-naceous product in open atmosphere. This obtained productis calcined and heat treated at 900 °C for 3 h. Finally, thecalcined products are pelletized and sintered at 1000˚C for5 h.
Powder X-ray diffraction (XRD) patterns are measuredby Bruker-D2 phaser diffractometer with Cu-Kα (λ=1.5418 Å) radiation to determine the crystal structure of theprepared samples. Raman spectra are recorded using Ramanspectrometer (RenishawInc.) with excitation laser wave-length 532 nm. For dielectric measurement, the pellet withdimensions of 10 mm (dia) and 1 mm (thickness) are sin-tered and coated with silver paste as contact electrodes onboth sides. The frequency and temperature dependentdielectric measurements are carried out on the sinteredpellets by employing PSM1735NumetriQ, UK. Tempera-ture- and field-dependent magnetization measurements areexecuted using physical property measurement system(PPMS, Quantum design, USA).
3 Results and discussions
3.1 Structural analysis
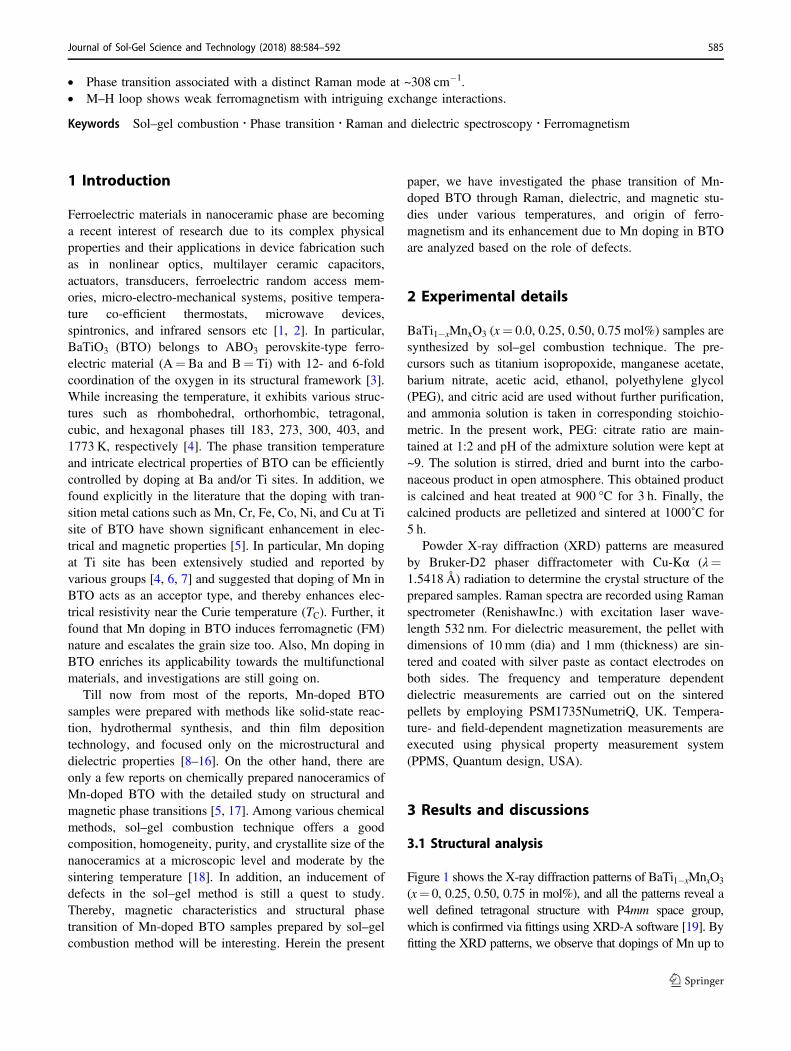
Figure 1 shows the X-ray diffraction patterns of BaTi1−xMnxO3
(x= 0, 0.25, 0.50, 0.75 in mol%), and all the patterns reveal awell defined tetragonal structure with P4mm space group,which is confirmed via fittings using XRD-A software [19]. Byfitting the XRD patterns, we observe that dopings of Mn up to
Journal of Sol-Gel Science and Technology (2018) 88:584–592 585
0.75mol% do not instigate any impurity phases and structuralchanges in the prepared samples. The lattice parameters andunit cell volume of all the prepared samples are obtained byrefinement, and the results are reported in Table 1. The latticeparameters a, c, and c/a ratio are increased with Mn doping inBTO, which is ascribed to the ionic size difference of (Mn2+(rion= 0.83Å))/(Mn3+(rion= 0.645Å)) and Ti4+ (rion=0.605Å) ions [9]. Also, the linear increase of unit cell volumeis observed from Table 1 and a corresponding shift in the XRDpattern of (110) plane as shown in Fig. 1b. Explicates theVegard’s law trend [20], which implying the doping of Mn2+/Mn3+ cations in Ti site. The crystallite size of the preparedsamples are calculated using Scherrer formula
D ¼ kλ
βcosθð1Þ
Where D is the crystallite size, k is shape factor (0.94), λ isthe wavelength of Cu-Kα line (1.5418 Å), β is full width athalf maximum in radians, and θ is peak position in degree.The average crystallites sizes are found to be 34, 43, 46, and49 nm for pristine and Mn-doped BTO samples respec-tively; thereby, the increasing trend confirms incorporationof Mn at Ti site of BTO by doping.
3.2 Raman spectroscopy analysis
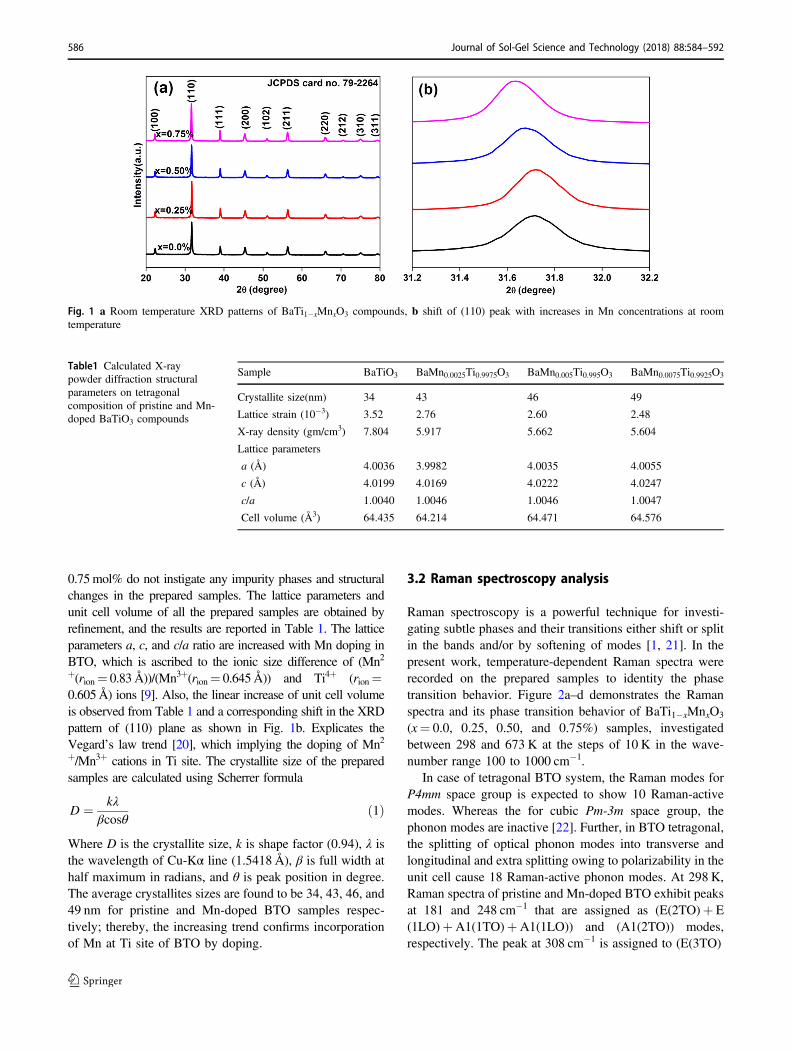
Raman spectroscopy is a powerful technique for investi-gating subtle phases and their transitions either shift or splitin the bands and/or by softening of modes [1, 21]. In thepresent work, temperature-dependent Raman spectra wererecorded on the prepared samples to identity the phasetransition behavior. Figure 2a–d demonstrates the Ramanspectra and its phase transition behavior of BaTi1−xMnxO3
(x= 0.0, 0.25, 0.50, and 0.75%) samples, investigatedbetween 298 and 673 K at the steps of 10 K in the wave-number range 100 to 1000 cm−1.
In case of tetragonal BTO system, the Raman modes forP4mm space group is expected to show 10 Raman-activemodes. Whereas the for cubic Pm-3m space group, thephonon modes are inactive [22]. Further, in BTO tetragonal,the splitting of optical phonon modes into transverse andlongitudinal and extra splitting owing to polarizability in theunit cell cause 18 Raman-active phonon modes. At 298 K,Raman spectra of pristine and Mn-doped BTO exhibit peaksat 181 and 248 cm−1 that are assigned as (E(2TO)+ E(1LO)+A1(1TO)+A1(1LO)) and (A1(2TO)) modes,respectively. The peak at 308 cm−1 is assigned to (E(3TO)
Fig. 1 a Room temperature XRD patterns of BaTi1−xMnxO3 compounds, b shift of (110) peak with increases in Mn concentrations at roomtemperature
Table1 Calculated X-raypowder diffraction structuralparameters on tetragonalcomposition of pristine and Mn-doped BaTiO3 compounds
Sample BaTiO3 BaMn0.0025Ti0.9975O3 BaMn0.005Ti0.995O3 BaMn0.0075Ti0.9925O3
Crystallite size(nm) 34 43 46 49
Lattice strain (10−3) 3.52 2.76 2.60 2.48
X-ray density (gm/cm3) 7.804 5.917 5.662 5.604
Lattice parameters
a (Å) 4.0036 3.9982 4.0035 4.0055
c (Å) 4.0199 4.0169 4.0222 4.0247
c/a 1.0040 1.0046 1.0046 1.0047
Cell volume (Å3) 64.435 64.214 64.471 64.576
586 Journal of Sol-Gel Science and Technology (2018) 88:584–592
+ E(2LO)+ B1). A peak at 512 cm−1 assigned as (E(4TO)+A1(3TO)), and at 717 cm−1 as (E(4LO)+A1(3LO)) thatare the predominate Raman modes occur exclusively for thetetragonal phase of BTO [23, 24]. In addition, the 308 and717 cm−1 peaks indicate the tetragonality of BTO, whichare for identifying the phase transition in pristine and Mn-doped BTO compounds.
On increasing the temperature from 298 to 413 K,Raman spectra reveal that the intensities of the sharp modeat 308 cm−1 and the over-damped soft mode at 717 cm−1
are reduced continuously. Further increasing of temperaturefrom 433 to 673 K, those peaks disappear rapidly, byindicating cubic phase. In regard to Mn doping, those peakintensities diminish and get obliterated in a decreasing spanof increasing temperature, which emphasizes the softeningof phonon modes. The observed broad peak nature at 512cm−1 is ascribed to the disorder of Ti cations on Ti/B sitesin the ferroelectric phase, and the disorder in the paraelectricphase is associated with the position of the Ti ions. As Ti
ions in paraelectric phase are expected to occupy bodycenter position for an ideal cubic phase. However, Ti ionsare randomly displaced along the cube diagonals causingdisorder in the lattice structure. Hence, the transitions are ofdislocate type, i.e., an order–disorder phase transition [21,25]. The existence of polar phase at higher temperature is anindicative of a partial presence of tetragonal phase. Thereason for its existence is the presence of polar phase at thegrain boundary and grain growth during heating and aninternal strain in the samples [26–28]. The contrast peakbroadening of 512 cm−1 also evident that the peak under-goes a significant change during the phase transition.
3.3 Electrical analysis
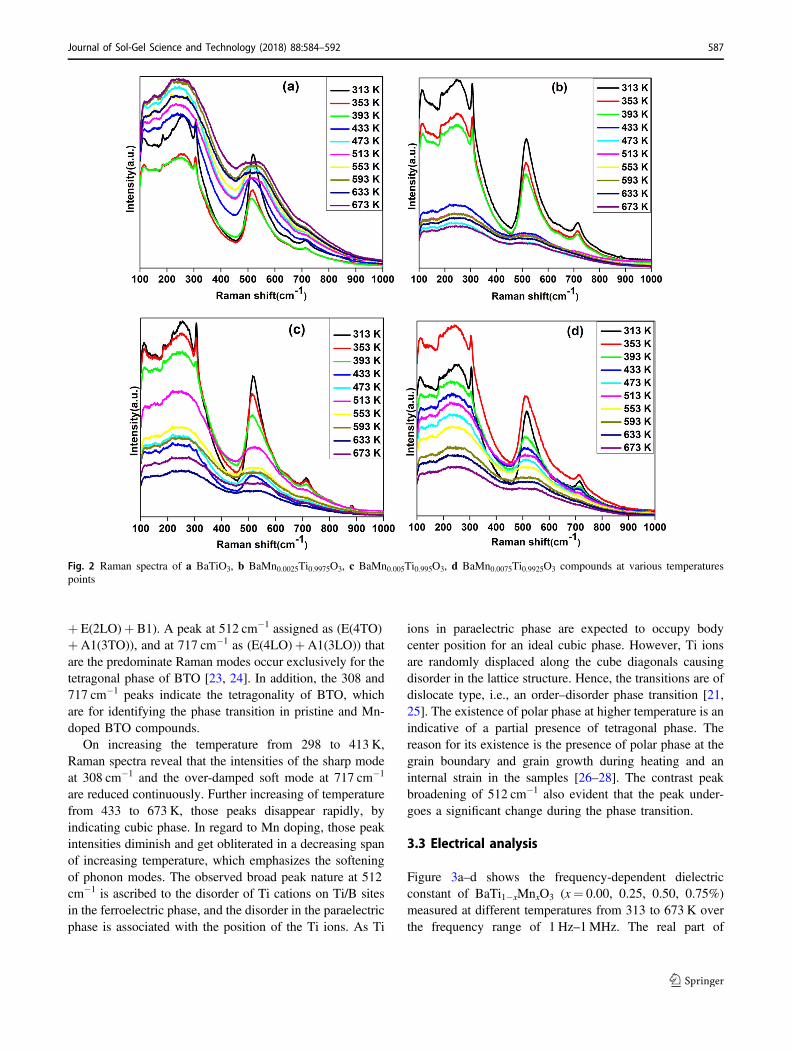
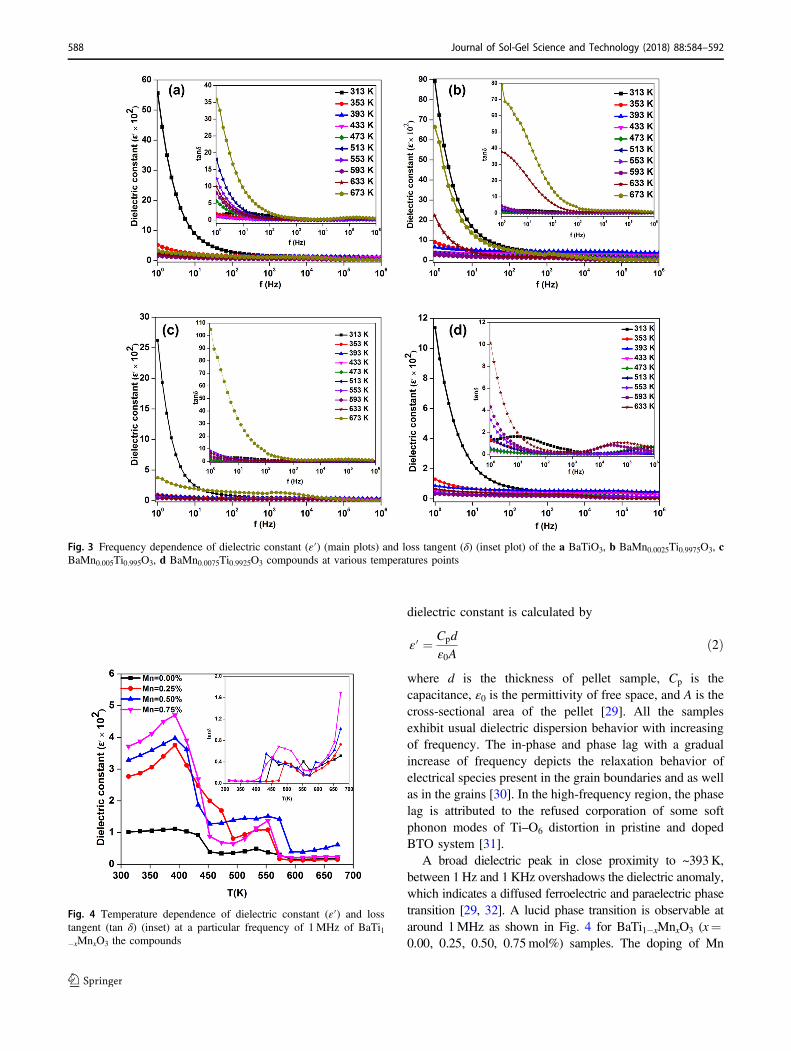
Figure 3a–d shows the frequency-dependent dielectricconstant of BaTi1−xMnxO3 (x= 0.00, 0.25, 0.50, 0.75%)measured at different temperatures from 313 to 673 K overthe frequency range of 1 Hz–1MHz. The real part of
Fig. 2 Raman spectra of a BaTiO3, b BaMn0.0025Ti0.9975O3, c BaMn0.005Ti0.995O3, d BaMn0.0075Ti0.9925O3 compounds at various temperaturespoints
Journal of Sol-Gel Science and Technology (2018) 88:584–592 587
dielectric constant is calculated by
ε′ ¼ Cpd
ε0Að2Þ
where d is the thickness of pellet sample, Cp is thecapacitance, ε0 is the permittivity of free space, and A is thecross-sectional area of the pellet [29]. All the samplesexhibit usual dielectric dispersion behavior with increasingof frequency. The in-phase and phase lag with a gradualincrease of frequency depicts the relaxation behavior ofelectrical species present in the grain boundaries and as wellas in the grains [30]. In the high-frequency region, the phaselag is attributed to the refused corporation of some softphonon modes of Ti–O6 distortion in pristine and dopedBTO system [31].
A broad dielectric peak in close proximity to ~393K,between 1 Hz and 1 KHz overshadows the dielectric anomaly,which indicates a diffused ferroelectric and paraelectric phasetransition [29, 32]. A lucid phase transition is observable ataround 1MHz as shown in Fig. 4 for BaTi1−xMnxO3 (x=0.00, 0.25, 0.50, 0.75mol%) samples. The doping of Mn
Fig. 3 Frequency dependence of dielectric constant (ε′) (main plots) and loss tangent (δ) (inset plot) of the a BaTiO3, b BaMn0.0025Ti0.9975O3, cBaMn0.005Ti0.995O3, d BaMn0.0075Ti0.9925O3 compounds at various temperatures points
Fig. 4 Temperature dependence of dielectric constant (ε′) and losstangent (tan δ) (inset) at a particular frequency of 1MHz of BaTi1−xMnxO3 the compounds
588 Journal of Sol-Gel Science and Technology (2018) 88:584–592
decreases the ferro-paraelectric transition temperature. Since,the doping or the substitution of dn cations relaxes the pseudoJahn–Teller distortion of TiO6 complex, which in turn reducesthe phase transition temperature [33, 34]. This observation isin compliance with the disappearance of Raman mode at 308cm−1 [E (TO)] of BaTi1−xMnxO3 samples. In addition to theabove, the doping of Mn increases the magnitude of thedielectric constant up to x= 0.75%. This pitch in the dielectricconstant is probably due to the presence of defect dipoles inthe lattice, theoretically supported by the following Kronger–Vink relations [29].
2MnO ! 2Mn′′Tiþ2OOþ2V��O ð3Þ
Mn2O3 ! 2Mn′Tiþ3OOþV��O ð4Þ
MnþTie� ! Mn′′Ti Mn3þ ! Mn2þ
� � ð5Þ
Which are expected due to the induce domain stability inthe ferroelectric ceramics, by the observation in lowering of
tan δ value for x= 0.25% and x= 0.50%. This wasobserved between 312 and 413 K, which persists in a stableferroelectric domain [14]. A trivial increase of tan δ valuefor x= 0.75% than pristine and other concentrations,exposits the leakage behavior impending due to the multi-valence state of defects viz., Mn2+/Mn3+ and Ti3+/Ti4+.Further, the other dielectric anomaly which is observed near529 K is akin to a thermally activated localized charge byoxygen vacancies as a report for BTO [35]. Such a signatureis also relevant in tan δ plot shown in Fig. 4 as an inset.
3.4 Magnetic analysis
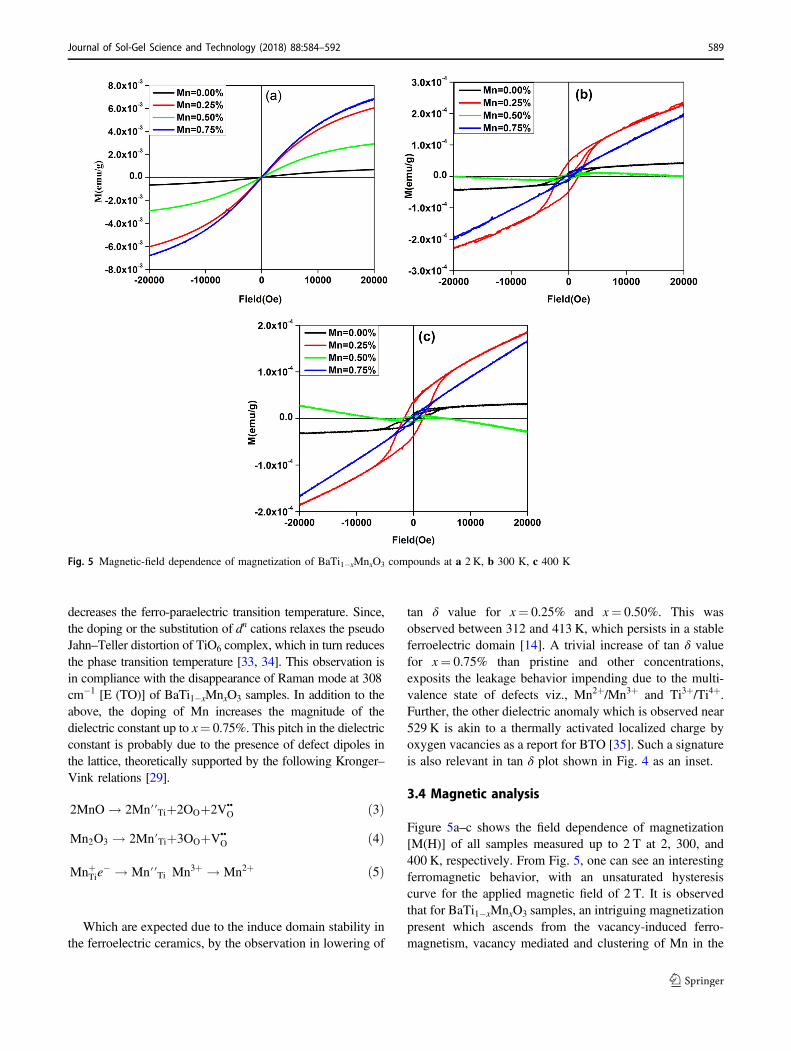
Figure 5a–c shows the field dependence of magnetization[M(H)] of all samples measured up to 2 T at 2, 300, and400 K, respectively. From Fig. 5, one can see an interestingferromagnetic behavior, with an unsaturated hysteresiscurve for the applied magnetic field of 2 T. It is observedthat for BaTi1−xMnxO3 samples, an intriguing magnetizationpresent which ascends from the vacancy-induced ferro-magnetism, vacancy mediated and clustering of Mn in the
Fig. 5 Magnetic-field dependence of magnetization of BaTi1−xMnxO3 compounds at a 2 K, b 300 K, c 400 K
Journal of Sol-Gel Science and Technology (2018) 88:584–592 589

doped BTO system, which is probed through electronparamagnetic resonances (EPR) analysis. However, theobserved magnetization in the pristine sample is due to theTi3+ existence as a result of oxygen vacancy. Further the M(H) curve is lucid in exhibiting wasp waist hysteresis looptype, which may be the result of different magnetic aniso-tropy in the domains.
With the increasing of Mn2+ ions in BTO system, weobserved that the magnetization varies non-monotonicallyas shown in Fig. 5. In particular, for x= 0.25% doping ofMn in BTO, the magnetization increases remarkably incomparison with other concentrations. The enhancement inthe magnetization for x= 0.25% confer on with theexchange interactions between the defect-induced carriersand Mn2+/Mn3+ magnetic ions. Further, the decrease in theintensity for x= 0.25% with respect to pristine, and thebroad resonances in the spectra instigate the existence ofMn2+/Mn3+ ions in the BTO lattice. On the other hand, forx= 0.50% doping, the M–H curve exhibits a non-magneticphase implying a diamagnetic-type behavior at high field,along with the ferromagnetic phases. Similar behavior isalso reported even for pristine compounds like ZnO, SnO2,TiO2, and BTO3 [36–39]. Such a behavior observed in adoping case, incurs a change in the defect-induced ordefect-mediated ferromagnetism, ascribed to the restraint ofdefect-induced carriers, which is implicitly through EPRstudies.
For x= 0.75%, the M–H curve is a further constraint inits magnetization nature, as a result of MnOx segregation,which is likely possible to occur on higher concentrationdoping. Hence, the M (H) curve resembles to appear as anantiferromagnetic behavior [40]. In all the case of Mndoping, a significant enhancement in the magnetization asnoted at 300 K, which ensuring a decline in the thermalenergy. However, at 2 K, the observed M (H) loops signifya quasi-paramagnetic ordering, encompassing both para andweak ferromagnetic behavior in the samples.
A keen look at the M (H) loops of BaTi1−xMnxO3 revealsan asymmetric hysteresis loop (a small shift in the loop),corresponds to an exchange-bias (EB) signature. Theexchange-bias field (HEB) and the coercive field (HC)were calculated using |HEB|= | (H+ +H−)/2| and |HC|= |(H
+−H−)/2|, where H+ and H− are the positive and negativecoercive field on the magnetic axis [41, 42]. The calculatedvalues are reported in Table 2. The presence of exchangebias implies the existence of surface imperfections andsurface strain anisotropies, which induces distortion on thelarger particles and site in-equivalence on the crystal-lographic structure [43].
Figure 6 shows the magnetization as a function of tem-perature [M (T)] measured with an applied field of 100 Oe,and we observed a notable splitting between Zero FieldCooled (ZFC) and Field Cooled (FC) at below 200 K, Ta
ble2Calculatedparameter
from
temperature
depend
entmagnetic
hysteresisloop
ontetragon
alcompo
sitio
nof
pristin
eandMn-do
pedBaT
iO3compo
unds
Mn(%
)2K
300K
400K
Ms(emu/g)
Mr(emu/g)
Hc(O
e)EB
(Oe)
Ms(emu/g)
Mr(emu/g)
Hc(O
e)EB
(Oe)
Ms(emu/g)
Mr(emu/g)
Hc(O
e)EB(O
e)
X=0.00
6.74
47×10
−4
1.99
41×10
−5
269.26
7.67
4.29
68×10
−5
1.18
02×10
−5
825.41
76.15
3.17
82×10
−5
1.02
63×10
−5
789.59
17.38
X=0.25
6.03
99×10
−3
6.09
09×10
−5
118.81
4.02
2.34
49×10
−4
4.66
88×10
−5
1621
.90
28.33
1.85
24×10
−4
3.65
52×10
−5
1713
.09
29.31
X=0.50
2.91
01×10
−3
1.14
25×10
−5
55.78
5.25
1.24
11×10
−5
7.47
34×10
−6
1455
.72
42.43
1.23
75×10
−5
5.85
94×10
−6
2206
.71
133.74
X=0.75
6.83
00×10
−3
7.43
83×10
−6
12.95
2.53
1.98
66×10
−4
6.69
54×10
−6
562.98
41.13
1.65
67×10
−4
5.80
34×10
−6
535.44
24.59
590 Journal of Sol-Gel Science and Technology (2018) 88:584–592
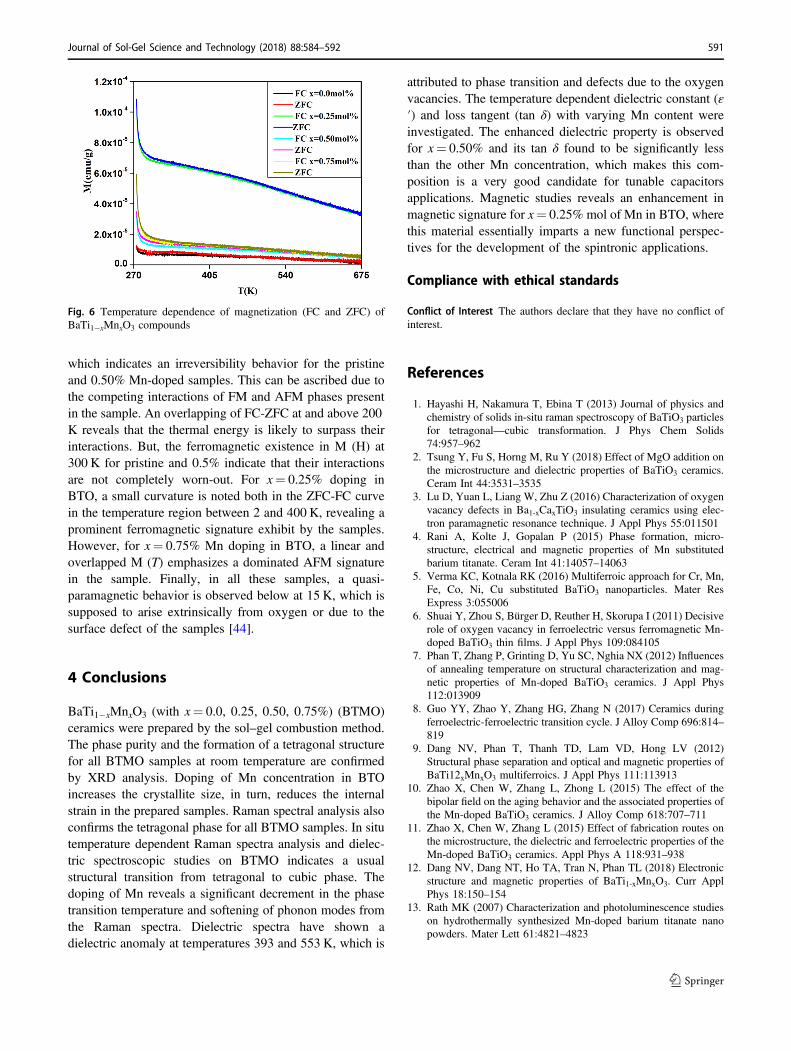
which indicates an irreversibility behavior for the pristineand 0.50% Mn-doped samples. This can be ascribed due tothe competing interactions of FM and AFM phases presentin the sample. An overlapping of FC-ZFC at and above 200K reveals that the thermal energy is likely to surpass theirinteractions. But, the ferromagnetic existence in M (H) at300 K for pristine and 0.5% indicate that their interactionsare not completely worn-out. For x= 0.25% doping inBTO, a small curvature is noted both in the ZFC-FC curvein the temperature region between 2 and 400 K, revealing aprominent ferromagnetic signature exhibit by the samples.However, for x= 0.75% Mn doping in BTO, a linear andoverlapped M (T) emphasizes a dominated AFM signaturein the sample. Finally, in all these samples, a quasi-paramagnetic behavior is observed below at 15 K, which issupposed to arise extrinsically from oxygen or due to thesurface defect of the samples [44].
4 Conclusions
BaTi1−xMnxO3 (with x= 0.0, 0.25, 0.50, 0.75%) (BTMO)ceramics were prepared by the sol–gel combustion method.The phase purity and the formation of a tetragonal structurefor all BTMO samples at room temperature are confirmedby XRD analysis. Doping of Mn concentration in BTOincreases the crystallite size, in turn, reduces the internalstrain in the prepared samples. Raman spectral analysis alsoconfirms the tetragonal phase for all BTMO samples. In situtemperature dependent Raman spectra analysis and dielec-tric spectroscopic studies on BTMO indicates a usualstructural transition from tetragonal to cubic phase. Thedoping of Mn reveals a significant decrement in the phasetransition temperature and softening of phonon modes fromthe Raman spectra. Dielectric spectra have shown adielectric anomaly at temperatures 393 and 553 K, which is
attributed to phase transition and defects due to the oxygenvacancies. The temperature dependent dielectric constant (ε′) and loss tangent (tan δ) with varying Mn content wereinvestigated. The enhanced dielectric property is observedfor x= 0.50% and its tan δ found to be significantly lessthan the other Mn concentration, which makes this com-position is a very good candidate for tunable capacitorsapplications. Magnetic studies reveals an enhancement inmagnetic signature for x= 0.25% mol of Mn in BTO, wherethis material essentially imparts a new functional perspec-tives for the development of the spintronic applications.
Compliance with ethical standards
Conflict of Interest The authors declare that they have no conflict ofinterest.
References
1. Hayashi H, Nakamura T, Ebina T (2013) Journal of physics andchemistry of solids in-situ raman spectroscopy of BaTiO3 particlesfor tetragonal—cubic transformation. J Phys Chem Solids74:957–962
2. Tsung Y, Fu S, Horng M, Ru Y (2018) Effect of MgO addition onthe microstructure and dielectric properties of BaTiO3 ceramics.Ceram Int 44:3531–3535
3. Lu D, Yuan L, Liang W, Zhu Z (2016) Characterization of oxygenvacancy defects in Ba1-xCaxTiO3 insulating ceramics using elec-tron paramagnetic resonance technique. J Appl Phys 55:011501
4. Rani A, Kolte J, Gopalan P (2015) Phase formation, micro-structure, electrical and magnetic properties of Mn substitutedbarium titanate. Ceram Int 41:14057–14063
5. Verma KC, Kotnala RK (2016) Multiferroic approach for Cr, Mn,Fe, Co, Ni, Cu substituted BaTiO3 nanoparticles. Mater ResExpress 3:055006
6. Shuai Y, Zhou S, Bürger D, Reuther H, Skorupa I (2011) Decisiverole of oxygen vacancy in ferroelectric versus ferromagnetic Mn-doped BaTiO3 thin films. J Appl Phys 109:084105
7. Phan T, Zhang P, Grinting D, Yu SC, Nghia NX (2012) Influencesof annealing temperature on structural characterization and mag-netic properties of Mn-doped BaTiO3 ceramics. J Appl Phys112:013909
8. Guo YY, Zhao Y, Zhang HG, Zhang N (2017) Ceramics duringferroelectric-ferroelectric transition cycle. J Alloy Comp 696:814–819
9. Dang NV, Phan T, Thanh TD, Lam VD, Hong LV (2012)Structural phase separation and optical and magnetic properties ofBaTi12xMnxO3 multiferroics. J Appl Phys 111:113913
10. Zhao X, Chen W, Zhang L, Zhong L (2015) The effect of thebipolar field on the aging behavior and the associated properties ofthe Mn-doped BaTiO3 ceramics. J Alloy Comp 618:707–711
11. Zhao X, Chen W, Zhang L (2015) Effect of fabrication routes onthe microstructure, the dielectric and ferroelectric properties of theMn-doped BaTiO3 ceramics. Appl Phys A 118:931–938
12. Dang NV, Dang NT, Ho TA, Tran N, Phan TL (2018) Electronicstructure and magnetic properties of BaTi1-xMnxO3. Curr ApplPhys 18:150–154
13. Rath MK (2007) Characterization and photoluminescence studieson hydrothermally synthesized Mn-doped barium titanate nanopowders. Mater Lett 61:4821–4823
Fig. 6 Temperature dependence of magnetization (FC and ZFC) ofBaTi1−xMnxO3 compounds
Journal of Sol-Gel Science and Technology (2018) 88:584–592 591

14. Chen W, Zhao X, Sun J, Zhang L, Zhong L (2016) Effect of theMn doping concentration on the dielectric and ferroelectricproperties of different-routes-fabricated BaTiO3-based ceramics. JAlloy Comp 670:48–54
15. Yadav P, Sharma S, Lalla NP (2017) Effect of magnetic ion (Mn)doping on structural, ferroelectric and magnetic. Ceram Int43:13339–13344
16. Ba M, Tio C, Sakamoto W, Noritake K, Ichikawa H, Hayashi K,Yogo T (2017) Fabrication and properties of nonreducible lead-free piezoelectric. Ceram Int 43:S166–S171
17. Wang X, Gu M, Yang B, Zhu S, Cao W (2003) Hall effect anddielectric properties of Mn-doped barium titanate. MicroelectronEng 66:855–859
18. Khirade PP, Birajdar SD, Raut AV, Jadhav KM (2016) Multi-ferroic iron doped BaTiO3 nanoceramics synthesized by sol–gelauto combustion: Influence of iron on physical properties. CeramInt 42:12441–12451
19. Daniel PJ, Lin JG (2013) Investigation of optimal growth condi-tions of La0.7Sr0.3MnO3–Bi2Sr2Ca1Cu2O8 hetero structures. J AmCeram Soc 484:481–484
20. Lee S, Randall CA (2008) A modified Vegard’ s law for multisiteoccupancy of Ca in BaTiO3–CaTiO3 solid solutions. Appl PhysLett 92:111904
21. El Marssi M, Le Marrec F, Lukyanchuk IA, Karkut MG (2013)Ferroelectric transition in an epitaxial barium titanate thin film:Raman spectroscopy and X-ray diffraction study. J Appl Phys94:3307
22. Smith MB, Page K, Siegrist T, Redmond PL, Walter EC, SeshadriR, Brus LE, Steigerwald ML, Barbara S, Laboratories B, Moun-tain AV, Hill M (2008) Crystal structure and the paraelectric-to-ferroelectric phase transition of nanoscale BaTiO3. J Am ChemSoc 130:6955–6963
23. Woldu T, Raneesh B, Reddy MVR, Kalarikkal N (2016) Grainsize dependent magnetoelectric coupling of BaTiO3 nanoparticles.RSC Adv. https://doi.org/10.1039/C5RA18018J
24. Soumya Rajan PM, Mohammed G, Chandrasekaran G (2015)Electrical and magnetic phase transition studies of Fe and Mn co-doped BaTiO3. J Alloy Comp 656:98–109
25. Chihaoui S, Chaker C, Khemakhem H (2017) X-ray diffraction,dielectric and Raman studies of the Ba1−xNaxTi1−x(Nb1−ySby)xO3
ceramics. Ceram Int 43:8938–894326. Gulwade D, Gopalan P (2008) Diffuse phase transition in La and
Ga doped barium titanate. Solid State Commun 146:340–34427. Kaddoussi H, Abdelmoula N, Gagou Y, Mezzane D, Khemakhem
H, Elmarssi M (2014) X-ray diffraction, dielectric and Ramanspectroscopy studies. Ceram Int 40:10255–10261
28. Xiao CJ, Chi ZH, Zhang WW, Li FY, Feng SM, Jin CQ, WangXH, Deng XY, Li LT (2007) The phase transitions and ferro-electric behavior of dense nanocrystalline BaTiO3 ceramics fab-ricated by pressure assisted sintering. J Phys Chem Solids 68:311–314
29. Sareecha N, Shah WA, Anis-ur-rehman M, Mirza ML, Awan MS(2017) Electrical investigations of BaTiO3 ceramics with Ba/Ticontents under influence of temperature. Solid State Ion 303:16–23
30. Kaur M, Uniyal P (2016) Investigation on the effect of Ti dopingon dielectric, impedance and magnetic properties of Ba2+-sub-stituted BiFeO3 ceramics. J Mater Sci. https://doi.org/10.1007/s10854-016-5789-2
31. Bhowmik RN (2012) by solid state sintering, mechanical alloyingand chemical routes. Ceram Int 38:5069–5080
32. Ca B, Sn T, Mizouri F, Kallel I, Abdelmoula N, Mezzane D,Khemakhem H (2018) Structural dielectric and magnetic proper-ties of (1-x)BiFeO3-xBa0.9Ca0.1Ti0.9Sn0.1O3 ceramics. J Alloy Comp731:458–464
33. Bersuker IB (2012) Pseudo Jahn–Teller origin of perovskitemultiferroics, magnetic-ferroelectric crossover, and magneto-electric effects: the d0-d10 problem. PRL 108:137202
34. Polinger V, Garcia-fernandez P, Bersuker IB (2015) Pseudo Jahn–Teller origin of ferroelectric instability in BaTiO3 type per-ovskites: the Green function approach and beyond. Phys B457:296–309
35. Bourguiba F, Dhahri A, Rhouma FIH, Mnefgui S, Dhahri J, TaibiK, Hlil EK (2016) Effect of iron and tungsten substitution on thedielectric response and phase transformations of BaTiO3 pervos-kite ceramic. J Alloy Comp 686:675–683
36. Pazhanivelu V, Paul Blessington Selvadurai A, Murugaraj R(2014) Effect of Ni doping on structural, morphological, opticaland magnetic properties of Zn1−xNixO dilute magnetic semi-conductors. J Supercond Nov Magn 27:1737–1742
37. Saravanakumar M, Agilan S, Muthukumarasamy N, RukkumaniV, Marusamy A, Ranjith A (2015) Effect of Mn doping on thestructural, optical and magnetic properties of SnO2 nanoparticles.Acta Phys Pol A 127:1656–1660
38. Phan T, Zhang P, Yang DS, Thanh TD, Tuan DA, Yu SC (2013)Origin of ferromagnetism in BaTiO3 nanoparticles prepared bymechanical milling. J Appl Phys 113:17E305
39. Bahadur N, Pasricha R, Chand S, Kotnala RK (2012) Effect of Nidoping on the microstructure and high Curie temperature ferro-magnetism in sol–gel derived titania powders. Mater Chem Phys133:471–479
40. Basith MA, Islam MA (2017) Preparation of high crystallinenanoparticles of rare-earth based complex pervoskites and com-parison of their structural and magnetic properties with bulkcounterparts. Mater Res Express 4:075012
41. Gheisari M, Mozafari M, Niyaifar M, Amighian J, Soleimani R(2013) Observation of small exchange bias in defect Wüstite(Fe0.93O) nanoparticles. J Supercond Nov Magn 26:237–242
42. Mangalam RVK, Mahuya Chakrabrati, Sanya D, Chakrabati A,Sundaresan A (2009) Identifying defects in multiferroic nano-crystalline BaTiO3 by positron. J Phys Condens Matter 21:445902
43. Darbandi M, Stromberg F, Landers J, Reckers N, Sanyal B, KeuneW, Wende H (2012) Nanoscale size effect on surface spin cantingin iron oxide nanoparticles synthesized by the microemulsionmethod. J Phys D Appl Phys 45(2012):195001
44. Bhowmik RN, Vijayasri G, Ranganathan R (2014) Structuralcharacterization and ferromagnetic properties in Ga3+ dopedFe2O3 system prepared by coprecipitation route and vacuumannealing. J Appl Phys 116:123905
592 Journal of Sol-Gel Science and Technology (2018) 88:584–592