
Investigations of oxygen reduction reactions for ...rx...Investigations of Oxygen Reduction...
200
Investigations of Oxygen Reduction Reactions for Electrochemical Energy Storage and Conversion by Iromie A. Gunasekara B Sc. in Chemistry, University of Peradeniya A dissertation submitted to The Faculty of the College of Science of Northeastern University in partial fulfillment of the requirements for the degree of Doctor of Philosophy September 22 nd , 2015 Dissertation directed by Kuzhikalail Abraham Professor of Chemistry and Chemical Biology and Sanjeev Mukerjee Professor of Chemistry and Chemical Biology
Transcript of Investigations of oxygen reduction reactions for ...rx...Investigations of Oxygen Reduction...

Investigations of Oxygen Reduction Reactions for Electrochemical Energy Storage and
Conversion
by Iromie A. Gunasekara
B Sc. in Chemistry, University of Peradeniya
A dissertation submitted to
The Faculty of
the College of Science of
Northeastern University
in partial fulfillment of the requirements
for the degree of Doctor of Philosophy
September 22nd
, 2015
Dissertation directed by
Kuzhikalail Abraham
Professor of Chemistry and Chemical Biology
and
Sanjeev Mukerjee
Professor of Chemistry and Chemical Biology

ii
©Iromie A. Gunasekara
2015
All Rights Reserved

iii
Acknowledgements
I would like to thank my advisors Dr. Sanjeev Mukerjee and Dr. K. M. Abraham for their
continuous guidance and patience throughout the past five years. Dr. Sanjeev’s motivation and
enthusiasm towards science have created his students a supportive environment to participate in
cutting edge research and achieve interesting outcomes as scientists. The valuable experience
that I gained during my work at NUCRET has equipped me with skills and confidence to
conduct meticulous scientific research. Dr. Abraham is one of the most passionate scientists that
I have ever met. He has been a tremendous mentor and has inspired me to reach a higher level of
thinking. I would not be successful today if not for my advisers. I am truly honored to have
worked with them.
I’m especially grateful for the members of my thesis committee, Dr. David Budil and Dr.
Geoffrey Davies for their valuable advice and constructive criticism which have guided me
throughout my PhD career. Also I have to mention the support I received from former and
current members of the administrative staff of the Department of Chemistry, Jean Harris and
Cara Shockly in particular. It has been a pleasure.
Former NUCRET members, Nagappan Ramaswamy, Daniel Abbot, Michael Bates,
Christopher Allen and Matthew Trahan have helped me a lot with their knowledge and
experience since I first started my graduate research at NUCRET. I should also mention Kara
Strickland, Urzula Tylus, Braja Ghosh and Gizem Yilmaz as well as the visiting scholars
Myoungseok Lee and Halil Sahan for their support. Special thanks to Dr. Serge Pann, the
director of NUCRET, Mehmet Ates and Qingying Jia who spent their valuable time and efforts
to help me in many situations. All the members of the NUCRET including Ryan Pavlicek,

iv
Shraboni Ghoshal, Jingkun Li, Amell Alsudairi and Houng Doan have made the past few years
very enjoyable. I will miss the joy of having all those wonderful discussions with them.
I appreciate the valuable support of Bill Fowle and Wentao Liang for helping me out with
the SEM and TEM instrumentation and Dr. Swastik Kar for letting me use the equipment in his
lab.
I should also mention the love and support I received from my family throughout the
journey. The blessings of my wonderful parents and my brother have been strength in all my
achievements. My loving husband Sadeera has been immensely helpful and understanding
throughout the past few years.
Finally, the financial support that I received from DuPont Corporation, US Army
Research Laboratory and US Army Cerdec is mentioned with gratitude.
v
Abstract of Dissertation
High energy density portable power solutions have been of utmost importance for the
advancement of modern day necessities such as data and voice communication, vehicular
transportation, distributed power generation and storage of energy produced by sustainable
power sources. Progress made in fuel cell and lithium-ion battery technologies over the past
decade have opened opportunities to power electric and hybrid electric vehicles for long distance
transportation. Alkaline membrane fuel cells (AEMFCs) are the new alternatives to proton
exchange membrane fuel cells (PEMFCs), which require generous amounts of noble metal-based
catalysts on their electrodes. Facile electrode kinetics on non-precious group metal catalysts in
alkaline environments is the key factor which has promoted AEMFCs over PEMFCs. While the
research on AEMFCs is vastly expanding, high energy density batteries are praiseworthy
considering the high cost of hydrogen fuel. The state-of-the-art Li-ion batteries cannot reach the
desirable capacity density to power electric vehicles capable of >300 miles on a single charge
whereas Li-O2 batteries with a theoretical capacity more than ten times larger than that of Li-ion
have become very promising for this application. Chapter 1 of this thesis provides a discussion of
the background behind the fuel cell and battery technologies beyond Li-ion along with the
electrochemical and analytical techniques employed throughout this investigation.
The major deterrent to AEMFC technology is its performance decrease by means of
carbonate exchange of the membrane when exposed to carbon dioxide. The second Chapter deals
with a quantitative determination of the influence of carbonate ions in the alkaline membrane on
interfacial electrode reactions and reactant transport through the membrane. A Pt microelectrode
investigation conducted on a commercial anion exchange membrane (AEM) (Tokuyama, A201)
vi
showed rather close kinetics for oxygen reduction reaction (ORR) with and without carbonate
exchange as well as with a perfluorinated proton exchange membrane analog such as Nafion®.
Resolution of the mass transport into constituent components (diffusion coefficient and
solubility) showed that the oxygen diffusion coefficient in the AEM exchanged with carbonate
ions (CO32-
) is lowered while the solubility remained unaffected. These results show remarkable
agreement with polarization corrected fuel cell data, thus enabling a method to better resolve
interfacial performance of an AEM fuel cell.
We have also investigated the kinetics of hydrogen oxidation reaction (HOR) and
methanol oxidation reaction (MOR) at the Tokuyama (A201/A901) anion exchange membrane
/Pt microelectrode interfaces using solid state electrochemical cells. Diffusion of hydrogen
molecules through the membrane was not influenced by the carbonate ions due to the smaller
size of the gaseous molecule. However, hydrogen concentration in the anion exchange
membrane is low in the presence of carbonate ions. Methanol diffusion is facilitated in the anion
exchange polymer electrolyte due to its high water content. A change of the diffusion path length
in carbonate polymer electrolytes caused methanol permeability to drop significantly. The kinetic
parameters obtained for the AEM in the carbonate form suggests that both hydrogen and
methanol oxidation reactions proceed through the carbonate pathway. Therefore, the kinetic
parameters obtained are significantly lower than what were observed at the AEM in the
hydroxide form.
In the third Chapter I demonstrate that a microelectrode can be used as a diagnostic tool
to determine O2 transport properties and redox kinetics in dimethyl sulfoxide (DMSO)–based
electrolytes for non-aqueous Li-air batteries, and to elucidate the influence of ion-conducting
salts on the O2 reduction reaction mechanism. Oxygen reduction/evolution reactions on a carbon

vii
microelectrode have been studied in dimethyl sulfoxide-based electrolytes containing Li+ and
tetrabutylammonium ((C4H9)4N+) ions. Analysis of chronoamperometric current-time transients
of the oxygen reduction reactions in the series of tetrabutylammmonium (TBA) salt-containing
electrolytes of TBAPF6, TBAClO4, TBACF3SO3, or TBAN(CF3SO2)2 in DMSO revealed that
the anion of the salt exerts little influence on O2 transport. Whereas steady-state ORR currents
(with sigmoidal-shaped current-potential curves) were observed in TBA-based electrolytes,
peak-shaped current-voltage profiles were seen in the electrolytes containing their Li salt
counterparts. The latter response results from the combined effects of the electrostatic repulsion
of the superoxide (O2-) intermediate as it is reduced further to peroxide (O2
2-) at low potentials
and the formation of passivation films of the O2 reduction products at the electrode. Raman
spectroscopic data confirmed the formation of non-conducting Li2O2 and Li2O on the electrode
surface at different reduction potentials in Li salt solutions. Out of the four lithium salt-
containing electrolytes studied, namely LiPF6, LiClO4, LiCF3SO3, or LiN(CF3SO2)2 in DMSO,
the LiCF3SO3/DMSO solution revealed the most favorable ORR kinetics and the least
passivation of the electrode by ORR products.
The influence of lithium salts on O2 reduction reactions (ORR) in 1, 2-dimethoxyethane
(DME) and tetraethylene glycol dimethyl ether (TEGDME) has been investigated in Chapter 4.
Microelectrode studies in a series of tetrabutylammonium salt (TBA salt)/DME-based
electrolytes showed that O2 solubility and diffusion coefficient are not significantly affected by
the electrolyte anion. The ORR voltammograms on microelectrodes in these electrolytes
exhibited steady-state limiting current behavior. In contrast, peak-shaped voltammograms were
observed in Li+-conducting electrolytes suggesting a reduction of the effective electrode area by
passivating ORR products as well as migration-diffusion control of the reactants at the

viii
microelectrode as observed in DMSO-based electrolytes. FT-IR spectra have revealed that Li+
ions are solvated to form solvent separated ion pairs of the type Li+(DME)nPF6
- and
Li+(TEGDME)PF6
- in LiPF6–based electrolytes. On the other hand, the contact ion pairs
(DME)mLi+(CF3SO3
-) and (TEGDME)Li
+(CF3SO3
-) appear to form in LiSO3CF3-containing
electrolytes. In the LiSO3CF3–based electrolytes, the initial ORR product, superoxide (O2-), is
stabilized in solution by forming [(DME)m-1(O2-)]Li
+(CF3SO3
-) and [(TEGDME)(O2
-
)]Li+(CF3SO3
-) complexes. These soluble superoxide complexes are able to diffuse away from
the electrode surface reaction sites to the bulk electrolyte in the electrode pores where they
decompose to form Li2O2. This explains the higher capacity obtained in Li/O2 cells utilizing
LiCF3SO3/TEGDME electrolytes.
In Chapter 5 the synthesis of iron(II) phathlaocyanine (FePC)–based catalysts is
presented. FePC embedded in a carbon support was heat-treated at a series of temperatures
(300oC, 600
oC and 800
oC) and characterized by means of several spectroscopic and
electrochemical techniques. Catalytic oxygen reduction recorded in the low Donor Number
acetonitrile (MeCN)–based electrolytes have shown that the oxygen reduction reaction (ORR)
mechanism is modified at the catalyst surface. Redox electrochemistry of FePC recorded in
argon saturated electrolytes has confirmed that the iron is in the Fe(I) state at the O2 reduction
potential in these electrolytes which is capable of stabilizing the superoxide leading to an inner–
Helmholtz plane electron transfer reaction. In high Donor Number DMSO–based electrolytes the
ORR was not influenced by the catalyst and this has been attributed to the oxidation state of iron
being Fe(II) at the superoxide forming potential. The superoxide formed in such conditions are
stabilized by the DMSO solvated softer Lewis acid Li+ as the Li
+(DMSO)n–O2
- ion pair in
solution. The ORR reaction in this electrolyte proceeds through an outer Helmholtz plane
ix
electron transfer process despite the presence of the FePC catalyst in the electrode. Catalyzed
carbon electrodes treated at 300 and 600oC were successfully employed in the low Donor
Number tetra ethylene glycol dimethyl ether (TEGDME)–based electrolyte-containing Li-O2
cells. These cells showed significant reduction in the charging overpotentials and a doubling of
the cell cycle life compared to uncatalyzed cells.
Chapter 6 sums up the conclusions of the research presented in this thesis and presents
future directions for investigations.
x
Table of Contents
Acknowledgements iii
Abstract v
Table of Contents x
List of Figures 16
List of Tables 22
List of Schemes 23
List of Abbreviations and Symbols 25
xvi
xxii
xxiii
xxiv
Chapter 1: Introduction 27
1.1.World Energy Demand 27
1.2.Electrochemical Energy Conversion and Storage- Fuel Cells and Batteries 28
1.3.Fundamentals of a Fuel cell 29
1.3.1. Fundamentals of Batteries
1.3.2. Voltage Losses Associated with Cells
1.4.Lithium Batteries 37
1.4.1. Non-Aqueous Electrolytes
1.4.2. Lithium-Ion Batteries
1.5. Microelectrode Diagnostics 46
1.5.1 Planar vs. Radial Diffusion
1.5.2 Microelectrode Electrochemistry
1.6 Scope of the Thesis 52
1
1
2
3
7
9
11
12
17
20
21
23
26
xi
Chapter 2: Reactant Transport and Interfacial Kinetics at the Pt/AEM Interface:
Microelectrode Studies on the Effect of Carbonate Exchange in Alkaline Fuel Cells
2.1. Introduction 54
2.2. Experimental 56
2.2.1. Membranes
2.2.2. Electrochemical Techniques
2.2.3. Mass Transport Parameters
2.2.4. Oxygen Transport and ORR Kinetics at the Pt/AEM Interface
2.2.5. Hydrogen transport and HOR Kinetics at the Pt/AEM Interface
2.2.6. H2/air Fuel Cell Tests
2.2.7. Methanol Transport and MOR Kinetics at the Pt/AEM Interface
2.3. Results and Discussion 61
2.3.1. Oxygen Reduction Kinetics
2.3.2. Oxygen Transport Parameters
2.3.3. Fuel Cell Performance
2.3.4. Hydrogen Oxidation Kinetics
2.3.5. Hydrogen Transport
2.3.6. Methanol Oxidation Reaction at the Pt/AEM Interface
2.4. Conclusion
28
28
29
29
30
31
32
33
34
34
35
36
39
41
42
44
46
53
Chapter 3: Microelectrode Investigations of the Oxygen Electrode in Dimethyl
Sulfoxide-based Electrolytes Lithium-Oxygen Batteries
3.1. Introduction 82
3.2. Experimental 84
55
55
57
xii
3.2.1. Materials
3.3. Results and Discussion 85
3.3.1. Validation of the Experimental Approach and Determination of the
Microelectrode Radius
3.3.2. Kinetic Equation for the Reaction at the Microelectrode under Steady
State Conditions
3.3.3. Oxygen Reduction Reaction in Tetrabutyl Ammonium–based
Electrolytes
3.3.4. Deviation of Microelectrode Response from Classical Diffusion Limited
Current
3.3.5. Oxygen Electrochemistry on Carbon Microelectrodes
3.3.6. ORR in Tetrabutylammonium (TBA) Salt-based Electrolytes
3.3.7. ORR in Lithium Ion-containing Electrolytes
3.3.8. ORR Product Analysis
3.3.9. Irreversibility of Oxygen Reduction Reaction in Lithium Salt Solutions
3.3.10. The role of the Li salt anion on ORR
3.3.11. FT-IR Evidence for Ion Pair Formation
3.3.12. Lithium Ion-anion Ion Pair Formation
3.3.13. Oxygen Reduction Kinetics in TBA and Li Salt-based Electrolytes
3.4. Conclusion
57
58
58
59
60
61
62
63
68
71
73
74
78
81
84
85
xiii
Chapter 4: The Influence of Lithium Salt Anions on Oxygen Reduction Reactions in
Ether Electrolytes for Li-air Batteries
4.1 Introduction 114
4.2 Experimental 115
4.2.1 Materials
4.2.2 Cyclic Voltammetry
4.2.3 RRDE Measurements
4.2.4 Lithium-Air Cell Testing
4.2.5 Scanning Electron Microscopy (SEM)
4.2.6 FT-IR characterization
4.3 Results and Discussion 118
4.3.1 Microelectrode Electrochemistry
4.3.2 Oxygen Transport and ORR in Tetrabutylammonium Salt-based Ether
Electrolytes: The Effect of the Electrolyte Salt Anion
4.3.3 ORR in Li Salt Solutions in 1,2-Dimethoxyethane (DME) and
Tetraethylene Glycol Dimethyl Ether (TEGDME)
4.3.4 The Impact of the Structure-Property Characteristics of CF3SO3- on ORR
in Ether Electrolytes
4.4 Conclusion
87
87
88
88
89
90
90
90
91
91
92
93
100
114
125
Chapter 5: Solid Phase Bi-functional FePC Catalysts for Non-aqueous Li-air Batteries
5.1. Introduction 155
5.2. Experimental 157
5.2.1. Materials
126
126
128
128
xiv
5.2.2. Iron(II) phthalocyanine–based Catalyst Synthesis
5.2.3. Cyclic voltammetry
5.2.4. Lithium-air cell testing
5.2.5. Thermo-gravimetric analysis (TGA)
5.2.6. Fourier-transform Infrared spectroscopy (FT-IR)
5.2.7. X-Ray Diffraction
5.2.8. In-situ Raman
5.2.9. Scanning electron microscopy (SEM)
5.2.10. Transmission electron microscopy (TEM)
5.3. Results and Discussion 161
5.3.1. Electrochemistry of Iron(II) Phthalocyanine Dissolved in Dimethyl
Sulfoxide
5.3.2. Reaction of the Li Metal with Iron(II) Phthalocyanine
5.3.3. Thermal Stability and Structure of Iron(II) Phthalocyanine
5.3.4. Synthesis and Characterization of Carbon Supported Catalysts
5.3.5. Catalyst Solubility in Organic Electrolytes
5.3.6. Oxygen Reduction in High Donor Number (DN) Dimethyl Sulfoxide-
based Electrolytes
5.3.7. Oxygen Reduction in Low Donor Number Acetonitrile-based
Electrolytes
5.3.8. Li-O2 Cells Utilizing FePC-based Catalysts
5.3.9. Li-O2 Cell Discharge Products
5.3.10. Mechanism of the FePC Catalysis
128
129
129
130
130
130
130
131
131
132
132
137
138
141
144
145
146
152
159
157

xv
5.4. Conclusion 162
Chapter 6: Conclusions and Future Directions
6.1. Alkaline anion exchange membrane fuel cells
6.2. Lithium-oxygen batteries
164
164
165
References 167
xvi
List of Figures
Figure 1.1:
Figure 1.2:
Figure 1.3:
Figure 1.4:
Figure 1.5:
Figure 1.6:
Figure 1.7:
Figure 1.8:
Figure 1.9:
Figure 1.10:
Figure 2.1:
Figure 2.2:
Figure 2.3:
Operation of a (a) proton exchange membrane fuel cell, (b) alkaline anion
exchange membrane fuel cell.
Structure of a quaternary ammonium polysulfone–based membrane.
Schematic of a Daniell cell.
Polarization losses in a battery/cell.
Schematic representation of a Li-ion cell. Fabricated in the discharged
state, the cell is activated by charging, during which the cathode is
oxidized (See equation 1.23 for the LiCoO2 cathode) to produce Li+
and
electrons (𝑒− ). The Li+ travels through the electrolyte composed of LiPF6
in organic solvent) and is inserted into the anode (See equation 1.24 for the
graphite anode) along with the electrons arriving at it through the external
circuit. The opposite processes occur during discharge.
Schematic of a Li-O2 battery a) discharge, and b) charge.
Comparison of gravimetric energy densities of some battery systems.
Diffusion fields around a) macrodisc electrode, b) microdisc electrodes.
Ferrocene oxidation currents obtained at an 11µm microdisc electrode at
different potential scan rates.
Current vs t-1/2
plot for chronoamperometric transients obtained for the
ferrocene oxidation reaction in 0.1M Li+/DMSO (Argon saturated solution,
11µm microelectrode).
Solid state cells a) For gaseous reactants, b) Liquid feed enabled cell.
Cyclic voltammogram recorded on A201 membrane under 100% RH
nitrogen saturated conditions, 293K, 1 atm.
Kinetics at the Pt/ membrane interface and Mass transport Characteristics,
green-Nafion-112, blue-Tokuyama A201-OH-, red-A201-CO3
2- a) Mass
transport corrected Tafel plots for Oxygen Reduction at the Pt/membrane
interface b) Cottrell plots for the Oxygen reduction at the interface,
potential range (1.0 to 0.4 V vs. RHE).
4
6
8
11
17
19
20
20
23
25
33
36
38
xvii
Figure 2.4:
Figure 2.5:
Figure 2.6:
Figure 2.7:
Figure 2.8:
Figure 2.9:
Figure 3.1:
Figure 3.2:
Figure 3.3:
Figure 3.4:
iR corrected H2/Air fuel cell cathode polarization curves for PEMFCs
(650C) and AEMFCs (50
0C). Solid curves show mass transport and kinetic
overpotentials. Dotted curves show kinetic only overpotential.
Mass transport corrected Tafel plots for HOR/HER at the membrane
electrode interface.
Cottrell plots for the HOR calculated from current-time transients at 0.3V
(potential jump from 0V to 0.3 V).
Cyclic voltammograms for MOR at the membrane /Pt microelectrode
interface. 1 M MeOH, 293K.
a) Comparison of kinetic parameters for MOR at the Pt/A201 interface,
293K , 1M MeOH - Tafel plots, b) Comparison of kinetic parameters for
MOR at the Pt/A901 interface, 293K , 1M MeOH - Tafel plots.
Cottrell plots for the MOR calculated from current-time transients at 0.8V
(potential jump from 0.4V to 0.8 V).
Current-voltage behavior observed in O2 purged 0.1 M TBAPF6/DMSO
electrolyte at a): carbon microelectrode b): glassy carbon macroelectrode.
a): Oxygen reduction reaction on the microelectrode in 0.1 M TBA salts
in DMSO at 50 mV s-1
. b): Cottrell plots calculated for the current time
transients obtained by potential jump chronoamperometry experiments
on the microelectrode in different TBA salt solutions in DMSO.
Current -voltage characteristics at the carbon microelectrode for O2
purged 0.1 M LiPF6/DMSO recorded: a) at scan rates ranging from 5-
1000 mV s-1
, b) at various potential windows, c) Oxygen reduction half-
cycle in 0.1M LiPF6/DMSO to passivate the electrode for the test in d,
d) ORR currents obtained in 0.1M TBAPF6/DMSO on the electrode after
the oxygen reduction half-cycle in 0.1M LiPF6/DMSO as shown in c.
SEM micrographs of the glassy carbon electrode surface, a) pristine
electrode, b) after ORR in TBA+/DMSO, c) after ORR in Li
+/DMSO, d)
EDAX analysis of electrode surface after ORR in Li+/DMSO. Images on
the right show the corresponding elemental compositions of the
electrode.
42
44
45
47
50
51
64
66
69
72

xviii
Figure 3.5:
Figure 3.6:
Figure 3.7:
Figure 3.8:
Figure 3.9:
Figure 3.10:
Figure 4.1:
Figure 4.2:
Figure 4.3:
Raman spectra of the oxygen reduction products formed on the carbon
electrode; potential hold at a) 2.32 V, b) 2.12 V, each versus Li/Li+ for
5hrs. Raman spectra for pure reference samples are given in the upper
panel.
Current-voltage characteristics at the carbon microelectrode obtained for
O2 purged solutions of a) 0.1M LiClO4/DMSO, b) 0.1M
LiN(CF3SO2)2/DMSO, c) 0.1M LiCF3SO3/DMSO electrolytes, d) ORR
at the Planar GC macroelectrode.
Continuous cycling of potential in O2 saturated a) LiCF3SO3/DMSO and
b) LiPF6/DMSO electrolytes, at 100 mVs-1
.
FT- IR spectra of DMSO-Lithium salt solutions. (a) LiPF6-DMSO, (b) Li
CF3SO3-DMSO, (c) LiN(CF3SO2)2 –DMSO.
Solvation and contact ion pair formation in a) LiCF3SO3/DMSO and c)
LiN(CF3SO2)2/DMSO electrolytes. Ion pair between solvated Li+ and
superoxide ion in b) LiCF3SO3/DMSO, d) LiN(CF3SO2)2/DMSO
electrolytes
Calculation of kinetic parameters for the quasi-reversible ORR in Li+-
containing electrolytes with various anions.
Oxygen reduction limiting currents obtained on the carbon microelectrode
a) in 0.1 M TBACF3SO3/ DME at several voltage scan rates from 50- 200
mVs-1
(CV recorded at 200mVs-1
in an Ar saturated electrolyte is shown in
black), b) in a series of 0.1 M TBA salt /DME electrolytes at 200 mV s-1
.
C) Cottrell plots obtained for the current time transients recorded in an O2
saturated series of TBA salt/ DME electrolytes.
Oxygen reduction limiting currents obtained on the carbon
microelectrode in a a) saturated TBA PF6/TEGDME, b-c) 0.1 M TBA
CF3SO3/ TEGDME electrolyte. d) Cottrell plot obtained for the current
time transient obtained in O2 saturated 0.1 M TBA CF3SO3/ TEGDME
electrolyte.
a) current-voltage data obtained on the carbon microelectrode in 0.1 M
TBAPF6/DME (red), and 0.1 M LiPF6/DME (blue). b) Scan rate dependent
cyclic voltammograms obtained on the carbon microelectrode in 0.1M
LiPF6/ DME(continuously recorded second CV at 200 mVs-1
is shown as a
black dotted line, c) Comparison of anodic current-potential response on
73
75
78
80
83
85
94
96
99
xix
Figure 4.4:
Figure 4.5:
Figure 4.6:
Figure 4.7:
Figure 4.8:
Figure 4.9:
Figure 4.10:
the microelectrode with different cathodic potential limits at 200 mV s-1
.
Cyclic voltammograms recorded at the 11µm carbon electrode in O2
saturated electrolytes. a) anodic response in LiCF3SO3/DME at different
cathodic limiting potentials. b) Cyclability of the ORR/OER in
LiCF3SO3/DME, c) Scan rate dependent ORR/OER in LiCF3SO3/DME.
Oxygen reduction half-cycles were recorded at a pristine carbon
microelectrode in LiPF6/ DME. ORR limiting currents recorded for the
same electrode in TBAPF6/DMSO soon after the above reaction are
shown.
Cyclic voltammograms recorded at a 11µm carbon disc in O2 saturated
LiPF6/ TEGDME. a) CVs collected at scan rates ranging from 20 mVs-1
to
200 mV s-1
, b) Anodic response at different cathodic limiting potentials, c)
Cyclability of the ORR/ OER in the potential range of 1.7 V and 3.6 V
(initial scan at the full potential range from 1.7V to 4.5V is shown in
black).
Cyclability of the oxygen reduction/evolution reaction in the potential
range of 1.5 V and 4.5 V a) in 0.1 M LiPF6/ TEGDME, b) 0.1 M
LiCF3SO3/ TEGDME.
Cyclic voltammograms recorded at an 11 µm carbon microdisc at 200 mV
s-1
in O2 saturated a) 0.1M LiPF6/ TEGDME (black) and 0.1M LiCF3SO3/
TEGDME (red). b) Cyclability of the ORR/OER in 0.1M LiCF3SO3/
TEGDME in the voltage range of 1.7V - 3.7V (black curve shows the
initial scan in the voltage range of 1.5V - 4.6V).
Galvanostatic discharge curves for Li/O2 cells. a) XC72R carbon cathodes,
b) Ketjenblack EC300JD carbon cathodes, both discharged at 0.1 mA cm-2
with LiPF6/TEGDME and LiCF3SO3/TEGDME (insets shows the voltage
scales expanded). Galvanostatic discharge-charge curves obtained for a
Li/O2 cell (KB300JD cathode) with c) LiPF6/TEGDME, d)
LiCF3SO3/TEGDME by limiting the capacity to 400 mAhg-1
and limiting
the charging potential to 4.5 V.
a) Cyclic voltammograms recorded in O2 saturated LiPF6/ TEGDME at the
Au macro disc. Rotating ring disc electrode response obtained in O2 purged
solutions (at 800 rpm at 40 mV s-1
). b) 0.1M LiPF6/TEGDME and c) 0.1M
LiCF3SO3/TEGDME (Disc response is shown in black and the ring
response is shown in red).
101
102
105
106
107
108
110
xx
Figure 4.11:
Figure 4.12:
Figure 5.1:
Figure 5.2:
Figure 5.3:
Figure 5.4:
Figure 5.5:
Figure 5.6:
Figure 5.7:
Figure 5.8:
FT-IR spectra for Li salt solutions in DME for various salt concentrations.
a) LiPF6/DME (peak position of the solvent C-O-C vibration is shown by a
dotted line at 1090cm-1
), b) LiCF3SO3/DME (peak position of the
asymmetric stretching vibrations of the ion paired sulfonyl groups are
shown by dotted lines at 1260 and 1300 cm-1
).
FT-IR spectra for Li salt solutions in TEGDME for various salt
concentrations: a) LiPF6/ TEGDME (peak position of the solvent C-O-C
vibration is shown by a dotted line at 1090cm-1
), b) LiCF3SO3/ TEGDME
(peak position of the asymmetric stretching vibrations of the ion paired
sulfonyl groups are shown by dotted lines at 1260 and 1300 cm-1
).
Cyclic voltammograms obtained for argon purged 1mM solution of FePC
in a) 0.1M LiPF6/DMSO and b) 0.1M LiCF3SO3/DMSO.
In-situ Raman spectra obtained at the carbon electrode at different
potentials (Argon purged 1mM FePC, 0.1M LiCF3SO3/DMSO).
SEM micrographs of the Li metal surface after being contact with 1mM
FePC in DMSO and TEGDME. a) Lithium metal surface as received, b)
Lithium metal surface polished, c) Surface (a) after contact in 1mM
FePC/1M Li+ in DMSO and d) Surface (b) after contact in 1mM FePC/1M
Li+ in DMSO e) Surface (a) after contact in 1mM FePC/1M Li+ in
TEGDME, f) Surface (b) after contact in 1mM FePC/1M Li+ in TEGDME.
TGA data for FePC under argon in the temperature range of 20-1000oC at
a heating rate of 10 deg/second.
FT-IR spectra of pure iron(II) phthalocyanine pyrolyzed at a series of
temperatures ranging from 300-8000C.
XRD spectra of the carbon supported FePC catalysts
TEM micrographs of catalysts, a,b) FePC-KB(300), c,d) FePC-KB(600),
e,f) FePC-KB(800) showing their crystalline nature.
Comparison of the supernatant color of the various catalysts dissolved in
TEGDME. a) Neat TEGDME, b) 1mM FePC dissolved in TEGDME, c)
FePC/VC(300) in TEGDME , d) FePC/VC(600) in TEGDME and e)
FePC/VC(800) in TEGDME.
112
116
134
136
138
139
140
142
143
144
xxi
Figure 5.9:
Figure 5.10:
Figure 5.11:
Figure 5.12:
Figure 5.13:
Figure 5.14:
Figure 5.15:
Figure 5.16:
Figure 5.17:
Figure 5.18:
Figure 5.19:
Cyclic voltammograms obtained at a glassy carbon disc in O2 saturated
0.1M LiPF6/DMSO.
Cyclic voltammograms obtained for argon purged <0.5 mM (saturated)
solutions of FePC in 0.1M LiPF6/MeCN and 0.1M LiCF3SO3/MeCN, CV
obtained for the O2 saturated 0.1M LiPF6/MeCN electrolyte is shown as a
dotted line.
Cyclic voltammograms obtained for FePC/VC(300) in : a) an Ar saturated
solution of 0.1M LiCF3SO3/MeCN. (Solid line-first cycle, dotted line-
second cycle), b) O2 saturated solutons in 0.1M LiCF3SO3/MeCN(red) and
LiPF6/MeCN(black).
(a) Cyclic voltammograms obtained for FePC/VC(300) in oxygen saturated
solutions of 0.1M LiPF6/MeCN at scan rates ranging from 10-100mVs-1
,
(b) Nicholson-Schain plots calculated for the ORR peak currents obtained
at FePC/VC(300).
(a) Cyclic voltammograms obtained at catalyzed electrodes in O2 saturated
solutions of 0.1M LiPF6/MeCN, (b) Cyclic voltammograms obtained for
FePC/VC(800) in argon saturated solutions of 0.1M LiPF6/MeCN.
Full discharge and charge cyclability obtained for a) FePC/KB(300) and b)
FePC/KB(600) catalysts 1M LiCF3SO3/TEGDME in the voltage range of
2.00V to 4.4V. c) Comparison of the charging efficiencies of the catalyzed
cell and the uncatalyzed cell.
Cycling performance obtained for a) FePC/KB(300), b) FePC/KB(600),
c) FePC/KB(800) catalyzed and d) uncatalyzed cells in 1M
LiCF3SO3/TEGDME.
XRD profile for the post discharged cathodes. a) Post-Discharge-Cathode
using KB300JD, b) Post-Discharge-Cathode using FePC/KB(600).
Raman Spectrum obtained for the post discharge cathode (FePC/KB(600)).
The red and black curves show the spectra obtained for the TEGDME
solvent +K2O powder and neat TEGDME respectively.
Pathway (i)-Proposed mechanism of the catalysis of oxygen reduction and
oxygnevolution at the FePC/Carbon(300) catalyst.
Pathway (ii)-Proposed mechanism of the catalysis of oxygen reduction and
oxygnevolution at the FePC/Carbon(300) catalyst.
146
147
149
151
153
154
155
156
157
161
162
xxii
List of Tables
Table 1.1:
Table 2.1:
Table 2.2:
Table 2.3:
Table 2.4:
Table 2.5:
Table 2.6:
Table 3.1:
Table 3.2:
Table 3.3:
Table 3.4:
Table 3.5:
Table 4.1:
Physical properties of non-aqueous solvents.
Comparison of Interfacial kinetics of ORR.
Comparison of Mass transport characteristics.
Kinetic parameters for hydrogen oxidation reaction in alkaline electrolytes.
Mass transport characteristics of Hydrogen in the AEM.
Kinetic parameters for Methanol oxidation reaction.
Mass transport characteristics of Methanol in the AEM.
Oxygen transport parameters in TBAX electrolytes.
Superoxide Diffusivities in TBAX electrolytes.
Columbic efficiencies for OER/ORR (OER divided by ORR) processes in
the presence of Li+ ions.
Physical properties of the electrolytes at 20oC.
Kinetic parameters of ORR in Li+-based electrolytes.
Oxygen transport parameters in 1,2-dimethoxyethane.
14
39
39
43
45
48
52
67
67
77
82
85
95
xxiii
List of Schemes
Scheme 1.1:
Scheme 1.2:
Scheme 1.3:
Scheme 1.4:
Scheme 1.5:
Scheme 1.6:
Scheme 2.1:
Scheme 2.2:
Scheme 4.1:
Scheme 4.2:
Scheme 4.3:
Scheme 4.4:
Scheme 4.5:
Scheme 5.1:
Scheme 5.2:
Scheme 5.3:
Scheme 5.4:
Scheme 5.5:
Scheme 5.6:
Fuel cell reactions of a proton exchange membrane fuel cell.
Fuel cell reactions of a direct methanol fuel cell.
Fuel cell reactions of an alkaline hydrogen fuel cell.
Fuel cell reactions of an alkaline methanol fuel cell.
Reactions of a Daniell Cell.
Possible reactions in a Li-O2 battery1 and the calculated voltages at
standard conditions.
Hydrogen oxidation reaction in acidic environments.
Hydrogen oxidation reaction in alkaline environments
Li+
solvation and ion pair formation in LiPF6/DME.
Li+
solvation and ion pair formation in LiCF3SO3/DME.
Linear Structure of TEGDME.
Li+
solvation and ion pair formation in LiPF6/TEGDME
Li+
solvation and ion pair formation in LiCF3SO3/TEGDME
Iron d electron configurations of FePC dissolved in DMSO as a
function of Fe oxidation state.
Fe(II)/Fe(I) in DMSO.
Fe(I)PC reduction in DMSO.
Fe(II)/Fe(III) in DMSO.
Proposed mechanism of the catalytic oxygen reduction and Oxidation
reactions at FePC/VC(300) under CV conditions
Proposed mechanism of the catalytic oxygen reduction and Oxidation
reactions in a FePC/VC(300) catalyzed Li-O2 cell
4
5
6
6
8
19
33
34
118
119
120
122
123
132
135
135
136
158
159
xxiv
List of Abbreviations and Symbols
α Charge transfer coefficient
η Overpotential
λ # of water molecule per exchange site
ν Scan rate
υ Kinematic viscosity
ω Rotation speed
θ Angle
∆H Change in enthalpy
A Ampere/ area
AEM Anion exchange membrane
Ah Ampere hour
B-V Butler-Volmer
C Concentration
CV Cyclic voltammogram
D Diffusion coefficient
DME 1,2-Dimethoxyethane
DMSO Dimethyl sulfoxide
DN Donor number
E electrode potential
e- Electron
F Faraday constant
FT-IR Fourier transform infrared spectroscopy
G Gibbs free energy
GC Glassy carbon
GDL Gas diffusion layer
hcd High current density
HOR Hydrogen oxidation reaction
HSAB Hard soft acid base (concept)
id Limiting current
xxv
IEC Ion exchange capacity
io Exchange current
Ip Peak current
h Hour
iR Ohmic potential drop
ks Heterogeneous rate constant
KB Ketjenblack
lcd Low current density
m Meter
M Molarity
M+ Single charged anion
MEA Membrane electrode assembly
MeCN Acetonitrile
MOR methanol oxidation reactions
n Number of electrons transferred
OCP Open circuit potential
OER Oxygen evolution reaction
ORR Oxygen reduction reaction
PEM Proton exchange membrane
ppm Parts per million
PTFE Polytetrafluoroethylene
R Gas constant
R2 Regression correlation coefficient
RDE Rotating disc electrode
RH Relative humidity
RHE Reversible hydrogen electrode
RRDE Rotating ring disc electrode
RTIL Room temperature ionic liquid
s Second
SEM Scanning electron microscopy
T Temperature
xxvi
TBA Tetrabutylammonium
TEGDME Tetraethylene glycol dimethyl ether
TEM Transmission electron microscopy
TGA Thermo gravimetric analysis
V Volts
VC Vulcan
W Watts
XRD X-ray diffraction
1
Chapter 1
Introduction
1.1. World Energy Demand
In present day the energy economy of the United States and the world is largely
dependent on fossil fuels. Close to 44% of the energy consumption in the US is fulfilled by
petroleum and coal, and the rest comes from natural gas, nuclear energy, hydropower and
renewable energy sources.1-3
Heavy dependence on fossil fuel energy is unreliable for a nation
due to rapid depletion of these non-renewable energy sources as well as global warming and
climate changes associated with the release of large amounts of CO2 from them to the
atmosphere. Energy legislations have created regulations to decrease CO2 emission from power
plants based on fossil fuels.4 Even though natural gas power plants can provide cleaner energy
with half the CO2 emission of coal power plants, the heavy machinery and hydraulic fractioning
process used in the gas extraction can pollute the groundwater system.5 Nuclear energy is also
one of the reliable sources of energy which addresses the concern of greenhouse gas emissions.
However, disposal of waste from nuclear power plants and reactor safety issues have impeded
the process of building new nuclear power plants6. As a result of these considerations the current
policies of the US government through the department of energy (DOE) is encouraging the
development of renewable energy power plants. The resources of renewable energy include
solar, wind, geothermal, biomass and hydropower. A key component of widespread adoption of
the various renewable sources is the development of energy storage systems in order to store the
energy produced from these systems prior to distribution when the demand rises.
Fulfilling the stationary power demand by renewable energy resources is not entirely
practical on account of the scarcity of energy storage solutions, the consumption of petroleum for
2
transportation needs remains unchanged over the years. The best way to address the air pollution
caused by petroleum use in transportation is to replace the internal combustion engine vehicles
with zero or controlled emission vehicles. Therefore, there is a growing demand for efficient
energy conversion and storage systems to produce, store and deliver the energy from renewable
power plants to electric and hybrid electric vehicles. Electrochemical energy conversion and
storage devices comprising fuel cells and batteries are the two primary candidates to address this
demand.
Energy conversion and storage systems with higher energy and power densities are also
needed to meet the ever-increasing demands of portable consumer devices such as cellphones,
laptop computers, tablets and digital cameras. While lithium ion batteries have played a major
role in fulfilling the portable electronics revolution of the past two decades, rechargeable
batteries with significantly higher energy densities are needed to meet the continued demand for
increasing functionalities of these devices.
In this thesis, the role of electrochemical energy conversion and storage systems to
address the aforementioned energy needs are addressed, with a focus on the key challenges
associated with anion exchange membrane fuel cells and rechargeable Li-O2 batteries.
1.2. Electrochemical Energy Conversion and Storage- Fuel Cells and Batteries
Electrical energy is produced from a fuel cell or battery by means of charge transfer
between two chemical reactions, oxidation and reduction, that occur at the anode and cathode,
respectively. The reactions are physically separated inside the cell, but when connected
externally through a load an electrical current is generated by the electrochemical potential
difference between the two electrodes. In a battery the two chemicals are usually stored inside
3
the battery cell, physically separated by an ion conducting but electronically insulating electrode
separator. When it is discharged the battery uses up the stored reactants. The fuel cell, on the
other hand, is an energy conversion device and requires a continuous supply of fuel to the
electrodes inside the cell to produce electricity.
1.3. Fundamentals of a Fuel Cell
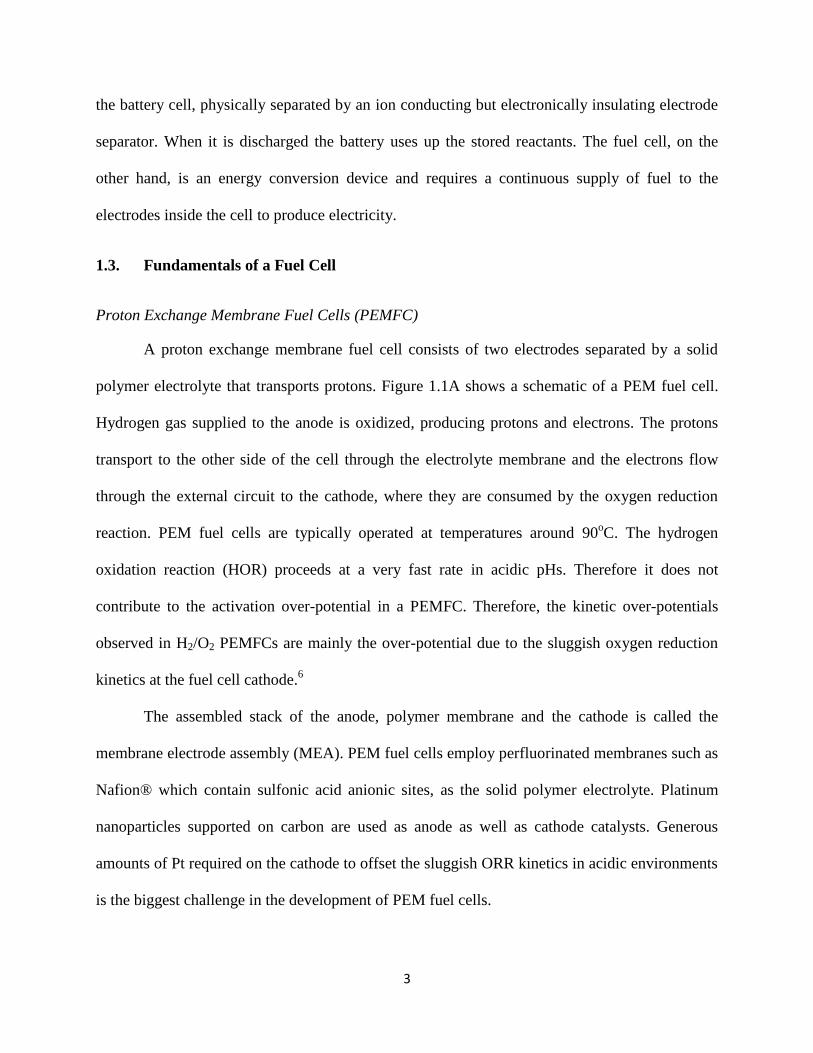
Proton Exchange Membrane Fuel Cells (PEMFC)
A proton exchange membrane fuel cell consists of two electrodes separated by a solid
polymer electrolyte that transports protons. Figure 1.1A shows a schematic of a PEM fuel cell.
Hydrogen gas supplied to the anode is oxidized, producing protons and electrons. The protons
transport to the other side of the cell through the electrolyte membrane and the electrons flow
through the external circuit to the cathode, where they are consumed by the oxygen reduction
reaction. PEM fuel cells are typically operated at temperatures around 90oC. The hydrogen
oxidation reaction (HOR) proceeds at a very fast rate in acidic pHs. Therefore it does not
contribute to the activation over-potential in a PEMFC. Therefore, the kinetic over-potentials
observed in H2/O2 PEMFCs are mainly the over-potential due to the sluggish oxygen reduction
kinetics at the fuel cell cathode.6
The assembled stack of the anode, polymer membrane and the cathode is called the
membrane electrode assembly (MEA). PEM fuel cells employ perfluorinated membranes such as
Nafion® which contain sulfonic acid anionic sites, as the solid polymer electrolyte. Platinum
nanoparticles supported on carbon are used as anode as well as cathode catalysts. Generous
amounts of Pt required on the cathode to offset the sluggish ORR kinetics in acidic environments
is the biggest challenge in the development of PEM fuel cells.
4
Figure 1.1: Operation of a A) proton exchange membrane fuel cell, B) alkaline anion exchange
membrane fuel cell.
Scheme 1.1: Fuel cell reactions of a proton exchange membrane fuel cell
Anode: 𝐻2 → 2𝐻+ + 2𝑒− E0 = 0.0 V [1.1]
Cathode: 1
2𝑂2 + 2𝐻+ + 2𝑒− → 𝐻2𝑂 E0= 1.23 V [1.2]
Full cell reaction: 𝐻2 +1
2𝑂2 → 𝐻2𝑂 Ecell = 1.23 V [1.3]
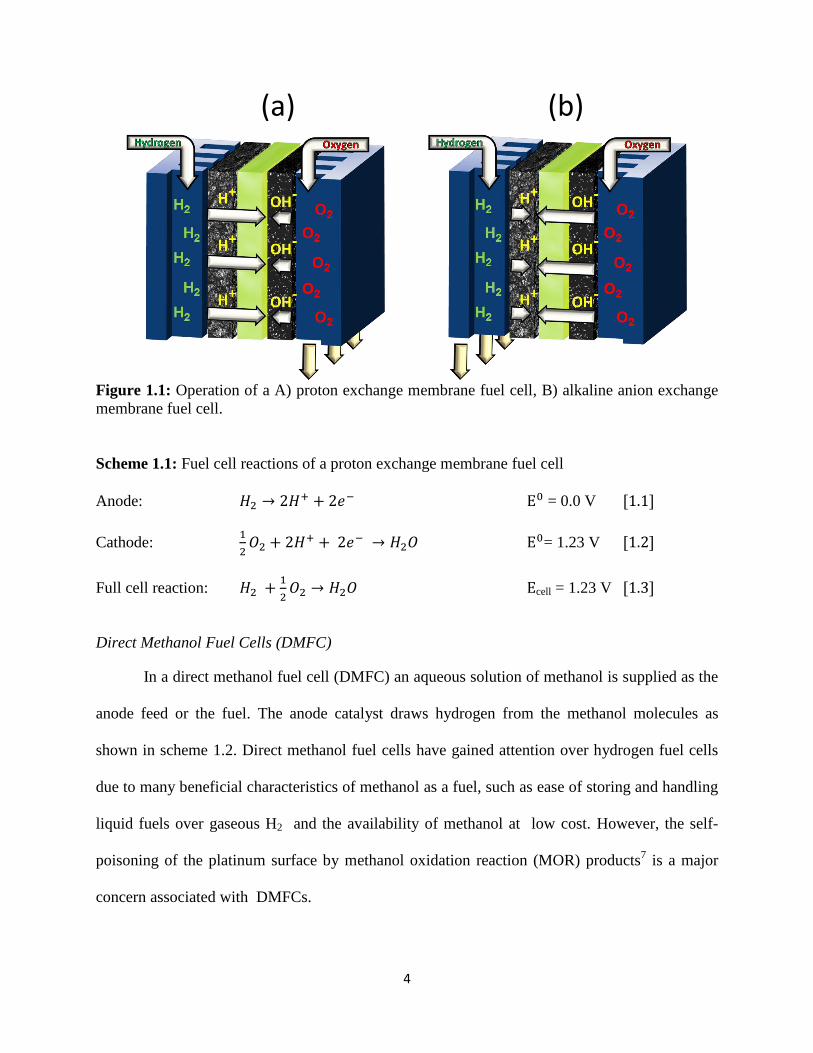
Direct Methanol Fuel Cells (DMFC)
In a direct methanol fuel cell (DMFC) an aqueous solution of methanol is supplied as the
anode feed or the fuel. The anode catalyst draws hydrogen from the methanol molecules as
shown in scheme 1.2. Direct methanol fuel cells have gained attention over hydrogen fuel cells
due to many beneficial characteristics of methanol as a fuel, such as ease of storing and handling
liquid fuels over gaseous H2 and the availability of methanol at low cost. However, the self-
poisoning of the platinum surface by methanol oxidation reaction (MOR) products7 is a major
concern associated with DMFCs.
(a) (b)
5
Scheme 1.2: Fuel cell reactions of a direct methanol fuel cell
Anode: 𝐶𝐻3𝑂𝐻 + 𝐻2𝑂 → 6𝐻+ + 6𝑒− + 𝐶𝑂2 E0 = 0.02 V [1.4]
Cathode: 3
2𝑂2 + 6𝐻+ + 6𝑒− → 3𝐻2𝑂 E0= 1.23 V [1.5]
Full cell reaction: 𝐶𝐻3𝑂𝐻 +3
2𝑂2 → 𝐻2𝑂 + 𝐶𝑂2 Ecell = 1.21 V [1.6]
Alkaline Anion Exchange Membrane Fuel Cells (AEMFC)
The hydroxide equivalent of the PEM fuel cell is known as alkaline anion exchange
membrane fuel cell. The hydroxide ions formed at the cathode during the oxygen reduction
reaction are transported to the anode side through the membrane where they combine with the
protons to form water.
Fuel cells operated under high pH conditions are currently gaining attention due to many
reasons. The beneficial characteristics include: 1) facile oxygen reduction kinetics afforded by
non-precious group metals in alkaline conditions,8, 9
2) favorable hydrodynamics of alkaline
membrane fuel cells which translates to better water management in them compared to
conventional PEM fuel cells, and 3) improved membrane stability due to the membrane being
less prone to attack by peroxide ions in alkaline conditions. In addition, the facile methanol
oxidation kinetics in direct methanol fuel cells observed at high pHs8 is also advantageous.
Figure 1.1B shows a schematic of an anion exchange membrane (AEM) fuel cell (H2/O2).
AEM fuel cells operate at high pHs where the polymer electrolyte employed is a hydroxide ion
transport membrane. Scheme 3 and 4 display reactions corresponding to AEMs operating under
hydrogen and methanol as anode feed, respectively.
6
Scheme 1.3: Fuel cell reactions of an alkaline hydrogen fuel cell
Anode: 𝐻2 + 2𝑂𝐻− → 2𝐻2𝑂 + 2𝑒− E0 = -0.83 V [1.7]
Cathode: 1
2𝑂2 + 𝐻2𝑂 + 2𝑒− → 2𝑂𝐻− E0 = 0.40 V [1.8]
Full cell reaction: 𝐻2 +1
2𝑂2 → 𝐻2𝑂 Ecell = 1.23 V [1.9]
Scheme 1.4: Fuel cell reactions of an alkaline methanol fuel cell
Anode: 𝐶𝐻3𝑂𝐻 + 6𝑂𝐻− → 5𝐻2𝑂 + 6𝑒− + 𝐶𝑂2 E0 = -0.81 V [1.10]
Cathode: 3
2𝑂2 + 3𝐻2𝑂 + 6𝑒− → 6𝑂𝐻− E0 = 0.40 V [1.11]
Full cell reaction: 𝐶𝐻3𝑂𝐻 +3
2𝑂2 → 2𝐻2𝑂 + 𝐶𝑂2 Ecell = 1.21 V [1.12]
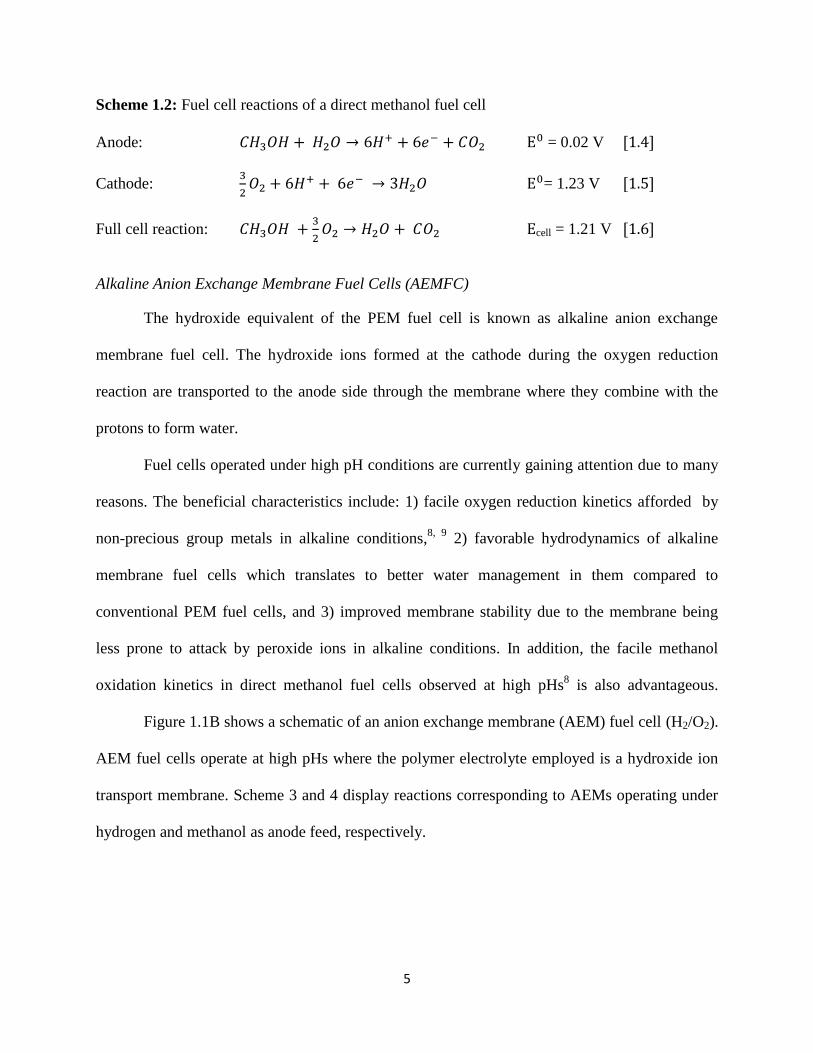
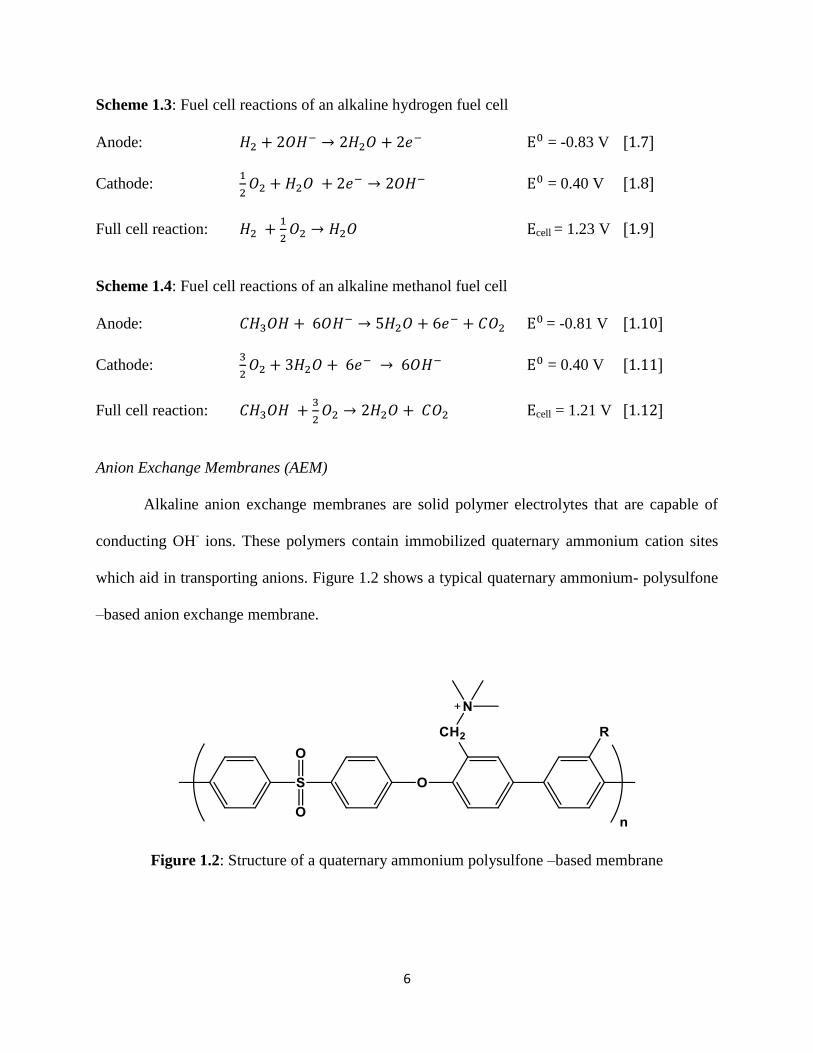
Anion Exchange Membranes (AEM)
Alkaline anion exchange membranes are solid polymer electrolytes that are capable of
conducting OH- ions. These polymers contain immobilized quaternary ammonium cation sites
which aid in transporting anions. Figure 1.2 shows a typical quaternary ammonium- polysulfone
–based anion exchange membrane.
Figure 1.2: Structure of a quaternary ammonium polysulfone –based membrane
7
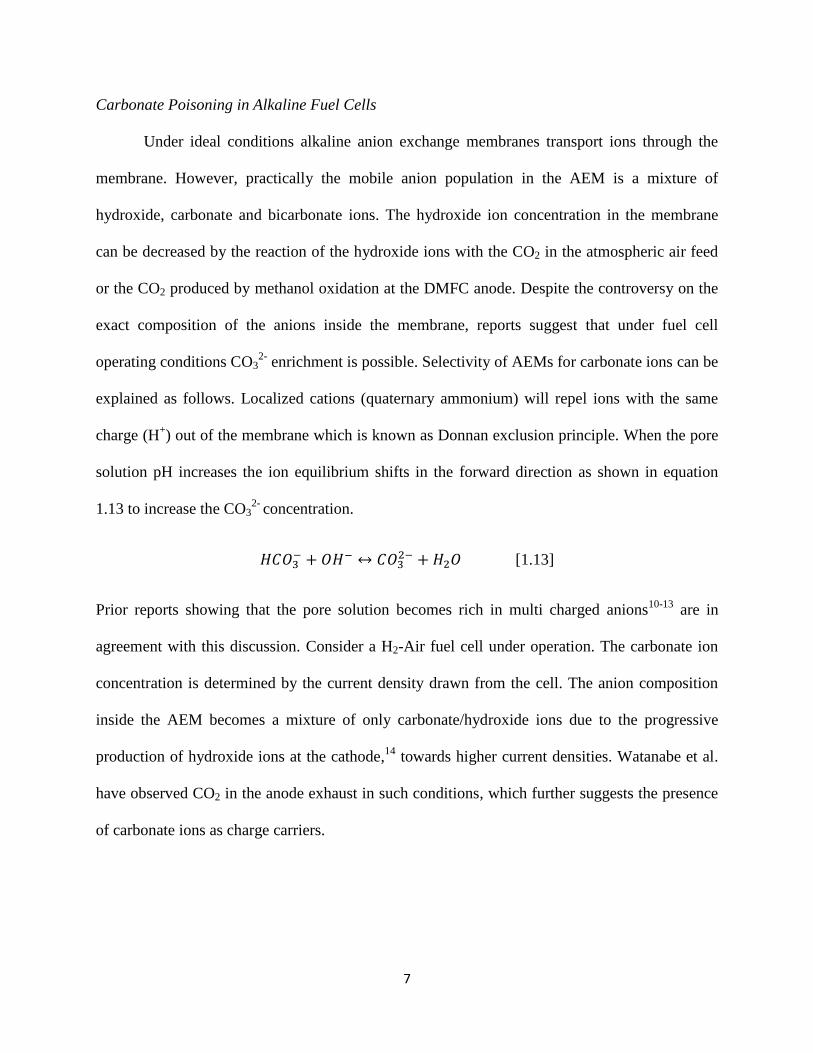
Carbonate Poisoning in Alkaline Fuel Cells
Under ideal conditions alkaline anion exchange membranes transport ions through the
membrane. However, practically the mobile anion population in the AEM is a mixture of
hydroxide, carbonate and bicarbonate ions. The hydroxide ion concentration in the membrane
can be decreased by the reaction of the hydroxide ions with the CO2 in the atmospheric air feed
or the CO2 produced by methanol oxidation at the DMFC anode. Despite the controversy on the
exact composition of the anions inside the membrane, reports suggest that under fuel cell
operating conditions CO32-
enrichment is possible. Selectivity of AEMs for carbonate ions can be
explained as follows. Localized cations (quaternary ammonium) will repel ions with the same
charge (H+) out of the membrane which is known as Donnan exclusion principle. When the pore
solution pH increases the ion equilibrium shifts in the forward direction as shown in equation
1.13 to increase the CO32-
concentration.
𝐻𝐶𝑂3− + 𝑂𝐻− ↔ 𝐶𝑂3
2− + 𝐻2𝑂 [1.13]
Prior reports showing that the pore solution becomes rich in multi charged anions10-13
are in
agreement with this discussion. Consider a H2-Air fuel cell under operation. The carbonate ion
concentration is determined by the current density drawn from the cell. The anion composition
inside the AEM becomes a mixture of only carbonate/hydroxide ions due to the progressive
production of hydroxide ions at the cathode,14
towards higher current densities. Watanabe et al.
have observed CO2 in the anode exhaust in such conditions, which further suggests the presence
of carbonate ions as charge carriers.
8
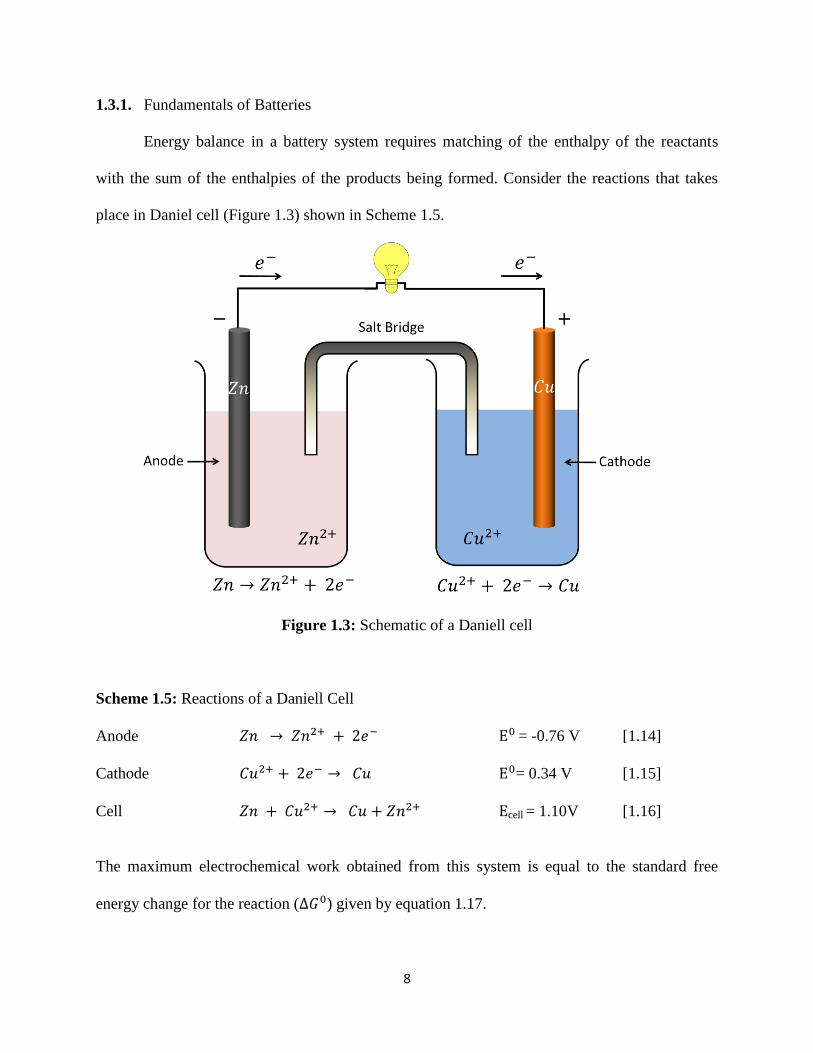
1.3.1. Fundamentals of Batteries
Energy balance in a battery system requires matching of the enthalpy of the reactants
with the sum of the enthalpies of the products being formed. Consider the reactions that takes
place in Daniel cell (Figure 1.3) shown in Scheme 1.5.
Figure 1.3: Schematic of a Daniell cell
Scheme 1.5: Reactions of a Daniell Cell
Anode 𝑍𝑛 → 𝑍𝑛2+ + 2𝑒− E0 = -0.76 V [1.14]
Cathode 𝐶𝑢2+ + 2𝑒− → 𝐶𝑢 E0= 0.34 V [1.15]
Cell 𝑍𝑛 + 𝐶𝑢2+ → 𝐶𝑢 + 𝑍𝑛2+ Ecell = 1.10V [1.16]
The maximum electrochemical work obtained from this system is equal to the standard free
energy change for the reaction (∆𝐺0) given by equation 1.17.
9
∆𝐺0 = −𝑛𝐹𝐸0 [1.17]
where n is the number of electrons involved in the reaction, F is the Faraday constant and 𝐸0 is
the electrode potential under standard conditions. The electrode potential for reaction 1.16 under
non-standard conditions is given by the Nernst equation (equation 1.18),
𝐸 = 𝐸0 −𝑅𝑇
𝑛𝐹(
𝑎𝐶𝑢(𝑠) × 𝑎𝑍𝑛2+(𝑎𝑞)
𝑎𝐶𝑢2+(𝑎𝑞) × 𝑎𝑍𝑛(𝑠)) [1.18]
In equation 1.18 R is the gas constant, T is the temperature in K, 𝑎𝐶𝑢(𝑠) , 𝑎𝑍𝑛2+(𝑎𝑞) are the
activities of the products and 𝑎𝐶𝑢2+(𝑎𝑞), 𝑎𝑍𝑛(𝑠) are the activities of the reactants. This equation
simplifies to equation 1.19 since the activity of a pure solid is equal to 1.
𝐸 = 𝐸0 −𝑅𝑇
𝑛𝐹(
𝑎𝑍𝑛2+(𝑎𝑞)
𝑎𝐶𝑢2+(𝑎𝑞)) [1.19]
1.3.2. Voltage Losses Associated with Cells
Typically, the measured cell potential is significantly lower than the thermodynamic
equilibrium potential (E) as depicted in equation 1.20. The voltage losses, also called
polarization losses can be broken down to three parameters as shown in this equation, namely
ohmic losses, kinetic losses and mass transport losses.15, 16
Figure 1.4 shows the quantitative
effect of each parameter on cell voltage (Vcell).
𝑉𝑐𝑒𝑙𝑙 = 𝐸 − ∆𝐸𝑜ℎ𝑚𝑖𝑐 − 𝜂𝑘𝑖𝑛𝑒𝑡𝑖𝑐 − 𝜂𝑡𝑥 [1.20]
10
Ohmic polarization losses (∆Eohmic) arise from the resistance of the cell components. Thickness
of the electrodes as well as the membrane ion conductivity determines the overall resistance of a
battery cell. Voltage drop due to the cell resistance is proportional to the current drawn from the
cell as defined by equation 1.21.
∆𝐸𝑜ℎ𝑚𝑖𝑐 = 𝑖𝑅 [1.21]
Kinetic (ηkinetic) or activation polarization losses which arise due to slow electrochemical
reactions are noticeable in the low current region. Activation polarization is given by equation
1.22 where α is charge transfer coefficient, i and io are the current density and exchange current
density, respectively.
𝜂𝑘𝑖𝑛𝑒𝑡𝑖𝑐 = 𝑅𝑇
𝛼𝑛𝐹𝑙𝑛 (
𝑖
𝑖𝑜) [1.22]
Mass transport (ηtx) or concentration overpotential losses arise from resistance ofreactant
diffusion through the gas diffusion layers and the electrodes. These losses are indistinct in the
low current region, but become significant in the high current region. In a H2-O2 fuel cell,
enhanced mass transport losses at high current densities can be attributed to the flooding of the
electrodes from a high rate of water production.

11
Figure 1.4: Polarization losses in a battery/cell
1.4. Lithium Batteries
Lithium has drawn attention as a successful anode material for batteries since the 1960s17
.
This is due to two aspects, lithium being the most electropositive material (-3.04V vs SHE) and
the lightest metal (6.94 g mol-1
). These two properties made this unique metal the ideal candidate
for high energy density storage applications. The discovery of the stability of lithium metal in
organic solvents owing to electronically insulating film with Li ion conductivity formed on the
Li metal led to the to the development of commercial lithium batteries.17
A Lithium battery is comprised of an anode made of lithium metal or a lithium-
containing compound, an organic liquid or polymer electrolyte, and a cathode. Most common
types of primary lithium batteries include Li-SOCl2, Li-FeS2 and Li-MnO2 batteries containing
the cathode materials SOCl2, FeS2 and MnO2, respectively. These are not rechargeable once the
stored reactants are consumed in the discharge. On the other hand, secondary batteries store
energy by means of reversible electrochemical reactions and the products of discharge can be
12
reversed to their original state by charging the cell. Therefore, these batteries can be recharged
and used many times. Early rechargeable Li batteries had safety issues as their continuous
charge/discharge cycling led to deposition of dendritic lithium metal on the Li anode.18
This
raised the serious hazard of needle like lithium formed in the charging process piercing the
separator to cause internal short circuits and ensuing thermal runaway reactions with fire
hazards.
1.4.1. Non-Aqueous Electrolytes
Since Li is highly reactive towards H2O, electrolytes composed of solutions of Li salts
dissolved in non-aqueous solvents are used in Li batteries. The frequently used non-aqueous
solvents include aprotic organic solvents such as ethers, carbonates and ionic liquids.
The solvent needs to contain polar groups so that it has a sufficiently high dielectric
constant to dissolve lithium salts and minimize ion pairing. No matter how strong the solvating
ability of the solvent with Li ion is, organic solvents containing active protons are ruled out due
to their irreversible reaction with the Li metal anode. In addition, a number of requirements must
be fulfilled by a solvent to be a successful candidate in a lithium battery. These include: the
ability to dissolve a high concentration of Li+-conducting salts such as LiPF6, LiCF3SO3 and
LiN(SO2CF3)2 ; high ionic conductivity for the electrolyte prepared; chemical compatibility with
the electrode materials in the battery; a high electrochemical stability window within which the
electrolyte does not undergo redox reactions when the electrodes are reduced and oxidized
during charge/discharge cycling of the battery; good liquid range from -20 to +70oC; and good
thermal stability over the entire temperature range of operation of the battery.
Since the discovery of non-aqueous Li-O2 batteries by Abraham et al.19
, a great deal of
investigations been carried out with respect to solvent selection and electrolyte formulation for
13
them. Some of the additional requirements of solvents for these batteries must include the
following:
The solvent must survive in the presence of the nucleophile superoxide, which is an
intermediate formed during O2 reduction at the Li-O2 cathode. As far as solvent stability
is concerned, inactivity towards the Li anode and a high oxidation potential are also
required.
A low viscosity is required for good O2 and ion transport through the electrolyte. At the
same time the solvent should have a low volatility and remain a liquid over a wide range
of temperatures.
The solvent should be able to dissolve the oxygen reduction product Li2O2. The overall
solubility of Li2O2 in the electrolyte is determined by the dissolved Li salt as well.
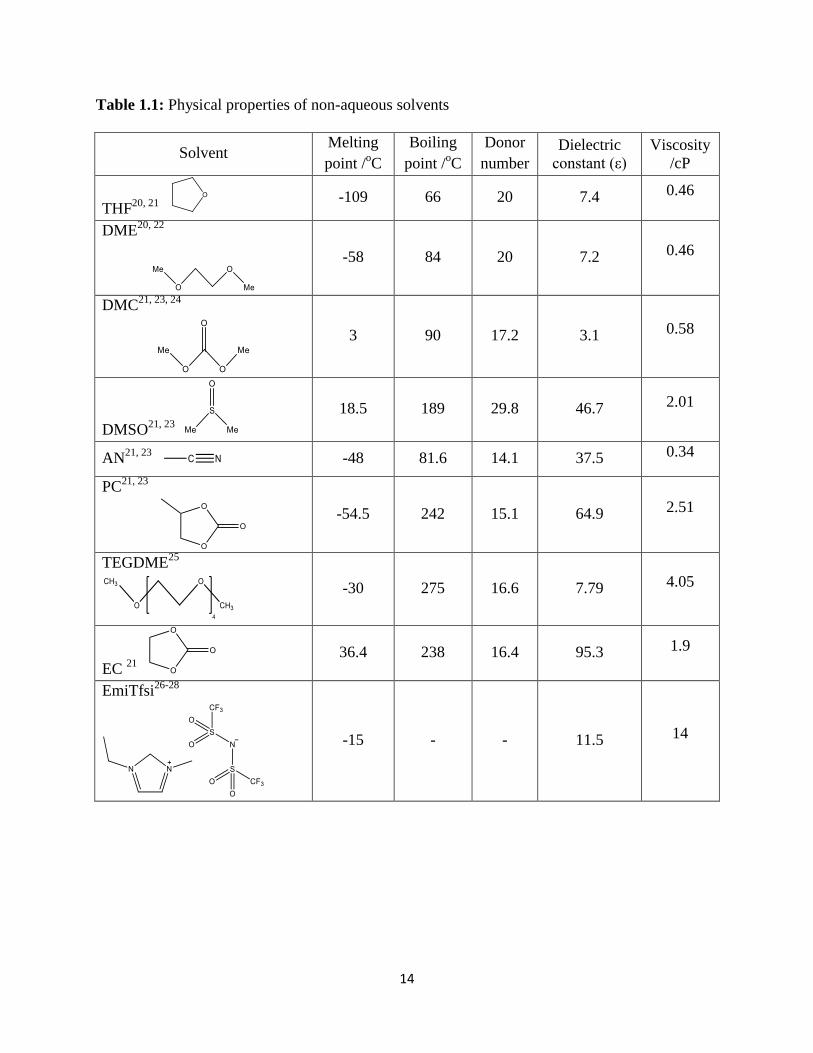
Aprotic electrolytes over a wide range of properties have been investigated so far and
they include Li salt solutions in organic esters, carbonates, ethers and sulfoxides. Another class
of electrolytes being investigated for Li-O2 batteries is room temperature ionic liquids (RTILs).
In some instances solvent blends are used incorporated to modulate electrolyte characteristics to
meet the aforementioned requirements. Physical properties of a group of aprotic solvents and a
RTIL are listed in Table 1.1
14
Table 1.1: Physical properties of non-aqueous solvents
Solvent Melting
point /oC
Boiling
point /oC
Donor
number
Dielectric
constant (ε)
Viscosity
/cP
THF20, 21
-109 66 20 7.4 0.46
DME20, 22
-58 84 20 7.2 0.46
DMC21, 23, 24
3 90 17.2 3.1 0.58
DMSO21, 23
18.5 189 29.8 46.7 2.01
AN21, 23
-48 81.6 14.1 37.5 0.34
PC21, 23
-54.5 242 15.1 64.9 2.51
TEGDME25
-30 275 16.6 7.79 4.05
EC 21
36.4 238 16.4 95.3 1.9
EmiTfsi26-28
-15 - - 11.5 14
15
Organic Carbonates
Oragnic carbonates are the most popular solvents used in state-of-art Li-ion batteries.
Formally, dendrite formation on the lithium anode was a drawback of electrolytes based on
cyclic carbonates such as propylene carbonate (PC). However, with the invention of
carbonaceous Li intercalation anodes leading to the advent of Li-ion batteries, organic
carbonate solvents have become popular again with practical electrolytes comprising LiPF6
dissolved in mixtures of ethylene carbonate (EC) and linear carbonates of dimethyl carbonate
(DMC), diethyl carbonate (DEC) and/or ethyl methyl carbonate (EMC) .
The high dielectric constants and the wide liquid range of these types of solvents attracted
attention of scientists at the beginning of Li-O2 battery research. Resent experiments of Li-O2
batteries based on carbonate electrolytes have shown capacity fade with prolonged cycling which
has been attributed to stability limitations of these electrolytes under the strongly oxidizing and
reducing environments in the Li-O2 battery. The main discharge product in Li-O2 batteries
utilizing organic carbonate solvents has been found to be Li2CO3, suggesting the decomposition
of the electrolyte by the reaction with the discharge of the battery lithium peroxide. Therefore,
loss of electrolyte and the accumulation of lithium carbonate have been a serious issue which
prompted new investigations for alternative solvent systems for the Li-O2 battery.
Organic Ethers
Organic ethers gained attention as they are less susceptible to reduction at the Li-O2
cathode compared to carbonate based electrolytes and they are more stable in the presence of the
reactive oxygen reduction products formed at the cathode. High boiling point ethers such as
tetraethylene glycol dimethyl ether (TEGDME) have been successfully employed in Li-O2 cells
in the past few years.29, 30
The low cost of the ethers and their wide potential windows have also
16
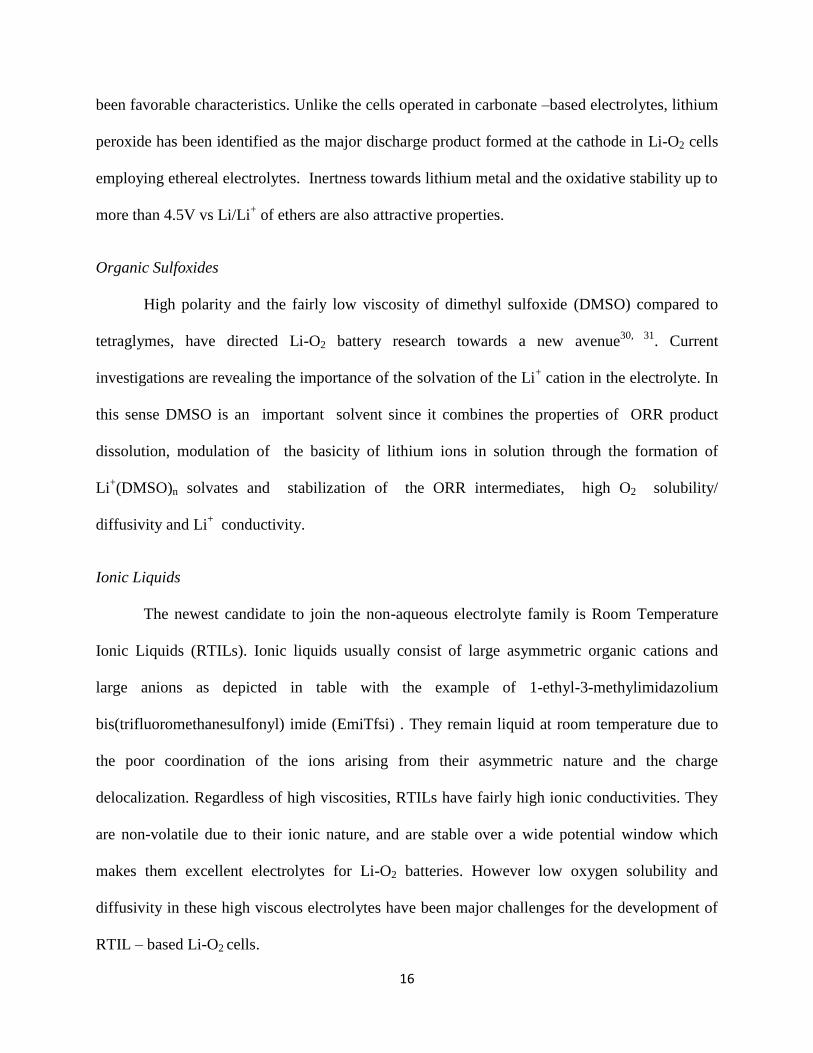
been favorable characteristics. Unlike the cells operated in carbonate –based electrolytes, lithium
peroxide has been identified as the major discharge product formed at the cathode in Li-O2 cells
employing ethereal electrolytes. Inertness towards lithium metal and the oxidative stability up to
more than 4.5V vs Li/Li+ of ethers are also attractive properties.
Organic Sulfoxides
High polarity and the fairly low viscosity of dimethyl sulfoxide (DMSO) compared to
tetraglymes, have directed Li-O2 battery research towards a new avenue30, 31
. Current
investigations are revealing the importance of the solvation of the Li+ cation in the electrolyte. In
this sense DMSO is an important solvent since it combines the properties of ORR product
dissolution, modulation of the basicity of lithium ions in solution through the formation of
Li+(DMSO)n solvates and stabilization of the ORR intermediates, high O2 solubility/
diffusivity and Li+ conductivity.
Ionic Liquids
The newest candidate to join the non-aqueous electrolyte family is Room Temperature
Ionic Liquids (RTILs). Ionic liquids usually consist of large asymmetric organic cations and
large anions as depicted in table with the example of 1-ethyl-3-methylimidazolium
bis(trifluoromethanesulfonyl) imide (EmiTfsi) . They remain liquid at room temperature due to
the poor coordination of the ions arising from their asymmetric nature and the charge
delocalization. Regardless of high viscosities, RTILs have fairly high ionic conductivities. They
are non-volatile due to their ionic nature, and are stable over a wide potential window which
makes them excellent electrolytes for Li-O2 batteries. However low oxygen solubility and
diffusivity in these high viscous electrolytes have been major challenges for the development of
RTIL – based Li-O2 cells.
17
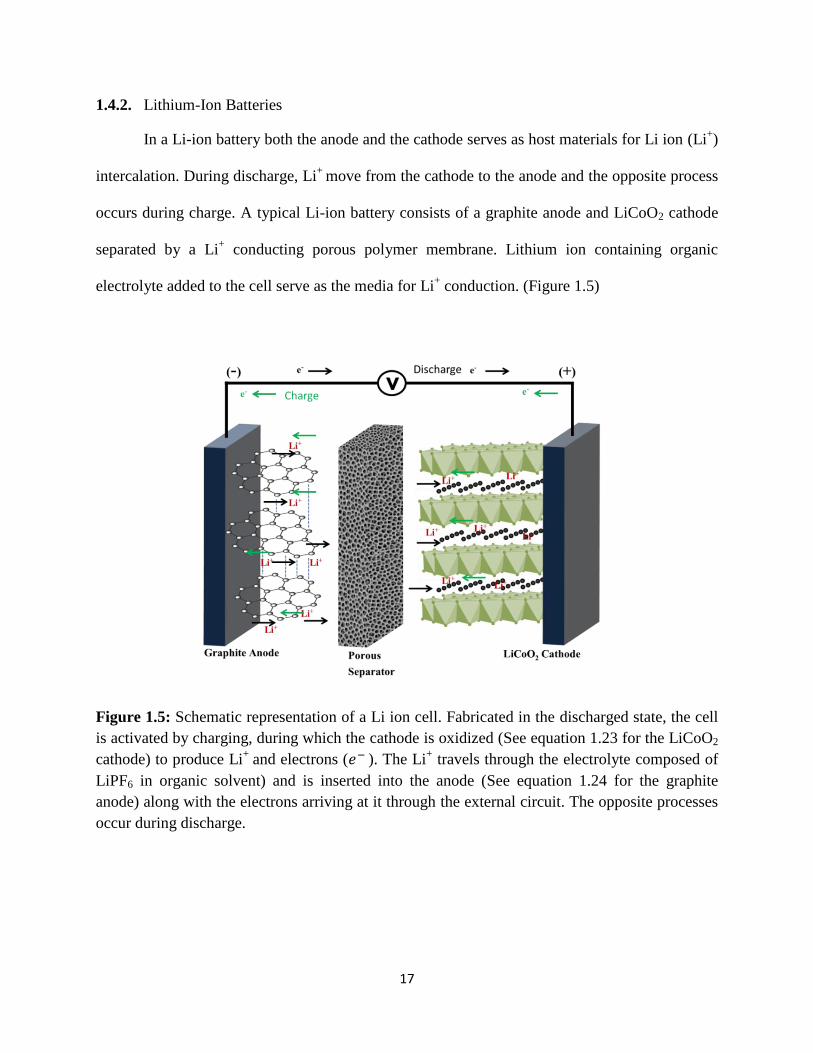
1.4.2. Lithium-Ion Batteries
In a Li-ion battery both the anode and the cathode serves as host materials for Li ion (Li+)
intercalation. During discharge, Li+
move from the cathode to the anode and the opposite process
occurs during charge. A typical Li-ion battery consists of a graphite anode and LiCoO2 cathode
separated by a Li+ conducting porous polymer membrane. Lithium ion containing organic
electrolyte added to the cell serve as the media for Li+ conduction. (Figure 1.5)
Figure 1.5: Schematic representation of a Li ion cell. Fabricated in the discharged state, the cell
is activated by charging, during which the cathode is oxidized (See equation 1.23 for the LiCoO2
cathode) to produce Li+
and electrons (𝑒− ). The Li+ travels through the electrolyte composed of
LiPF6 in organic solvent) and is inserted into the anode (See equation 1.24 for the graphite
anode) along with the electrons arriving at it through the external circuit. The opposite processes
occur during discharge.
18
LiCoO2 Cathode 𝐿𝑖𝐶𝑜𝑂2 ⇄ 𝐿𝑖1−𝑥𝐶𝑜𝑂2 + 𝑥𝐿𝑖+ + 𝑥𝑒− [1.23]
Graphite Anode 𝑥𝐿𝑖+ + 𝑥𝑒− + 𝑥𝐶6 ⇄ 𝑥𝐿𝑖𝐶6 [1.24]
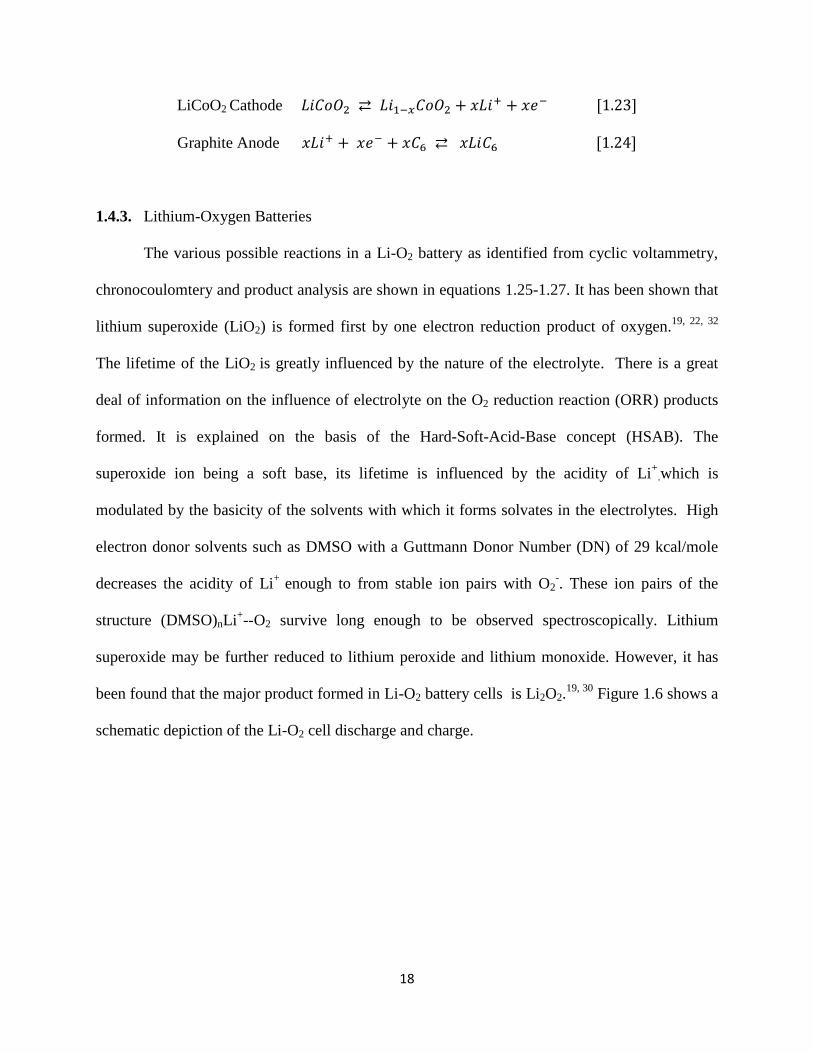
1.4.3. Lithium-Oxygen Batteries
The various possible reactions in a Li-O2 battery as identified from cyclic voltammetry,
chronocoulomtery and product analysis are shown in equations 1.25-1.27. It has been shown that
lithium superoxide (LiO2) is formed first by one electron reduction product of oxygen.19, 22, 32
The lifetime of the LiO2 is greatly influenced by the nature of the electrolyte. There is a great
deal of information on the influence of electrolyte on the O2 reduction reaction (ORR) products
formed. It is explained on the basis of the Hard-Soft-Acid-Base concept (HSAB). The
superoxide ion being a soft base, its lifetime is influenced by the acidity of Li+
.which is
modulated by the basicity of the solvents with which it forms solvates in the electrolytes. High
electron donor solvents such as DMSO with a Guttmann Donor Number (DN) of 29 kcal/mole
decreases the acidity of Li+
enough to from stable ion pairs with O2-. These ion pairs of the
structure (DMSO)nLi+--O2 survive long enough to be observed spectroscopically. Lithium
superoxide may be further reduced to lithium peroxide and lithium monoxide. However, it has
been found that the major product formed in Li-O2 battery cells is Li2O2.19, 30
Figure 1.6 shows a
schematic depiction of the Li-O2 cell discharge and charge.
19
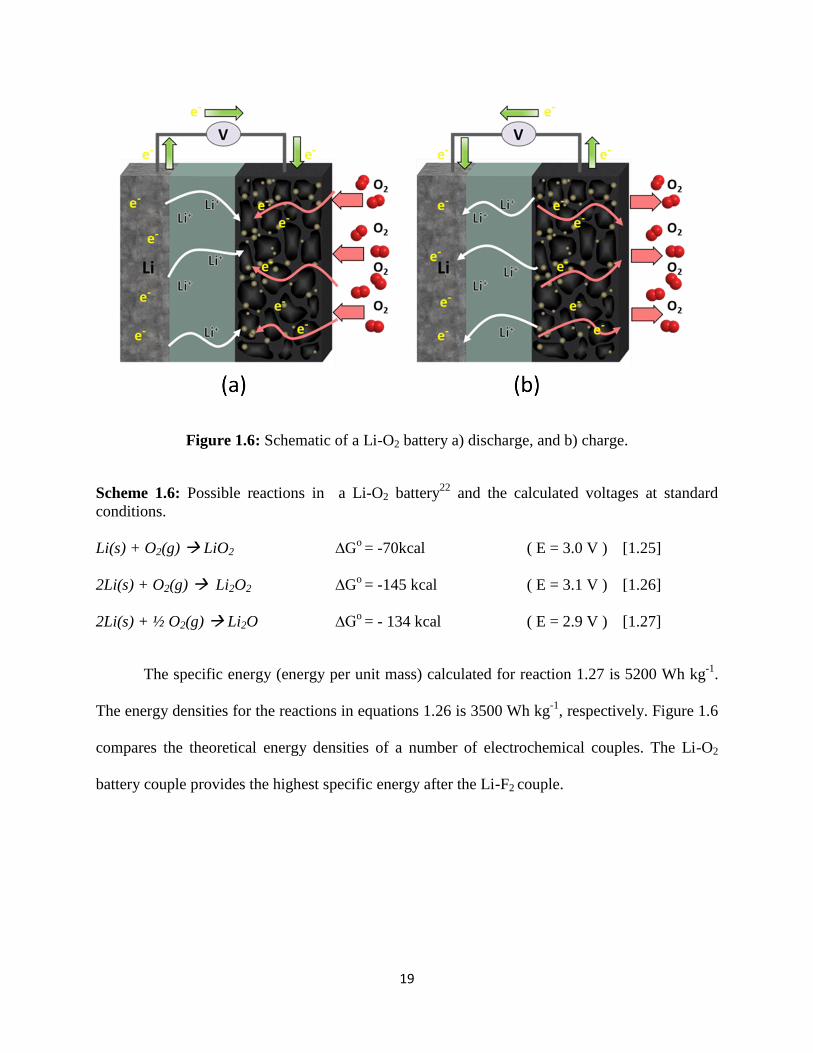
Figure 1.6: Schematic of a Li-O2 battery a) discharge, and b) charge.
Scheme 1.6: Possible reactions in a Li-O2 battery22
and the calculated voltages at standard
conditions.
Li(s) + O2(g) LiO2 ∆Go = -70kcal ( E = 3.0 V ) [1.25]
2Li(s) + O2(g) Li2O2 ∆Go = -145 kcal ( E = 3.1 V ) [1.26]
2Li(s) + ½ O2(g) Li2O ∆Go = - 134 kcal ( E = 2.9 V ) [1.27]
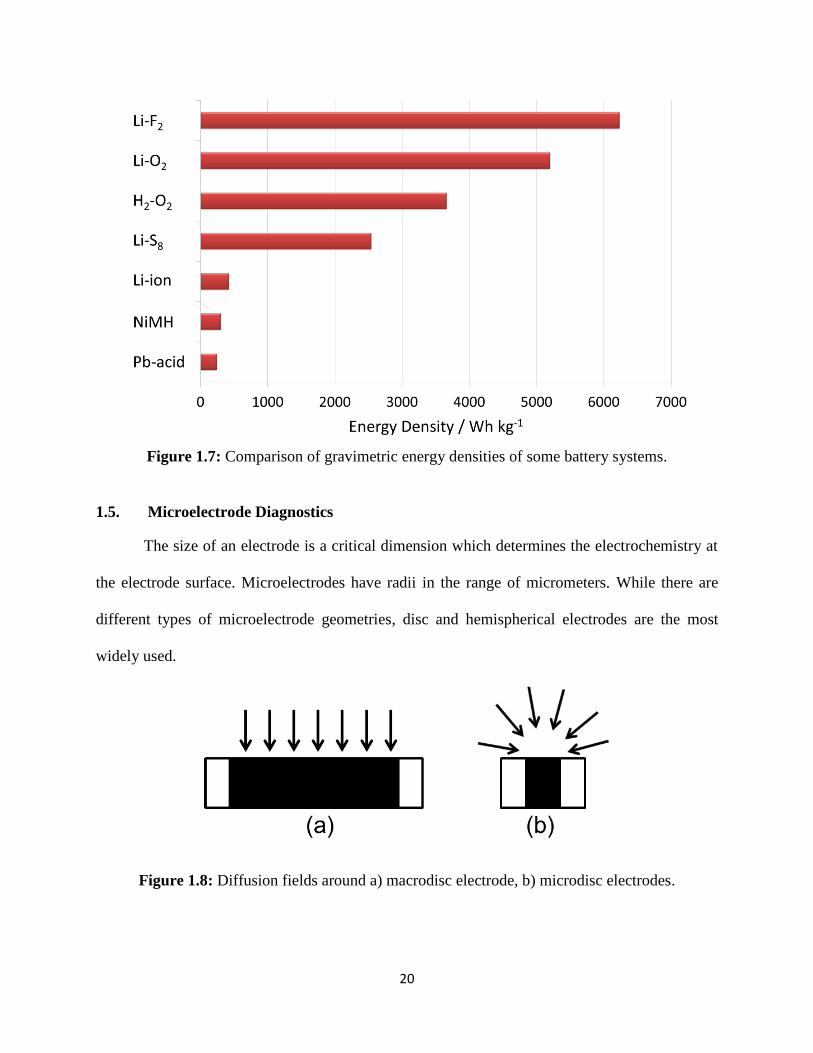
The specific energy (energy per unit mass) calculated for reaction 1.27 is 5200 Wh kg-1
.
The energy densities for the reactions in equations 1.26 is 3500 Wh kg-1
, respectively. Figure 1.6
compares the theoretical energy densities of a number of electrochemical couples. The Li-O2
battery couple provides the highest specific energy after the Li-F2 couple.
20
Figure 1.7: Comparison of gravimetric energy densities of some battery systems.
1.5. Microelectrode Diagnostics
The size of an electrode is a critical dimension which determines the electrochemistry at
the electrode surface. Microelectrodes have radii in the range of micrometers. While there are
different types of microelectrode geometries, disc and hemispherical electrodes are the most
widely used.
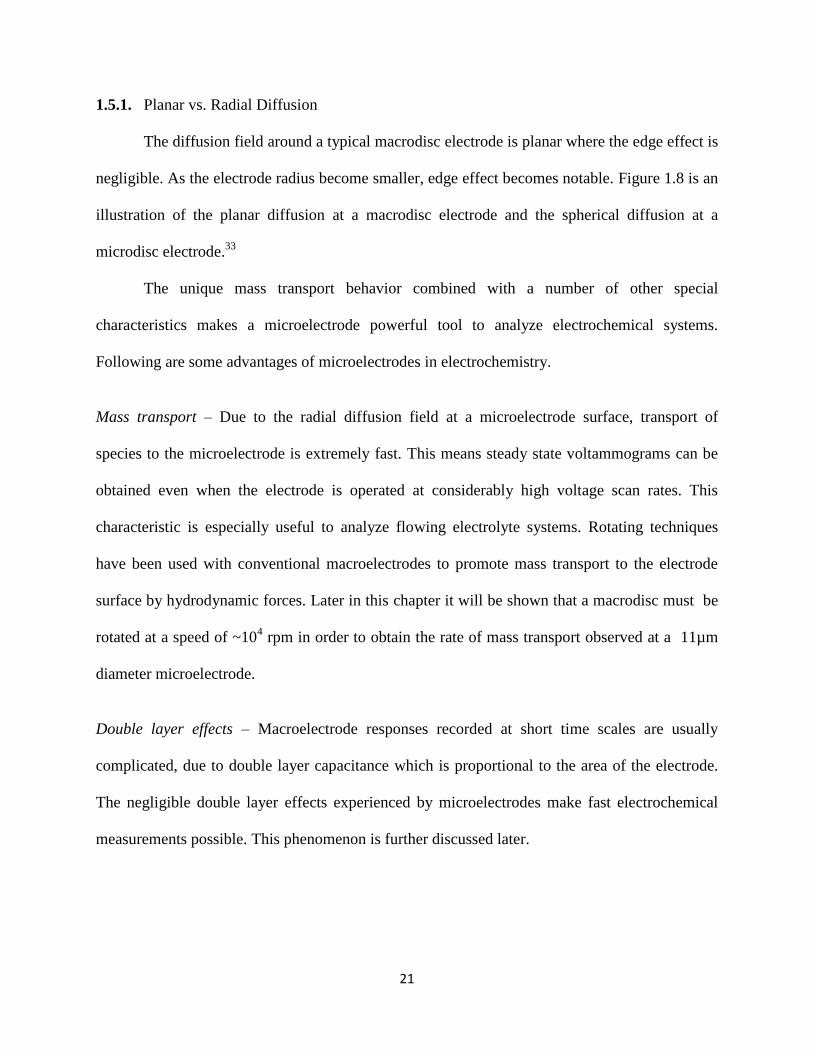
Figure 1.8: Diffusion fields around a) macrodisc electrode, b) microdisc electrodes.
21
1.5.1. Planar vs. Radial Diffusion
The diffusion field around a typical macrodisc electrode is planar where the edge effect is
negligible. As the electrode radius become smaller, edge effect becomes notable. Figure 1.8 is an
illustration of the planar diffusion at a macrodisc electrode and the spherical diffusion at a
microdisc electrode.33
The unique mass transport behavior combined with a number of other special
characteristics makes a microelectrode powerful tool to analyze electrochemical systems.
Following are some advantages of microelectrodes in electrochemistry.
Mass transport – Due to the radial diffusion field at a microelectrode surface, transport of
species to the microelectrode is extremely fast. This means steady state voltammograms can be
obtained even when the electrode is operated at considerably high voltage scan rates. This
characteristic is especially useful to analyze flowing electrolyte systems. Rotating techniques
have been used with conventional macroelectrodes to promote mass transport to the electrode
surface by hydrodynamic forces. Later in this chapter it will be shown that a macrodisc must be
rotated at a speed of ~104 rpm in order to obtain the rate of mass transport observed at a 11µm
diameter microelectrode.
Double layer effects – Macroelectrode responses recorded at short time scales are usually
complicated, due to double layer capacitance which is proportional to the area of the electrode.
The negligible double layer effects experienced by microelectrodes make fast electrochemical
measurements possible. This phenomenon is further discussed later.
22
Small currents – The magnitude of the currents recorded at a microelectrode are considerably
small (in the 10-9
–10-10
A range) which translates to negligible iR drops associated with their
measurements. Therefore microelectrodes can be successfully employed in highly resistive
electrolytes such as solid polymer electrolytes and viscous organic electrolytes with very low ion
concentrations, without sacrificing the accuracy of the data obtained.
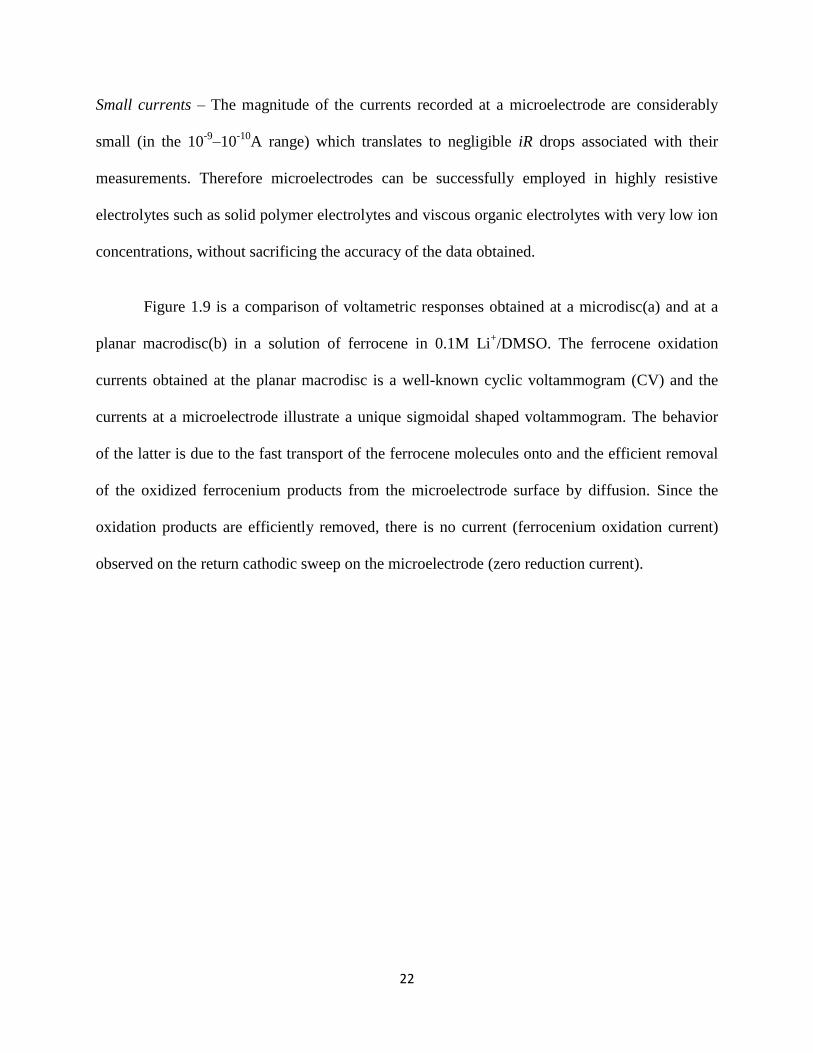
Figure 1.9 is a comparison of voltametric responses obtained at a microdisc(a) and at a
planar macrodisc(b) in a solution of ferrocene in 0.1M Li+/DMSO. The ferrocene oxidation
currents obtained at the planar macrodisc is a well-known cyclic voltammogram (CV) and the
currents at a microelectrode illustrate a unique sigmoidal shaped voltammogram. The behavior
of the latter is due to the fast transport of the ferrocene molecules onto and the efficient removal
of the oxidized ferrocenium products from the microelectrode surface by diffusion. Since the
oxidation products are efficiently removed, there is no current (ferrocenium oxidation current)
observed on the return cathodic sweep on the microelectrode (zero reduction current).
23
Figure 1.9: Ferrocene oxidation currents obtained at a) an 11µm microdisc electrode at different
potential scan rates, b) a glassy carbon macrodisc at different potential scan rates.
1.5.2. Microelectrode Electrochemistry
The current at a microelectrode operating under steady state conditions is given by,
𝑖𝑙 = 4𝑛𝐹𝐴𝐷𝐶
𝜋𝑟= 4𝑛𝐹𝐷𝐶𝑟 [1.28]
a
b
24
where 𝑖𝑙 is the diffusion limited current, F is the Faraday constant, D is the diffusion coefficient
and C is the solubility of the reactant and r is the radius of the microdisc electrode and n is the
number of electrons. When the microelectrode potential is stepped from a potential where no
reaction occurs to a potential where the reaction is diffusion limited, at small times after
polarization, the diffusion limited I current is given by equation 1.29.34
𝐼 = 𝑛𝐹𝐴𝐷
12𝐶
𝜋12𝑡
12
+ 𝑛𝜋𝐹𝐷𝐶𝑟 [1.29]
From the slope and the intercept of I vs. t−1/2
curve34
(equation 1.29) the diffusion coefficient and
solubility of the reactant in the electrolyte can be calculated as shown by equations 1.30 and 1.31
respectively.
𝐷 =𝑖𝑛𝑡𝑒𝑟𝑐𝑒𝑝𝑡2 × 𝑟2
𝑠𝑙𝑜𝑝𝑒2 × 𝜋 [1.30]
𝐶 =𝑠𝑙𝑜𝑝𝑒2
𝑖𝑛𝑡𝑒𝑟𝑐𝑒𝑝𝑡 × 𝑟3 × 𝐹 × 𝑛 [1.31]
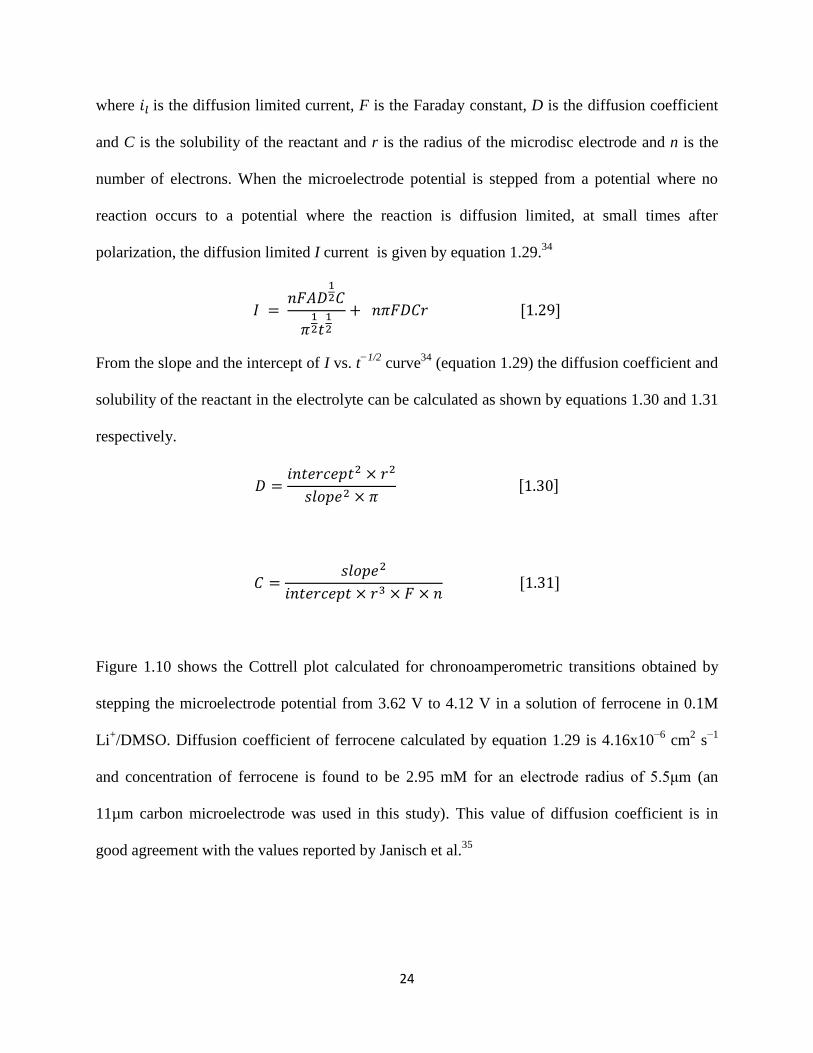
Figure 1.10 shows the Cottrell plot calculated for chronoamperometric transitions obtained by
stepping the microelectrode potential from 3.62 V to 4.12 V in a solution of ferrocene in 0.1M
Li+/DMSO. Diffusion coefficient of ferrocene calculated by equation 1.29 is 4.16x10
−6 cm
2 s
−1
and concentration of ferrocene is found to be 2.95 mM for an electrode radius of 5.5μm (an
11µm carbon microelectrode was used in this study). This value of diffusion coefficient is in
good agreement with the values reported by Janisch et al.35
25
Figure 1.10: Current vs t
-1/2 plot for chronoamperometric transients obtained for the ferrocene
oxidation reaction in 0.1M Li+/DMSO (Argon saturated solution, 11µm microelectrode).
1.5.3. Experimental Validation of the Technique
The steady state current on a rotating disc macroelectrode is given by the Levich equation
(equation 1.32)
𝑖𝑙 = 0.620 × 𝑛𝐹𝐴𝐷23𝜔
12𝜐−
16𝐶 [1.32]
where ω is the speed at which the electrode is rotated and υ is the kinematic viscosity of the
electrolyte. The requirement to obtain a particular limiting current density at a microelectrode
and a macroelectrode can be derived using equations 1.28 and 1.32 as follows (equation 1.33).
4𝑛𝐹𝐷𝐶𝜋−1𝑟−1 = 0.620 × 𝑛𝐹𝐴𝐷23𝜔
12𝜐−
16𝐶 [1.33]
This simplifies to equation 1.34 which shows the relation of a microelectrode radius with the
rotating speed of a macrodisc.
0.620 × 4𝜋𝐷13𝜐
16 = 𝜔
12𝑟 [1.34]
26
From equation 1.34, it can be shown that the rotation speed of a microdisc corresponding to a
microelectrode of 11µm diameter is ∼25000 rpm (assuming DO2, DMSO ∼ 2*10−5
cm2
s−1
, υDMSO
∼1.9 cP). This further confirms the advantage of using a microelectrode for voltametric
measurements related to high resistance electrochemical systems. The maximum rotation speeds
that the conventional rotors can operate are limited to ∼3000 rpm. Also the electrode responses
obtained at these rotation speeds often suffer from high ohmic voltage drops and needs to
carefully corrected using electrochemical impedance spectroscopy. Clearly, a microelectrode is a
very useful technique to accurately analyze complicated electrochemical systems.
1.6. Scope of the Thesis
The contents of this dissertation are divided into two major parts. The first part presented
in detail in Chapter 2 deals with the interfacial kinetics of fuel cell reactions at the
membrane/electrode interface and transport characteristics of reactants through alkaline anion
exchange membranes. The mass transport losses that occur as result of carbonate exchange of
hydroxide ions in alkaline anion exchange membranes are discussed in detail. The qualitative
effect of the carbonate exchange on O2 reduction,13
H2 oxidation and methanol oxidation under
alkaline conditions are also discussed here.
The second part of the dissertation detailed in Chapters 3, 4 and 5 is concerned with the
electrochemistry of non-aqueous lithium-oxygen batteries. We show that electrolyte formulation
is of utmost importance to overcome the capacity and cycle life limitations associated with these
batteries. For the first time microelectrode technique31, 36
has been used to electrochemically
characterize and predict O2 diffusion and solubility in viscous organic electrolytes relevant to Li-
O2 batteries. The importance of the donor properties of the lithium salt anions, ether and
27
sulfoxide -based solvents and the significance of the acidity modulation of the Li+ cation in the
electrolytes containing these species are presented.37
Chapter 5 focuses on the catalysis of the oxygen reduction reaction (ORR) by an iron(II)
phthalocyanine–based solid state catalyst. The structure and electrochemistry of iron-based
catalysts prepared by heat-treating iron(II) phthalocyanine with high surface area carbon black
precursors have been investigated. The pyrolysis temperature of the catalyst determines the ORR
mechanism which translates to a better ORR onset potential and the subsequent oxygen
evolution reactions (OER). The donor properties of the solvent as well as the salt anion of the
electrolyte have a significant effect on the ORR mechanism in the presence of these catalysts.
Mechanisms proposed for the catalytic ORR and OER based on the results of electrochemical
investigations are discussed, and Raman and FT-IR spectroscopic and X-ray diffraction studies
are presented.
The final chapter includes the conclusion of the investigations and a discussion of
directions for future work.
28
Chapter 2
Reactant Transport and Interfacial Kinetics at the Pt/AEM Interface:
Microelectrode Studies on the Effect of Carbonate Exchange in Alkaline
Fuel Cells
2.1. Introduction
Development of fuel cell technology requires significant cost reduction which mainly
arises from the generous amounts of Pt–based catalysts being used to surmount kinetic
overpotentials at the oxygen cathode. Fuel cells operating in alkaline media have possible
advantage of facile kinetics of the oxygen reduction reaction (ORR) on non-precious group
metals and stability at high pH values. Also, the facile methanol oxidation kinetics observed in
direct methanol fuel cells (DMFC) under high pHs8 have been favorable. In addition, the
hydrodynamics of alkaline membrane fuel cells is beneficial considering the problems associated
with water management in a conventional PEM fuel cell. Furthermore, highly stable
poly(tetrafluoroethylene) (PTFE)-based membranes are not required under alkaline conditions as
the membranes are less prone to attack by peroxide ions.
Even though AEMFCs alleviate most of the hurdles associated with PEM fuel cells, state
of art performance of 𝐻2/O2(air) cells does not exceed half of the performance shown by 𝐻2 fed
PEM fuel cells using Pt –based catalysts (compare 700 mW cm-2
for PEMFCs15
at 0.65 V (80oC,
100% RH) with ~40 mW cm-2
for AEMFCs38
at 0.65 Volts (50oC, 85% RH).
38 The major
concern under atmospheric air feed is carbonate exchange of the hydroxyl ions in the
polyelectrolyte due to their complete conversion to carbonate and bicarbonate ions upon
exposure.9, 39, 40
Conversion of the hydroxide ions to CO32−/ HCO3
− ions can also occur by the CO2
produced by methanol oxidation at the DMFC anode. In such instances only HCO3− and CO3
2−are
responsible for ionic conduction.41
Donnan exclusion of protons within the membrane and the
29
fuel cell operating conditions lead to carbonate (CO32−) ion enrichment
10-14, 42 as discussed in
Chapter 1. It is well known that conductivities of carbonate ions in aqueous solutions are lower
than hydroxyl ions due to larger hydration spheres arising from the size and surface charge
densities.43
As reported earlier, relative decrease in ionic conductivity as a function of exchange
with carbonate and bicarbonate ions is low.44, 45
Permeation of reactants in the ionomer and
membrane thus play an important role in determining the onset of mass transport and hence the
power density of the AEM fuel cells. Details of interfacial kinetics and mass transport of
dissolved oxygen and the quantitative effect on the performance by carbonate exchange is
relatively unknown. The first part of this chapter provides an insight on the relative magnitudes
of kinetics of the ORR as well as mass transport of O2 in the AEM with and without carbonate
exchange. Investigations on the quantitative effect of the carbonate ion contamination in the
alkaline membrane on the fuel cell anode (hydrogen and methanol) are discussed later.
A well-known quaternized anion exchange membrane, Tokuyama®A201, (Tokuyama
Corp., Tsukuba, Japan) was used in this study in conjunction with a solid state electrochemical
cell incorporating a micro-electrode, described in detail elsewhere.46, 47
The parameters obtained
were free from effects typically encountered in liquid electrolytes such as hydroxide ion
adsorption effects and presence of mobile cations. Conventional fuel cell electrode kinetics
reported on rotating disc electrodes in aqueous electrolytes greatly deviate from the kinetics of
the membrane electrode interface.48
This study for the first time resolves the kinetics from the
mass transport contributions (diffusion coefficient and solubility) of fuel cell cathode reactions
(ORR) and fuel cell anode reactions (hydrogen and methanol oxidation). Results of this work are
used to understand polarization losses at a typical fuel cell interface.
30
2.2. Experimental
2.2.1. Membranes
Tokuyama-A201-OH− and A901- OH− membranes were prepared by soaking Tokuyama
A201, A901 (Tokuyama Corp., Tsukuba, Japan) membranes in 1 M KOH solutions. Membranes
were then rinsed and stored in CO2 free water (prepared by boiling the water followed by cooling
under argon. Membranes in the carbonate form were prepared by soaking as received membranes
in 1 M K2CO3 solution. These membranes were then rinsed and stored in milli-q water overnight
to leach excess carbonate ions. A solid state cell shown in Figure 2.1a was used to study the
oxygen and hydrogen electrode reactions.13, 46, 47
A liquid feed enabled cell shown in Figure 2.1b
was used to study the methanol anode electrochemistry. A 100µm Pt microelectrode (Bio-
analytical Systems), 1.6 mm diameter Pt disc counter electrode and a dynamic hydrogen
electrode (DHE) made the three electrode system. All electrodes were cleaned using 15 µm, 3
µm, 1 µm diamond polish, respectively, and were sonicated in milli-q water for 10 minutes. The
DHE was subsequently platinized prior to use.
2.2.2. Electrochemical Techniques
Voltammeric measurements were taken using a computer controlled
potentiostat/galvanostat (Autolab, model PGSTAT30). Measurements of carbonate free
membranes were carried out in CO2 free conditions enabled by an Ar filled glove bag (Atmos-
glove bag (Sigma Aldrich)). Cyclic voltammograms were recorded for 100% RH nitrogen
saturated membranes to ensure a proper electrochemical interface. Anion exchange membrane
exchanged with carbonate ions was studied outside the glove-bag, exposed to air. All
measurements were carried out at 293 K temperature and 1 atm pressure.
31
Potentials were scanned from 0.0 V to 1.3 V in nitrogen saturated membranes at 100 mV s-1
, to
clean the electrode surface prior to taking readings. All potentials were corrected to the
reversible hydrogen electrode (RHE) scale before analysis. Cyclic voltammetry was preceded by
measurement of contact impedance changes with variation of contact pressure using a built in
micrometer head.46, 47
The relative invariance of contact impedance and the recording of proper
Pt features on the CV, were checks to ensure proper interfacial conditions. HUPD areas measured
by CV served to determine the active surface area of the microelectrode.
2.2.3. Mass Transport Parameters
Using the mathematical model proposed by Aoki and Osteryoung49
to simulate
chronoamperometric currents at the microelectrode, Winlove et al.34
have reported that if the
time after polarization is small, diffusion limited current at the microelectrode can be given by
modified Cottrell equation (equation 2.1).
where n is the number of electrons per reduction of oxygen molecule. F is the Faraday constant,
A is the geometric area and r is the electrode radius of the electrode. D and C are diffusion
coefficient and solubility of the reactant in the AEM. Chronoamperometric measurements were
carried out by equilibrating the electrode at potential close to the open circuit potential and
stepping to a potential beyond the kinetic region. D and C were calculated using the equations
involving the slope and the intercept of the Cottrell plot (equations 2.2 and 2.3).13, 31
𝐼 =𝑛𝐹𝐴𝐷
12𝐶
𝜋12𝑡
12
+ 𝑛𝜋𝐹𝐷𝐶𝑟 [2.1]
32
2.2.4. Oxygen Transport and ORR Kinetics at the Pt/AEM Interface
The membrane was equilibrated for at least two hours with a 100% RH oxygen supply in
order to ensure oxygen dissolution. Chronoamperometric measurements were carried out by
conditioning the electrode potential at 1.0 V for 10 s and stepping down to 0.4 V for 20 s with
respect to RHE. D and C were calculated by using the slope and intercept of the current vs.
inverse square root plot (equation 2.1). Kinetics of the ORR at the Pt electrode/AEM interface
was studied by mass transport corrected Tafel equation (2.4),
where η is the overpotential (E-E0), io is the exchange current density, α is the transfer
coefficient, R is the gas constant, T is the absolute temperature, id and i are limiting current and
current, respectively. Transfer coefficient and exchange current densities were calculated using
extrapolation of the Tafel slope. Since this extrapolation is over several decades of current, the
relative orders of magnitude served as indicators of changes in kinetics. More accurate
comparisons were made using currents (mass transport corrected) at 0.9 V vs. RHE.
𝐷 =𝑖𝑛𝑡𝑒𝑟𝑐𝑒𝑝𝑡2 × 𝑟2
𝑠𝑙𝑜𝑝𝑒2 × 𝜋 [2.2]
𝐶 =𝑠𝑙𝑜𝑝𝑒2
𝑖𝑛𝑡𝑒𝑟𝑐𝑒𝑝𝑡 × 𝑟3 × 𝐹 × 𝑛 [2.3]
𝜂 =2.303𝑅𝑇
𝛼𝑛𝐹log 𝑖0 +
−2.303𝑅𝑇
𝛼𝑛𝐹log [
𝑖0𝑖
𝑖𝑑 − 𝑖] [2.4]

33
Figure 2.1: Solid state cells a) For gaseous reactants, b) Liquid feed enabled cell.
2.2.5. Hydrogen Transport and HOR Kinetics at the Pt/AEM Interface
The membrane was equilibrated for at least two hours with a 100% RH hydrogen supply
in order to ensure proper hydrogen dissolution. Chronoamperometric measurements were carried
out by conditioning the electrode potential at 0.0 V for 10 s and stepping up to 0.3 V for 20 s
with respect to RHE. D and C were calculated by using the slope and intercept of the current vs.
inverse square root plot (equation 2.1). Kinetics at the Pt electrode/AEM interface were studied
by mass transport corrected Tafel equation (2.4),
The HOR on platinum electrodes can take place through the following steps (scheme 2.1-2.2),
Scheme 2.1: Hydrogen oxidation reaction in acidic environments
𝐻2 + 2𝑃𝑡 → 2(𝑃𝑡 − 𝐻) Tafel [2.5]
𝐻2 + 𝑃𝑡 → 𝑃𝑡 − 𝐻 + 𝐻+ + 𝑒 Heyrovsky [2.6]
𝑃𝑡 − 𝐻 → 𝐻+ + 𝑒 Volmer [2.7]
a b
34
Scheme 2.2: Hydrogen oxidation reaction in alkaline environments
𝐻2 + 𝑂𝐻− + 𝑃𝑡 → 𝑃𝑡 − 𝐻 + 𝐻2𝑂 + 𝑒 Heyrovsky [2.8]
𝑃𝑡 − 𝐻 + 𝑂𝐻− → 𝐻2𝑂 + 𝑒 Volmer [2.9]
To interpret the Heyrovky-Volmer reaction with a transfer coefficient of α, Butler –Volmer (B-
V) equation can be used.50
Kinetic parameters for HOR were obtained by fitting the polarization
data in B-V equation (2.5).50
𝑖𝑘 = 𝑖𝑜 {exp (𝛼𝐹
𝑅𝑇𝜂) − exp (
−(1 − 𝛼)𝐹
𝑅𝑇) 𝜂} [2.5]
2.2.6. H2/Air Fuel Cell Tests
PEM fuel cells and AEM fuel cells were constructed using Pt/C based electrodes (0.5
mgPt cm-2
). A catalyst coated Nafion® membrane (ionomer/carbon ratio of 0.7) was hot pressed
to the gas diffusion layer (GDL) at 130oC. Polarization data were recorded for normal air feed at
the cathode at 65oC and 100% RH conditions. Catalyst coated Tokuyama-A201 membranes were
prepared by hot pressing the membrane between ink coated decal supports (ionomer (AS-4
(Tokuyama Corp.))/carbon ratio of 0.4). Ultra-zero (CO2 < 1 ppm) air was used at the cathode
and polarization curves were recorded at 50oC and 100% RH conditions. Both membrane
electrode assemblies (MEAs) were conditioned at series of potentials prior to testing.
2.2.7. Methanol Transport and MOR Kinetics at the Pt/AEM Interface
Equation 2.6 shows possible pathways of the methanol oxidation on a Pt electrode.
𝐶𝐻3𝑂𝐻 → 𝑅𝑒𝑎𝑐𝑡𝑖𝑣𝑒 𝑖𝑛𝑡𝑒𝑟𝑚𝑒𝑑𝑖𝑎𝑡𝑒𝑠
𝐻𝐶𝑂𝑂− ↗ ↘ 𝑃𝑜𝑖𝑠𝑜𝑛𝑖𝑛𝑔 𝑠𝑝𝑒𝑐𝑖𝑒𝑠 → 𝐶𝑂2
[2.6]
35
Methanol oxidation in alkaline conditions proceeds faster than in low pH conditions due
to balanced co-adsorption of hydroxyl ions at high pHs. Slow sweep voltammetry cannot be used
to obtain diffusion limited currents for the methanol oxidation reaction at a Pt electrode.
Therefore, potential step chronoamperometry was applied to obtain steady state methanol
oxidation currents for kinetic analysis. For this, starting from 4.0 V the potential of the Pt
electrode was increased by 50mV limits and the electrode was held at each potential for 180
seconds.
Methanol transport parameters were evaluated using the Cottrell Plots calculated from the
current-time transients obtained by stepping the Pt electrode potential from 0.4 V to 0.8 V.
2.3. Results and Discussion
Cyclic voltammograms (CV) were recorded at the Pt microelectrode for the N2 saturated
alkaline anion exchange membrane, to ensure the proper contact between the AEM and the
electrode. All the potentials reported in this chapter are with reference to the RHE. The CVs
were recorded under 100% relative humidity (RH) conditions. The electrochemically active area
of the platinum microelectrode was calculated using the hydrogen adsorption region of the
nitrogen CV. Specific adsorption of hydroxide ions from water leads to Pt-OH formation which
is indicated by the peak that appears at 0.8V. Meanwhile in the CO32−-based AEM, the hydroxide
adsorption peak is very low in intensity and it has shifted to a higher voltage (Figure 2.2).51
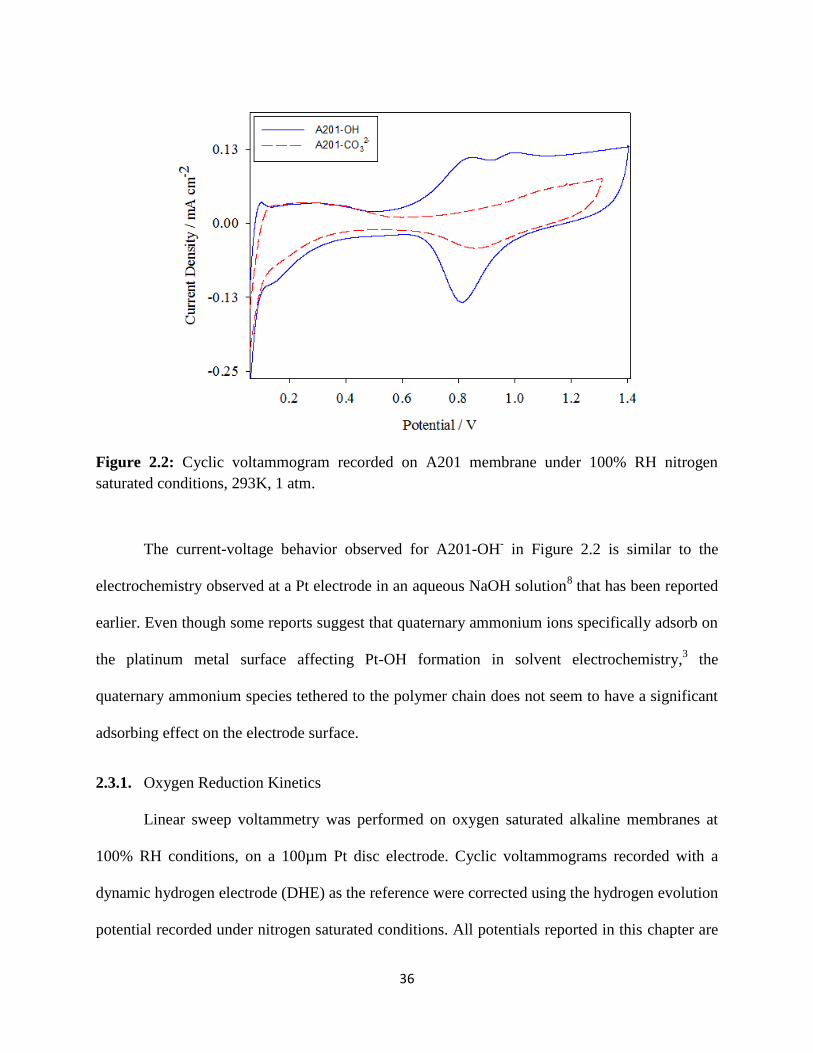
36
Figure 2.2: Cyclic voltammogram recorded on A201 membrane under 100% RH nitrogen
saturated conditions, 293K, 1 atm.
The current-voltage behavior observed for A201-OH- in Figure 2.2 is similar to the
electrochemistry observed at a Pt electrode in an aqueous NaOH solution8 that has been reported
earlier. Even though some reports suggest that quaternary ammonium ions specifically adsorb on
the platinum metal surface affecting Pt-OH formation in solvent electrochemistry,3 the
quaternary ammonium species tethered to the polymer chain does not seem to have a significant
adsorbing effect on the electrode surface.
2.3.1. Oxygen Reduction Kinetics
Linear sweep voltammetry was performed on oxygen saturated alkaline membranes at
100% RH conditions, on a 100µm Pt disc electrode. Cyclic voltammograms recorded with a
dynamic hydrogen electrode (DHE) as the reference were corrected using the hydrogen evolution
potential recorded under nitrogen saturated conditions. All potentials reported in this chapter are
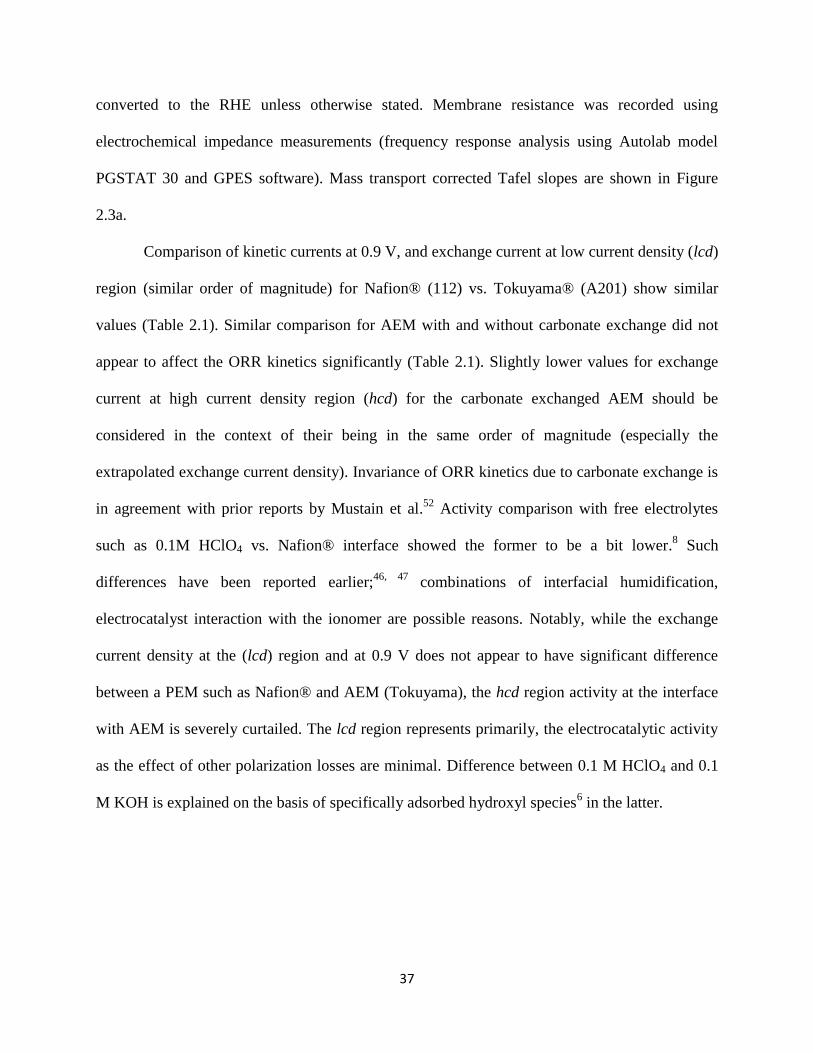
37
converted to the RHE unless otherwise stated. Membrane resistance was recorded using
electrochemical impedance measurements (frequency response analysis using Autolab model
PGSTAT 30 and GPES software). Mass transport corrected Tafel slopes are shown in Figure
2.3a.
Comparison of kinetic currents at 0.9 V, and exchange current at low current density (lcd)
region (similar order of magnitude) for Nafion® (112) vs. Tokuyama® (A201) show similar
values (Table 2.1). Similar comparison for AEM with and without carbonate exchange did not
appear to affect the ORR kinetics significantly (Table 2.1). Slightly lower values for exchange
current at high current density region (hcd) for the carbonate exchanged AEM should be
considered in the context of their being in the same order of magnitude (especially the
extrapolated exchange current density). Invariance of ORR kinetics due to carbonate exchange is
in agreement with prior reports by Mustain et al.52
Activity comparison with free electrolytes
such as 0.1M HClO4 vs. Nafion® interface showed the former to be a bit lower.8 Such
differences have been reported earlier;46, 47
combinations of interfacial humidification,
electrocatalyst interaction with the ionomer are possible reasons. Notably, while the exchange
current density at the (lcd) region and at 0.9 V does not appear to have significant difference
between a PEM such as Nafion® and AEM (Tokuyama), the hcd region activity at the interface
with AEM is severely curtailed. The lcd region represents primarily, the electrocatalytic activity
as the effect of other polarization losses are minimal. Difference between 0.1 M HClO4 and 0.1
M KOH is explained on the basis of specifically adsorbed hydroxyl species6 in the latter.
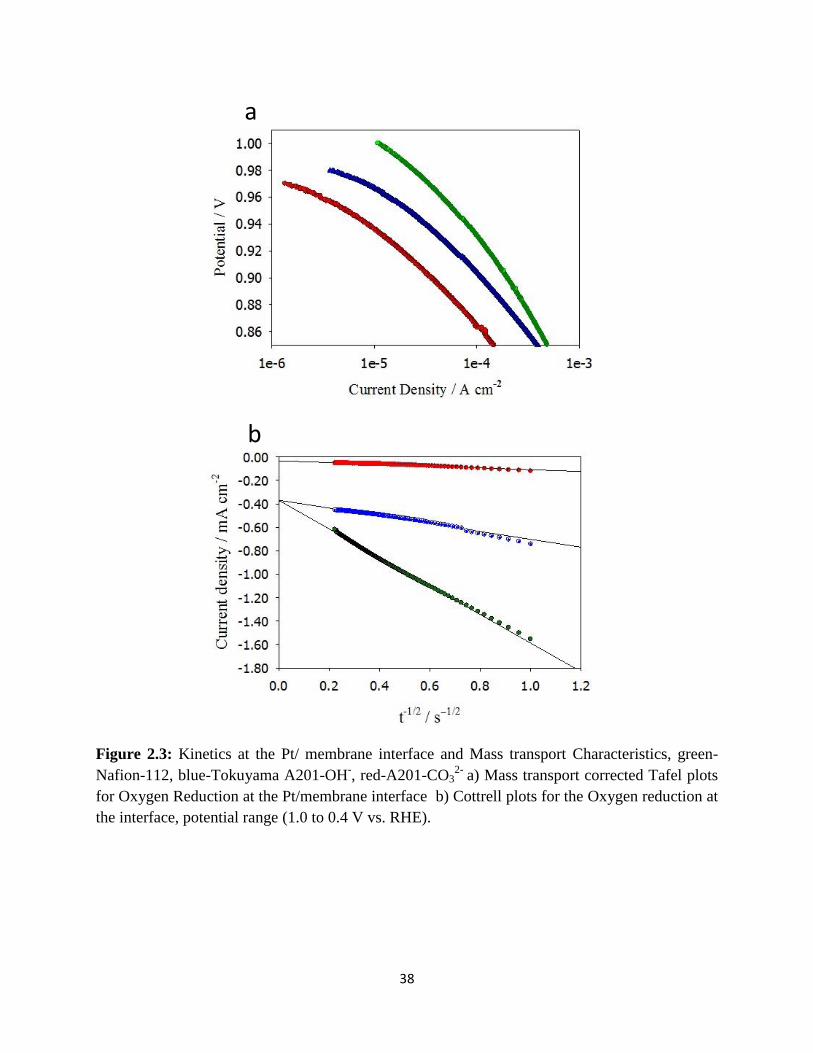
38
Figure 2.3: Kinetics at the Pt/ membrane interface and Mass transport Characteristics, green-
Nafion-112, blue-Tokuyama A201-OH-, red-A201-CO3
2- a) Mass transport corrected Tafel plots
for Oxygen Reduction at the Pt/membrane interface b) Cottrell plots for the Oxygen reduction at
the interface, potential range (1.0 to 0.4 V vs. RHE).
a
b
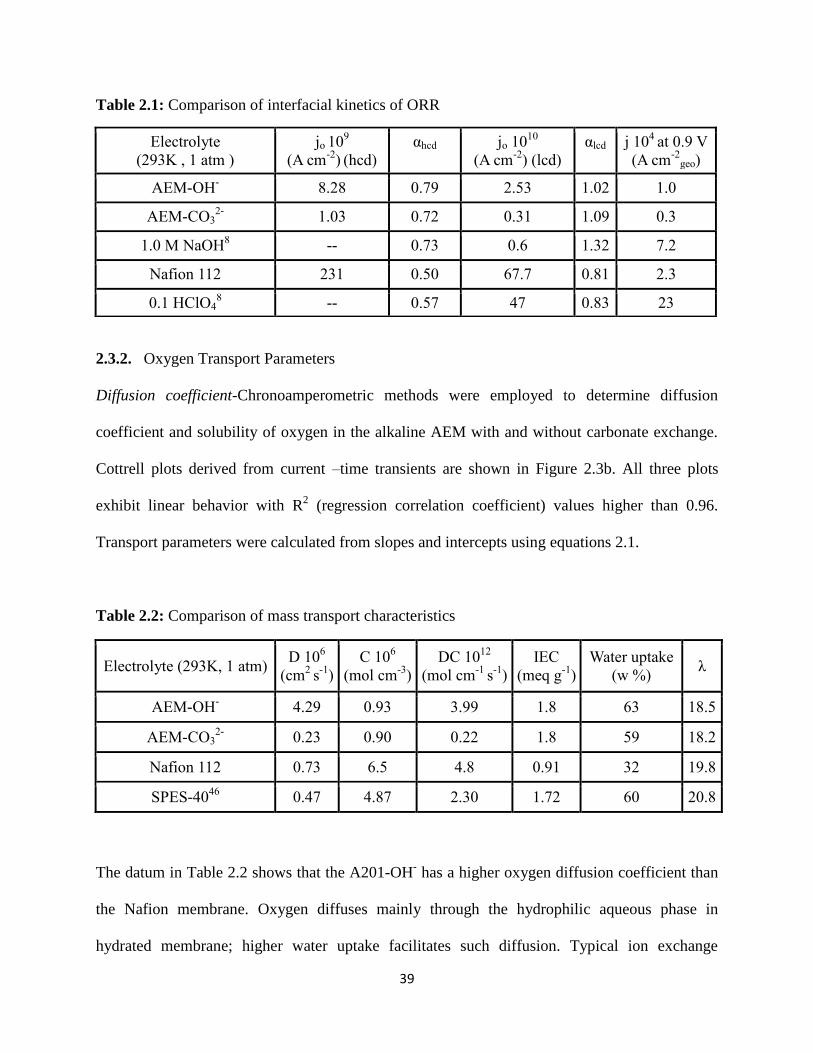
39
Table 2.1: Comparison of interfacial kinetics of ORR
2.3.2. Oxygen Transport Parameters
Diffusion coefficient-Chronoamperometric methods were employed to determine diffusion
coefficient and solubility of oxygen in the alkaline AEM with and without carbonate exchange.
Cottrell plots derived from current –time transients are shown in Figure 2.3b. All three plots
exhibit linear behavior with R2 (regression correlation coefficient) values higher than 0.96.
Transport parameters were calculated from slopes and intercepts using equations 2.1.
Table 2.2: Comparison of mass transport characteristics
The datum in Table 2.2 shows that the A201-OH- has a higher oxygen diffusion coefficient than
the Nafion membrane. Oxygen diffuses mainly through the hydrophilic aqueous phase in
hydrated membrane; higher water uptake facilitates such diffusion. Typical ion exchange
Electrolyte
(293K , 1 atm )
jo 109
(A cm-2
) (hcd)
αhcd jo 1010
(A cm-2
) (lcd)
αlcd j 104
at 0.9 V
(A cm-2
geo)
AEM-OH- 8.28 0.79 2.53 1.02 1.0
AEM-CO32-
1.03 0.72 0.31 1.09 0.3
1.0 M NaOH8 -- 0.73 0.6 1.32 7.2
Nafion 112 231 0.50 67.7 0.81 2.3
0.1 HClO48
-- 0.57 47 0.83 23
Electrolyte (293K, 1 atm) D 10
6
(cm2
s-1
)
C 106
(mol cm-3
)
DC 1012
(mol cm-1
s-1
)
IEC
(meq g-1
)
Water uptake
(w %) λ
AEM-OH- 4.29 0.93 3.99 1.8 63 18.5
AEM-CO32-
0.23 0.90 0.22 1.8 59 18.2
Nafion 112 0.73 6.5 4.8 0.91 32 19.8
SPES-4046
0.47 4.87 2.30 1.72 60 20.8
40
capacity of Nafion is 0.91 meq g-1
which when compared with corresponding value of 1.8 meq
g-1
for the Tokuyama®A201 membrane indicates a concomitantly higher water content and
hence a higher oxygen diffusion coefficient. The higher water content is a bulk property distinct
from the λ (# of water molecule per exchange site), which shows similar values irrespective of
the polymer backbone and exchange site (sulfonate vs. quaternary amine). Since diffusion
coefficient is directly related to water content and as shown earlier,53
potential window used in
this chronoamperometric study provides for sufficient hydration for this not to be a factor in our
measured values. Exchange of the AEM with carbonate ions resulted in significant lowering of
oxygen diffusion. This is in agreement with oxygen diffusion measurements in aqueous
carbonate solutions using rotating disc electrode measurements and comparison of mass
transport limited currents.52
Mobility of the molecules inside the pores of the polymer is
expected to be low. This in combination with slower steric and electrostatic impedance resulting
from the doubly charged carbonate ions result in lower diffusion coefficient of oxygen in
carbonate exchanged AEMs.
Solubility- Oxygen concentration in the membrane is mainly determined by its solubility in the
polymer backbone. Our data (Table 2.2) shows that the solubility of oxygen in the
Tokuyama®A201 membrane is much lower than that in Nafion®. This is expected since
Nafion® possesses essentially a PTFE backbone which renders very high oxygen solubility
(26.8×10⁻⁶
mol cm-3
) as compared to a typical hydrocarbon backbone such as those in
Tokuyama®. Similar comparison for proton exchange membranes has been reported earlier
between Nafion® and sulfonated polyether sulfones, with similar results (Table 2.2).46
Since the
exact structure of the Tokuyama (A201) membrane is not known, a comparison with the
analogous proton exchange membrane (SPES-40) is not possible. It should however be noted for
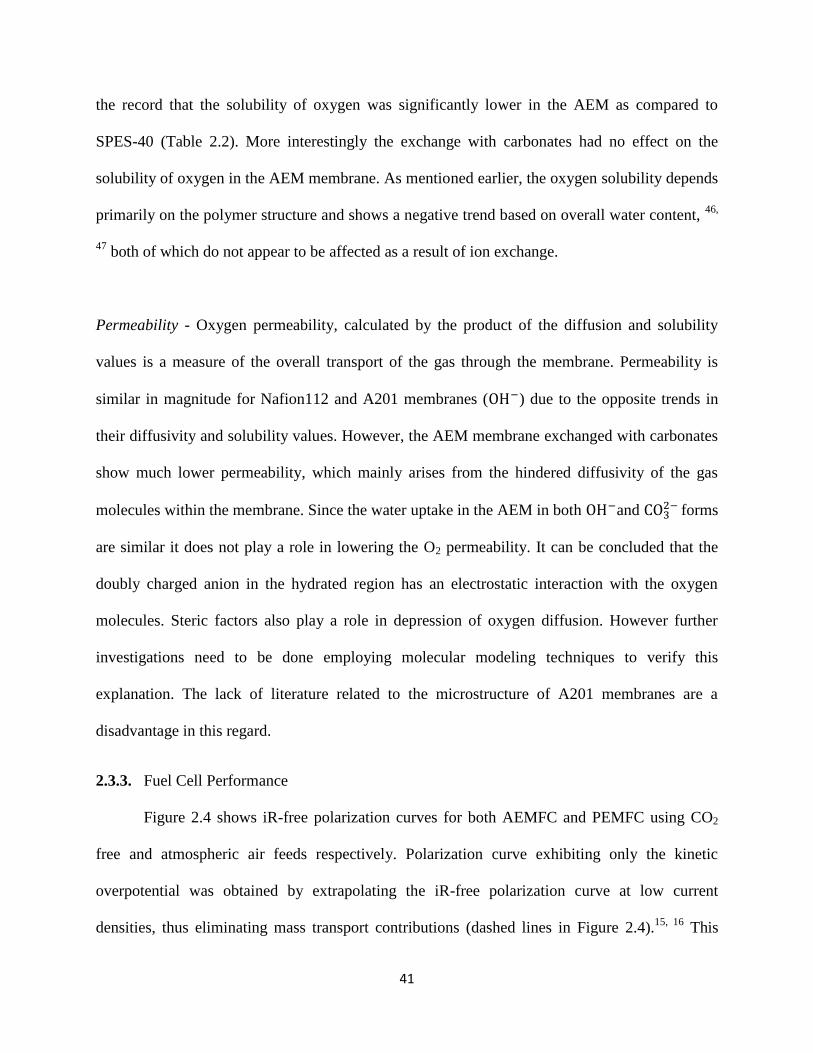
41
the record that the solubility of oxygen was significantly lower in the AEM as compared to
SPES-40 (Table 2.2). More interestingly the exchange with carbonates had no effect on the
solubility of oxygen in the AEM membrane. As mentioned earlier, the oxygen solubility depends
primarily on the polymer structure and shows a negative trend based on overall water content, 46,
47 both of which do not appear to be affected as a result of ion exchange.
Permeability - Oxygen permeability, calculated by the product of the diffusion and solubility
values is a measure of the overall transport of the gas through the membrane. Permeability is
similar in magnitude for Nafion112 and A201 membranes (OH−) due to the opposite trends in
their diffusivity and solubility values. However, the AEM membrane exchanged with carbonates
show much lower permeability, which mainly arises from the hindered diffusivity of the gas
molecules within the membrane. Since the water uptake in the AEM in both OH−and CO32− forms
are similar it does not play a role in lowering the O2 permeability. It can be concluded that the
doubly charged anion in the hydrated region has an electrostatic interaction with the oxygen
molecules. Steric factors also play a role in depression of oxygen diffusion. However further
investigations need to be done employing molecular modeling techniques to verify this
explanation. The lack of literature related to the microstructure of A201 membranes are a
disadvantage in this regard.
2.3.3. Fuel Cell Performance
Figure 2.4 shows iR-free polarization curves for both AEMFC and PEMFC using CO2
free and atmospheric air feeds respectively. Polarization curve exhibiting only the kinetic
overpotential was obtained by extrapolating the iR-free polarization curve at low current
densities, thus eliminating mass transport contributions (dashed lines in Figure 2.4).15, 16
This
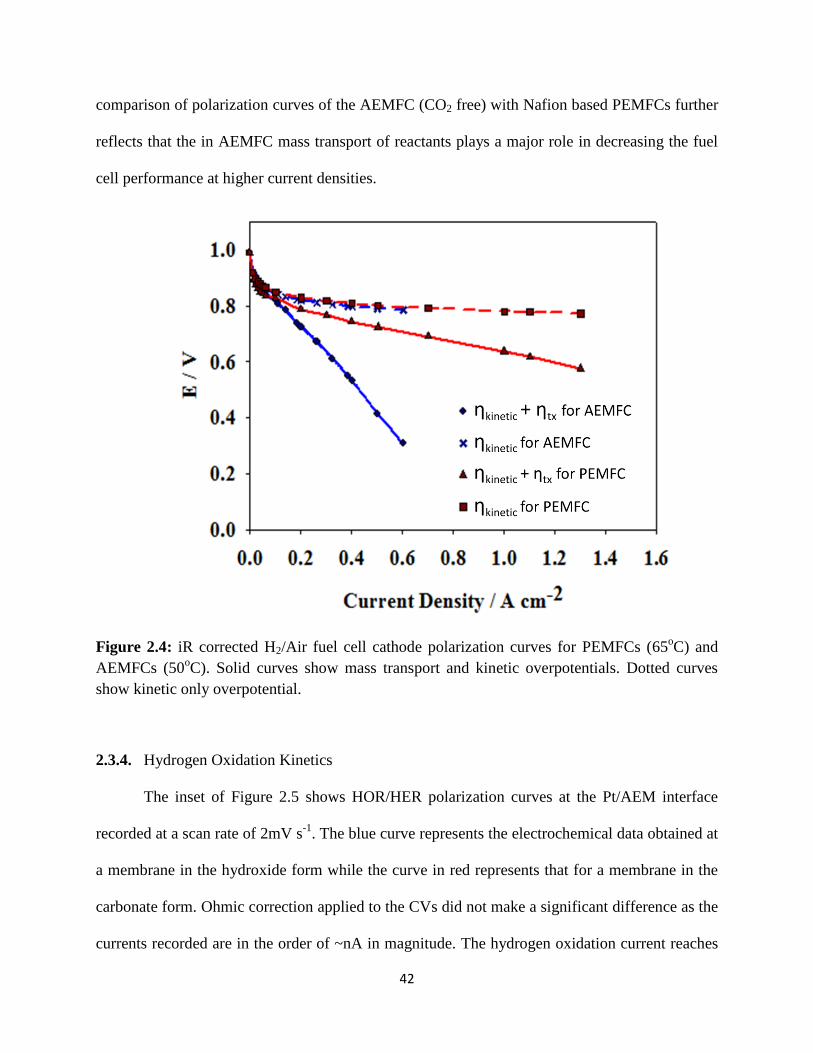
42
comparison of polarization curves of the AEMFC (CO2 free) with Nafion based PEMFCs further
reflects that the in AEMFC mass transport of reactants plays a major role in decreasing the fuel
cell performance at higher current densities.
Figure 2.4: iR corrected H2/Air fuel cell cathode polarization curves for PEMFCs (65oC) and
AEMFCs (50oC). Solid curves show mass transport and kinetic overpotentials. Dotted curves
show kinetic only overpotential.
2.3.4. Hydrogen Oxidation Kinetics
The inset of Figure 2.5 shows HOR/HER polarization curves at the Pt/AEM interface
recorded at a scan rate of 2mV s-1
. The blue curve represents the electrochemical data obtained at
a membrane in the hydroxide form while the curve in red represents that for a membrane in the
carbonate form. Ohmic correction applied to the CVs did not make a significant difference as the
currents recorded are in the order of ~nA in magnitude. The hydrogen oxidation current reaches
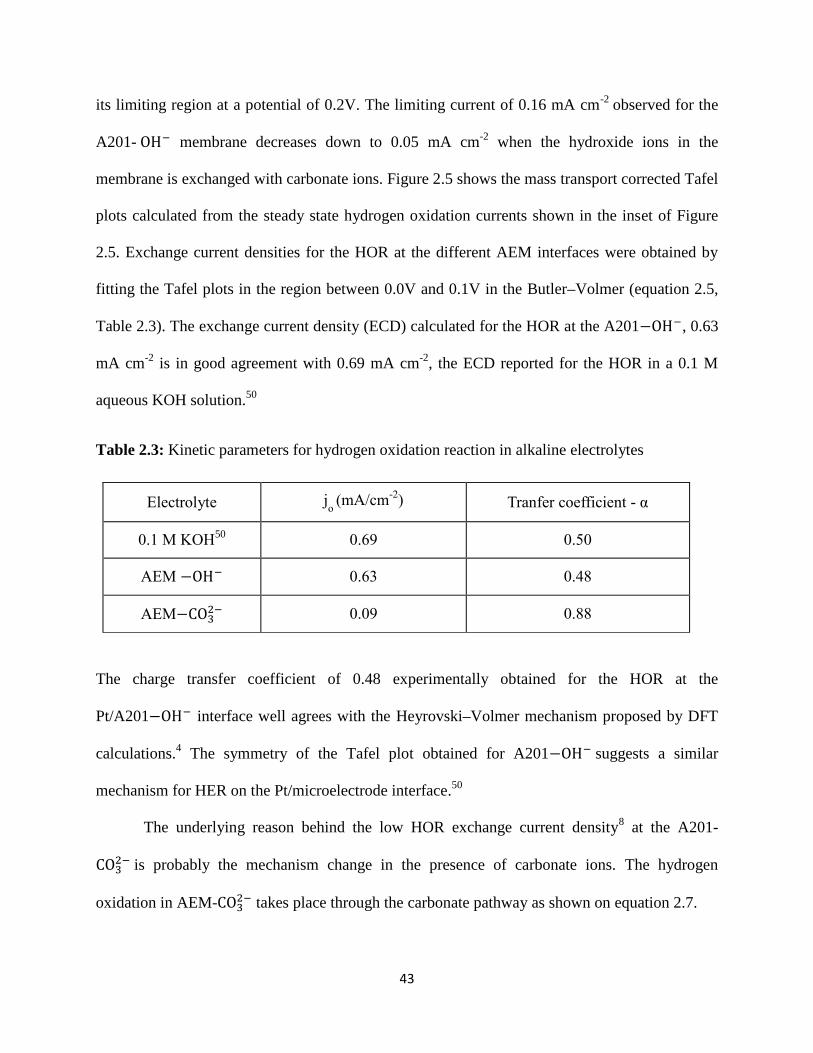
43
its limiting region at a potential of 0.2V. The limiting current of 0.16 mA cm-2
observed for the
A201- OH− membrane decreases down to 0.05 mA cm-2
when the hydroxide ions in the
membrane is exchanged with carbonate ions. Figure 2.5 shows the mass transport corrected Tafel
plots calculated from the steady state hydrogen oxidation currents shown in the inset of Figure
2.5. Exchange current densities for the HOR at the different AEM interfaces were obtained by
fitting the Tafel plots in the region between 0.0V and 0.1V in the Butler–Volmer (equation 2.5,
Table 2.3). The exchange current density (ECD) calculated for the HOR at the A201−OH−, 0.63
mA cm-2
is in good agreement with 0.69 mA cm-2
, the ECD reported for the HOR in a 0.1 M
aqueous KOH solution.50
Table 2.3: Kinetic parameters for hydrogen oxidation reaction in alkaline electrolytes
The charge transfer coefficient of 0.48 experimentally obtained for the HOR at the
Pt/A201−OH− interface well agrees with the Heyrovski–Volmer mechanism proposed by DFT
calculations.4 The symmetry of the Tafel plot obtained for A201−OH− suggests a similar
mechanism for HER on the Pt/microelectrode interface.50
The underlying reason behind the low HOR exchange current density8 at the A201-
CO32− is probably the mechanism change in the presence of carbonate ions. The hydrogen
oxidation in AEM-CO32− takes place through the carbonate pathway as shown on equation 2.7.
Electrolyte jo (mA/cm
-2) Tranfer coefficient - α
0.1 M KOH50
0.69 0.50
AEM −OH− 0.63 0.48
AEM−CO32− 0.09 0.88

44
𝐻2 + 𝐶𝑂32− → 𝐶𝑂2 + 𝐻2𝑂 + 2𝑒− [2.7]
As we discussed earlier the pore solution in AEMs becomes acidic due to the Donnon exclusion
of H+ ions from the membrane. However, literature suggests that in aqueous carbonate
electrolytes the HOR tends to go through the carbonate pathway rather than reacting with the
remaining OH- species in the electrolyte. It appears that the HOR mechanism at the Pt/AEM-
CO32− interface follows the same trend.
Figure 2.5: Mass transport corrected Tafel plots for HOR/HER at the membrane electrode
interface.
2.3.5. Hydrogen Transport
Transport of gaseous molecules through the membrane is determined by their solubility
in the membrane and their diffusion. The experimentally obtained (Figure 2.6) mass transport
45
parameters for the AEMs are displayed along with the values reported for a PEM by Kucernack
et al.51
in Table 2.4 for comparison. In water, the diffusion coefficient of hydrogen is 4.5×10⁻⁵
cm2
s-1
and the hydrogen solubility is in the order of ~10-7
mol cm-3
. The diffusivity of hydrogen
molecules in AEM−OH− is lower than this value regardless of the high water content (or IEC) in
the membrane. This implies that the hydrogen molecule diffusion does not take place through the
aqueous part of the polymer membrane. Considering the hydrophobicity of non-polar H2
molecules it is practical that the hydrogen molecules dissolve and diffuse through the water–
polymer interfacial regions of the membrane.54, 55
Table 2.4: Mass transport characteristics of hydrogen in the AEM
Electrolyte Diffusion coefficient (D) 10
6
(cm2 s
-1)
Solubility (C) 106
(mol cm-3
)
Permeability (DC) 1012
(mol cm-1
s-1
)
AEM −OH− 1.34 2.98 4.00
AEM−CO32− 1.30 0.52 0.68
Nafion 11751
7.60 0.51 3.90
Figure 2.6: Cottrell plots for the HOR calculated from current-time transients at 0.3V (potential
jump from 0V to 0.3 V).

46
From a study based on proton exchange membranes with different side chain lengths,
Tsuo et al54
have concluded that extrusion of side chains to the water phase is an important factor
which determines the diffusion path of hydrogen molecules. As the aqueous region expands its
crystallinity decreases which in turn facilitates the extrusion of the polymer side chains into the
water phase. This increases the interfacial path length. Hence the overall H2 diffusion coefficient
decreases. In general it is plausible to say that the diffusion of non-polar molecules in polymer
electrolytes with high IEC is low. However it is surprising that the diffusion coefficient of
hydrogen gas is not altered when the mobile ion is changed from OH− to CO32−. Ionic species are
generally confined to the aqueous part of the membrane. Hence they have a little effect on
molecular transport that occurs through the interfacial region. The insignificance of the mobile
anion on the diffusivity of the molecular hydrogen further confirms that the hydrogen molecules
are diffusing through the interfacial region of the membrane. The effect of carbonate ions on the
hydrogen solubility is not very clear. Probably, the interactions of the doubly charged carbonate
ions with multiple quaternary ammonium sites leads to a distortion in the polymer micro-channel
structure. This may in turn decrease the effective area of interfacial region where H2 can
dissolve. Distortion of the polymer micro-channel system should have a minimal effect on
hydrogen diffusivity due to the smaller size of the H2 molecule. A detailed investigation on the
structure of the AEM is required to further explain the trend in H2 solubility.
2.3.6. Methanol Oxidation Reaction at the Pt/AEM Interface
Methanol oxidation kinetics:- Cyclic voltammograms (CVs) obtained for the methanol oxidation
reaction (MOR) at different Pt/AEM interfaces are shown in Figure 2.7. The CV corresponding
to Pt/Nafion interface is superimposed in black dashed curves in the same Figure for better
comparison. The MOR begins at a potential of 0.5 V, after the hydrogen desorption region.

47
Voltammograms shown in Figure 2.7 clearly indicate that the methanol oxidation peak current
coincides with the hydroxide layer formation.8, 56-58
At potentials above 0.9V, the electrode
surface becomes highly covered by hydroxyl species that inhibit methanol adsorption on the
electrode. This in turn reduces the MOR current. At both Pt/A201-OH− and Pt/A901-OH−
interfaces, the onset potentials of the MOR occur at low potentials compared to that of the
Pt/Nafion membrane.
Figure 2.7: Cyclic voltammograms for MOR at the membrane/Pt microelectrode interface. 1 M
MeOH, 293K.
The methanol oxidation reaction proceeds through formation of several intermediates and
CO is one of the main species formed. As the electrode potential is scanned CO poisoning
species are formed which strongly adsorb on the Pt surface. The peak current in the negative
going scan becomes low since the effective electrode area is decreased by adsorbed CO species

48
formed during the forward scan. Sufficient adsorption of hydroxyl species on the electrode is
necessary to regenerate the poisoned electrode surface by oxidation of CO to CO2 (equation 2.8).
𝐶𝑂𝑎𝑑𝑠 + 2𝑂𝐻𝑎𝑑𝑠 → 𝐶𝑂2 + 𝐻2𝑂 [2.8]
In alkaline electrolytes the electrode surface is recovered very easily; therefore a shift in reverse
peak is not observed. However the reverse peak at the Nafion membrane interface appears at a
much lower potential than the forward peak. Tafel plots were calculated for Pt/Membrane
interfaces (Figure 2.8) using steady state methanol oxidation currents. These plots shown in
Figure 2.8 were used to further evaluate the effect of the pH and the anionic species on the
electrode activity towards the MOR. The Tafel slopes of 142 mV dec-1
and 122 mV dec-1
obtained for Pt/A201-OH− and Pt/A901-OH− interfaces respectively agrees well with the MOR
kinetic parameters obtained for an aqueous KOH electrolyte59
(Table 2.5). The A901 membrane
has a better ion conductance than the A201 membrane, which is an indication of the higher
surface charge concentration of the former. This is the underlying reason behind the slightly
better MOR kinetics observed at the Pt/A901-OH− interface.
Table 2.5: Kinetic parameters for methanol oxidation reaction
Electrolyte Tafel Slope
(mV dec-1
)
j (at 0.65 V) 105
(A cm-2
)
A201-OH- 142 4.32
A201-CO32-
314 1.00
A901-OH- 122 15.06
A901-CO32-
249 1.00
0.1M OH solution 113 294.4
Nafion 112 138 4.12
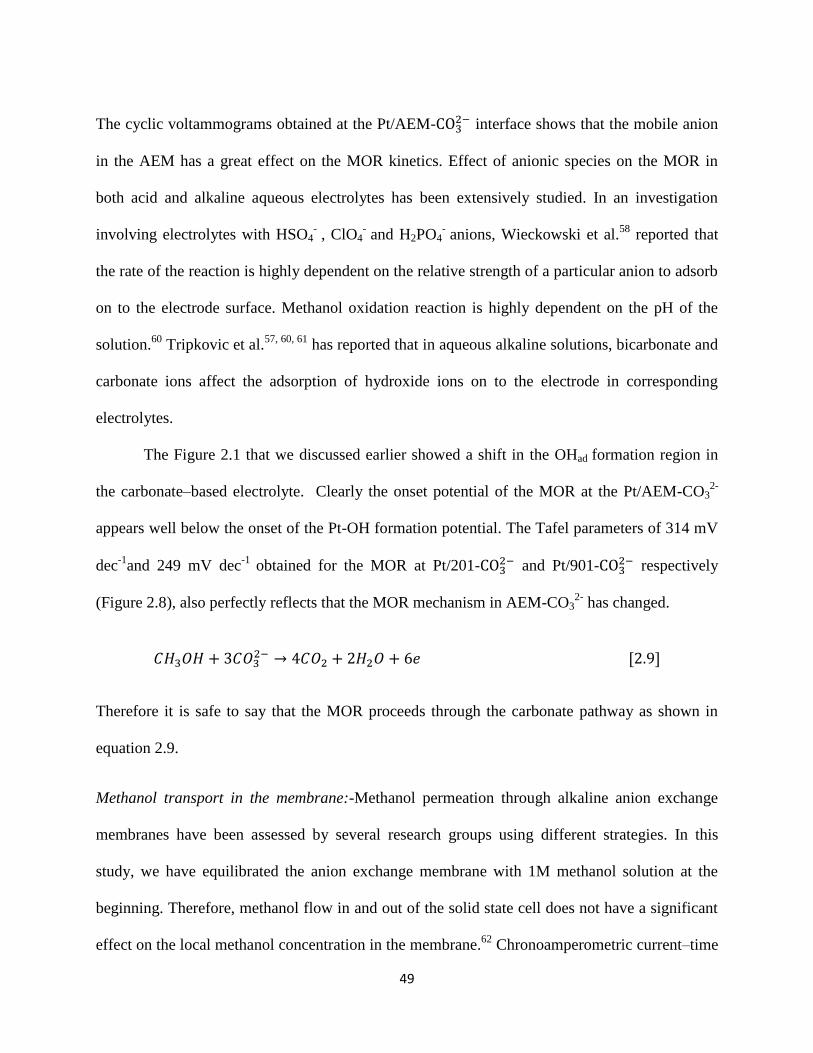
49
The cyclic voltammograms obtained at the Pt/AEM-CO32− interface shows that the mobile anion
in the AEM has a great effect on the MOR kinetics. Effect of anionic species on the MOR in
both acid and alkaline aqueous electrolytes has been extensively studied. In an investigation
involving electrolytes with HSO4- , ClO4
- and H2PO4
- anions, Wieckowski et al.
58 reported that
the rate of the reaction is highly dependent on the relative strength of a particular anion to adsorb
on to the electrode surface. Methanol oxidation reaction is highly dependent on the pH of the
solution.60
Tripkovic et al.57, 60, 61
has reported that in aqueous alkaline solutions, bicarbonate and
carbonate ions affect the adsorption of hydroxide ions on to the electrode in corresponding
electrolytes.
The Figure 2.1 that we discussed earlier showed a shift in the OHad formation region in
the carbonate–based electrolyte. Clearly the onset potential of the MOR at the Pt/AEM-CO32-
appears well below the onset of the Pt-OH formation potential. The Tafel parameters of 314 mV
dec-1
and 249 mV dec-1
obtained for the MOR at Pt/201-CO32− and Pt/901-CO3
2− respectively
(Figure 2.8), also perfectly reflects that the MOR mechanism in AEM-CO32-
has changed.
𝐶𝐻3𝑂𝐻 + 3𝐶𝑂32− → 4𝐶𝑂2 + 2𝐻2𝑂 + 6𝑒 [2.9]
Therefore it is safe to say that the MOR proceeds through the carbonate pathway as shown in
equation 2.9.
Methanol transport in the membrane:-Methanol permeation through alkaline anion exchange
membranes have been assessed by several research groups using different strategies. In this
study, we have equilibrated the anion exchange membrane with 1M methanol solution at the
beginning. Therefore, methanol flow in and out of the solid state cell does not have a significant
effect on the local methanol concentration in the membrane.62
Chronoamperometric current–time
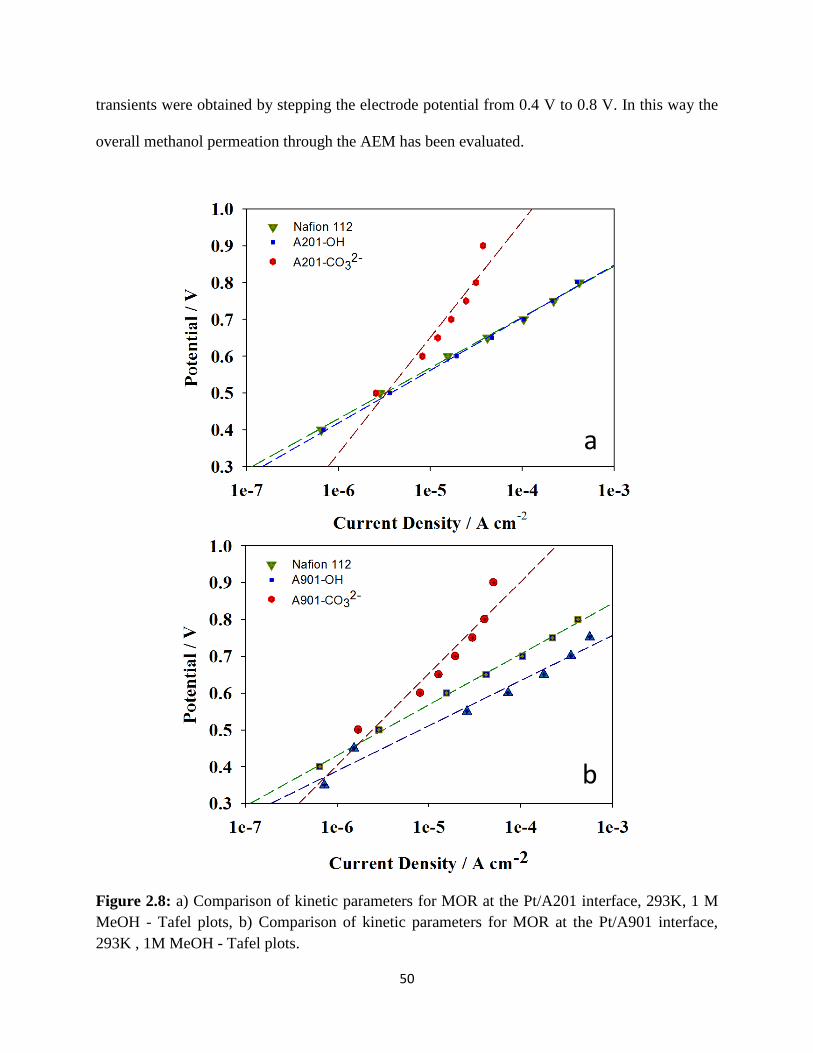
50
transients were obtained by stepping the electrode potential from 0.4 V to 0.8 V. In this way the
overall methanol permeation through the AEM has been evaluated.
Figure 2.8: a) Comparison of kinetic parameters for MOR at the Pt/A201 interface, 293K, 1 M
MeOH - Tafel plots, b) Comparison of kinetic parameters for MOR at the Pt/A901 interface,
293K , 1M MeOH - Tafel plots.
a
b
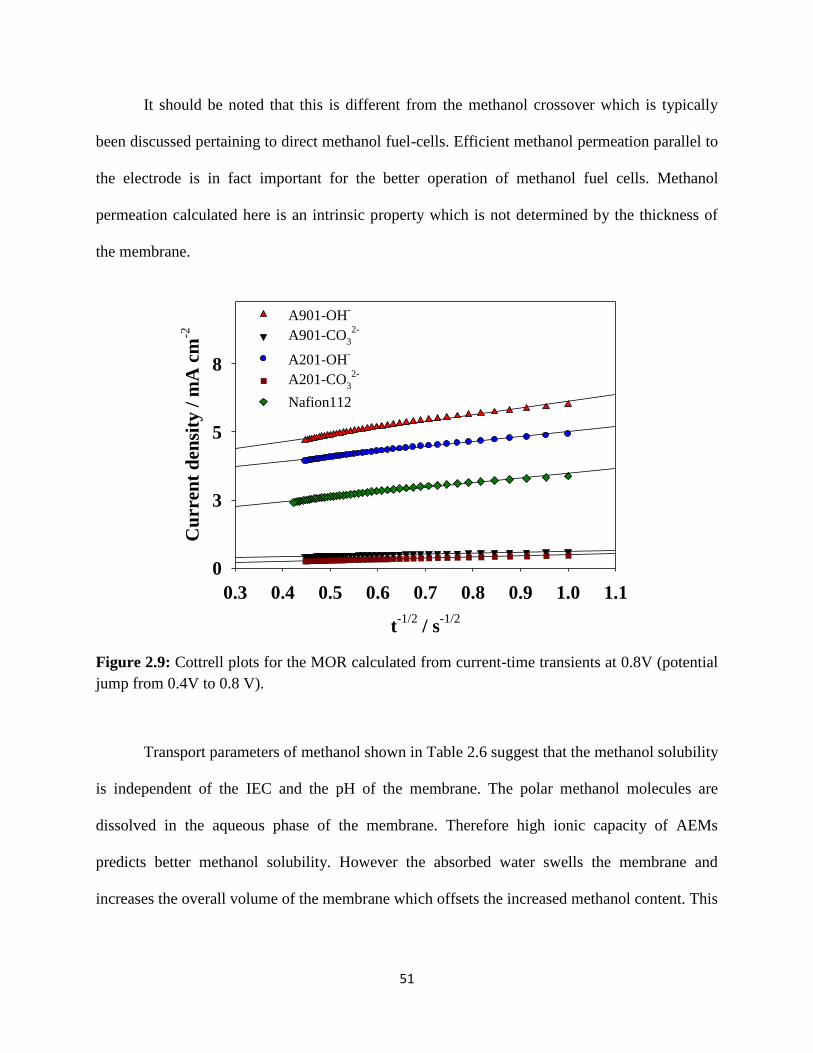
51
It should be noted that this is different from the methanol crossover which is typically
been discussed pertaining to direct methanol fuel-cells. Efficient methanol permeation parallel to
the electrode is in fact important for the better operation of methanol fuel cells. Methanol
permeation calculated here is an intrinsic property which is not determined by the thickness of
the membrane.
t-1/2
/ s-1/2
0.3 0.4 0.5 0.6 0.7 0.8 0.9 1.0 1.1
Cu
rren
t d
ensi
ty /
mA
cm
-2
0
3
5
8
A901-OH-
A901-CO3
2-
A201-OH-
A201-CO3
2-
Nafion112
Figure 2.9: Cottrell plots for the MOR calculated from current-time transients at 0.8V (potential
jump from 0.4V to 0.8 V).
Transport parameters of methanol shown in Table 2.6 suggest that the methanol solubility
is independent of the IEC and the pH of the membrane. The polar methanol molecules are
dissolved in the aqueous phase of the membrane. Therefore high ionic capacity of AEMs
predicts better methanol solubility. However the absorbed water swells the membrane and
increases the overall volume of the membrane which offsets the increased methanol content. This
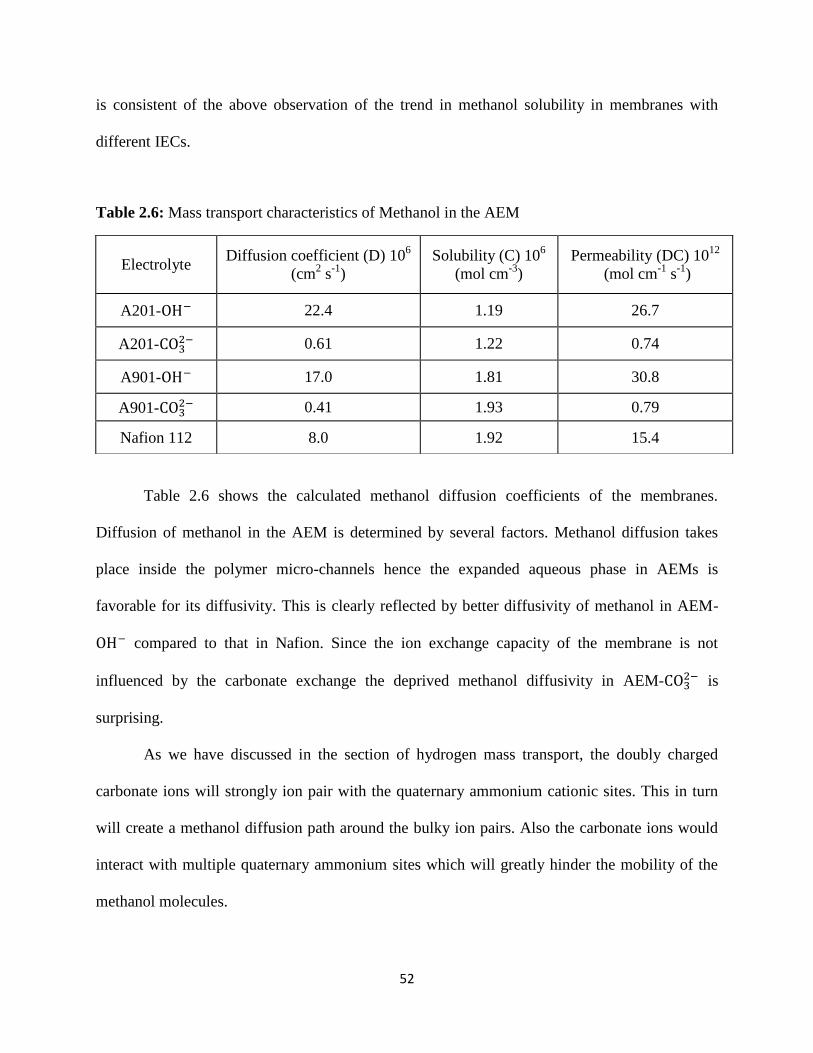
52
is consistent of the above observation of the trend in methanol solubility in membranes with
different IECs.
Table 2.6: Mass transport characteristics of Methanol in the AEM
Table 2.6 shows the calculated methanol diffusion coefficients of the membranes.
Diffusion of methanol in the AEM is determined by several factors. Methanol diffusion takes
place inside the polymer micro-channels hence the expanded aqueous phase in AEMs is
favorable for its diffusivity. This is clearly reflected by better diffusivity of methanol in AEM-
OH− compared to that in Nafion. Since the ion exchange capacity of the membrane is not
influenced by the carbonate exchange the deprived methanol diffusivity in AEM-CO32− is
surprising.
As we have discussed in the section of hydrogen mass transport, the doubly charged
carbonate ions will strongly ion pair with the quaternary ammonium cationic sites. This in turn
will create a methanol diffusion path around the bulky ion pairs. Also the carbonate ions would
interact with multiple quaternary ammonium sites which will greatly hinder the mobility of the
methanol molecules.
Electrolyte Diffusion coefficient (D) 10
6
(cm2 s
-1)
Solubility (C) 106
(mol cm-3
)
Permeability (DC) 1012
(mol cm-1
s-1
)
A201-OH− 22.4 1.19 26.7
A201-CO32− 0.61 1.22 0.74
A901-OH− 17.0 1.81 30.8
A901-CO32− 0.41 1.93 0.79
Nafion 112 8.0 1.92 15.4
53
2.4. Conclusion
Mass transport and kinetic parameters for the oxygen reduction at a Pt microelectrode/
Tokuyama®A201 (AEM) membrane interface was determined using linear sweep voltammetry
and chronoamperometry at 298 K and 1 atm for membranes in hydroxide and carbonate forms
and compared with corresponding values for a perfluorinated membrane (Nafion®). Compared
with Nafion®, the AEM in both the OH− as well as those exchanged with CO32− showed similar
ORR kinetics at 0.9 V (RHE) and exchange current at the low current density (lcd) region.
Comparison of exchange current densities at high current density (hcd) region showed the effects
of higher mass transport in the AEMs, especially when exchanged with CO32−.
Higher oxygen diffusion in AEM (OH− form) compared with Nafion® was explained by
the higher ion exchange capacity and hence concomitantly higher water content in the AEM.
Exchange with CO32−
shows a marked lowering of the O2 diffusion coefficient, which was
ascribed to steric and electrostatic of carbonate exchanged polymer microchannels. Oxygen
solubility in AEM is mainly a function of its hydrocarbon backbone chemistry (as opposed to
Teflon in the case of Nafion®) and higher water content (higher IEC). Comparison with a similar
IEC proton conducting membrane, however, indicated that the solubility value obtained was
lower for this AEM than that in an analogous proton exchange membrane containing a
hydrocarbon backbone (Table 2.2) with a similar IEC. While no clear explanation is forthcoming
at the moment, such differences arise as a result of different phase separation based on the ion
exchange site and overall polymer chemistry. The principle effect of carbonate exchange on the
oxygen transport was the significant (one order of magnitude) lowering of diffusion coefficient,
while the solubility remained unaffected, thus resulting in a concomitant one order of magnitude
lowering of the overall permeability.
54
The presence of carbonate ions (in the aqueous region of the membrane) did not affect
the DH2, as the hydrogen diffusion took place mainly through the hydrophobic interfacial region.
However, hydrogen solubility was greatly reduced. Significantly low HOR kinetics were
observed at the Pt/AEM-CO32−, which was attributed to the HOR proceeding through the
carbonate pathway.
Methanol transport in AEM-OH- is better compared to the proton exchange membranes,
as the high water content in AEMs increases the pore sizes which facilitate diffusion of
molecules in the aqueous region. Decreased methanol diffusion in the anion exchange membrane
in the carbonate form is explained by the strong ion pairing between the doubly charged
carbonate ions with the quaternary ammonium species: which causes methanol molecules to
diffuse around the bulky ion pairs (increasing the diffusion path length). Decrease in methanol
oxidation kinetics observed confirmed that the MOR proceeds through the carbonate pathway in
the AEM-CO32-
electrolyte. The effect of such a significant lowering of mass transport in
carbonate exchanged membranes is also observed in the fuel cell polarization curves obtained for
the AEMFCs (Figure 2.4). The performance of AEMFC cathode side can be improved by means
of efficient mass transport through the ionomer in the reaction layer. While avoiding carbonate
and to a certain extent even bicarbonate exchange in the membrane cannot be prevented in a
practical fuel cell, more careful consideration of solute transport in such varying ion exchanged
moieties are needed. In addition, robust polymers enabling higher temperature operation (i.e., up
to 80oC) would provide some much needed respite.
55
Chapter 3
Microelectrode Investigations of the Oxygen Electrode in Dimethyl
Sulfoxide-based Electrolytes Lithium-Oxygen Batteries
3.1. Introduction
Li-air batteries, composed of Li metal anodes and oxygen cathodes in combination with
non-aqueous electrolytes, have the potential to deliver practical rechargeable batteries with up
to ten times more energy density than Li-ion batteries.63, 64
However, the reactivity of the
oxygen reduction reaction (ORR) products LiO2 and Li2O2 towards the organic solvents used
for electrolytes, and the irreversibility of the ORR processes remain as deterrents to these
batteries from becoming practical systems.19, 22, 30, 65
Although significant progress has been
made in elucidating the redox chemistry of oxygen in non-aqueous Li-air batteries,19, 22, 30, 32
a
full understanding of the factors affecting the oxygen electrode processes, particularly the
ability to delineate mass transport contributions from electron transfer kinetics, is still lacking.
In this regard, microelectrodes can provide information that cannot be obtained with the use of
the traditional macroelectrodes employed in most ORR investigations.
Electrochemical data gathered using microelectrodes can be used to distinguish
reactions controlled by mass transport from those dominated by electrode kinetics. In ideal
cases, current-voltage data for an electrochemical process on a microelectrode exhibits limiting
currents if there is no inhibition of mass transport. Deviation of the current-voltage response
from this behavior is an indication of possible mass transport limitations in the electrode
reaction arising from a variety of sources. Poor solubility or high viscosity of the reaction
products is a root cause. Another factor is the loss of effective electrode area by passivation
films that hinder electrode activity thereby reducing the limiting current even at sufficiently
high overpotentials. Finally, if the reaction involves anionic reactants, at voltages sufficiently

56
negative than the potential of zero charge of the electrode, the electrode can exert an
electrostatic repulsion on negatively charged species.66
In such cases, the electrode will
produce a non-steady state, peak-shaped, response instead of the limiting current behavior.
Charging currents are close to zero on microelectrodes and, as a result, accurate
electrode responses can be obtained even at high scan rates which is especially important to
investigate fast electrode reactions followed by chemical dissociation of the products as
observed in Li-air batteries.33
Furthermore, microelectrodes are useful for studying very small
volumes of electrolyte and since the reactions occur at homogeneous local physical
environments, the current normalized on the electrode can give an accurate picture of the
electrolyte/electrode interface behavior. Finally, microelectrode array systems can be used to
experimentally characterize the site-dependent electrochemistry of a cathode catalyst which is
relevant to ORR in non-aqueous Li-air batteries.
Previous studies65
have revealed that many organic carbonate solvents are unstable in
the presence of the ORR intermediate superoxide, O2−. Relatively stable solvents for use in Li-
air batteries include ethers such as dimethoxy ethane (DME) and tetraethylene glycol dimethyl
ether (TEGDME), organic sulfoxides and sulfones typified by dimethyl sulfoxide (DMSO),
and ionic liquids exemplified by 1-ethyl-3-methylimidazolium
bis(trifluoromethylsulfonyl)imide (EMITFSI) and 1-methyl-1-butyl-pyrrolidinium bis-
(triflouromethanesulfonyl)imide (PYRTFSI)67
. In this chapter, we report on a detailed study of
the use of microelectrodes for elucidating the influence of a series of ion-conducting salts on
ORR in dimethyl sulfoxide-based electrolytes. Our results of the current-voltage response of
the microelectrode in DMSO-based electrolytes reveal that the cation of the ion-conducting salt
in the electrolyte plays a significant role on the properties of the ORR products. Detailed
57
analysis of the microelectrode response has also shown that the triflate anion may have a
positive influence on the stability and solubility of the ORR products in LiCF3SO3 solutions
leading to the most favorable ORR kinetics. We demonstrate that the microelectrode can be
used as a diagnostic tool to select and optimize the properties of electrolytes for use in non-
aqueous Li-air batteries, and to elucidate the influence of different ion-conducting salts on
oxygen redox reaction mechanisms.
3.2. Experimental
3.2.1. Materials
All lithium salts (lithium hexafluorophosphate, lithium perchlorate, lithium
trifluoromethanesulfonate, lithium bis(trifuoromethanesulfonyl)imide and tetrabutylammonium
salts (tetrabutylammonium hexafluorophosphate, tetrabutylammonium perchlorate,
tetrabutylammonium trifluoromethanesulfonate, tetrabutylammonium
bis(trifuoromethanesulfonyl)imide ) and anhydrous grade solvents used in this study were
purchased from Sigma-Aldrich and stored in an M-Braun glove box maintained under 1 ppm
humidity level. Silver wires and 99.9% lithium foil were purchased from Alfa Aesar. The
electrochemical half-cell employed a Pt mesh counter electrode, 11μm diameter glassy carbon
working electrode and a Ag/Ag+ reference electrode. This reference electrode was constructed
as reported by Wain et al.68
The Ag/Ag+ reference electrode potential with respect to the Li/
Li+ reference electrode was determined by measuring the potential difference between a clean
Li foil and the Ag/Ag+ reference electrode immersed in the same electrolyte. This value was
found to be 3.62 V in all electrolytes. All the data gathered on the carbon microelectrode are
normalized to its geometric area experimentally determined using the ferrocene oxidation
current in DMSO. Potential step chronoamperometric transients for ORR were recorded in
58
tetrabutylammonium (TBA+)-based electrolyte solutions at the 11 µm carbon microdisc
electrode. Cyclic voltammetric responses were recorded in all Li+
and TBA-based electrolytes
at scan rates up to 1000 mV s-1
. Supplementary electrochemical experiments for supporting the
microelectrode analyses were carried out on glassy carbon disc electrode (diameter = 0.59 cm).
In order to characterize the ORR products, they were electro-deposited on a removable tip
glassy carbon disc electrode by holding the electrode at a high enough over-potential for 60
min in O2 saturated Li+/DMSO and TBA
+/DMSO electrolytes. The products were analyzed by
Scanning Electron Microscopy (SEM) and Energy Dispersive X-ray Spectroscopy (EDAX).
Raman spectra were obtained for carbon cloth electrodes potentiostated for 5 hr periods at 2.12
V and 2.32 V, respectively, in O2 purged LiPF6/DMSO electrolyte. Conductivities of the
electrolytes of interest were measured using a Thermo-Orion™ conductivity cell and a
Thermo-Orion™ conductivity meter. Kinematic viscosities of the solutions were recorded at
20oC using an Ubbelohde Viscometer (C-545). FT-IR spectra were recorded for all four
electrolytes on a Bruker ATR Infra-red spectrometer.
3.3. Results and Discussion
3.3.1. Validation of the Experimental Approach and Determination of the Microelectrode
Radius
Oxidation of ferrocene to ferrocenium ions is a one-electron reaction and the diffusion
coefficient (D) of ferrocene calculated by Janisch et al. for a 0.1-1.5 mM ferrocene solution in
DMSO is 4.4×10⁻⁶
cm2
s-1
.35
Using this D and the limiting current in the 2.58 mM ferrocene
solution (Figure 1.9), the radius of the carbon microelectrode was calculated from equation 3.1
to be 5.54 µm.
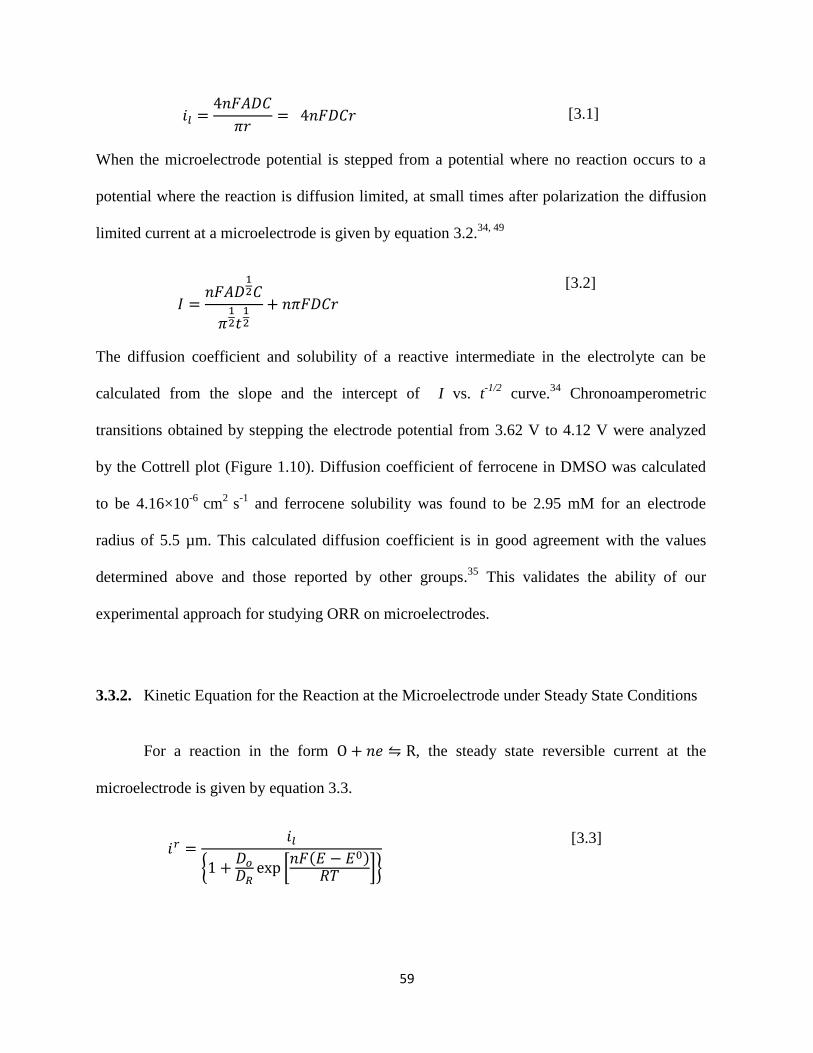
59
𝑖𝑙 =4𝑛𝐹𝐴𝐷𝐶
𝜋𝑟= 4𝑛𝐹𝐷𝐶𝑟 [3.1]
When the microelectrode potential is stepped from a potential where no reaction occurs to a
potential where the reaction is diffusion limited, at small times after polarization the diffusion
limited current at a microelectrode is given by equation 3.2.34, 49
𝐼 =𝑛𝐹𝐴𝐷
12𝐶
𝜋12𝑡
12
+ 𝑛𝜋𝐹𝐷𝐶𝑟
[3.2]
The diffusion coefficient and solubility of a reactive intermediate in the electrolyte can be
calculated from the slope and the intercept of I vs. t-1/2
curve.34
Chronoamperometric
transitions obtained by stepping the electrode potential from 3.62 V to 4.12 V were analyzed
by the Cottrell plot (Figure 1.10). Diffusion coefficient of ferrocene in DMSO was calculated
to be 4.16×10⁻⁶
cm2
s-1
and ferrocene solubility was found to be 2.95 mM for an electrode
radius of 5.5 µm. This calculated diffusion coefficient is in good agreement with the values
determined above and those reported by other groups.35
This validates the ability of our
experimental approach for studying ORR on microelectrodes.
3.3.2. Kinetic Equation for the Reaction at the Microelectrode under Steady State Conditions
For a reaction in the form O + 𝑛𝑒 ⇋ R, the steady state reversible current at the
microelectrode is given by equation 3.3.
𝑖𝑟 =𝑖𝑙
{1 +𝐷𝑜
𝐷𝑅exp [
𝑛𝐹(𝐸 − 𝐸0)𝑅𝑇 ]}
[3.3]
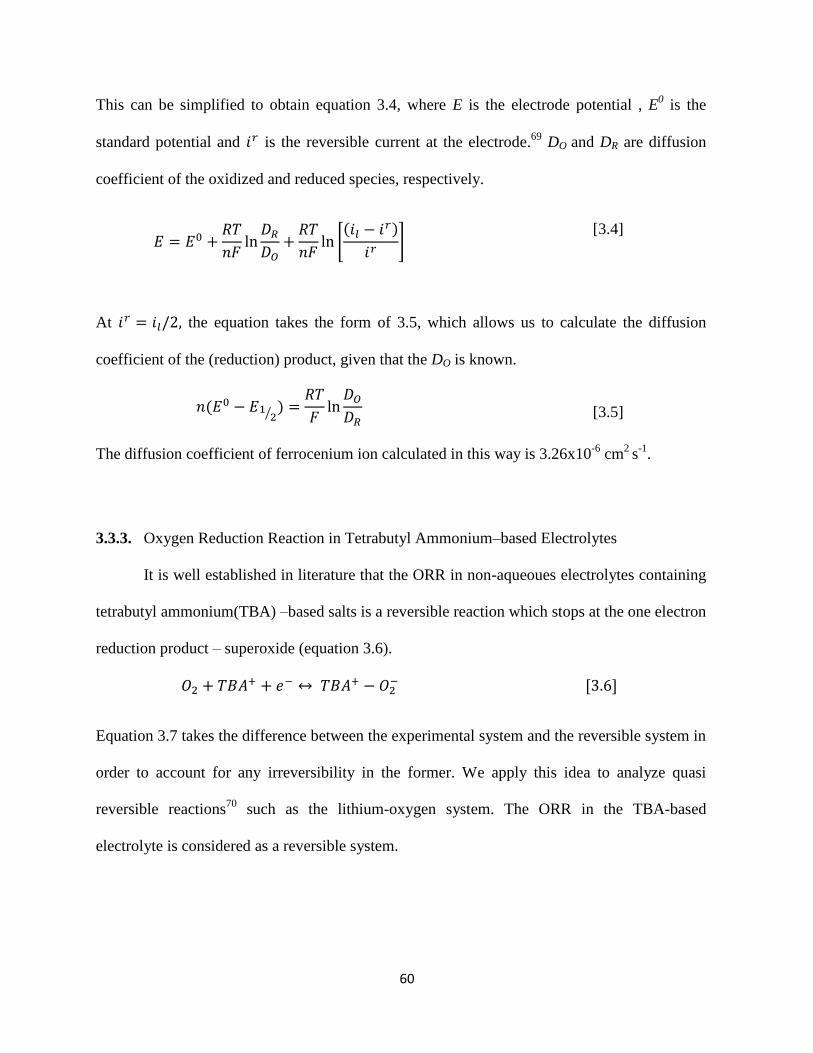
60
This can be simplified to obtain equation 3.4, where E is the electrode potential , E0 is the
standard potential and 𝑖𝑟 is the reversible current at the electrode.69
DO and DR are diffusion
coefficient of the oxidized and reduced species, respectively.
𝐸 = 𝐸0 +𝑅𝑇
𝑛𝐹ln
𝐷𝑅
𝐷𝑂+
𝑅𝑇
𝑛𝐹ln [
(𝑖𝑙 − 𝑖𝑟)
𝑖𝑟]
[3.4]
At 𝑖𝑟 = 𝑖𝑙/2, the equation takes the form of 3.5, which allows us to calculate the diffusion
coefficient of the (reduction) product, given that the DO is known.
𝑛(𝐸0 − 𝐸12⁄ ) =
𝑅𝑇
𝐹ln
𝐷𝑂
𝐷𝑅 [3.5]
The diffusion coefficient of ferrocenium ion calculated in this way is 3.26x10⁻⁶
cm2
s-1
.
3.3.3. Oxygen Reduction Reaction in Tetrabutyl Ammonium–based Electrolytes
It is well established in literature that the ORR in non-aqueoues electrolytes containing
tetrabutyl ammonium(TBA) –based salts is a reversible reaction which stops at the one electron
reduction product – superoxide (equation 3.6).
𝑂2 + 𝑇𝐵𝐴+ + 𝑒− ↔ 𝑇𝐵𝐴+ − 𝑂2− [3.6]
Equation 3.7 takes the difference between the experimental system and the reversible system in
order to account for any irreversibility in the former. We apply this idea to analyze quasi
reversible reactions70
such as the lithium-oxygen system. The ORR in the TBA-based
electrolyte is considered as a reversible system.
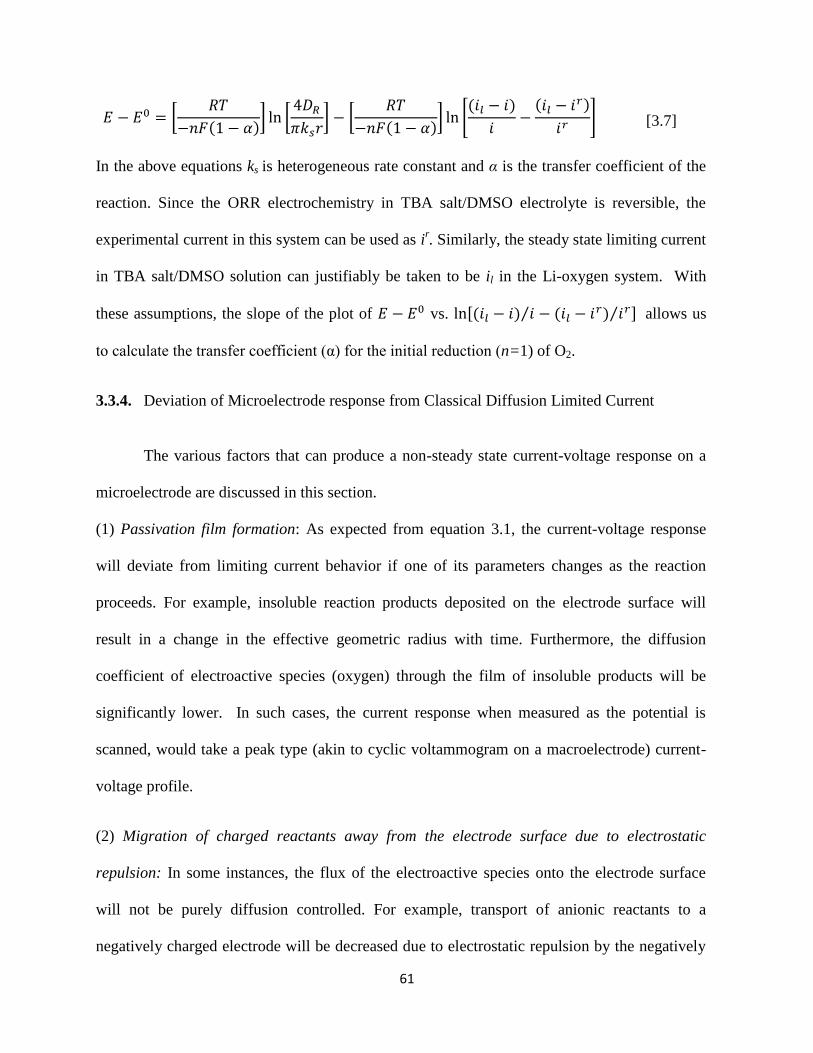
61
𝐸 − 𝐸0 = [𝑅𝑇
−𝑛𝐹(1 − 𝛼)] ln [
4𝐷𝑅
𝜋𝑘𝑠𝑟] − [
𝑅𝑇
−𝑛𝐹(1 − 𝛼)] ln [
(𝑖𝑙 − 𝑖)
𝑖−
(𝑖𝑙 − 𝑖𝑟)
𝑖𝑟] [3.7]
In the above equations ks is heterogeneous rate constant and α is the transfer coefficient of the
reaction. Since the ORR electrochemistry in TBA salt/DMSO electrolyte is reversible, the
experimental current in this system can be used as ir. Similarly, the steady state limiting current
in TBA salt/DMSO solution can justifiably be taken to be il in the Li-oxygen system. With
these assumptions, the slope of the plot of 𝐸 − 𝐸0 vs. ln[(𝑖𝑙 − 𝑖) 𝑖⁄ − (𝑖𝑙 − 𝑖𝑟) 𝑖𝑟⁄ ] allows us
to calculate the transfer coefficient (α) for the initial reduction (n=1) of O2.
3.3.4. Deviation of Microelectrode response from Classical Diffusion Limited Current
The various factors that can produce a non-steady state current-voltage response on a
microelectrode are discussed in this section.
(1) Passivation film formation: As expected from equation 3.1, the current-voltage response
will deviate from limiting current behavior if one of its parameters changes as the reaction
proceeds. For example, insoluble reaction products deposited on the electrode surface will
result in a change in the effective geometric radius with time. Furthermore, the diffusion
coefficient of electroactive species (oxygen) through the film of insoluble products will be
significantly lower. In such cases, the current response when measured as the potential is
scanned, would take a peak type (akin to cyclic voltammogram on a macroelectrode) current-
voltage profile.
(2) Migration of charged reactants away from the electrode surface due to electrostatic
repulsion: In some instances, the flux of the electroactive species onto the electrode surface
will not be purely diffusion controlled. For example, transport of anionic reactants to a
negatively charged electrode will be decreased due to electrostatic repulsion by the negatively
62
charged electrode. Therefore, the limiting current will be potential dependent. White et al66
described the migration-diffusion limited currents at a spherical microelectrode by taking a
new term called “interaction energy” into consideration.
𝐴 + 𝑒 → 𝐴− [3.8]
𝐴− + 𝑒 → 𝐴2− [3.9]
For example consider equation 3.8; the neutral reactant giving negatively charged products
would give the expected sigmoidal shaped voltammogram. However, as in equation 3.9 for a
singly negative reactant giving a doubly negative product, the shape of the voltammogram can
deviate from a sigmoidal shape as the electrode potential is scanned towards negative
potentials with respect to the potential of zero charge (𝐸𝑝𝑧𝑐). In our study, the reaction of an
oxygen molecule going to superoxide represents the equation 3.8 and the superoxide ion
reduction to peroxide ion is similar to the reaction in equation 3.9. In fact as presented below,
we consider this behavior as one of the reasons for the non-steady state microelectrode ORR
response in Li salt solutions in DMSO.
3.3.5. Oxygen Electrochemistry on Carbon Microelectrodes
We have investigated the ORR current-voltage response at the microelectrode in a
series of tetrabutylammonium and lithium salts solutions in DMSO. The salts studied included
MPF6, MClO4, MCF3SO3, MN(CF3SO2)2 where M=TBA or Li. Distinct differences in the
current-voltage profile attributable to the TBA+ and Li
+ salt solutions were observed, providing
valuable insights into the strong influence of cation on the ORR electrochemistry and the
mechanism of ORR in these electrolyte solutions.
63
3.3.6. ORR in Tetrabutylammonium (TBA) Salt-based Electrolytes
Figures 3.1a and 3.1b show the voltammograms recorded on micro and macro
electrodes, respectively, in oxygen-saturated solutions of 0.1 M TBAPF6/DMSO. The limiting
currents for oxygen reduction obtained for scan rates ranging from 50 to 1000 mV s-1
are seen
in Figure 3.1a. The ORR is a one-electron reversible reaction in TBAPF6/DMSO electrolyte as
determined from detailed analysis of the data in Figure 3.1b using the Randles-Sevcik
relationship as done previously22, 32
. As we have recently demonstrated through 13
C NMR
chemical shift and spin-lattice relaxation time (T1) data in propylene carbonate solutions,
TBA+ is a soft acid due to its low charge density.
71 Therefore, the TBA
+ interaction with the
soft base O2−, the one-electron reduction product of O2, is sufficiently strong to spare it from
further reduction22, 32
at lower potentials. The nearly ideal limiting current behavior displayed
in Figure 3.1a for a series of sweep rates indicates that the microelectrode surface is not
modified by insoluble ORR products in TBA/DMSO electrolytes. The superoxide reduction
product is apparently highly soluble in the electrolyte.
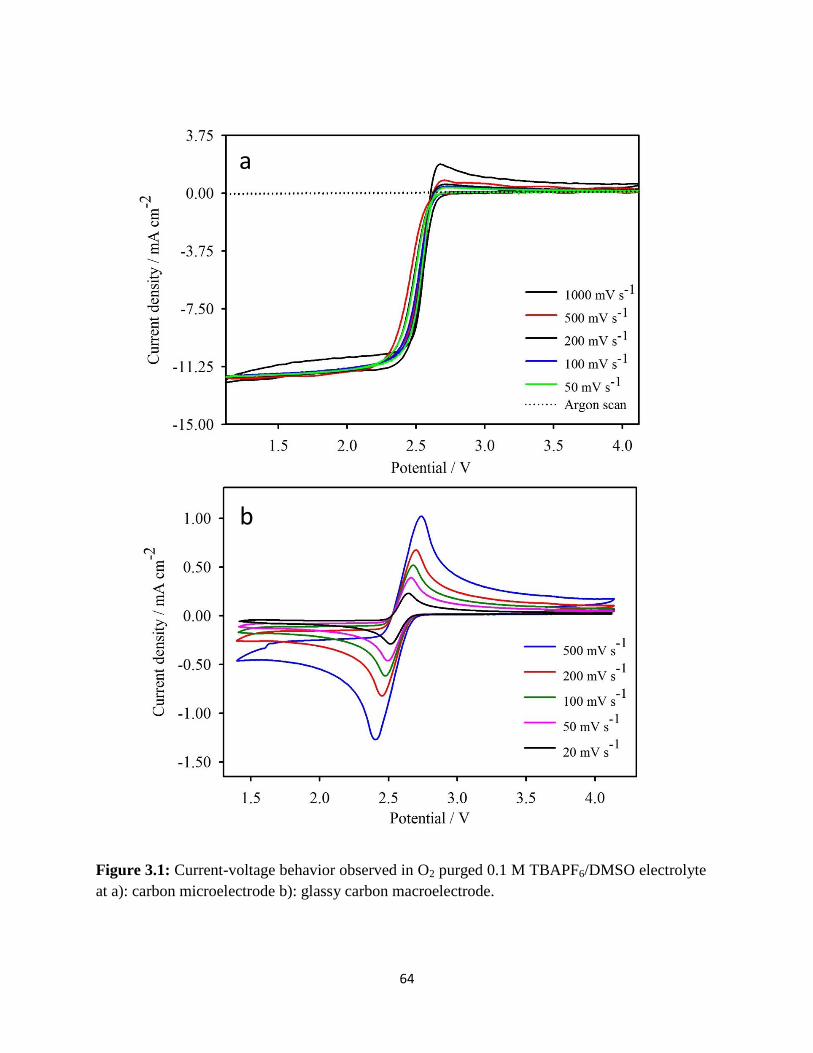
64
Figure 3.1: Current-voltage behavior observed in O2 purged 0.1 M TBAPF6/DMSO electrolyte
at a): carbon microelectrode b): glassy carbon macroelectrode.
a
b
65
Similar ORR limiting currents were observed in 0.1 M TBAPF6, TBAClO4, TBACF3SO3,
TBAN(CF3SO2)2 in DMSO (Figure 3.2a). This suggests that the electrode process is primarily
controlled by the TBA+ cation with minimal influence of the anion on the ORR mechanism.
Current-time transients obtained by stepping the electrode potential from 3.62 V to 1.62 V
were analyzed using the Cottrell equation as shown in Figure 3.2b. The oxygen diffusion
coefficient and solubility in TBAPF6/DMSO calculated from these data were found to be
2.2x10⁻⁵
cm-2
s-1
and 2.79x10⁻⁶
mol cm-3
, respectively.
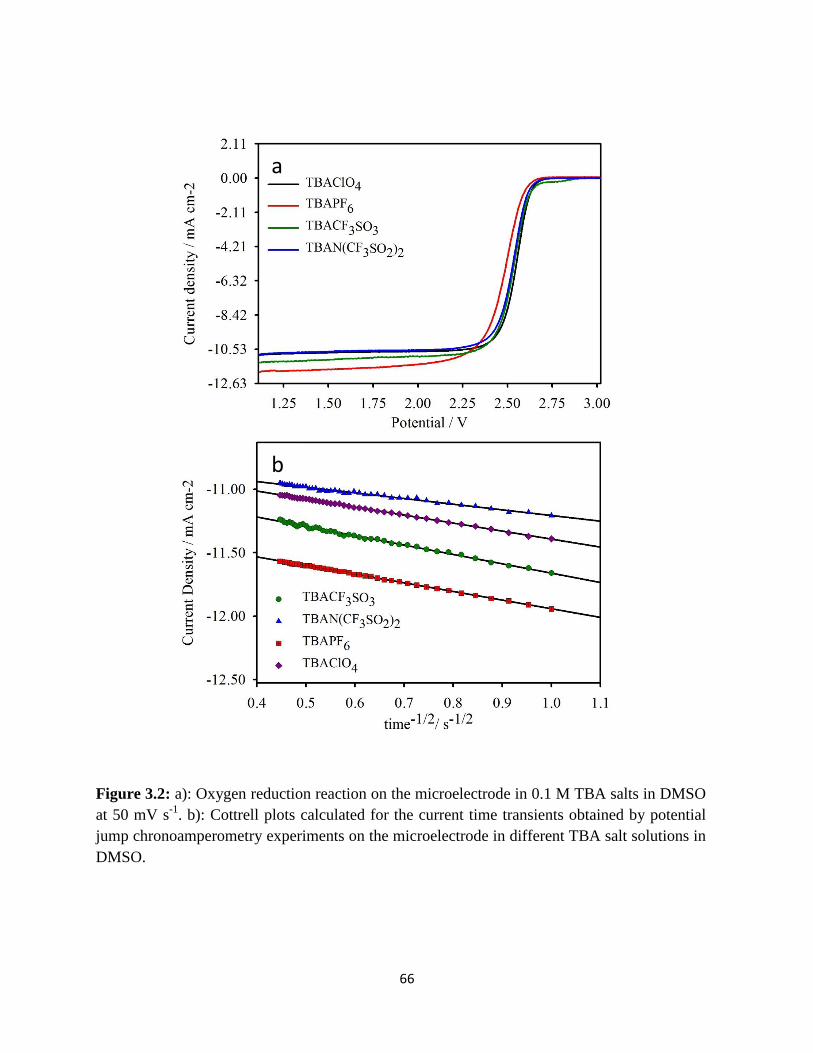
66
Figure 3.2: a): Oxygen reduction reaction on the microelectrode in 0.1 M TBA salts in DMSO
at 50 mV s-1
. b): Cottrell plots calculated for the current time transients obtained by potential
jump chronoamperometry experiments on the microelectrode in different TBA salt solutions in
DMSO.
a
b
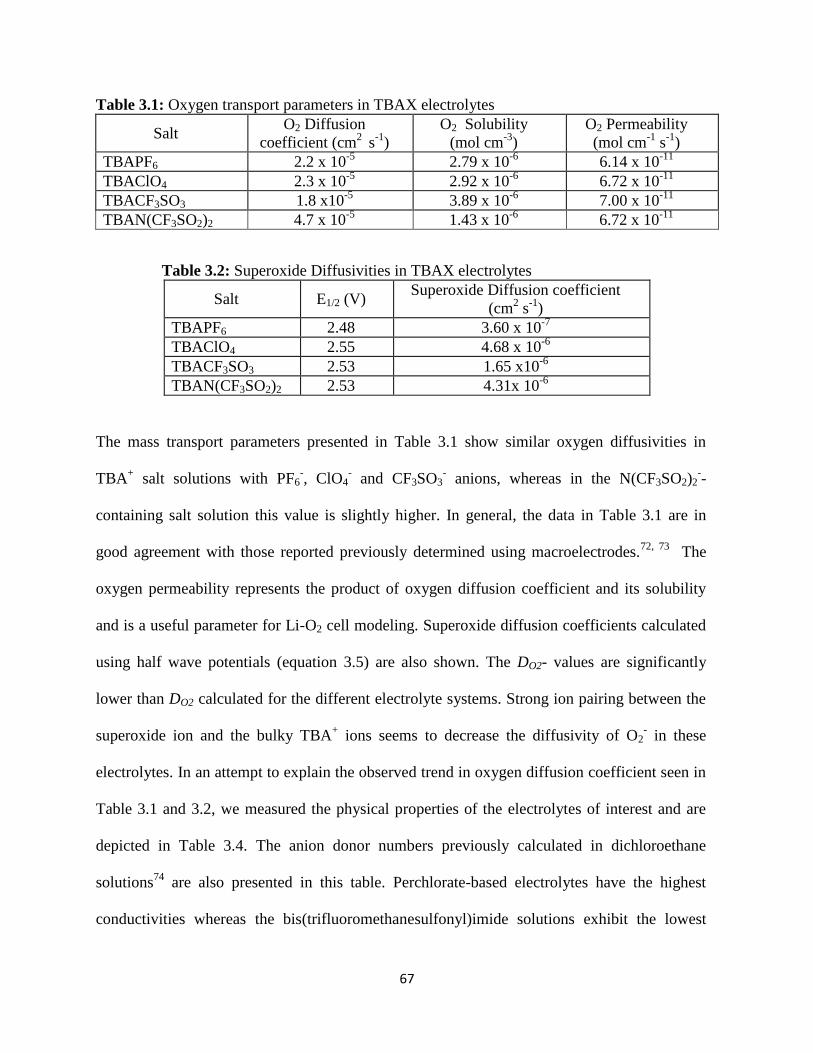
67
Table 3.1: Oxygen transport parameters in TBAX electrolytes
Salt O2 Diffusion
coefficient (cm2
s-1
)
O2 Solubility
(mol cm-3
)
O2 Permeability
(mol cm-1
s-1
)
TBAPF6 2.2 x 10⁻⁵
2.79 x 10⁻⁶
6.14 x 10⁻¹¹
TBAClO4 2.3 x 10⁻⁵
2.92 x 10⁻⁶
6.72 x 10⁻¹¹
TBACF3SO3 1.8 x10⁻⁵
3.89 x 10⁻⁶
7.00 x 10⁻¹¹
TBAN(CF3SO2)2 4.7 x 10⁻⁵
1.43 x 10⁻⁶
6.72 x 10⁻¹¹
Table 3.2: Superoxide Diffusivities in TBAX electrolytes
Salt E1/2 (V) Superoxide Diffusion coefficient
(cm2 s
-1)
TBAPF6 2.48 3.60 x 10⁻⁷
TBAClO4 2.55 4.68 x 10⁻⁶
TBACF3SO3 2.53 1.65 x10⁻⁶
TBAN(CF3SO2)2 2.53 4.31x 10⁻⁶
The mass transport parameters presented in Table 3.1 show similar oxygen diffusivities in
TBA+ salt solutions with PF6
-, ClO4
- and CF3SO3
- anions, whereas in the N(CF3SO2)2
--
containing salt solution this value is slightly higher. In general, the data in Table 3.1 are in
good agreement with those reported previously determined using macroelectrodes.72, 73
The
oxygen permeability represents the product of oxygen diffusion coefficient and its solubility
and is a useful parameter for Li-O2 cell modeling. Superoxide diffusion coefficients calculated
using half wave potentials (equation 3.5) are also shown. The DO2- values are significantly
lower than DO2 calculated for the different electrolyte systems. Strong ion pairing between the
superoxide ion and the bulky TBA+ ions seems to decrease the diffusivity of O2
- in these
electrolytes. In an attempt to explain the observed trend in oxygen diffusion coefficient seen in
Table 3.1 and 3.2, we measured the physical properties of the electrolytes of interest and are
depicted in Table 3.4. The anion donor numbers previously calculated in dichloroethane
solutions74
are also presented in this table. Perchlorate-based electrolytes have the highest
conductivities whereas the bis(trifluoromethanesulfonyl)imide solutions exhibit the lowest

68
conductivities probably due to the low mobility of this large anion. However the conductivity
differences are small. The slightly higher O2 diffusion coefficient seen in the TBAN(CF3SO2)2
solution in Table 3.1 does not appear to be due to viscosity effects but rather it may be
associated with the lower O2 solubility.
3.3.7. ORR in Lithium Ion-containing Electrolytes
Figure 3.3b displays the scan rate dependent current-voltage curves obtained on the
microelectrode in oxygen saturated 0.1 M LiPF6 in DMSO. The current reached its maximum
at around 2.5 V (at 50 mV s-1
) and started to decrease at lower potentials. Most interestingly,
the current-voltage curve has the appearance of a cyclic voltammogram. There was no
sigmoidal shaped limiting current behavior as observed for O2 in TBA salt-containing
solutions. Considering that ORR limiting currents are observed in TBA+/DMSO electrolytes,
clearly this behavior are not arising from oxygen mass transport limitation in the electrolyte.
On the contrary, it probably arises either from the passivation of the electrode by the deposition
of insoluble lithium oxides on the electrode surface or due to limited reactant transport, which
is not purely diffusion controlled. Any insoluble products formed on the electrode would block
enough O2 from reaching the electrode surface to maintain a limiting current. In this context, it
is useful to recall that previous studies on macroelectrodes have shown that in presence of
small cations like Li+ and Na
+, ORR
becomes less reversible
22, 32 probably due to the
precipitation of the corresponding peroxide and monoxide on the electrodes.
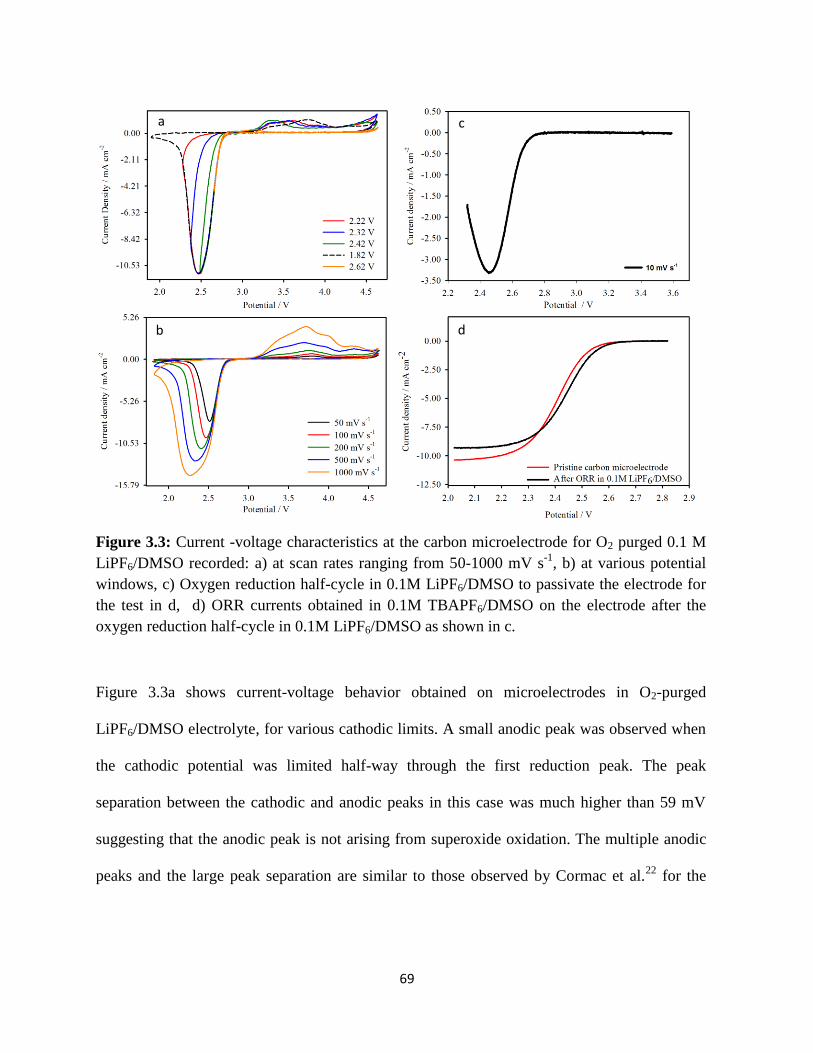
69
Figure 3.3: Current -voltage characteristics at the carbon microelectrode for O2 purged 0.1 M
LiPF6/DMSO recorded: a) at scan rates ranging from 50-1000 mV s-1
, b) at various potential
windows, c) Oxygen reduction half-cycle in 0.1M LiPF6/DMSO to passivate the electrode for
the test in d, d) ORR currents obtained in 0.1M TBAPF6/DMSO on the electrode after the
oxygen reduction half-cycle in 0.1M LiPF6/DMSO as shown in c.
Figure 3.3a shows current-voltage behavior obtained on microelectrodes in O2-purged
LiPF6/DMSO electrolyte, for various cathodic limits. A small anodic peak was observed when
the cathodic potential was limited half-way through the first reduction peak. The peak
separation between the cathodic and anodic peaks in this case was much higher than 59 mV
suggesting that the anodic peak is not arising from superoxide oxidation. The multiple anodic
peaks and the large peak separation are similar to those observed by Cormac et al.22
for the
a
b
c
d
70
ORR at a glassy carbon disc electrode and supports the view of electrochemical reduction of
O2 followed by chemical decomposition, as displayed in equations 3.10 and 3.11.
As an attempt to quantify the passivation of the microelectrode in Li+ salt solutions
after ORR, we have recorded ORR currents on this same microelectrode in TBAPF6 solutions
after they have been removed from the ORR in Li+-containing solutions. Newman et al.
75 have
reported that ferrocene oxidation limiting currents can be used as a measure of the amount of
passivation at the electrode from solid electrolyte interphase (SEI) formation in lithium ion
battery electrolytes. However, our attempts to use ferrocene oxidation as a measure of the
extent of passivation due to ORR on the carbon microelectrode revealed that the bulky
ferrocene molecules can overestimate the electrode area passivation. Consequently, we used
ORR in the TBAPF6/DMSO solution to determine passivation in Li salt solutions. In this
method involving the reduction of oxygen in a TBA salt solution to measure the extent of
electrode passivation from ORR in Li salt solutions, the small oxygen molecules can still
penetrate through the pores of any oxide film on the electrode, and give a fair estimate of the
extent of passivation from ORR in Li salt solutions. Figure 3.3d shows the ORR current
plateau obtained in a TBAPF6/DMSO solution after an ORR run in 0.1M LiPF6/DMSO.
Surprisingly, the extent of passivation is small and insufficient to cause the bell shaped CV
response observed in figure 3.3b. Therefore, the most probable explanation for the peak-shaped
current-voltage response is the migration-diffusion controlled reaction that occurs at the
microelectrode66
as discussed earlier.
The reduction of O2 to O2- in either TBA or Li salt solutions (equation 3.10) does not
involve a charged reactant which can be repelled from the negatively charged electrode. In
TBA salt solutions the superoxide is highly stabilized and a second reduction to peroxide does
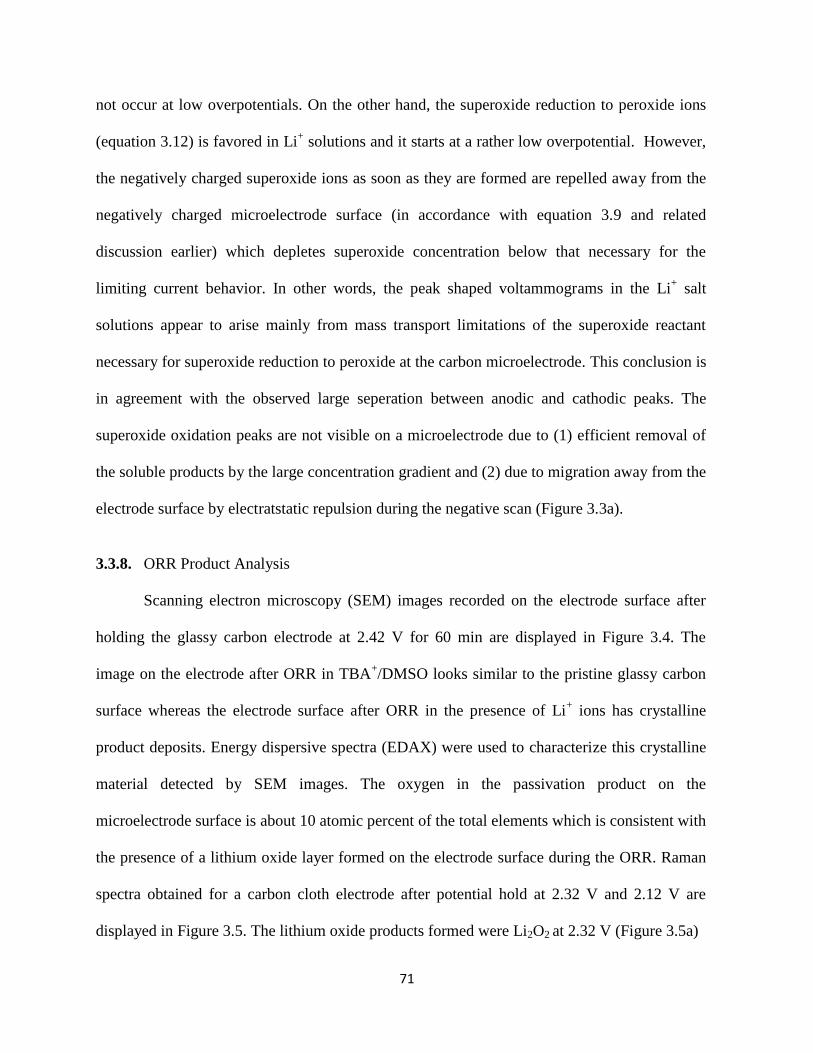
71
not occur at low overpotentials. On the other hand, the superoxide reduction to peroxide ions
(equation 3.12) is favored in Li+ solutions and it starts at a rather low overpotential. However,
the negatively charged superoxide ions as soon as they are formed are repelled away from the
negatively charged microelectrode surface (in accordance with equation 3.9 and related
discussion earlier) which depletes superoxide concentration below that necessary for the
limiting current behavior. In other words, the peak shaped voltammograms in the Li+ salt
solutions appear to arise mainly from mass transport limitations of the superoxide reactant
necessary for superoxide reduction to peroxide at the carbon microelectrode. This conclusion is
in agreement with the observed large seperation between anodic and cathodic peaks. The
superoxide oxidation peaks are not visible on a microelectrode due to (1) efficient removal of
the soluble products by the large concentration gradient and (2) due to migration away from the
electrode surface by electratstatic repulsion during the negative scan (Figure 3.3a).
3.3.8. ORR Product Analysis
Scanning electron microscopy (SEM) images recorded on the electrode surface after
holding the glassy carbon electrode at 2.42 V for 60 min are displayed in Figure 3.4. The
image on the electrode after ORR in TBA+/DMSO looks similar to the pristine glassy carbon
surface whereas the electrode surface after ORR in the presence of Li+ ions has crystalline
product deposits. Energy dispersive spectra (EDAX) were used to characterize this crystalline
material detected by SEM images. The oxygen in the passivation product on the
microelectrode surface is about 10 atomic percent of the total elements which is consistent with
the presence of a lithium oxide layer formed on the electrode surface during the ORR. Raman
spectra obtained for a carbon cloth electrode after potential hold at 2.32 V and 2.12 V are
displayed in Figure 3.5. The lithium oxide products formed were Li2O2 at 2.32 V (Figure 3.5a)
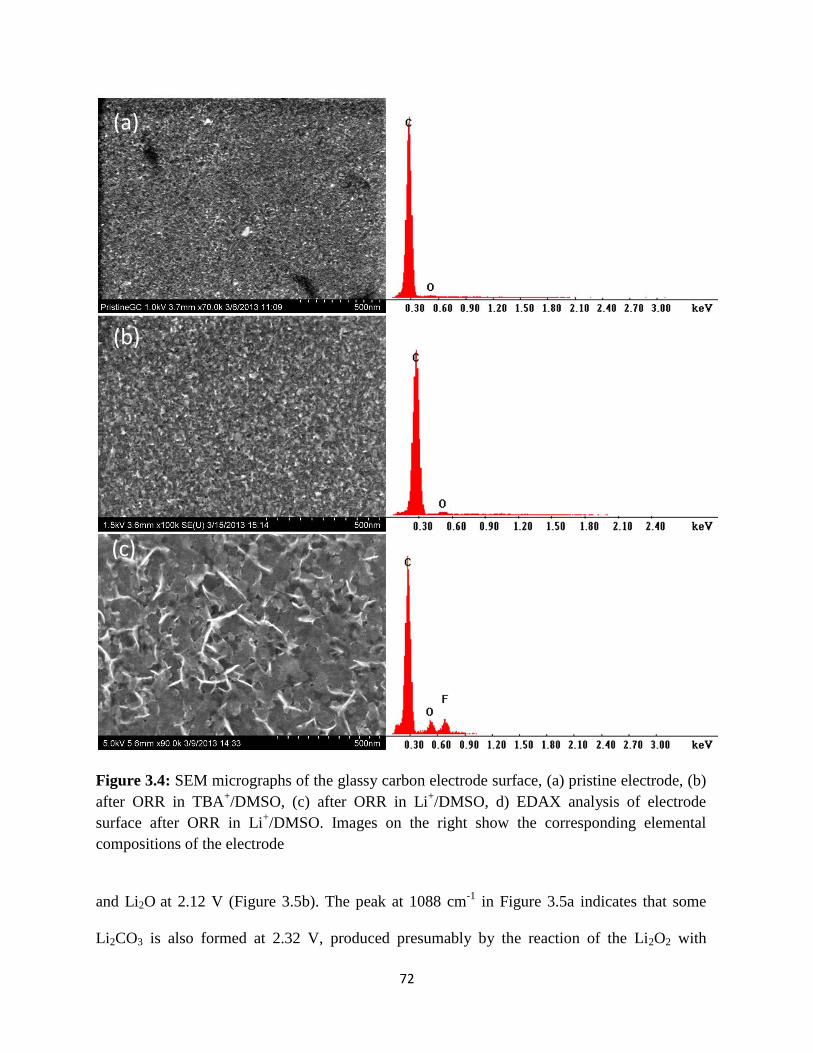
72
Figure 3.4: SEM micrographs of the glassy carbon electrode surface, (a) pristine electrode, (b)
after ORR in TBA+/DMSO, (c) after ORR in Li
+/DMSO, d) EDAX analysis of electrode
surface after ORR in Li+/DMSO. Images on the right show the corresponding elemental
compositions of the electrode
and Li2O at 2.12 V (Figure 3.5b). The peak at 1088 cm-1
in Figure 3.5a indicates that some
Li2CO3 is also formed at 2.32 V, produced presumably by the reaction of the Li2O2 with
(a)
0)
(b)
0)
(c)
0)
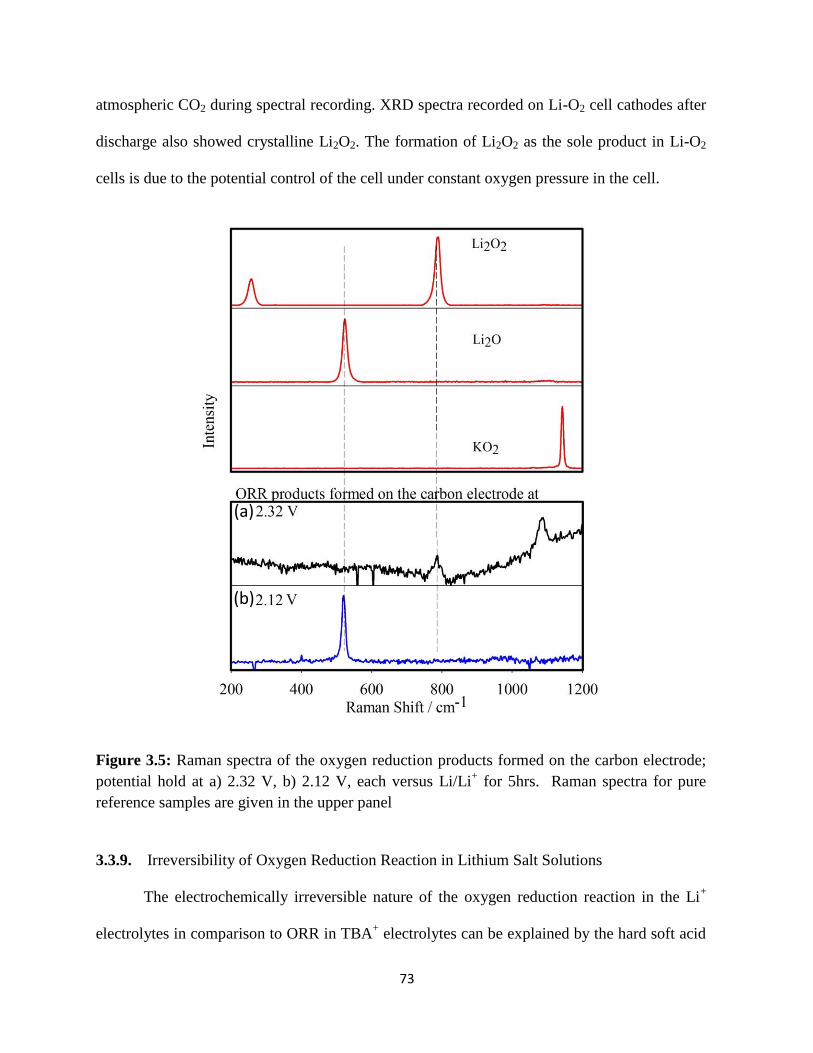
73
atmospheric CO2 during spectral recording. XRD spectra recorded on Li-O2 cell cathodes after
discharge also showed crystalline Li2O2. The formation of Li2O2 as the sole product in Li-O2
cells is due to the potential control of the cell under constant oxygen pressure in the cell.
Figure 3.5: Raman spectra of the oxygen reduction products formed on the carbon electrode;
potential hold at a) 2.32 V, b) 2.12 V, each versus Li/Li+ for 5hrs. Raman spectra for pure
reference samples are given in the upper panel
3.3.9. Irreversibility of Oxygen Reduction Reaction in Lithium Salt Solutions
The electrochemically irreversible nature of the oxygen reduction reaction in the Li+
electrolytes in comparison to ORR in TBA+ electrolytes can be explained by the hard soft acid
(a)
0)
(b)
0)
74
base (HSAB) concept we previously advanced.22, 32, 71
Small cations like Li+ possessing high
charge densities are strong Lewis acids71
. Superoxide being a soft Lewis base, LiO2 is unstable
and undergoes chemical decomposition/electrochemical reduction to the more stable Li2O2
which is deposited on the electrode surface. At lower potentials, the Li2O2 is reduced to Li2O
and appears as the sole product as evidenced by the Raman spectra discussed earlier. These
data unequivocally confirm the four-electron reduction of O2 in DMSO-containing Li salts.
The various ORR processes in Li+ salt solutions are depicted in equations 3.10 – 3.13.
𝐿𝑖+ + 𝑂2 + 𝑒 → 𝐿𝑖𝑂2 [3.10]
2𝐿𝑖𝑂2 → 𝐿𝑖2𝑂2 + 𝑂2 (chemical) [3.11]
𝐿𝑖𝑂2 + 𝐿𝑖+ + 𝑒 → 𝐿𝑖2𝑂2 [3.12]
𝐿𝑖2𝑂2 + 2𝐿𝑖+ + 2𝑒 → 2𝐿𝑖2𝑂 [3.13]
3.3.10. The Role of the Li Salt Anion on ORR
Current voltage characteristics recorded for oxygen purged LiCF3SO3, LiClO4 and
LiN(CF3SO2)2 electrolytes in DMSO are shown in Figure 3.6. Similar to the ORR
voltammograms observed in LiPF6/DMSO electrolyte, potential dependent (bell shaped) mass
transport limited currents were observed in all cases. In contrast to the second reduction
reaction (O2- O2
2-) observed at higher potentials (lower over-potentials) in all electrolytes,
there was a significant difference in the magnitude of oxidation peaks observed in different salt
solutions.
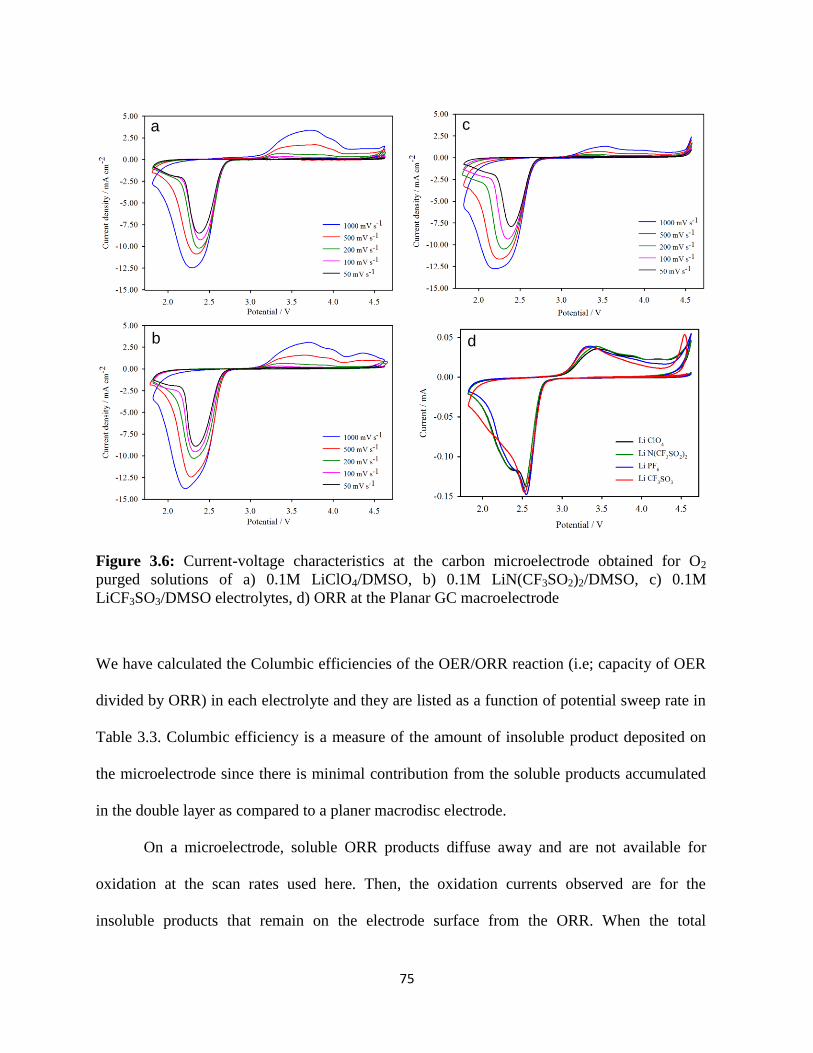
75
Figure 3.6: Current-voltage characteristics at the carbon microelectrode obtained for O2
purged solutions of a) 0.1M LiClO4/DMSO, b) 0.1M LiN(CF3SO2)2/DMSO, c) 0.1M
LiCF3SO3/DMSO electrolytes, d) ORR at the Planar GC macroelectrode
We have calculated the Columbic efficiencies of the OER/ORR reaction (i.e; capacity of OER
divided by ORR) in each electrolyte and they are listed as a function of potential sweep rate in
Table 3.3. Columbic efficiency is a measure of the amount of insoluble product deposited on
the microelectrode since there is minimal contribution from the soluble products accumulated
in the double layer as compared to a planer macrodisc electrode.
On a microelectrode, soluble ORR products diffuse away and are not available for
oxidation at the scan rates used here. Then, the oxidation currents observed are for the
insoluble products that remain on the electrode surface from the ORR. When the total
a
b
c
d

76
capacities involved in the ORR processes in the different electrolytes are of the same
magnitude, the difference in the columbic efficiencies can be attributed to the differences in the
solubility of the reduction products; the higher the solubility of the reduction products, the
lower is the columbic efficiency. As shown in Figure 3.6, the ORR peak currents and the total
charge involved in these electrolytes are very similar in the first cycle.
Scan rate dependence of ORR voltammograms in the presence of lithium ions can be
explained by the comparison of the rates of superoxide reduction both chemically and
electrochemically. At low potential sweeps (1) chemical decomposition of lithium superoxide
to lithium peroxide will occur near the electrode, and (2) more peroxides will start to form
from the electrochemical reduction of superoxide at higher potentials. Both of these effects
lead to instantaneous reduction of the surface activity of the electrode through passivation
which in turn leads to low reduction currents. Therefore, an increase in columbic efficiency of
ORR by decreasing scan rate is expected if passivation film formation was the major
contributor to columbic efficiency.
Comparison of the Columbic efficiencies (OER/ORR) at scan rates of 200 mV s-1
or
higher shows that of the four electrolytes, the ORR in the LiCF3SO3/DMSO has considerably
lower columbic efficiency for OER at all scan rates. The observed trend in columbic
efficiencies listed in Table 3.3 is consistent with product solubility with time since the ORR
capacities involved are very similar for all salts. In support of this view, we found that the SEM
of the microelectrode surface after the ORR showed much less products in the
LiCF3SO3/DMSO electrolyte than in LiPF6/DMSO. Solubility of Li2O2 in a solvent is
determined by the solvation energy of its Li+ cation compared to the lattice energy of this
oxide. In the presence of an abundance of DMSO molecules as in a 0.1 M Li salt solution, it is
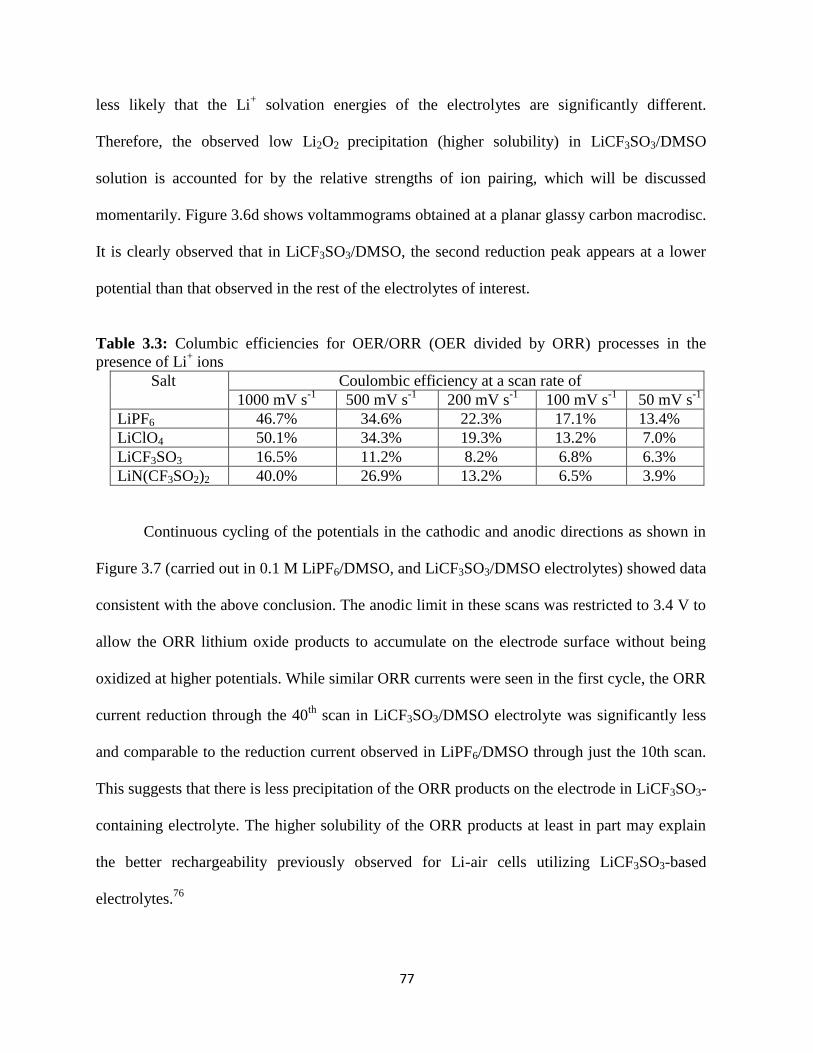
77
less likely that the Li+ solvation energies of the electrolytes are significantly different.
Therefore, the observed low Li2O2 precipitation (higher solubility) in LiCF3SO3/DMSO
solution is accounted for by the relative strengths of ion pairing, which will be discussed
momentarily. Figure 3.6d shows voltammograms obtained at a planar glassy carbon macrodisc.
It is clearly observed that in LiCF3SO3/DMSO, the second reduction peak appears at a lower
potential than that observed in the rest of the electrolytes of interest.
Table 3.3: Columbic efficiencies for OER/ORR (OER divided by ORR) processes in the
presence of Li+ ions
Salt Coulombic efficiency at a scan rate of
1000 mV s-1
500 mV s-1
200 mV s-1
100 mV s-1
50 mV s-1
LiPF6
46.7% 34.6% 22.3% 17.1% 13.4%
LiClO4
50.1% 34.3% 19.3% 13.2% 7.0%
LiCF3SO3 16.5% 11.2% 8.2% 6.8% 6.3%
LiN(CF3SO2)2 40.0% 26.9% 13.2% 6.5% 3.9%
Continuous cycling of the potentials in the cathodic and anodic directions as shown in
Figure 3.7 (carried out in 0.1 M LiPF6/DMSO, and LiCF3SO3/DMSO electrolytes) showed data
consistent with the above conclusion. The anodic limit in these scans was restricted to 3.4 V to
allow the ORR lithium oxide products to accumulate on the electrode surface without being
oxidized at higher potentials. While similar ORR currents were seen in the first cycle, the ORR
current reduction through the 40th
scan in LiCF3SO3/DMSO electrolyte was significantly less
and comparable to the reduction current observed in LiPF6/DMSO through just the 10th scan.
This suggests that there is less precipitation of the ORR products on the electrode in LiCF3SO3-
containing electrolyte. The higher solubility of the ORR products at least in part may explain
the better rechargeability previously observed for Li-air cells utilizing LiCF3SO3-based
electrolytes.76

78
Figure 3.7: Continuous cycling of potential in O2 saturated a) LiCF3SO3/DMSO and b)
LiPF6/DMSO electrolytes at 100 mV s-1
.
3.3.11. FT-IR Evidence for Ion Pair Formation
FT-IR spectra recorded in LiPF6, LiCF3SO3, LiN(CF3SO2)2 salts in DMSO are shown
in Figure 3.8. The spectrum of neat DMSO showed an intense band consisting of two shoulders
at 1050 cm-1
. The peak at 1045 cm-1
was assigned to the symmetric stretching vibration of the
S=O group whereas the shoulder at 1022 cm-1
was assigned to rocking vibrations of the methyl
groups. Appearance of a new peak at 1028 cm-1
with increasing concentration of LiPF6 salt
a
b

79
suggests ion pairing between DMSO and lithium ions (Figure 3.8a). A similar trend was
observed in the presence of both LiN(CF3SO2)2- and LiCF3SO3 in DMSO. Symmetric
stretching vibrations, νss of free CF3SO3- ions appear at 1031 cm
-1. This new peak leaned
towards lower frequencies with the increasing triflate ion concentration, indicating ion pair
formation between the S=O of CF3SO3- and Li
+ ions. Asymmetric stretching vibrations (νas) of
free triflate ion appear at 1270 cm-1
. When the triflate ions are coordinated with small cations
such as Li+, this peak splits into two peaks, which appears slightly below and above the νas
arising from the free ion. In higher donor number solvents such as DMSO, peaks arising from
Li+ ion paired triflate may not be clearly visible. However, with the increasing concentration of
triflate ions, νss of free triflate ions shifted towards a lower frequency (Figure 3.8b inset). It has
been reported that the FT-IR peaks arising from Li+-triflate aggregates appear at 1062 cm
-1. We
can conclude from these data that as the salt concentration increases the triflate ions form ion
pairs and aggregates with the Li+ in the corresponding electrolyte solution. Surprisingly this
lowering of νas was not observed (Figure 3.8c) in the νas peaks from the S=O of
N(CF3SO2)2- ions ( νas = 1352 cm
-1 ). This is explained below in Figure 3.9, in relation to the
ability of contact ion pair formation between Li+ and the anions in these electrolytes.

80
Figure 3.8: FT- IR spectra of DMSO-Lithium salt solutions. (a) LiPF6-DMSO, (b) Li CF3SO3-
DMSO, (c) LiN(CF3SO2)2-DMSO.
a
b
c
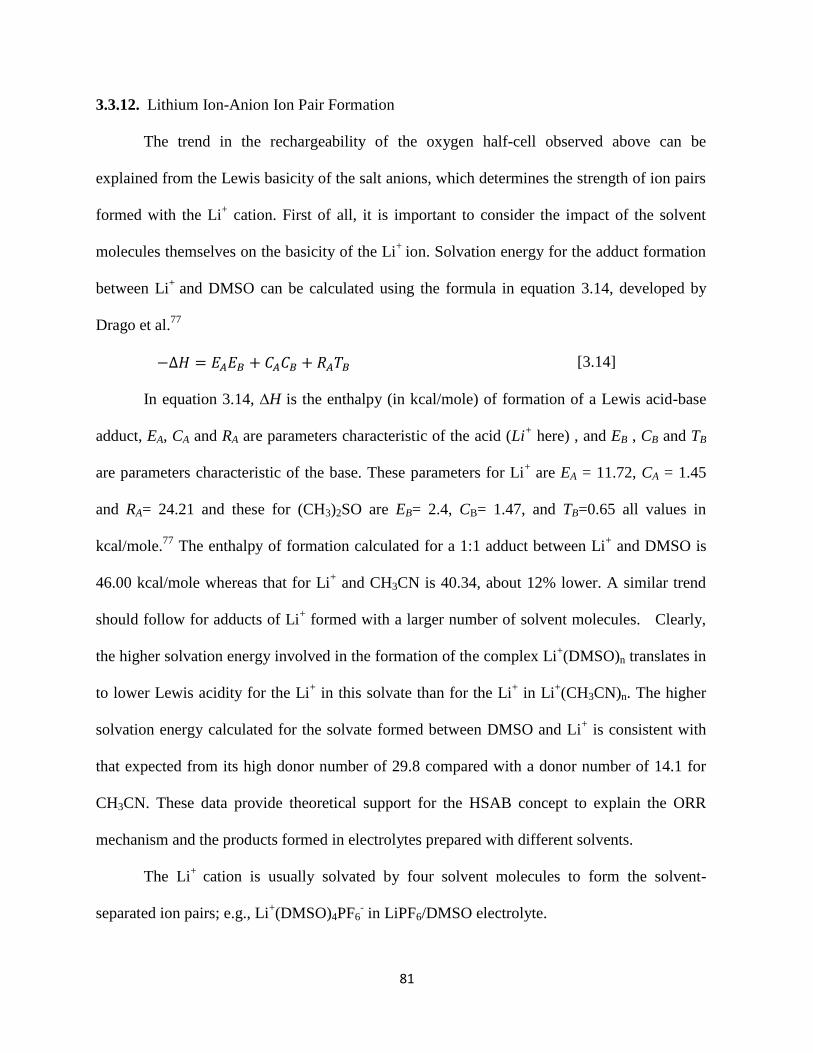
81
3.3.12. Lithium Ion-Anion Ion Pair Formation
The trend in the rechargeability of the oxygen half-cell observed above can be
explained from the Lewis basicity of the salt anions, which determines the strength of ion pairs
formed with the Li+ cation. First of all, it is important to consider the impact of the solvent
molecules themselves on the basicity of the Li+
ion. Solvation energy for the adduct formation
between Li+
and DMSO can be calculated using the formula in equation 3.14, developed by
Drago et al.77
−∆𝐻 = 𝐸𝐴𝐸𝐵 + 𝐶𝐴𝐶𝐵 + 𝑅𝐴𝑇𝐵 [3.14]
In equation 3.14, ∆H is the enthalpy (in kcal/mole) of formation of a Lewis acid-base
adduct, EA, CA and RA are parameters characteristic of the acid (Li+ here) , and EB , CB and TB
are parameters characteristic of the base. These parameters for Li+ are EA = 11.72, CA = 1.45
and RA= 24.21 and these for (CH3)2SO are EB= 2.4, CB= 1.47, and TB=0.65 all values in
kcal/mole.77
The enthalpy of formation calculated for a 1:1 adduct between Li+ and DMSO is
46.00 kcal/mole whereas that for Li+ and CH3CN is 40.34, about 12% lower. A similar trend
should follow for adducts of Li+ formed with a larger number of solvent molecules. Clearly,
the higher solvation energy involved in the formation of the complex Li+(DMSO)n translates in
to lower Lewis acidity for the Li+ in this solvate than for the Li
+ in Li
+(CH3CN)n. The higher
solvation energy calculated for the solvate formed between DMSO and Li+ is consistent with
that expected from its high donor number of 29.8 compared with a donor number of 14.1 for
CH3CN. These data provide theoretical support for the HSAB concept to explain the ORR
mechanism and the products formed in electrolytes prepared with different solvents.
The Li+
cation is usually solvated by four solvent molecules to form the solvent-
separated ion pairs; e.g., Li+(DMSO)4PF6
- in LiPF6/DMSO electrolyte.
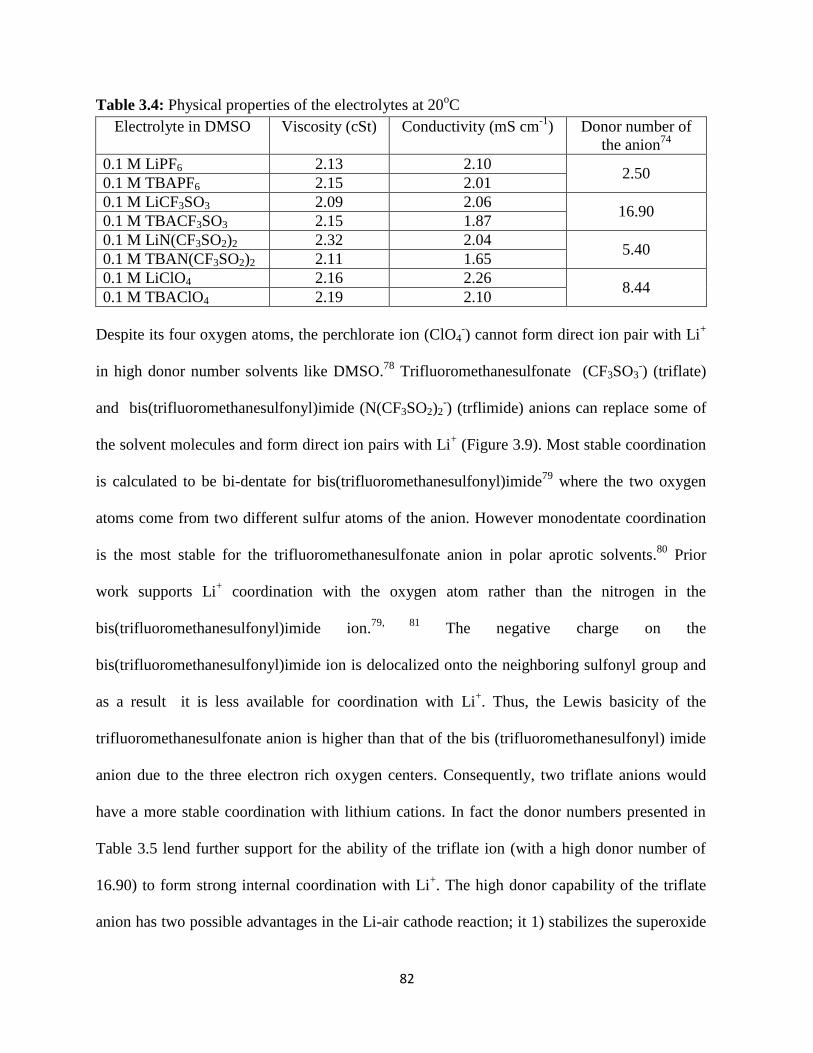
82
Table 3.4: Physical properties of the electrolytes at 20oC
Electrolyte in DMSO Viscosity (cSt) Conductivity (mS cm-1
) Donor number of
the anion74
0.1 M LiPF6 2.13 2.10 2.50
0.1 M TBAPF6 2.15 2.01
0.1 M LiCF3SO3 2.09 2.06 16.90
0.1 M TBACF3SO3 2.15 1.87
0.1 M LiN(CF3SO2)2 2.32 2.04 5.40
0.1 M TBAN(CF3SO2)2 2.11 1.65
0.1 M LiClO4 2.16 2.26 8.44
0.1 M TBAClO4 2.19 2.10
Despite its four oxygen atoms, the perchlorate ion (ClO4-) cannot form direct ion pair with Li
+
in high donor number solvents like DMSO.78
Trifluoromethanesulfonate (CF3SO3-) (triflate)
and bis(trifluoromethanesulfonyl)imide (N(CF3SO2)2-) (trflimide) anions can replace some of
the solvent molecules and form direct ion pairs with Li+ (Figure 3.9). Most stable coordination
is calculated to be bi-dentate for bis(trifluoromethanesulfonyl)imide79
where the two oxygen
atoms come from two different sulfur atoms of the anion. However monodentate coordination
is the most stable for the trifluoromethanesulfonate anion in polar aprotic solvents.80
Prior
work supports Li+ coordination with the oxygen atom rather than the nitrogen in the
bis(trifluoromethanesulfonyl)imide ion.79, 81
The negative charge on the
bis(trifluoromethanesulfonyl)imide ion is delocalized onto the neighboring sulfonyl group and
as a result it is less available for coordination with Li+. Thus, the Lewis basicity of the
trifluoromethanesulfonate anion is higher than that of the bis (trifluoromethanesulfonyl) imide
anion due to the three electron rich oxygen centers. Consequently, two triflate anions would
have a more stable coordination with lithium cations. In fact the donor numbers presented in
Table 3.5 lend further support for the ability of the triflate ion (with a high donor number of
16.90) to form strong internal coordination with Li+. The high donor capability of the triflate
anion has two possible advantages in the Li-air cathode reaction; it 1) stabilizes the superoxide
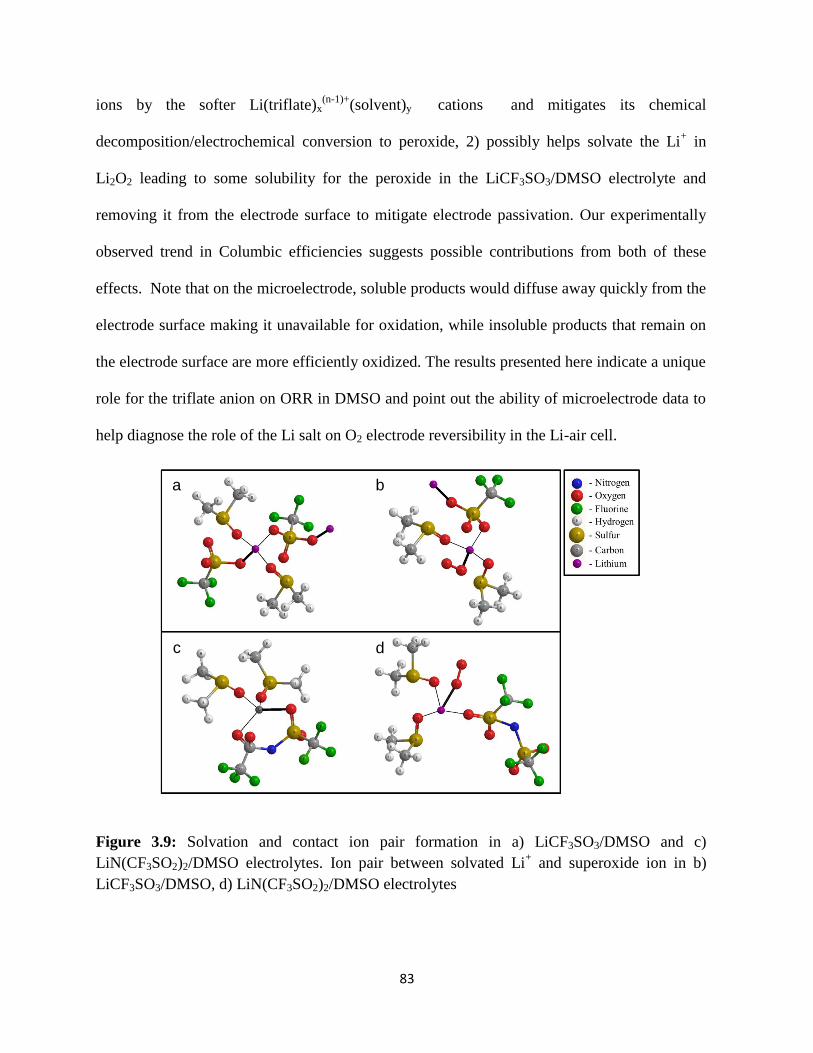
83
ions by the softer Li(triflate)x(n-1)+
(solvent)y
cations and mitigates its chemical
decomposition/electrochemical conversion to peroxide, 2) possibly helps solvate the Li+ in
Li2O2 leading to some solubility for the peroxide in the LiCF3SO3/DMSO electrolyte and
removing it from the electrode surface to mitigate electrode passivation. Our experimentally
observed trend in Columbic efficiencies suggests possible contributions from both of these
effects. Note that on the microelectrode, soluble products would diffuse away quickly from the
electrode surface making it unavailable for oxidation, while insoluble products that remain on
the electrode surface are more efficiently oxidized. The results presented here indicate a unique
role for the triflate anion on ORR in DMSO and point out the ability of microelectrode data to
help diagnose the role of the Li salt on O2 electrode reversibility in the Li-air cell.
Figure 3.9: Solvation and contact ion pair formation in a) LiCF3SO3/DMSO and c)
LiN(CF3SO2)2/DMSO electrolytes. Ion pair between solvated Li+ and superoxide ion in b)
LiCF3SO3/DMSO, d) LiN(CF3SO2)2/DMSO electrolytes
a b
c d

84
3.3.13. Oxygen Reduction Kinetics in TBA and Li Salt-based Electrolytes
We have plotted E-E0
vs. [(il-i)/i] - [(il-ir)/i
r] (as shown in equation 3.7) for the four Li
+-
based electrolyte systems (Figure 3.10). Currents observed in the corresponding TBA
electrolyte have been used as the current values in a reversible system. The transfer coefficient,
α , and the heterogeneous rate constant , ks , calculated are shown in Table 3.6. According to
the data in Table 3.1 and 3.2, the size of the cation does not have a significant impact on the
viscosity or oxygen transport parameters in DMSO. Therefore, in the presence of Li+ ions, it is
reasonable to use the limiting current in TBA+/DMSO electrolyte for that in Li
+/DMSO
electrolytes. Apart from the large differences between TBA+ and Li
+ salts, comparison of the
voltammetric responses obtained in different Li+-based electrolytes revealed valuable
distinguishing features. In LiCF3SO3/DMSO and Li(CF3SO2)2N/DMSO solutions, transfer
coefficients are close to 0.5 whereas in LiPF6/DMSO a much low transfer coefficient (~0.3)
was observed. The slow kinetics observed in LiPF6/DMSO can be possibly attributed to the
electrode surface modified with insoluble products formed at high potentials. A transfer
coefficient of 0.57 in the triflate electrolyte suggests a more desirable ORR and OER kinetics
in this electrolyte
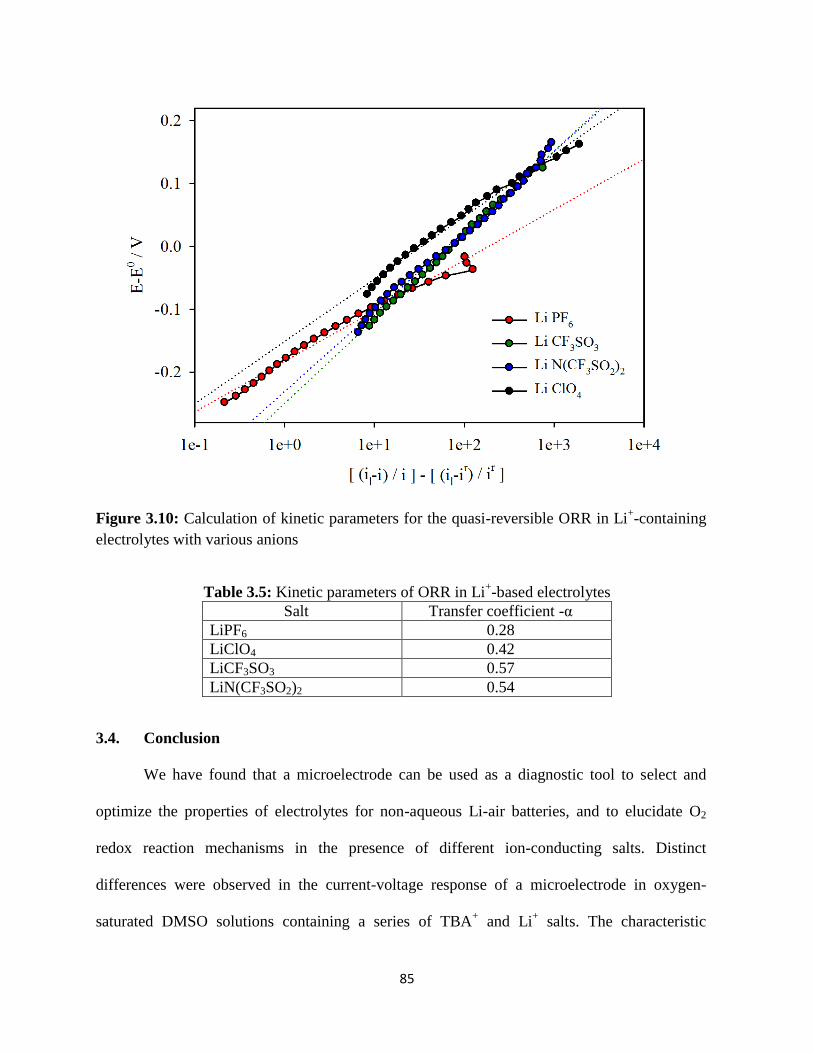
85
Figure 3.10: Calculation of kinetic parameters for the quasi-reversible ORR in Li+-containing
electrolytes with various anions
Table 3.5: Kinetic parameters of ORR in Li+-based electrolytes
Salt Transfer coefficient -α
LiPF6 0.28
LiClO4 0.42
LiCF3SO3 0.57
LiN(CF3SO2)2 0.54
3.4. Conclusion
We have found that a microelectrode can be used as a diagnostic tool to select and
optimize the properties of electrolytes for non-aqueous Li-air batteries, and to elucidate O2
redox reaction mechanisms in the presence of different ion-conducting salts. Distinct
differences were observed in the current-voltage response of a microelectrode in oxygen-
saturated DMSO solutions containing a series of TBA+ and Li
+ salts. The characteristic
86
limiting currents observed in TBA+ salt solutions due to the exceptional stability and solubility
of the ORR products were contrasted with the bell shaped CV responses in Li+ salt solutions,
attributed to the passivation of the microelectrode surface by insoluble ORR products
combined with the electrostatic repulsion of O2-, the initial O2 reduction product. The final O2
reduction products were identified be Li2O2 and Li2O formed at different potentials. Our data
confirm the four-electron reduction of O2 to Li2O in DMSO. Overall oxygen transport was not
influenced by anion of either the TBA or Li salts. The trend in OER/ORR coulombic
efficienies in Li+-based electrolytes suggested that there is improved O2
- stability and ORR
product solubility in LiCF3SO3/DMSO electrolytes, probabaly due to increased solvation of the
Li+
cation by the triflate anion which may translate into better ORR and OER kinetics for the
Li-air cell utilizing this electrolyte as previously observed.76
87
Chapter 4
The Influence of Lithium Salt Anions on Oxygen Reduction Reactions in
Ether Electrolytes for Li-air Batteries
4.1. Introduction
The promise of the high theoretical energy density has not yet been translated into
practical devices due to the shortcomings of the electrode and electrolyte materials used in the
battery as well as an incomplete understanding of the chemical and electrochemical processes
involved in its operation. In Chapter 3 I discussed the strong effect of non-aqueous solvents on
the oxygen reduction reaction (ORR) electrochemistry in Li+-containing electrolytes.
22, 30, 32, 67, 71,
82 In that work a carbon microelectrode has been successfully employed to quantify oxygen
transport parameters and elucidate the influence of the Li salt on the reversibility of the ORR in
tetrabutylammonium (TBA) and lithium salt-containing electrolytes in dimethyl sulfoxide
(DMSO) .31, 36
It has become increasingly clear that the ORR in the non-aqueous Li-air battery is
solvent controlled29
with a secondary role of the Li salt through the solvates formed between the
solvent and the salt.83
The stability of the electrolyte solvent in contact with the O2 reduction products in the
non-aqueous Li-air battery plays a key role on the reversibility of the oxygen reduction reactions
(ORR). Organic carbonate solvents such as propylene carbonate (PC), ethylene carbonate (EC)
and diethyl carbonate (DEC) readily decompose through their reactions with the superoxide (O2-)
radicals formed as the ORR intermediate in these electrolyte media.65, 84, 85
Ethers are recognized
as relatively stable solvents without significant superoxide mediated decomposition.86
Ethers are
also important due to their high oxygen solubility and low to moderate dielectric constants
resulting in lower reactivity towards the superoxide ions. In this chapter, we present ORR
electrochemistry data gathered from electrolytes in, 1, 2-dimethoxyethane (DME) and

88
tetraethylene glycol dimethyl ether (TEGDME), ethers that have been studied as solvents for Li-
air batteries. Their low dielectric constants (DME, 7.07 and TEGDME, 7.79)87, 88
are important
as this property influences the wettability of the carbon cathode and provide better stability in the
presence of ORR products. Even though DME is a low boiling point solvent, its ability to form
well conductive electrolytes makes it an attractive representative medium to elucidate ORR
mechanism in ether-based electrolytes. TEGDME is especially desirable as a practical solvent
for Li-air batteries because of its low vapor pressure and other desirable properties as we stated
in our original reason for the selection of this solvent.32, 82, 89
In our previous publication on the utility of microelectrodes for Li-air battery diagnostics,
we presented a detailed analysis of the ORR in an electrolyte based on a high Donor Number
(Lewis basicity) solvent namely, DMSO (DN = 29 kcal/mole) .31
TEGDME and DME on the
other hand, are low Donor Number solvents (DN = 16.6 and 20 kcal/mole, respectively). It is our
expectation that with the microelectrode studies presented in this chapter together with the
previous work in DMSO, we would provide a fuller picture of the extent to which the electron
donor properties of the solvent and Li salt anion, as well as the transport of O2 in the electrolyte,
influence the mechanism and reversibility of the ORR in non-aqueous Li-air batteries. FT-IR
spectral data provided information on the structures of the electrolyte solutions to enable us to
correlate O2 electrochemistry with electrolyte properties.
4.2. Experimental
4.2.1. Materials
All tetrabutylammonium (TBA) salts (TBAPF6, TBACF3SO3, TBAN(CF3SO2)2,
TBAClO4) and lithium salts (LiPF6, LiCF3SO3, LiN(CF3SO2)2, LiClO4), battery grade, were
89
purchased from Sigma-Aldrich and were stored in an MBraun glove-box maintained under 0.5
ppm (H2O concetration) prior to use. An 11 µm diameter carbon disc microelectrode working
electrode purchased from BASi® and a Pt mesh counter electrode were used. A Ag/AgNO3
reference electrode was prepared as reported by Wain et al.68
using silver wire (99%) purchased
from Alfa Aesar. All the potentials in this chapter are reported with respect to the Li/Li+
scale
obtained using a conversion factor determined by measuring the potential of Ag/Ag+ reference
electrode versus a Li foil reference electrode in each electrolyte.
4.2.2. Cyclic Voltammetry
Cyclic voltammograms were recorded in argon saturated solutions to verify that the
electrolyte itself does not undergo any reaction within the electrochemical potential window of
interest. All the current densities reported in this chapter are referenced to the geometric surface
areas of the electrodes. Oxygen electrochemistry was recorded at the carbon microelectrode (5.5
µm electrode radius) in O2 saturated DME and TEGDME-based electrolytes. Current-time
transients were obtained in TBA/ DME salt electrolytes, by stepping the microelectrode potential
from a potential where there is no reaction to a potential where the reaction is diffusion limited.
Oxygen transport parameters were calculated using Cottrell plots obtained from these potential
jump experiments. Oxygen reduction electrochemistry was also performed in a series of Li salt-
based electrolytes (LiPF6, LiCF3SO3, LiN(CF3SO2)2 and LiClO4) in DME and in TEGDME.
Most of the cyclic voltammograms at the carbon microelectrode were recorded at a scan rate of
200 mV s-1
. This is a relatively high scan rate. However, charging currents are minimal at a
microelectrode and this allows us to record cyclic voltammograms at high scan rates at these
electrodes without sacrificing any electrochemical information. In fact, a high 200 mV s-1
scan
90
rate is preferred for studying electrochemical processes in Li+-based electrolytes in order to avoid
rapid passivation of the microelectrode surface by insoluble lithium oxide products.
4.2.3. RRDE Measurements
Electrochemical measurements were also obtained at a rotating ring disc electrode
(RRDE) in Li salt/ TEGDME electrolytes. The rotating ring disc consisted of a glassy carbon
working electrode and a gold ring secondary working electrode. The gold ring was set at a
positive potential where the oxidation of the lithium oxides produced from the reduction of O2 on
the carbon disc occurred.
Ring efficiency: Ring efficiency of the rotating ring disc electrode was determined as follows.
Ferrocene was oxidized in an argon-purged Li salt/ TEGDME solution where the ring potential
was set to a potential where the reduction of ferrocenium ion produced from the oxidation
reaction occurred. Ring efficiency was calculated from the ratio of the ring current to the disc
current. All electrochemical tests were carried out in a glove-box maintained at a humidity level
< 0.5 ppm.
4.2.4. Lithium-Air Cell Testing
Lithium-air full cells were constructed as previously reported30
using Li foil anodes and
KetjenBlack (EC300JD) or Vulcan XC-72R carbon porous cathodes, and microporous
polypropylene membrane separators. Discharged cathodes were analyzed by means of a Rigaku
X-ray diffractometer with the samples sealed in Kapton® polyimide film to identify the
discharge products.
4.2.5. Scanning Electron Microscopy (SEM)
91
Discharged Li-O2 cell cathodes were washed with acetonitrile solvent, dried and SEM images
were recorded on a Hitachi S-4900 instrument.
4.2.6. FT-IR Characterization
A series of electrolytes composed of Li salt solution in DME or TEGDME were analyzed
using a Bruker Vertex-70 FT-IR spectrometer.
4.3. Results and Discussion
Preliminary electrochemical data gathered in TBA salt/DME-based electrolytes at a
rotating disc electrode (RDE) showed that the ORR does not reach a limiting current within the
stable potential window of the electrolyte. This is because oxygen reduction reaction is
kinetically, not mass transport, limited in DME-based electrolytes. Therefore, it is impossible to
calculate the oxygen transport parameters with the aid of the RDE technique in these
electrolytes. However, efficient oxygen transport observed at a microelectrode can be useful to
obtain steady-state limiting current conditions. From these steady-state current-potential data at
the microelectrode, one can calculate oxygen transport parameters in these electrolytes which are
useful for the development of practical Li-air batteries.13, 34
The first part of this chapter details
our microelectrode studies in DME-based electrolytes. In the second part we extend the studies
to electrolytes in the high molecular weight ether, TEGDME. The TEGDME is a low volatile
solvent with a donor number of 16.6 kcal/mole, which following our original investigation22, 89, 90
has been studied as a Li-air battery electrolyte by many researchers.32, 82, 90-92
As we reported
previously, the electron donor property of a solvent influences the mechanism and reversibility
of the ORR in lithium salt-containing electrolytes through the Hard Soft Acid Base concept.22, 71
The quantitative effect of the Donor Number of the solvent on ORR can only be investigated in
92
the absence of Li ions which otherwise would complicate the analysis by passivating the
electrode surface with ORR products. However, oxygen transport properties and
electrochemistry in tetrabutylammonium salt (TBA salt)-containing TEGDME electrolytes, in
which passivation of the electrode surface does not occur, has not been satisfactorily performed
using a planar glassy carbon macrodisc electrodes due to the high viscosity and the associated
large iR drop and kinetic limitations of the ORR in the stable potential window of these
electrolytes. Electrochemistry on a microelectrode is able to overcome these limitations by
allowing us to study diffusion limited ORR in these electrolytes to determine oxygen transport
properties, as well as ORR kinetics and mechanisms.
4.3.1. Microelectrode Electrochemistry
A microelectrode has the unique advantage of efficient transport of electro-active species
to and from the electrode surface. This is demonstrated by the sigmoidal-shaped cyclic
voltammograms that we have observed31
in ferrocene solution in DMSO at scan rates as high as
500 mV s-1
. The diffusion controlled limiting current at a microdisc electrode is given by
equation 4.1.
In equation 4.1, Id is the diffusion limited current, F is the Faraday constant, A is the geometric
area of the electrode, n is the number of electrons, r is the electrode radius and D and C are
diffusion coefficient and solubility of the electroactive species, respectively.
We have also shown that the oxygen transport to a 5.5 μm radius microelectrode in
DMSO31
is approximately equal to the hydrodynamic transport of oxygen to a rotating disc
electrode at a speed of 25000 rpm. Ohmic drops originating from solution resistance are
𝐼𝑑 =4𝑛𝐹𝐴𝐷𝐶
𝜋𝑟= 4𝑛𝐹𝐷𝐶𝑟
[4.1]
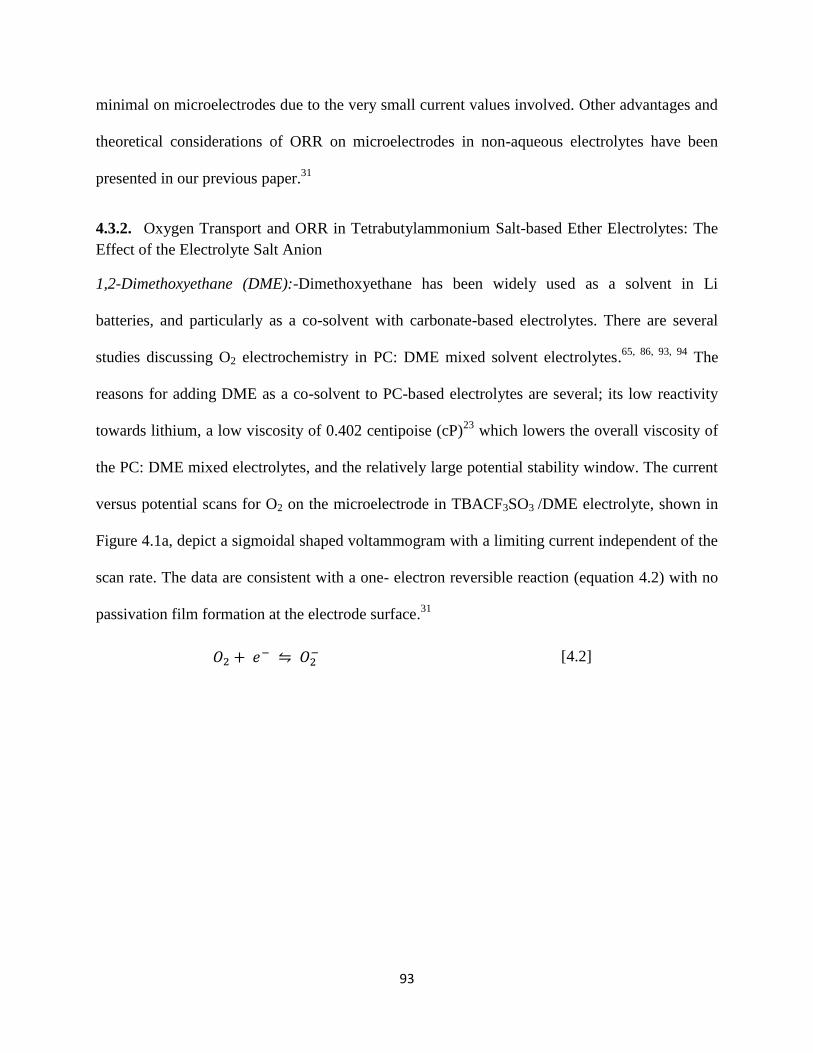
93
minimal on microelectrodes due to the very small current values involved. Other advantages and
theoretical considerations of ORR on microelectrodes in non-aqueous electrolytes have been
presented in our previous paper.31
4.3.2. Oxygen Transport and ORR in Tetrabutylammonium Salt-based Ether Electrolytes: The
Effect of the Electrolyte Salt Anion
1,2-Dimethoxyethane (DME):-Dimethoxyethane has been widely used as a solvent in Li
batteries, and particularly as a co-solvent with carbonate-based electrolytes. There are several
studies discussing O2 electrochemistry in PC: DME mixed solvent electrolytes.65, 86, 93, 94
The
reasons for adding DME as a co-solvent to PC-based electrolytes are several; its low reactivity
towards lithium, a low viscosity of 0.402 centipoise (cP)23
which lowers the overall viscosity of
the PC: DME mixed electrolytes, and the relatively large potential stability window. The current
versus potential scans for O2 on the microelectrode in TBACF3SO3 /DME electrolyte, shown in
Figure 4.1a, depict a sigmoidal shaped voltammogram with a limiting current independent of the
scan rate. The data are consistent with a one- electron reversible reaction (equation 4.2) with no
passivation film formation at the electrode surface.31
𝑂2 + 𝑒− ⇋ 𝑂2− [4.2]
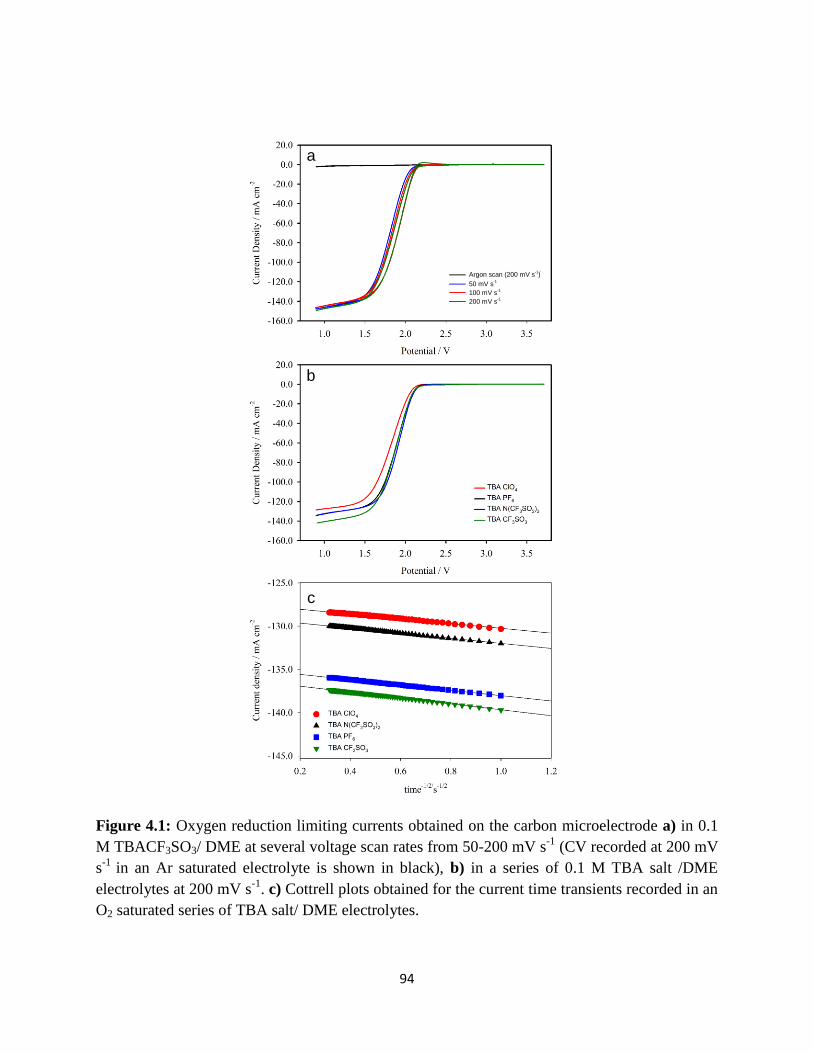
94
Figure 4.1: Oxygen reduction limiting currents obtained on the carbon microelectrode a) in 0.1
M TBACF3SO3/ DME at several voltage scan rates from 50-200 mV s-1
(CV recorded at 200 mV
s-1
in an Ar saturated electrolyte is shown in black), b) in a series of 0.1 M TBA salt /DME
electrolytes at 200 mV s-1
. c) Cottrell plots obtained for the current time transients recorded in an
O2 saturated series of TBA salt/ DME electrolytes.
a
b
c
Argon scan (200 mV s-1)
50 mV s-1
100 mV s-1
200 mV s-1
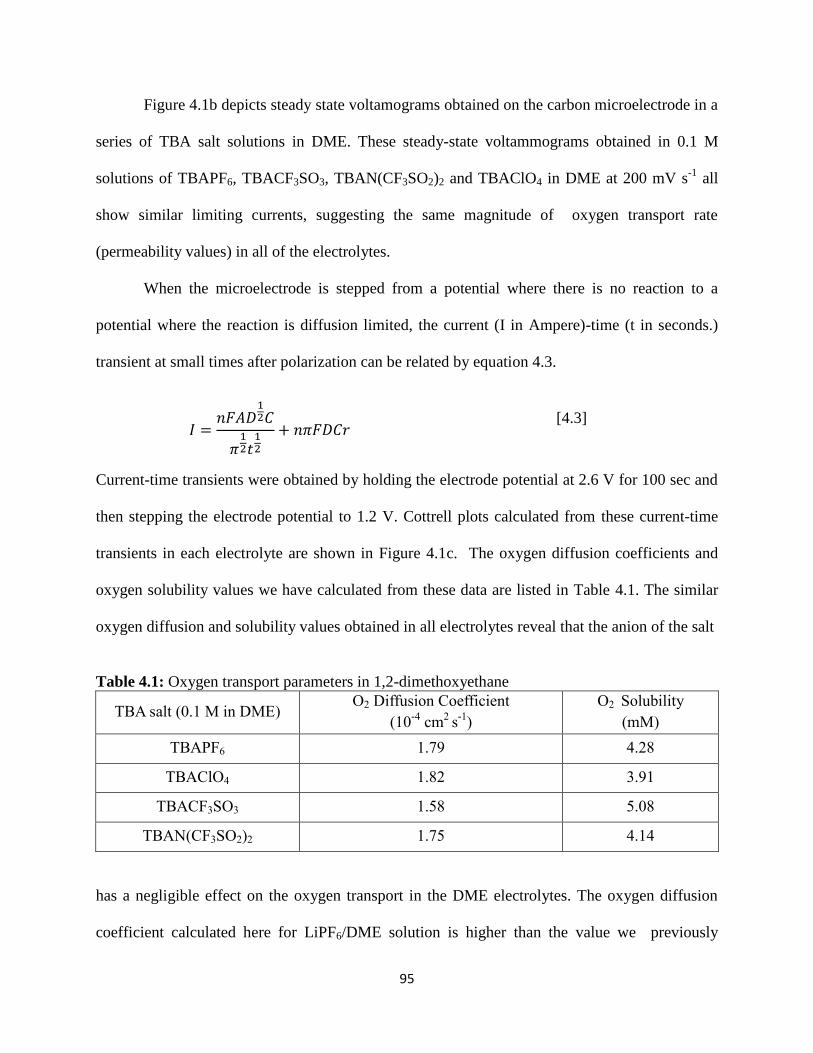
95
Figure 4.1b depicts steady state voltamograms obtained on the carbon microelectrode in a
series of TBA salt solutions in DME. These steady-state voltammograms obtained in 0.1 M
solutions of TBAPF6, TBACF3SO3, TBAN(CF3SO2)2 and TBAClO4 in DME at 200 mV s-1
all
show similar limiting currents, suggesting the same magnitude of oxygen transport rate
(permeability values) in all of the electrolytes.
When the microelectrode is stepped from a potential where there is no reaction to a
potential where the reaction is diffusion limited, the current (I in Ampere)-time (t in seconds.)
transient at small times after polarization can be related by equation 4.3.
Current-time transients were obtained by holding the electrode potential at 2.6 V for 100 sec and
then stepping the electrode potential to 1.2 V. Cottrell plots calculated from these current-time
transients in each electrolyte are shown in Figure 4.1c. The oxygen diffusion coefficients and
oxygen solubility values we have calculated from these data are listed in Table 4.1. The similar
oxygen diffusion and solubility values obtained in all electrolytes reveal that the anion of the salt
Table 4.1: Oxygen transport parameters in 1,2-dimethoxyethane
TBA salt (0.1 M in DME) O2 Diffusion Coefficient
(10-4
cm2
s-1
)
O2 Solubility
(mM)
TBAPF6 1.79 4.28
TBAClO4 1.82 3.91
TBACF3SO3 1.58 5.08
TBAN(CF3SO2)2 1.75 4.14
has a negligible effect on the oxygen transport in the DME electrolytes. The oxygen diffusion
coefficient calculated here for LiPF6/DME solution is higher than the value we previously
𝐼 =𝑛𝐹𝐴𝐷
12𝐶
𝜋12𝑡
12
+ 𝑛𝜋𝐹𝐷𝐶𝑟 [4.3]
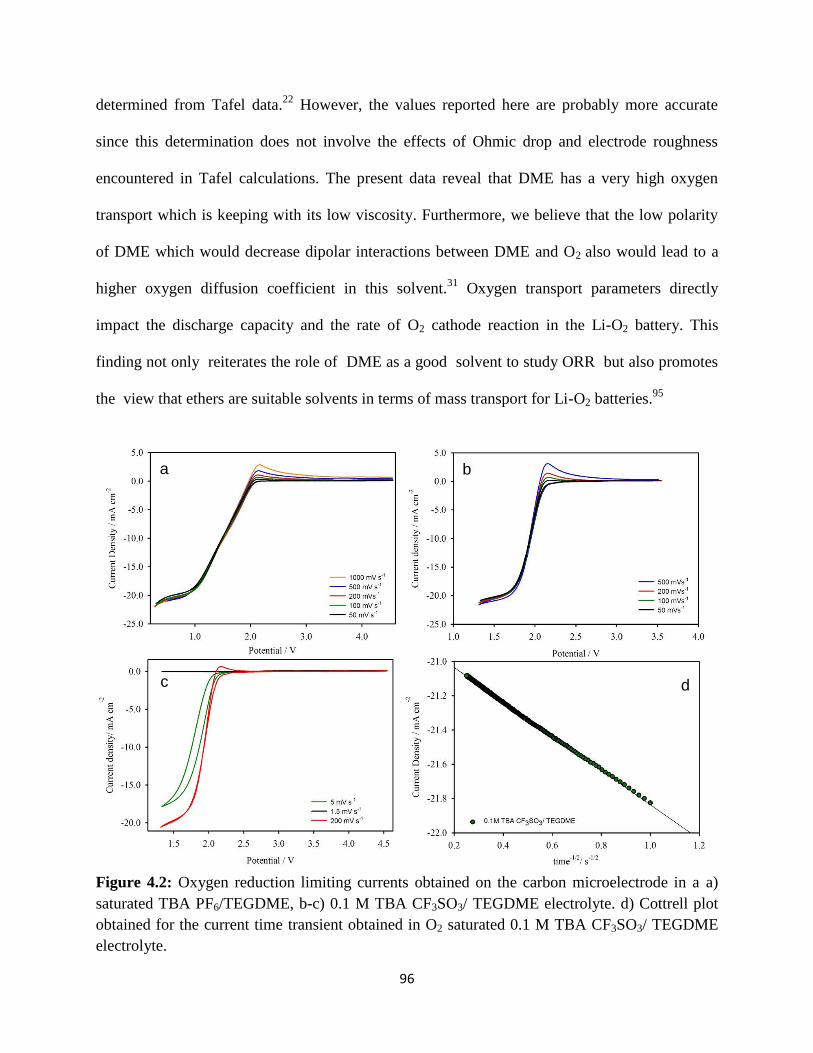
96
determined from Tafel data.22
However, the values reported here are probably more accurate
since this determination does not involve the effects of Ohmic drop and electrode roughness
encountered in Tafel calculations. The present data reveal that DME has a very high oxygen
transport which is keeping with its low viscosity. Furthermore, we believe that the low polarity
of DME which would decrease dipolar interactions between DME and O2 also would lead to a
higher oxygen diffusion coefficient in this solvent.31
Oxygen transport parameters directly
impact the discharge capacity and the rate of O2 cathode reaction in the Li-O2 battery. This
finding not only reiterates the role of DME as a good solvent to study ORR but also promotes
the view that ethers are suitable solvents in terms of mass transport for Li-O2 batteries.95
Figure 4.2: Oxygen reduction limiting currents obtained on the carbon microelectrode in a a)
saturated TBA PF6/TEGDME, b-c) 0.1 M TBA CF3SO3/ TEGDME electrolyte. d) Cottrell plot
obtained for the current time transient obtained in O2 saturated 0.1 M TBA CF3SO3/ TEGDME
electrolyte.
a b
c d
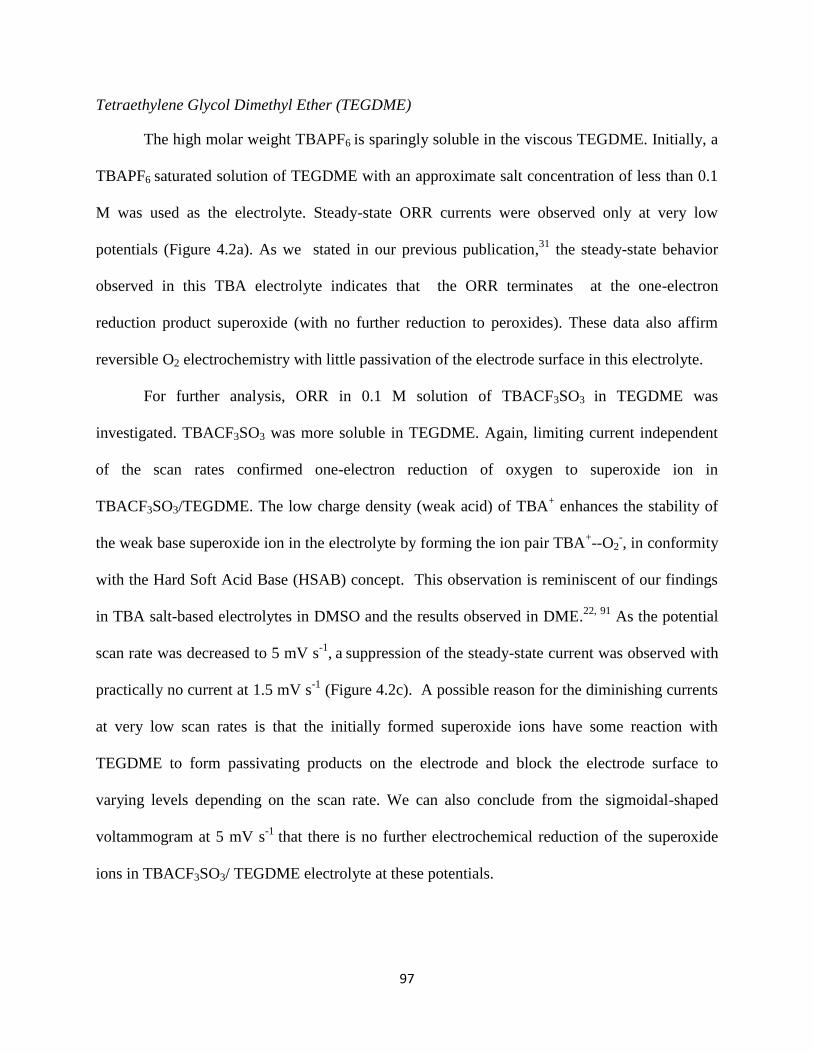
97
Tetraethylene Glycol Dimethyl Ether (TEGDME)
The high molar weight TBAPF6 is sparingly soluble in the viscous TEGDME. Initially, a
TBAPF6 saturated solution of TEGDME with an approximate salt concentration of less than 0.1
M was used as the electrolyte. Steady-state ORR currents were observed only at very low
potentials (Figure 4.2a). As we stated in our previous publication,31
the steady-state behavior
observed in this TBA electrolyte indicates that the ORR terminates at the one-electron
reduction product superoxide (with no further reduction to peroxides). These data also affirm
reversible O2 electrochemistry with little passivation of the electrode surface in this electrolyte.
For further analysis, ORR in 0.1 M solution of TBACF3SO3 in TEGDME was
investigated. TBACF3SO3 was more soluble in TEGDME. Again, limiting current independent
of the scan rates confirmed one-electron reduction of oxygen to superoxide ion in
TBACF3SO3/TEGDME. The low charge density (weak acid) of TBA+ enhances the stability of
the weak base superoxide ion in the electrolyte by forming the ion pair TBA+--O2
-, in conformity
with the Hard Soft Acid Base (HSAB) concept. This observation is reminiscent of our findings
in TBA salt-based electrolytes in DMSO and the results observed in DME.22, 91
As the potential
scan rate was decreased to 5 mV s-1
, a
suppression of the steady-state current was observed with
practically no current at 1.5 mV s-1
(Figure 4.2c). A possible reason for the diminishing currents
at very low scan rates is that the initially formed superoxide ions have some reaction with
TEGDME to form passivating products on the electrode and block the electrode surface to
varying levels depending on the scan rate. We can also conclude from the sigmoidal-shaped
voltammogram at 5 mV s-1
that there is no further electrochemical reduction of the superoxide
ions in TBACF3SO3/ TEGDME electrolyte at these potentials.
98
Oxygen diffusion rate and solubility in TBACF3SO3/TEGDME were calculated using the
Cottrell plot (equation 4.3, Figure 4.2d) obtained from chronoamperometric current-time
transients.13, 31
Oxygen solubility was found to be 3.5 mM and the oxygen diffusion coefficient
was calculated to be 3.5x10⁻⁵
cm2
s-1
. The oxygen solubility value is in agreement with that we
previously reported for LiPF6/TEGDME electrolyte.22
The oxygen diffusivity determined in this
work is considerably higher than what was previously reported in 0.1 M LiPF6/TEGDME.22
However, the theoretical ORR limiting current calculated from equation 4.1 using the diffusivity
and solubility values determined in this study is in agreement with the observed ORR limiting
current in this electrolyte. Therefore, we conclude that the oxygen diffusivity in
TBACF3SO3/TEGDME electrolyte is higher than the previously determined value in
LiPF6/TEGDME.
99
Figure 4.3: a) current-voltage data obtained on the carbon microelectrode in 0.1 M TBAPF6/
DME (red), and 0.1 M LiPF6/ DME (blue). b) Scan rate dependent cyclic voltammograms
obtained on the carbon microelectrode in 0.1 M LiPF6/ DME(continuously recorded second CV
at 200 mV s-1
is shown as a black dotted line, c) Comparison of anodic current-potential response
on the microelectrode with different cathodic potential limits at 200 mV s-1
.
Although the actual Li salt concentration in the electrolytes used in Li-O2 batteries is much
higher than the 0.1M TBA salt solutions we used in the O2 transport measurements, we believe
a
b
c
100
that the transport data from the dilute TBA salt solutions can be used to project O2 transport in
the 1M solutions in the Li-air battery. This is because the motion of the neutral O2 molecule in
the electrolyte is minimally affected by the ionic environment.
4.3.3. ORR in Li Salt Solutions in 1,2-Dimethoxyethane (DME) and Tetraethylene Glycol
Dimethyl Ether (TEGDME)
Li Salt Solutions in DME–based Electrolytes
Microelectrode voltammograms for ORR in Li salt/ DME solutions showed peak-shaped
behavior. As we discussed before31
microelectrode response can deviate from the expected
steady-state behavior observed for O2 in TBAPF6/DME (Figure 4.1a), due to two main reasons:
i) the electrostatic repulsion of the species being reduced at the commencement of the second
reduction reaction of the initial ORR product, i.e, reduction of O2- to O2
2- (equation 4.4)
and ii) from passivation of the electrode surface by the ORR product(s), e.g; Li2O2. Bell shaped
oxygen reduction currents in Li salt/DME solutions (Figure 4.3a (blue) and Figure 4.3b) suggest
that further electrochemical reduction of the initially formed superoxide ion (O2-) to peroxide
(O22-
) occurs at lower potentials31
along with electrode passivation by the deposition of this
product on the electrode surface. As a test of the cyclability of the ORR/OER processes, we
repeated the CV in 0.1 M LiPF6/DME at 200 mV s-1
(Figure 4.3b – red (200 mV s-1
) and it
showed zero reduction current in the second cycle (Figure 4.3b – black dotted line), which was
surprising considering the very low columbic efficiency (zero anodic current) in the first cycle.
The latter behavior on a microelectrode is usually indicative of solubility of the ORR products31
.
Figure 4.3a reveals a significantly smaller peak current in LiPF6/DME than the steady state
current seen in TBAPF6/DME. This contrasts with our previous obervation in DMSO-based
𝑂2− + 𝑒− → 𝑂2
2− [4.4]

101
electrolytes in which ORR in TBA and Li salt-containing solutions showed similar limiting or
peak currents.
Figure 4.4: Cyclic voltammograms recorded at the 11 µm carbon electrode in O2 saturated
electrolytes. a) Anodic response in LiCF3SO3/DME at different cathodic limiting potentials. b)
Cyclability of the ORR/OER in LiCF3SO3/DME, c) Scan rate dependent ORR/OER in
LiCF3SO3/DME.
a
b
c
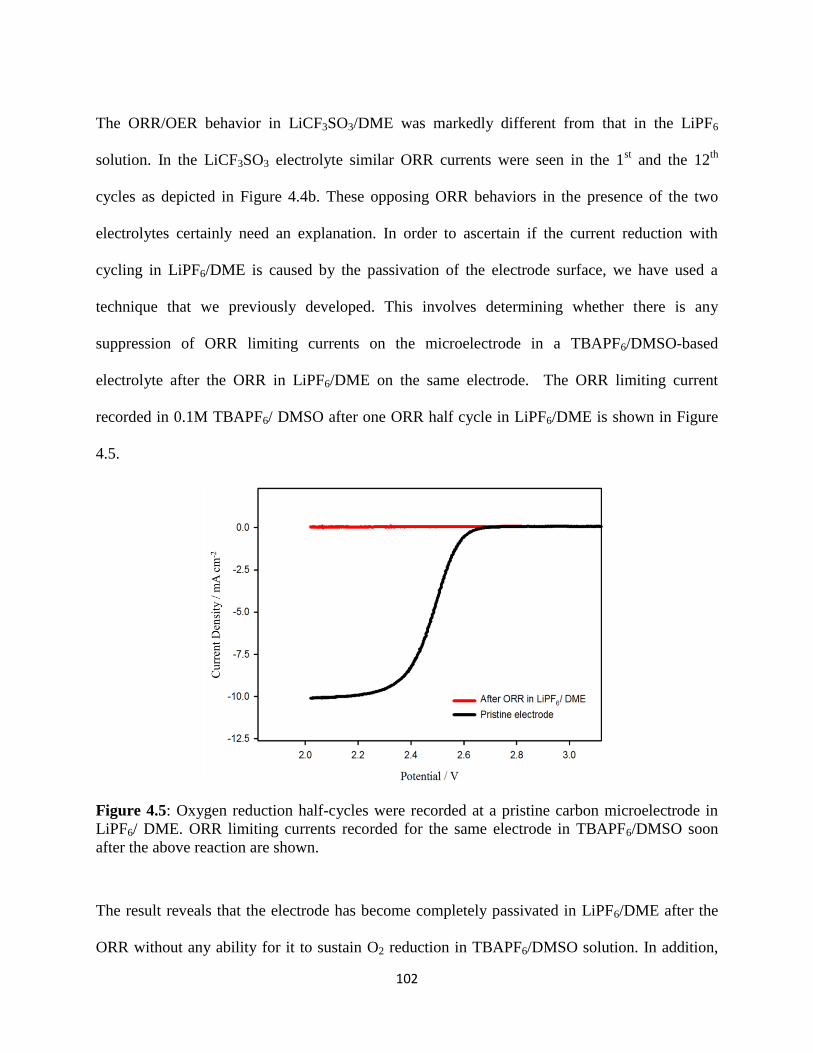
102
The ORR/OER behavior in LiCF3SO3/DME was markedly different from that in the LiPF6
solution. In the LiCF3SO3 electrolyte similar ORR currents were seen in the 1st and the 12
th
cycles as depicted in Figure 4.4b. These opposing ORR behaviors in the presence of the two
electrolytes certainly need an explanation. In order to ascertain if the current reduction with
cycling in LiPF6/DME is caused by the passivation of the electrode surface, we have used a
technique that we previously developed. This involves determining whether there is any
suppression of ORR limiting currents on the microelectrode in a TBAPF6/DMSO-based
electrolyte after the ORR in LiPF6/DME on the same electrode. The ORR limiting current
recorded in 0.1M TBAPF6/ DMSO after one ORR half cycle in LiPF6/DME is shown in Figure
4.5.
Figure 4.5: Oxygen reduction half-cycles were recorded at a pristine carbon microelectrode in
LiPF6/ DME. ORR limiting currents recorded for the same electrode in TBAPF6/DMSO soon
after the above reaction are shown.
The result reveals that the electrode has become completely passivated in LiPF6/DME after the
ORR without any ability for it to sustain O2 reduction in TBAPF6/DMSO solution. In addition,
103
the fact that the Columbic efficiency of the reaction in LiPF6/DME did not improve by limiting
the cathodic potential to 2.0 V suggests that the electrode passivation occurs from the beginning
of ORR at higher potentials, most probably by the chemical decomposition of the initially
formed lithium superoxide to insoluble Li2O2 (Figure 4.3c) as depicted in equation 4.5.
The high degree of passivation in LiPF6-based electrolyte suggests that the peak shape of the CV
is the result of electrode passivation in addition to migration- diffusion control of the first
reduction product.
The information which can be obtained from the voltammograms recorded in LiPF6/
DME is limited due to the instant passivation of the electrode surface during the first half-cycle
of the ORR. Therefore, further analysis of the DME-based electrolyte system was carried out in
0.1 M LiCF3SO3/DME. Figure 4.4a shows oxygen reduction reaction electrochemistry recorded
in this electrolyte for different cathodic limits at the sweep rate of 200 mV s-1
. A small shoulder
peak appeared around 2.2 V in the reduction scan (Figure 4.4c). However, when the cathodic
scan was limited to 2.12 V, there was no significant response observed in the anodic scan. This,
along with the improved cyclability of the ORR/OER processes in this electrolyte implies that
the reduction shoulder peak which appears around 2.2 V is probably from the initial one-electron
reduction of the O2 to superoxide. It should be noted that the current peak in LiCF3SO3/DME
appears at slightly lower potentials than in LiPF6/DME.
Oxygen Electrochemistry in LiPF6 and LiCF3SO3 Solutions in TEGDME
The voltammograms for oxygen reduction reactions at a carbon microelectrode in LiPF6/
TEGDME are shown in Figure 4.6a. We observed bell shaped oxygen reduction curves for a
range of scan rates, which as described above can be explained on the basis of the migration-
2𝐿𝑖𝑂2 → 𝐿𝑖2𝑂2 + 𝑂𝑧2 [4.5]
104
diffusion controlled currents originating from the initial one-electron O2 reduction product LiO2,
and its one-electron reduction to Li2O2.31, 66
Cyclic voltamograms recorded at different cathodic limiting potentials provided
interesting insights. First, an anodic peak appeared when the potential was scanned cathodically
down to 2.15 V, which grew when the cathodic limit was decreased. This is attributed to the
formation and re-oxidation of Li2O2. When the cathodic potential was limited to 1.7 V, another
anodic peak emerged which is attributed to the oxidation of the ORR product Li2O.
Continuous scanning of potentials between 1.5 V and 4.5 V in LiPF6/TEGDME
electrolyte showed rapid decaying of the ORR peak current density (Figure 4.6a). This
observation conforms with the above conclusion that Li2O is formed at low potentials. The
oxidation over-potential of crystalline lithium monoxide is expected to be high due to its lack of
electronic conductivity. A shift of the oxygen evolution onset potential to a more positive voltage
was observed when the electrode was scanned down to 1.5 V, which suggests the oxidation of
additional Li2O formed from the full reduction of Li2O2 to Li2O. Figure 4.6c shows cyclability
of the ORR/OER reactions in the potential range of 1.7 V to 3.7 V. In this case we have
restricted the anodic potential in order to prevent the full recovery of the electrode surface after
passivation with ORR products. The result is a gradual decrease in the activity of the electrode
with accumulated products which passivate the microelectrode.
We have also studied ORR in LiCF3SO3/TEGDME electrolyte. Bell shaped
voltammograms obtained in this electrolyte and the cyclic volatammograms obtained from
cycling in the in the voltage range of 1.5 V to 4.5 V are shown in Figure 4.7b. Unlike the
behavior in LiPF6/TEGDME electrolyte (Figure 4.7a),
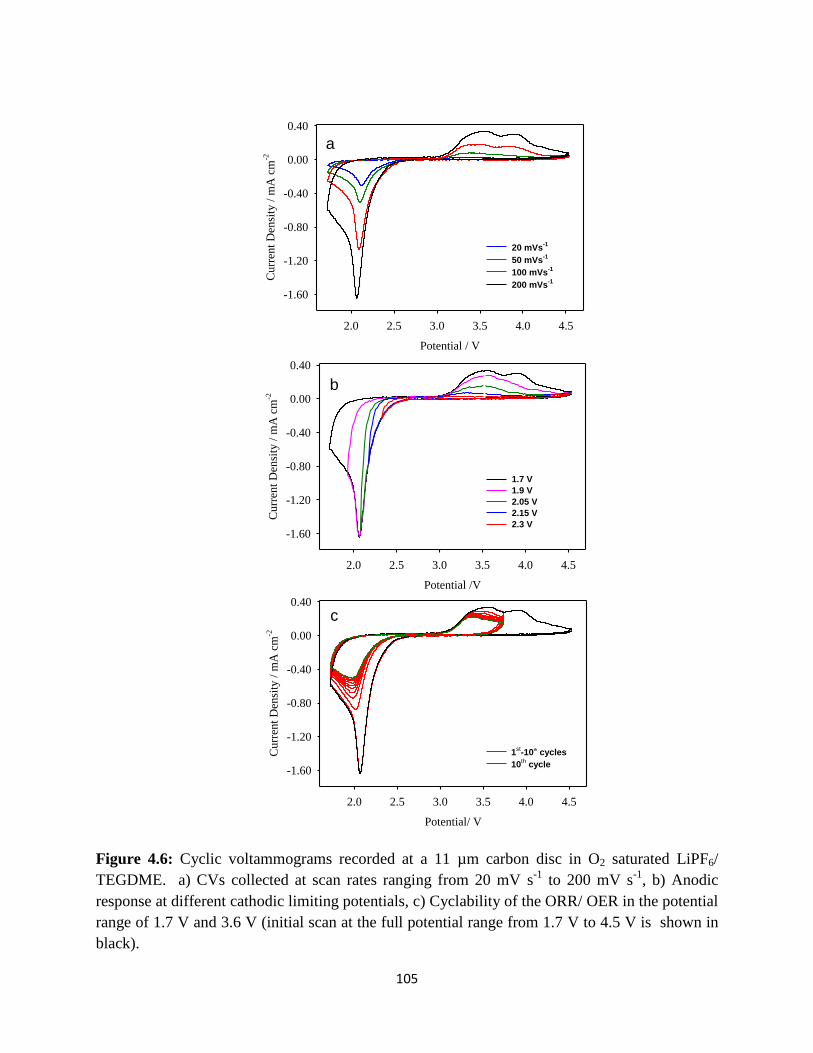
105
Potential / V
2.0 2.5 3.0 3.5 4.0 4.5
Cu
rren
t D
ensi
ty /
mA
cm
-2
-1.60
-1.20
-0.80
-0.40
0.00
0.40
20 mVs-1
50 mVs-1
100 mVs-1
200 mVs-1
Potential /V
2.0 2.5 3.0 3.5 4.0 4.5
Curr
ent
Den
sity
/ m
A c
m-2
-1.60
-1.20
-0.80
-0.40
0.00
0.40
1.7 V
1.9 V
2.05 V
2.15 V
2.3 V
Potential/ V
2.0 2.5 3.0 3.5 4.0 4.5
Cu
rren
t D
ensi
ty /
mA
cm
-2
-1.60
-1.20
-0.80
-0.40
0.00
0.40
1st-10
th
cycles
10th
cycle
A
B
C
Figure 4.6: Cyclic voltammograms recorded at a 11 µm carbon disc in O2 saturated LiPF6/
TEGDME. a) CVs collected at scan rates ranging from 20 mV s-1
to 200 mV s-1
, b) Anodic
response at different cathodic limiting potentials, c) Cyclability of the ORR/ OER in the potential
range of 1.7 V and 3.6 V (initial scan at the full potential range from 1.7 V to 4.5 V is shown in
black).
a
b
c
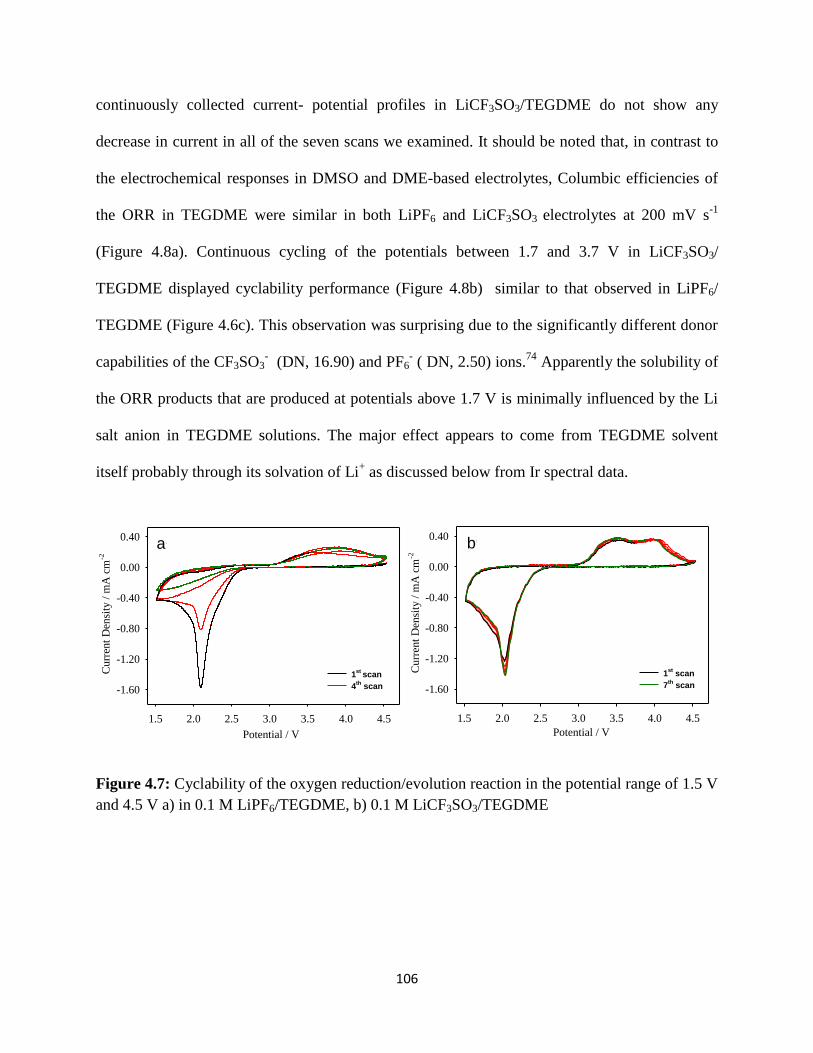
106
continuously collected current- potential profiles in LiCF3SO3/TEGDME do not show any
decrease in current in all of the seven scans we examined. It should be noted that, in contrast to
the electrochemical responses in DMSO and DME-based electrolytes, Columbic efficiencies of
the ORR in TEGDME were similar in both LiPF6 and LiCF3SO3 electrolytes at 200 mV s-1
(Figure 4.8a). Continuous cycling of the potentials between 1.7 and 3.7 V in LiCF3SO3/
TEGDME displayed cyclability performance (Figure 4.8b) similar to that observed in LiPF6/
TEGDME (Figure 4.6c). This observation was surprising due to the significantly different donor
capabilities of the CF3SO3- (DN, 16.90) and PF6
- ( DN, 2.50) ions.
74 Apparently the solubility of
the ORR products that are produced at potentials above 1.7 V is minimally influenced by the Li
salt anion in TEGDME solutions. The major effect appears to come from TEGDME solvent
itself probably through its solvation of Li+ as discussed below from Ir spectral data.
Potential / V
1.5 2.0 2.5 3.0 3.5 4.0 4.5
Curr
ent
Den
sity
/ m
A c
m-2
-1.60
-1.20
-0.80
-0.40
0.00
0.40
1st
scan
4th
scan
Potential / V
1.5 2.0 2.5 3.0 3.5 4.0 4.5
Curr
ent
Den
sity
/ m
A c
m-2
-1.60
-1.20
-0.80
-0.40
0.00
0.40
1st
scan
7th
scan
A B
Figure 4.7: Cyclability of the oxygen reduction/evolution reaction in the potential range of 1.5 V
and 4.5 V a) in 0.1 M LiPF6/TEGDME, b) 0.1 M LiCF3SO3/TEGDME
a b
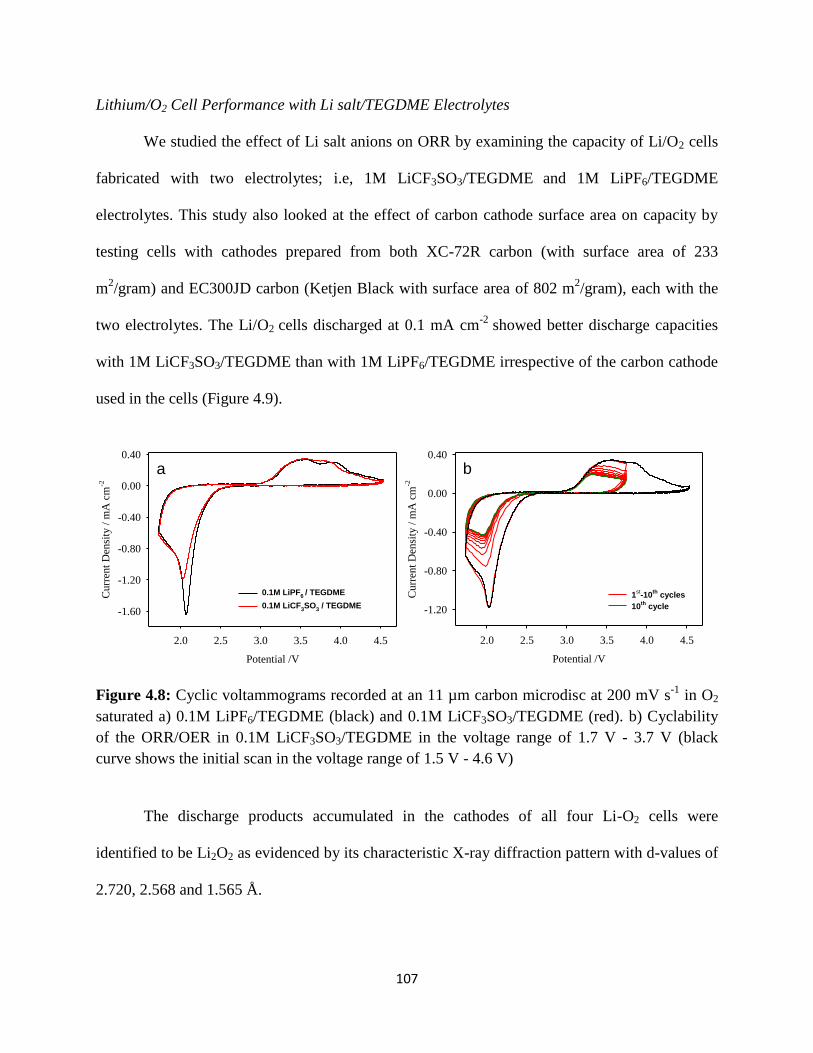
107
Lithium/O2 Cell Performance with Li salt/TEGDME Electrolytes
We studied the effect of Li salt anions on ORR by examining the capacity of Li/O2 cells
fabricated with two electrolytes; i.e, 1M LiCF3SO3/TEGDME and 1M LiPF6/TEGDME
electrolytes. This study also looked at the effect of carbon cathode surface area on capacity by
testing cells with cathodes prepared from both XC-72R carbon (with surface area of 233
m2/gram) and EC300JD carbon (Ketjen Black with surface area of 802 m
2/gram), each with the
two electrolytes. The Li/O2 cells discharged at 0.1 mA cm-2
showed better discharge capacities
with 1M LiCF3SO3/TEGDME than with 1M LiPF6/TEGDME irrespective of the carbon cathode
used in the cells (Figure 4.9).
Potential /V
2.0 2.5 3.0 3.5 4.0 4.5
Curr
ent
Den
sity
/ m
A c
m-2
-1.20
-0.80
-0.40
0.00
0.40
1st-10
th cycles
10th
cycle
Potential /V
2.0 2.5 3.0 3.5 4.0 4.5
Curr
ent
Den
sity
/ m
A c
m-2
-1.60
-1.20
-0.80
-0.40
0.00
0.40
0.1M LiPF6 / TEGDME
0.1M LiCF3SO
3 / TEGDME
A B
Figure 4.8: Cyclic voltammograms recorded at an 11 µm carbon microdisc at 200 mV s-1
in O2
saturated a) 0.1M LiPF6/TEGDME (black) and 0.1M LiCF3SO3/TEGDME (red). b) Cyclability
of the ORR/OER in 0.1M LiCF3SO3/TEGDME in the voltage range of 1.7 V - 3.7 V (black
curve shows the initial scan in the voltage range of 1.5 V - 4.6 V)
The discharge products accumulated in the cathodes of all four Li-O2 cells were
identified to be Li2O2 as evidenced by its characteristic X-ray diffraction pattern with d-values of
2.720, 2.568 and 1.565 Å.
a b
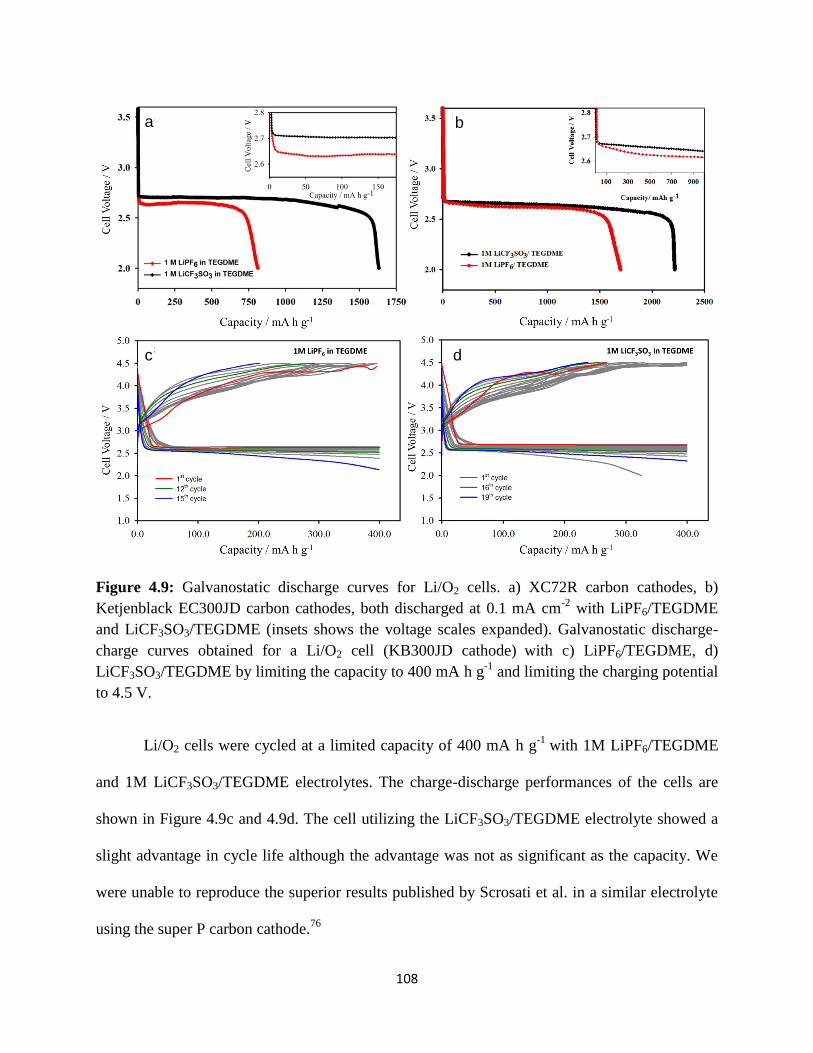
108
Figure 4.9: Galvanostatic discharge curves for Li/O2 cells. a) XC72R carbon cathodes, b)
Ketjenblack EC300JD carbon cathodes, both discharged at 0.1 mA cm-2
with LiPF6/TEGDME
and LiCF3SO3/TEGDME (insets shows the voltage scales expanded). Galvanostatic discharge-
charge curves obtained for a Li/O2 cell (KB300JD cathode) with c) LiPF6/TEGDME, d)
LiCF3SO3/TEGDME by limiting the capacity to 400 mA h g-1
and limiting the charging potential
to 4.5 V.
Li/O2 cells were cycled at a limited capacity of 400 mA h g-1
with 1M LiPF6/TEGDME
and 1M LiCF3SO3/TEGDME electrolytes. The charge-discharge performances of the cells are
shown in Figure 4.9c and 4.9d. The cell utilizing the LiCF3SO3/TEGDME electrolyte showed a
slight advantage in cycle life although the advantage was not as significant as the capacity. We
were unable to reproduce the superior results published by Scrosati et al. in a similar electrolyte
using the super P carbon cathode.76
a b
c d

109
The low cycle life of the Li-O2 cell is caused by many factors. First of all, the ORR
products, superoxide and peroxide, react slowly with the solvents to degrade the electrolyte and
to increase the cell’s internal resistance from the accumulation of products from these reactions
in the porous cathode. Another issue is the poor cycling efficiency of the Li anode due to
reactions of the plated Li with the electrolyte during charging. Further studies to determine the
contributions of each of these factors on the cycle life of the Li-air battery have to be performed
and appropriate solutions found for each.
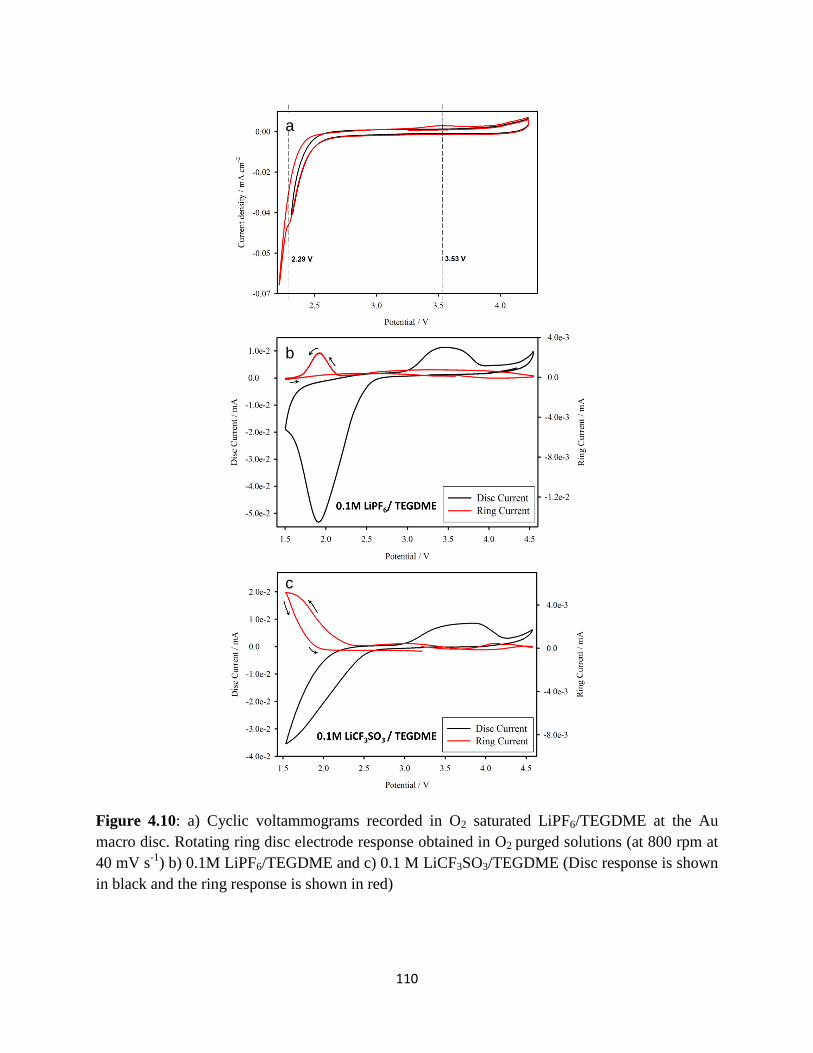
110
Figure 4.10: a) Cyclic voltammograms recorded in O2 saturated LiPF6/TEGDME at the Au
macro disc. Rotating ring disc electrode response obtained in O2 purged solutions (at 800 rpm at
40 mV s-1
) b) 0.1M LiPF6/TEGDME and c) 0.1 M LiCF3SO3/TEGDME (Disc response is shown
in black and the ring response is shown in red)
a
b
c
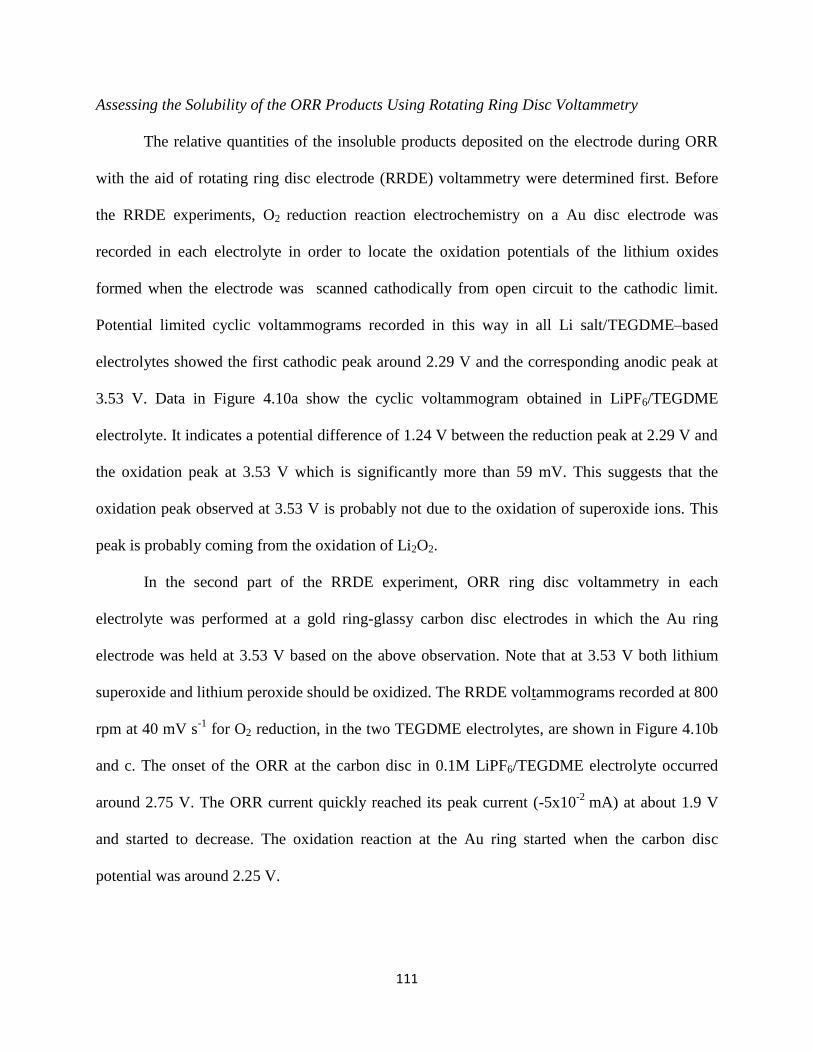
111
Assessing the Solubility of the ORR Products Using Rotating Ring Disc Voltammetry
The relative quantities of the insoluble products deposited on the electrode during ORR
with the aid of rotating ring disc electrode (RRDE) voltammetry were determined first. Before
the RRDE experiments, O2 reduction reaction electrochemistry on a Au disc electrode was
recorded in each electrolyte in order to locate the oxidation potentials of the lithium oxides
formed when the electrode was scanned cathodically from open circuit to the cathodic limit.
Potential limited cyclic voltammograms recorded in this way in all Li salt/TEGDME–based
electrolytes showed the first cathodic peak around 2.29 V and the corresponding anodic peak at
3.53 V. Data in Figure 4.10a show the cyclic voltammogram obtained in LiPF6/TEGDME
electrolyte. It indicates a potential difference of 1.24 V between the reduction peak at 2.29 V and
the oxidation peak at 3.53 V which is significantly more than 59 mV. This suggests that the
oxidation peak observed at 3.53 V is probably not due to the oxidation of superoxide ions. This
peak is probably coming from the oxidation of Li2O2.
In the second part of the RRDE experiment, ORR ring disc voltammetry in each
electrolyte was performed at a gold ring-glassy carbon disc electrodes in which the Au ring
electrode was held at 3.53 V based on the above observation. Note that at 3.53 V both lithium
superoxide and lithium peroxide should be oxidized. The RRDE voltammograms recorded at 800
rpm at 40 mV s-1
for O2 reduction, in the two TEGDME electrolytes, are shown in Figure 4.10b
and c. The onset of the ORR at the carbon disc in 0.1M LiPF6/TEGDME electrolyte occurred
around 2.75 V. The ORR current quickly reached its peak current (-5x10⁻²
mA) at about 1.9 V
and started to decrease. The oxidation reaction at the Au ring started when the carbon disc
potential was around 2.25 V.
112
Figure 4.11: FT-IR spectra for Li salt solutions in DME for various salt concentrations. a)
LiPF6/DME (peak position of the solvent C-O-C vibration is shown by a dotted line at 1090 cm-
1), b) LiCF3SO3/DME (peak position of the asymmetric stretching vibrations of the ion paired
sulfonyl groups are shown by dotted lines at 1260 and 1300 cm-1
)
a
b
113
The ORR in LiCF3SO3/TEGDME electrolyte started at 2.75 V and the current magnitude
continuously increased up to -3.5x10⁻²
mA remaining steady above 1.5 V. The oxidation reaction
at the Au ring in this electrolyte started when the carbon disc was around 2.5 V. In
LiCF3SO3/TEGDME, the ring current starts soon after the commencement of the ORR at the
carbon disc. In other words superoxide formation at the carbon disc coincides with the
emergence of the oxidation current at the Au ring. This indicates that a significant amount of
superoxide ions are contributing to the oxidation current at the Au ring in LiCF3SO3/TEGDME.
On the other hand, the oxidation current at the Au ring lags the ORR current at the carbon disc in
LiPF6/TEGDME electrolyte.
This information provides an insight on the stability of the superoxide ions in the two
different electrolytes. The superoxide ions in the LiCF3SO3-based electrolyte appear to have
longer lifetimes and are readily transferred to the Au ring where they are oxidized. On the other
hand, the superoxide ions in the LiPF6 -based electrolyte appear to be less stable and are quickly
decomposed to peroxide ions at the disc before being transferred to the ring where they are
oxidized. The peroxide ions not only requires a larger oxidation over-potential, but also has a
lower diffusion coefficient than the superoxide ions, both of which are contributing to the
observed trend in ring current in PF6- -based electrolyte.
Oxygen Electrochemistry in Other Li salt/TEGDME Electrolytes
Oxygen electrochemistry was also recorded in two other Li-containing electrolytes
namely, LiClO4 and LiN(SO2CF3)2 (LiTFSI).96
Similar bell shaped electrochemistry was
observed in both these electrolytes suggesting the same overall ORR processes as we discussed
above. Rotating ring disc response obtained suggested that electrochemistry in both LiClO4 and
LiN(CF3SO2)2/TEGDME are similar to that observed in the LiPF6/TEGDME system. It appears
114
that even though sulfonyl oxygen atoms are present in the N(CF3SO2)2- (TFSI) anion, the
electron density is delocalized throughout this anion providing it with low donor properties
than that in the CF3SO3- anion. As a result LiN(CF3SO2)2 behaves more like LiPF6.
4.3.4 The Impact of the Structure-Property Characteristics of CF3SO3- on ORR in Ether
Electrolytes
The preceding data suggest that the higher capacity of the Li/O2 cell containing
LiCF3SO3/TEGDME electrolyte is related to the structure of the electrolyte. This is reasonable
considering that the initial ORR product superoxide (O2-) does not undergo chemical
decomposition to insoluble Li2O2 right away in this electrolyte. The superoxide, stabilized by
this electrolyte, is apparently more soluble (as evidenced by the RRDE results) and is swiftly
removed from the microelectrode surface by diffusion. The removal of the soluble superoxide
from the carbon electrode surface to the LiCF3SO3/TEGDME electrolyte bulk in the porous
electrode maintains the electrode surface less passivated and, as a result the electrode has higher
activity to yield higher capacity in Li/O2 cells. In order to characterize the structure of the
electrolytes, the FT-IR spectra of Li salt solutions in DME and TEGDME were recorded and the
data discussed below support this conclusion.
FT-IR Spectral Characterization of Electrolyte Structures
FT-IR spectra of 1 M LiPF6 and 1 M LiCF3SO3 in DME and TEGDME recorded from
550 cm-1
to 2000 cm-1
are shown in Figure 4.11 and Figure 4.12 respectively. The vibrational
absorption peak for the PF6- ion is observed at around 840 cm
-1. The symmetric stretching peak
of the ether oxygen (H3C-O-CH-) linkage appears at about 1120 cm-1
. As more LiPF6 is added to
the LiPF6/DME a shoulder peak appears at a lower frequency of 1090 cm-1
. With increasing
concentration of LiPF6 in DME, the peak at 1120cm-1
completely disappears and when the LiPF6
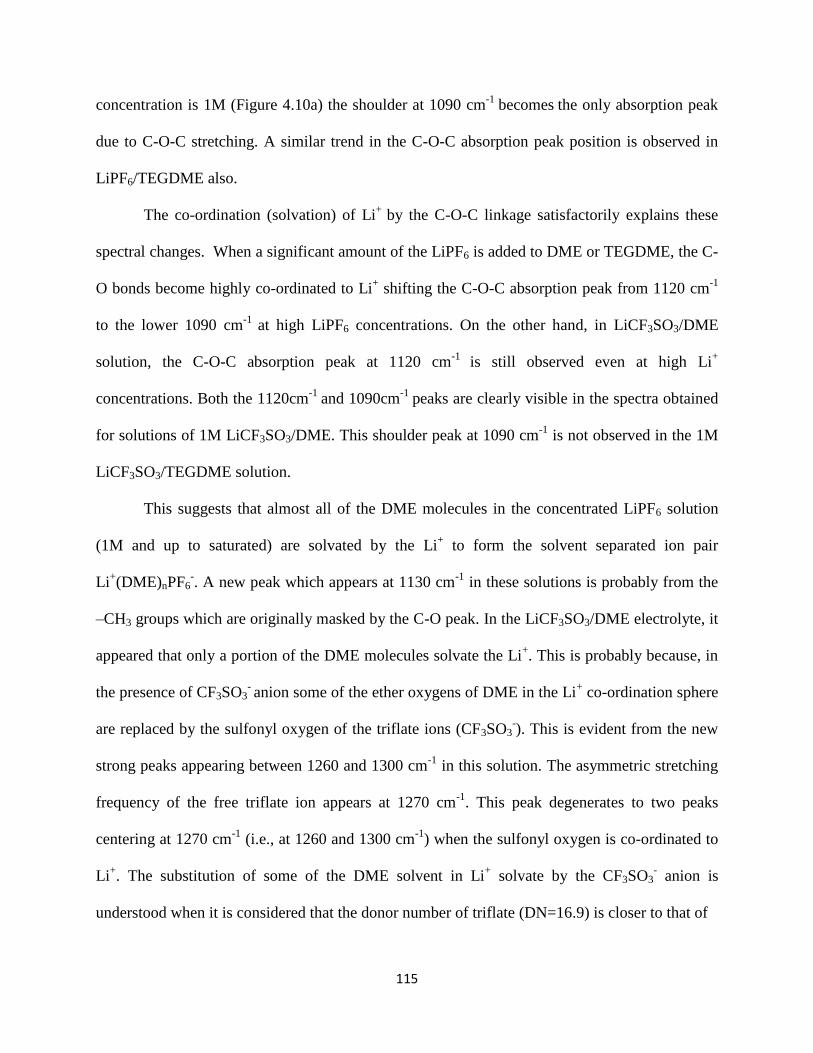
115
concentration is 1M (Figure 4.10a) the shoulder at 1090 cm-1
becomes the only absorption peak
due to C-O-C stretching. A similar trend in the C-O-C absorption peak position is observed in
LiPF6/TEGDME also.
The co-ordination (solvation) of Li+
by the C-O-C linkage satisfactorily explains these
spectral changes. When a significant amount of the LiPF6 is added to DME or TEGDME, the C-
O bonds become highly co-ordinated to Li+ shifting the C-O-C absorption peak from 1120 cm
-1
to the lower 1090 cm-1
at high LiPF6 concentrations. On the other hand, in LiCF3SO3/DME
solution, the C-O-C absorption peak at 1120 cm-1
is still observed even at high Li+
concentrations. Both the 1120cm-1
and 1090cm-1
peaks are clearly visible in the spectra obtained
for solutions of 1M LiCF3SO3/DME. This shoulder peak at 1090 cm-1
is not observed in the 1M
LiCF3SO3/TEGDME solution.
This suggests that almost all of the DME molecules in the concentrated LiPF6 solution
(1M and up to saturated) are solvated by the Li+ to form the solvent separated ion pair
Li+(DME)nPF6
-. A new peak which appears at 1130 cm
-1 in these solutions is probably from the
–CH3 groups which are originally masked by the C-O peak. In the LiCF3SO3/DME electrolyte, it
appeared that only a portion of the DME molecules solvate the Li+. This is probably because, in
the presence of CF3SO3- anion some of the ether oxygens of DME in the Li
+ co-ordination sphere
are replaced by the sulfonyl oxygen of the triflate ions (CF3SO3-). This is evident from the new
strong peaks appearing between 1260 and 1300 cm-1
in this solution. The asymmetric stretching
frequency of the free triflate ion appears at 1270 cm-1
. This peak degenerates to two peaks
centering at 1270 cm-1
(i.e., at 1260 and 1300 cm-1
) when the sulfonyl oxygen is co-ordinated to
Li+. The substitution of some of the DME solvent in Li
+ solvate by the CF3SO3
- anion is
understood when it is considered that the donor number of triflate (DN=16.9) is closer to that of
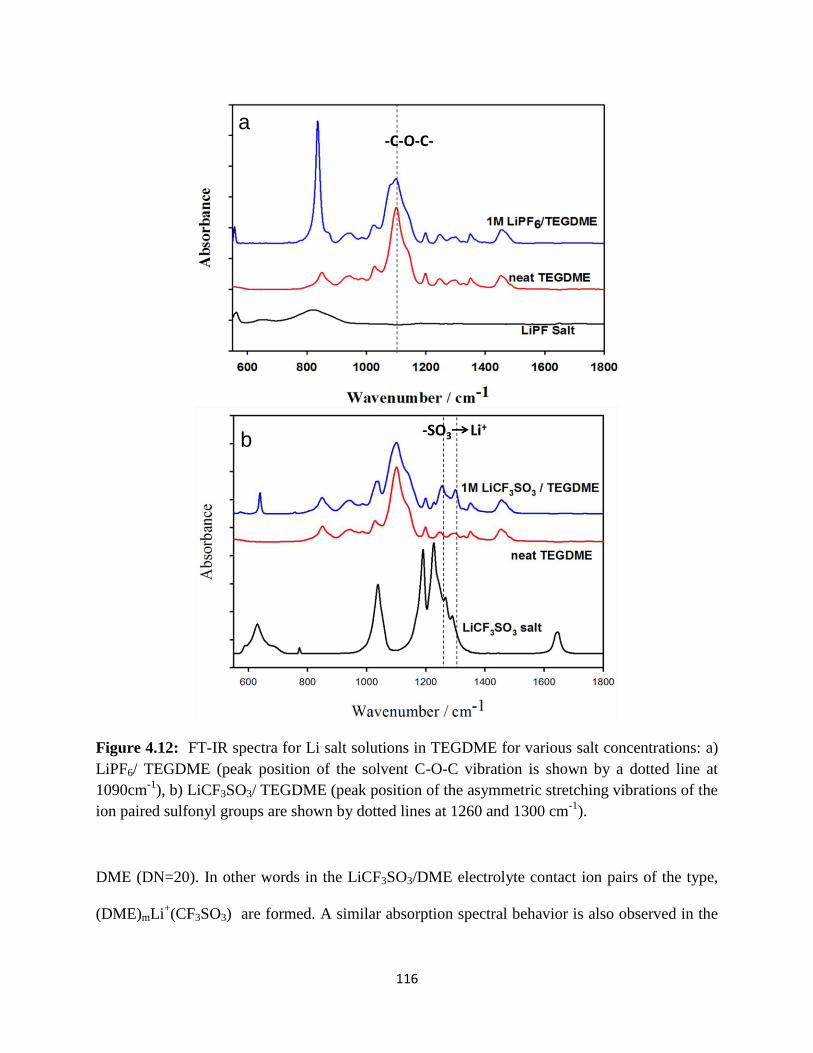
116
Figure 4.12: FT-IR spectra for Li salt solutions in TEGDME for various salt concentrations: a)
LiPF6/ TEGDME (peak position of the solvent C-O-C vibration is shown by a dotted line at
1090cm-1
), b) LiCF3SO3/ TEGDME (peak position of the asymmetric stretching vibrations of the
ion paired sulfonyl groups are shown by dotted lines at 1260 and 1300 cm-1
).
DME (DN=20). In other words in the LiCF3SO3/DME electrolyte contact ion pairs of the type,
(DME)mLi+(CF3SO3) are formed. A similar absorption spectral behavior is also observed in the
a
b
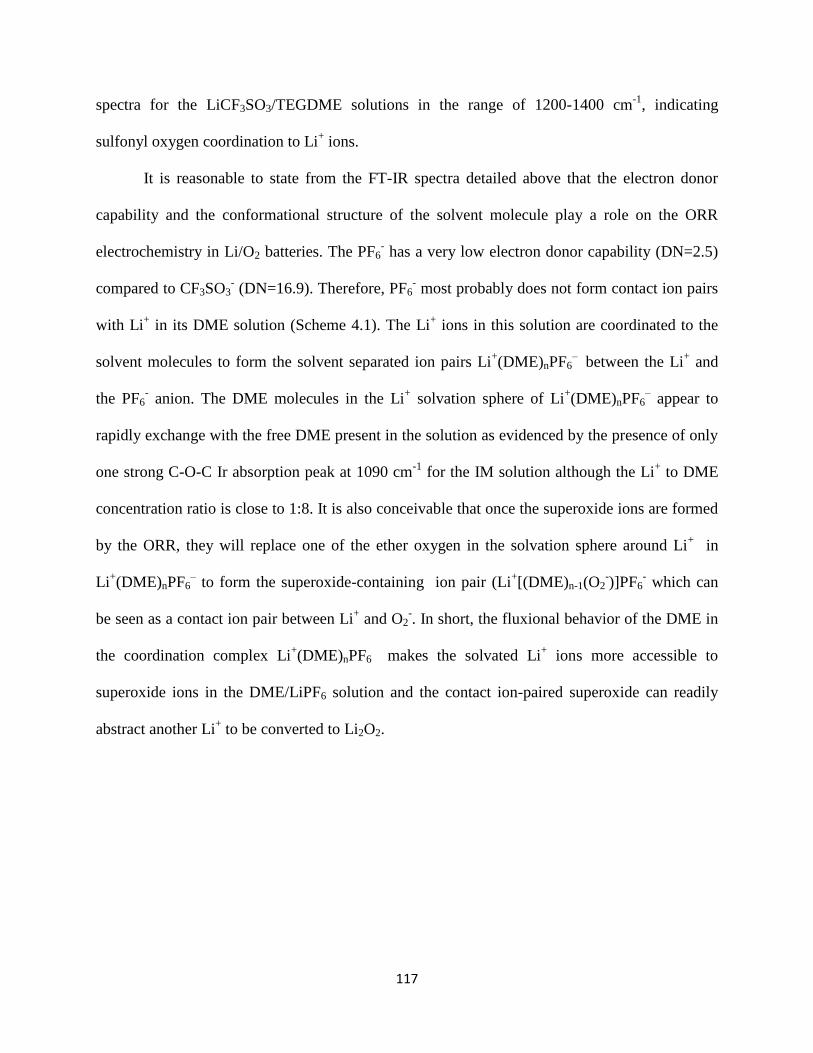
117
spectra for the LiCF3SO3/TEGDME solutions in the range of 1200-1400 cm-1
, indicating
sulfonyl oxygen coordination to Li+ ions.
It is reasonable to state from the FT-IR spectra detailed above that the electron donor
capability and the conformational structure of the solvent molecule play a role on the ORR
electrochemistry in Li/O2 batteries. The PF6- has a very low electron donor capability (DN=2.5)
compared to CF3SO3- (DN=16.9). Therefore, PF6
- most probably does not form contact ion pairs
with Li+ in its DME solution (Scheme 4.1). The Li
+ ions in this solution are coordinated to the
solvent molecules to form the solvent separated ion pairs Li+(DME)nPF6
– between the Li
+ and
the PF6- anion. The DME molecules in the Li
+ solvation sphere of Li
+(DME)nPF6
– appear to
rapidly exchange with the free DME present in the solution as evidenced by the presence of only
one strong C-O-C Ir absorption peak at 1090 cm-1
for the IM solution although the Li+ to DME
concentration ratio is close to 1:8. It is also conceivable that once the superoxide ions are formed
by the ORR, they will replace one of the ether oxygen in the solvation sphere around Li+ in
Li+(DME)nPF6
– to form the superoxide-containing ion pair (Li
+[(DME)n-1(O2
-)]PF6
- which can
be seen as a contact ion pair between Li+ and O2
-. In short, the fluxional behavior of the DME in
the coordination complex Li+(DME)nPF6
makes the solvated Li
+ ions more accessible to
superoxide ions in the DME/LiPF6 solution and the contact ion-paired superoxide can readily
abstract another Li+ to be converted to Li2O2.
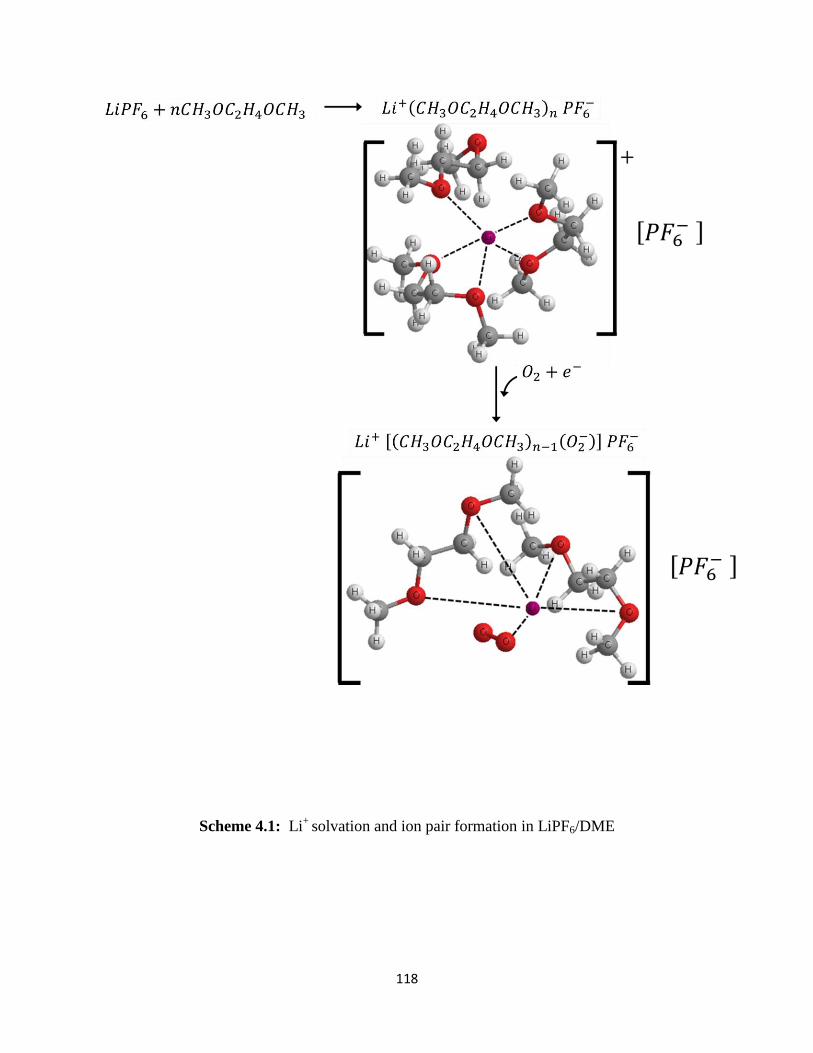
118
Scheme 4.1: Li+
solvation and ion pair formation in LiPF6/DME
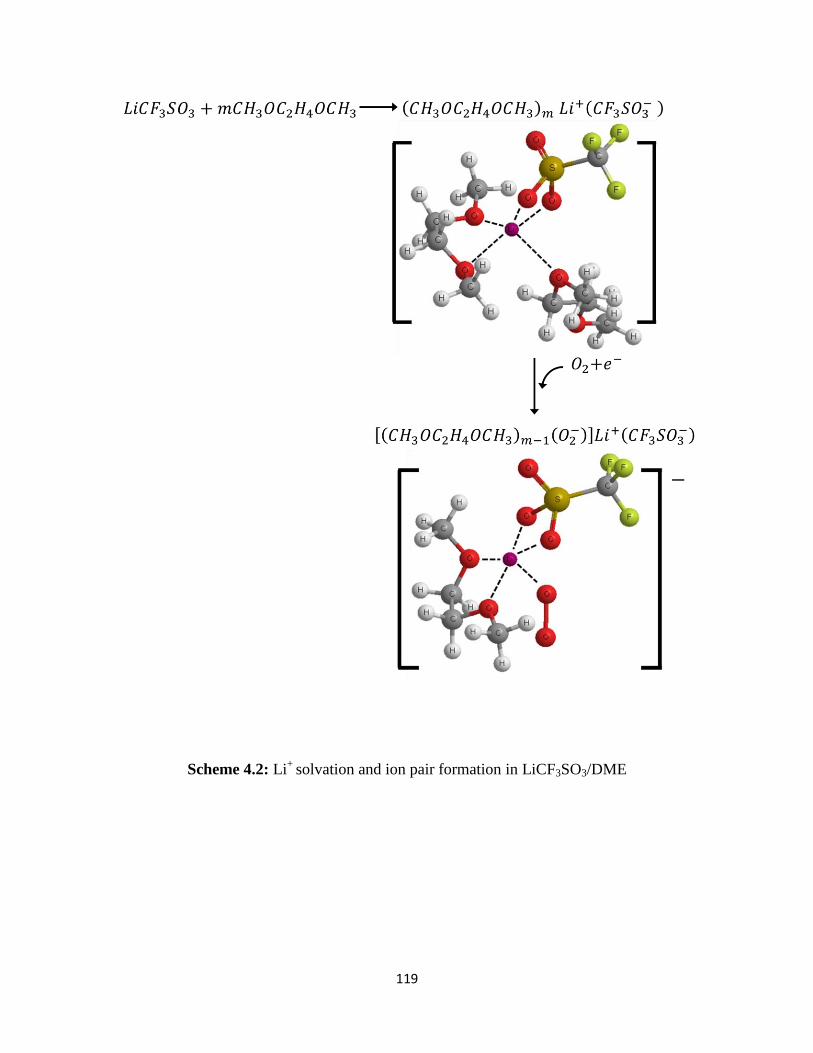
119
Scheme 4.2: Li+
solvation and ion pair formation in LiCF3SO3/DME
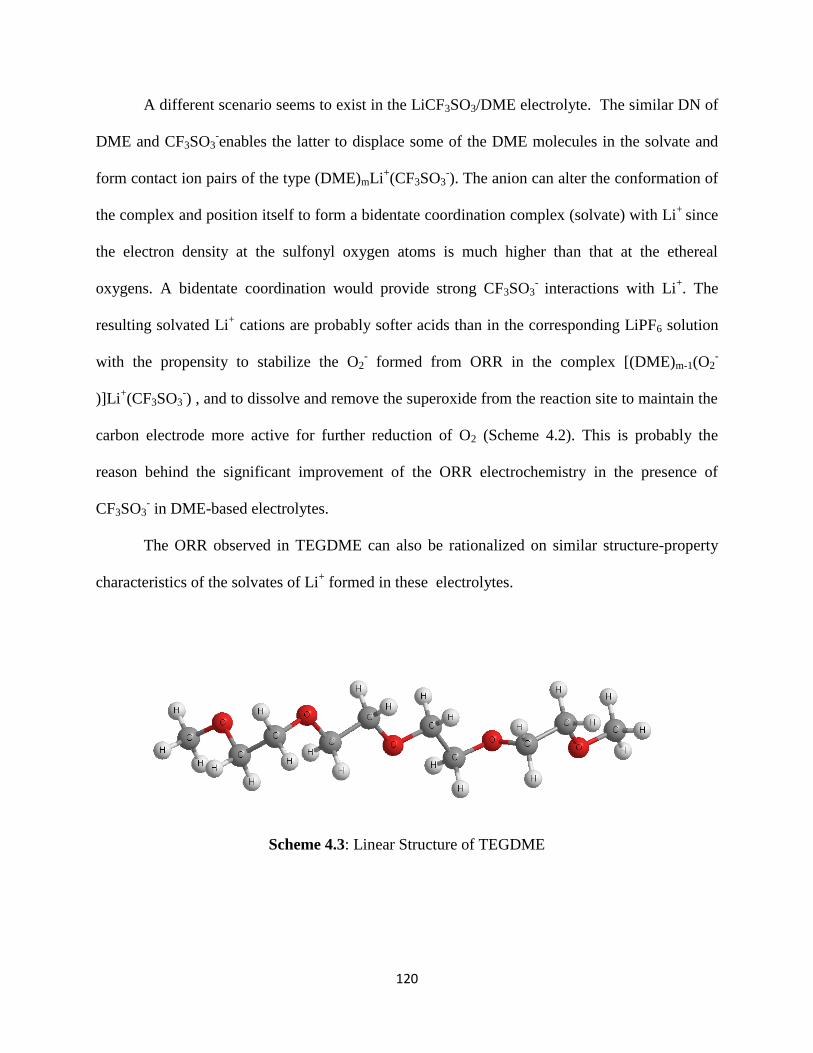
120
A different scenario seems to exist in the LiCF3SO3/DME electrolyte. The similar DN of
DME and CF3SO3-enables the latter to displace some of the DME molecules in the solvate and
form contact ion pairs of the type (DME)mLi+(CF3SO3
-). The anion can alter the conformation of
the complex and position itself to form a bidentate coordination complex (solvate) with Li+
since
the electron density at the sulfonyl oxygen atoms is much higher than that at the ethereal
oxygens. A bidentate coordination would provide strong CF3SO3-
interactions with Li+. The
resulting solvated Li+ cations are probably softer acids than in the corresponding LiPF6 solution
with the propensity to stabilize the O2- formed from ORR in the complex [(DME)m-1(O2
-
)]Li+(CF3SO3
-) , and to dissolve and remove the superoxide from the reaction site to maintain the
carbon electrode more active for further reduction of O2 (Scheme 4.2). This is probably the
reason behind the significant improvement of the ORR electrochemistry in the presence of
CF3SO3- in DME-based electrolytes.
The ORR observed in TEGDME can also be rationalized on similar structure-property
characteristics of the solvates of Li+ formed in these electrolytes.
Scheme 4.3: Linear Structure of TEGDME
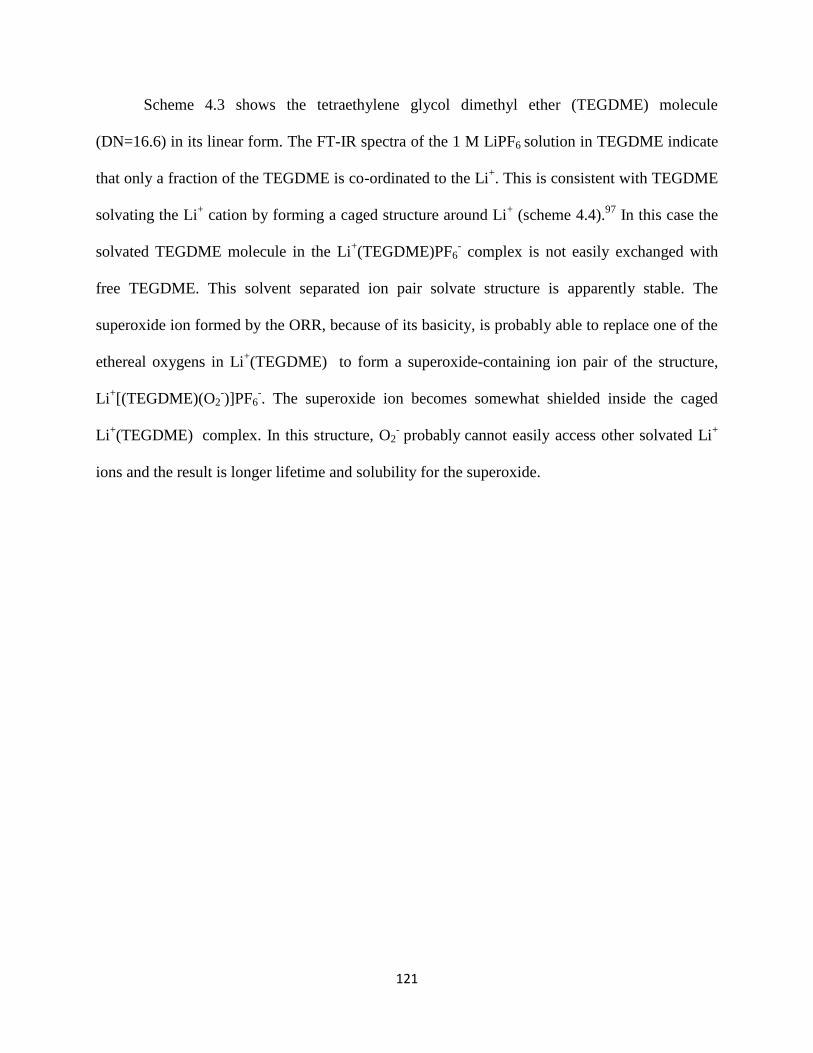
121
Scheme 4.3 shows the tetraethylene glycol dimethyl ether (TEGDME) molecule
(DN=16.6) in its linear form. The FT-IR spectra of the 1 M LiPF6 solution in TEGDME indicate
that only a fraction of the TEGDME is co-ordinated to the Li+. This is consistent with TEGDME
solvating the Li+ cation by forming a caged structure around Li
+ (scheme 4.4).
97 In this case the
solvated TEGDME molecule in the Li+(TEGDME)PF6
- complex is not easily exchanged with
free TEGDME. This solvent separated ion pair solvate structure is apparently stable. The
superoxide ion formed by the ORR, because of its basicity, is probably able to replace one of the
ethereal oxygens in Li+(TEGDME) to form a superoxide-containing ion pair of the structure,
Li+[(TEGDME)(O2
-)]PF6
-. The superoxide ion becomes somewhat shielded inside the caged
Li+(TEGDME)
complex. In this structure, O2
- probably cannot easily access other solvated Li
+
ions and the result is longer lifetime and solubility for the superoxide.
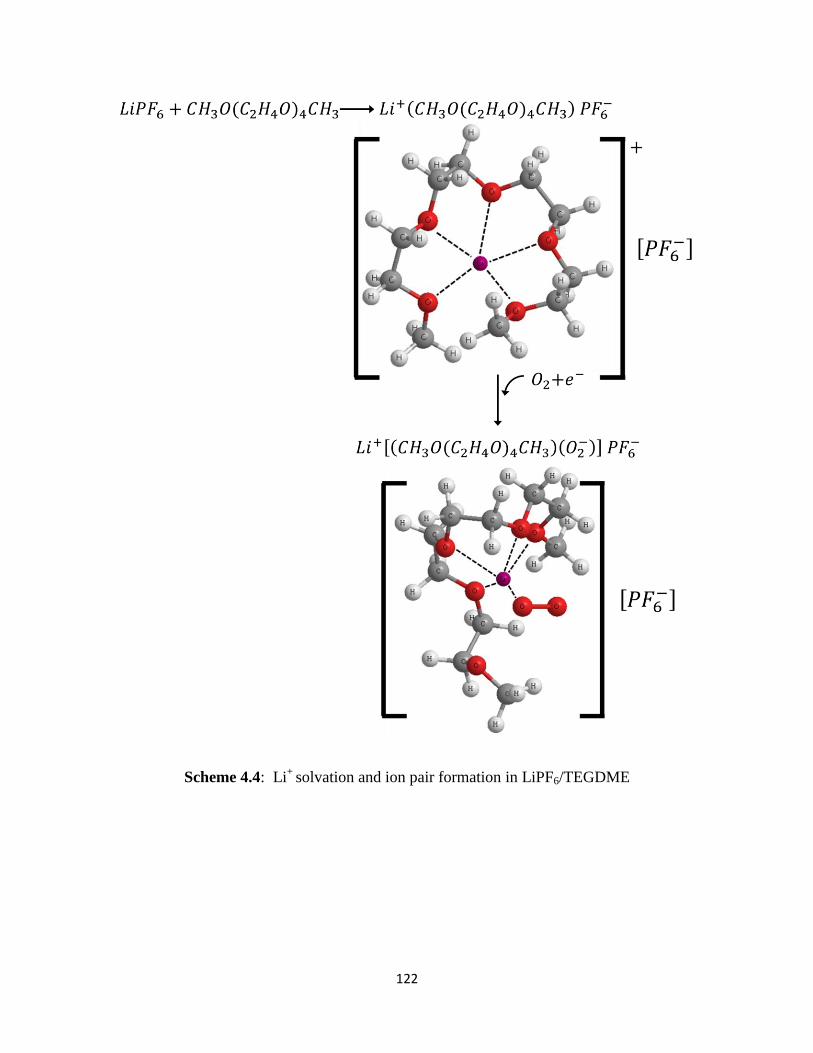
122
Scheme 4.4: Li+
solvation and ion pair formation in LiPF6/TEGDME
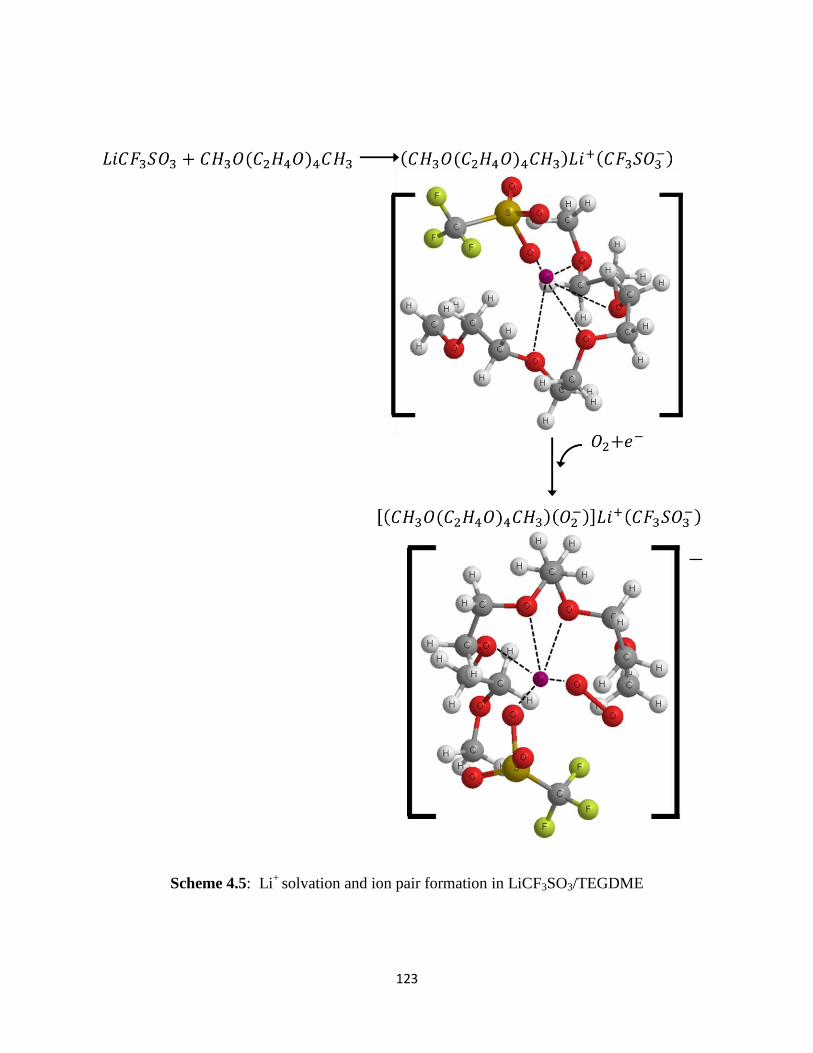
123
Scheme 4.5: Li+
solvation and ion pair formation in LiCF3SO3/TEGDME
124
Scheme 4.5 shows the probable ORR sequence in the presence of CF3SO3- anions. The very
similar DN of TEGDME and CF3SO3- implies that the triflate could enter into the co-ordination
sphere with TEGDME by substituting for some of the Li+--O- bonds in the Li
+(TEGDME)
solvate with Li+--O=S bonds to form a contact ion pair of the type (TEGDME)Li
+(CF3SO3
-).
Even though the caged solvate structure is somewhat altered in this case, the stability imposed by
the strong interaction between the sulfonyl oxygens with the Li+ ions will restore or even
enhance the stability of the Li+[(TEGDME)(O2
-)](CF3SO3
-) complex formed with superoxide.
The higher capacity obtained in Li/O2 cells utilizing LiCF3SO3/TEGDME electrolyte is
consistent with the stability of the superoxide ions shown in scheme 4.5, its increased solubility
and diffusion away from the carbon electrode surface to the electrolyte bulk in the pores of the
electrode where it decomposes to Li2O2.
Solvation enthalpy vs. lattice enthalpy : In general a crystalline solid like Li2O2 dissolves in a
solvent when its solvation energy with the solvent exceeds its lattice energy. The following
calculations indicate that Li2O2 will not be soluble in TEGDME or DME but LiO2 could. The
enthalpy of solvation calculated for Li+ in diethyl ether to form Li
+(diethyl ether)5 using Drago’s
equation77
we described previously is about 209 kcal/mole. On the other hand, the lattice energy
calculated for Li2O2 is 619.4 kcal/mole.98
It is unlikely that the lithium peroxide dissolves in any
of these ether based electrolytes. The lattice energy of LiO2 has been calculated to be 210
kcal/mole.99
This value is comparable to the above mentioned estimated solvation energy of Li+
in ether-based electrolytes. The enthalpy data provide a rational explanation for the solubility of
lithium superoxide complexes discussed above in the ether-based electrolytes. The stable
complexes are able to dissolve in the ether electrolytes, move away from the electrode surface to
the electrolyte in the electrode pores and decompose there eventually to form Li2O2. In this way
Scheme 2C
125
the porous electrode performs better in the LiCF3SO3-based electrolytes in which the suproxide
complexes are more stable and soluble to yield higher capacities in the Li/O2 cells.
4.4. Conclusion
We have shown that the conducting salt anion does not affect oxygen transport in TBA
salt-based electrolytes in 1,2-dimethoxyethane. As a result we have been able to determine O2
solubility and diffusion coefficients in these electrolytes. We have also found higher oxygen
transport parameters in electrolytes prepared from both the low viscosity DME and high
viscosity TEGDME compared to that in DMSO. We attribute this to the electrolyte structures.
We have found that the discharge capacities of Li/O2 cells utilizing LiCF3SO3/TEGDME
solutions are higher than in those containing LiPF6/TEGDME. Our microelectrode and RRDE
data combined with IR spectra suggest that the higher capacity in LiCF3SO3-based Li/O2 cells is
due to the increased stability and solubility of the ion pair species formed in the electrolyte
between the initial ORR product superoxide (O2-) and the solvated Li
+ with a structure such as
[(TEGDME)(O2-)]Li
+(CF3SO3
-) in which the Li
+ resides in a TEGDME cage. The PF6
- anion
does not form a similar contact ion pair with Li+ in DME or TEGDME because of the very low
DN of PF6- compared to that of the TEGDME solvent and the CF3SO3
- anion. This study further
affirms the electrolyte-controlled ORR processes in non-aqueous Li/O2 batteries.
126
Chapter 5
Solid Phase Bi-functional FePC Catalysts for Non-aqueous Li-air Batteries
5.1. Introduction
The limited rechargeability of the Li anode and the constraints associated with the
development of suitable battery architecture are deterrents to the development of a practical
rechargeable Li-O2 battery. The major discharge product reported in a non-aqueous Li-O2 battery
is Li2O2 via a two-electron O2 reduction which yields a theoretical specific energy of 3505
Wh/kg. This is sixty seven percent lower than the theoretical specific energy of 5200 Wh/kg
calculated on the basis of the four-electron reduction of O2 to form Li2O as the discharge
product. In this context a cathode catalyst that could catalyze the reduction of O2 to form lithium
monoxide (Li2O) as the discharge product is appealing.29, 91, 100
Simultaneously, if the same
catalyst can promote oxygen evolution reactions at lower over-potentials, then the high capacity
of the Li-O2 battery can be accessed in many charge/discharge cycles to realize the goal of an
ultra-high energy density rechargeable Li-O2 battery.
Oxygen electrocatalysts based on transition metal-N4 centers such as porphyrins and
phthalocyanines have demonstrated varying degrees of activity to catalyze ORR in fuel cells.29,
91, 101, 102 However, only a few studies have reported ORR/OER catalysis of the O2 electrode by
these metal-N4 centers in non-aqueous electrolyte-based Li-O2 batteries.103-105
A recent study
published by Trahan et al. show that CoPC-based catalyst can influence the oxygen
electrochemistry in Li-O2 batteries.29
The oxygen reduction reaction rate at the catalyst is
determined by the solvent’s ability to modulate the Lewis acidity of Li+ ions in solution. In high
Donor Number (DN) solvents the ORR proceeds at the outer Helmholtz plane since the
Li(solvent)n+–O2
- intermediate is stabilized in the electrolyte solution. On the other hand, in low
127
DN solvents such as acetonitrile and TEGDME the ORR proceeds at the electrode’s inner
Helmholtz plane on the catalyst center, since the electron acceptor property of the catalyst is
higher than that of Li(solvent)n+.
An ideal catalyst would be one that selectively catalyzes the ORR and OER reactions
without interfering with the performance of the electrolyte or the lithium anode. We demonstrate
that the solid phase FePC catalyst that we have developed approaches this performance. DFT
calculations (for solvent free conditions) have shown that both cobalt(II) phthalocyanine (CoPC)
and iron(II) phthalocyanine (FePC) have positive binding energies for O2 adsorption.106
These
studies have also suggested that only FePC is capable of adsorbing O2 in the side-on
configuration, which we believe is desired for the four-electron reduction of O2 to form Li2O.
Sun et al.107
employed FePC dissolved in TEGDME and DMSO-based electrolytes as a redox
shuttle for electrons and superoxide ions (O2-, the one electron reduction product of O2),
between a carbon cathode and the insulating Li2O2 formed on it during discharge. They
concluded that the molecular oxygen adsorbed on the metal center (i.e, FePC–O2) would undergo
reduction to form FePC-LiOOLi which would then diffuse to a nucleated Li2O2 site and
precipitate. Similarly, they claim that the FeIII
PC can oxidize the Li2O2 to form FePC–O2- which
would then diffuse to the carbon surface where the superoxide would undergo further oxidation
to O2. However, as we show later in this chapter the dissolved FePC reacts with the Li metal
anode, possibly affecting its rechargeability in the Li-air battery. Consequently, a FePC catalyst
that does not dissolve in non-aqueous electrolytes while retaining its ORR and OER catalytic
activity would be of great interest for developing practical Li-air batteries. We have developed
such solid phase catalysts by heat-treating mixtures of high surface carbon and FePC at selected
high temperatures. The properties of these catalysts prepared by heating at precisely controlled
128
temperature are reported together with their ORR and OER activities in non-aqueous electrolytes
and Li-air battery cells. The pyrolysis temperature of the high surface area carbon with the FePC
catalyst embedded in it affects the structure and catalytic activity of the resulting solid phase
catalyst. We present here a comprehensive discussion of the structure-catalytic property
relationships of these solid phase FePC catalysts and the manner in which the electrolytes
influence their electrochemical properties. The best catalyst has demonstrated a doubling of the
cycle life of the Li-air battery.
5.2. Experimental
5.2.1. Materials
All lithium salts (LiPF6, LiCF3SO3) battery grade, Iron(II) phthalocyanine and dry
organic solvents (acetonitrile-MeCN, dimethyl sulfoxide-DMSO, tetraethylene glycol dimethyl
ether-TEGDME) were purchased from Sigma-Aldrich and were stored in an MBraun glove-box
maintained under 0.5 ppm prior to use. High surface area carbon Vulcan-XC72R (233 m2/gram)
and Ketjenblack EC300JD (802 m2/gram),) were obtained from Cabot corporation. The
Ag/AgNO3 reference electrode was prepared as reported by Wain et al.68
using a silver wire
(99%) purchased from Alfa Aesar. All the potentials in this chapter are reported with respect to
the Li/Li+
scale unless otherwise stated.
5.2.2. Iron(II) Phthalocyanine–based Catalyst Synthesis
Catalysts were prepared using a method previously reported by Dodelet et al.91, 108
Iron(II) Phthalocyanine dissolved in concentrated sulfuric acid was stirred with the carbon black
(Ketjenblack EC300JD or Vulcan-XC72R). The amount of high surface area carbon added was
such that the weight of iron metal in the carbon matrix is 4% by weight. The resulting slurry was
poured into a large volume of de-ionized water cooled to below 5oC. The suspension was filtered
129
and washed as required to remove any residual H+ in the catalyst. The carbon-catalyst residue
was dried overnight at 60oC under vacuum and the dried powder was heat-treated at the selected
temperatures (presented in the Results and Discussion section) for two hours under argon.
5.2.3. Cyclic Voltammetry
Thin film electrodes were prepared from FePC/Vulcan catalyst–based inks as follows.
PVDF binder was dissolved in N-methyl-2-pyrrolidone to which the carbon/catalyst powder was
added so that the binder:carbon/catalyst ratio was 90:10 by mass. A required aliquot of the ink
dispersion was deposited on the clean dry glassy carbon disc electrode to obtain a 0.1 mg cm-2
catalyst layer. The glassy carbon disc was dried in vacuum at 80oC overnight.
Voltammograms were initially recorded in argon-saturated 0.1 M LiCF3SO3/MeCN, 0.1
M LiPF6/MeCN, 0.1 M LiCF3SO3/ DMSO, and 0.1 M LiPF6/DMSO electrolytes to investigate
the redox activity of the catalyst metal center and to verify the absence of electrochemical
reactions that arise from the electrolyte within the electrochemical potential window of interest.
All the electrochemical data shown in this chapter were obtained at a glassy carbon disc
electrode (0.5 cm diameter) and the current densities reported here are referenced to its
geometric surface area (0.196 cm2). Oxygen electrochemistry was recorded in O2 saturated 0.1M
LiCF3SO3 or LiPF6 electrolytes prepared in acetonitrile (MeCN) and dimethylsulfoxide (DMSO)
solvents.
5.2.4. Lithium-Air Cell Testing:
Li-oxygen cells were constructed using Li foil anodes and uncatalyzed cathodes using
KetjenBlack EC300JD, and catalyzed carbon cathodes containing FePC/Ketjenblack-based
catalyst, and microporous polypropylene membrane separators. Details of our Li-O2 cell
130
construction are reported elsewhere (Section 4.2.4). The Li-O2 cells employed TEGDME as the
electrolyte solvent and electrolytes prepared with 1M LiPF6 as well as LiCF3SO3 were used.
Some cycled cells were disassembled and the cathodes were analyzed by means of several
spectroscopic techniques that are discussed later in this chapter. All electrochemical experiments
and Li-O2 cell tests were carried out in a glove-box maintained at a humidity level < 0.5 ppm.
5.2.5. Thermo-Gravimetric Analysis (TGA)
Thermal stability of commercial iron(II) phthalocyanine was measured under argon in an
SDT Q600 thermal analyzer.
5.2.6. Fourier-Transform Infrared Spectroscopy (FT-IR)
Commercial iron(II) phthalocyanine samples pyrolyzed at different temperatures under
argon were analyzed using a Bruker Vertex-70 FT-IR spectrometer.
5.2.7. X-Ray Diffraction
Discharged Li-O2 cells were disassembled inside the glove-box, the carbon cathodes were
separated, washed with acetonitrile to remove the Li salt, and XRD spectra were recorded with a
Rigaku Ultima IV diffractometer using a Cu Kα radiation source. The cathode sample was
covered with a Kapton® polyimide film to prevent contact with atmospheric moisture during the
data acquisition.
5.2.8. In-Situ Raman
In-situ Raman experiments were carried out using an in-situ Raman cell obtained from
MTI Corporation. In situ Li-O2 cells were prepared using a carbon cloth cathode (facing the
quartz window of the Raman cell) and a lithium anode. Raman spectra were obtained in a
131
DMSO-based electrolyte containing dissolved FePC of the composition 1 mM FePC/0.1M
LiCF3SO3/DMSO, while scanning the cathode potential at 200 mV steps and holding the
electrode at each potential for more than 300 minutes. Note that whereas unheated FePC is
soluble in DMSO, the heat-treated FePC/carbon materials are insoluble in DMSO.
5.2.9. Scanning Electron Microscopy (SEM)
Lithium metal surfaces were exposed to 1mM FePC/1 M LiCF3SO3 in DMSO and 1 mM
FePC/1 M LiCF3SO3 in TEGDME overnight. Then, they were washed with 1,2-dimethoxyethane
solvent, dried under vacuum and SEM images of the specimens were recorded on a Hitachi S-
4900 instrument. SEM images were also recorded for cycled cathodes from Li-air cells.
5.2.10. Transmission Electron Microscopy (TEM)
The iron(II) phthalocyanine catalysts deposited on carbon were characterized using a JEOL
2010F transmission electron microscope.
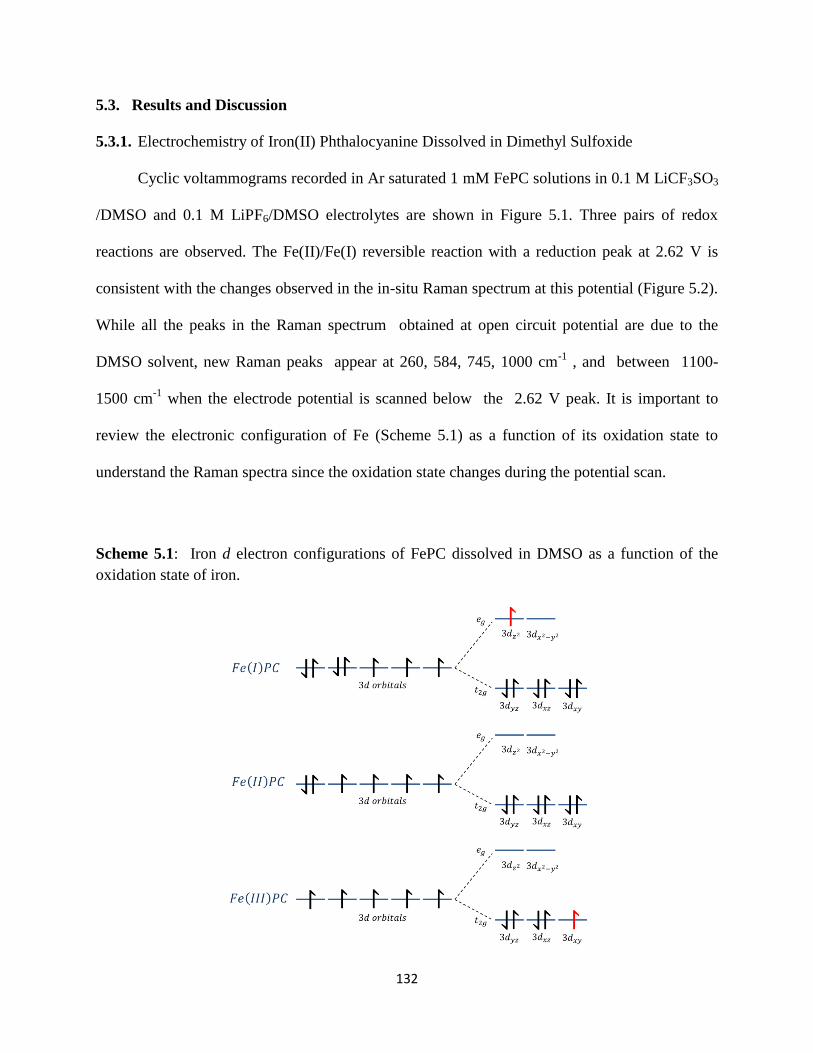
132
5.3. Results and Discussion
5.3.1. Electrochemistry of Iron(II) Phthalocyanine Dissolved in Dimethyl Sulfoxide
Cyclic voltammograms recorded in Ar saturated 1 mM FePC solutions in 0.1 M LiCF3SO3
/DMSO and 0.1 M LiPF6/DMSO electrolytes are shown in Figure 5.1. Three pairs of redox
reactions are observed. The Fe(II)/Fe(I) reversible reaction with a reduction peak at 2.62 V is
consistent with the changes observed in the in-situ Raman spectrum at this potential (Figure 5.2).
While all the peaks in the Raman spectrum obtained at open circuit potential are due to the
DMSO solvent, new Raman peaks appear at 260, 584, 745, 1000 cm-1
, and between 1100-
1500 cm-1
when the electrode potential is scanned below the 2.62 V peak. It is important to
review the electronic configuration of Fe (Scheme 5.1) as a function of its oxidation state to
understand the Raman spectra since the oxidation state changes during the potential scan.
Scheme 5.1: Iron d electron configurations of FePC dissolved in DMSO as a function of the
oxidation state of iron.

133
In solvents such as DMSO which can form coordination bonds with electron acceptor
centers, iron(II) phthalocyanine is six co-ordinated109
in a structure, (DMSO)2Fe(II)PC(−2),
containing two DMSO molecules as shown in Scheme 5.2. At the open circuit potential the metal
center is in the Fe(II) state. When the electrode is polarized to lower potentials , the Fe(II) is
reduced to Fe(I) which has the (xz,yz,xy)6(z
2)1 electronic configuration. Axially coordinated
DMSO molecules destabilize electronic states of iron where electrons occupy axial orbitals
(Fe(1) state, Scheme 5.1). As the DN of the coordinating molecule is increased, the Fe(II) state is
stabilized over the Fe(I) state and the redox potential of Fe(II)/Fe(I) is shifted downwards. The
effect of the shift of the Fe(II)/Fe(I) redox potential on oxygen electrochemistry is discussed in
detail in the following sections of this chapter. As shown in Scheme 5.2, following the reduction
of the metal center (DMSO)2Fe(I)PC(−2) releases one of the two DMSO molecules attached to
Fe(II)PC to form an asymmetric five co-ordinated complex. The planarity of the coordinated
FePC molecule is lost during this transition and the changes that appear in the Raman spectra
below 2.6 V are consistent with these symmetry changes.
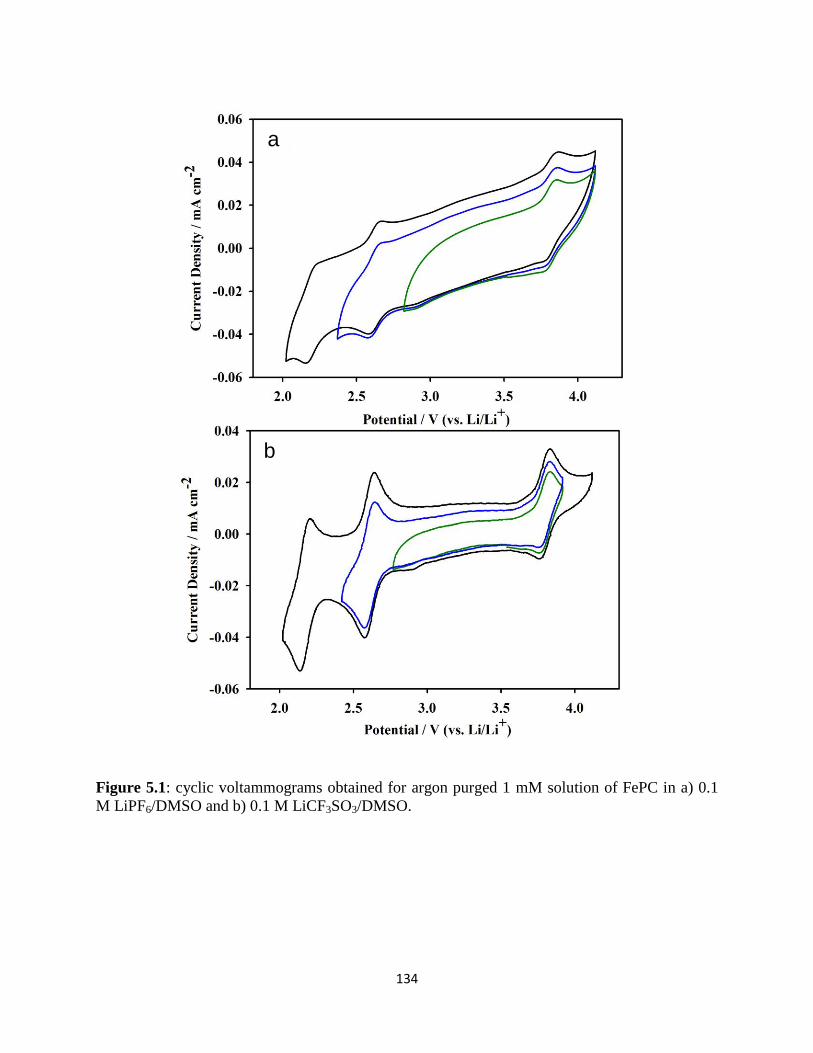
134
Figure 5.1: cyclic voltammograms obtained for argon purged 1 mM solution of FePC in a) 0.1
M LiPF6/DMSO and b) 0.1 M LiCF3SO3/DMSO.
a
b

135
Scheme 5.2: Fe(II)/Fe(I) in DMSO
(DMSO)2Fe(II)PC(−2) + e− ↔ [(DMSO)2Fe(I)PC(−2)]− [5.1]
[(DMSO)2Fe(I)PC(−2)]− ↔ [(DMSO)Fe(I)PC(−2)]− + DMSO [5.2]
Scheme 5.3: Fe(I)PC reduction in DMSO
[(DMSO)Fe(I)PC(−2)]− + e− ↔ [(DMSO)Fe(I)PC(−3)]2− [5.3]
Figure 5.1 also indicates that the Fe(I)PC(−2)) is further reduced possibly to
Fe(I)PC(−3) at about 2.2 V (Scheme 5.3). Note that in this process only the PC macrocycle
moiety is reduced. This reaction is reflected by the new Raman peaks that appear at 1425 and
1490 cm-1
in Figure 5.2 when the electrode is polarized down to 2.20 V. These Raman peaks can
be attributed to the pyrrole C-C and C-N stretching vibrations arising from the reduction of the
macrocycle ring as depicted in Scheme 5.3.
The oxidation of Fe(II) to Fe(III) that appears at 3.8 V in the reverse scan in
LiCF3SO3/DMSO is a two-step reaction where the electron transfer is followed by substitution of
a co-ordinated DMSO molecule by an anion as depicted in Scheme 5.4. The strength of the
coordination bond between the counter anion (X−) in solution and the Fe(III) center determines
the redox potential of the Fe(II)/Fe(III) couple. That is, the oxidation of the Fe(II) to Fe(III)
occurs at a lower potential if the anion forms a stronger bond with the Fe(III)PC formed as a
result of the oxidation.110

136
Scheme 5.4: Fe(II)/Fe(III) in DMSO
(DMSO)2Fe(II)PC(−2) ↔ [(DMSO)2Fe(III)PC(−2)]+ + e− [5.4]
[(DMSO)2Fe(III)PC(−2)]+ + X− ↔ (DMSO)Fe(III)PC(−2)X + DMSO [5.5]
Figure 5.2: In-situ Raman spectra obtained at the carbon electrode at different potentials (Argon
purged 1 mM FePC, 0.1M LiCF3SO3/DMSO)
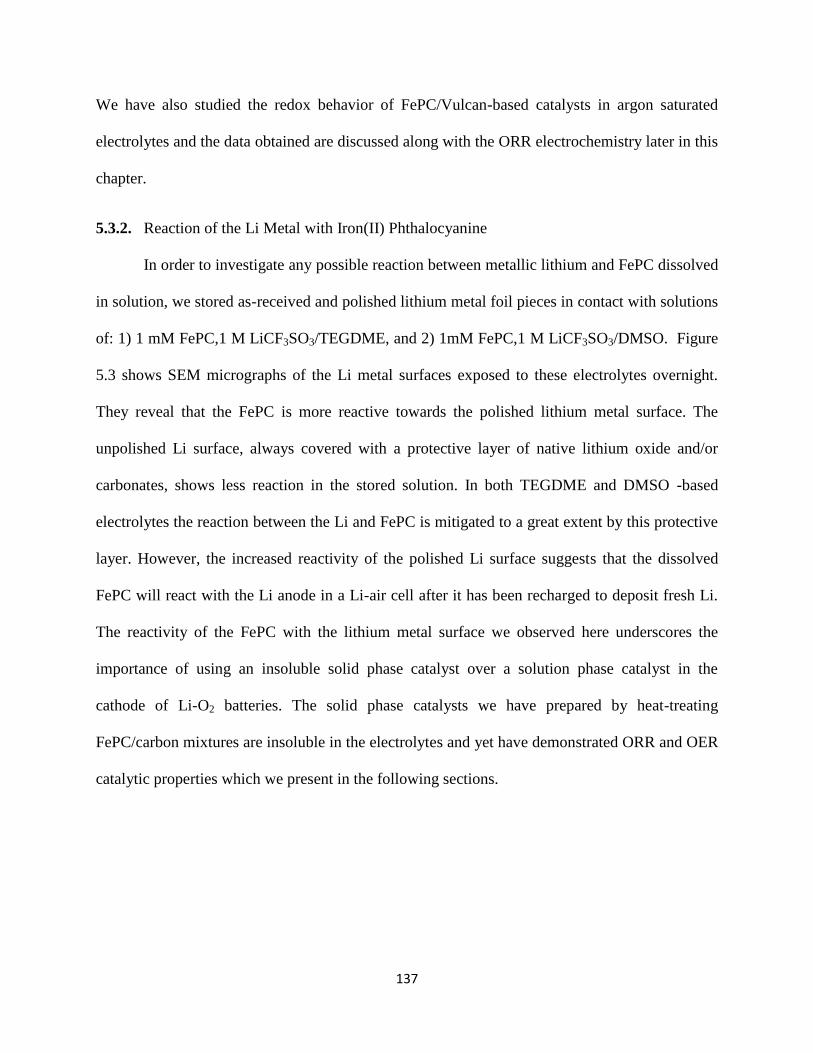
137
We have also studied the redox behavior of FePC/Vulcan-based catalysts in argon saturated
electrolytes and the data obtained are discussed along with the ORR electrochemistry later in this
chapter.
5.3.2. Reaction of the Li Metal with Iron(II) Phthalocyanine
In order to investigate any possible reaction between metallic lithium and FePC dissolved
in solution, we stored as-received and polished lithium metal foil pieces in contact with solutions
of: 1) 1 mM FePC,1 M LiCF3SO3/TEGDME, and 2) 1mM FePC,1 M LiCF3SO3/DMSO. Figure
5.3 shows SEM micrographs of the Li metal surfaces exposed to these electrolytes overnight.
They reveal that the FePC is more reactive towards the polished lithium metal surface. The
unpolished Li surface, always covered with a protective layer of native lithium oxide and/or
carbonates, shows less reaction in the stored solution. In both TEGDME and DMSO -based
electrolytes the reaction between the Li and FePC is mitigated to a great extent by this protective
layer. However, the increased reactivity of the polished Li surface suggests that the dissolved
FePC will react with the Li anode in a Li-air cell after it has been recharged to deposit fresh Li.
The reactivity of the FePC with the lithium metal surface we observed here underscores the
importance of using an insoluble solid phase catalyst over a solution phase catalyst in the
cathode of Li-O2 batteries. The solid phase catalysts we have prepared by heat-treating
FePC/carbon mixtures are insoluble in the electrolytes and yet have demonstrated ORR and OER
catalytic properties which we present in the following sections.
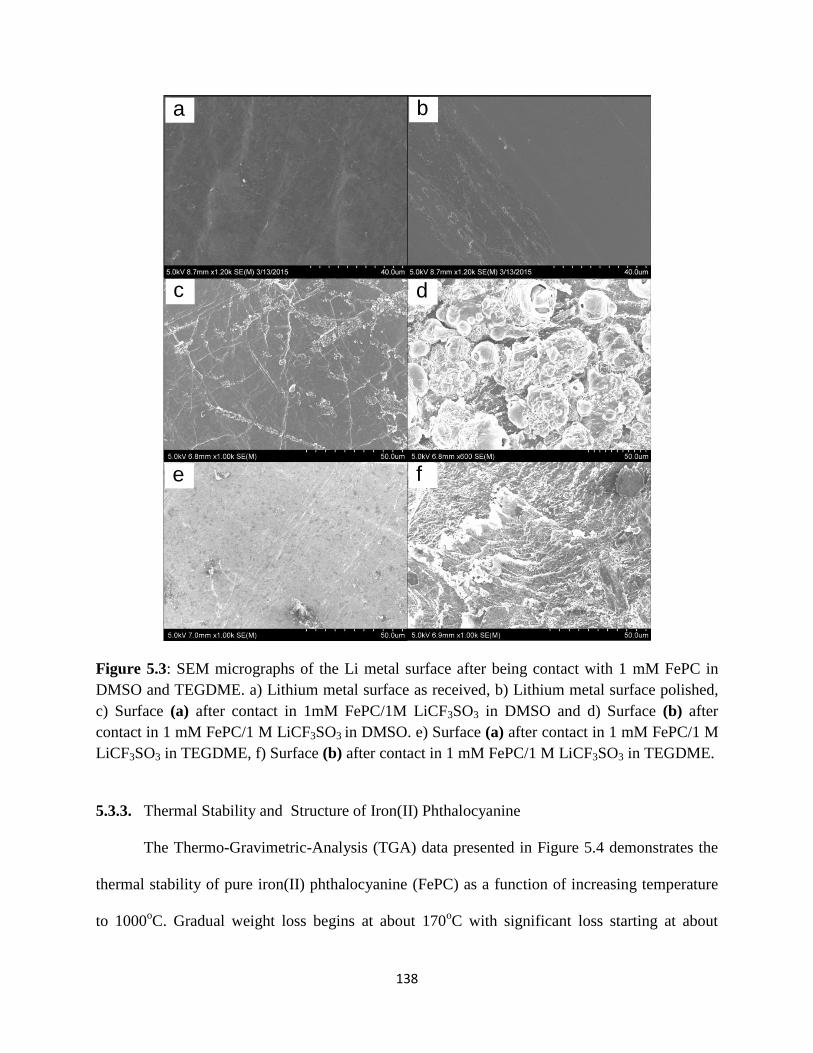
138
Figure 5.3: SEM micrographs of the Li metal surface after being contact with 1 mM FePC in
DMSO and TEGDME. a) Lithium metal surface as received, b) Lithium metal surface polished,
c) Surface (a) after contact in 1mM FePC/1M LiCF3SO3 in DMSO and d) Surface (b) after
contact in 1 mM FePC/1 M LiCF3SO3 in DMSO. e) Surface (a) after contact in 1 mM FePC/1 M
LiCF3SO3 in TEGDME, f) Surface (b) after contact in 1 mM FePC/1 M LiCF3SO3 in TEGDME.
5.3.3. Thermal Stability and Structure of Iron(II) Phthalocyanine
The Thermo-Gravimetric-Analysis (TGA) data presented in Figure 5.4 demonstrates the
thermal stability of pure iron(II) phthalocyanine (FePC) as a function of increasing temperature
to 1000oC. Gradual weight loss begins at about 170
oC with significant loss starting at about
a b
c d
e f
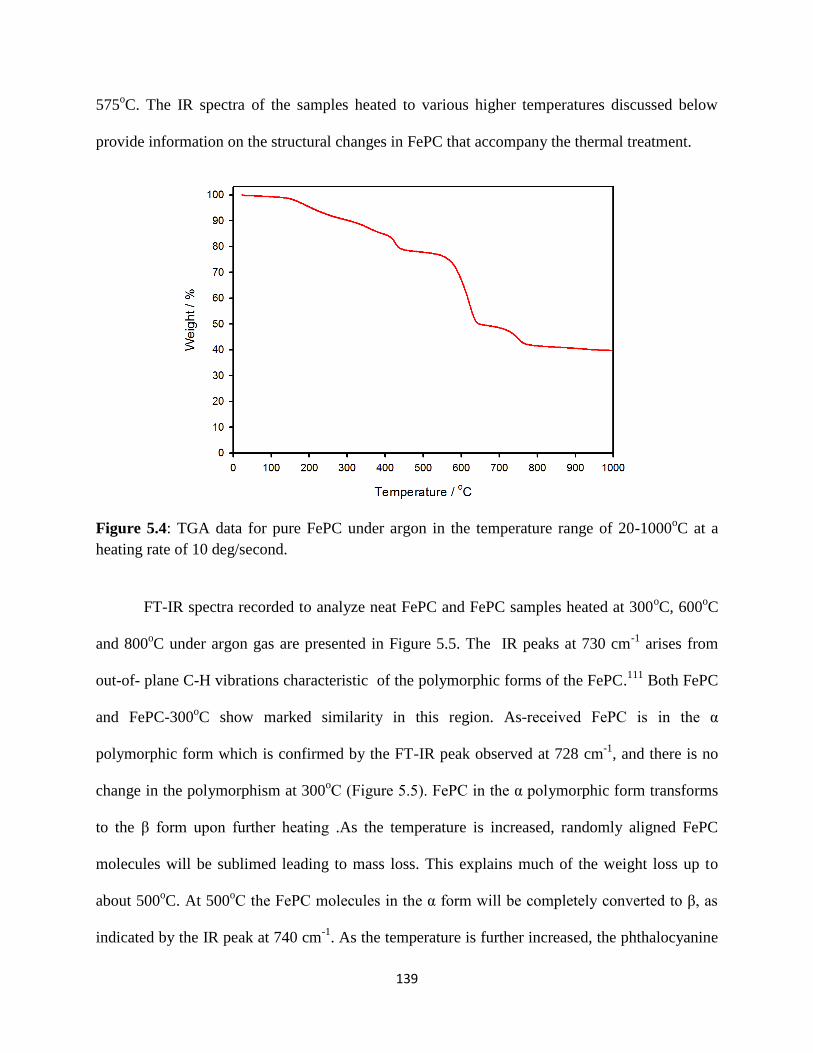
139
575oC. The IR spectra of the samples heated to various higher temperatures discussed below
provide information on the structural changes in FePC that accompany the thermal treatment.
Figure 5.4: TGA data for pure FePC under argon in the temperature range of 20-1000oC at a
heating rate of 10 deg/second.
FT-IR spectra recorded to analyze neat FePC and FePC samples heated at 300oC, 600
oC
and 800oC under argon gas are presented in Figure 5.5. The IR peaks at 730 cm
-1 arises from
out-of- plane C-H vibrations characteristic of the polymorphic forms of the FePC.111
Both FePC
and FePC-300oC show marked similarity in this region. As-received FePC is in the α
polymorphic form which is confirmed by the FT-IR peak observed at 728 cm-1
, and there is no
change in the polymorphism at 300oC (Figure 5.5). FePC in the α polymorphic form transforms
to the β form upon further heating .As the temperature is increased, randomly aligned FePC
molecules will be sublimed leading to mass loss. This explains much of the weight loss up to
about 500oC. At 500
oC the FePC molecules in the α form will be completely converted to β, as
indicated by the IR peak at 740 cm-1
. As the temperature is further increased, the phthalocyanine
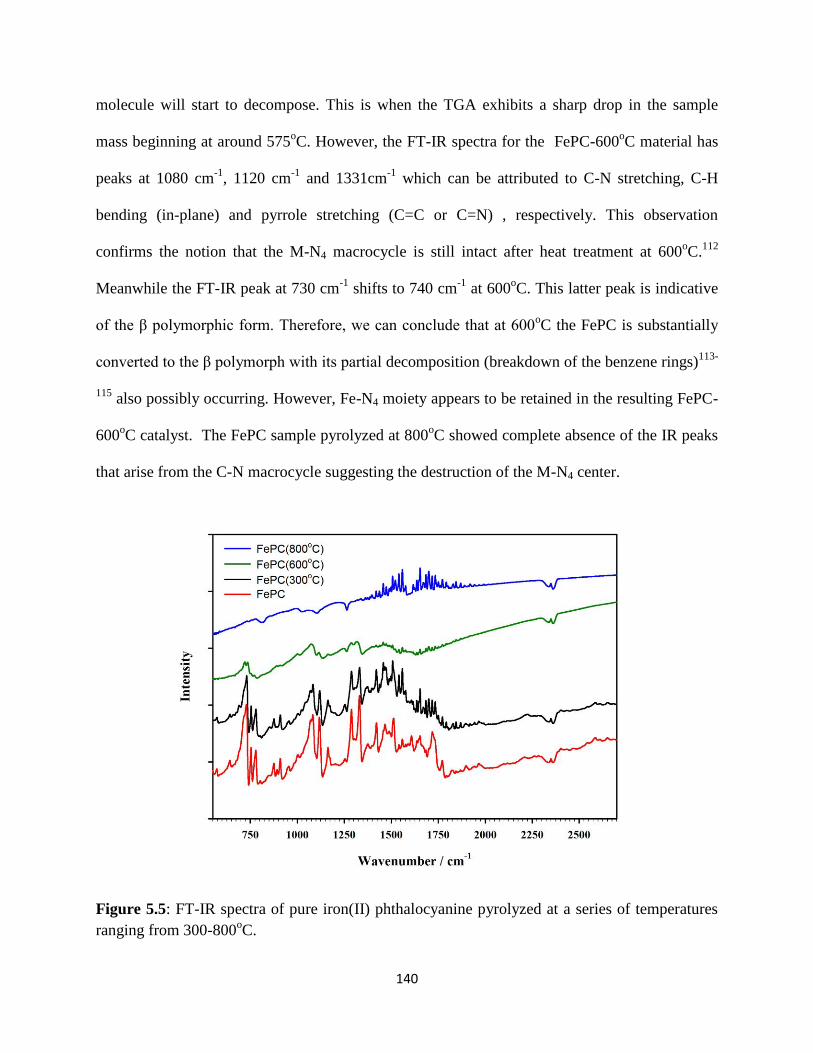
140
molecule will start to decompose. This is when the TGA exhibits a sharp drop in the sample
mass beginning at around 575oC. However, the FT-IR spectra for the FePC-600
oC material has
peaks at 1080 cm-1
, 1120 cm-1
and 1331cm-1
which can be attributed to C-N stretching, C-H
bending (in-plane) and pyrrole stretching (C=C or C=N) , respectively. This observation
confirms the notion that the M-N4 macrocycle is still intact after heat treatment at 600oC.
112
Meanwhile the FT-IR peak at 730 cm-1
shifts to 740 cm-1
at 600oC. This latter peak is indicative
of the β polymorphic form. Therefore, we can conclude that at 600oC the FePC is substantially
converted to the β polymorph with its partial decomposition (breakdown of the benzene rings)113-
115 also possibly occurring. However, Fe-N4 moiety appears to be retained in the resulting FePC-
600oC catalyst. The FePC sample pyrolyzed at 800
oC showed complete absence of the IR peaks
that arise from the C-N macrocycle suggesting the destruction of the M-N4 center.
Figure 5.5: FT-IR spectra of pure iron(II) phthalocyanine pyrolyzed at a series of temperatures
ranging from 300-800oC.
141
5.3.4. Synthesis and Characterization of Carbon Supported Catalysts
Carbon supported FePC catalysts were prepared using two types of carbon precursors-
low surface area Vulcan(VC)(XC72R) and high surface area Ketjenblack (KB) (EC300JD). The
FePC/Vulcan (VC)(XC72R) -based catalysts were synthesized to carry out electrochemical thin
film studies, and the FePC/Ketjenblack (KB)(ED300JD) -based catalysts were prepared to
evaluate Li-O2 cell performance. Hereon, the Vulcan and Ketjenblack supported catalysts heat
treated at 300 o
C will be referred to as FePC/VC(300) and FePC/KB(300), respectively. The
catalysts heat treated at other temperatures will be named in the same manner with the
corresponding temperature identifiers.
The FePC/Carbon -based catalysts prepared by heat treatment were characterized by
powder X-ray diffraction (XRD). The XRD spectra shown in Figure 5.6 indicate the formation of
metallic Fe(2θ = 44o) in the sample pyrolyzed at 800
oC. This is in agreement with the FT-IR
spectra obtained for pure FePC heat treated at 800oC which suggested complete destruction of
the phthalocyanine macrocycle.
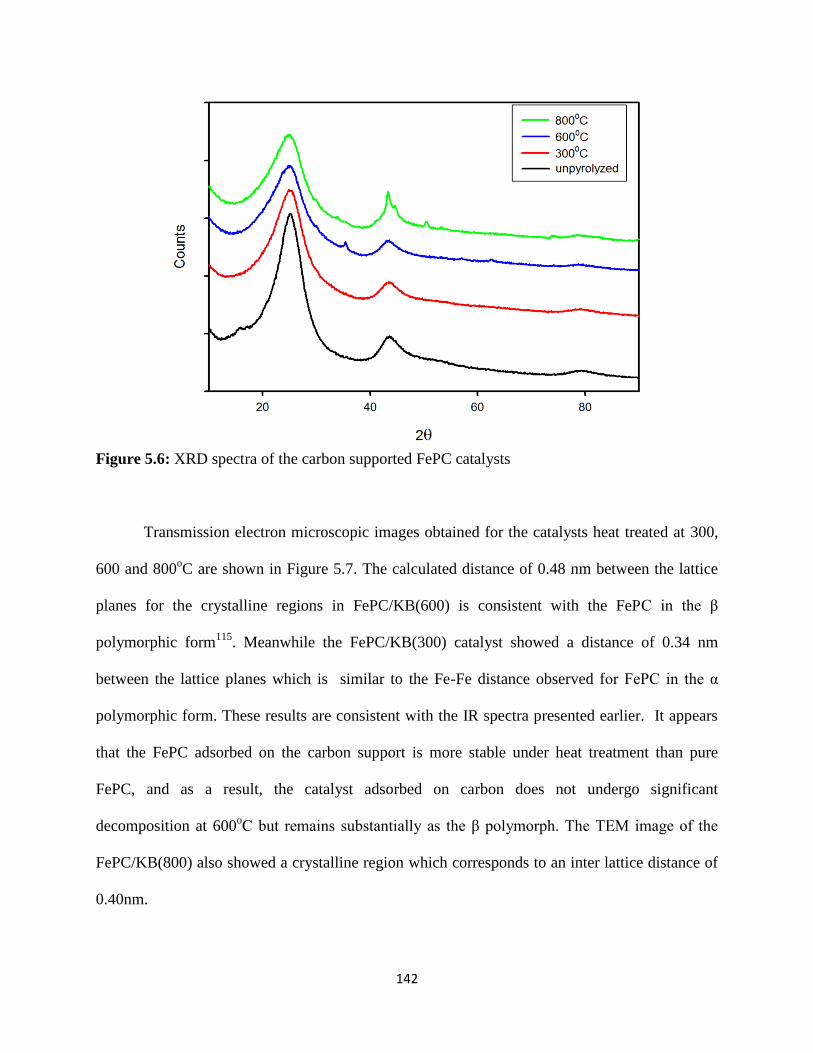
142
Figure 5.6: XRD spectra of the carbon supported FePC catalysts
Transmission electron microscopic images obtained for the catalysts heat treated at 300,
600 and 800oC are shown in Figure 5.7. The calculated distance of 0.48 nm between the lattice
planes for the crystalline regions in FePC/KB(600) is consistent with the FePC in the β
polymorphic form115
. Meanwhile the FePC/KB(300) catalyst showed a distance of 0.34 nm
between the lattice planes which is similar to the Fe-Fe distance observed for FePC in the α
polymorphic form. These results are consistent with the IR spectra presented earlier. It appears
that the FePC adsorbed on the carbon support is more stable under heat treatment than pure
FePC, and as a result, the catalyst adsorbed on carbon does not undergo significant
decomposition at 600oC but remains substantially as the β polymorph. The TEM image of the
FePC/KB(800) also showed a crystalline region which corresponds to an inter lattice distance of
0.40nm.
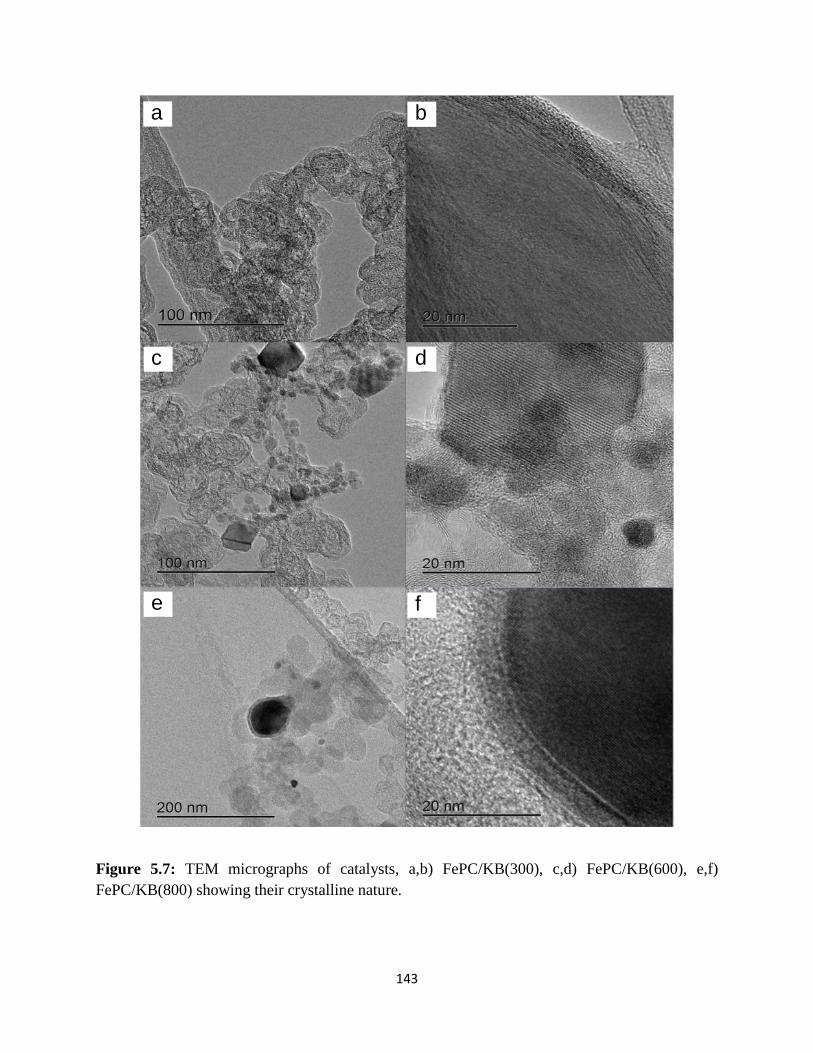
143
Figure 5.7: TEM micrographs of catalysts, a,b) FePC/KB(300), c,d) FePC/KB(600), e,f)
FePC/KB(800) showing their crystalline nature.
a b
c d
e f
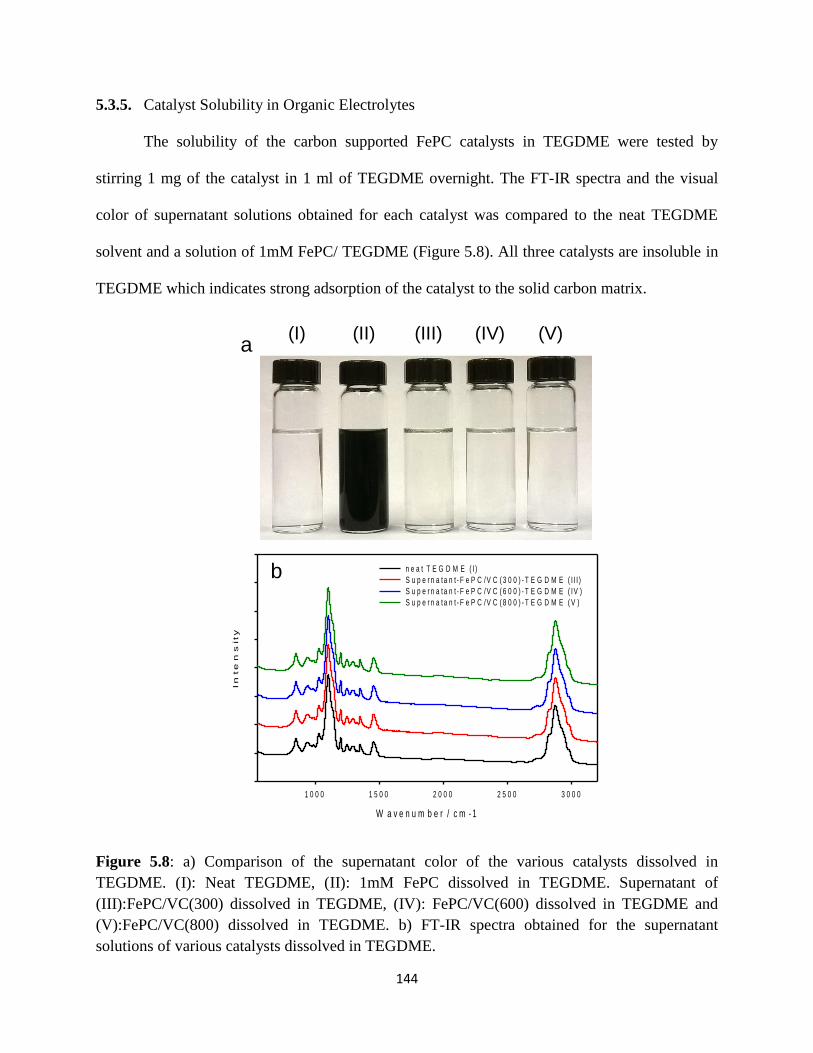
144
5.3.5. Catalyst Solubility in Organic Electrolytes
The solubility of the carbon supported FePC catalysts in TEGDME were tested by
stirring 1 mg of the catalyst in 1 ml of TEGDME overnight. The FT-IR spectra and the visual
color of supernatant solutions obtained for each catalyst was compared to the neat TEGDME
solvent and a solution of 1mM FePC/ TEGDME (Figure 5.8). All three catalysts are insoluble in
TEGDME which indicates strong adsorption of the catalyst to the solid carbon matrix.
Figure 5.8: a) Comparison of the supernatant color of the various catalysts dissolved in
TEGDME. (I): Neat TEGDME, (II): 1mM FePC dissolved in TEGDME. Supernatant of
(III):FePC/VC(300) dissolved in TEGDME, (IV): FePC/VC(600) dissolved in TEGDME and
(V):FePC/VC(800) dissolved in TEGDME. b) FT-IR spectra obtained for the supernatant
solutions of various catalysts dissolved in TEGDME.
b
(I) (II) (III) (IV) (V)
2 D G r a p h 2
W a v e n u m b e r / c m - 1
1 0 0 0 1 5 0 0 2 0 0 0 2 5 0 0 3 0 0 0
In
te
ns
ity
n e a t T E G D M E ( I )
S u p e r n a ta n t - F e P C /V C ( 3 0 0 ) - T E G D M E ( I I I )
S u p e r n a ta n t - F e P C /V C ( 6 0 0 ) - T E G D M E ( IV )
S u p e r n a ta n t - F e P C /V C ( 8 0 0 ) - T E G D M E ( V )
(I) (II) (III) (IV) (V) a
b
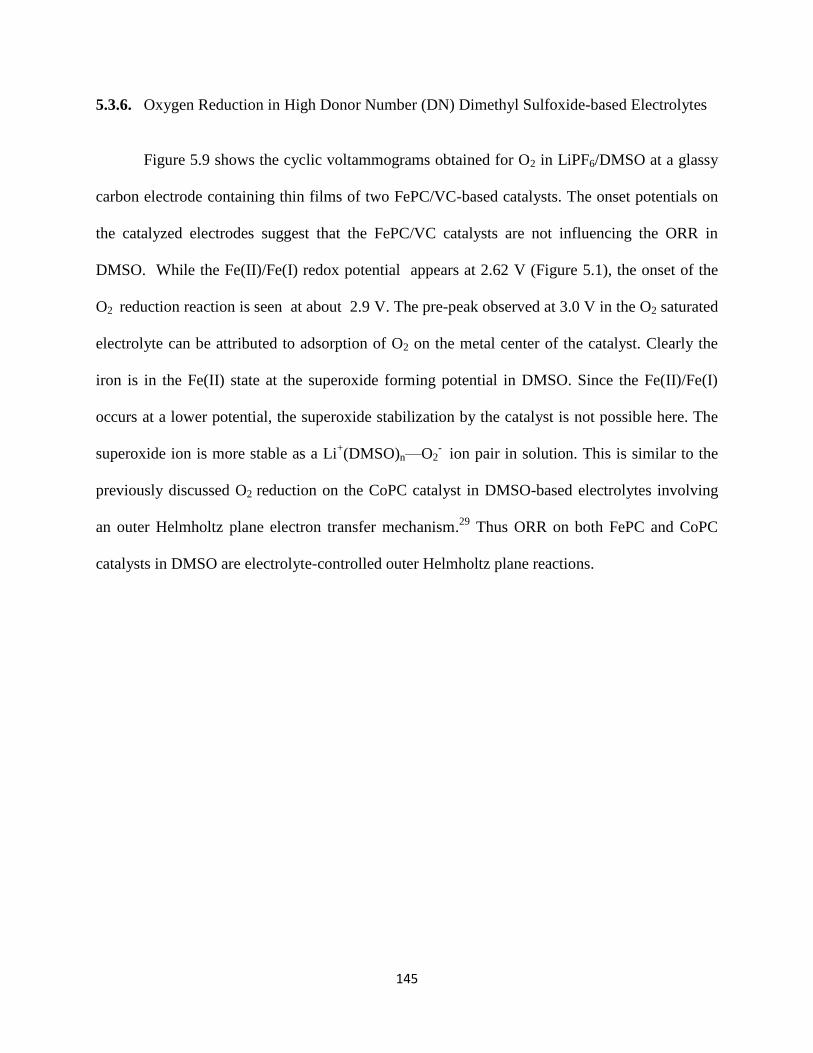
145
5.3.6. Oxygen Reduction in High Donor Number (DN) Dimethyl Sulfoxide-based Electrolytes
Figure 5.9 shows the cyclic voltammograms obtained for O2 in LiPF6/DMSO at a glassy
carbon electrode containing thin films of two FePC/VC-based catalysts. The onset potentials on
the catalyzed electrodes suggest that the FePC/VC catalysts are not influencing the ORR in
DMSO. While the Fe(II)/Fe(I) redox potential appears at 2.62 V (Figure 5.1), the onset of the
O2 reduction reaction is seen at about 2.9 V. The pre-peak observed at 3.0 V in the O2 saturated
electrolyte can be attributed to adsorption of O2 on the metal center of the catalyst. Clearly the
iron is in the Fe(II) state at the superoxide forming potential in DMSO. Since the Fe(II)/Fe(I)
occurs at a lower potential, the superoxide stabilization by the catalyst is not possible here. The
superoxide ion is more stable as a Li+(DMSO)n—O2
- ion pair in solution. This is similar to the
previously discussed O2 reduction on the CoPC catalyst in DMSO-based electrolytes involving
an outer Helmholtz plane electron transfer mechanism.29
Thus ORR on both FePC and CoPC
catalysts in DMSO are electrolyte-controlled outer Helmholtz plane reactions.
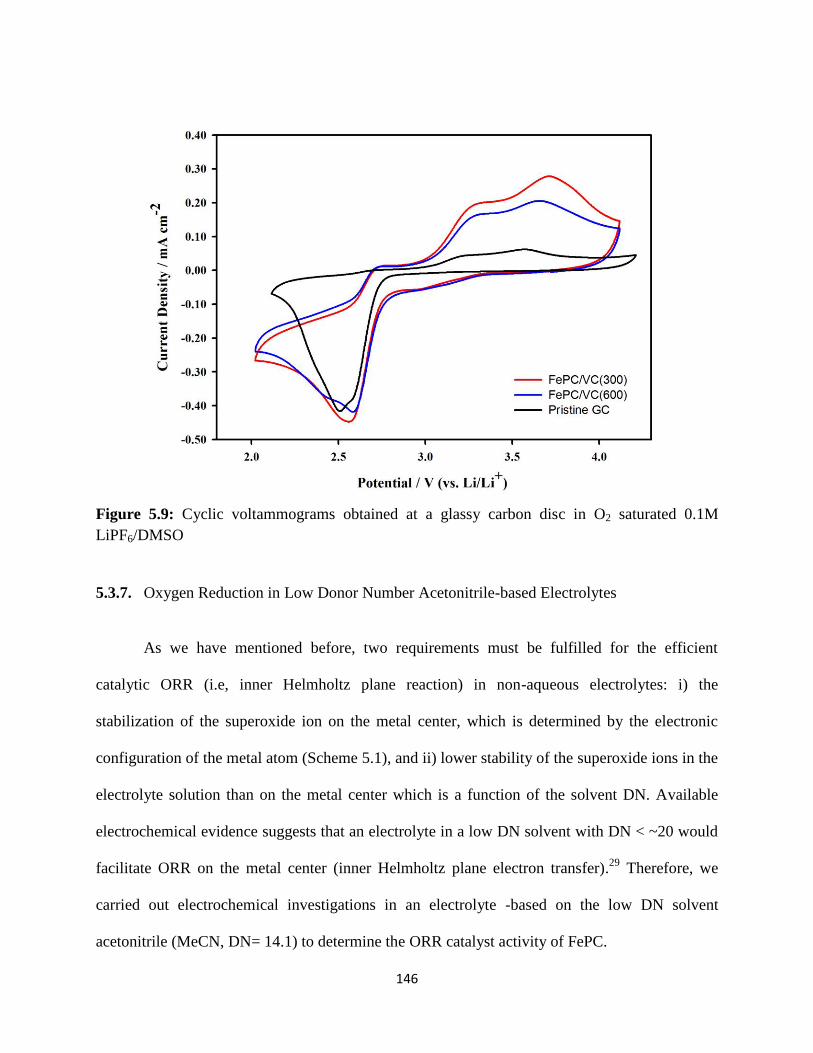
146
Figure 5.9: Cyclic voltammograms obtained at a glassy carbon disc in O2 saturated 0.1M
LiPF6/DMSO
5.3.7. Oxygen Reduction in Low Donor Number Acetonitrile-based Electrolytes
As we have mentioned before, two requirements must be fulfilled for the efficient
catalytic ORR (i.e, inner Helmholtz plane reaction) in non-aqueous electrolytes: i) the
stabilization of the superoxide ion on the metal center, which is determined by the electronic
configuration of the metal atom (Scheme 5.1), and ii) lower stability of the superoxide ions in the
electrolyte solution than on the metal center which is a function of the solvent DN. Available
electrochemical evidence suggests that an electrolyte in a low DN solvent with DN < ~20 would
facilitate ORR on the metal center (inner Helmholtz plane electron transfer).29
Therefore, we
carried out electrochemical investigations in an electrolyte -based on the low DN solvent
acetonitrile (MeCN, DN= 14.1) to determine the ORR catalyst activity of FePC.
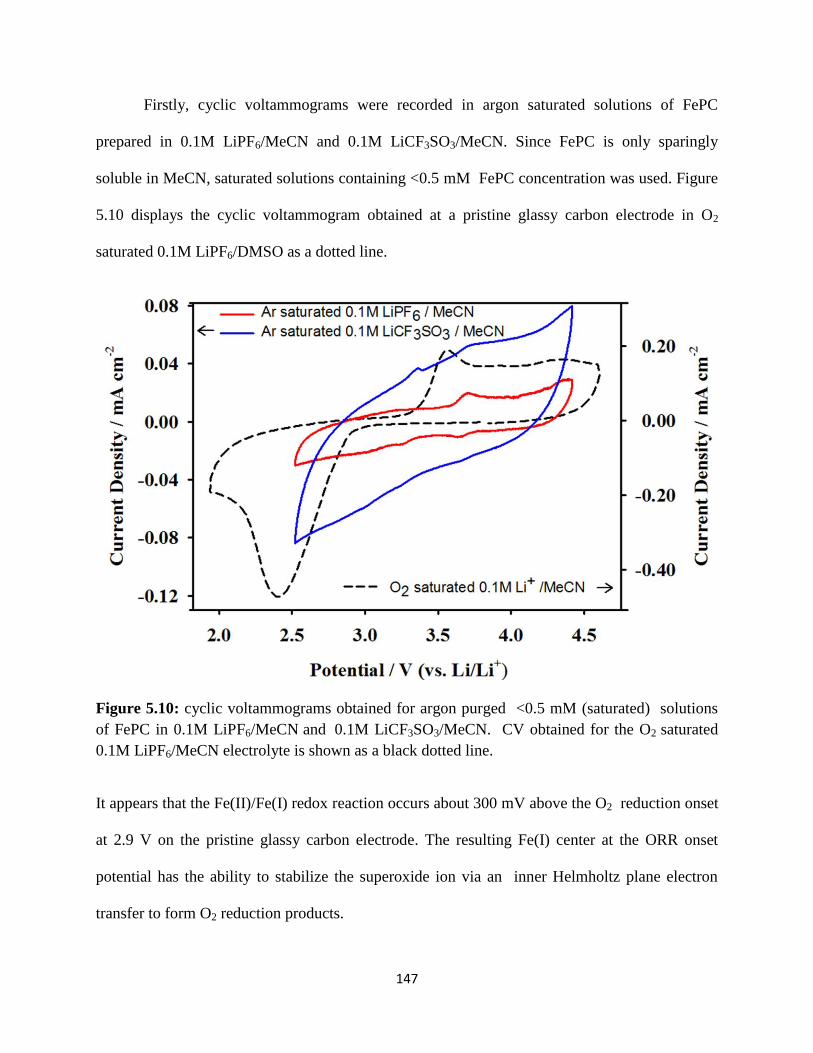
147
Firstly, cyclic voltammograms were recorded in argon saturated solutions of FePC
prepared in 0.1M LiPF6/MeCN and 0.1M LiCF3SO3/MeCN. Since FePC is only sparingly
soluble in MeCN, saturated solutions containing <0.5 mM FePC concentration was used. Figure
5.10 displays the cyclic voltammogram obtained at a pristine glassy carbon electrode in O2
saturated 0.1M LiPF6/DMSO as a dotted line.
Figure 5.10: cyclic voltammograms obtained for argon purged <0.5 mM (saturated) solutions
of FePC in 0.1M LiPF6/MeCN and 0.1M LiCF3SO3/MeCN. CV obtained for the O2 saturated
0.1M LiPF6/MeCN electrolyte is shown as a black dotted line.
It appears that the Fe(II)/Fe(I) redox reaction occurs about 300 mV above the O2 reduction onset
at 2.9 V on the pristine glassy carbon electrode. The resulting Fe(I) center at the ORR onset
potential has the ability to stabilize the superoxide ion via an inner Helmholtz plane electron
transfer to form O2 reduction products.
148
Comparison of the CVs obtained for redox activity of FePC dissolved in LiPF6/MeCN
and LiCF3SO3/MeCN (Figure 5.10) suggests that the effect of the donor ability of the lithium salt
anion74
on the redox potentials of iron is insignificant in MeCN – based electrolytes. The reason
is that MeCN is a strong σ donor which coordinates to the Fe metal center through the nitrogen
atom. It has been reported that the bond distance between the Fe atom and the nitrogen of MeCN
is shorter than these distances observed for other nitrogen based solvents such as pyridine and
amine.116
We further studied the redox activity of FePC –based catalyst thin films deposited on a
glassy carbon electrode.
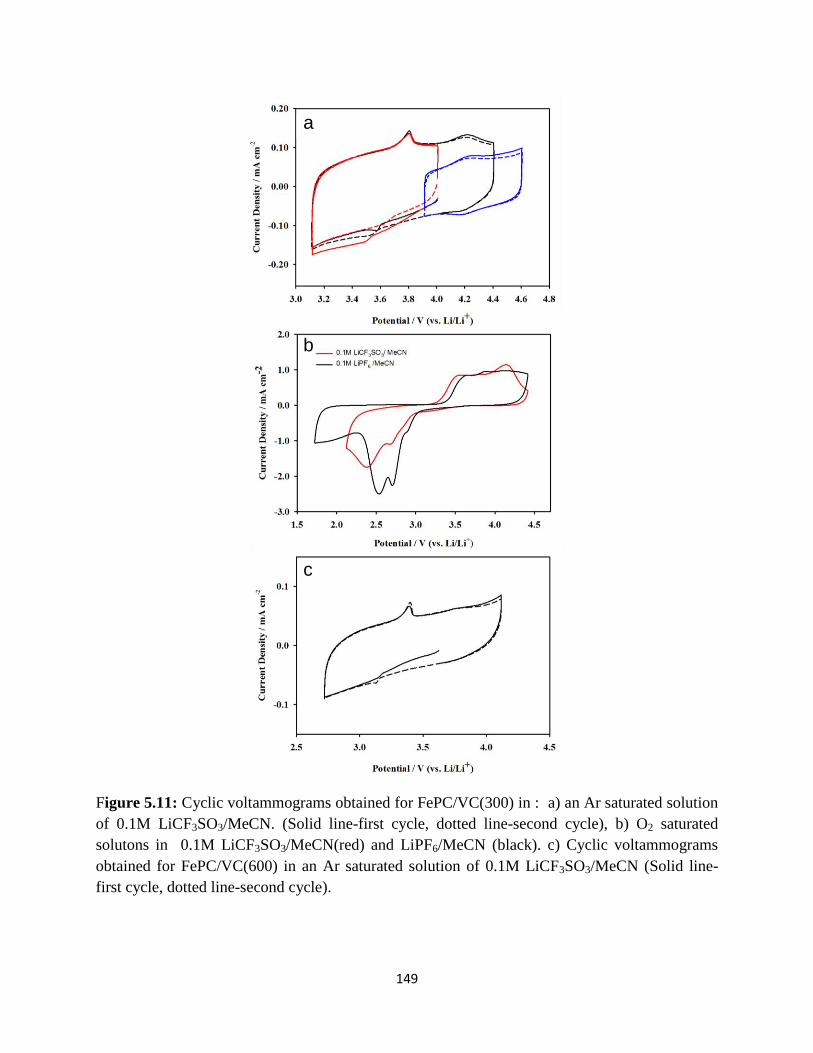
149
Figure 5.11: Cyclic voltammograms obtained for FePC/VC(300) in : a) an Ar saturated solution
of 0.1M LiCF3SO3/MeCN. (Solid line-first cycle, dotted line-second cycle), b) O2 saturated
solutons in 0.1M LiCF3SO3/MeCN(red) and LiPF6/MeCN (black). c) Cyclic voltammograms
obtained for FePC/VC(600) in an Ar saturated solution of 0.1M LiCF3SO3/MeCN (Solid line-
first cycle, dotted line-second cycle).
a
b
c
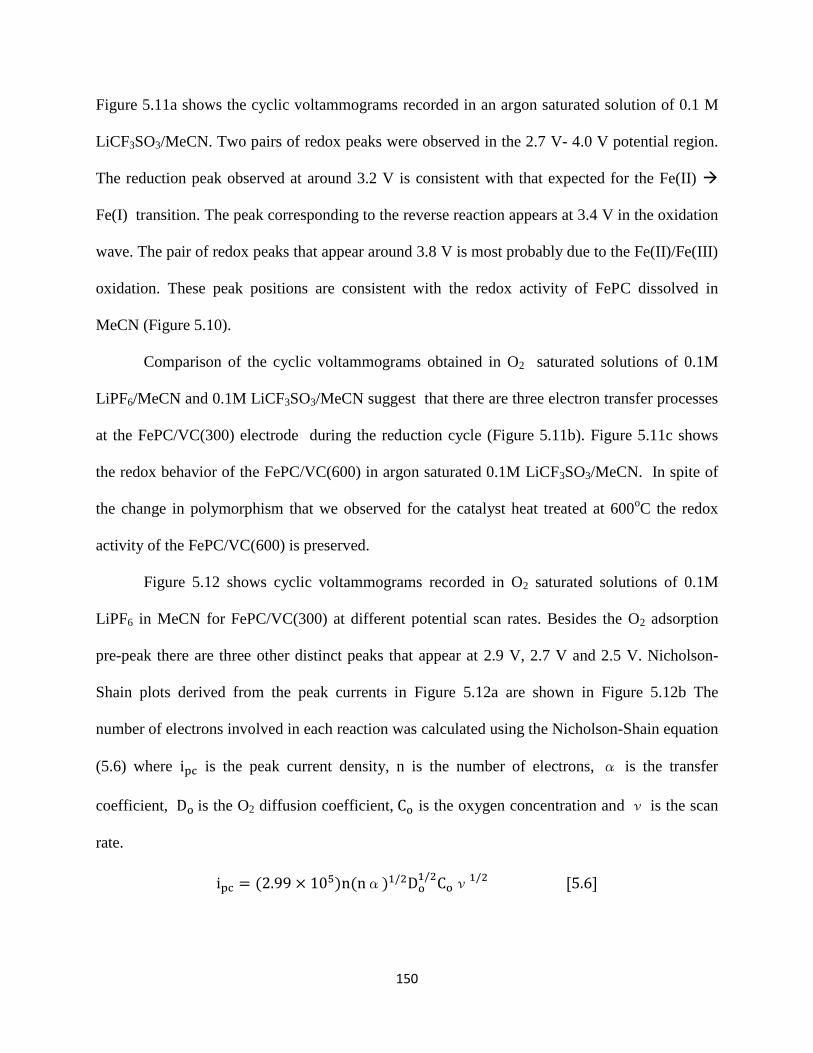
150
Figure 5.11a shows the cyclic voltammograms recorded in an argon saturated solution of 0.1 M
LiCF3SO3/MeCN. Two pairs of redox peaks were observed in the 2.7 V- 4.0 V potential region.
The reduction peak observed at around 3.2 V is consistent with that expected for the Fe(II)
Fe(I) transition. The peak corresponding to the reverse reaction appears at 3.4 V in the oxidation
wave. The pair of redox peaks that appear around 3.8 V is most probably due to the Fe(II)/Fe(III)
oxidation. These peak positions are consistent with the redox activity of FePC dissolved in
MeCN (Figure 5.10).
Comparison of the cyclic voltammograms obtained in O2 saturated solutions of 0.1M
LiPF6/MeCN and 0.1M LiCF3SO3/MeCN suggest that there are three electron transfer processes
at the FePC/VC(300) electrode during the reduction cycle (Figure 5.11b). Figure 5.11c shows
the redox behavior of the FePC/VC(600) in argon saturated 0.1M LiCF3SO3/MeCN. In spite of
the change in polymorphism that we observed for the catalyst heat treated at 600oC the redox
activity of the FePC/VC(600) is preserved.
Figure 5.12 shows cyclic voltammograms recorded in O2 saturated solutions of 0.1M
LiPF6 in MeCN for FePC/VC(300) at different potential scan rates. Besides the O2 adsorption
pre-peak there are three other distinct peaks that appear at 2.9 V, 2.7 V and 2.5 V. Nicholson-
Shain plots derived from the peak currents in Figure 5.12a are shown in Figure 5.12b The
number of electrons involved in each reaction was calculated using the Nicholson-Shain equation
(5.6) where ipc is the peak current density, n is the number of electrons, α is the transfer
coefficient, Do is the O2 diffusion coefficient, Co is the oxygen concentration and ν is the scan
rate.
ipc = (2.99 × 10⁵)n(nα)1/2Do1/2
Coν1/2 [5.6]

151
Figure 5.12: a) Cyclic voltammograms obtained for FePC/VC(300) in oxygen saturated
solutions of 0.1M LiPF6/MeCN at scan rates ranging from 10-100 mV s-1
, b) Nicholson-Shain
plots for the ORR peak currents obtained at FePC/VC(300). (The dotted line indicates the
theoretical Nicholsan-Shain plot for n=1)
The theoretically calculated Nicholson-Shain plot for one-electron reduction of oxygen in MeCN
is shown as a dotted line in Figure 5.12b. The plot calculated for the first reduction peak (a) is in
Peak a Peak b Peak c
a
b c
a
b
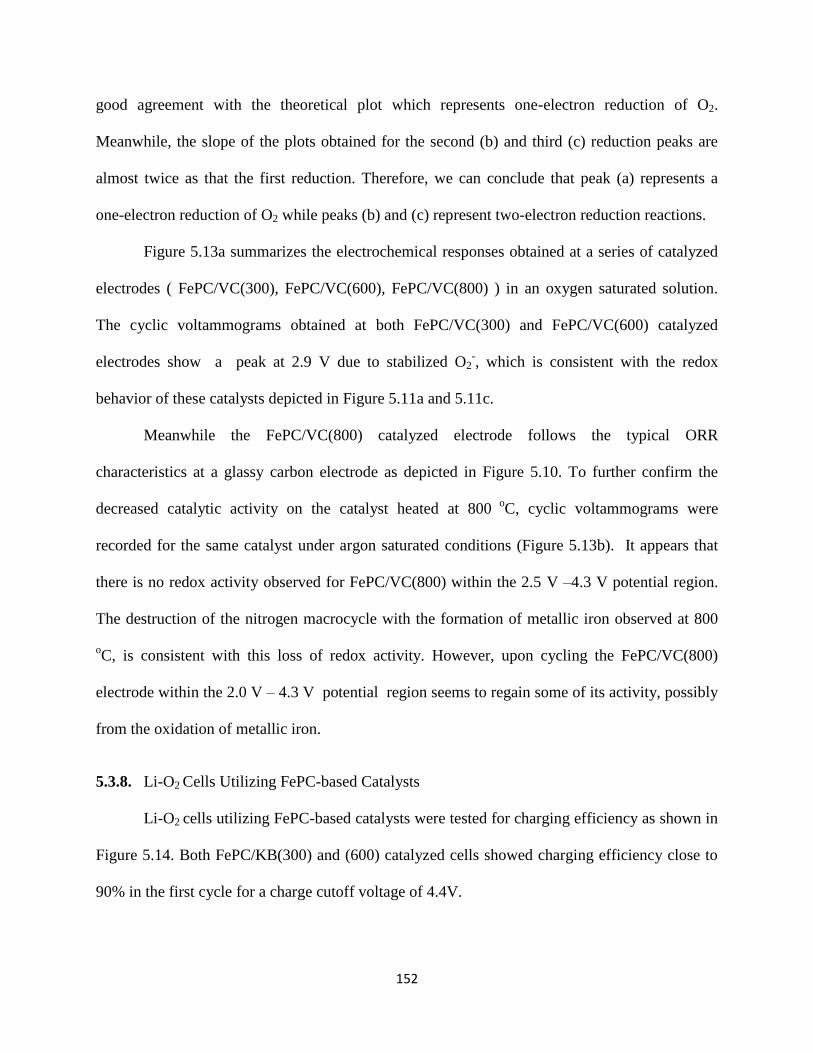
152
good agreement with the theoretical plot which represents one-electron reduction of O2.
Meanwhile, the slope of the plots obtained for the second (b) and third (c) reduction peaks are
almost twice as that the first reduction. Therefore, we can conclude that peak (a) represents a
one-electron reduction of O2 while peaks (b) and (c) represent two-electron reduction reactions.
Figure 5.13a summarizes the electrochemical responses obtained at a series of catalyzed
electrodes ( FePC/VC(300), FePC/VC(600), FePC/VC(800) ) in an oxygen saturated solution.
The cyclic voltammograms obtained at both FePC/VC(300) and FePC/VC(600) catalyzed
electrodes show a peak at 2.9 V due to stabilized O2-, which is consistent with the redox
behavior of these catalysts depicted in Figure 5.11a and 5.11c.
Meanwhile the FePC/VC(800) catalyzed electrode follows the typical ORR
characteristics at a glassy carbon electrode as depicted in Figure 5.10. To further confirm the
decreased catalytic activity on the catalyst heated at 800 o
C, cyclic voltammograms were
recorded for the same catalyst under argon saturated conditions (Figure 5.13b). It appears that
there is no redox activity observed for FePC/VC(800) within the 2.5 V –4.3 V potential region.
The destruction of the nitrogen macrocycle with the formation of metallic iron observed at 800
oC, is consistent with this loss of redox activity. However, upon cycling the FePC/VC(800)
electrode within the 2.0 V – 4.3 V potential region seems to regain some of its activity, possibly
from the oxidation of metallic iron.
5.3.8. Li-O2 Cells Utilizing FePC-based Catalysts
Li-O2 cells utilizing FePC-based catalysts were tested for charging efficiency as shown in
Figure 5.14. Both FePC/KB(300) and (600) catalyzed cells showed charging efficiency close to
90% in the first cycle for a charge cutoff voltage of 4.4V.
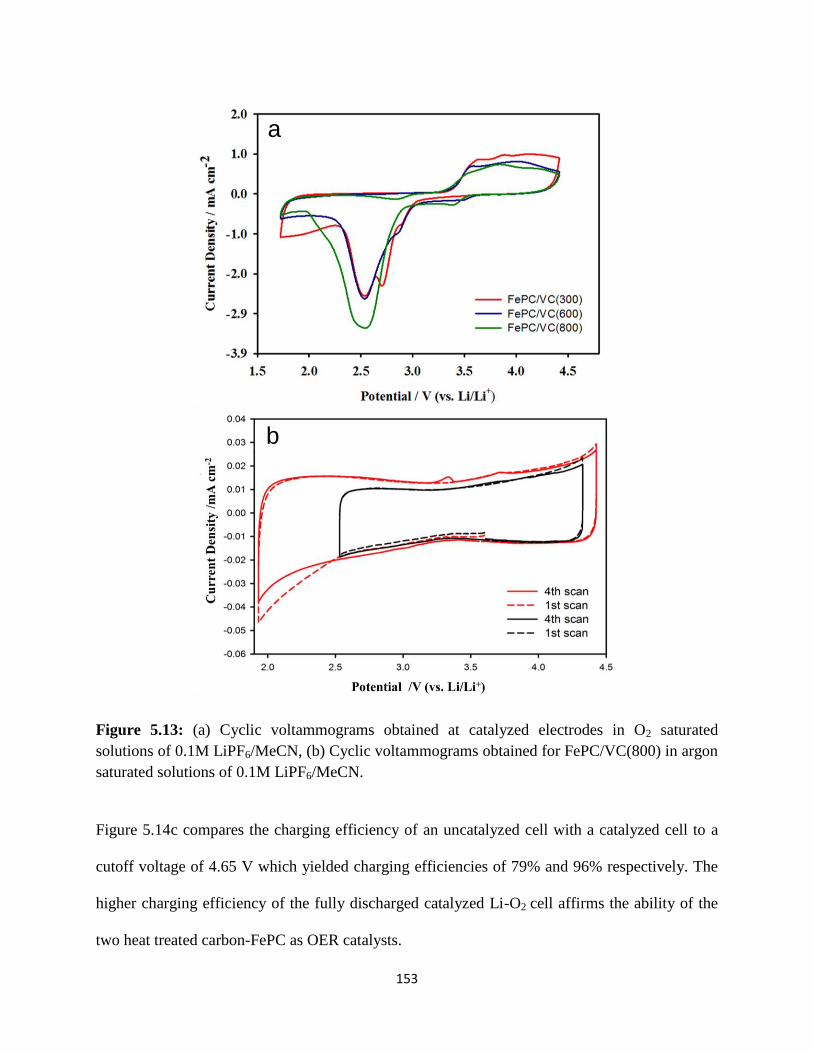
153
Figure 5.13: (a) Cyclic voltammograms obtained at catalyzed electrodes in O2 saturated
solutions of 0.1M LiPF6/MeCN, (b) Cyclic voltammograms obtained for FePC/VC(800) in argon
saturated solutions of 0.1M LiPF6/MeCN.
Figure 5.14c compares the charging efficiency of an uncatalyzed cell with a catalyzed cell to a
cutoff voltage of 4.65 V which yielded charging efficiencies of 79% and 96% respectively. The
higher charging efficiency of the fully discharged catalyzed Li-O2 cell affirms the ability of the
two heat treated carbon-FePC as OER catalysts.
a
b
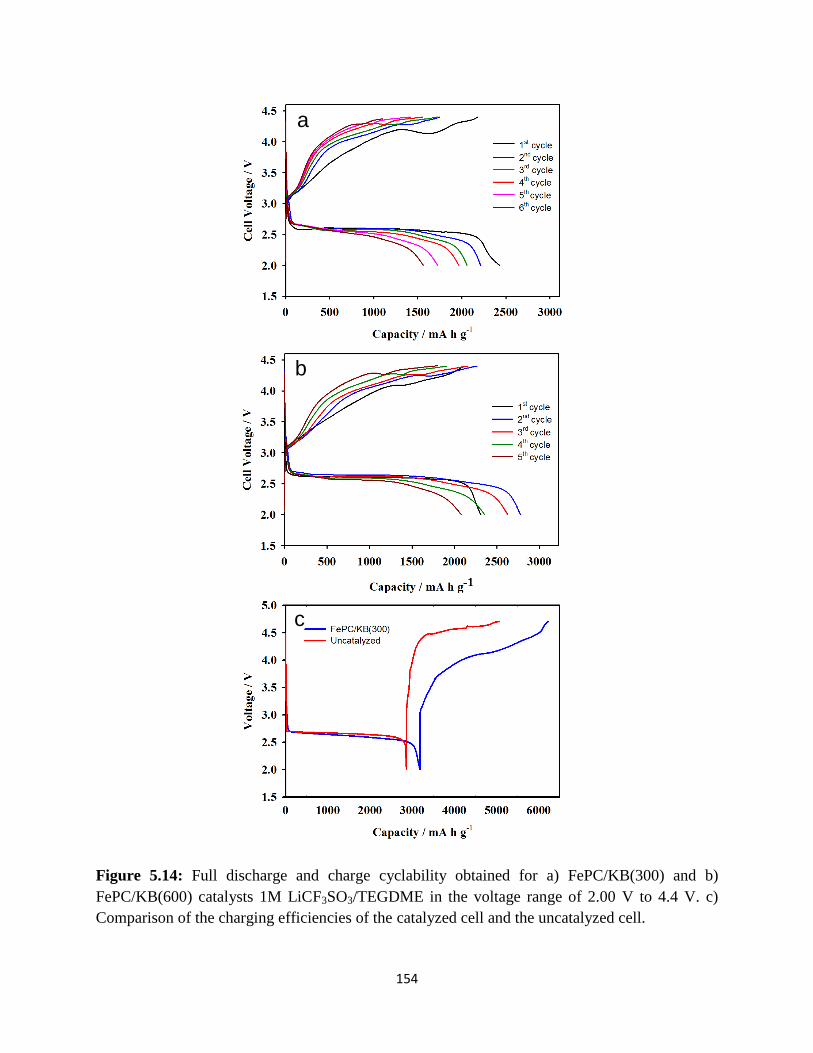
154
Figure 5.14: Full discharge and charge cyclability obtained for a) FePC/KB(300) and b)
FePC/KB(600) catalysts 1M LiCF3SO3/TEGDME in the voltage range of 2.00 V to 4.4 V. c)
Comparison of the charging efficiencies of the catalyzed cell and the uncatalyzed cell.
a
b
c

155
Lithium- oxygen cells were cycled with a capacity limit of 400 mA h g-1
(Figure 5.15). All three
catalyzed cells with FePC/KB(300), FePC/KB(600) and FePC/KB(800) survived through their
40th
cycle with 100% capacity utilization. This is a two fold increase in cycle life compared to
the un-catalyzed Li-O2 cell.
Figure 5.15: Cycling performance obtained for a) FePC/KB(300) b) FePC/KB(600) c)
FePC/KB(800) catalyzed and d) uncatalyzed(Ketjenblack) cells in 1M LiCF3SO3/TEGDME. The
cell are capacity limited at 400 mA h/g. The charge limit is 4.65 V.
5.3.9. Li-O2 Cell Discharge Products
Figure 5.16 is a comparison of XRD spectra obtained for uncatalyzed (Figure 5.16a) and
FePC/KB(600) catalyzed (Figure 5.16b) Li-O2 cell cathodes after full discharge with a capacity
a b
c d
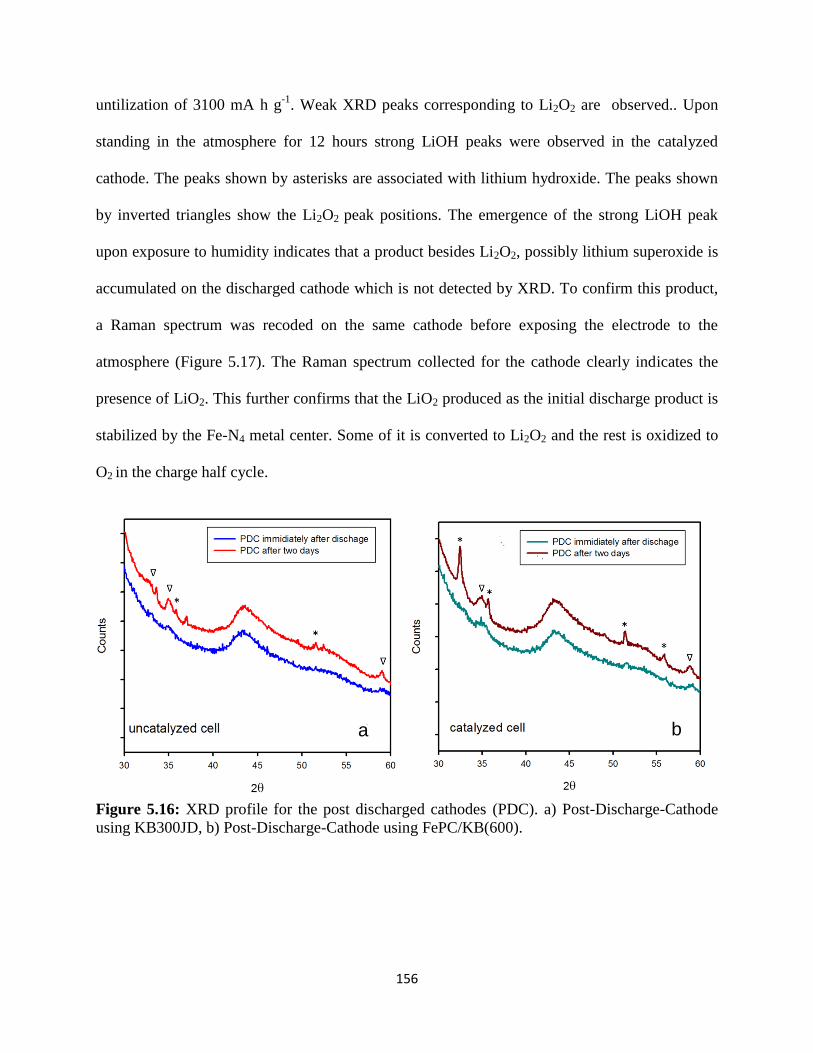
156
untilization of 3100 mA h g-1
. Weak XRD peaks corresponding to Li2O2 are observed.. Upon
standing in the atmosphere for 12 hours strong LiOH peaks were observed in the catalyzed
cathode. The peaks shown by asterisks are associated with lithium hydroxide. The peaks shown
by inverted triangles show the Li2O2 peak positions. The emergence of the strong LiOH peak
upon exposure to humidity indicates that a product besides Li2O2, possibly lithium superoxide is
accumulated on the discharged cathode which is not detected by XRD. To confirm this product,
a Raman spectrum was recoded on the same cathode before exposing the electrode to the
atmosphere (Figure 5.17). The Raman spectrum collected for the cathode clearly indicates the
presence of LiO2. This further confirms that the LiO2 produced as the initial discharge product is
stabilized by the Fe-N4 metal center. Some of it is converted to Li2O2 and the rest is oxidized to
O2 in the charge half cycle.
Figure 5.16: XRD profile for the post discharged cathodes (PDC). a) Post-Discharge-Cathode
using KB300JD, b) Post-Discharge-Cathode using FePC/KB(600).
a b
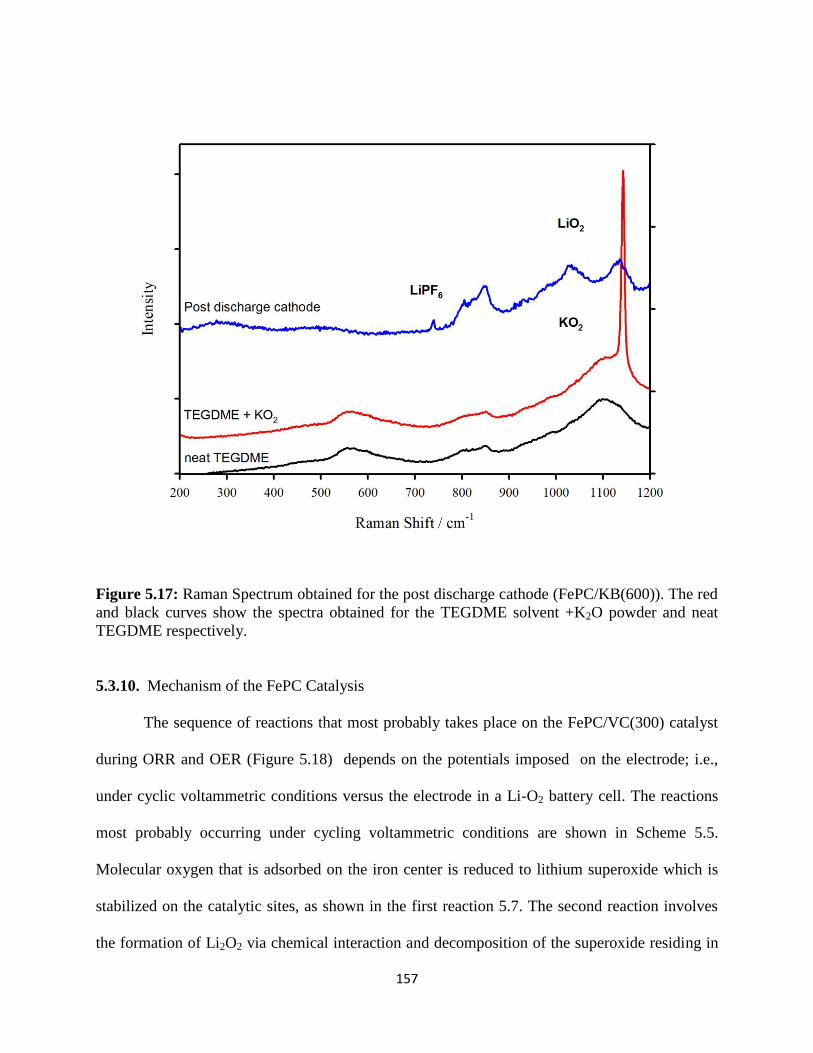
157
Figure 5.17: Raman Spectrum obtained for the post discharge cathode (FePC/KB(600)). The red
and black curves show the spectra obtained for the TEGDME solvent +K2O powder and neat
TEGDME respectively.
5.3.10. Mechanism of the FePC Catalysis
The sequence of reactions that most probably takes place on the FePC/VC(300) catalyst
during ORR and OER (Figure 5.18) depends on the potentials imposed on the electrode; i.e.,
under cyclic voltammetric conditions versus the electrode in a Li-O2 battery cell. The reactions
most probably occurring under cycling voltammetric conditions are shown in Scheme 5.5.
Molecular oxygen that is adsorbed on the iron center is reduced to lithium superoxide which is
stabilized on the catalytic sites, as shown in the first reaction 5.7. The second reaction involves
the formation of Li2O2 via chemical interaction and decomposition of the superoxide residing in
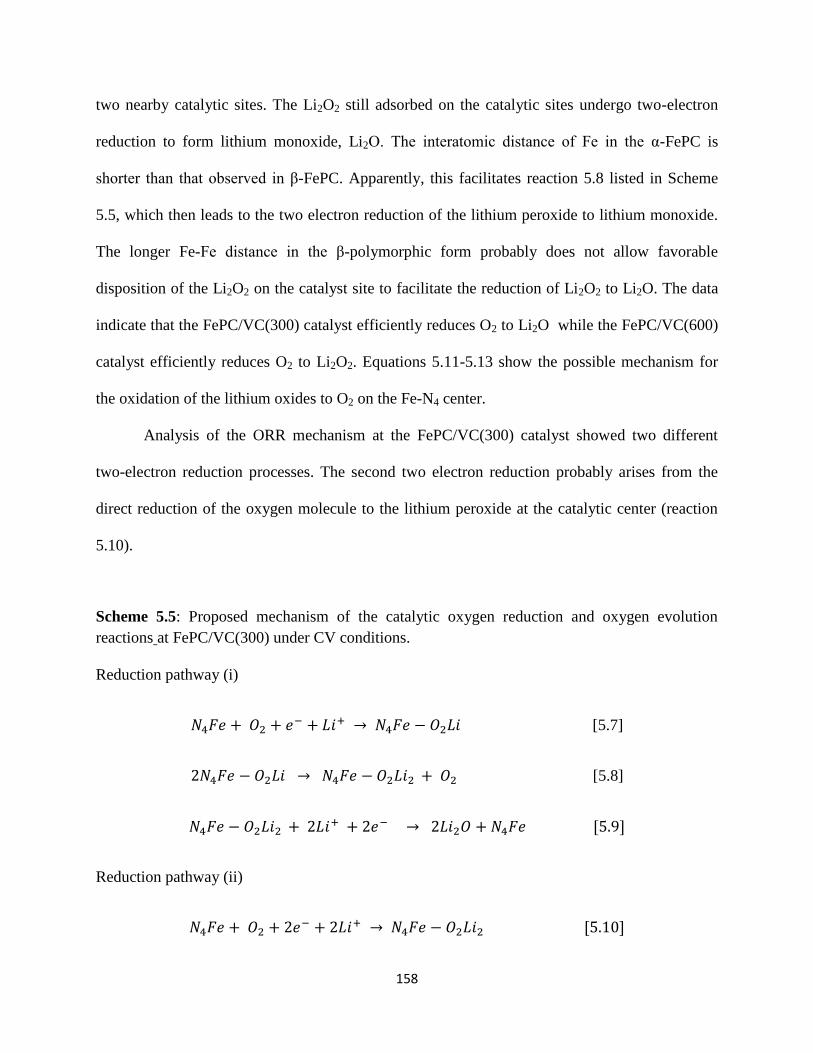
158
two nearby catalytic sites. The Li2O2 still adsorbed on the catalytic sites undergo two-electron
reduction to form lithium monoxide, Li2O. The interatomic distance of Fe in the α-FePC is
shorter than that observed in β-FePC. Apparently, this facilitates reaction 5.8 listed in Scheme
5.5, which then leads to the two electron reduction of the lithium peroxide to lithium monoxide.
The longer Fe-Fe distance in the β-polymorphic form probably does not allow favorable
disposition of the Li2O2 on the catalyst site to facilitate the reduction of Li2O2 to Li2O. The data
indicate that the FePC/VC(300) catalyst efficiently reduces O2 to Li2O while the FePC/VC(600)
catalyst efficiently reduces O2 to Li2O2. Equations 5.11-5.13 show the possible mechanism for
the oxidation of the lithium oxides to O2 on the Fe-N4 center.
Analysis of the ORR mechanism at the FePC/VC(300) catalyst showed two different
two-electron reduction processes. The second two electron reduction probably arises from the
direct reduction of the oxygen molecule to the lithium peroxide at the catalytic center (reaction
5.10).
Scheme 5.5: Proposed mechanism of the catalytic oxygen reduction and oxygen evolution
reactions at FePC/VC(300) under CV conditions.
Reduction pathway (i)
𝑁4𝐹𝑒 + 𝑂2 + 𝑒− + 𝐿𝑖+ → 𝑁4𝐹𝑒 − 𝑂2𝐿𝑖 [5.7]
2𝑁4𝐹𝑒 − 𝑂2𝐿𝑖 → 𝑁4𝐹𝑒 − 𝑂2𝐿𝑖2 + 𝑂2 [5.8]
𝑁4𝐹𝑒 − 𝑂2𝐿𝑖2 + 2𝐿𝑖+ + 2𝑒− → 2𝐿𝑖2𝑂 + 𝑁4𝐹𝑒 [5.9]
Reduction pathway (ii)
𝑁4𝐹𝑒 + 𝑂2 + 2𝑒− + 2𝐿𝑖+ → 𝑁4𝐹𝑒 − 𝑂2𝐿𝑖2 [5.10]
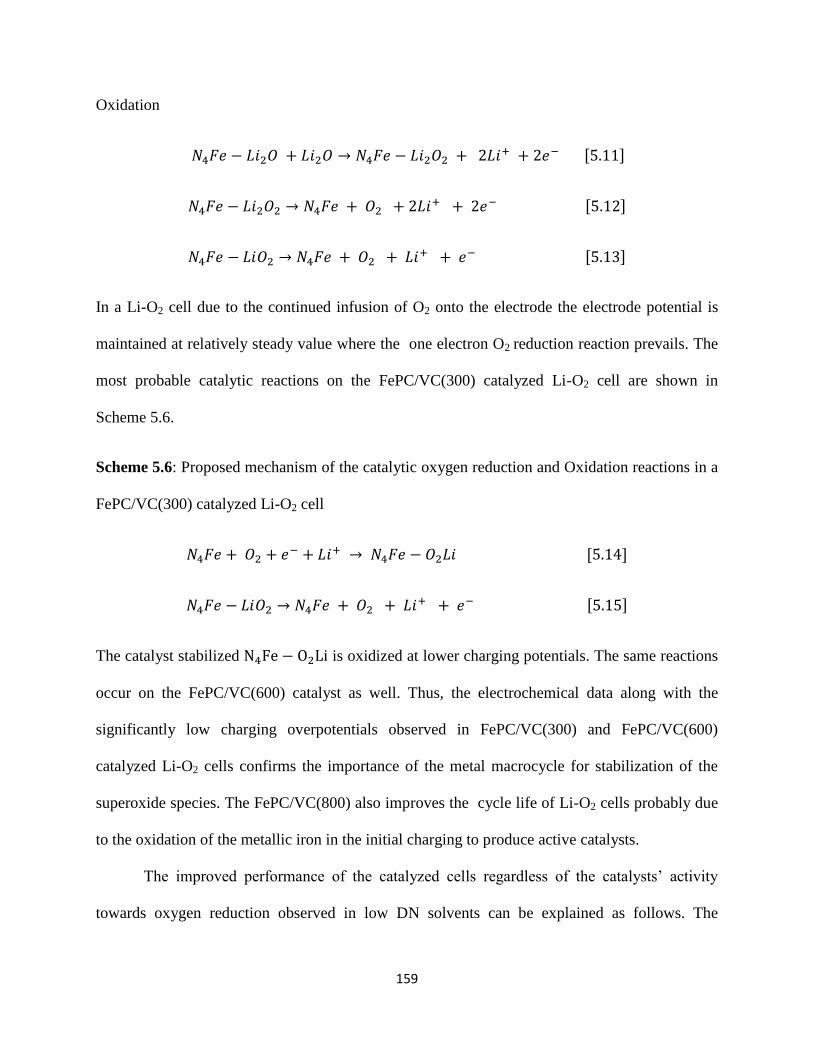
159
Oxidation
𝑁4𝐹𝑒 − 𝐿𝑖2𝑂 + 𝐿𝑖2𝑂 → 𝑁4𝐹𝑒 − 𝐿𝑖2𝑂2 + 2𝐿𝑖+ + 2𝑒− [5.11]
𝑁4𝐹𝑒 − 𝐿𝑖2𝑂2 → 𝑁4𝐹𝑒 + 𝑂2 + 2𝐿𝑖+ + 2𝑒− [5.12]
𝑁4𝐹𝑒 − 𝐿𝑖𝑂2 → 𝑁4𝐹𝑒 + 𝑂2 + 𝐿𝑖+ + 𝑒− [5.13]
In a Li-O2 cell due to the continued infusion of O2 onto the electrode the electrode potential is
maintained at relatively steady value where the one electron O2 reduction reaction prevails. The
most probable catalytic reactions on the FePC/VC(300) catalyzed Li-O2 cell are shown in
Scheme 5.6.
Scheme 5.6: Proposed mechanism of the catalytic oxygen reduction and Oxidation reactions in a
FePC/VC(300) catalyzed Li-O2 cell
𝑁4𝐹𝑒 + 𝑂2 + 𝑒− + 𝐿𝑖+ → 𝑁4𝐹𝑒 − 𝑂2𝐿𝑖 [5.14]
𝑁4𝐹𝑒 − 𝐿𝑖𝑂2 → 𝑁4𝐹𝑒 + 𝑂2 + 𝐿𝑖+ + 𝑒− [5.15]
The catalyst stabilized N4Fe − O2Li is oxidized at lower charging potentials. The same reactions
occur on the FePC/VC(600) catalyst as well. Thus, the electrochemical data along with the
significantly low charging overpotentials observed in FePC/VC(300) and FePC/VC(600)
catalyzed Li-O2 cells confirms the importance of the metal macrocycle for stabilization of the
superoxide species. The FePC/VC(800) also improves the cycle life of Li-O2 cells probably due
to the oxidation of the metallic iron in the initial charging to produce active catalysts.
The improved performance of the catalyzed cells regardless of the catalysts’ activity
towards oxygen reduction observed in low DN solvents can be explained as follows. The

160
discharge voltage plateaus of these cells operated in a continuous flow of oxygen represent the
one-electron reduction reaction of oxygen to form lithium superoxide, LiO2. The LiO2 is
converted to Li2O2 via the well-established chemical decomposition reaction. The stability and
lifetime of the superoxide is determined by the nature of the catalytic site, which also catalyzes
the oxidation of Li2O2 to O2 at a lower voltage in the charge half cycle. The catalysis of both the
discharge and charge reactions account for the doubling of the cycle life of the Li-O2 cell.
However, the Li2O2 formed in each cell by chemical decomposition would passivate the
electrode during prolonged cycling and decrease the catalytic activity of the reaction sites.
Therefore, in prolonged operation of the Li-O2 cell the activity of the catalyst decreases and
affects the cycle life of the cell.
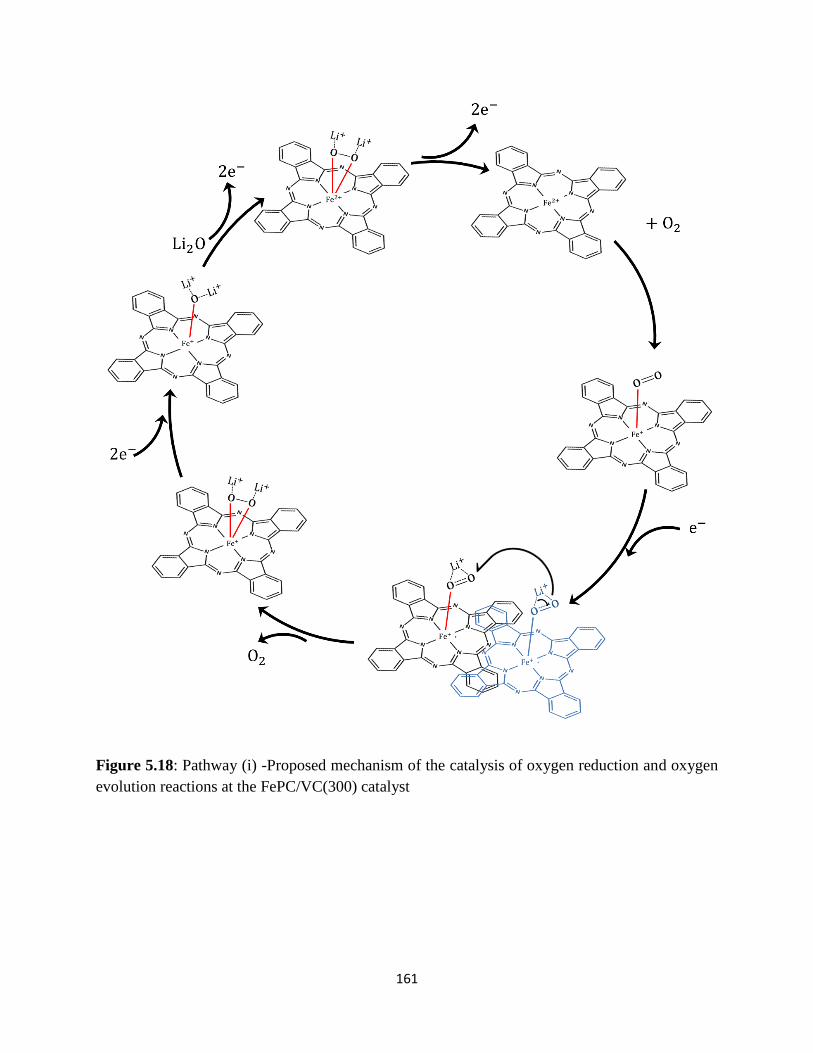
161
Figure 5.18: Pathway (i) -Proposed mechanism of the catalysis of oxygen reduction and oxygen
evolution reactions at the FePC/VC(300) catalyst
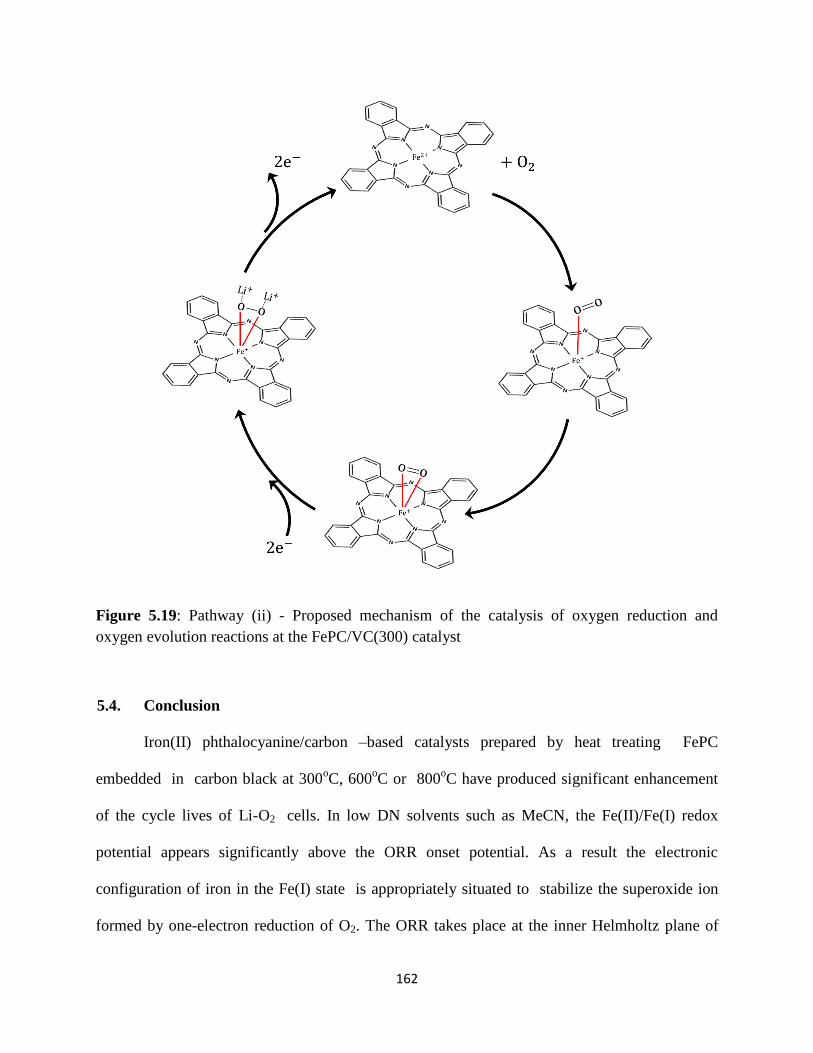
162
Figure 5.19: Pathway (ii) - Proposed mechanism of the catalysis of oxygen reduction and
oxygen evolution reactions at the FePC/VC(300) catalyst
5.4. Conclusion
Iron(II) phthalocyanine/carbon –based catalysts prepared by heat treating FePC
embedded in carbon black at 300oC, 600
oC or 800
oC have produced significant enhancement
of the cycle lives of Li-O2 cells. In low DN solvents such as MeCN, the Fe(II)/Fe(I) redox
potential appears significantly above the ORR onset potential. As a result the electronic
configuration of iron in the Fe(I) state is appropriately situated to stabilize the superoxide ion
formed by one-electron reduction of O2. The ORR takes place at the inner Helmholtz plane of
163
the catalyzed electrode in such conditions. The Fe-Fe interatomic distance in α-FePC favors
interaction of the superoxide species residing on Fe centers adjacent to each other with the result
the superoxide is converted to peroxide by chemical decomposition. The peroxide is in turn
reduced to lithium monoxide at the FePC/VC(300) while such reaction is not observed at the
FePC/VC(600) electrode where the Fe-Fe distance is longer in the of FePC β polymorph.
Destruction of the Fe-N4 observed in the catalyst heated up to 800oC is consistent with its
inability to stabilize lithium superoxide on the catalyst center. Our data suggest that while the Fe-
N4 center is crucial for the catalytic oxygen reduction reaction, the metal center also is capable of
catalyzing the oxygen evolution reaction. Finally, FePC/Carbon–based catalysts can be
successfully employed in Li-O2 batteries to catalyze both oxygen reduction reactions and oxygen
evolutions leading to longer cycle life for the battery.
164
Chapter 6
Conclusions and Future Directions
6.1. Alkaline Anion Exchange Membrane Fuel Cells
Overcoming the challenges associated with alkaline anion membrane fuel cell technology
is essential for its advancement as a potential portable power source and to replace the costly
PEMFC technology as a whole. While the electrochemistry of fuel cell reactions in alkaline
environments are advantageous particularly due to the electrocatalytic activity of cheap non-
PGM catalysts on the oxygen cathode, there are many limitations that are yet to be resolved. As
we have experimentally shown in Chapter 2, the carbonate exchange has a significant influence
on oxygen reduction, hydrogen oxidation and methanol oxidation reactions pertaining to fuel
cells. The results show that the ORR kinetics is not significantly affected. On the other hand,
both HOR and MOR tend to proceed through the carbonate pathway at carbonate-containing
anion exchange membrane interfaces. This leads to a significant decrease in the electrode
activity. Strong ion pairing of doubly charged carbonate ions with the immobile quaternary
ammonium (R4N+) species is shown to affect the diffusion pathways and exert hindrance to the
overall transport of reactants through the polymer. To overcome these challenges it is important
to develop suitable anion exchange membranes which have polymer structures less prone to
change with carbonate exchange. Developing the fuel cell architecture and operating conditions
to regenerate the AEM to the hydroxide form efficiently will also be beneficial. Finally,
synthesis of electrocatalysts which can selectively promote the electrode reactions through the
hydroxide pathway in the presence of carbonate ions will significantly improve the utility of
AEMFCs as a future generation power source.
165
6.2. Lithium-Oxygen Batteries
Developing Li-O2 batteries as a viable alternative for energy storage includes overcoming
the many challenges stated in Chapter 1. In this sense, formulation of battery electrolytes to
suitably modulate the Li+ Lewis acidity and control the stability of reactive O2 reduction reaction
intermediates is essential. Capacity and cycle life of Li-O2 batteries are determined by the
solubility of lithium oxide products in the electrolytes, stability of the electrolyte itself and the
kinetics and mechanism of oxygen reduction and oxygen evolution reactions on the electrodes.
We have shown in Chapters 3 and 4 that the electron donor ability of the lithium salt anion is
beneficial in improving the life-time of the lithium superoxide formed which in turn determines
the extent of electrode passivation by insoluble lithium peroxide. Chelating linear solvents such
as TEGDME play an important role on ORR by forming solvates with a curled conformation
around Li+
in the Li--O2- ion pair, thereby efficiently shielding it from further decomposition.
Whereas the electron donor properties of the electrolyte benefit the reversibility of the ORR in
uncatalyzed systems, it modulates the mechanism of ORR and OER on catalyzed electrodes. We
have shown in Chapter 5 that the oxidation state of the catalyst which determines the Lewis
acidity of the catalyst center in FePC–based catalysts facilitates superoxide stabilization of the
metal center in Low Donor Number electrolytes. This in turn drives the ORR through an inner
Helmholtz plane electron transfer process. In high donor number electrolytes, the oxidation state
of the iron (which is coupled to the Donor Number of the solvent) and the ability of the
electrolyte to decrease the Li+ Lewis acidity promotes the ORR at the outer Helmholtz plane
(outer plane electron transfer). Detailed understanding of these catalytic reaction conditions in
electrolytes of high and low electron donor properties, have been extremely helpful in
formulating the optimum electrolytes and cathodes for the Li-O2 battery. However, it is clear
166
from our data that the Li anode itself plays a major role in determining the battery’s cycle life.
Continuous oxidation (stripping) of lithium metal during discharge followed by lithium plating
and on recharge will eventually damage the uniformity of the anode interface and lead to the
formation of insulating bi-products that limit the cycle life of the battery. Therefore, improving
the performance of the Li anode through appropriate electrode architecture and formulation of
electrolytes with additives to facilitate efficient Li electroplating, is essential to develop a
practical rechargeable Li-O2 battery for the future.
167
References
1. in Meeting the Energy Challenges of the Future: A Guide for Policymakers, National Conference
of State Legislatures.
2. A. Sieminski, International Energy Outlook, (2014).
3. M. Ünlü, D. Abbott, N. Ramaswamy, X. Ren, S. Mukerjee and P. A. Kohl, Journal of The
Electrochemical Society, 158, B1423-B1431, (2011).
4. E. Skulason, G. S. Karlberg, J. Rossmeisl, T. Bligaard, J. Greeley, H. Jonsson and J. K. Norskov,
Physical Chemistry Chemical Physics, 9, 3241-3250, (2007).
5. S. G. Osborn, A. Vengosh, N. R. Warner and R. B. Jackson, proceedings of the National
Academy of Sciences, 108, 8172-8176, (2011).
6. W. Sheng, H. A. Gasteiger and Y. Shao-Horn, Journal of The Electrochemical Society, 157,
B1529-B1536, (2010).
7. J. S. Spendelow and A. Wieckowski, Physical Chemistry Chemical Physics, 9, 2654-2675,
(2007).
8. N. Ramaswamy and S. Mukerjee, The Journal of Physical Chemistry C, 115, 18015-18026,
(2011).
9. J. R. Varcoe and R. C. T. Slade, Fuel Cells, 5, 187-200, (2005).
10. E. Volodina, Y. Senik, O. Basova, N. Pismenskaya, V. Nikonenko and G. Pourcelly,
Desalination, 149, 459-464, (2002).
11. N. Pismenskaya, E. Laktionov, V. Nikonenko, A. El Attar, B. Auclair and G. Pourcelly, Journal
of Membrane Science, 181, 185-197, (2001).
12. V. Nikonenko, K. Lebedev, J. A. Manzanares and G. Pourcelly, Electrochim. Acta, 48, 3639-
3650, (2003).
13. I. Gunasekara, M. Lee, D. Abbott and S. Mukerjee, ECS Electrochemistry Letters, 1, F16-F19,
(2012).
168
14. S. Watanabe, K. Fukuta and H. Yanagi, ECS Transactions, 33, 1837-1845, (2010).
15. H. A. Gasteiger, S. S. Kocha, B. Sompalli and F. T. Wagner, Applied Catalysis B: Environmental,
56, 9-35, (2005).
16. M. S. Saha, A. F. Gullá, R. J. Allen and S. Mukerjee, Electrochimica Acta, 51, 4680-4692,
(2006).
17. C. A. Vincent, Solid State Ionics, 134, 159-167, (2000).
18. J.-M. Tarascon and M. Armand, Nature, 414, 359-367, (2001).
19. K. M. Abraham and Z. Jiang, Journal of The Electrochemical Society, 143, 1-5, (1996).
20. K. Xu, Chemical Reviews, 104, 4303-4418, (2004).
21. M. Alamgir, K. M. Abraham and G. Pistoia, Industrial Chemistry Library, 5, 114, (1994).
22. C. O. Laoire, S. Mukerjee, K. M. Abraham, E. J. Plichta and M. A. Hendrickson, The Journal of
Physical Chemistry C, 114, 9178-9186, (2010).
23. M. Salomon, Journal of Power Sources, 26, 9-21, (1989).
24. Y. Marcus, Chemical Society Reviews, 22, 409-416, (1993).
25. C. Laoire, S. Mukerjee, E. J. Plichta, M. A. Hendrickson and K. M. Abraham, Journal of The
Electrochemical Society, 158, A302-A308, (2011).
26. S. Zhang, N. Sun, X. He, X. Lu and X. Zhang, Journal of physical and chemical reference data,
35, 1475-1517, (2006).
27. T. Singh and A. Kumar, The Journal of Physical Chemistry B, 112, 12968-12972, (2008).
28. A. Nomura, K. Ohno, T. Fukuda, T. Sato and Y. Tsujii, Polymer Chemistry, 3, 148-153, (2012).
29. M. J. Trahan, I. Gunasekara, S. Mukerjee, E. J. Plichta, M. A. Hendrickson and K. M. Abraham,
Journal of The Electrochemical Society, 161, A1706-A1715, (2014).
30. M. J. Trahan, S. Mukerjee, E. J. Plichta, M. A. Hendrickson and K. M. Abraham, Journal of The
Electrochemical Society, 160, A259-A267, (2013).
31. I. Gunasekara, S. Mukerjee, E. J. Plichta, M. A. Hendrickson and K. M. Abraham, Journal of The
Electrochemical Society, 161, A381-A392, (2014).
169
32. C. O. Laoire, S. Mukerjee, K. M. Abraham, E. J. Plichta and M. A. Hendrickson, The Journal of
Physical Chemistry C, 113, 20127-20134, (2009).
33. M. I. Montenegro, M. A. Queirós and J. L. Daschbach, Microelectrodes: theory and applications,
Springer, 1991.
34. C. P. Winlove, K. H. Parker and R. K. C. Oxenham, Journal of Electroanalytical Chemistry and
Interfacial Electrochemistry, 170, 293-304, (1984).
35. J. Janisch, A. Ruff, B. Speiser, C. Wolff, J. Zigelli, S. Benthin, V. Feldmann and H. A. Mayer,
Journal of Solid State Electrochemistry, 15, 2083-2094, (2011).
36. I. Gunasekara, S. Mukerjee and K. M. Abraham, Microelectrode Investigations of Oxygen
Reduction Reactions in Lithium-Air Batteries, ECS Meeting Abstracts, 2013; MA2013-02, p-449.
37. I. Gunasekara, S. Mukerjee, E. J. Plichta, M. A. Hendrickson and K. M. Abraham, Journal of The
Electrochemical Society, 162, A1055-A1066, (2015).
38. M. Piana, M. Boccia, A. Filpi, E. Flammia, H. A. Miller, M. Orsini, F. Salusti, S. Santiccioli, F.
Ciardelli and A. Pucci, Journal of Power Sources, 195, 5875-5881, (2010).
39. H. Yanagi and K. Fukuta, ECS Transactions, 16, 257-262, (2008).
40. Z. Siroma, S. Watanabe, K. Yasuda, K. Fukuta and H. Yanagi, Journal of The Electrochemical
Society, 158, B682-B689, (2011).
41. A. Lounis and C. Gavach, J. Membr. Sci., 54, 63-74, (1990).
42. K. N. Grew, X. Ren and D. Chu, Electrochemical and Solid-State Letters, 14, B127-B131,
(2011).
43. J. A. Vega, C. Chartier and W. E. Mustain, J. Power Sources, 195, 7176-7180, (2010).
44. N. J. Robertson, H. A. I. V. Kostalik, T. J. Clark, P. F. Mutolo, H. D. Abruna and G. W. Coates,
Journal of the American Chemical Society, 132, 3400-3404, (2010).
45. J. R. Varcoe, R. C. T. Slade, E. Lam How Yee, S. D. Poynton, D. J. Driscoll and D. C. Apperley,
Chemistry of Materials, 19, 2686-2693, (2007).
46. L. Zhang, C. Ma and S. Mukerjee, Electrochimica Acta, 48, 1845-1859, (2003).
170
47. L. Zhang, C. Ma and S. Mukerjee, Journal of Electroanalytical Chemistry, 568, 273-291, (2004).
48. A. Parthasarathy, C. R. Martin and S. Srinivasan, Journal of The Electrochemical Society, 138,
916-921, (1991).
49. K. Aoki and J. Osteryoung, Journal of Electroanalytical Chemistry and Interfacial
Electrochemistry, 122, 19-35, (1981).
50. W. Sheng, H. A. Gasteiger and Y. Shao-Horn, J. Electrochem. Soc., 157, B1529-B1536, (2010).
51. J. Jiang and A. Kucernak, Journal of Electroanalytical Chemistry, 567, 123-137, (2004).
52. J. A. Vega and W. E. Mustain, Electrochim. Acta, 55, 1638-1644, (2010).
53. Z. Xie and S. Holdcroft, Journal of Electroanalytical Chemistry, 568, 247-260, (2004).
54. Y. M. Tsou, M. C. Kimble and R. E. White, Journal of The Electrochemical Society, 139, 1913-
1917, (1992).
55. Z. Ogumi, Z. Takehara and S. Yoshizawa, Journal of The Electrochemical Society, 131, 769-773,
(1984).
56. J. H. Barber and B. E. Conway, Journal of Electroanalytical Chemistry, 461, 80-89, (1999).
57. A. V. Tripković, K. D. Popović, J. D. Momčilović and D. M. Dražić, Journal of Electroanalytical
Chemistry, 448, 173-181, (1998).
58. E. Herrero, K. Franaszczuk and A. Wieckowski, The Journal of Physical Chemistry, 98, 5074-
5083, (1994).
59. E. H. Yu, K. Scott and R. W. Reeve, Journal of Electroanalytical Chemistry, 547, 17-24, (2003).
60. A. V. Tripković, K. D. Popović, B. N. Grgur, B. Blizanac, P. N. Ross and N. M. Marković,
Electrochimica Acta, 47, 3707-3714, (2002).
61. A. Tripković, K. D. Popović, J. Momčilović and D. Draić, Journal of Electroanalytical
Chemistry, 418, 9-20, (1996).
62. J. Jiang and A. Kucernak, Journal of Electroanalytical Chemistry, 576, 223-236, (2005).
63. K. M. Abraham, P. G. Bruce and L. J. Hardwick, MRS Bull, 36, 506-512, (2011).
171
64. J. Christensen, P. Albertus, R. S. Sanchez-Carrera, T. Lohmann, B. Kozinsky, R. Liedtke, J.
Ahmed and A. Kojic, Journal of The Electrochemical Society, 159, R1-R30, (2011).
65. B. D. McCloskey, D. S. Bethune, R. M. Shelby, G. Girishkumar and A. C. Luntz, The Journal of
Physical Chemistry Letters, 2, 1161-1166, (2011).
66. J. D. Norton, H. S. White and S. W. Feldberg, Journal of physical chemistry, 94, 6772-6780,
(1990).
67. C. J. Allen, S. Mukerjee, E. J. Plichta, M. A. Hendrickson and K. M. Abraham, The Journal of
Physical Chemistry Letters, 2, 2420-2424, (2011).
68. A. J. Wain, G. G. Wildgoose, C. G. R. Heald, L. Jiang, T. G. J. Jones and R. G. Compton, The
Journal of Physical Chemistry B, 109, 3971-3978, (2005).
69. A. J. Bard and L. R. Faulkner, Electrochemical methods: fundamentals and applications, Wiley
New York, 1980.
70. Z. Galus, J. Golas and J. Osteryoung, The Journal of Physical Chemistry, 92, 1103-1107, (1988).
71. C. J. Allen, J. Hwang, R. Kautz, S. Mukerjee, E. J. Plichta, M. A. Hendrickson and K. M.
Abraham, The Journal of Physical Chemistry C, 116, 20755-20764, (2012).
72. D. T. Sawyer and J. L. Roberts Jr, Journal of Electroanalytical Chemistry (1959), 12, 90-101,
(1966).
73. D. T. Sawyer, G. Chiericato, C. T. Angelis, E. J. Nanni and T. Tsuchiya, Analytical Chemistry,
54, 1720-1724, (1982).
74. W. Linert, A. Camard, M. Armand and C. Michot, Coordination Chemistry Reviews, 226, 137-
141, (2002).
75. M. Tang and J. Newman, Journal of The Electrochemical Society, 158, A530-A536, (2011).
76. H.-G. Jung, J. Hassoun, J.-B. Park, Y.-K. Sun and B. Scrosati, Nature Chemistry, 4, 579-585,
(2012).
77. R. S. Drago, D. C. Ferris and N. Wong, Journal of the American Chemical Society, 112, 8953-
8961, (1990).
172
78. Y. M. Cahen, P. R. Handy, E. T. Roach and A. I. Popov, The Journal of Physical Chemistry, 79,
80-85, (1975).
79. R. Arnaud, D. Benrabah and J. Y. Sanchez, The Journal of Physical Chemistry, 100, 10882-
10891, (1996).
80. W. Huang, R. Frech and R. A. Wheeler, The Journal of Physical Chemistry, 98, 100-110, (1994).
81. J. L. Nowinski, P. Lightfoot and P. G. Bruce, Journal of Materials Chemistry, 4, 1579-1580,
(1994).
82. C. O. Laoire, S. Mukerjee, K. M. Abraham, E. J. Plichta and M. A. Hendrickson, The Journal of
Physical Chemistry C, 114, 9178-9186, (2010).
83. K. M. Abraham, Journal of The Electrochemical Society, 162, A3021-A3031, (2015).
84. W. Xu, K. Xu, V. V. Viswanathan, S. A. Towne, J. S. Hardy, J. Xiao, Z. Nie, D. Hu, D. Wang
and J.-G. Zhang, Journal of Power Sources, 196, 9631-9639, (2011).
85. V. S. Bryantsev, V. Giordani, W. Walker, M. Blanco, S. Zecevic, K. Sasaki, J. Uddin, D. Addison
and G. V. Chase, The Journal of Physical Chemistry A, 115, 12399-12409, (2011).
86. D. Aurbach, M. Daroux, P. Faguy and E. Yeager, Journal of Electroanalytical Chemistry and
Interfacial Electrochemistry, 297, 225-244, (1991).
87. M. A. Rivas, T. P. Iglesias, S. M. Pereira and N. Banerji, The Journal of Chemical
Thermodynamics, 38, 245-256, (2006).
88. C. F. Riadigos, R. Iglesias, M. A. Rivas and T. P. Iglesias, The Journal of Chemical
Thermodynamics, 43, 275-283, (2011).
89. K. M. Abraham, Z. Jiang and B. Carroll, Chemistry of Materials, 9, 1978-1988, (1997).
90. C. Laoire, S. Mukerjee, E. J. Plichta, M. A. Hendrickson and K. M. Abraham, Journal of The
Electrochemical Society, 158, A302-A308, (2011).
91. M. J. Trahan, Q. Jia, S. Mukerjee, E. J. Plichta, M. A. Hendrickson and K. M. Abraham, Journal
of The Electrochemical Society, 160, A1577-A1586, (2013).

173
92. L. Cecchetto, M. Salomon, B. Scrosati and F. Croce, Journal of Power Sources, 213, 233-238,
(2012).
93. Y.-C. Lu, H. A. Gasteiger, M. C. Parent, V. Chiloyan and Y. Shao-Horn, Electrochemical and
Solid-State Letters, 13, A69-A72, (2010).
94. Y.-C. Lu, H. A. Gasteiger, E. Crumlin, R. McGuire and Y. Shao-Horn, Journal of The
Electrochemical Society, 157, A1016-A1025, (2010).
95. J. Read, Journal of The Electrochemical Society, 153, A96-A100, (2006).
96. E. Nasybulin, W. Xu, M. H. Engelhard, Z. Nie, S. D. Burton, L. Cosimbescu, M. E. Gross and J.-
G. Zhang, The Journal of Physical Chemistry C, 117, 2635-2645, (2013).
97. U. Olsher, R. M. Izatt, J. S. Bradshaw and N. K. Dalley, Chemical Reviews, 91, 137-164, (1991).
98. R. H. Wood and L. A. D'Orazio, The Journal of Physical Chemistry, 69, 2558-2561, (1965).
99. R. H. Snow, Thermodynamic Evaluation of the Possibility of Lithium Superoxide Production
Technical Report, Aerospace Medical Research Laboratories, (1965).
100. Y.-C. Lu and Y. Shao-Horn, The Journal of Physical Chemistry Letters, 4, 93-99, (2013).
101. K. M. Kadish, K. M. Smith and R. Guilard, The Porphyrin Handbook: Phthalocyanines:
spectroscopic and electrochemical characterization, Elsevier, 2003.
102. Y. Shao, S. Park, J. Xiao, J.-G. Zhang, Y. Wang and J. Liu, ACS Catalysis, 2, 844-857, (2012).
103. J.-L. Shui, N. K. Karan, M. Balasubramanian, S.-Y. Li and D.-J. Liu, Journal of the American
Chemical Society, 134, 16654-16661, (2012).
104. C. W. B. Bezerra, L. Zhang, K. Lee, H. Liu, A. L. B. Marques, E. P. Marques, H. Wang and J.
Zhang, Electrochimica Acta, 53, 4937-4951, (2008).
105. A. B. P. Lever and P. C. Minor, Advances in Molecular Relaxation and Interaction Processes, 18,
115-126, (1980).
106. G. Wang, N. Ramesh, A. Hsu, D. Chu and R. Chen, Molecular Simulation, 34, 1051-1056,
(2008).
174
107. D. Sun, Y. Shen, W. Zhang, L. Yu, Z. Yi, W. Yin, D. Wang, Y. Huang, J. Wang, D. Wang and J.
B. Goodenough, Journal of the American Chemical Society, 136, 8941-8946, (2014).
108. M. Ladouceur, G. Lalande, D. Guay, J. Dodelet, L. Dignard‐Bailey, M. Trudeau and R. Schulz,
Journal of the Electrochemical Society, 140, 1974-1981, (1993).
109. K. Kadish, R. Guilard and K. M. Smith, The Porphyrin Handbook: Phthalocyanines:
spectroscopic and electrochemical characterization, Academic press, 2003.
110. E. Milaeva, G. Speier and A. Lever, The redox chemistry of metallophthalocyanines in solution,
DTIC Document, (1992).
111. A. S. Milev, N. Tran, G. Kamali Kannangara, M. A. Wilson and I. Avramov, The Journal of
Physical Chemistry C, 112, 5339-5347, (2008).
112. V. Bambagioni, C. Bianchini, J. Filippi, A. Lavacchi, W. Oberhauser, A. Marchionni, S. Moneti,
F. Vizza, R. Psaro, V. Dal Santo, A. Gallo, S. Recchia and L. Sordelli, Journal of Power Sources,
196, 2519-2529, (2011).
113. C. Melendres and V. Maroni, Journal of Raman spectroscopy, 15, 319-326, (1984).
114. J. Janczak and R. Kubiak, Inorganica Chimica Acta, 342, 64-76, (2003).
115. A. S. Milev, N. Tran, G. S. Kamali Kannangara, M. A. Wilson and I. Avramov, The Journal of
Physical Chemistry C, 112, 5339-5347, (2008).
116. D. V. Konarev, A. V. Kuzmin, S. V. Simonov, S. S. Khasanov and R. N. Lyubovskaya, Journal
of Porphyrins and Phthalocyanines, 18, 87-93, (2014).