Investigations of Electron, Ion, and Proton Transport in ... · Metal-Organic Frameworks (MOFs) are...
158
Investigations of Electron, Ion, and Proton Transport in Zirconium- based Metal-Organic Frameworks Paula Juliana Celis Salazar Dissertation submitted to the faculty of the Virginia Polytechnic Institute and State University in partial fulfillment of the requirements for the degree of Doctor of Philosophy In Chemistry Amanda J. Morris, Chair James M. Tanko Brian M. Tissue John R. Morris May 4th, 2018 Blacksburg, VA Keywords: metal-organic frameworks, electron transport, electrochemistry, quinone chemistry, proton-coupled electron transport, electronic and ionic diffusion, charge storage
Transcript of Investigations of Electron, Ion, and Proton Transport in ... · Metal-Organic Frameworks (MOFs) are...

Investigations of Electron, Ion, and Proton Transport in Zirconium-
based Metal-Organic Frameworks
Paula Juliana Celis Salazar
Dissertation submitted to the faculty of the Virginia Polytechnic Institute and State University in
partial fulfillment of the requirements for the degree of
Doctor of Philosophy
In
Chemistry
Amanda J. Morris, Chair
James M. Tanko
Brian M. Tissue
John R. Morris
May 4th, 2018
Blacksburg, VA
Keywords: metal-organic frameworks, electron transport, electrochemistry, quinone chemistry,
proton-coupled electron transport, electronic and ionic diffusion, charge storage

Investigations of Electron, Ion, and Proton Transport in Zirconium-
based Metal-Organic Frameworks
Paula Juliana Celis Salazar
ABSTRACT
Metal-Organic Frameworks (MOFs) are porous materials consisting of organic ligands
connected by inorganic nodes. Their structural uniformity, high surface area, and synthetic
tunability, position these frameworks as suitable active materials to achieve efficient and clean
electrochemical energy storage. In spite of recent demonstrations of MOFs undergoing diverse
electrochemical processes, a fundamental understanding of the mechanism of electron, proton, and
ion transport in these porous structures is needed for their application in electronic devices. The
current work focuses on contributing to such understanding by investigating proton-coupled
electron transfer, capacitance performance, and the relative contribution of electron and ionic
transport in the voltammetry of zirconium-based MOFs.
First, we investigated the effects that the quinone ligand orientation inside two new UiO-
type metal-organic frameworks (2,6-Zr-AQ-MOF and 1,4-Zr-AQ-MOF) have on the ability of the
MOFs to achieve proton and electron conduction. The number of electrons and protons transferred
by the frameworks was tailored in a Nernstian manner by the pH of the media, revealing different
electrochemical processes separated by distinct pKa values. In particular, the position of the
quinone moiety with respect to the zirconium node, the effect of hydrogen bonding, and the amount
of defects in the MOFs, lead to different PCET processes. The ability of the MOFs to transport
discrete numbers of protons and electrons, suggested their application as charge carriers in
electronic devices.
With that purpose in mind, we assembled 2,6-Zr-AQ-MOF and 1,4-Zr-AQ-MOF into two
different types of working electrodes: a slurry-modified glassy carbon electrode, and as
solvothermally-grown MOF thin films. The specific capacitance and the percentage of quinone
accessed in the two frameworks were calculated for the two types of electrodes using cyclic
voltammetry in aqueous buffered media as a function of pH. Both frameworks showed an
enhanced capacitance and quinone accessibility in the thin films as compared to the powder-based
electrodes, while revealing that the structural differences between 2,6-Zr-AQ-MOF and 1,4-Zr-
AQ-MOF in terms of defectivity and the number of electrons and protons transferred were directly
influencing the percentage of active quinones and the ability of the materials to store charge.
Additionally, we investigated in detail the redox-hopping electron transport mechanism
previously proposed for MOFs, by utilizing the chronoamperometric response (I vs. t) of three
metallocene-doped metal-organic frameworks (MOFs) thin films (M-NU-1000, M= Fe, Ru, Os)
in two different electrolytes (TBAPF6 and TBATFAB). We were able to elucidate, for the first
time, the diffusion coefficients of electrons and ions (De and Di, respectively) through the structure
in response to an oxidizing applied bias. The application of a theoretical model for solid state-
voltammetry to the experimental data revealed that the diffusion of ions is the rate-determining
step at the three different time stages of the electrochemical transformation. Remarkably, the trends
observed in the diffusion coefficients (De and Di) of these systems obtained in PF61- and TFAB1-
based electrolytes at the different stages of the electrochemical reaction, demonstrated that the
redox hopping rates inside frameworks can be controlled through the modifications of the self-
exchange rates of redox centers, the use of large MOF channels, and the utilization of smaller

counter anions. These structure-function relationships provide a foundation for the future design,
control, and optimization of electronic and ionic transport properties in MOF thin films.

Investigations of Electron, Ion, and Proton Transport in Zirconium-
based Metal-Organic Frameworks
Paula Juliana Celis Salazar
GENERAL AUDIENCE ABSTRACT
The necessity of implementing new energy storage systems that enable the utilization of
clean energy in diverse technologies such as electric vehicles and smart power grids, has generated
great research efforts in the field of materials science. In particular, the development of nanoscale-
based materials that can be utilized in batteries and supercapacitors is essential for achieving
effective and clean electrochemical energy storage. Two of the main desired properties for such
materials to be employed as electrodes in energy storage devices are high surface area and the
possibility of incorporating redox-active moieties that are able to store electricity.
Metal-Organic Frameworks (MOFs) are a relatively new kind of porous materials with
high surface area and structural uniformity, consisting of organic ligands connected by inorganic
nodes. The application of these materials in charge transport and storage is still in its early stages.
Therefore, fundamental understanding of the mechanism of electron, proton, and ion transport in
MOFs is necessary for a rational design of these porous structures. In order to contribute to such
understanding, the present work is focus on two main concepts: (1) elucidating the effect that the
tridimensional orientation of redox moieties inside the MOF could have on the charge storage
performance and the ability of the material to achieve proton and electron conduction; and (2)
quantifying for the first time the individual relative contribution of electron and ionic transport in
MOF materials.

vi
Acknowledgements
First, I would like to thank my graduate advisor, Professor Amanda J. Morris, for her
academic guidance and devoted efforts during the last five years. Pursuing doctoral studies in the
United States was a dream that I had for many years and I will never forget that it was Dr. Amanda
Morris who believed in me and gave me the wonderful opportunity of joining her group which
made that dream come true. She is an excellent mentor and an inspiring example as a scientist and
researcher. During my years at her laboratory I grew academically and professionally, and I am
sincerely grateful for all the lessons she taught me. Thanks to her guidance I have become a more
goal-oriented person and learned to always put the best of myself into every task encountered.
Additionally, I would like to thank her for her patience, time, hard-work, discipline, and
commitment to the work presented in this dissertation.
I would also like to thank all of my current and past committee members, Professors Brian
Hanson, James Tanko, Brian Tissue, and John Morris for all their support during my years at the
Chemistry Department of Virginia Tech. I owe a debt of gratitude to Professor Brian Hanson for
encouraging me to apply for the doctoral chemistry program and for his guidance and friendship
during my years at Virginia Tech. I also have a lot of appreciation for the support and help offered
by Dr. James Tanko, Dr. John Morris, and Dr. Brian Tissue during all the milestones of the doctoral
program. I would like to also thank Dr. Carla Slebodnick for her guidance on single-crystal X-ray
Diffraction, a technique that I loved learning.
Additionally, I would like to thank my labmates for their friendship and support. I have
had a wonderful time at the Dr. Amanda Morris laboratory. I am very grateful for the valuable
advice of Dr. William Maza and Dr. Pavel Usov, who gave me much chemical and career advice.
Especially, I would like to thank Shaoyang Lin, Jie Zhu, Jose Rodriguez, Jose Santiago, and Jenn

vii
Rowe, for their unconditional friendship and support through the Ph.D. years. We all grew
together!
To the Chemistry Department, Virginia Tech, the Blacksburg community, and all the
friends I met during these five years, I would like to extend my gratitude for welcoming me in this
country and making the last five years some of the best of my life. I always felt at home and am
proud to be a Hokie. I will always carry with me fond memories of my time at Virginia Tech and
will miss Blacksburg immensely.
I would like to thank my family for their unconditional support and immense love. To my
mom Alix Salazar, who lived with me every moment of my graduate school years and now feels
more than familiar talking about MOFs and electrochemistry. Thank you so much for being there
in the distance, it would not have been possible without your optimism and love. I would also like
to thank all of the Salazar family, especially my grandparents Miguel Salazar and Teresa de Salazar
for their support, love, and influence in my life. You are my main inspiration.
Last, I would like to thank my wonderful husband, Micky Allen, who has been my rock,
my best friend, and my main supporter through these years. Thanks for your unconditional love,
patience, help, and for making my life so happy. It would not have been possible without your
enthusiasm and happiness. Thanks for always being there for me. Your wise advice makes the
difference.

viii
Table of Contents
Table of Contents
1. INTRODUCTION 1
1.1 RESEARCH MOTIVATION 1
1.2 METAL-ORGANIC FRAMEWORKS 2
1.2.1 Zirconium MOFs 3
1.2.2 Synthesis of MOF thin films 5
1.3 MOFS IN ELECTROCHEMICAL SYSTEMS 5
1.4 ELECTRON TRANSPORT MECHANISMS IN MOFS 9
1.4.1 Metal-ligand orbital overlap 9
1.4.2 π-stacking interactions between electroactive ligands 10 1.4.3 Redox hopping 11
1.5 ELECTROCHEMISTRY OF QUINONE-HYDROQUINONE COUPLES 12
1.5.1 Electrochemical reduction of quinones in aqueous media 13 1.5.1.1 Reduction of quinones in buffered aqueous media 13
1.5.1.2 Reduction of quinones in unbuffered aqueous media 15 1.5.2 Electrochemistry of quinones in non-aqueous media 16
1.5.2.1 Reduction of quinones in neutral aprotic media 16
1.5.2.2 The role of protonation and hydrogen bonding 17
1.6 REFERENCES 19
2. PROTON-COUPLED ELECTRON TRANSPORT IN ANTHRAQUINONE-BASED
ZIRCONIUM METAL-ORGANIC FRAMEWORKS 30
2.1 ABSTRACT 30
2.2 INTRODUCTION 31
2.3 EXPERIMENTAL SECTION 33
2.3.1 Synthesis of 2,6-dicarboxy-9,10-anthhraquinone (1) 33 2.3.2 Synthesis of 1,4-dicarboxy-9,10-anthhraquinone (2) 34 2.3.3 Synthesis of 2,6-Zr-AQ MOF [Zr6O4(OH)4(C16O6H6)6 (C3H7NO)17(H2O)22] 34
2.3.4 Synthesis of 1,4- Zr-AQ-MOF [Zr6O4(OH)4(C16O6H6)4(C2O2H3)2.76(CO2H)1.2
(C3H7NO)11(H2O)40] 35
2.4 RESULTS AND DISCUSSION 35
2.5 CONCLUSION 45
2.6 SUPPORTING INFORMATION 46
2.6.1 Materials and Instrumentation 46 2.6.1.1 Materials 46

ix
2.6.1.2 Nuclear Magnetic Resonance (NMR) 46
2.6.1.3 High Resolution Mass Spectrometry (HR-MS) 46 2.6.1.4 Attenuated Total Reflectance Fourier-Transform Infrared Spectroscopy
(ATR-FTIR) 46
2.6.1.5 Titrations with base 46 2.6.1.6 Powder X-Ray Diffraction (PXRD) 47 2.6.1.7 Scanning Electron Microscopy (SEM) 47 2.6.1.8 Thermogravimetric Analysis (TGA) 47 2.6.1.9 Gas Sorption Isotherms 47
2.6.1.10 Electrochemistry 48 2.6.1.11 UV-Visible Absorption Spectroscopy 48
2.6.2 Synthetic Procedures 48 2.6.3 Physical Characterization of the ligands: NMR, MS, FT-IR and Titrations 49
2.6.4 Physical Characterization of the MOFs: PXRD Le Bail refinement, SEM, and TGA 53 2.6.5 Electrochemical Methods and Characterization of the ligands Cyclic voltammetry
analysis 55 2.6.6 Electrochemical Methods and Characterization of the MOFs 60
2.6.6.1 Preparation and dropcasting of the slurry modified electrode 60 2.6.6.2 Cyclic voltammetry analysis 60
2.6.7 Determination of MOFs defects by NMR 64
2.6.8 Elemental Analysis (C, N, H) of the MOFs 66
2.7 ACKNOWLEDGMENTS 68
2.8 REFERENCES 68
3. CHARGE STORAGE AND QUINONE ACCESSIBILITY IN ANTHRAQUINONE-
BASED ZIRCONIUM METAL-ORGANIC FRAMEWORKS 75
3.1 ABSTRACT 75
3.2 INTRODUCTION 76
3.3 EXPERIMENTAL SECTION 77
3.3.1 Synthesis of 2,6-dicarboxy-9,10-anthhraquinone 77
3.3.2 Synthesis of 1,4-dicarboxy-9,10-anthhraquinone 78 3.3.3 Synthesis of 2,6-Zr-AQ MOF [Zr6O4(OH)4(C16O6H6)6 (C3H7NO)17(H2O)22] 79 3.3.4 Synthesis of 1,4- Zr-AQ-MOF [Zr6O4(OH)4(C16O6H6)4(C2O2H3)2.76
(CO2H)1.24(C3H7NO)11(H2O)40] 79
3.4 RESULTS AND DISCUSSION 79
3.5 CONCLUSION 88
3.6 SUPPORTING INFORMATION 89
3.6.1 Materials and Instrumentation 89 3.6.1.1 Materials 89 3.6.1.2 Nuclear Magnetic Resonance (NMR) 89 3.6.1.3 Powder X-Ray Diffraction (PXRD) 89
3.6.1.4 Electrochemistry 89 3.6.2 Electrochemical Methods 90
x
3.6.2.1 Preparation and dropcasting of the slurry modified electrode 90
3.6.2.2 Preparation of thin films 90 3.6.2.3 Cyclic voltammetry analysis 90 3.6.2.3.1 Calculation of % of Quinone active from CV analysis 97
3.6.2.3.2 Calculation of Specific Capacitance from CV analysis 98 3.6.2.4 Coin cells assembly and tests 98
3.7 ACKNOWLEDGMENTS 99
3.8 REFERENCES 99
4. ELUCIDATION OF THE RELATIVE CONTRIBUTIONS OF ELECTRONIC AND
IONIC DIFFUSION FROM THE SOLID-STATE VOLTAMMETRY OF
METALLOCENE-DOPED METAL-ORGANIC FRAMEWORKS THIN FILMS 103
4.1 ABSTRACT 103
4.2 INTRODUCTION 104
4.3 EXPERIMENTAL SECTION 106
4.3.1 Synthesis of Ferrocene Carboxylic Acid (Fe-COOH) 106
4.3.2 Synthesis of Ruthenocene Carboxylic Acid (Ru-COOH) 107 4.3.3 Synthesis of Osmocene Carboxylic Acid (Os-COOH) 108
4.3.4 Synthesis of 1,3,6,8-tetrakis(p-benzoic acid)pyrene (TBAPy) ligand 109 4.3.5 Synthesis of NU-1000 MOF [Zr6(μ3−OH)8(OH)8(TBAPy)2] 110 4.3.6 Solvent Assisted Ligand Incorporation (SALI) 110
4.3.6.1 Fe-NU-1000 110 4.3.6.2 Ru-NU-1000 111
4.3.6.3 Os-NU-1000 111 4.3.7 Electrophoretic Deposition of MOF thin films 111
4.4 RESULTS AND DISCUSSION 111
4.4.1 Stage A 117
4.4.2 Stage B 120 4.4.3 Stage C 122
4.5 CONCLUSION 125
4.6 SUPPORTING INFORMATION 126
4.6.1 Materials and Instrumentation 126 4.6.1.1 Materials 126 4.6.1.2 Nuclear Magnetic Resonance (NMR) 126
4.6.1.3 Powder X-Ray Diffraction (PXRD) 126 4.6.1.4 Scanning Electron Microscopy (SEM) 126
4.6.1.5 Electrochemistry 126 4.6.2 Synthetic Procedures 127 4.6.3 Determination of Metallocene to Node ratio of M-NU-1000 MOFs (M=Fe, Ru, and
Os) from NMR 127 4.6.4 Scanning Electron Microscopy (SEM) Images 130
4.6.5 Electrochemical Methods 131

xi
4.6.5.1 Cyclic voltammetry analysis 132
4.6.5.2 Chronoamperometry analysis – DC Potential Amperometry (DCPA) 132 4.6.6 Determination of De and Di based on the Sholtz model of solid state voltammetry
of microcrystals14 132
4.6.6.1 Step by step sample calculation of the model using a Fe-NU-1000 thin film 132 4.6.6.1.1 Stage A 133 4.6.6.1.2 Stage B 135 4.6.6.1.3 Stage C 136 4.6.6.2 Statistical error on the De and Di values calculated in each stage 137
4.7 ACKNOWLEDGMENTS 141
4.8 REFERENCES 141
5. CONCLUSIONS AND FUTURE WORK 145
xii
Attributions
Chapters 2 of this dissertation was written using a published manuscript to which the
author, Paula Juliana Celis-Salazar (P.J.C-S.), majorly contributed. The contributions of the co-
authors to the presented chapters are as follows:
Chapter 2. P.J.C-S., performed experiments and assisted with manuscript writing and
editing. Charity Epley performed SEM imaging. Spencer Ahrenholtz measured N2 isotherms. Dr.
William Maza contributed intellectually. Dr. Pavel Usov contributed intellectually and assisted in
writing and editing. Dr. Amanda J. Morris, principle investigator, supervised the research project
and provided technical insight during experimentation, and assisted in writing and editing.
Chapter 3. P.J.C-S., performed experiments and assisted with manuscript writing and
editing. Dr. Linqin Mu assembled and tested coin cells. Connor Slamowitz was an undergraduate
researcher on the project and performed synthesis of MOF thin films. Dr. Amanda J. Morris,
principle investigator, supervised the research project and provided technical insight during
experimentation, and assisted in writing and editing.
Chapter 4. P.J.C-S., performed experiments and assisted with manuscript writing and
editing. Clark Cucinell was an undergraduate researcher on the project and performed synthesis of
MOF thin films and ligands. Spencer Ahrenholtz initiated previous investigations relevant to the
project. Meng Cai and Charity Epley performed SEM imaging. Dr. Pavel Usov contributed
intellectually and assisted in writing and editing. Dr. Amanda J. Morris, principle investigator,
supervised the research project and provided technical insight during experimentation, and assisted
in writing and editing.
1
1. Introduction
1.1 Research Motivation
Transition from the current fossil fuel-based energy economy to an alternative and
environmentally friendly form of energy generation and storage has become a challenge to the
scientific community in the last few decades. However, greenhouse gas emissions are still growing
dramatically. In 2011, world carbon dioxide emissions, due to petroleum consumption, reached
11.4 billion metric tons, a 34.2% increase as compared to the carbon dioxide emissions reported
in 1981.1 In order to alleviate the undesirable effects that greenhouse gas emissions produce in the
global climate, research efforts have focused on generating new electrical energy storage systems
that could contribute to the large-scale employment of emerging clean technologies, such as
electric vehicles and smart power grids.2, 3
In particular, the development of nano-structured materials that can be utilized in batteries
and supercapacitors is a fundamental part for achieving efficient and clean electrochemical energy
storage.4 Electrode materials displaying high surface area and the possibility of including redox-
active moieties that are able to store electricity are suitable materials to be employed in such
technologies.5 Metal-organic frameworks (MOFs) are a relatively new class of porous materials
that due to their structural uniformity, thermal and chemical stability, and inherent tunability have
been proposed as active materials to achieve efficient charge storage in electronic devices.6, 7
In less than a decade, great research efforts have been done in the investigation of MOFs
undergoing diverse electrochemical processes, validating their potential as key components of
electrode materials.6, 8 However, the rational design of MOFs requires fundamental understanding
of the mechanism of electron, proton, and ion transport in these porous structures. The motivation

2
of the present work involves two main concepts to contribute to such understanding: (1)
elucidating the effect that the orientation of redox moieties inside the MOF could have on the
charge storage performance and the ability of the material to achieve proton and electron
conduction; and (2) quantifying for the first time the individual relative contribution of electron
and ionic transport in MOF materials. The latter two concepts aim to contribute to the current state
of the art of MOF research, as well as and enhance the rational design of MOF structures based on
structure-function relationships, for future applications.
1.2 Metal-organic frameworks
MOFs are highly porous materials assembled from secondary building units (metals or
metal clusters) connected through organic linkers.9, 10 These materials exhibit pores or void spaces
that can be potentially occupied by host molecules.11, 12 Figure 1.1 shows the crystal structure of
MOF-5, one of the most widely studied in the literature, which has an apparent Langmuir surface
area of 2900 m2g-1.13 In fact, one of the tremendous advantages of MOFs is that they have
demonstrated superior surface areas as compared to the largest surface areas of other porous
materials such as activated carbon (2030 m2g-1)14 and zeolites (904 m2g-1, for zeolite-Y).15, 16 At
the present time, the highest surface area known for a porous material is 7140 m2g-1, for MOF NU-
110.17 Additionally, other remarkable advantages such as the high permanent microporosity, low
density, crystallinity, and the inherent tunability of MOFs make them suitable materials for charge
storage applications.16, 18

3
Figure 1.1: MOF-5 crystal structure. Top, the secondary building unit Zn4(O)O12C6. Left,
as a ball and stick model (Zn, blue; O, green; C, grey). Middle, with the Zn4(O) tetrahedron
indicated in green. Right, with the ZnO4 tetrahedra indicated in blue. Bottom, one of the cavities
in the MOF-5 framework. Eight clusters constitute a unit cell and enclose a cavity, indicated by a
yellow sphere of diameter 18.5 A°. This image was copied from Reference 13.
1.2.1 Zirconium MOFs
The assembly of metal-organic frameworks containing zirconium nodes constituted a
milestone in the design and application of MOF materials.19 Since MOFs are constructed of
inorganic nodes connected by organic ligands, the reversible nature of such coordinating bonds
prevented the chemical stability of the frameworks, especially when containing zinc clusters.19
The discovery of UiO-66 MOF (Zr6(µ3-O)4(µ3-OH)4(BDC)6. BDC = benzene dicarboxylate), a
framework containing a twelve-coordinated Zr cluster and exceptional hydrothermal stability
(Figure 1.2),20 allowed the future assembly of a variety of isoreticular Zr-MOFs (UiO MOFs
series) that displayed high stability in water and in acidic pH.20, 21
The solvothermal synthesis of Zr-MOFs is usually achieved by modulated synthesis.19, 22
This process consists of dissolving the organic ligand, the Zr precursor salt, and a modulator

4
molecule with similar chemical coordination functionality than the organic ligand, in a high boiling
point solvent (usually) at temperatures around 80ºC - 120ºC.20, 21 The main purpose of using a
modulator is to control the coordination equilibrium between the ligands and the zirconium salt
during the reaction. Therefore, regulating the rate of nucleation and growth of the MOF material.22
The conditions employed during the modulated synthesis have a great impact on the crystallinity,
particle size, and defectivity of UiO MOFs.22
Figure 1.2 UiO-66 MOF (Zr6(µ3-O)4(µ3-OH)4(BDC)6. BDC = benzene dicarboxylate)
crystal structure, indicating the octahedral cage of the framework. This image was created using
the crystal structure reported in Reference 20.
The NU-1000 MOF is another Zr-MOF that not only displays chemical stability, but also
has shown an excellent thermal stability.23 One of the main characteristics of this framework is
that its inorganic cluster contains open metal sites, allowing the introduction of extra ligands in
their structure after the MOF has been assembled.24, 25 This type of post synthetic process to modify
the chemical structure of an existing MOF has been used widely,26, 27 and constitutes one of the
main strategies to append redox moieties into the core structure of MOF materials.25, 28

5
1.2.2 Synthesis of MOF thin films
The assembly of MOFs in conductive electrodes as thin films is one of the latest advances
towards the application of MOFs in electronic technologies.29 The main advantages of using MOF
thin films in electrochemical analysis is that the MOF material is in direct contact with the
electrolyte solution and that the material can be tested without the addition of other conductive
materials, such as graphite.30 The two main synthesis methods for MOF thin films are solvothermal
synthesis and electrophoretic deposition: The solvothermal method consists on the spontaneous
growth of the MOF in its crystalline form on the surface of a conductive material such as
fluorinated tin oxide (FTO),30 and the electrophoretic deposition involves creating a suspension of
the MOF powder where two identical FTO slides facing each other and separated by 1 cm are
immersed, and subjected to a DC voltage.25
1.3 MOFs in electrochemical systems
The possibility of generating materials capable of exhibiting both porosity and electrical
conductivity has emerged as one of the most promising applications of MOFs30-32 in order to
possibly allow energy storage and conversion within these materials.8 However, electrochemistry
in MOFs is considered significantly complex since, in addition to the electron transfer process,
insertion and ejection of ions must simultaneously take place into the framework and can affect
the material’s crystal lattice.33 Three main experimental approaches have successfully enhanced
the electrochemical activity in MOFs: The first is based on the redox behavior of the metal
coordination center,31, 34 the second involves charge transfer attributed to the organic linker,35, 36
and the third relies in doping/mixing the MOF with conductive phases.37

6
One specific illustration of the latter approach was recently carried out when Alizarin red
S (Scheme 1.1), a redox-active negatively charged material, was encapsulated in the redox-inactive
MOF UMCM-1 (Figure 1.3A).38 The electrochemical activity of this organic dye is attributed to
its anthraquinone functionality that exhibits a pH dependent two-electron reduction mechanism
(vide infra). Consequently, in a proton rich environment, two protons are consumed in addition to
two electrons (Scheme 1.1a), and in alkaline media the two-electron reduction takes place without
protonation (Scheme 1.1b).8, 38
Figure 1.3 A) Molecular structure of UMCM-1 and Powder XRD pattern of B) UMCM-1
and (C) UMCM-1-Alizarin Red S powder. The symbol * denotes glass capillary background
signals. This imaged was copied from Reference 38.
After alizarin red S was physisorbed in UMCM-1 (AR-UMCM-1), the original MOF
structure experienced a loss of crystallinity as can be seen in Figure 1.3 B-C. Cyclic voltammetry
studies of AR-UMCM-1 in ethanolic solution revealed two reduction waves at -0.2V and -1.2V,
corresponding to the reduction reactions described in Scheme 1a and b, respectively (Figure 1.4A).
Cyclic voltammograms obtained using a probe “collector-electrode”, showed that reduced alizarin
(leuco-alizarin) was released from the MOF to the solution, with a presumable degradation of the
host framework (Figure 1.4B).38 Apparently, when the proton consuming process described in
7
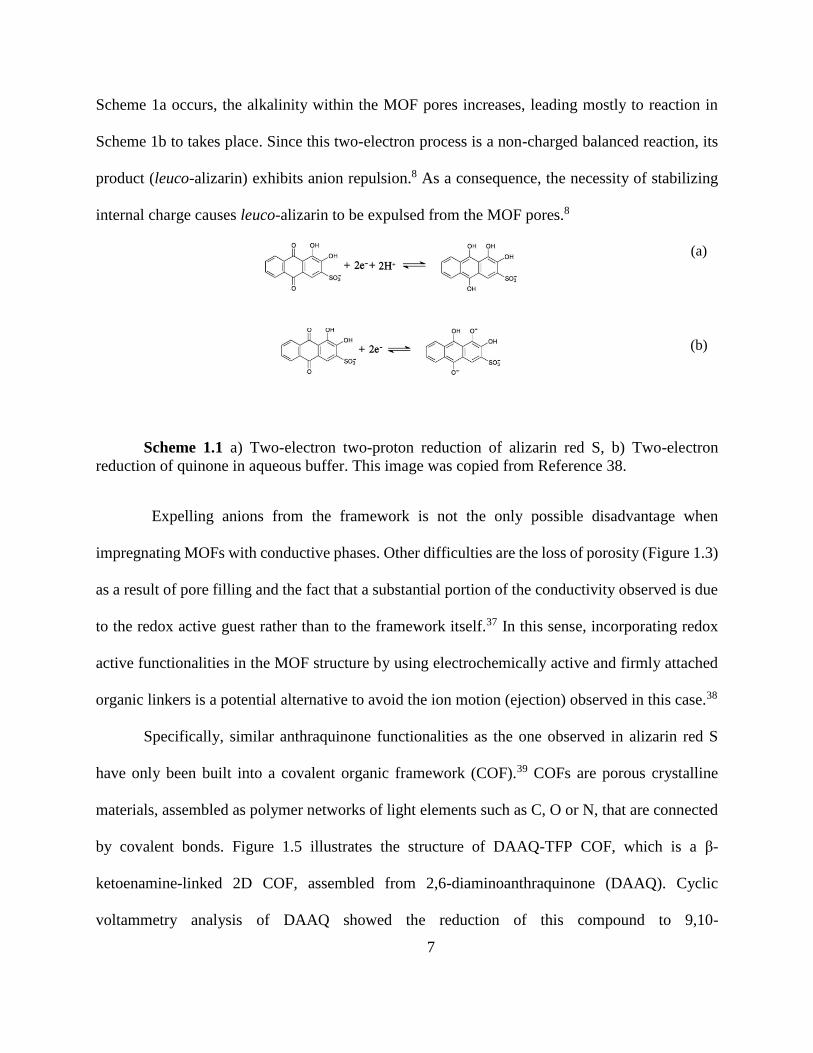
Scheme 1a occurs, the alkalinity within the MOF pores increases, leading mostly to reaction in
Scheme 1b to takes place. Since this two-electron process is a non-charged balanced reaction, its
product (leuco-alizarin) exhibits anion repulsion.8 As a consequence, the necessity of stabilizing
internal charge causes leuco-alizarin to be expulsed from the MOF pores.8
(a)
(b)
Scheme 1.1 a) Two-electron two-proton reduction of alizarin red S, b) Two-electron
reduction of quinone in aqueous buffer. This image was copied from Reference 38.
Expelling anions from the framework is not the only possible disadvantage when
impregnating MOFs with conductive phases. Other difficulties are the loss of porosity (Figure 1.3)
as a result of pore filling and the fact that a substantial portion of the conductivity observed is due
to the redox active guest rather than to the framework itself.37 In this sense, incorporating redox
active functionalities in the MOF structure by using electrochemically active and firmly attached
organic linkers is a potential alternative to avoid the ion motion (ejection) observed in this case.38
Specifically, similar anthraquinone functionalities as the one observed in alizarin red S
have only been built into a covalent organic framework (COF).39 COFs are porous crystalline
materials, assembled as polymer networks of light elements such as C, O or N, that are connected
by covalent bonds. Figure 1.5 illustrates the structure of DAAQ-TFP COF, which is a β-
ketoenamine-linked 2D COF, assembled from 2,6-diaminoanthraquinone (DAAQ). Cyclic
voltammetry analysis of DAAQ showed the reduction of this compound to 9,10-

8
dihydroxyanthracene moieties by means of a two-electron two-proton reversible mechanism in a
protic electrolyte (Figure 1.5).39 Similarly, DAAQ-TFP COF also demonstrated reversible redox
processes.39
Since the redox activity of the COF material is analogous to the anthraquinone subunit, the
use of anthraquinone functionalities in MOFs emerges as a potential opportunity to synthesize
electrochemically active porous materials. In particular, quinone-based ligands have served as an
inspiration to the synthesis of COFs,39, 40 and other MOFs that show potential applications in
batteries and supercapacitors.41-43 A positive performance of thin film electrodes has been recently
observed in quinone-based COFs,39, 40 where the assembly of two-dimensional frameworks in thin
films provided more efficient quinone accessibility and capacitance as compared to randomly
oriented slurry-modified electrodes.5, 44 The electrochemical mechanism of quinone-hydroquinone
systems is reviewed in detail in following sections.
Figure 1.4 (A) Cyclic voltammogram for the reduction of immobilized UMCM-1-alizarin
red S immersed in ethanol with 0.01 M NBu4PF6/1 mM HClO4 (scan rate 0.05 V/s, cycle 4) , (B)
Cyclic voltammogram (scan rate 0.01 V/s, second potential cycle) showing generator (4.9 mm
diameter basal plane pyrolytic graphite) and collector (50 µm diameter platinum wire) data. This
image was copied from Reference 38.

9
Figure 1.5 Left: Synthesis of DAAQ-TFP COF. Right: Cyclic voltammograms (50 mV/s,
1 M H2SO4 supporting electrolyte) of DAAQ-TFP COF (red), DAAQ monomer 1 (black), and
carbon black-only (blue). This image was copied from Reference 39.
1.4 Electron Transport Mechanisms in MOFs
Although initially most MOFs were considered electrical insulators, in the recent years
numerous examples of MOFs displaying the ability to transport electrical charge have been
reported in the literature.8, 31, 45 The structural design of MOF materials, where the desired
electronic properties of both ligands and nodes are tuned in order to obtain specific characteristics
in the synthesized MOFs, have led to some examples of MOFs containing charge transport
pathways.31, 45 The mechanisms of such pathways are described below:
1.4.1 Metal-ligand orbital overlap
One of the most inventive examples of charge transfer in MOFs, was based on the design
of materials displaying metal-ligand orbital overlap (Figure 1.6).46 Although charge transport is
not favored in the majority of MOF materials, which contain coordination moieties containing
oxygen or nitrogen atoms, attached to clusters of hard-metal ions; the introduction of other
chemical species in the ligand (such as sulfur) creates a favorable pathway for charge transport.46
In this particular example, the orbital overlap generated by the infinite Metal−Sulfur one-

10
dimensional chains displayed in the framework (denoted in purple on Figure 1.6), allowed the
MOF material to exhibit high charge mobility, in the same order of magnitude than several organic
semiconductors.46
Figure 1.6 Metal-ligand overlap path for charge transport. This image was copied from
Reference 46.
1.4.2 π-stacking interactions between electroactive ligands
The mechanism of charge transport by designing organic ligands containing conjugated
systems, has also been reported as one of the methods for achieving charge transport in MOFs.47
The first particular example of charge mobility due to π-stacking interactions between
electroactive ligands involved the assembly of a zinc-based MOF containing
tetrathiafulvalenetetrabenzoate (H4TTFTB) linkers (Figure 1.7).47 Although the framework
displayed high intrinsic charge mobility due to the stacking of its individual building blocks,47 the
subsequent development of MOF thin films, allowed more detailed mechanistic studies of electron
transport in MOF materials (redox hopping).30

11
Figure 1.7 π-stacking interactions path for charge transport. This image was adapted from
Reference 47.
1.4.3 Redox hopping
This electron-transport mechanism in MOFs was first demonstrated experimentally by both
electrochemical and spectroelectrochemical analysis on a metalloporphyrin MOF thin film,
CoPIZA/FTO.30 Specifically, this framework contains large pores that allow unhindered access to
its fixed redox centers. The electrochemical response observed in CV analysis, when applying a
variety of different scan rates (10 mV/sec – 1000 mV/sec) revealed that this MOF film displayed
nonzero, scan-rate dependent peak separation (ΔEp). Therefore, the CV response involved a
diffusion-limited redox reaction equivalent to the one observed for redox centers diffusing freely
in solution. This kind of behavior suggested that charge transport should occur via discrete
ambipolar redox-hopping steps (Figure 1.8).30 Once this mechanism was elucidated, the apparent
diffusion coefficient (Dapp) of this Co-based MOF thin films was quantified for the first time.30

12
Figure 1.8 Redox-hopping electron transfer. This image was copied from Reference 30.
An important characteristic of the suggested redox hopping mechanism in MOFs, is the
fact that the electrochemical charge transport should depend on the rate of electron diffusion (De)
from one redox center to another, and the rate of ionic diffusion (Di) through the MOF pores to
satisfy the electroneutrality requirement.30 Although there are no detailed reports examining such
rates of diffusion in MOFs, a theoretical model capable of individually quantifying these
diffusional components has been developed for immobilized microcrystals on the surface of an
electrode.48. The application of the theoretical model to experimental MOF data is vital for the
overall understanding of charge transport properties in MOFs, and constitutes one of the main
objectives of the present study (Chapter 4).
1.5 Electrochemistry of Quinone-Hydroquinone Couples
Electrochemical reduction of quinones is probably one of the most illustrative examples of
electron transfer reactions in organic redox systems. The importance of these compounds relies
13
mainly in their key function as proton-coupled electron transport agents in different biological
processes such as photosynthesis and oxidative phosphorylation, as well as their proven medicinal
activity in anticancer drugs.49, 50 Several investigations about the redox behavior of quinones have
been achieved and extended to contemporary studies using techniques such as cyclic voltammetry,
pulse radiolysis, and electron spin resonance.51, 52 Studies in different media allow for the
description of the mechanism, kinetics, and potential pathways involved in quinones
electrochemistry.52
1.5.1 Electrochemical reduction of quinones in aqueous media
1.5.1.1 Reduction of quinones in buffered aqueous media
It is well known that in buffered aqueous media, quinones undergo a reversible, single-
step, two-electron reduction where the cathodic peak reduction potential (Epc) varies with pH
according to the Nernst equation.52, 53 In acidic pH, this process is a two-proton two-electron
reduction (Scheme 1.2a) where the slope of the linear relationship between Epc and pH is
approximately 60 mV/pH unit.54 In basic pH, quinone is reduced to its quinone dianion Q2-
(Scheme 1.2c) in a two-electron transfer process,50, 52 while at neutral pH, the reduction is either a
one-proton two-electron transfer to form the protonated dianion QH- (Scheme 1.2b) or a two
electron transfer to form quinone dianion Q2- (Scheme 1.2c).50, 52
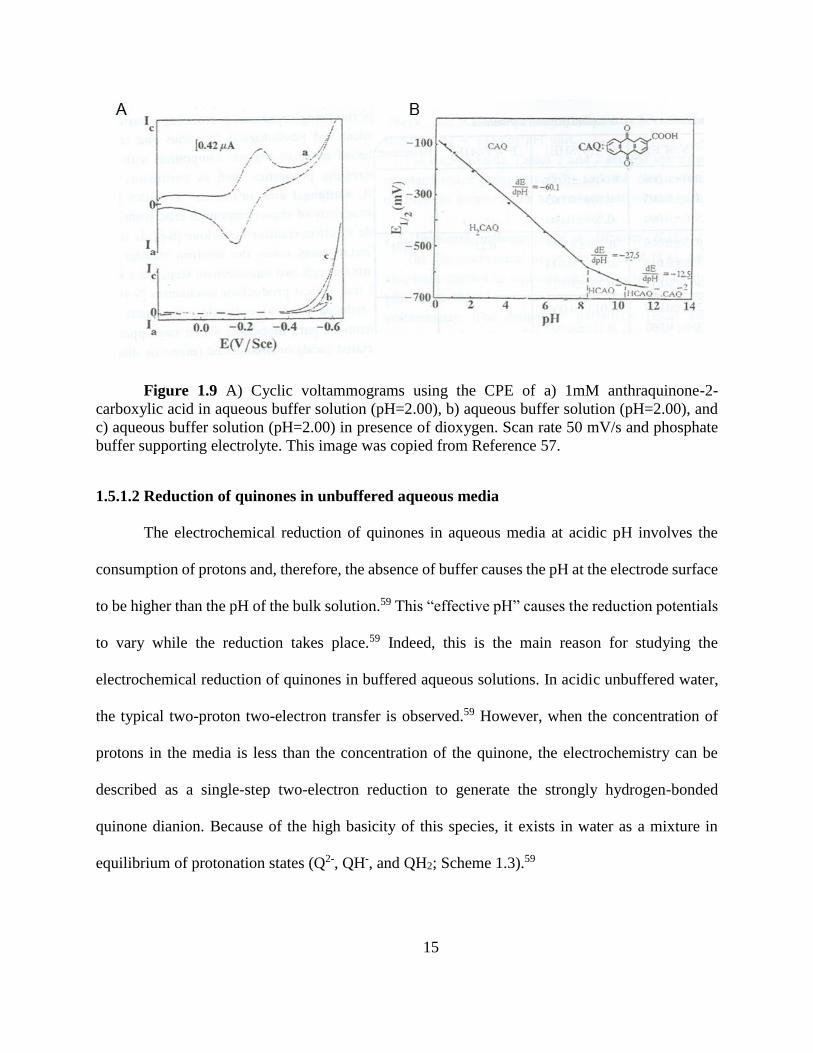
In order to overcome the adsorption at the electrode surface displayed by carboxy-
substituted 9,10-anthraquinones,55, 56 anthraquinone-2-carboxylic acid (CAQ) have been studied
using carbon paste electrodes finding a single and reversible reduction peak by cyclic voltammetry
in aqueous buffer media (Figure 1.9A).57 The E1/2-pH diagram for this compound (Figure 1.9B)
shows three different segments with slopes: -60.1 mV/pH (pH < 8.3), -27.5 mV/pH (8.3 > pH >
10.5), and -12.5 mV/pH (pH > 10.5), respectively. According to these slope values and using the

14
Nernst equation, the first process corresponds to a two-proton two-electron transfer to form the
respective hydroquinone (H2CAQ), the second chemical reaction is a two-electron one-proton
transfer to form the correspondent protonated dianion (HCAQ-), and the third segment involves a
four-proton one-electron reactions of two quinone molecules to form both quinone dianion (CAQ2-
) and HCAQ-.57 The pKa for the equilibrium between H2CAQ and HCAQ- is 8.3, based on the
intersection of the first and second segments previously described (Figure 1.9B).57
Scheme 1.2 a) Two-electron two-proton reduction of quinone in aqueous buffer b) Two-
electron one-proton reduction of quinone in aqueous buffer c) Two-electron reduction of quinone
in aqueous buffer. This image was copied from Reference 52.
The mixture of aqueous buffer solutions with small portions of organic solvents such as
THF or DMF has also been used to address solubility issues in substituted 9,10-anthraquinones.54,
58 For instance, the reduction of substituted 9,10-anthraquinones containing acetate groups were
analyzed by cyclic voltammetry using a glassy carbon electrode in 50% aqueous buffer/THF
mixtures.54 The Nernstian variation of potential with pH consistent with a two-proton two-electron
single step transfer was observed.54
15
Figure 1.9 A) Cyclic voltammograms using the CPE of a) 1mM anthraquinone-2-
carboxylic acid in aqueous buffer solution (pH=2.00), b) aqueous buffer solution (pH=2.00), and
c) aqueous buffer solution (pH=2.00) in presence of dioxygen. Scan rate 50 mV/s and phosphate
buffer supporting electrolyte. This image was copied from Reference 57.
1.5.1.2 Reduction of quinones in unbuffered aqueous media
The electrochemical reduction of quinones in aqueous media at acidic pH involves the
consumption of protons and, therefore, the absence of buffer causes the pH at the electrode surface
to be higher than the pH of the bulk solution.59 This “effective pH” causes the reduction potentials
to vary while the reduction takes place.59 Indeed, this is the main reason for studying the
electrochemical reduction of quinones in buffered aqueous solutions. In acidic unbuffered water,
the typical two-proton two-electron transfer is observed.59 However, when the concentration of
protons in the media is less than the concentration of the quinone, the electrochemistry can be
described as a single-step two-electron reduction to generate the strongly hydrogen-bonded
quinone dianion. Because of the high basicity of this species, it exists in water as a mixture in
equilibrium of protonation states (Q2-, QH-, and QH2; Scheme 1.3).59

16
Scheme 1.3 Reduction of quinones in unbuffered aqueous media when [H+] < [Q]. This
image was copied from Reference 59.
1.5.2 Electrochemistry of quinones in non-aqueous media
1.5.2.1 Reduction of quinones in neutral aprotic media
The reduction of quinones in aprotic solvents involves the generation of two different
cathodic waves, corresponding to two consecutive one-electron reduction steps to produce
semiquinone (Q.-) and quinone dianion (Q2-), respectively (Scheme 1.4).60 Electron spin resonance
has been used to determine the presence of these radicals.61 Generally, the first reduction step is
entirely reversible while the second one is quasireversible (Figure1.10a).60 In both reduction steps,
current is controlled by the diffusion of species to the electrode and, therefore, the peak current is
directly proportional to the square root of the scan rate.60 The semiquinone has a short life-time
and rapidly undergoes disproportionation to form the quinone and the quinone dianion.52
Scheme 1.4 EE mechanism for the electrochemical reduction of quinones in neutral aprotic
media (Q.-, semiquinone; Q2-, quinone dianion).

17
Figure 1.10 CVs of anthraquinone in 0.1 M NBu4PF6 in DMF after addition of water: (a)
0% H2O, (b) 0.5% H2O, (c) 1% H2O, (d) 2% H2O, (e) 4% H2O, (f) 8% H2O. Scan rate 100 mV/s
with a Au working electrode. This image was copied from Reference 59.
1.5.2.2 The role of protonation and hydrogen bonding
Although the two waves are usually separated by approximately 0.7 V, the potentials
strongly depend on the stability of the reduced species.60 For instance, in hydroxy-substituted
anthraquinones both semiquinone and quinone dianion can be strongly stabilized by intramolecular
hydrogen bonding between the negatively-charged quinone oxygen and the hydroxylic proton.62
As a consequence, the reduction potentials of selected 9,10-anthraquinones with hydroxy
substituents in the positions 1,4,5- and 8- showed a positive shift in their reduction potentials of
approximately +209 mV for the first reduction potential (E°’ for Q / Q.-) and +291 mV for the
second reduction potential (E°’ for Q / Q.-).62 From an electrostatic point of view this behavior is
reasonable, since it should be harder to add an electron to a species that is already negatively
charged and as a result once quinone radicals are stabilized by intramolecular hydrogen bonding,
less potential is required to achieve electron transfer from the electrode to the compound.
Addition of hydrogen bonding agents has strong influence on the reduction potentials of
quinones in neutral aprotic media.52, 59 The addition of water to a DMF solution containing
18
anthraquinone causes the second reduction potential to move in a positive direction (Figure 1.10).59
The first reduction wave also moves positively but less in extent. Therefore, sufficient addition of
water causes the two waves to merge together. This effect was initially explained as protonation
of the quinone dianion by water63 but further studies revealed that hydrogen bonding was more
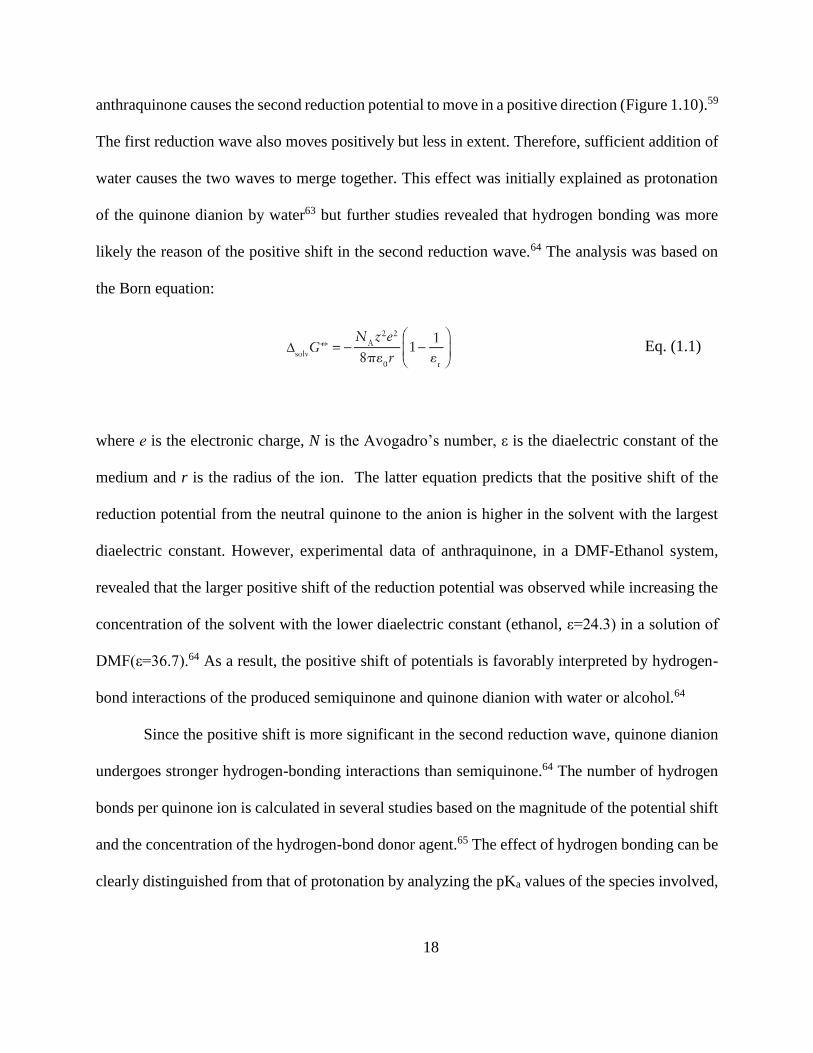
likely the reason of the positive shift in the second reduction wave.64 The analysis was based on
the Born equation:
Eq. (1.1)
where е is the electronic charge, N is the Avogadro’s number, ε is the diaelectric constant of the
medium and r is the radius of the ion. The latter equation predicts that the positive shift of the
reduction potential from the neutral quinone to the anion is higher in the solvent with the largest
diaelectric constant. However, experimental data of anthraquinone, in a DMF-Ethanol system,
revealed that the larger positive shift of the reduction potential was observed while increasing the
concentration of the solvent with the lower diaelectric constant (ethanol, ε=24.3) in a solution of
DMF(ε=36.7).64 As a result, the positive shift of potentials is favorably interpreted by hydrogen-
bond interactions of the produced semiquinone and quinone dianion with water or alcohol.64
Since the positive shift is more significant in the second reduction wave, quinone dianion
undergoes stronger hydrogen-bonding interactions than semiquinone.64 The number of hydrogen
bonds per quinone ion is calculated in several studies based on the magnitude of the potential shift
and the concentration of the hydrogen-bond donor agent.65 The effect of hydrogen bonding can be
clearly distinguished from that of protonation by analyzing the pKa values of the species involved,
19
the dielectric constants of the solvents, the extent of the potential shifts and the reversibility
observed in the cyclic voltammograms.60
1.6 References
1. Kimizuka, N. Towards Self-Assembling Inorganic Molecular Wires. Advanced Materials
2000, 12 (19), 1461-1463 DOI: 10.1002/1521-4095(200010)12:19<1461::AID-
ADMA1461>3.0.CO;2-X.
2. Sheberla, D.; Bachman, J. C.; Elias, J. S.; Sun, C.-J.; Shao-Horn, Y.; Dincă, M. Conductive
MOF electrodes for stable supercapacitors with high areal capacitance. Nature Materials 2016, 16,
220 DOI: 10.1038/nmat4766 https://www.nature.com/articles/nmat4766#supplementary-
information.
3. Larcher, D.; Tarascon, J. M. Towards greener and more sustainable batteries for electrical
energy storage. Nature chemistry 2015, 7 (1), 19-29 DOI: 10.1038/nchem.2085.
4. Xu, G.; Nie, P.; Dou, H.; Ding, B.; Li, L.; Zhang, X. Exploring metal organic frameworks
for energy storage in batteries and supercapacitors. Materials Today 2017, 20 (4), 191-209 DOI:
https://doi.org/10.1016/j.mattod.2016.10.003.
5. DeBlase, C. R.; Hernández-Burgos, K.; Silberstein, K. E.; Rodríguez-Calero, G. G.;
Bisbey, R. P.; Abruña, H. D.; Dichtel, W. R. Rapid and Efficient Redox Processes within 2D
Covalent Organic Framework Thin Films. ACS Nano 2015, 9 (3), 3178-3183 DOI:
10.1021/acsnano.5b00184.

20
6. Allendorf, M. D.; Schwartzberg, A.; Stavila, V.; Talin, A. A. A roadmap to implementing
metal-organic frameworks in electronic devices: challenges and critical directions. Chemistry
2011, 17 (41), 11372-88 DOI: 10.1002/chem.201101595.
7. Wang, G.; Zhang, L.; Zhang, J. A review of electrode materials for electrochemical
supercapacitors. Chemical Society Reviews 2012, 41 (2), 797-828 DOI: 10.1039/C1CS15060J.
8. Halls, J. E.; Jiang, D.; Burrows, A. D.; Kulandainathan, M. A.; Marken, F. In
Electrochemistry: Volume 12; The Royal Society of Chemistry: 2014; Vol. 12, pp 187-210.
9. Yaghi, O. M.; O'Keeffe, M.; Kanatzidis, M. Design of Solids from Molecular Building
Blocks: Golden Opportunities for Solid State Chemistry. Journal of Solid State Chemistry 2000,
152 (1), 1-2.
10. Tranchemontagne, D. J.; Ni, Z.; O'Keeffe, M.; Yaghi, O. M. ChemInform Abstract:
Reticular Chemistry of Metal—Organic Polyhedra. ChemInform 2008, 39 (40), no-no DOI:
10.1002/chin.200840226.
11. Dang, D.; Wu, P.; He, C.; Xie, Z.; Duan, C. Homochiral Metal−Organic Frameworks for
Heterogeneous Asymmetric Catalysis. Journal of the American Chemical Society 2010, 132 (41),
14321-14323 DOI: 10.1021/ja101208s.
12. Yaghi, O. M.; O'Keeffe, M.; Ockwig, N. W.; Chae, H. K.; Eddaoudi, M.; Kim, J. Reticular
synthesis and the design of new materials. Nature 2003, 423 (6941).
13. Li, H. E., Mohamed; O'Keeffe, M; Yaghi, O. M. Design and synthesis of an exceptionally stable
and highly porous metal-organic framework. Nature 1999, 402 ( 6759), 276-279.

21
14. Nijkamp, M. G.; Raaymakers, J. E. M. J.; van Dillen, A. J.; de Jong, K. P. Hydrogen storage
using physisorption – materials demands. Appl Phys A 2001, 72 (5), 619-623 DOI:
10.1007/s003390100847.
15. Chester, A. W.; Clement, C. P.; Han, S., Faujasite zeolitic materials. In Google Patents:
2000.
16. Davis, M. E. Ordered porous materials for emerging applications. Nature 2002, 417 (6891),
813-21.
17. Farha, O. K.; Eryazici, I.; Jeong, N. C.; Hauser, B. G.; Wilmer, C. E.; Sarjeant, A. A.;
Snurr, R. Q.; Nguyen, S. T.; Yazaydın, A. Ö.; Hupp, J. T. Metal–Organic Framework Materials
with Ultrahigh Surface Areas: Is the Sky the Limit? Journal of the American Chemical Society
2012, 134 (36), 15016-15021 DOI: 10.1021/ja3055639.
18. Murray, L. J.; Dinca, M.; Long, J. R. Hydrogen storage in metal-organic frameworks.
Chemical Society Reviews 2009, 38 (5), 1294-1314 DOI: 10.1039/b802256a.
19. Bai, Y.; Dou, Y.; Xie, L.-H.; Rutledge, W.; Li, J.-R.; Zhou, H.-C. Zr-based metal-organic
frameworks: design, synthesis, structure, and applications. Chem. Soc. Rev. 2016, 45 (8), 2327-
2367 DOI: 10.1039/C5CS00837A.
20. Cavka, J. H.; Jakobsen, S.; Olsbye, U.; Guillou, N.; Lamberti, C.; Bordiga, S.; Lillerud, K.
P. A New Zirconium Inorganic Building Brick Forming Metal Organic Frameworks with
Exceptional Stability. Journal of the American Chemical Society 2008, 130 (42), 13850-13851
DOI: 10.1021/ja8057953.

22
21. DeCoste, J. B.; Peterson, G. W.; Jasuja, H.; Glover, T. G.; Huang, Y.-g.; Walton, K. S.
Stability and degradation mechanisms of metal-organic frameworks containing the Zr6O4(OH)4
secondary building unit. Journal of Materials Chemistry A 2013, 1 (18), 5642-5650 DOI:
10.1039/C3TA10662D.
22. Shearer, G. C.; Chavan, S.; Bordiga, S.; Svelle, S.; Olsbye, U.; Lillerud, K. P. Defect
Engineering: Tuning the Porosity and Composition of the Metal–Organic Framework UiO-66 via
Modulated Synthesis. Chemistry of Materials 2016, 28 (11), 3749-3761 DOI:
10.1021/acs.chemmater.6b00602.
23. Wang, T. C.; Vermeulen, N. A.; Kim, I. S.; Martinson, A. B. F.; Stoddart, J. F.; Hupp, J.
T.; Farha, O. K. Scalable synthesis and post-modification of a mesoporous metal-organic
framework called NU-1000. Nature Protocols 2015, 11, 149 DOI: 10.1038/nprot.2016.001.
24. Deria, P.; Bury, W.; Hupp, J. T.; Farha, O. K. Versatile functionalization of the NU-1000
platform by solvent-assisted ligand incorporation. Chem. Commun. 2014, 50 (16), 1965-1968 DOI:
10.1039/C3CC48562E.
25. Hod, I.; Bury, W.; Gardner, D. M.; Deria, P.; Roznyatovskiy, V.; Wasielewski, M. R.;
Farha, O. K.; Hupp, J. T. Bias-Switchable Permselectivity and Redox Catalytic Activity of a
Ferrocene-Functionalized, Thin-Film Metal–Organic Framework Compound. The Journal of
Physical Chemistry Letters 2015, 6 (4), 586-591 DOI: 10.1021/acs.jpclett.5b00019.
26. Marshall, R. J.; Forgan, R. S. Postsynthetic Modification of Zirconium Metal-Organic
Frameworks. European Journal of Inorganic Chemistry 2016, 2016 (27), 4310-4331 DOI:
10.1002/ejic.201600394.

23
27. Lin, S.; Pineda-Galvan, Y.; Maza, W. A.; Epley, C. C.; Zhu, J.; Kessinger, M. C.; Pushkar,
Y.; Morris, A. J. Electrochemical Water Oxidation by a Catalyst-Modified Metal–Organic
Framework Thin Film. ChemSusChem 2017, 10 (3), 514-522 DOI: 10.1002/cssc.201601181.
28. Hod, I.; Farha, O. K.; Hupp, J. T. Modulating the rate of charge transport in a metal-organic
framework thin film using host:guest chemistry. Chemical Communications 2016, 52 (8), 1705-
1708 DOI: 10.1039/C5CC09695B.
29. Liu, J.; Woll, C. Surface-supported metal-organic framework thin films: fabrication
methods, applications, and challenges. Chemical Society Reviews 2017, 46 (19), 5730-5770 DOI:
10.1039/C7CS00315C.
30. Ahrenholtz, S. R.; Epley, C. C.; Morris, A. J. Solvothermal Preparation of an
Electrocatalytic Metalloporphyrin MOF Thin Film and its Redox Hopping Charge-Transfer
Mechanism. Journal of the American Chemical Society 2014, 136 (6), 2464-2472 DOI:
10.1021/ja410684q.
31. Kobayashi, Y.; Jacobs, B.; Allendorf, M. D.; Long, J. R. Conductivity, Doping, and Redox
Chemistry of a Microporous Dithiolene-Based Metal−Organic Framework. Chemistry of
Materials 2010, 22 (14), 4120-4122 DOI: 10.1021/cm101238m.
32. Morozan, A.; Jaouen, F. Metal organic frameworks for electrochemical applications.
Energy & Environmental Science 2012, 5 (11), 9269-9290 DOI: 10.1039/c2ee22989g.
33. Millward, R. C.; Madden, C. E.; Sutherland, I.; Mortimer, R. J.; Fletcher, S.; Marken, F.
Directed assembly of multilayers - the case of Prussian Blue. Chemical Communications 2001,
(19), 1994-1995 DOI: 10.1039/b106616c.
24
34. Lin, H.; Wang, X.; Hu, H.; Chen, B.; Liu, G. A novel copper(II) complex constructed with
mixed ligands of biphenyl-4,4′-dicarboxylic acid (H2bpdc) and dipyrido[3,2-d:2′,3′-f]quinoxaline
(Dpq): Synthesis, structure, electrochemistry and electrocatalysis. Solid State Sciences 2009, 11
(3), 643-650 DOI: http://dx.doi.org/10.1016/j.solidstatesciences.2008.10.007.
35. Nguyen, T. L. A.; Devic, T.; Mialane, P.; Riviere, E.; Sonnauer, A.; Stock, N.; Demir-
Cakan, R.; Morcrette, M.; Livage, C.; Marrot, J. r.; Tarascon, J.-M.; Ferey, G. r. Reinvestigation
of the MII (M = Ni, Co)/TetraThiafulvaleneTetraCarboxylate System Using High-Throughput
Methods: Isolation of a Molecular Complex and Its Single-Crystal-to-Single-Crystal
Transformation to a Two-Dimensional Coordination Polymer. Inorganic Chemistry 2010, 49 (22),
10710-10717 DOI: 10.1021/ic101906u.
36. Behera, J. N.; D’Alessandro, D. M.; Soheilnia, N.; Long, J. R. Synthesis and
Characterization of Ruthenium and Iron−Ruthenium Prussian Blue Analogues. Chemistry of
Materials 2009, 21 (9), 1922-1926 DOI: 10.1021/cm900230p.
37. Zeng, M.-H.; Wang, Q.-X.; Tan, Y.-X.; Hu, S.; Zhao, H.-X.; Long, L.-S.; Kurmoo, M.
Rigid Pillars and Double Walls in a Porous Metal-Organic Framework: Single-Crystal to Single-
Crystal, Controlled Uptake and Release of Iodine and Electrical Conductivity. Journal of the
American Chemical Society 2010, 132 (8), 2561-2563 DOI: 10.1021/ja908293n.
38. Halls, J. E.; Ahn, S. D.; Jiang, D.; Keenan, L. L.; Burrows, A. D.; Marken, F. Proton uptake
vs. redox driven release from metal–organic-frameworks: Alizarin red S reactivity in UMCM-1.
Journal of Electroanalytical Chemistry 2013, 689, 168-175 DOI:
http://dx.doi.org/10.1016/j.jelechem.2012.11.016.

25
39. DeBlase, C. R.; Silberstein, K. E.; Truong, T.-T.; Abruña, H. D.; Dichtel, W. R. β-
Ketoenamine-Linked Covalent Organic Frameworks Capable of Pseudocapacitive Energy
Storage. Journal of the American Chemical Society 2013, 135 (45), 16821-16824 DOI:
10.1021/ja409421d.
40. Chandra, S.; Roy Chowdhury, D.; Addicoat, M.; Heine, T.; Paul, A.; Banerjee, R.
Molecular Level Control of the Capacitance of Two-Dimensional Covalent Organic Frameworks:
Role of Hydrogen Bonding in Energy Storage Materials. Chemistry of Materials 2017, 29 (5),
2074-2080 DOI: 10.1021/acs.chemmater.6b04178.
41. Gui, B.; Meng, X.; Chen, Y.; Tian, J.; Liu, G.; Shen, C.; Zeller, M.; Yuan, D.; Wang, C.
Reversible Tuning Hydroquinone/Quinone Reaction in Metal–Organic Framework: Immobilized
Molecular Switches in Solid State. Chemistry of Materials 2015, 27 (18), 6426-6431 DOI:
10.1021/acs.chemmater.5b02648.
42. Zhang, Z.; Yoshikawa, H.; Awaga, K. Monitoring the Solid-State Electrochemistry of
Cu(2,7-AQDC) (AQDC = Anthraquinone Dicarboxylate) in a Lithium Battery: Coexistence of
Metal and Ligand Redox Activities in a Metal–Organic Framework. Journal of the American
Chemical Society 2014, 136 (46), 16112-16115 DOI: 10.1021/ja508197w.
43. Zhang, Z.; Yoshikawa, H.; Awaga, K. Discovery of a “Bipolar Charging” Mechanism in
the Solid-State Electrochemical Process of a Flexible Metal–Organic Framework. Chemistry of
Materials 2016, 28 (5), 1298-1303 DOI: 10.1021/acs.chemmater.5b04075.
44. Mulzer, C. R.; Shen, L.; Bisbey, R. P.; McKone, J. R.; Zhang, N.; Abruña, H. D.; Dichtel,
W. R. Superior Charge Storage and Power Density of a Conducting Polymer-Modified Covalent
Organic Framework. ACS Central Science 2016, 2 (9), 667-673 DOI: 10.1021/acscentsci.6b00220.
26
45. Gándara, F.; Uribe-Romo, F. J.; Britt, D. K.; Furukawa, H.; Lei, L.; Cheng, R.; Duan, X.;
O'Keeffe, M.; Yaghi, O. M. Porous, Conductive Metal-Triazolates and Their Structural
Elucidation by the Charge-Flipping Method. Chemistry – A European Journal 2012, 18 (34),
10595-10601 DOI: 10.1002/chem.201103433.
46. Sun, L.; Miyakai, T.; Seki, S.; Dincă, M. Mn2(2,5-disulfhydrylbenzene-1,4-dicarboxylate):
A Microporous Metal–Organic Framework with Infinite (−Mn–S−)∞ Chains and High Intrinsic
Charge Mobility. Journal of the American Chemical Society 2013, 135 (22), 8185-8188 DOI:
10.1021/ja4037516.
47. Narayan, T. C.; Miyakai, T.; Seki, S.; Dincă, M. High Charge Mobility in a
Tetrathiafulvalene-Based Microporous Metal–Organic Framework. Journal of the American
Chemical Society 2012, 134 (31), 12932-12935 DOI: 10.1021/ja3059827.
48. Schröder, U.; Oldham, K. B.; Myland, J. C.; Mahon, P. J.; Scholz, F. Modelling of solid
state voltammetry of immobilized microcrystals assuming an initiation of the electrochemical
reaction at a three-phase junction. Journal of Solid State Electrochemistry 2000, 4 (6), 314-324
DOI: 10.1007/s100080000130.
49. Aguilar-Martinez, M.; Macias-Ruvalcaba, N. A.; Bautista-Martinez, J. A.; Gomez, M.;
Gonzalez, F. J.; Gonzalez, I. Review: Hydrogen Bond and Protonation as Modifying Factors of
the Quinone Reactivity. Current Organic Chemistry 2004, 8 (17), 1721-1738 DOI:
10.2174/1385272043369548.
50. Guin, P. S.; Das, S.; Mandal, P. C. Sodium 1, 4-dihydroxy-9, 10-anthraquinone- 2-
sulphonate interacts with calf thymus DNA in a way that mimics anthracycline antibiotics: an

27
electrochemical and spectroscopic study. Journal of Physical Organic Chemistry 2010, 23 (6),
477-482 DOI: 10.1002/poc.1624.
51. Fieser, L. F. THE TAUTOMERISM OF HYDROXY QUINONES. Journal of the
American Chemical Society 1928, 50 (2), 439-465 DOI: 10.1021/ja01389a033.
52. Guin, P. S.; Das, S.; Mandal, P. C. Electrochemical Reduction of Quinones in Different
Media: A Review. International Journal of Electrochemistry 2011, 2011, DOI:
10.4061/2011/816202.
53. He, P.; Crooks, R. M.; Faulkner, L. R. Adsorption and electrode reactions of disulfonated
anthraquinones at mercury electrodes. The Journal of Physical Chemistry 1990, 94 (3), 1135-1141
DOI: 10.1021/j100366a023.
54. Blankespoor, R. L.; Hsung, R.; Schutt, D. L. Electroreductive cleavage of substituted 9,10-
anthraquinones in 50% aqueous THF buffers: a pH-dependent process. The Journal of Organic
Chemistry 1988, 53 (13), 3032-3035 DOI: 10.1021/jo00248a024.
55. Han, S. W.; Ha, T. H.; Kim, C. H.; Kim, K. Self-Assembly of Anthraquinone-2-carboxylic
Acid on Silver: Fourier Transform Infrared Spectroscopy, Ellipsometry, Quartz Crystal
Microbalance, and Atomic Force Microscopy Study. Langmuir 1998, 14 (21), 6113-6120 DOI:
10.1021/la980259j.
56. Osawa, M.; Ataka, K.-i.; Yoshii, K.; Yotsuyanagi, T. Surface-enhanced infrared ATR
spectroscopy for in situ studies of electrode/electrolyte interfaces. Journal of Electron
Spectroscopy and Related Phenomena 1993, 64–65 (0), 371-379 DOI:
http://dx.doi.org/10.1016/0368-2048(93)80099-8.
28
57. Ojani, R. R., Jahanbakhsh and Ebrahimi, Manochehr. A Cyclic Voltammetric Study of the
Aqueous Electrochemistry of Some Anthraquinone Derivatives on Carbon Paste Electrode. Iran.
J. Chem. & Chem. Eng. 2001, 20 (2).
58. Partha Sarathi Guin, S. D., P. C. Mandal. Electrochemical Reduction of Sodium 1,4-
dihydroxy-9,10-anthraquinone-2-sulphonate in Aqueous and Aqueous Dimethyl Formamide
Mixed Solvent: A Cyclic Voltammetric Study. Int. J. Electrochem. Sci 2008, 3, 1016 - 1028
59. Quan, M.; Sanchez, D.; Wasylkiw, M. F.; Smith, D. K. Voltammetry of Quinones in
Unbuffered Aqueous Solution: Reassessing the Roles of Proton Transfer and Hydrogen Bonding
in the Aqueous Electrochemistry of Quinones. Journal of the American Chemical Society 2007,
129 (42), 12847-12856 DOI: 10.1021/ja0743083.
60. Gupta, N.; Linschitz, H. Hydrogen-Bonding and Protonation Effects in Electrochemistry
of Quinones in Aprotic Solvents. Journal of the American Chemical Society 1997, 119 (27), 6384-
6391 DOI: 10.1021/ja970028j.
61. Meisel, D.; Czapski, G. One-electron transfer equilibriums and redox potentials of radicals
studied by pulse radiolysis. The Journal of Physical Chemistry 1975, 79 (15), 1503-1509 DOI:
10.1021/j100582a004.
62. Ashnagar, A.; Bruce, J. M.; Dutton, P. L.; Prince, R. C. One- and two-electron reduction
of hydroxy-1,4-naphthoquinones and hydroxy-9,10-anthraquinones. The role of internal hydrogen
bonding and its bearing on the redox chemistry of the anthracycline antitumour quinones. Biochim
Biophys Acta 1984, 801 (3), 351-9.

29
63. Peover, M. E. 879. A polarographic investigation into the redox behaviour of quinones: the
roles of electron affinity and solvent. Journal of the Chemical Society (Resumed) 1962, (0), 4540-
4549 DOI: 10.1039/jr9620004540.
64. Hayano, S.; Fujihira, M. The Effect of Water on the Reduction Potentials of Some
Aromatic Compounds in the DMF-Water System. Bulletin of the Chemical Society of Japan 1971,
44 (8), 2051-2055 DOI: 10.1246/bcsj.44.2051.
65. Olmstead, W. N.; Margolin, Z.; Bordwell, F. G. Acidities of water and simple alcohols in
dimethyl sulfoxide solution. The Journal of Organic Chemistry 1980, 45 (16), 3295-3299 DOI:
10.1021/jo01304a032.

30
2. Proton-Coupled Electron Transport in Anthraquinone-based
Zirconium Metal-Organic Frameworks
This chapter has been adapted from a published manuscript Paula J. Celis-Salazar, Charity
C. Epley, Spencer R. Ahrenholtz, William A. Maza, Pavel M. Usov, Amanda J. Morris from the
following reference: Inorganic Chemisry, 2017, 56, 22, 13741-13747. Reprinted with permission
from the American Chemical Society copyright © 2017.
2.1 ABSTRACT
The ditopic ligands, 2,6-dicarboxy-9,10-anthraquinone and 1,4-dicarboxy-9,10-
anthraquinone were used to synthesize two new UiO-type metal-organic frameworks (2,6-Zr-AQ-
MOF and 1,4-Zr-AQ-MOF, respectively). The Pourbaix diagrams (E vs. pH) of the MOFs and
their ligands were constructed using cyclic voltammetry in aqueous buffered media. The MOFs
exhibit chemical stability and undergo diverse electrochemical processes, where the number of
electrons and protons transferred was tailored in a Nernstian manner by the pH of the media. Both
the 2,6-Zr-AQ-MOF and its ligand reveal a similar electrochemical pKa value (7.56 and 7.35,
respectively) for the transition between a two-electron, two-proton transfer (at pH < pKa) and a
two-electron, one-proton transfer (at pH > pKa). In contrast, the position of the quinone moiety
with respect to the zirconium node, the effect of hydrogen bonding, and the amount of defects in
1,4-Zr-AQ-MOF, lead to the transition from a two-electron, three-proton transfer to a two-electron,
one-proton transfer. The pKa of this framework (5.18) is analogous to one of the three
electrochemical pKa values displayed by its ligand (3.91, 5.46, and 8.80), which also showed

31
intramolecular hydrogen bonding. The ability of the MOFs to tailor discrete numbers of protons
and electrons, suggests their application as charge carriers in electronic devices.
2.2 INTRODUCTION
The application of metal-organic frameworks (MOFs) as active materials in electronic
devices has been proposed as a suitable alternative to achieve efficient charge storage and energy
conversion.1 The characteristic synthetic tunability, high permanent porosity, and structural
uniformity of MOFs position these materials as prospective candidates for assembling high surface
electrodes containing well-organized redox moieties that are capable to store electricity.2 In
particular, the ability of MOFs to undergo electron transport has been achieved through three
different synthetic approaches: 1) charge transfer through metal-ligand orbital overlap,3 2) π-
stacking interactions between electroactive ligands within the framework4 and 3) redox hopping.5
Nevertheless, the synthetic design of MOFs that exhibit proton-coupled electron transport (PCET)
remains in its early stages. The two main necessities are the ability to facilitate high electron and
proton conduction and a high water stability over a range of pH.
One way to address these requirements is to integrate ligands capable of undergoing PCET
into isoreticular arrays of highly stable MOFs, such as the UiO-series. These zirconium-based
MOFs have demonstrated an exceptional stability in water and in acidic pH.6, 7 Similarly, quinone
ligands are recognized as excellent PCET agents, since they play an important role in biochemical
processes, including photosynthesis and oxidative phosphorylation.8 The redox chemistry of
quinones is strongly influenced by the pH of the media. Generally, at acidic pH, the quinone (Q)
reduction is a single-step, two-electron, two-proton process which generates the respective
hydroquinone (QH2).9 At alkaline pH, the concentration of protons is too low to support PCET,

32
therefore the redox process is a two-electron transfer to form the dianion (Q2-).9 At neutral pH, the
quinone can undergo either a two-electron, one-proton process resulting in the protonated dianion
specie (QH-), or alternatively it could lead to the formation of the dianion (SI, Scheme S2).9 The
electrochemical pKa values of the different redox and protonation states of quinone species can be
represented using a potential (E) vs. pH plot (Pourbaix diagram).
Quinone-based ligands have served as an inspiration to the synthesis of covalent-organic
frameworks (COFs)10, 11 and other MOFs that show potential applications in batteries and
supercapacitors.12-14 However, understanding the effect of local pH in the pore environment of
these frameworks remains vague. A hitherto study of the reduction of MOF UMCM-1 containing
a nanoconfined anthraquinone molecule (Alizarin red S) in its pores showed that a typical two-
electron, two-proton process at acidic pH was experienced only in anthraquinone molecules
located at the MOF surface.15, 16 In contrast, the deficiency of protons inside the MOF pores created
a local alkaline environment during the two-electron reduction that led to the formation of the
negatively charged dianion, which was ejected from the framework in order to stabilize internal
charge.15, 16
Furthermore, the protonation state of the zirconium nodes of UiO-MOFs is also directly
influenced by the local pH.17 As a result, assembling these frameworks with ligands that exhibit
quinone moieties in the proximity of the zirconium cluster may result in the occurrence of other
complex processes, such as hydrogen bonding or linker-to-node proton transfer. Additionally, the
pore size and the amount of defects (missing ligands) in the framework may play an important role
in the transport of protons within the MOF pores. In order to elucidate these factors, we sought to
study the effect of applied potential and pH on the equilibrium between different quinone species
in these materials, where the specific number of protons and electrons transferred can be

33
accounted. Herein, we report the first example of Pourbaix diagrams for two different
anthraquinone-based zirconium MOFs that exhibit diverse electrochemical response in aqueous
electrolytes due to the positioning of the quinone moiety with respect to the zirconium node, the
amount of defects, and the pore size. To the best of our knowledge, these types of studies have not
been performed on redox-active frameworks to date. These results demonstrate the potential of
MOFs to be employed as proton-electron carriers in energy transport systems.
2.3 EXPERIMENTAL SECTION
2.3.1 Synthesis of 2,6-dicarboxy-9,10-anthhraquinone (1)
The synthesis of 1 was achieved in two steps by adapting previous procedures described in
the literature (Scheme S2.1).18, 19 Benzoquinone (3.25 g, 30 mmol), isoprene (10.0 mL) and traces
of hydroquinone (two spatula tips), were suspended in 20.0 mL of absolute ethanol. The mixture
was placed in a 40.0 mL autoclave and heated at 130 °C for 6 h. Once the autoclave reached room
temperature, the mixture was dissolved in a potassium hydroxide solution in ethanol (8.5 g of KOH
in 200 mL of EtOH) in a round bottom flask. The solution was stirred and heated for 8 h at 40 °C
under air. Stirring was continued for 12 h at room temperature under air. The mixture was heated
again at 50 °C for 2h, let to reach room temperature and filtered in vacuum to give a white cream
solid. The solid was placed in a vial containing absolute ethanol and left in the fridge overnight.
Subsequently, the solid was filtered again, washed with cold ethanol and water, and dried under
air. 1HNMR confirmed the identity of the product as 2,6-dimethyl-9,10-anthraquinone.18 A
solution of 2,6-dimethyl-9,10-anthraquinone (1.0 g) in 12.0 mL of 25% nitric acid was placed in a
40.0 mL autoclave and heated at 220 °C for 3 h. After cooling to room temperature, the yellow
precipitate was filtered under vacuum and washed with water. The solid was dried overnight,

34
affording pure 1 with 69% yield.19 1H NMR (400 MHz, DMSO): δ 13.77 (s, 2H), 8.69(dd, J= 1.8
Hz, 0.4 Hz, 2H), 8.44(dd, J=8 Hz, 1.8Hz, 2H), 8.36(d,d J= 8 Hz, 0.4 Hz, 2H). HRMS: (M+H)+:
297.0375.
2.3.2 Synthesis of 1,4-dicarboxy-9,10-anthhraquinone (2)
The synthesis of 2 was achieved in two steps by adapting previous procedures described in
the literature (Scheme S1).19, 20 First, a solution of 1,4-naphthoquinone (9.35 g, 0.059 mol) and
2,4-hexadiene (5.0 g, 0.605 mol) in toluene (35 mL) was heated at 65°C for 4 days. Subsequently,
the solvent was evaporated and the remaining oily solid was used in the next step without further
purification. The oily solid (15.0 g) was disolved in 250 mL absolute ethanol and added to a
solution of KOH (30 g) in ethanol (1.25 L), while cooled at 10 °C. Then a current of oxygen was
bubbled through the solution for 1 h while the temperature was maintained at 10 °C. After the
solvent was evaporated, the semisolid residue was treated with water (600 mL) and extracted with
benzene. Removal of the aromatic solvent and afforded 1,4-dimethyl-9,10-anthraquinone with
70% yield.20 A solution of 1,4-dimethyl-9,10-anthraquinone (1.0 g) in 12.0 mL of 25% nitric acid
was placed in a 40.0 mL autoclave and heated at 220 °C for 3 h. After cooling to room temperature,
the yellow precipitate was filtered under vacuum and washed with water. The solid was dried
overnight, affording pure 2 with 69% yield.19 1H NMR (400 MHz, DMSO): δ 13.37 (s, 2H), 8.19
(dd, J=5.6 Hz, 3.2 Hz, 2H), 7.99 (dd, J=5.6 Hz, 3.2 Hz, 2H), 7.89 (s, 2H). HRMS: (M+H)+:
297.0376.
2.3.3 Synthesis of 2,6-Zr-AQ MOF [Zr6O4(OH)4(C16O6H6)6 (C3H7NO)17(H2O)22]
The synthesis was carried out using a similar procedure previously reported in the
literature.21 ZrCl4 (23.0 mg, 0.1 mmol) was disolved in 2.0 mL of DMF and sonicated for 5
minutes. Then, the ligand 2,6-dicarboxy-9,10-anthraquinone 1 (29.6 mg, 0.1 mmol) was added to

35
the solution, as well as 47 equivalents (0.3 mL) of acetic acid as a modulator. The mixture was
sonicated for 15 minutes before being set at 120 °C for 24 h. The 2,6-Zr-AQ-MOF was obtained
as a pink powder and isolated by centrifugation. The pink solid was washed and centrifuged three
times with fresh DMF and dried under vacuum at room temperature (Yield 31.3 mg, 75 %).
2.3.4 Synthesis of 1,4- Zr-AQ-MOF [Zr6O4(OH)4(C16O6H6)4(C2O2H3)2.76(CO2H)1.2
(C3H7NO)11(H2O)40]
A mixture of ZrCl4 (23.0 mg, 0.1 mmol), the ligand 1,4-dicarboxy-9,10-anthraquinone 2
(29.6 mg, 0.1 mmol), acetic acid (1.2 mL, 200 equivalents) and DMF (3.0 mL) was sonicated for
15 minutes. The mixture was heated at 120 °C for 48 h. After cooling at a rate of 1 °C/min, the
1,4-Zr-AQ-MOF was obtained as a pink powder, which was isolated by centrifugation. The pink
solid was washed and centrifuged three times with fresh DMF and dried under vacuum at room
temperature (Yield 30.0 mg, 72 %).
2.4 RESULTS AND DISCUSSION
The ligands, 2,6-dicarboxy-9,10-anthraquinone (1) and 1,4-dicarboxy-9,10-anthraquinone
(2) were synthesized in two steps by means of a Diels-Alder reaction followed by oxidation,
according to Scheme S1.18-20 The powdered samples of 2,6-Zr-AQ-MOF [Zr6O4(OH)4(C16O6H6)6
(C3H7NO)17(H2O)22] and 1,4-Zr-AQ-MOF [Zr6O4(OH)4(C16O6H6)4(C2O2H3)2.76(CO2H)1.24
(C3H7NO)11(H2O)40] were obtained by the solvothermal synthesis of ZrCl4 and either 1 or 2 in
DMF, using acetic acid as a modulator (Figure 2.1). Specifically, the addition of 1 and 47
equivalents of acetic acid to a solution of ZrCl4 in DMF, followed by heating at 120 °C for 1 day
afforded 2,6-Zr-AQ-MOF as a pink powder.21 Similarly, the treatment of 2 and ZrCl4 in a mixture
of acetic acid and DMF (1:2.5 by volume) at 120 °C for 2 days gave 1,4-Zr-AQ-MOF as a pink
powder.

36
Figure 2.1. Synthesis of 2,6-Zr-AQ-MOF and 1,4-Zr-AQ-MOF.
Powder X-ray diffraction (PXRD) patterns of 2,6-Zr-AQ-MOF and 1,4-Zr-AQ-MOF
reveal that both MOFs are isostructural with the UiO series (Figure 2.2). Le Bail refinement of the
powder patterns using crystallographic data for UiO-67 and UiO-66 as starting models
respectively, revealed a lattice parameter of a=27.0472 Å for 2,6-Zr-AQ-MOF and a=20.6825 Å
for 1,4-Zr-AQ-MOF (Figure S2.9-S2.10), which is consistent with the length of each ligand. SEM
images of 2,6-Zr-AQ-MOF show that it consists of octahedral-shaped crystallites, characteristic
of UiO-type frameworks. The 1,4-Zr-AQ-MOF, on the other hand, exhibited a more inconsistent
morphology (Figure S2.11-S2.12), presumably due to incorporated defects (vide infra). The N2
adsorption isotherms of both MOFs are shown in Figure 2.2. A BET surface area of 175.6 m2g-1
was found for 2,6-Zr-AQ-MOF, while the 1,4-Zr-AQ-MOF exhibited a surface area of 554.16
m2g-1.

37
The redox behavior of the ligands in aqueous phosphate buffer was studied by cyclic
voltammetry (CV), using a glassy carbon (GC) working electrode. Reduction potentials were
recorded at different pH, in order to construct the Pourbaix diagrams. Both ligands show a single-
step, reversible CV wave, which shifted to more negative reduction potentials with increasing pH
(Figure 2.3 A-B).
Figure 2.2. PXRD patterns of A) 2,6-Zr-AQ-MOF and B) 1,4-Zr-AQ-MOF. The insets
show the corresponding N2 adsorption isotherms.

38
This linear dependence of the reduction potential with respect to pH is expected to follow
the modified Nernst equation:
(2.1)
where m is the number of protons and n is the number of electrons involved in the process.
Therefore, the derivative of this relationship can be expressed as:
(2.2)
and represents the slope of the linear regression between E and pH in the different segments of the
Pourbaix diagrams (Figure 2.3 C-D). As a result, this expression allows the elucidation of the
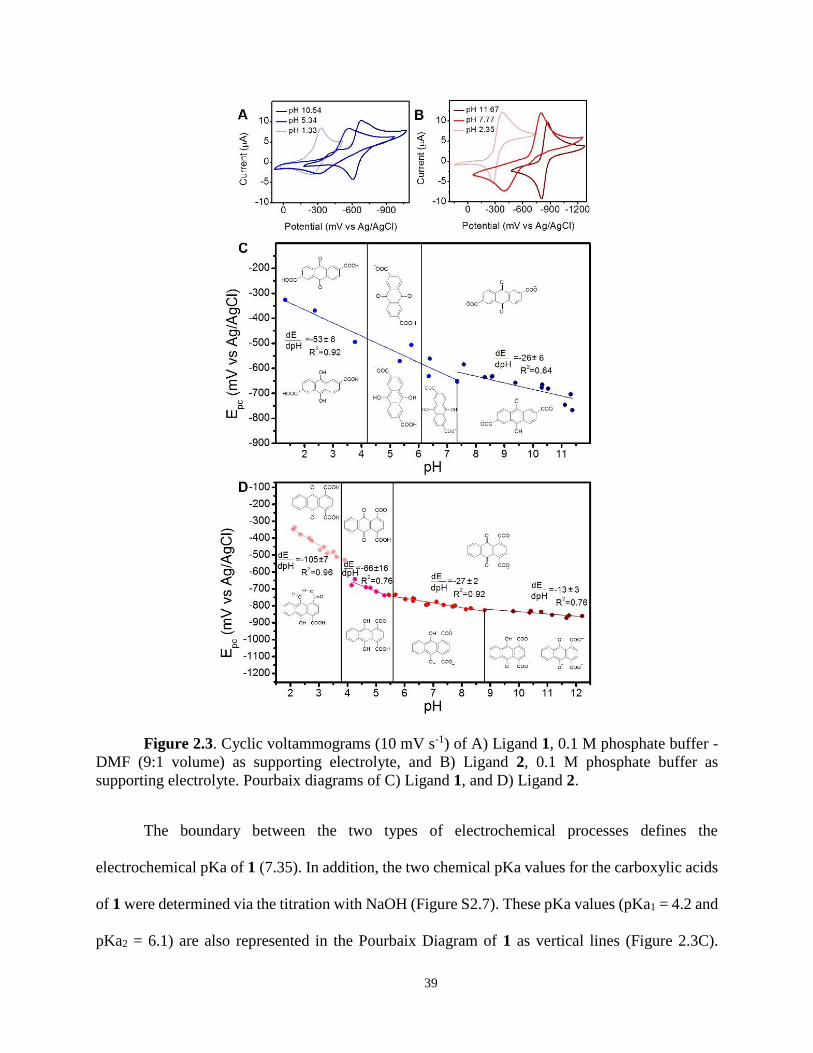
number of protons and electrons transferred during the reduction. For instance, two different
electrochemical processes are apparent in the Pourbaix diagram of ligand 1 (Figure 2.3C). An
experimentally determined relationship of dE/dpH of -53 ± 6 between pH 1.33 and 7.35, suggests
a two-electron, two-proton transfer to the quinone moiety of the ligand to form the respective
hydroquinone. In addition, from pH 7.35 to 11.38, a slope (dE/dpH) of -26 ± 6 evidenced a two-
electron, one-proton transfer from the quinone to the correspondent protonated dianion. The
appearance of these two processes in ligand 1 is typical of many anthraquinone systems in aqueous
buffer and has been extensively discussed in the literature.8, 9, 22, 23
39
Figure 2.3. Cyclic voltammograms (10 mV s-1) of A) Ligand 1, 0.1 M phosphate buffer -
DMF (9:1 volume) as supporting electrolyte, and B) Ligand 2, 0.1 M phosphate buffer as
supporting electrolyte. Pourbaix diagrams of C) Ligand 1, and D) Ligand 2.
The boundary between the two types of electrochemical processes defines the
electrochemical pKa of 1 (7.35). In addition, the two chemical pKa values for the carboxylic acids
of 1 were determined via the titration with NaOH (Figure S2.7). These pKa values (pKa1 = 4.2 and
pKa2 = 6.1) are also represented in the Pourbaix Diagram of 1 as vertical lines (Figure 2.3C).

40
Similarly, the titration of 2 (Figure S2.8) allowed the determination of pKa1 = 3.7 and pKa2 = 5.6
for the two carboxylic acid in 2 (Figure 2.3D).
Interestingly, ligand 2 was found to undergo four different PCET processes (Figure 2.3D).
Similar to ligand 1, a two-electron, one-proton transfer from the quinone to the correspondent
protonated dianion was observed from pH 5.46 to 8.80, as evidenced by a slope of -27 ± 2. In
addition, for pH between 3.91 and 5.46, the slope was found to be -66 ± 16, suggesting a two-
electron, and two-proton transfer process of the quinone moiety of 2 to form the hydroquinone.
However, two other processes were evidenced at the highest and lowest pH ranges tested
in this study: At high pH (from pH 8.80 to 12.22) a four-electron one-proton transfer represented
by a slope of -13 ± 3, involved the reaction of two ligand molecules to produce both the dianion
and protonated dianion.24-26 The formation of equal amounts of these species of 2 at alkaline pH,
which was not observed in 1, may be a result of the difficulty to protonate this moiety due to the
proximity of the carboxylic acid.
Moreover, at pH below 3.91, a slope of -105±7 involving a transfer of either two electrons
and three protons, or two electrons and four protons characterized the last process. Since the
carboxylic acid groups of 2 are fully protonated at pH <3.7 a maximum of two protons can be
transferred to the quinone to form the hydroquinone. The apparition of a third or fourth proton
during the reduction can be explained based on the proximity of the carboxylic acids to the quinone
moiety in 2. First, it is expected that the pKa of the carboxylic acids of 2 in the hydroquinone state
is much lower (≈2) compared to the quinone state.27, 28 As a result, the observed transfer of two
electrons and three/four protons could be attributed to a simultaneous protonation of the carboxylic
acid of the reduced hydroquinone moiety that is stabilized through hydrogen bonding. Figure 2.3D
shows the proposed seven-membered ring structure formed during the two-electron, three-proton

41
transfer. Predominantly, hydroquinones have been found to form both intermolecular29, 30 and
intramolecular hydrogen bonding with other –OH functionalities.31 In fact, the existence of
hydrogen bonding between hydroquinone moieties and carboxylic acids is well documented.31, 32
Consequently, the proximity of the carboxylic acids to the hydroxyl group in the hydroquinone
species could also lead to intramolecular stabilization due to hydrogen bonding. In order to test
this claim, the Pourbaix diagram of a similar derivative, 1,4-dimethyl-9,10-anthraquinone, was
obtained under identical conditions (Figure S2.18). In this analogue, the carboxylic acid groups
are replaced with methyl groups. A slope of -52 ± 2 was determined for pH between 1.69 and 6.15
indicating that this analogue undergoes a two-electron, two-proton transfer. This finding supports
the earlier explanation for the transfer of additional protons during the reduction of 2 at pH <3.91
with the third/fourth proton originating from the protonation of the carboxylate in the
hydroquinone form of 2, and stabilized through intramolecular hydrogen bonding. This
stabilization is less likely in 1 since carboxylic acid and hydroxyl functionalities are further apart.
Cyclic voltammetry of the anthraquinone frameworks were performed on the dried slurry
of the MOF powder (10 mg), graphite (10 mg), poly-methyl methacrylate (3.34 mg), and THF (1
mL), deposited on a GC electrode. Subsequently, this working electrode was used in a three-
electrode assembly, with a HEPES-buffered aqueous solution as supporting electrolyte (see SI for
detailed procedure). UV-Vis spectroscopy was used to monitor the stability of the frameworks,
evidenced as the absence of ligand absorption in solution before and after the CV measurements
over the range of pH (Figure S2.20-S2.22). The 2,6-Zr-AQ-MOF showed stability from pH 1.74
to 9.67, while the 1,4-Zr-AQ-MOF was stable from pH 1.66 to 6.75. Both MOFs showed a
reversible redox process which shifted to more negative potential with increasing pH (Figure 2.4
A-B).

42
Figure 2.4. Cyclic voltammograms (100 mV s-1, 0.1 M HEPES buffer as supporting
electrolyte) of A) 2,6-Zr-AQ-MOF, and B) 1,4-Zr-AQ-MOF. Pourbaix diagrams of C) 2,6-Zr-
AQ-MOF, and D) 1,4-Zr-AQ-MOF
The behavior of 2,6-Zr-AQ-MOF was very similar to that observed for its free ligand in
solution. The Pourbaix diagram of this MOF showed two electrochemical processes, defined by
an electrochemical pKa of 7.56 (Figure 2.4C). For pH <7.56, a slope of -63 ± 4 was observed

43
indicating the two-electron, two-proton transfer to the quinone resulting in the hydroquinone state
of the ligand inside 2,6-Zr-AQ-MOF. Furthermore, for pH >7.56 either a two-electron, one-proton
transfer or a two-electron, two-proton transfer took place, as evidenced by a slope of -39 ± 3. For
clarity, only the two-electron, one-proton transfer is shown in the correspondent segment of the
Pourbaix Diagram in Figure 2.4C. The similarity in the electrochemical pKa of 2,6-Zr-AQ-MOF
(7.56) and its ligand in solution (7.35) reveals that the pore dimensions of this framework allow a
sufficient transport of protons inside the MOF pores. Consequently, the pH in the pores is the same
as in the bulk solution, and only the pH tailors the number of protons transferred to the quinone
moiety during the reduction. This fact corroborates the benefits of introducing anthraquinone
moieties as ligands instead of encapsulating them in the MOF pores as nanoconfined molecules.15,
16
Unlike its ligand, 1,4-Zr-AQ-MOF revealed only two electrochemical processes (Figure
2.4D). For pH > 5.18, the formation of the protonated dianion through a two-electron, one-proton
transfer was characterized by a slope of -29 ± 8. This behavior is comparable to the one of its
ligand in solution at pH between 5.46 and 8.80 (Figure 2.3D), and to the 2,6-Zr-AQ-MOF (Figure
2.4C). This observation suggests that 1,4-Zr-AQ-MOF also allows the efficient penetration of
protons into the MOF structure, and demonstrates the consistency between the pore environment
with respect to the bulk.
The Pourbaix diagram of 1,4-Zr-AQ-MOF also showed a slope of -96 ± 5 for pH < 5.18,
representing a two-electron, three-proton transfer, similar to the one observed for 2 at pH < 3.91
(Figure 2.3D). Since the ligand of 1,4-Zr-AQ-MOF can only accept maximum of two protons
without breaking the metal-carboxylate bonds, this behavior could be explained based on the level
of defects in the MOF. Particularly, the UiO frameworks exhibit two different types of defects. On

44
one hand, “missing linker defects” refer to the absence of ligands coordinated to the Zr-oxide
cluster, that is commonly compensated by modulator molecules connected to the node.33 On the
other hand, the recently discovered “missing cluster defects”, correspond to the absence of Zr6(µ3-
O)4(µ3-OH)4 node, as well as the 12 ligands connected to it, in correlated nanoregions of the reo
topology.34, 35 We sought to calculate the defects in 1,4-Zr-AQ-MOF using quantitative NMR
analysis (Figure S2.23), finding a total modulator to linker molar ratio of 0.96, suggesting an
equivalent amount of linker and modulator in the framework, presumably due to the high
concentration of acetic acid utilized during the synthesis (Figure 2.1). Elemental analysis on the
framework (Table S2.1) also supported these findings. This framework is an analogue of the UiO-
66 MOF, which has been typically recognized to have a high amount of defects,33, 35, 36 and the
shape of the anthraquinone ligand suggests steric hindrance during its formation (Figure 2.1). More
importantly, the PXRD pattern of 1,4-Zr-AQ-MOF (Figure 2.2B) displays a broad peak at 2θ range
of ca. 3-6°, which has been recently assigned as a fingerprint of missing node defects in UiO
frameworks, where one quarter of the MOF clusters are missing.34 The high defectivity of 1,4-Zr-
AQ-MOF, can subsequently explicate the observed two-electron, three-proton transfer shown in
Figure 2.4D, when considering two different possibilities:
The existence of ligands connected only to one node could lead to intramolecular hydrogen
bonding between the free carboxylic acid and the reduced hydroquinone moiety, in a similar
fashion than its ligand in solution (Figure 2.3D). Alternatively, the proximity of the quinone moiety
to the zirconium node (2.6-2.8 Å) inside the framework could also lead to hydrogen bonding
between the hydroquinone and the protons present on the inorganic cluster, as represented in
Figure 2.4D for pH < 5.18. Two of the three types of protons present in the zirconium node are
recognized as -OH and -OH2 groups that occupy the place of missing linkers.17 The acidity of these

45
protons in UiO-66 has been recently studied, finding pKa values of 8.30 and 6.79, respectively.17
This fact suggests that at pH < 5.18 the highly defected node of 1,4-Zr-AQ-MOF is most likely
protonated, facilitating hydrogen bonding between the hydroquinone and the protons in the node
(Figure 2.4D). A related cooperative behavior between linker and node was postulated for the
electrocatalytic water oxidation in PCN-224, where the node acts as a proton acceptor.37 These
processes are not observed in the Pourbaix diagram of 2,6-Zr-AQ-MOF because the quinone
moiety is relatively distant (5.0-5.2 Å) from the zirconium node (Figure 2.1).
2.5 CONCLUSION
In summary, we have shown that PCET can be modulated in anthraquinone-based Zr
MOFs as a function of the pH. The positioning of the quinone moiety with respect to the zirconium
node, the amount of defects, and the pore size of these materials are directly influencing the amount
of protons transported to the frameworks. These results demonstrate that MOFs have potential as
proton-electron carriers for electronic applications and encourage further research in this area.

46
2.6 SUPPORTING INFORMATION
2.6.1 Materials and Instrumentation
2.6.1.1 Materials
All reagents and solvents were purchased from commercial sources and used without
further purification.
2.6.1.2 Nuclear Magnetic Resonance (NMR)
1H NMR spectra were acquired on a Agilent U4-DD2 spectrometer operating at 400 MHz.
Samples were analyzed as solutions in DMSO-d6 (ca. 10 mg mL−1) at 25 °C in standard 5 mm o.d.
tubes.
2.6.1.3 High Resolution Mass Spectrometry (HR-MS)
High-resolution mass spectra were taken on an Agilent Technologies 6220 TOF LC/MS
mass spectrometer.
2.6.1.4 Attenuated Total Reflectance Fourier-Transform Infrared Spectroscopy (ATR-
FTIR)
ATR-FTIR spectra were collected on a Varian 670 FT-IR Spectrometer with a diamond
Specac Golden Gate attachment. All spectra were recorded from 4000 to 400 cm−1 with 4 cm−1
resolution. The spectra of the powder samples consists of the average of 24 scans. A background
spectrum collected on air was subtracted from sample spectra.
2.6.1.5 Titrations with base
Titrations were performed manually with a Venier LabQuest pH meter. The 0.01M NaOH
titrant was standardized before measurements using KHP, and was delivered from a 50.0-ml
graduated buret. For the titration of the ligand 2,6-dicarboxy-9,10-anthhraquinone 1, the titrand
consisted of a solution of 24.3 mg of the ligand in 100.0 mL of water. For the titration of the ligand

47
1,4-dicarboxy-9,10-anthhraquinone 2, the titrand consisted of a solution of 27.5 mg of the ligand
in 65.0 mL of water.
2.6.1.6 Powder X-Ray Diffraction (PXRD)
PXRD measurements were carried out on a Rigaku Miniflex equipped with a Cu(Kα)
radiation source (λ=1.5418 Å). The scanning rate was 1°/min using a 2θ range of 3- 50° on
continuous mode. The samples were mounted onto reflective disks with a Si (510) surface.
2.6.1.7 Scanning Electron Microscopy (SEM)
A LEO (Zeiss) 1550 high-performance Schottky field-emission scanning electron
microscope equipped with an in-lens detector was used at 5.0 kV to obtain high-resolution images
of the MOFs.
2.6.1.8 Thermogravimetric Analysis (TGA)
A Q-series TGA from TA Instruments was used to analyze the thermal stability of the
MOFs. Samples (∼16 mg) were placed on an aluminum pan and heated under nitrogen at a rate of
10 °C/min over the temperature range of 25−700 °C (for 2,6-Zr-AQ-MOF) and 25−1000 °C (for
1,4-Zr-AQ-MOF).
2.6.1.9 Gas Sorption Isotherms
The sorption isotherm measurements were collected on a Quantachrome Autosorb-1. The
samples were placed in a 6 mm large bulb sample cell, which was degassed under vacuum at a
temperature of 100 °C for 8 h and at room temperature for 16 h. The surface area of the MOFs was
determined from the N2 adsorption isotherms at 77 K by fitting the adsorption data within the
0.05−0.3 P/P0 pressure range to the BET equation.38
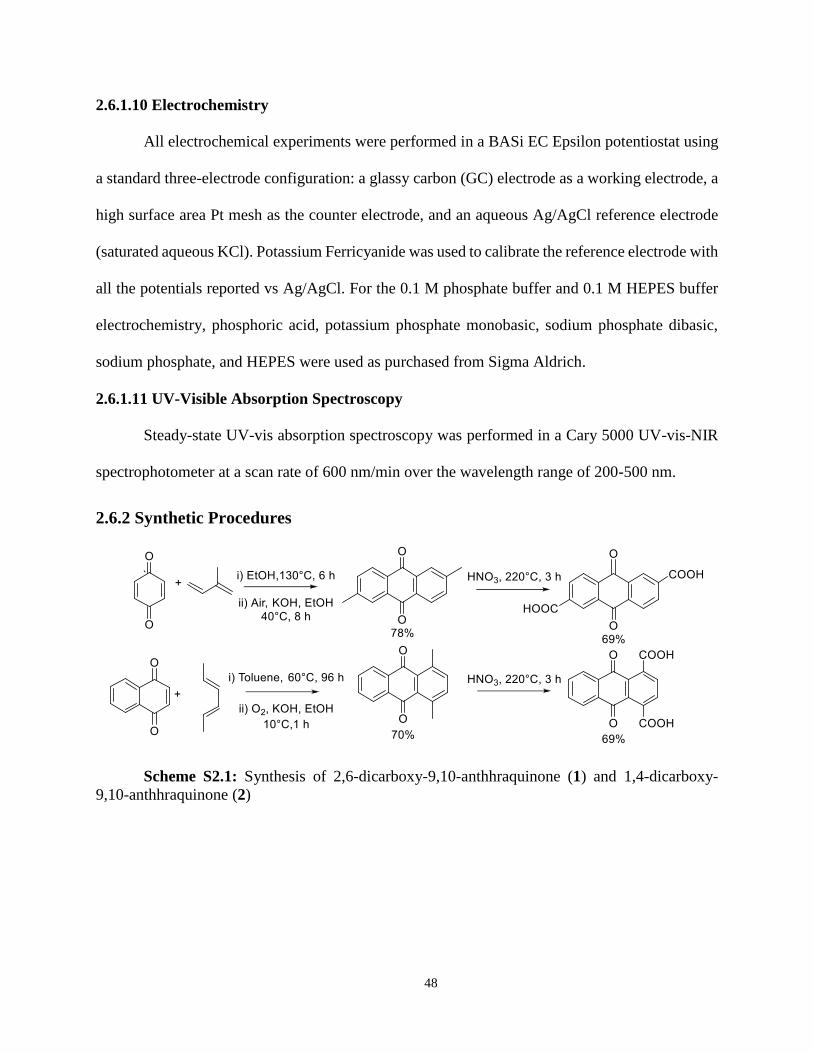
48
2.6.1.10 Electrochemistry
All electrochemical experiments were performed in a BASi EC Epsilon potentiostat using
a standard three-electrode configuration: a glassy carbon (GC) electrode as a working electrode, a
high surface area Pt mesh as the counter electrode, and an aqueous Ag/AgCl reference electrode
(saturated aqueous KCl). Potassium Ferricyanide was used to calibrate the reference electrode with
all the potentials reported vs Ag/AgCl. For the 0.1 M phosphate buffer and 0.1 M HEPES buffer
electrochemistry, phosphoric acid, potassium phosphate monobasic, sodium phosphate dibasic,
sodium phosphate, and HEPES were used as purchased from Sigma Aldrich.
2.6.1.11 UV-Visible Absorption Spectroscopy
Steady-state UV-vis absorption spectroscopy was performed in a Cary 5000 UV-vis-NIR
spectrophotometer at a scan rate of 600 nm/min over the wavelength range of 200-500 nm.
2.6.2 Synthetic Procedures
Scheme S2.1: Synthesis of 2,6-dicarboxy-9,10-anthhraquinone (1) and 1,4-dicarboxy-
9,10-anthhraquinone (2)

49
2.6.3 Physical Characterization of the ligands: NMR, MS, FT-IR and Titrations
Figure S2.1: 1H NMR of 2,6-dicarboxy-9,10-anthhraquinone
Figure S2.2: 1H NMR of 1,4-dicarboxy-9,10-anthhraquinone
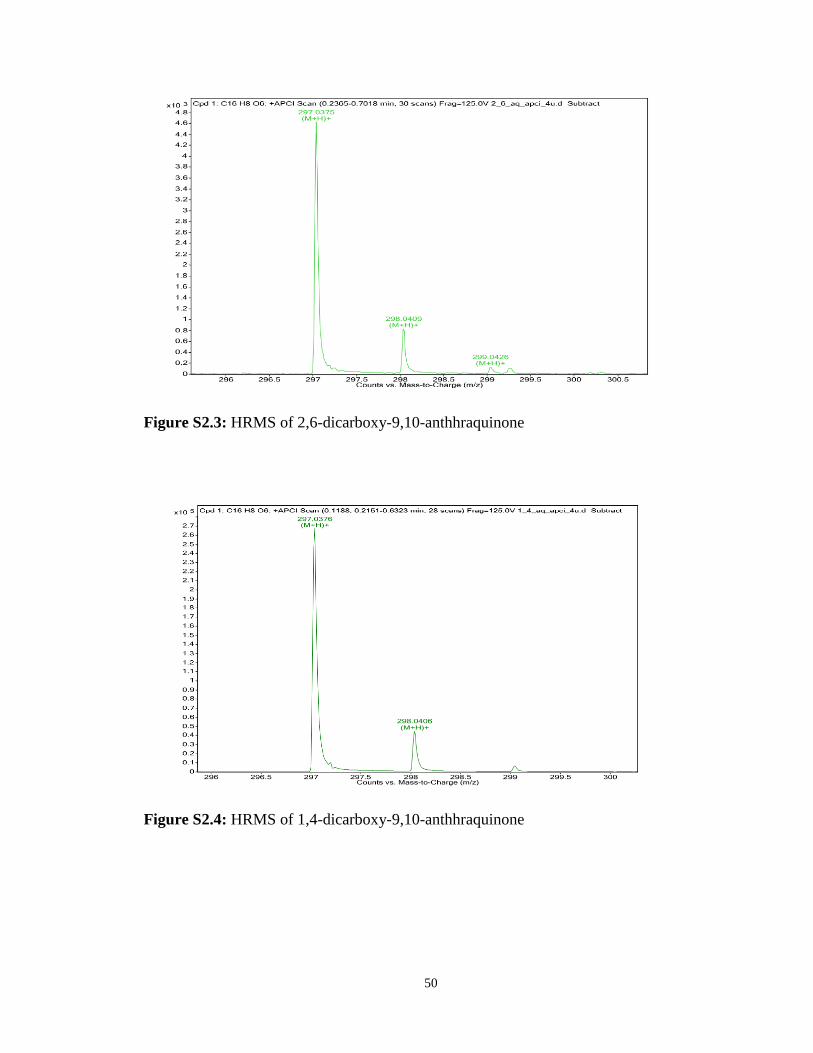
50
Figure S2.3: HRMS of 2,6-dicarboxy-9,10-anthhraquinone
Figure S2.4: HRMS of 1,4-dicarboxy-9,10-anthhraquinone

51
4000 3000 2000 10000
20
40
60
80
100
% T
ran
sm
ita
nce
Wavenumber (cm-1)
Figure S2.5: FT-IR spectra of 2,6-dicarboxy-9,10-anthhraquinone
4000 3000 2000 100020
40
60
80
100
% T
ran
sm
ita
nce
Wavenumber (cm-1)
Figure S2.6: FT-IR spectra of 1,4-dicarboxy-9,10-anthhraquinone

52
Figure S2.7: Titration curve of 2,6-dicarboxy-9,10-anthhraquinone
Figure S2.8: Titration curve of 1,4-dicarboxy-9,10-anthhraquinone
0 2 4 6 8 10 12 14 16 18
2.5
5.0
7.5
10.0
2n
d D
eri
va
tive
Volume NaOH (mL)
1st D
eri
va
tive
pH
0 5 10 15 20 25
2.5
5.0
7.5
10.0
2n
d D
eri
va
tive
Volume NaOH (mL)
1st D
eri
va
tive
pH
Ve1= 10.55mL
Ve1/2= 5.275
pka1=3.7489=3.7
Ve2=14.55
Midpoint=12.55
pka2=5.5857 = 5.6

53
2.6.4 Physical Characterization of the MOFs: PXRD Le Bail refinement, SEM, and
TGA
Figure S2.9: Le Bail refinement of 2,6-Zr-AQ-MOF PXRD pattern. Black cross –
experimental pattern, Red – Model pattern, Blue – Positions of the allowed reflections, Green –
Difference between model and experimental patterns.
Figure S2.10: Le Bail refinement of 1,4-Zr-AQ-MOF PXRD pattern. Black cross –
experimental pattern, Red – Model pattern, Blue – Positions of the allowed reflections, Green –
Difference between model and experimental patterns.

54
Figure S2.11: SEM images of 2,6-Zr-AQ-MOF
Figure S2.12: SEM images of 1,4-Zr-AQ-MOF
0 250 500
40
60
80
100 % weight
Derivative
Temperature (0C)
% w
eig
ht
0.0
0.1
0.2
0.3
0.4
De
riva
tive
Figure S2.13: TGA of 2,6-Zr-AQ-MOF
0 250 500 750 10000
20
40
60
80
100 % weight
derivative
Temperature (C)
we
ight %
0.0
0.2
0.4
0.6
0.8
De
riva
tive
Figure S2.14: TGA of 1,4-Zr-AQ-MOF
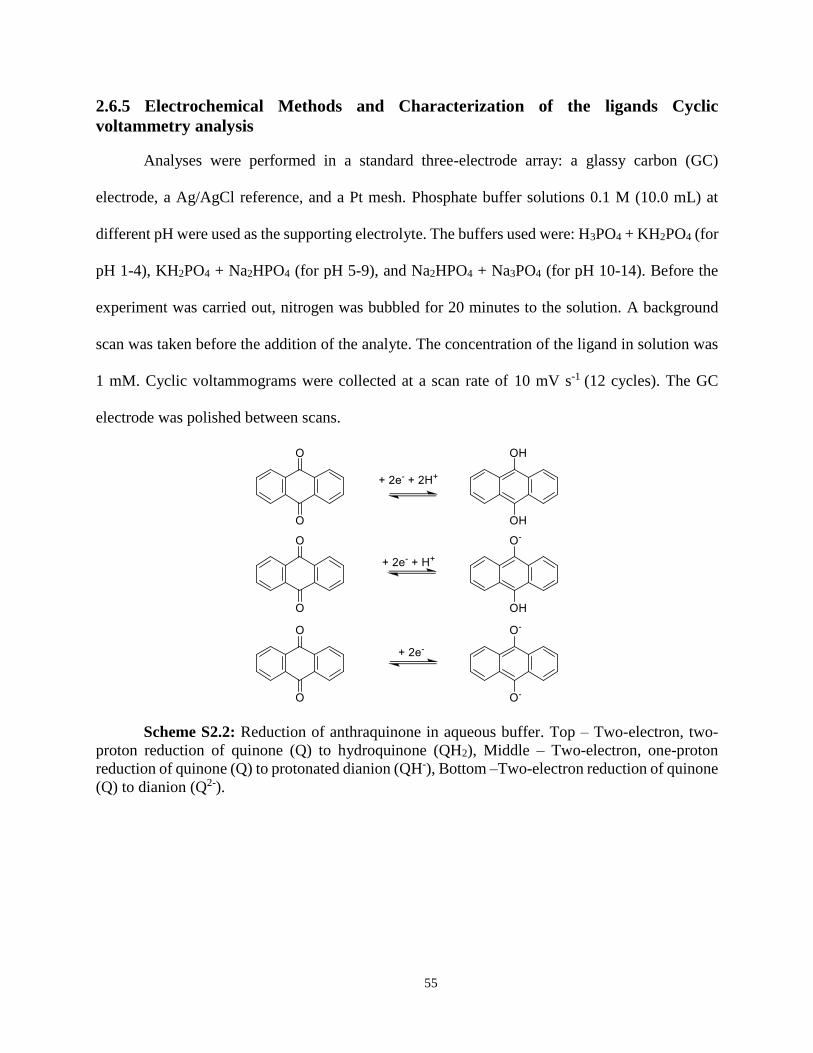
55
2.6.5 Electrochemical Methods and Characterization of the ligands Cyclic
voltammetry analysis
Analyses were performed in a standard three-electrode array: a glassy carbon (GC)
electrode, a Ag/AgCl reference, and a Pt mesh. Phosphate buffer solutions 0.1 M (10.0 mL) at
different pH were used as the supporting electrolyte. The buffers used were: H3PO4 + KH2PO4 (for
pH 1-4), KH2PO4 + Na2HPO4 (for pH 5-9), and Na2HPO4 + Na3PO4 (for pH 10-14). Before the
experiment was carried out, nitrogen was bubbled for 20 minutes to the solution. A background
scan was taken before the addition of the analyte. The concentration of the ligand in solution was
1 mM. Cyclic voltammograms were collected at a scan rate of 10 mV s-1 (12 cycles). The GC
electrode was polished between scans.
Scheme S2.2: Reduction of anthraquinone in aqueous buffer. Top – Two-electron, two-
proton reduction of quinone (Q) to hydroquinone (QH2), Middle – Two-electron, one-proton
reduction of quinone (Q) to protonated dianion (QH-), Bottom –Two-electron reduction of quinone
(Q) to dianion (Q2-).

56
Figure S2.15: Cyclic voltammograms (GC electrode, 10 mV s-1, 0.1 M phosphate buffer-
DMF (9:1 volume) as supporting electrolyte) of ligand 1 at different pH

57
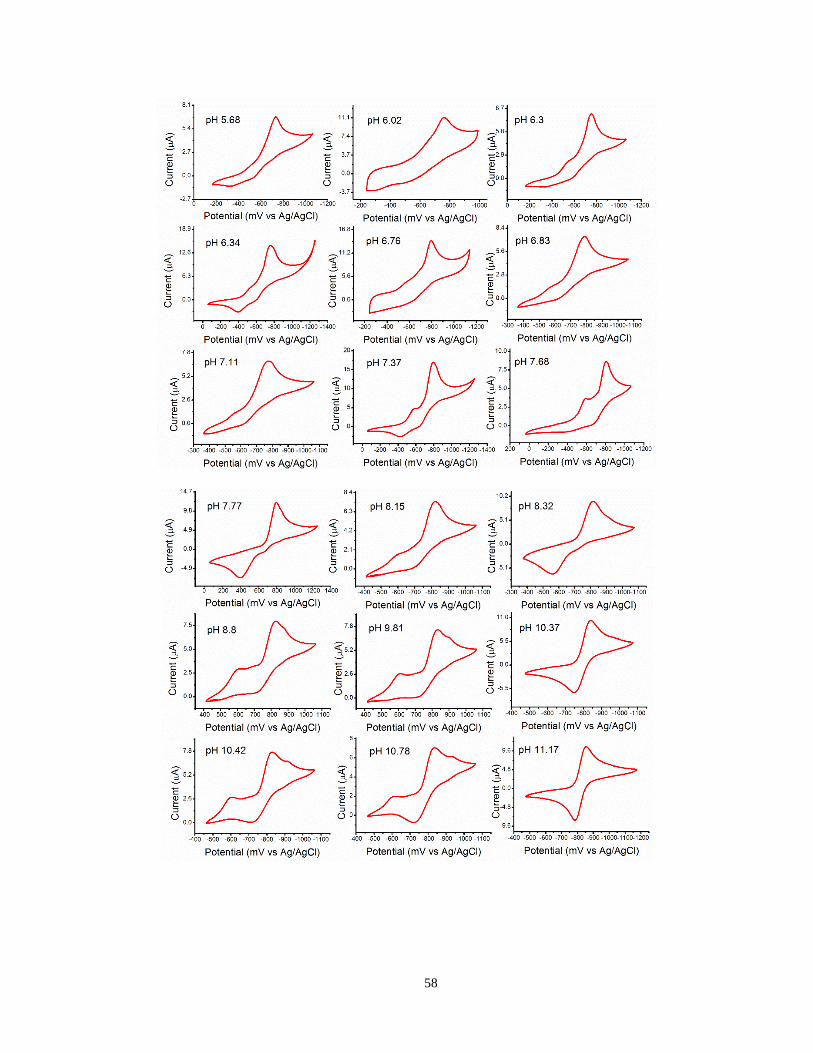
58

59
Figure S2.16: Cyclic voltammograms (GC electrode, 10 mV s-1, 0.1 M phosphate buffer
as supporting electrolyte) of ligand 2 at different pH
Figure S2.17: Cyclic voltammograms (GC electrode, 10 mV s-1, 0.1 M phosphate buffer
as supporting electrolyte) of 1,4-dimethyl-9,10-anthraquinone at different pH

60
Figure S2.18: Pourbaix diagram (GC electrode, 10 mV s-1, 0.1 M phosphate buffer as
supporting electrolyte) of 1,4-dimethyl-9,10-anthraquinone
2.6.6 Electrochemical Methods and Characterization of the MOFs
2.6.6.1 Preparation and dropcasting of the slurry modified electrode
A solution of Poly-methyl methacrylate (3.34 mg) in 1.0 mL of THF was sonicated for 10
min. Subsequently, 10.0 mg of MOF and 10.0 mg of graphite were added to the solution in order
to create a suspension that was stirred for 1 h. The dropcasting was performed by adding 40.0 μL
of the slurry in the surface of the glassy carbon electrode, and letting it dry for 20 min. The
electrode was polished and re-coated again after every measurement.
2.6.6.2 Cyclic voltammetry analysis
Analyses were performed in a standard three-electrode array: a slurry modified GC
electrode, a Ag/AgCl reference, and a Pt mesh. Solutions of 0.1 M HEPES (10.0 mL) buffer at
different pH were used as the supporting electrolyte. The pH was adjusted using either HCl or
NaOH. Before the experiment was carried out, nitrogen was bubbled for 20 minutes to the solution.
Cyclic voltammograms were collected at a scan rate of 100 mV s-1 (12 cycles). UV-vis
spectroscopy was used to monitor the stability of the MOFs, evidenced by the absence of ligand
absorption before and after the CV measurements over the range of pH.

61
Figure S2.19: Cyclic voltammograms (slurry modified GC electrode, 100 mV s-1, 0.1 M
HEPES buffer in water as supporting electrolyte) of 2,6-Zr-AQ-MOF at different pH
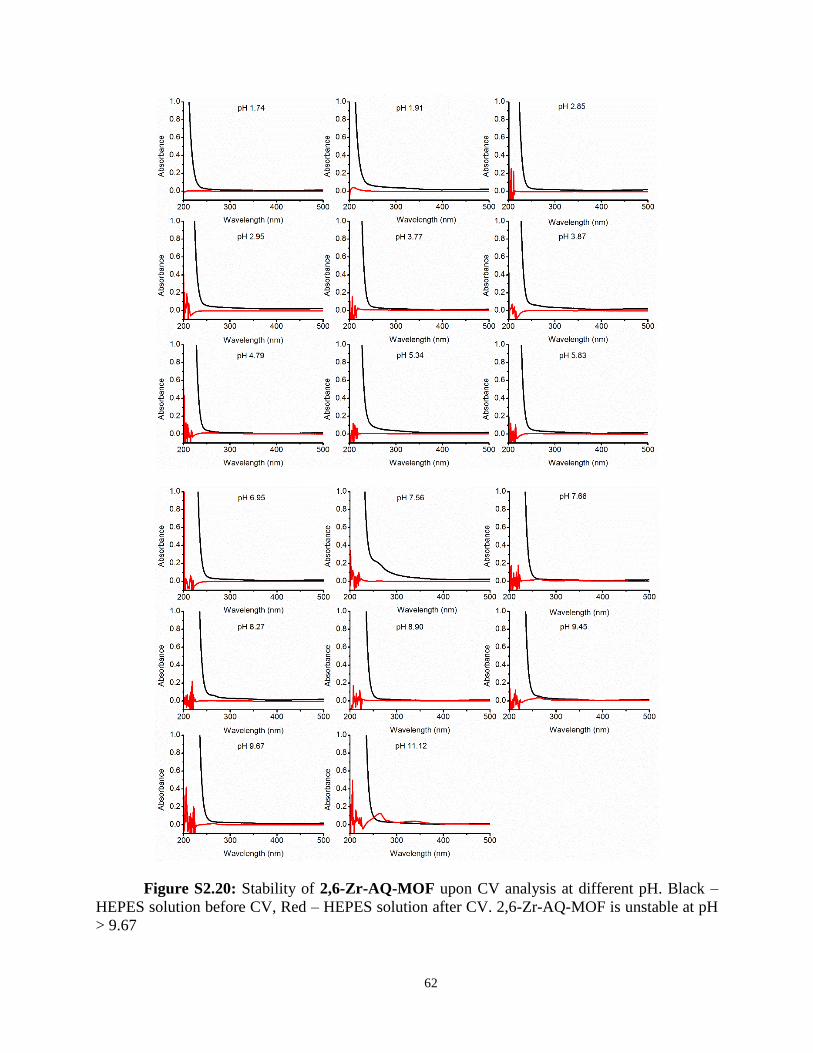
62
Figure S2.20: Stability of 2,6-Zr-AQ-MOF upon CV analysis at different pH. Black –
HEPES solution before CV, Red – HEPES solution after CV. 2,6-Zr-AQ-MOF is unstable at pH
> 9.67

63
Figure S2.21: Cyclic voltammograms (slurry modified GC electrode, 100 mV s-1, 0.1 M
HEPES buffer in water as supporting electrolyte) of 1,4-Zr-AQ-MOF at different pH

64
Figure S2.22: Stability of 1,4-Zr-AQ-MOF upon CV analysis at different pH. Black –
HEPES solution before CV, Red – HEPES solution after CV. 1,4-Zr-AQ-MOF is unstable at pH
> 6.75
2.6.7 Determination of MOFs defects by NMR
The experimental determination of the defects of 1,4-Zr-AQ-MOF was achieved by
following a similar procedure described in the literature.39 A sample of 1.22 mg of 1,4-Zr-AQ-
MOF was placed in an NMR tube, where 600 μL of a 50 mM KOH solution in D2O were added.
The mixture was sonicated for 30 min and heated at 85 °C. A quantitative 1H NMR was taken,
showing the signals of the ligand, acetic acid, and formic acid (Figure S2.23). The molar ratio of
total modulator to ligand was calculated according to established equations reported in the
literature:34

65
𝑇𝑜𝑡𝑎𝑙 𝑚𝑜𝑑𝑢𝑙𝑎𝑡𝑜𝑟
𝐿𝑖𝑔𝑎𝑛𝑑=
𝐴𝑐𝑒𝑡𝑖𝑐 𝐴𝑐𝑖𝑑
𝐿𝑖𝑔𝑎𝑛𝑑+
𝐹𝑜𝑟𝑚𝑖𝑐 𝐴𝑐𝑖𝑑
𝐿𝑖𝑔𝑎𝑛𝑑
𝐴𝑐𝑒𝑡𝑖𝑐 𝐴𝑐𝑖𝑑
𝐿𝑖𝑔𝑎𝑛𝑑=
𝐼𝑛𝑡𝑒𝑔𝑟𝑎𝑡𝑖𝑜𝑛 𝐴𝑐𝑒𝑡𝑖𝑐 𝐴𝑐𝑖𝑑
𝐸𝑞𝑢𝑖𝑣𝑎𝑙𝑒𝑛𝑡 1𝐻 𝑛𝑢𝑐𝑙𝑒𝑖 𝐴𝑐. 𝐴𝑐𝑖𝑑∗
𝐸𝑞𝑢𝑖𝑣𝑎𝑙𝑒𝑛𝑡 1𝐻 𝑛𝑢𝑐𝑙𝑒𝑖 𝐿𝑖𝑔𝑎𝑛𝑑
𝐼𝑛𝑡𝑒𝑔𝑟𝑎𝑡𝑖𝑜𝑛 𝐿𝑖𝑔𝑎𝑛𝑑
𝐹𝑜𝑟𝑚𝑖𝑐 𝐴𝑐𝑖𝑑
𝐿𝑖𝑔𝑎𝑛𝑑=
𝐼𝑛𝑡𝑒𝑔𝑟𝑎𝑡𝑖𝑜𝑛 𝐹𝑜𝑟𝑚𝑖𝑐 𝐴𝑐𝑖𝑑
𝐸𝑞𝑢𝑖𝑣𝑎𝑙𝑒𝑛𝑡 1𝐻 𝑛𝑢𝑐𝑙𝑒𝑖 𝐹𝑜𝑟. 𝐴𝑐𝑖𝑑∗
𝐸𝑞𝑢𝑖𝑣𝑎𝑙𝑒𝑛𝑡 1𝐻 𝑛𝑢𝑐𝑙𝑒𝑖 𝐿𝑖𝑔𝑎𝑛𝑑
𝐼𝑛𝑡𝑒𝑔𝑟𝑎𝑡𝑖𝑜𝑛 𝐿𝑖𝑔𝑎𝑛𝑑
where 𝑬𝒒𝒖𝒊𝒗𝒂𝒍𝒆𝒏𝒕 𝟏𝑯 𝒏𝒖𝒄𝒍𝒆𝒊 is the number of equivalent 1H nuclei contributing to the
1H NMR signal per molecule. For example, the 1H signal of acetic acid originates from its CH3
group in which all 3 protons are equivalent, therefore 𝑬𝒒𝒖𝒊𝒗𝒂𝒍𝒆𝒏𝒕 𝟏𝑯 𝒏𝒖𝒄𝒍𝒆𝒊 𝑨𝒄. 𝑨𝒄𝒊𝒅 = 𝟑.
Similarly, 𝑬𝒒𝒖𝒊𝒗𝒂𝒍𝒆𝒏𝒕 𝟏𝑯 𝒏𝒖𝒄𝒍𝒆𝒊 𝑭𝒐𝒓. 𝑨𝒄𝒊𝒅 = 𝟏 and 𝑬𝒒𝒖𝒊𝒗𝒂𝒍𝒆𝒏𝒕 𝟏𝑯 𝒏𝒖𝒄𝒍𝒆𝒊 𝑳𝒊𝒈𝒂𝒏𝒅 =
𝟔. Replacing the numerical 𝑰𝒏𝒕𝒆𝒈𝒓𝒂𝒕𝒊𝒐𝒏 value of the signals for the ligand, acetic acid, and
formic acid obtained from the 1H NMR spectra (Figure S2.23), the molar ratios can be expressed
as:
𝐴𝑐𝑒𝑡𝑖𝑐 𝐴𝑐𝑖𝑑
𝐿𝑖𝑔𝑎𝑛𝑑=
1.94
3∗
6
(1.93 + 2.00 + 1.96)= 0.66
𝐹𝑜𝑟𝑚𝑖𝑐 𝐴𝑐𝑖𝑑
𝐿𝑖𝑔𝑎𝑛𝑑=
0.29
1∗
6
(1.93 + 2.00 + 1.96)= 0.30
𝑇𝑜𝑡𝑎𝑙 𝑚𝑜𝑑𝑢𝑙𝑎𝑡𝑜𝑟
𝐿𝑖𝑔𝑎𝑛𝑑= 0.66 + 0.30 = 0.96

66
Figure S2.23: 1H NMR spectra obtained for digested 1,4-Zr-AQ-MOF
2.6.8 Elemental Analysis (C, N, H) of the MOFs
The C, N, H elemental analysis of both MOFs is shown below.
Table S2.1: Elemental Analysis of 2,6-Zr-AQ-MOF and 1,4-Zr-AQ-MOF
2,6-Zr-AQ-MOF 1,4-Zr-AQ-MOF
%C 43.08 34.46
%N 5.38 3.83
%H 4.69 4.08
The 2,6-Zr-AQ-MOF initial molecular formula was Zr6O4(OH)4(C16O6H6)6, based on the
typical formula of a UiO-type framework. However, the framework can also host guest molecules
such as DMF and water. Using the software CHN+: calculator4 as a tool for estimating the amount
of guest molecules in the MOF and correlating these results with the TGA analysis of 2,6-Zr-AQ-

67
MOF (Figure S2.13), the formula was found to be Zr6O4(OH)4(C16O6H6)6(C3H7NO)17(H2O)22.
This molecular formula provides a theoretical 43.24% of Carbon, 5.83% of Nitrogen, and 5.01%
of Hydrogen, which are in good agreement (less than 0.5% error) with the elemental analysis
provided in Table S2.1. The normalized TGA of 2,6-Zr-AQ-MOF (Figure S2.24) revealed a
67.18% of solvent lost, which is in agreement with the 67.04% of weight of DMF and H2O in the
formula Zr6O4(OH)4(C16O6H6)6(C3H7NO)17(H2O)22.
Figure S2.24: Normalized TGA of 2,6-Zr-AQ-MOF
The initial molecular formula of the highly defective 1,4-Zr-AQ-MOF was
Zr6O4(OH)4(C16O6H6)4(C2O2H3)2.76(CO2H)1.24, according to the NMR analysis shown in Figure
S2.23. However, the amount of DMF and water in the framework was also estimated by correlating
the elemental analysis and TGA (Figure S2.13), to obtain a molecular formula of
Zr6O4(OH)4(C16O6H6)4(C2O2H3)2.76(CO2H)1.24 (C3H7NO)11(H2O)40. According to this formula
the theoretical percentage of Carbon is 34.62% and the percentage of Nitrogen is 4.28% which are
in good agreement with the percentages obtained experimentally (Table S2.1). The theoretical
percentage of Hydrogen in the formula is 5.45%, which is 1.37% higher from the one obtained in
the elemental analysis. The presence of many hydrogen donors and acceptors in the framework
(ligand, modulators, and hydroxyl groups in the node) may account for this variability in the

68
percentage of hydrogen. The normalized TGA of 1,4-Zr-AQ-MOF (Figure S2.25) revealed a
77.80% of solvent lost, which is in agreement with the 73.5% of weight of DMF and H2O in the
formula Zr6O4(OH)4(C16O6H6)4(C2O2H3)2.76(CO2H)1.24 (C3H7NO)11(H2O)40.
Figure S2.25: Normalized TGA of 1,4-Zr-AQ-MOF
2.7 ACKNOWLEDGMENTS
This material is based upon work supported by the National Science Foundation under
Grant No. 1551964
2.8 REFERENCES
1. Allendorf, M. D.; Schwartzberg, A.; Stavila, V.; Talin, A. A. A roadmap to implementing
metal-organic frameworks in electronic devices: challenges and critical directions. Chemistry
2011, 17 (41), 11372-88 DOI: 10.1002/chem.201101595.
2. DeBlase, C. R.; Hernández-Burgos, K.; Silberstein, K. E.; Rodríguez-Calero, G. G.;
Bisbey, R. P.; Abruña, H. D.; Dichtel, W. R. Rapid and Efficient Redox Processes within 2D
Covalent Organic Framework Thin Films. ACS Nano 2015, 9 (3), 3178-3183 DOI:
10.1021/acsnano.5b00184.

69
3. Sun, L.; Miyakai, T.; Seki, S.; Dincă, M. Mn2(2,5-disulfhydrylbenzene-1,4-dicarboxylate):
A Microporous Metal–Organic Framework with Infinite (−Mn–S−)∞ Chains and High Intrinsic
Charge Mobility. Journal of the American Chemical Society 2013, 135 (22), 8185-8188 DOI:
10.1021/ja4037516.
4. Narayan, T. C.; Miyakai, T.; Seki, S.; Dincă, M. High Charge Mobility in a
Tetrathiafulvalene-Based Microporous Metal–Organic Framework. Journal of the American
Chemical Society 2012, 134 (31), 12932-12935 DOI: 10.1021/ja3059827.
5. Ahrenholtz, S. R.; Epley, C. C.; Morris, A. J. Solvothermal Preparation of an
Electrocatalytic Metalloporphyrin MOF Thin Film and its Redox Hopping Charge-Transfer
Mechanism. Journal of the American Chemical Society 2014, 136 (6), 2464-2472 DOI:
10.1021/ja410684q.
6. Cavka, J. H.; Jakobsen, S.; Olsbye, U.; Guillou, N.; Lamberti, C.; Bordiga, S.; Lillerud, K.
P. A New Zirconium Inorganic Building Brick Forming Metal Organic Frameworks with
Exceptional Stability. Journal of the American Chemical Society 2008, 130 (42), 13850-13851
DOI: 10.1021/ja8057953.
7. DeCoste, J. B.; Peterson, G. W.; Jasuja, H.; Glover, T. G.; Huang, Y.-g.; Walton, K. S.
Stability and degradation mechanisms of metal-organic frameworks containing the Zr6O4(OH)4
secondary building unit. Journal of Materials Chemistry A 2013, 1 (18), 5642-5650 DOI:
10.1039/C3TA10662D.
8. Guin, P. S.; Das, S.; Mandal, P. C. Electrochemical Reduction of Quinones in Different
Media: A Review. International Journal of Electrochemistry 2011, 2011, 22 DOI:
10.4061/2011/816202.
70
9. Guin, P. S.; Das, S.; Mandal, P. Electrochemical reduction of sodium 1, 4-dihydroxy-9, 10-
anthraquinone-2-sulphonate in aqueous and aqueous dimethyl formamide mixed solvent: a cyclic
voltammetric study. Int. J. Electrochem. Sci 2008, 3 (9), 1016-1028.
10. DeBlase, C. R.; Silberstein, K. E.; Truong, T.-T.; Abruña, H. D.; Dichtel, W. R. β-
Ketoenamine-Linked Covalent Organic Frameworks Capable of Pseudocapacitive Energy
Storage. Journal of the American Chemical Society 2013, 135 (45), 16821-16824 DOI:
10.1021/ja409421d.
11. Chandra, S.; Roy Chowdhury, D.; Addicoat, M.; Heine, T.; Paul, A.; Banerjee, R.
Molecular Level Control of the Capacitance of Two-Dimensional Covalent Organic Frameworks:
Role of Hydrogen Bonding in Energy Storage Materials. Chemistry of Materials 2017, 29 (5),
2074-2080 DOI: 10.1021/acs.chemmater.6b04178.
12. Gui, B.; Meng, X.; Chen, Y.; Tian, J.; Liu, G.; Shen, C.; Zeller, M.; Yuan, D.; Wang, C.
Reversible Tuning Hydroquinone/Quinone Reaction in Metal–Organic Framework: Immobilized
Molecular Switches in Solid State. Chemistry of Materials 2015, 27 (18), 6426-6431 DOI:
10.1021/acs.chemmater.5b02648.
13. Zhang, Z.; Yoshikawa, H.; Awaga, K. Monitoring the Solid-State Electrochemistry of
Cu(2,7-AQDC) (AQDC = Anthraquinone Dicarboxylate) in a Lithium Battery: Coexistence of
Metal and Ligand Redox Activities in a Metal–Organic Framework. Journal of the American
Chemical Society 2014, 136 (46), 16112-16115 DOI: 10.1021/ja508197w.
14. Zhang, Z.; Yoshikawa, H.; Awaga, K. Discovery of a “Bipolar Charging” Mechanism in
the Solid-State Electrochemical Process of a Flexible Metal–Organic Framework. Chemistry of
Materials 2016, 28 (5), 1298-1303 DOI: 10.1021/acs.chemmater.5b04075.

71
15. Halls, J. E.; Ahn, S. D.; Jiang, D.; Keenan, L. L.; Burrows, A. D.; Marken, F. Proton uptake
vs. redox driven release from metal–organic-frameworks: Alizarin red S reactivity in UMCM-1.
Journal of Electroanalytical Chemistry 2013, 689, 168-175 DOI:
http://dx.doi.org/10.1016/j.jelechem.2012.11.016.
16. Halls, J. E.; Jiang, D.; Burrows, A. D.; Kulandainathan, M. A.; Marken, F. In
Electrochemistry: Volume 12; The Royal Society of Chemistry: 2014; Vol. 12, pp 187-210.
17. Klet, R. C.; Liu, Y.; Wang, T. C.; Hupp, J. T.; Farha, O. K. Evaluation of Bronsted acidity
and proton topology in Zr- and Hf-based metal-organic frameworks using potentiometric acid-
base titration. Journal of Materials Chemistry A 2016, 4 (4), 1479-1485 DOI:
10.1039/C5TA07687K.
18. Cabellero, A. G.; Croft, A. K.; Nalli, S. M. Remote aromatic stabilization in radical
reactions. Tetrahedron Letters 2008, 49 (22), 3613-3615 DOI:
http://dx.doi.org/10.1016/j.tetlet.2008.04.009.
19. Arient, J.; Podstata, J. Nitration and oxidation of anthraquinone dimethyl derivatives.
Collect. Czech. Chem. Commun. 1974, 39 (11), 3117-3123.
20. Garay, R. O.; Naarmann, H.; Muellen, K. Synthesis and characterization of poly(1,4-
anthrylenevinylene). Macromolecules 1994, 27 (7), 1922-1927 DOI: 10.1021/ma00085a040.
21. Bon, V.; Senkovska, I.; Weiss, M. S.; Kaskel, S. Tailoring of network dimensionality and
porosity adjustment in Zr- and Hf-based MOFs. CrystEngComm 2013, 15 (45), 9572-9577 DOI:
10.1039/C3CE41121D.
22. Furman, N. H.; Stone, K. G. A Polarographic Study of Certain Anthraquinones1. Journal
of the American Chemical Society 1948, 70 (9), 3055-3061 DOI: 10.1021/ja01189a064.

72
23. Zhu, Z. W.; Li, N. Q. Electrochemical studies of the interaction of 9,10-anthraquinone with
DNA 1. Hanging mercury drop electrode. Microchemical Journal 1998, 59 (2), 294-306 DOI:
10.1006/mchj.1998.1576.
24. Ojani, R.; Raoof, J.; Ebranimi, M. A cyclic voltammetric study of the aqueous
electrochemistry of some anthraquinone derivatives on carbon paste electrode. Iranian Journal of
Chemistry and Chemical Engineering (IJCCE) 2001, 20 (2), 75-81.
25. Petrova, S. A.; Kolodyazhny, M. V.; Ksenzhek, O. S. Electrochemical properties of some
naturally occurring quinones. Journal of Electroanalytical Chemistry and Interfacial
Electrochemistry 1990, 277 (1), 189-196 DOI: http://dx.doi.org/10.1016/0022-0728(90)85101-A.
26. Raoof, D. B.; Golabi, S. M. Electrochemical Properties of Carbon-Paste Electrodes Spiked
with Some 1,4-Naphthoquinone Derivatives. Bulletin of the Chemical Society of Japan 1995, 68
(8), 2253-2261 DOI: 10.1246/bcsj.68.2253.
27. Driebergen, R. J.; Den Hartigh, J.; Holthuis, J. J. M.; Hulshoff, A.; van Oort, W. J.; Postma
Kelder, S. J.; Verboom, W.; Reinhoudt, D. N.; Bos, M.; van der Linden, W. E. Electrochemistry
of potentially bioreductive alkylating quinones. Analytica Chimica Acta 1990, 233, 251-268 DOI:
http://dx.doi.org/10.1016/S0003-2670(00)83486-8.
28. Örnskov, E.; Linusson, A.; Folestad, S. Determination of dissociation constants of labile
drug compounds by capillary electrophoresis. Journal of Pharmaceutical and Biomedical Analysis
2003, 33 (3), 379-391 DOI: http://dx.doi.org/10.1016/S0731-7085(03)00238-3.
29. Nemkevich, A.; Spackman, M. A.; Corry, B. Mechanism of Concerted Hydrogen Bond
Reorientation in Clathrates of Dianin’s Compound and Hydroquinone. Journal of the American
Chemical Society 2011, 133 (46), 18880-18888 DOI: 10.1021/ja206962f.

73
30. Ilczyszyn, M.; Selent, M.; Ilczyszyn, M. M. Participation of Xenon Guest in Hydrogen
Bond Network of β-Hydroquinone Crystal. The Journal of Physical Chemistry A 2012, 116 (12),
3206-3214 DOI: 10.1021/jp210670k.
31. Salazar, R.; Vidal, J.; Martinez-Cifuentes, M.; Araya-Maturana, R.; Ramirez-Rodriguez,
O. Electrochemical characterization of hydroquinone derivatives with different substituents in
acetonitrile. New Journal of Chemistry 2015, 39 (2), 1237-1246 DOI: 10.1039/C4NJ01657B.
32. Astudillo, P. D.; Valencia, D. P.; González-Fuentes, M. A.; Díaz-Sánchez, B. R.; Frontana,
C.; González, F. J. Electrochemical and chemical formation of a low-barrier proton transfer
complex between the quinone dianion and hydroquinone. Electrochimica Acta 2012, 81, 197-204
DOI: http://dx.doi.org/10.1016/j.electacta.2012.07.078.
33. Wu, H.; Chua, Y. S.; Krungleviciute, V.; Tyagi, M.; Chen, P.; Yildirim, T.; Zhou, W.
Unusual and Highly Tunable Missing-Linker Defects in Zirconium Metal–Organic Framework
UiO-66 and Their Important Effects on Gas Adsorption. Journal of the American Chemical Society
2013, 135 (28), 10525-10532 DOI: 10.1021/ja404514r.
34. Shearer, G. C.; Chavan, S.; Bordiga, S.; Svelle, S.; Olsbye, U.; Lillerud, K. P. Defect
Engineering: Tuning the Porosity and Composition of the Metal–Organic Framework UiO-66 via
Modulated Synthesis. Chemistry of Materials 2016, 28 (11), 3749-3761 DOI:
10.1021/acs.chemmater.6b00602.
35. Cliffe, M. J.; Wan, W.; Zou, X.; Chater, P. A.; Kleppe, A. K.; Tucker, M. G.; Wilhelm, H.;
Funnell, N. P.; Coudert, F. X.; Goodwin, A. L. Correlated defect nanoregions in a metal-organic
framework. Nat Commun 2014, 5, 4176 DOI: 10.1038/ncomms5176.
74
36. Øien, S.; Wragg, D.; Reinsch, H.; Svelle, S.; Bordiga, S.; Lamberti, C.; Lillerud, K. P.
Detailed Structure Analysis of Atomic Positions and Defects in Zirconium Metal–Organic
Frameworks. Crystal Growth & Design 2014, 14 (11), 5370-5372 DOI: 10.1021/cg501386j.
37. Usov, P. M.; Ahrenholtz, S. R.; Maza, W. A.; Stratakes, B.; Epley, C. C.; Kessinger, M.
C.; Zhu, J.; Morris, A. J. Cooperative electrochemical water oxidation by Zr nodes and Ni-
porphyrin linkers of a PCN-224 MOF thin film. Journal of Materials Chemistry A 2016, 4 (43),
16818-16823 DOI: 10.1039/C6TA05877A.
38. Brunauer, S.; Emmett, P. H.; Teller, E. Adsorption of Gases in Multimolecular Layers.
Journal of the American Chemical Society 1938, 60 (2), 309-319 DOI: 10.1021/ja01269a023.
39. Liang, W.; Coghlan, C. J.; Ragon, F.; Rubio-Martinez, M.; D'Alessandro, D. M.; Babarao,
R. Defect engineering of UiO-66 for CO2 and H2O uptake - a combined experimental and
simulation study. Dalton Transactions 2016, 45 (11), 4496-4500 DOI: 10.1039/C6DT00189K.

75
3. Charge Storage and Quinone Accessibility in Anthraquinone-based
Zirconium Metal-Organic Frameworks
Paula J. Celis-Salazar, Linqin Mu, Connor Slamowitz, Feng Lin, Amanda J. Morris*
3.1 ABSTRACT
The previously reported metal-organic frameworks (MOFs) 2,6-Zr-AQ-MOF and 1,4-Zr-
AQ-MOF were assembled into two different types of working electrodes: a slurry-modified glassy
carbon electrode, and as solvothermally-grown MOF thin films. The specific capacitance and the
percentage of quinone accessed in the two frameworks were calculated for the two types of
electrodes using cyclic voltammetry in aqueous buffered media as a function of pH. Both
frameworks showed an enhanced capacitance and quinone accessibility in the thin films as
compared to the powder-based electrodes, while revealing that the structural differences between
2,6-Zr-AQ-MOF and 1,4-Zr-AQ-MOF in terms of defectivity and the number of electrons and
protons transferred were directly influencing the percentage of active quinones and the ability of
the materials to store charge. The non-defective 2,6-Zr-AQ-MOF displayed higher quinone
accessibility and capacitance at pH > pKa, where the protonated dianion formed from a two-
electron, one-proton transfer, facilitated the charge storage in a higher extent than its hydroquinone
analogue formed at pH < pKa. In contrast, the highly defective 1,4-Zr-AQ-MOF showed better
performance at pH < pKa, due to linker to node hydrogen bonding interactions that assisted higher
capacitance and quinone access via a two-electron, three-proton transfer. The maximum specific
capacitance observed was in the order of 1.68 F g-1 and the highest quinone accessibility was of
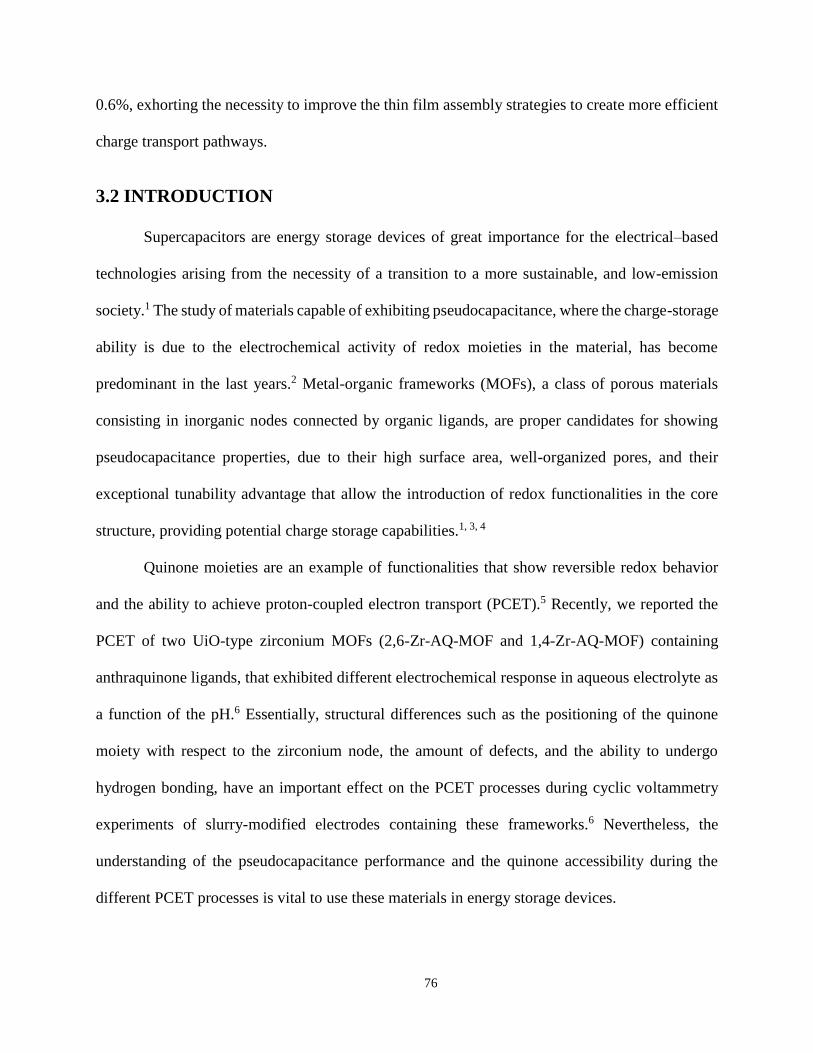
76
0.6%, exhorting the necessity to improve the thin film assembly strategies to create more efficient
charge transport pathways.
3.2 INTRODUCTION
Supercapacitors are energy storage devices of great importance for the electrical–based
technologies arising from the necessity of a transition to a more sustainable, and low-emission
society.1 The study of materials capable of exhibiting pseudocapacitance, where the charge-storage
ability is due to the electrochemical activity of redox moieties in the material, has become
predominant in the last years.2 Metal-organic frameworks (MOFs), a class of porous materials
consisting in inorganic nodes connected by organic ligands, are proper candidates for showing
pseudocapacitance properties, due to their high surface area, well-organized pores, and their
exceptional tunability advantage that allow the introduction of redox functionalities in the core
structure, providing potential charge storage capabilities.1, 3, 4
Quinone moieties are an example of functionalities that show reversible redox behavior
and the ability to achieve proton-coupled electron transport (PCET).5 Recently, we reported the
PCET of two UiO-type zirconium MOFs (2,6-Zr-AQ-MOF and 1,4-Zr-AQ-MOF) containing
anthraquinone ligands, that exhibited different electrochemical response in aqueous electrolyte as
a function of the pH.6 Essentially, structural differences such as the positioning of the quinone
moiety with respect to the zirconium node, the amount of defects, and the ability to undergo
hydrogen bonding, have an important effect on the PCET processes during cyclic voltammetry
experiments of slurry-modified electrodes containing these frameworks.6 Nevertheless, the
understanding of the pseudocapacitance performance and the quinone accessibility during the
different PCET processes is vital to use these materials in energy storage devices.

77
One of the latest advances on the application of MOFs in electronic platforms, is the
assembly of these frameworks in conductive electrodes as thin films.7 Unlike the slurry-modified
electrodes, solvothermally grown MOF thin films allow direct contact with the electrolyte solution
during cyclic voltammetry analysis, and prevent any permeability effects of the polymer present
in the slurry-modified electrode in pH-dependence studies. More importantly, the thin film
electrodes allow the spontaneous growth of the MOF in its crystalline form, facilitating pathways
for redox hopping, without the addition of other conductive materials, such as graphite.8 A positive
performance of thin film electrodes has been recently observed in quinone-based covalent-organic
frameworks (COFs),9, 10 where the assembly of two-dimensional frameworks in thin films
provided more efficient quinone accessibility and capacitance as compared to the randomly
oriented slurry-modified electrodes.4, 11
In the present study, we sought to investigate the capacitance and quinone accessibility of
2,6-Zr-AQ-MOF and 1,4-Zr-AQ-MOF in two different types of electrodes (powder-based and
solvothermally grown conductive thin films) in aqueous electrolyte at a variety of pH. The ability
of the materials to store charge was also tested by charge-discharge potential profiles on coin cells
containing the frameworks. The results of this study encourage further research on improving thin
film manufacture in order to obtain more efficient charge transport paths.
3.3 EXPERIMENTAL SECTION
3.3.1 Synthesis of 2,6-dicarboxy-9,10-anthhraquinone
The synthesis of this ligand was achieved according to previous reports.6, 12, 13 A mixture
of benzoquinone (3.25 g, 30 mmol), isoprene (10.0 mL) and traces of hydroquinone, in absolute
ethanol (20.0 mL) was heated at 130 °C for 6 h in a metal autoclave. After cooling to room
temperature, the mixture was added to a potassium hydroxide solution in ethanol (8.5 g of KOH

78
in 200 mL of EtOH). The solution was stirred under air for 8 h at 40 °C, for 12 h at room
temperature, and for 2h at 50 °C. A white solid was obtained after filtration in vacuum at room
temperature. Subsequently, the solid was suspended in absolute ethanol and left at 0 °C overnight.
After filtration and multiple washes with cold ethanol and water the solid was dried under air to
afford 2,6-dimethyl-9,10-anthraquinone.6, 12 The 2,6-dimethyl-9,10-anthraquinone (1.0 g) was
suspended in 12.0 mL of an aqueous solution of 25% nitric acid. The mixture was placed in a 40.0
mL autoclave and heated slowly until reaching 220 °C, where the temperature was maintained for
3 h. After cooling to room temperature and filtered under vacuum, a yellow powder was obtained
and washed with water. The solid was dried overnight, affording pure 2,6-dicarboxy-9,10-
anthhraquinone with 69% yield.6, 13 1H NMR (400 MHz, DMSO): δ 13.77 (s, 2H), 8.69(dd, J= 1.8
Hz, 0.4 Hz, 2H), 8.44(dd, J=8 Hz, 1.8Hz, 2H), 8.36(d,d J= 8 Hz, 0.4 Hz, 2H). HRMS: (M+H)+:
297.0375.
3.3.2 Synthesis of 1,4-dicarboxy-9,10-anthhraquinone
The synthesis of this ligand was achieved by following previous procedures.6, 13, 14 A
mixture of 1,4-naphthoquinone (9.35 g, 0.059 mol), 2,4-hexadiene (5.0 g, 0.605 mol), and toluene
(35 mL) was heated and stirred at 65°C for 4 days. After evaporation of the solvent, the remaining
oily solid (15.0 g) was dissolved in absolute ethanol (250 mL), and added to a solution of KOH in
ethanol (30 g in 1.25 L) at 10 °C. Subsequently, oxygen was bubbled through the solution at 10
°C for 1 h. After evaporation of the solvent, the semisolid residue was dissolved in 600 mL of
water and extracted with benzene. Removal of the organic solvent afforded 1,4-dimethyl-9,10-
anthraquinone with 70% yield.20 The 1,4-dimethyl-9,10-anthraquinone (1.0 g) was suspended in
12.0 mL of an aqueous solution of 25% nitric acid. The mixture was placed in a 40.0 mL autoclave
and heated slowly until reaching 220 °C, where the temperature was maintained for 3 h. After

79
cooling to room temperature and filtered under vacuum, a yellow powder was obtained and washed
with water. The solid was dried overnight, affording pure 1,4-dicarboxy-9,10-anthhraquinone with
69% yield.6, 13 1H NMR (400 MHz, DMSO): δ 13.37 (s, 2H), 8.19 (dd, J=5.6 Hz, 3.2 Hz, 2H), 7.99
(dd, J=5.6 Hz, 3.2 Hz, 2H), 7.89 (s, 2H). HRMS: (M+H)+: 297.0376.
3.3.3 Synthesis of 2,6-Zr-AQ MOF [Zr6O4(OH)4(C16O6H6)6 (C3H7NO)17(H2O)22]
A solution of ZrCl4 (23.0 mg, 0.1 mmol) in 2.0 mL of DMF was sonicated for 5 minutes.
Subsequently, the ligand 2,6-dicarboxy-9,10-anthraquinone (29.6 mg, 0.1 mmol) and 0.3 mL of
acetic acid (47 equiv.) were added to the solution. The mixture was sonicated for 15 minutes and
held at 120 °C for 24 h. The 2,6-Zr-AQ-MOF was obtained as a pink powder and isolated by three
cycles of centrifugation alternated with washes with fresh DMF. The MOF was dried under
vacuum at room temperature (Yield 31.3 mg, 75 %).6
3.3.4 Synthesis of 1,4- Zr-AQ-MOF [Zr6O4(OH)4(C16O6H6)4(C2O2H3)2.76
(CO2H)1.24(C3H7NO)11(H2O)40]
A mixture of ZrCl4 (23.0 mg, 0.1 mmol), the ligand 1,4-dicarboxy-9,10-anthraquinone
(29.6 mg, 0.1 mmol), acetic acid (1.2 mL, 200 equiv.) and DMF (3.0 mL) was sonicated for 15
minutes. The solution was heated at 120 °C for 48 h. The mixture was cooled to room temperature
at a rate of 1 °C/min. The 1,4-Zr-AQ-MOF was obtained as a pink powder, which was isolated by
three cycles of centrifugation alternated with washes with fresh DMF. The MOF was dried under
vacuum at room temperature (Yield 30.0 mg, 72 %).6
3.4 RESULTS AND DISCUSSION
The solvothermal synthesis of 2,6-Zr-AQ-MOF [Zr6O4(OH)4(C16O6H6)6(C3H7NO)17
(H2O)22] and 1,4-Zr-AQ-MOF [Zr6O4(OH)4(C16O6H6)4(C2O2H3)2.76(CO2H)1.24(C3H7NO)11
(H2O)40] was achieved by following a previously reported procedure.6 Explicitly, the 2,6-Zr-AQ-
80
MOF was obtained by the addition of 2,6-dicarboxy-9,10-anthhraquinone and acetic acid (47
equiv.) to a solution of ZrCl4 in DMF, followed by a static heating at 120 °C for 1 day. Likewise,
the treatment of 1,4-dicarboxy-9,10-anthhraquinone and ZrCl4 in a mixture of acetic acid (200
equiv.) and DMF (1:2.5 by volume) at 120 °C for 2 days afforded 1,4-Zr-AQ-MOF.6
The powder X-ray diffraction (PXRD) patterns of 2,6-Zr-AQ-MOF and 1,4-Zr-AQ-MOF
are consistent with the ones reported before for these two frameworks (Figure 3.1).6 On one hand,
the non-defective 2,6-Zr-AQ-MOF displays the typical PXRD peaks at low angle characteristic of
UiO-type frameworks. On the other hand, the high defectivity of 1,4-Zr-AQ-MOF is confirmed by
the broad peak at 2θ range of ca. 3-6°, which has been assigned as a fingerprint of missing node
defects in UiO frameworks.6, 15, 16
Figure 3.1. PXRD patterns and schematic structural representation of A) 2,6-Zr-AQ-
MOF and B) 1,4-Zr-AQ-MOF.

81
Cyclic voltammetry of the anthraquinone frameworks was performed using two different
types of working electrodes: 1) A dried slurry of the MOF powder (10 mg), graphite (10 mg), poly-
methyl methacrylate (3.34 mg), and THF (1 mL), deposited on a GC electrode, and 2) the
solvothermally synthesized MOF, grown as a thin film on a conductive FTO slide. The two
working electrodes were used separately in a three-electrode assembly, with a HEPES-buffered
aqueous solution as supporting electrolyte (see SI for details). CV measurements were taken over
the pH range of chemical stability of both MOFs (pH < 9.67 for 2,6-Zr-AQ-MOF, and pH < 6.75
for 1,4-Zr-AQ-MOF).6 It has been reported before that the 2,6-Zr-AQ-MOF has an electrochemical
pKa of 7.56 for the transition between a two-electron, two-proton transfer (at pH < pKa) and a
two-electron, one-proton transfer (at pH > pKa).6 Similarly, a pKa of 5.18 for 1,4-Zr-AQ-MOF
divides the transition from a two-electron, three-proton transfer (at pH < pKa) to a two-electron,
one-proton transfer (at pH > pKa).6
The cyclic voltammograms of 2,6-Zr-AQ-MOF and 1,4-Zr-AQ-MOF in the slurry
modified electrode and as thin films, over the pH range studied, showed a reversible redox process
which shifted to more negative potential with increasing pH (Figure 3.2). For both MOFs the
current of the reductive wave was higher in the thin films (Figure 3.2 E-H) than in the slurry
modified electrode (Figure 3.2 A-D). We sought to calculate the percentages of accessible
electroactive quinones moieties in the slurry and the films, by using the integrated charge of the
reductive wave of the cyclic voltammograms (shaded area in Figure 3.2). At a certain scan rate,
the charge corresponds to the integration of the current over the range of potential where the wave
is observed, according to the expression:
(3.1)

82
where Q is the charge, I is the current, E is the potential, E1 and E2 are the potentials
comprising the reductive wave, and υ is the scan rate. The theoretical charge was calculated by
determining the number of quinone sites available in the slurry modified electrode and the thin
films. The quinones available in the slurry were obtained from the concentration of MOF in the
original graphite-MOF- PMMA solution. Similarly, ICP analysis of the digested films for
determination of Zr, allowed the calculation of the quinone moieties in the thin films (see SI for
detailed calculations). For each range of pH, the CV experiments were repeated three times on
different slurry modified electrodes or films, in order to obtain the average percentages of
accessible quinones and the correspondent statistical error (see SI for detailed electrochemical
procedures).
Remarkably, both 2,6-Zr-AQ-MOF and 1,4-Zr-AQ-MOF revealed different percentages of
accessible electroactive quinones moieties at the lower and higher pH range (Figure 3.3 A-B). The
2,6-Zr-AQ-MOF showed lower quinones accessed (0.003% - 0.03%) at pH 1.5 - 7.0, while higher
quinones accessed (0.08% - 0.14%) at pH 7.0 - 9.67 (Figure 3.3A). Since the 2,6-Zr-AQ-MOF has
an electrochemical pKa of 7.56, at pH < pKa the two-electron, two-proton transfer from quinone
to hydroquinone6 on the ligands of this framework takes place with a low accessibility of quinone
sites in the slurry modified electrode. At pH > pKa, the ligands of this MOF undergo a two-
electron, one-proton transfer, from quinone to protonated dianion.6 This process appeared to be
assisted by a higher electronic accessibility to the MOF quinones sites in the same type of electrode
(Figure 3.3A).
Conversely, the 1,4-Zr-AQ-MOF displayed higher quinones accessed (0.09% - 0.11%) at
pH 1.5 - 4.5, while lower quinones accessed (0.02% - 0.03%) at pH 4.5 - 6.75 (Figure 3.3B). This
fact suggests that at pH lower than the pKa of 1,4-Zr-AQ-MOF (pKa = 5.18)6 the two-electron,

83
three-proton transfer is carried out with a higher accessibility to the quinone sites, as compared to
the two-electron, one-proton transfer (at pH > pKa),6 where the percentage of quinones active is
lower (Figure 3.3B). Additionally, a similar pKa trend was observed for the specific capacitance
of the slurry modified electrode of both frameworks.
Figure 3.2. Cyclic voltammograms (100 mV s-1, 0.1 M HEPES buffer as supporting
electrolyte) of: Top: the slurry modified electrode of A) 2,6-Zr-AQ-MOF at pH < pKa, B) 2,6-
Zr-AQ-MOF at pH > pKa, C) 1,4-Zr-AQ-MOF at pH < pKa, D) 1,4-Zr-AQ-MOF at pH > pKa,
Bottom: the thin films of E) 2,6-Zr-AQ-MOF at pH < pKa, F) 2,6-Zr-AQ-MOF at pH > pKa, G)
1,4-Zr-AQ-MOF at pH < pKa, H) 1,4-Zr-AQ-MOF at pH > pKa. Shaded Area: The integrated
charge of the reductive wave
The specific capacitance was calculated from the integration of their cyclic
voltammograms at the same pH values (see SI), using the expression:
(3.2)
where C is the capacitance, I is the current, E is the potential, ∆E is the potential window
for the CV, υ is the scan rate, and m is the mass of the MOF. The 2,6-Zr-AQ-MOF exhibited
specific capacitance around 0.15 - 0.55 F g-1, at pH 1.5 - 7.0 F g-1, and higher specific capacitance

84
values (0.45 - 0.78 F g-1) at pH 7.0 - 9.67 (Figure 3.3C). On the other hand, the 1,4-Zr-AQ-MOF
revealed specific capacitance of 0.76 - 0.79 F g-1 at pH 1.5 - 4.5 (Figure 3.3D), while at pH 4.5 -
6.75 the specific capacitance was lower (0.48 - 0.56 F g-1).
The pKa dependence of the accessible quinone sites and capacitance for both MOFs in
their identically prepared slurry modified electrodes, suggests that the structural differences
between 2,6-Zr-AQ-MOF and 1,4-Zr-AQ-MOF in terms of defectivity and PCET processes
(number of electrons and proton transferred at pH < pKa, and pH > pKa) are directly influencing
the accessibility to quinone sites and the ability of the materials to store charge. Remarkably, the
non-defective 2,6-Zr-AQ-MOF showed a better performance at pH > pKa, revealing that the
protonated dianion,6 formed from the two-electron, one-proton transfer, provides stability to store
charge in a higher extent than the hydroquinone analogue formed at pH < pKa. This behavior is
similar to the one observed by anthraquinone COFs, where higher quinone accessibility was
achieved in aprotic solvents than in a very acidic environment.4 In contrast, the highly defective
1,4-Zr-AQ-MOF showed higher accessibility and capacitance at pH < pKa, revealing that the
hydrogen bonding resultant from the cooperative behavior between node and linker to achieve the
two-electron, three-proton transfer,6 is indeed facilitating charge transfer. The stabilization by
intramolecular hydrogen bonding displaying high capacitance and accessibility, was also
previously observed in a quinone COF material.10
Although the tridimensional uniformity and crystalline nature of MOF materials is
supposed to facilitate efficient charge transport,4, 10 other effects may take an influential role in this
type of slurry modified electrodes. For instance, the MOF particles are randomly dispersed in a
mixture with graphite, and the PMMA polymer is a barrier between the mixture and the electrolyte.
The solvothermal growth of MOF thin films provides a platform for studying the capacitance of

85
these materials in their crystalline form without the addition of graphite, and avoiding any
permeability effects of the polymer in pH-dependence studies.
Figure 3.3. Top: Percentage of quinones active in the slurry modified electrode of A) 2,6-
Zr-AQ-MOF and B) 1,4-Zr-AQ-MOF at different pH. Bottom: Specific capacitance of the slurry
modified electrode of C) 2,6-Zr-AQ-MOF D) 1,4-Zr-AQ-MOF at different pH.
However, the same pKa-dependence trend in terms of percentage of quinone accessed and
specific capacitance was observed in the thin films (Figure 3.4). The 2,6-Zr-AQ-MOF (pKa 7.56)
showed lower quinones accessed (0.03% - 0.08%) at pH 1.5 - 7.0, while higher quinones accessed
(0.2% - 0.6%) at pH 7.0 - 9.67 (Figure 3.4A). Additionally, the 1,4-Zr-AQ-MOF (pKa 5.18)
revealed higher quinone accessed (0.41% - 0.50%) at pH 1.5 – 4.5, and lower quinone accessed
(0.01% - 0.28%) at pH 4.5 – 6.75 (Figure 3.4B). Moreover, the capacitance of the 2,6-Zr-AQ-
MOF thin films was lower at pH 1.5 - 7.0 (around 0.35 - 0.45 F g-1) and higher (around 0.96 – 1.63
F g-1) at pH 7.0 - 9.67 (Figure 3.4C). Conversely, the 1,4-Zr-AQ-MOF films revealed specific
capacitance of 1.60 – 1.68 F g-1 at pH 1.5 - 4.5 (Figure 3.4D), while at pH 4.5 - 6.75 the specific
capacitance was lower (0.82 F g-1).

86
Figure 3.4. Top: Percentage of quinones active in the films of A) 2,6-Zr-AQ-MOF and
B) 1,4-Zr-AQ-MOF at different pH. Bottom: Specific capacitance of the films of C) 2,6-Zr-AQ-
MOF D) 1,4-Zr-AQ-MOF at different pH
The percentages of quinones accessed in the thin films of both MOFs (Figure 3.4 A-B) are
in the order of 3 or 10 times higher than the ones displayed in the slurry modified electrodes (Figure
3.3 A-B). Similarly, the capacitance values of the films of both frameworks (Figure 3.4 C-D) are
approximately twice in magnitude than the ones observed in the slurry modified electrodes (Figure
3.3 C-D). These facts confirm that the well-organized and crystalline structure of the MOF thin
films allow higher quinone accessibility and increase the charge transfer performance, as compared
to the electrodes built with a randomly oriented MOF powder.4
The thin films and slurry modified electrodes of both 2,6-Zr-AQ-MOF and 1,4-Zr-AQ-
MOF show higher values of specific capacitance than many MOFs reported in the literature, such
as UiO-66, MIL-100, MIL-101, ZIF-8, and ZIF-67 (0.002 -0.133 F g-1).17 However, these values
are lower than the highest capacitance values reported for MOFs in the literature.18-20 Interestingly,
the percentages of accessible quinone sites and specific capacitance of the films of both quinone

87
MOFs are considerably lower than those reported in the literature for 2-D quinone COF based
materials.4, 9, 10 This fact suggests that the stacking of layers may create paths for conductivity,
where the thickness of the films have a crucial role.4 The films synthesized in this study have an
approximate thickness of 1 µm, while the 2-D COF films reported in the literature are usually in
the nanometric range.4 We anticipate that varying the amount of modulator on the solvothermally-
grown MOF thin films, could potentially provide a difference in the thickness and crystallinity of
the films, where paths for electron and proton transfer could be optimized.
Lastly, in order to check the performance of both the 2,6-Zr-AQ-MOF and 1,4-Zr-AQ-
MOF as active materials in batteries, we assembled coin cells of both frameworks (see SI) and
obtained their charge-discharge potential profiles as a function of time at 0.1 mA and 0.2 mA using
ethanol as the electrolyte (Figure 3.5). Both frameworks showed the characteristic response related
to the reduction and oxidation of the anthraquinone ligands in the frameworks over several cycles.
Nevertheless, the capacitance behavior seemed limited as compared to coin cells of COFs
materials that exhibited an enhanced charge-storage capability due to the addition of conductive
moieties by electropolymerization.11 The distance between anthraquinone ligands in 2,6-Zr-AQ-
MOF and 1,4-Zr-AQ-MOF may not be ideal for electrons to hop, as compared to the charge-
transport path resulting from the stacking of quinone layers offered by 2D-COF materials.4

88
Figure 3.5. Charge-discharge potential profiles for a coin cell assembled with A) 2,6-Zr-
AQ-MOF at 0.1 mA B) 1,4-Zr-AQ-MOF at 0.1 mA C) 2,6-Zr-AQ-MOF at 0.2 mA D) 1,4-Zr-AQ-
MOF at 0.2 mA
3.5 CONCLUSION
In summary, we have studied the quinone accessibility and specific capacitance in two
anthraquinone-based Zr MOFs thin films and slurry modified electrodes, as a function of the pH.
The pKa of the frameworks, the defectivity, and the stabilization through hydrogen bonding,
showed an important effect on the percentage of quinones active and their ability to store charge
in both type of electrodes. While the anthraquinone MOF thin films displayed superior
performance than the powder-based electrodes, improving charge transport paths in the films
through crystal engineering methods is vital to exploit the potential of these materials as charge
transport agents.

89
3.6 SUPPORTING INFORMATION
3.6.1 Materials and Instrumentation
3.6.1.1 Materials
All reagents and solvents were purchased from commercial sources and used without
further purification.
3.6.1.2 Nuclear Magnetic Resonance (NMR)
1H NMR spectra were acquired on a Agilent U4-DD2 spectrometer operating at 400 MHz.
Samples were analyzed as solutions in DMSO-d6 (ca. 10 mg mL−1) at 25 °C in standard 5 mm o.d.
tubes.
3.6.1.3 Powder X-Ray Diffraction (PXRD)
PXRD measurements were carried out on a Rigaku Miniflex equipped with a Cu(Kα)
radiation source (λ=1.5418 Å). The scanning rate was 1°/min using a 2θ range of 3- 50° on
continuous mode. The samples were mounted onto reflective disks with a Si (510) surface.
3.6.1.4 Electrochemistry
All electrochemical experiments were performed in a BASi EC Epsilon potentiostat using
a standard three-electrode configuration: a working electrode (either a slurry-modified glassy
carbon (GC) electrode containing the MOF sample, or a solvothermally grown MOF deposited
into a FTO thin film), a high surface area Pt mesh as the counter electrode, and an aqueous
Ag/AgCl reference electrode (saturated aqueous KCl). Potassium Ferricyanide was used to
calibrate the reference electrode with all the potentials reported vs Ag/AgCl.
90
3.6.2 Electrochemical Methods
3.6.2.1 Preparation and dropcasting of the slurry modified electrode
A solution of poly-methyl methacrylate (3.34 mg) in 1.0 mL of THF was sonicated for 10
min. Subsequently, 10.0 mg of MOF and 10.0 mg of graphite were added to the solution in order
to create a suspension that was stirred for 1 h. The dropcasting was performed by adding 40.0 μL
of the slurry in the surface of the glassy carbon electrode, and letting it dry for 20 min. The
electrode was polished and re-coated again after every measurement.
3.6.2.2 Preparation of thin films
The films were synthesized solvothermally by introducing a fluorinated tin oxide (FTO)
film in the synthesis vial containing the linker, ZrCl4, the modulator, and the DMF solvent (as
described in the Experimental section), just before the solution was about to be held at 120 °C. A
multimeter was used to differentiate the conductive side of the film, leaving such side facing up
during the synthesis.
3.6.2.3 Cyclic voltammetry analysis
Analyses were performed in a standard three-electrode array: Either a slurry modified GC
electrode or a MOF thin film, a Ag/AgCl reference, and a Pt mesh. Solutions of 0.1 M HEPES
(10.0 mL) buffer at different pH were used as the supporting electrolyte. The pH was adjusted
using either HCl or NaOH. Before the experiment was carried out, nitrogen was bubbled for 20
minutes to the solution. Cyclic voltammograms were collected at a scan rate of 100 mV s-1 (12
cycles).
For each range of pH, the CV experiments were repeated three times on different slurry
modified electrodes or films, in order to obtain the average percentages of accessible quinones and
the correspondent statistical error. The cyclic voltammograms obtained in the three repetitions

91
(series 1, 2, and 3) for both MOFs in the slurry modified electrode and films at the different pH
range are shown on Figures S3.1-S3.12.
Figure S3.1: Cyclic voltammograms (slurry modified GC electrode - series 1, 100 mV s-
1, 0.1 M HEPES buffer in water as supporting electrolyte) of 2,6-Zr-AQ-MOF at different pH.
Shaded area: The integrated charge of the reductive wave.
Figure S3.2: Cyclic voltammograms (slurry modified GC electrode - series 2, 100 mV s-
1, 0.1 M HEPES buffer in water as supporting electrolyte) of 2,6-Zr-AQ-MOF at different pH.
Shaded area: The integrated charge of the reductive wave.

92
Figure S3.3: Cyclic voltammograms (slurry modified GC electrode - series 3, 100 mV s-
1, 0.1 M HEPES buffer in water as supporting electrolyte) of 2,6-Zr-AQ-MOF at different pH.
Shaded area: The integrated charge of the reductive wave.
Figure S3.4: Cyclic voltammograms (slurry modified GC electrode - series 1, 100 mV s-
1, 0.1 M HEPES buffer in water as supporting electrolyte) of 1,4-Zr-AQ-MOF at different pH.
Shaded area: The integrated charge of the reductive wave.

93
Figure S3.5: Cyclic voltammograms (slurry modified GC electrode - series 2, 100 mV s-
1, 0.1 M HEPES buffer in water as supporting electrolyte) of 1,4-Zr-AQ-MOF at different pH.
Shaded area: The integrated charge of the reductive wave.
Figure S3.6: Cyclic voltammograms (slurry modified GC electrode - series 3, 100 mV s-
1, 0.1 M HEPES buffer in water as supporting electrolyte) of 1,4-Zr-AQ-MOF at different pH.
Shaded area: The integrated charge of the reductive wave.

94
Figure S3.7: Cyclic voltammograms (thin films - series 1, 100 mV s-1, 0.1 M HEPES
buffer in water as supporting electrolyte) of 2,6-Zr-AQ-MOF at different pH. Shaded area: The
integrated charge of the reductive wave.
Figure S3.8: Cyclic voltammograms (thin films - series 2, 100 mV s-1, 0.1 M HEPES
buffer in water as supporting electrolyte) of 2,6-Zr-AQ-MOF at different pH. Shaded area: The
integrated charge of the reductive wave.

95
Figure S3.9: Cyclic voltammograms (thin films - series 3, 100 mV s-1, 0.1 M HEPES
buffer in water as supporting electrolyte) of 2,6-Zr-AQ-MOF at different pH. Shaded area: The
integrated charge of the reductive wave.
Figure S3.10: Cyclic voltammograms (thin films - series 1, 100 mV s-1, 0.1 M HEPES
buffer in water as supporting electrolyte) of 1,4-Zr-AQ-MOF at different pH. Shaded area: The
integrated charge of the reductive wave.

96
Figure S3.11: Cyclic voltammograms (thin films - series 2, 100 mV s-1, 0.1 M HEPES
buffer in water as supporting electrolyte) of 1,4-Zr-AQ-MOF at different pH. Shaded area: The
integrated charge of the reductive wave.
Figure S3.12: Cyclic voltammograms (thin films - series 3, 100 mV s-1, 0.1 M HEPES
buffer in water as supporting electrolyte) of 1,4-Zr-AQ-MOF at different pH. Shaded area: The
integrated charge of the reductive wave.

97
3.6.2.3.1 Calculation of % of Quinone active from CV analysis
The percentages of accessible electroactive quinones moieties in the slurry and the films
were calculated using the integrated charge of the reductive wave of the cyclic voltammograms
(shaded area on Figures S3.1-S3.12). As described in the manuscript, at a certain scan rate, the
charge corresponds to the integration of the current over the range of potential were the wave is
observed, according to the expression:
(3.1)
where Q is the charge, I is the current, E is the potential, E1 and E2 are the potentials
comprising the reductive wave, and υ is the scan rate.
As an example, for one of the 2,6-Zr-AQ-MOF slurry-modified GC electrode
experiments, at υ= 0.1 Vs-1, the integration of the peak (numerator in equation 1) gave 8.71 E-6
AV. Therefore, the experimental charge of the reductive wave was Qexp = 8.71 E-5 C.
The theoretical charge was calculated by determining the number of quinone sites available
in the slurry modified electrode. The concentration of MOF in the original graphite-MOF-PMMA
solution was 3.34 mg/mL, and the dropcasting was done by taking 40 µL of such slurry. Since the
molecular mass of the MOF is known (4083.58 g/mol), it was determined that there were 3.27 E-
5 mmol of 2,6-Zr-AQ-MOF in the slurry-modified GC electrode. Each mol of MOF contains 6
mol of quinone ligand, and every mol of ligand is able to transfer 2 mol of electrons. Using these
facts and the Faraday constant (96485 C mol-1), it was determined a theoretical charge of Qtheo=
3.79 E-2 C. Therefore, the percentage of quinone accessed during this particular experiment is
calculated as:
%𝑄𝑢𝑖𝑛𝑜𝑛𝑒 𝑎𝑐𝑡𝑖𝑣𝑒 =8.71 ∗ 10−5 𝐶
3.79 10−2 𝐶∗ 100 = 0.23%

98
The theoretical charge in the case of the thin films was obtained by digesting the MOF thin
film in nitric acid, and obtaining the Zr content by ICP analysis. Once more, using the molecular
formula of the MOF, the number of quinone ligands was obtained. Using the fact that each ligand
transfers two electrons and the Faraday constant, the theoretical charge (Qtheo) through the quinone
moieties in the thin films is easily calculated.
3.6.2.3.2 Calculation of Specific Capacitance from CV analysis
The specific capacitance was calculated from the integration of the whole CV (all the
potential window) by using the equation:
(3.2)
where C is the capacitance, I is the current, E is the potential, ∆E is the potential window for the
CV, υ is the scan rate, and m is the mass of the MOF. The mass of the MOF was obtained from
the concentration of the framework in the original graphite-MOF-PMMA solution for the slurry-
modified electrode, and the ICP analysis of the digested films.
3.6.2.4 Coin cells assembly and tests
The working electrodes were assembled by evenly distributing the active materials (either
2,6-Zr-AQ-MOF or 1,4-Zr-AQ-MOF), acetylene black, and polytetrafluoroethylene (PTFE) with
the mass ratio of 75:15:10. This mixture was pressed into a thin film that was cut to small pieces
(around 1 cm x 1 cm). The counter electrodes were prepared by mixing active carbon and PTFE
with the mass ratio of 90:10, and subsequently pressing the mixture into a thin film, that was also
cut to small pieces (around 1 cm x 1 cm). The active mass loadings for working and counter

99
electrodes were 6 mg/cm2. Then, all the electrodes were dried in vacuum oven at room-temperature
overnight. The CR2032 coin cells were assembled using the working electrodes, counter
electrodes, glass fiber as separator, and ethanol as the electrolyte. All coin cells were cycled with
an electrochemical workstation (Wuhan Land Company) at 25°C at the constant current of 0.1 -
0.5 mA in the voltage range of -1.5 - 0.2 V.
3.7 ACKNOWLEDGMENTS
This material is based upon work supported by the National Science Foundation under
Grant No. 1551964
3.8 REFERENCES
1. Xu, G.; Nie, P.; Dou, H.; Ding, B.; Li, L.; Zhang, X. Exploring metal organic frameworks
for energy storage in batteries and supercapacitors. Materials Today 2017, 20 (4), 191-209 DOI:
https://doi.org/10.1016/j.mattod.2016.10.003.
2. Wang, G.; Zhang, L.; Zhang, J. A review of electrode materials for electrochemical
supercapacitors. Chemical Society Reviews 2012, 41 (2), 797-828 DOI: 10.1039/C1CS15060J.
3. Allendorf, M. D.; Schwartzberg, A.; Stavila, V.; Talin, A. A. A roadmap to implementing
metal-organic frameworks in electronic devices: challenges and critical directions. Chemistry
2011, 17 (41), 11372-88 DOI: 10.1002/chem.201101595.
4. DeBlase, C. R.; Hernández-Burgos, K.; Silberstein, K. E.; Rodríguez-Calero, G. G.;
Bisbey, R. P.; Abruña, H. D.; Dichtel, W. R. Rapid and Efficient Redox Processes within 2D
Covalent Organic Framework Thin Films. ACS Nano 2015, 9 (3), 3178-3183 DOI:
10.1021/acsnano.5b00184.

100
5. Guin, P. S.; Das, S.; Mandal, P. C. Electrochemical Reduction of Quinones in Different
Media: A Review. International Journal of Electrochemistry 2011, 2011, 22 DOI:
10.4061/2011/816202.
6. Celis-Salazar, P. J.; Epley, C. C.; Ahrenholtz, S. R.; Maza, W. A.; Usov, P. M.; Morris, A.
J. Proton-Coupled Electron Transport in Anthraquinone-Based Zirconium Metal–Organic
Frameworks. Inorganic Chemistry 2017, 56 (22), 13741-13747 DOI:
10.1021/acs.inorgchem.7b01656.
7. Liu, J.; Woll, C. Surface-supported metal-organic framework thin films: fabrication
methods, applications, and challenges. Chemical Society Reviews 2017, 46 (19), 5730-5770 DOI:
10.1039/C7CS00315C.
8. Ahrenholtz, S. R.; Epley, C. C.; Morris, A. J. Solvothermal Preparation of an
Electrocatalytic Metalloporphyrin MOF Thin Film and its Redox Hopping Charge-Transfer
Mechanism. Journal of the American Chemical Society 2014, 136 (6), 2464-2472 DOI:
10.1021/ja410684q.
9. DeBlase, C. R.; Silberstein, K. E.; Truong, T.-T.; Abruña, H. D.; Dichtel, W. R. β-
Ketoenamine-Linked Covalent Organic Frameworks Capable of Pseudocapacitive Energy
Storage. Journal of the American Chemical Society 2013, 135 (45), 16821-16824 DOI:
10.1021/ja409421d.
10. Chandra, S.; Roy Chowdhury, D.; Addicoat, M.; Heine, T.; Paul, A.; Banerjee, R.
Molecular Level Control of the Capacitance of Two-Dimensional Covalent Organic Frameworks:
Role of Hydrogen Bonding in Energy Storage Materials. Chemistry of Materials 2017, 29 (5),
2074-2080 DOI: 10.1021/acs.chemmater.6b04178.

101
11. Mulzer, C. R.; Shen, L.; Bisbey, R. P.; McKone, J. R.; Zhang, N.; Abruña, H. D.; Dichtel,
W. R. Superior Charge Storage and Power Density of a Conducting Polymer-Modified Covalent
Organic Framework. ACS Central Science 2016, 2 (9), 667-673 DOI: 10.1021/acscentsci.6b00220.
12. Cabellero, A. G.; Croft, A. K.; Nalli, S. M. Remote aromatic stabilization in radical
reactions. Tetrahedron Letters 2008, 49 (22), 3613-3615 DOI:
http://dx.doi.org/10.1016/j.tetlet.2008.04.009.
13. Arient, J.; Podstata, J. Nitration and oxidation of anthraquinone dimethyl derivatives.
Collect. Czech. Chem. Commun. 1974, 39 (11), 3117-3123.
14. Garay, R. O.; Naarmann, H.; Muellen, K. Synthesis and characterization of poly(1,4-
anthrylenevinylene). Macromolecules 1994, 27 (7), 1922-1927 DOI: 10.1021/ma00085a040.
15. Shearer, G. C.; Chavan, S.; Bordiga, S.; Svelle, S.; Olsbye, U.; Lillerud, K. P. Defect
Engineering: Tuning the Porosity and Composition of the Metal–Organic Framework UiO-66 via
Modulated Synthesis. Chemistry of Materials 2016, 28 (11), 3749-3761 DOI:
10.1021/acs.chemmater.6b00602.
16. Cliffe, M. J.; Wan, W.; Zou, X.; Chater, P. A.; Kleppe, A. K.; Tucker, M. G.; Wilhelm, H.;
Funnell, N. P.; Coudert, F. X.; Goodwin, A. L. Correlated defect nanoregions in a metal-organic
framework. Nat Commun 2014, 5, 4176 DOI: 10.1038/ncomms5176.
17. Li, W. H.; Ding, K.; Tian, H. R.; Yao, M. S.; Nath, B.; Deng, W. H.; Wang, Y.; Xu, G.
Conductive Metal–Organic Framework Nanowire Array Electrodes for High‐Performance Solid‐
State Supercapacitors. Advanced Functional Materials 2017, 27 (27), 1702067 DOI:
doi:10.1002/adfm.201702067.

102
18. Gholipour-Ranjbar, H.; Soleimani, M.; Naderi, H. R. Application of Ni/Co-based metal-
organic frameworks (MOFs) as an advanced electrode material for supercapacitors. New Journal
of Chemistry 2016, 40 (11), 9187-9193 DOI: 10.1039/C6NJ01449F.
19. Lee, D. Y.; Shinde, D. V.; Kim, E.-K.; Lee, W.; Oh, I.-W.; Shrestha, N. K.; Lee, J. K.; Han,
S.-H. Supercapacitive property of metal–organic-frameworks with different pore dimensions and
morphology. Microporous and Mesoporous Materials 2013, 171, 53-57 DOI:
http://dx.doi.org/10.1016/j.micromeso.2012.12.039.
20. Tan, Y.; Zhang, W.; Gao, Y.; Wu, J.; Tang, B. Facile synthesis and supercapacitive
properties of Zr-metal organic frameworks (UiO-66). RSC Advances 2015, 5 (23), 17601-17605
DOI: 10.1039/C4RA11896K.
103
4. Elucidation of the Relative Contributions of Electronic and Ionic
Diffusion from the Solid-State Voltammetry of Metallocene-doped
Metal-Organic Frameworks Thin Films
Paula J. Celis-Salazar, Clark A. Cucinell, Spencer R. Ahrenholtz, Meng Cai, Charity C.
Epley, Pavel M. Usov, Amanda J. Morris*
4.1 ABSTRACT
The chronoamperometric response (I vs. t) of three metallocene-doped metal-organic
frameworks (MOFs) thin films (M-NU-1000, M= Fe, Ru, Os) in two different electrolytes
(TBAPF6 and TBATFAB) was utilized to elucidate the diffusion coefficients of electrons and ions
(De and Di, respectively) through the structure in response to an oxidizing applied bias. The
application of a theoretical model for solid state-voltammetry to the experimental data revealed
that the diffusion of ions is the rate-determining step at the three different time stages of the
electrochemical transformation: an initial stage characterized by the rapid electron diffusion along
the crystal-solution boundary (Stage A), a maximum exhaustive conversion of all the redox centers
of such crystal-electrolyte interface (Stage B), and a final period of the conversion dominated only
by the diffusion of ions from the surface of the crystal into the bulk (Stage C). Remarkably, the
electron diffusion (De) increased in the order of Fe < Ru < Os using PF61- as the counter anion in
all the stages of the voltammogram, demonstrating the strategy to modulate the rate of electron
transport through the incorporation of rapidly self-exchanging molecular moieties into the MOF
structure. The De values obtained with larger TFAB1- counter anion were generally in agreement
with the previous trend, but were on average lower than those obtained with PF61-. Similarly, the
ionic diffusion coefficient (Di) was higher for PF61- than for TFAB1- in the first two stages,

104
confirming that smaller ions move more rapidly through the MOF pores. These structure-function
relationships provide a foundation for the future design, control, and optimization of electronic
and ionic transport properties in MOF thin films.
4.2 INTRODUCTION
Metal-Organic Frameworks (MOFs) are prominent materials with considerable promise in
many fields such as electrocatalysis, electronics and batteries.1, 2 These hybrid arrays of inorganic
nodes connected by organic-based ligands to form multidimensional structures have arisen as
potential candidates to satisfy the current demands for cleaner energy and its environmentally
sustainable storage.3, 4 Recently, the fabrication of MOF thin films on conductive substrates, have
facilitated their electrochemical characterization, and improved the utility of these systems in a
wider variety of applications.3
Although originally most MOFs were considered electrical insulators, several examples of
MOFs capable of efficient charge transport has been reported in the recent years.5-7 Careful
selection of ligands and nodes with appropriate electronic properties in the MOF synthesis, could
lead to the extended structures containing charge transport pathways.6, 7 Similarly, post-synthetic
modifications (PSM) of existing MOFs have shown to be an effective strategy for incorporation
of electroactive moieties.8, 9 In particular, the use of coordinatively unsaturated metal clusters has
been extensively employed to append the redox-active species inside the frameworks.8, 10
While these synthetic approaches have contributed to the development of an extensive
variety of conductive MOFs, detailed studies on the mechanism of electron transport in these
materials are still lacking. In principle, the charge propagation in frameworks can be facilitated by
three different mechanisms: 1) ligand-node orbital energy overlap,11 2) π-stacking interactions
between planar linkers,12 and 3) redox hopping between the neighboring centers.13 Indeed, the

105
latter mechanism was demonstrated experimentally by quantifying the apparent diffusion
coefficient (Dapp) in Co-based MOF thin films, suggesting that charge conduction occurs through
discrete ambipolar redox-hopping steps.13
Specifically, for such mechanism to take place in a MOF, the electrochemical charge
transport should depend on the rate of electron diffusion (De) from one redox center to another
along the framework backbone, and the rate of ionic diffusion (Di) through the MOF pores to
maintain the electroneutrality.13 The electron diffusion coefficient is related to the homogeneous
self-exchange rate of the redox centers, whereas the ionic diffusion is primarily dependent on the
ion size, MOF pore size, and the ion pairing ability. Despite the importance of these diffusion
terms for understanding the overall charge transport properties in MOFs, there are no detailed
reports examining their relative contributions towards this process. This information would be vital
for establishing structure-function relationships in the design of these materials. Nevertheless, a
theoretical model capable of individually quantifying these diffusional components has been
developed in the past, for idealized microcrystals immobilized on the surface of an electrode.14
In order to apply this theoretical model to the solid-state voltammetry of MOF thin films,
a series of materials with systematic parameter variation was devised. There are several important
considerations: (1) First, the films should be constructed from a robust and chemically stable MOF
with open metal sites, providing the possibility for a post-synthetic functionalization. For instance,
the NU-1000 exhibits a high degree of stability, and has been previously functionalized with
ferrocene molecules.10, 15 (2) Additionally, the redox active centers inside the framework must be
systematically varied through the use of isostructural guests with different self-exchange rates. For
example, metallocenes behave as ideal redox couples, undergoing reversible one-electron
oxidation reactions from M2+ to M3+.16, 17 Moreover, ferrocene, ruthenocene, and osmocene have

106
self-exchange rates differing by orders of magnitude,18, 19 which is important to effectively probe
the electronic diffusion. (3) Lastly, ionic diffusion should be interrogated by utilizing counter
anions with substantially different sizes. For this role, non-coordinating anions such as PF6 and
TFAB,20 combined with low donor solvents, such as dichloromethane, should facilitate the
unimpeded ion mobility during the electrochemical analysis.16
Herein, we report the synthesis of metallocene-doped M-NU-1000 (M = Fe, Ru, Os) thin
films on conductive fluorine-doped tin oxide (FTO) support. A series of chronoamperometry
experiments in PF61- and TFAB1- based electrolytes was performed with the goal of unravelling
the individual contributions of electronic and ionic diffusion (De and Di) in MOF thin films. We
separated these contributions by applying a solid-state voltammetric model to the experimental
data identifying three key stages in the process of electrochemical transformation. To the best of
our knowledge, this investigation is the first attempt to directly quantify the main contributing
factors to the redox-hopping process in MOFs.
4.3 EXPERIMENTAL SECTION
4.3.1 Synthesis of Ferrocene Carboxylic Acid (Fe-COOH)
The synthesis of Fe-COOH was achieved in two steps by following a procedure described
in the literature (Scheme S4.1).21 Ferrocene (1.86 g, 0.01 mol), 2-chlorobenzoyl chloride (1.3 mL,
0.01 mol) and 20 mL of dry dichloromethane were placed in a two-necked round bottom flask
under positive flow of nitrogen and continuous stirring at 0 °C (ice bath). Anhydrous aluminum
chloride (1.4 g, 0.01 mol) was added to the reaction mixture in small portions. As the reaction
proceeded, the appearance of a blue color was observed. Once the addition was finished the
mixture was stirred at 0 °C for 30 min, and at room temperature for 2 h. Subsequently, the mixture
was cooled in ice and 100 mL of water were added to the flask. The two-phase mixture was stirred
107
vigorously for 30 min, and successively extracted with DCM. The DCM phase was reduced under
vacuum and dried under air, to afford a red viscous slurry of 2-cholorobenzoyl ferrocene that was
used in the next step without further purification. Potassium tert-butoxide (4.6 g, 0.04 mol) and
50.0 mL of tetrahydrofuran (THF) were added to the flask containing the 2-cholorobenzoyl
ferrocene slurry with continuous stirring before it was placed under nitrogen flow, and equipped
with a reflux condenser. Water (0.2 mL, 0.01 mol) was added to the mixture, and the reaction was
refluxed for 1 h, undergoing a color change from yellow to tan. Once the reaction was cooled, 100
mL of water were added to the mixture and several extractions with diethyl ether were performed.
The aqueous phase was isolated and acidified with concentrated hydrochloric acid (37 % HCl).
The resultant yellow precipitate was filtered under vacuum and washed with water. The solid was
dried overnight, affording pure Fe-COOH with 81% yield.21 1H NMR (400 MHz, d6-DMSO): δ
4.69 (s, 2H), 4.43 (s, 2H), 4.21 (s, 5H).
4.3.2 Synthesis of Ruthenocene Carboxylic Acid (Ru-COOH)
The synthesis of Ru-COOH was achieved in two steps by adapting the procedure reported
for Fe-COOH (Scheme S4.1).21 Ruthenocene (0.56 g, 2.4 mmol), 2-chlorobenzoyl chloride (0.30
mL, 2.4 mmol) and 20 mL of dry dichloromethane (DCM) were placed in a two-necked round
bottom flask under positive flow of nitrogen and continuous stirring at 0 °C (ice bath). Anhydrous
aluminum chloride (0.32 g, 2.4 mmol) was added to the reaction mixture in small portions. As the
reaction proceeded, the color of the mixture changed from yellow to orange. Once the addition
was finished the mixture was stirred at 0 °C for 30 min, and at room temperature for 2 h.
Subsequently, the mixture was cooled in ice and 100 mL of water were added to the flask. The
two-phase mixture was stirred vigorously overnight, and successively extracted with DCM. The
DCM phase was reduced under vacuum and dried under air, to afford a yellow slurry of 2-

108
cholorobenzoyl ruthenocene that was used in the next step without further purification. Potassium
tert-butoxide (1.1 g, 0.01 mol) and 25.0 mL of tetrahydrofuran (THF) were added to the flask
containing the 2-cholorobenzoyl ruthenocene slurry with continuous stirring before the flask was
placed under nitrogen flow, and equipped with a reflux condenser. Water (50 µL, 2.5 mmol) was
added to the mixture, and the reaction was refluxed for 4 h, appearing beige in color. Once the
reaction was cooled, 100 mL of water were added to the mixture, and several extractions with
diethyl ether were performed. The aqueous phase was isolated and acidified with concentrated
hydrochloric acid (37 % HCl). The pale yellow precipitate was filtered under vacuum and washed
with water. The solid was dried overnight, affording pure Ru-COOH with 52% yield. 1H NMR
(400 MHz, d6-DMSO): δ 5.01 (t, J = 1.9 Hz, 2H), 4.74 (t, J = 1.9 Hz, 2H), 4.60 (s, 5H).
4.3.3 Synthesis of Osmocene Carboxylic Acid (Os-COOH)
The synthesis of Os-COOH was achieved in two steps by adapting the procedure reported
for Fe-COOH (Scheme S4.1).21 Osmocene (0.52 g, 1.6 mmol), 2-chlorobenzoyl chloride (0.2 mL,
1.6 mmol) and 15 mL of dry dichloromethane (DCM) were placed in a two-necked round bottom
flask under positive flow of nitrogen and continuous stirring at 0 °C (ice bath). Anhydrous
aluminum chloride (0.23 g, 1.6 mmol) was added to the reaction mixture in small portions. As the
reaction proceeded, the color of the mixture changed from white to yellow. Once the addition was
finished the mixture was stirred at 0 °C for 30 min, and at room temperature for 2 h. Subsequently,
the mixture was cooled in ice and 70 mL of water were added to the flask. The two-phase mixture
was stirred vigorously overnight, and successively extracted with DCM. The aqueous phase was
reduced under vacuum and dried under air, to afford a yellow slurry of 2-cholorobenzoyl osmocene
that was used in the next step without further purification. Potassium tert-butoxide (0.74 g, 6.7
mol) and 25.0 mL of tetrahydrofuran (THF) were added to the flask containing the 2-

109
cholorobenzoyl osmocene slurry with continuous stirring before the flask was placed under
nitrogen flow, and equipped with a reflux condenser. Water (34 µL, 2.5 mmol) was added to the
mixture, and the reaction was refluxed for 4 h. Once the reaction was cooled, 100 mL of water
were added to the mixture, and several extractions with diethyl ether were performed. The aqueous
phase was isolated and acidified with concentrated hydrochloric acid (37 % HCl). The beige
precipitate was filtered under vacuum and washed with water. The solid was dried overnight,
affording Os-COOH with 50% yield. 1H NMR (400 MHz, d6-DMSO): δ 5.10 (m, 2H), 5.02 (m,
2H), 4.92 (s, 5H).
4.3.4 Synthesis of 1,3,6,8-tetrakis(p-benzoic acid)pyrene (TBAPy) ligand
The synthesis was achieved in two steps by following the previously reported procedure.22
First, a stirred solution of 4-(methoxycarbonyl)phenyl boronic acid (5 g, 32.9 mmol), 1,3,6,8-
tetrabromopyrene (2.85 g, 5.5 mmol), palladium tetrakis (triphenylphosphine) (0.1 g, 0.09 mmol),
and potassium carbonate (6 g, 44 mmol) in dry dioxane (50 mL) was heated at 85 °C for 72 h under
nitrogen flow. Subsequently, the mixture was poured into a solution containing concentrated
hydrochloric acid (37 % HCl) and ice (w/w 1:3). Multiple extractions were performed using
chloroform to purify the organic layer which was dried over magnesium sulfate. The solvent was
removed under reduced pressure and the resulting solid of 1,3,6,8-tetrakis(4-
methoxycarbonyl)phenyl pyrene was dried under vacuum and used in the next step without further
purification. The compound 1,3,6,8-tetrakis(4-methoxycarbonyl)phenyl pyrene was dissolved in
100.0 mL of a mixture of THF-Dioxane-Water (5:2:2), and 20 mL of a concentrated NaOH
solution were added to the suspension. The mixture was stirred and heated at 85 °C for 24 h. After
removing the solvent, 50 mL of water were added to the solution, which was stirred for additional
2 h. The aqueous phase was acidified with concentrated hydrochloric acid (37 % HCl), and the

110
resulting yellow solid was filtered and dried under vacuum affording pure 1,3,6,8-tetrakis(p-
benzoic acid)pyrene (TBAPy) with 84% yield.22 1H NMR (400 MHz, d6-DMSO): δ 8.21 (s, 4H),
8.16 (d, J = 8.4 Hz, 8H), 8.08 (s, 2H), 7.87 (d, J = 8.4 Hz, 8H)
4.3.5 Synthesis of NU-1000 MOF [Zr6(μ3−OH)8(OH)8(TBAPy)2]
The synthesis was carried out by following a procedure previously reported in the
literature.23 ZrCl4 (70 mg, 0.3 mmol), and benzoic acid (2700 mg, 22 mmol) were dissolved in 8.0
mL of DMF and sonicated for 5 min. The mixture was placed in an oven at 80 °C for 1 h, and
allowed to cool to room temperature. Then, the ligand, 1,3,6,8-tetrakis(p-benzoic acid)pyrene
TBAPy (40 mg, 0.06 mmol) was added to the solution. The mixture was sonicated for 20 minutes
before heating at 120 °C for 48 h. The NU-1000 MOF was obtained as a yellow powder, which
was isolated by centrifugation, washed three times with fresh DMF and dried under vacuum.
4.3.6 Solvent Assisted Ligand Incorporation (SALI)
The SALI procedure was carried out by following an analogous procedure described in the
literature.10 The concentration of the metallocene carboxylic acids solutions was experimentally
adjusted to obtain a constant Zr6/ metallocene ratio of 1.
4.3.6.1 Fe-NU-1000
The NU-1000 (60 mg, 0.027 mmol) and 2.4 mL of a 0.1 M solution of Fe-COOH in DMF
(0.24 mmol) were mixed in a 3 mL vial. The mixture was heated at 60 °C for 18 h, with occasional
stirring. After cooling to room temperature, the powder was isolated by centrifugation.
Subsequently, the resultant pink solid was washed and centrifuged three times with fresh DMF,
and two times with acetone and diethyl ether. The Fe-NU-1000 sample was dried under vacuum
at room temperature.10

111
4.3.6.2 Ru-NU-1000
The NU-1000 (60 mg, 0.027 mmol) and 2.4 mL of a 0.05 M solution of Ru-COOH in DMF
(0.12 mmol) were mixed in a 3 mL vial. The mixture was heated at 60 °C for 18 h, with occasional
stirring. After cooling to room temperature, the powder was isolated by centrifugation.
Subsequently, the resultant pink solid was washed and centrifuged three times with fresh DMF,
and two times with acetone and diethyl ether. The Ru-NU-1000 sample was dried under vacuum
at room temperature.
4.3.6.3 Os-NU-1000
The NU-1000 (12 mg, 0.0054 mmol) and 2.4 mL of a 0.1 M solution of Os-COOH in DMF
(0.24 mmol) were mixed in a 3 mL vial. The mixture was heated at 60 °C for 18 h, with occasional
stirring. After cooling to room temperature, the powder was isolated by centrifugation.
Subsequently, the resultant pink solid was washed and centrifuged three times with fresh DMF,
and two times with acetone and diethyl ether. The Os-NU-1000 sample was dried under vacuum
at room temperature.
4.3.7 Electrophoretic Deposition of MOF thin films
The electrophoretic deposition of the MOF films was achieved by using a previously
reported procedure.10 A suspension of the M-NU-1000 (M = Fe, Ru, Os; 14 mg) in 26 mL of
toluene was stirred, while two identical FTO slides separated by 1 cm were placed in the solution.
A constant DC voltage of 130 V was maintained for 3 hours.
4.4 RESULTS AND DISCUSSION
The monodentate metallocene-based ligands, namely ferrocene carboxylic acid (Fe-
COOH), ruthenocene carboxylic acid (Ru-COOH), and osmocene carboxylic acid (Os-COOH)

112
were synthesized in two steps using a Friedel-Crafts acylation reaction of the parent metallocene,
followed by a cleavage of the non-enolizable ketone to form the carboxylic acid (Scheme S4.1).21
The ligand 1,3,6,8-tetrakis(p-benzoic acid)pyrene (TBAPy) was synthesized via a Suzuki reaction
and a basic hydrolysis according to previously reported procedures.22 The solvothermal reaction
of TBAPy and ZrCl4 in DMF, using benzoic acid as a modulator afforded NU-1000 MOF as a
yellow powder.23
The incorporation of the metallocene ligands in the structure of the NU-1000 to obtain M-
NU-1000 (M= Fe, Ru, Os) was achieved through a commonly employed solvent assisted ligand
incorporation (SALI) procedure.10 NMR analysis of the digested M-NU-1000 samples (Figure
S4.1) revealed that the ratio of Zr6 to metallocene was 1:1 in all the frameworks, suggesting the
presence of one metallocene molecule per zirconium node (Figure 4.1A). It is important to keep
this ratio constant across the series, to ensure that metallocene concentration inside NU-1000 and
the distance between them remains unchanged during the electrochemical characterization.
Additionally, powder X-ray diffraction (PXRD) patterns of Fe-NU-1000, Ru-NU-1000, and Os-
NU-1000 samples confirmed the expected NU-1000 structure, which remained consistent after the
SALI procedure (Figure 4.1B). The deposition of these MOFs as thin films was achieved by
electrophoretic deposition using conductive FTO slides as a support.10 SEM analysis showed an
average film thickness of 1 µm (Figure S4.2), and a hexagonal rod morphology of framework
particles across the film surface, characteristic of NU-1000 microcrystals (Figure S4.3).
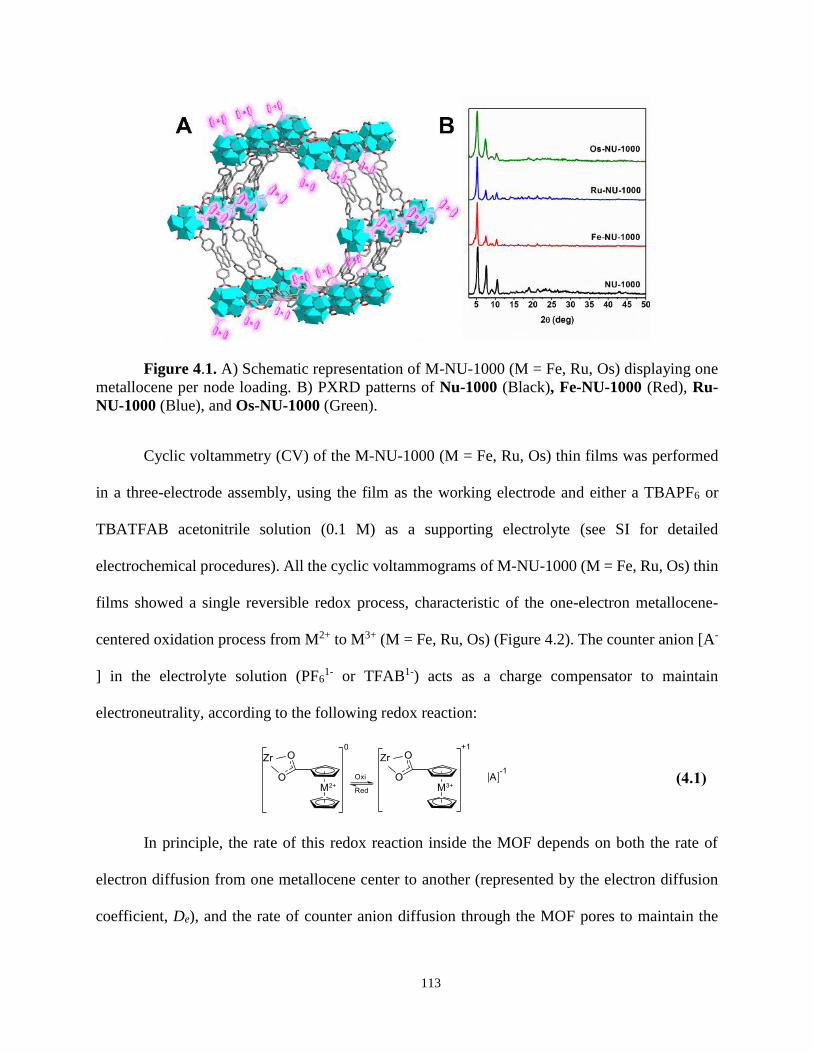
113
Figure 4.1. A) Schematic representation of M-NU-1000 (M = Fe, Ru, Os) displaying one
metallocene per node loading. B) PXRD patterns of Nu-1000 (Black), Fe-NU-1000 (Red), Ru-
NU-1000 (Blue), and Os-NU-1000 (Green).
Cyclic voltammetry (CV) of the M-NU-1000 (M = Fe, Ru, Os) thin films was performed
in a three-electrode assembly, using the film as the working electrode and either a TBAPF6 or
TBATFAB acetonitrile solution (0.1 M) as a supporting electrolyte (see SI for detailed
electrochemical procedures). All the cyclic voltammograms of M-NU-1000 (M = Fe, Ru, Os) thin
films showed a single reversible redox process, characteristic of the one-electron metallocene-
centered oxidation process from M2+ to M3+ (M = Fe, Ru, Os) (Figure 4.2). The counter anion [A-
] in the electrolyte solution (PF61- or TFAB1-) acts as a charge compensator to maintain
electroneutrality, according to the following redox reaction:
(4.1)
In principle, the rate of this redox reaction inside the MOF depends on both the rate of
electron diffusion from one metallocene center to another (represented by the electron diffusion
coefficient, De), and the rate of counter anion diffusion through the MOF pores to maintain the
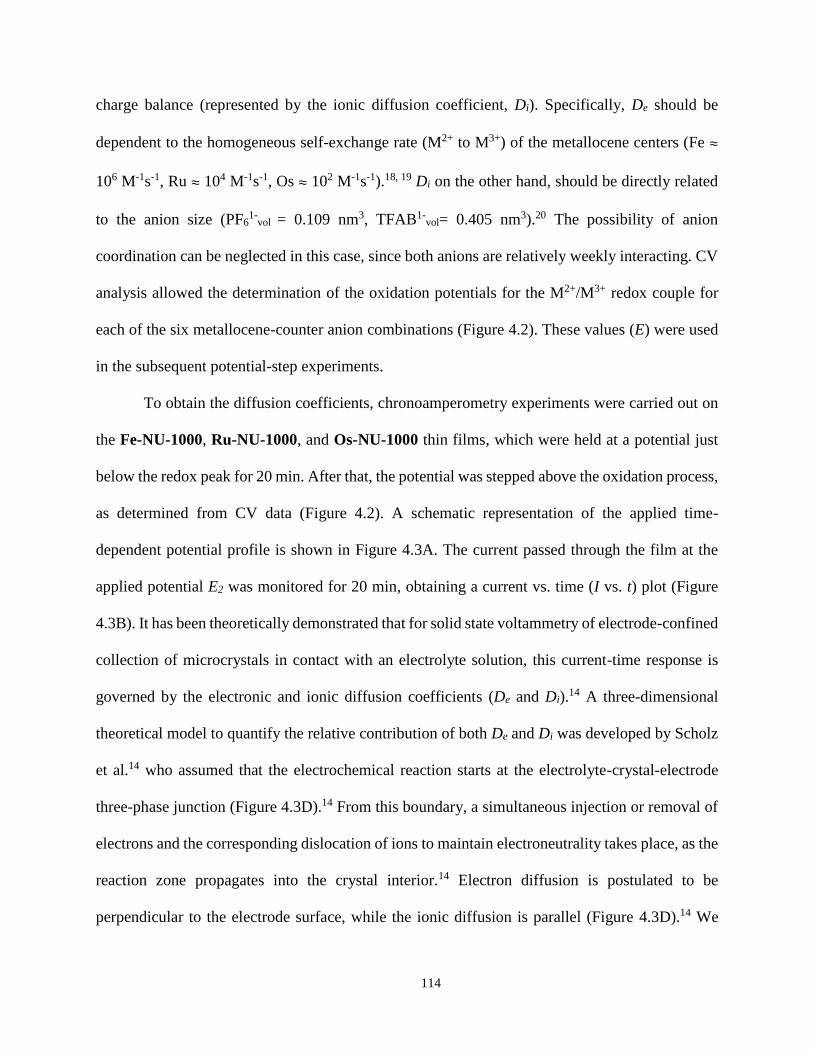
114
charge balance (represented by the ionic diffusion coefficient, Di). Specifically, De should be
dependent to the homogeneous self-exchange rate (M2+ to M3+) of the metallocene centers (Fe ≈
106 M-1s-1, Ru ≈ 104 M-1s-1, Os ≈ 102 M-1s-1).18, 19 Di on the other hand, should be directly related
to the anion size (PF61-
vol = 0.109 nm3, TFAB1-vol= 0.405 nm3).20 The possibility of anion
coordination can be neglected in this case, since both anions are relatively weekly interacting. CV
analysis allowed the determination of the oxidation potentials for the M2+/M3+ redox couple for
each of the six metallocene-counter anion combinations (Figure 4.2). These values (E) were used
in the subsequent potential-step experiments.
To obtain the diffusion coefficients, chronoamperometry experiments were carried out on
the Fe-NU-1000, Ru-NU-1000, and Os-NU-1000 thin films, which were held at a potential just
below the redox peak for 20 min. After that, the potential was stepped above the oxidation process,
as determined from CV data (Figure 4.2). A schematic representation of the applied time-
dependent potential profile is shown in Figure 4.3A. The current passed through the film at the
applied potential E2 was monitored for 20 min, obtaining a current vs. time (I vs. t) plot (Figure
4.3B). It has been theoretically demonstrated that for solid state voltammetry of electrode-confined
collection of microcrystals in contact with an electrolyte solution, this current-time response is
governed by the electronic and ionic diffusion coefficients (De and Di).14 A three-dimensional
theoretical model to quantify the relative contribution of both De and Di was developed by Scholz
et al.14 who assumed that the electrochemical reaction starts at the electrolyte-crystal-electrode
three-phase junction (Figure 4.3D).14 From this boundary, a simultaneous injection or removal of
electrons and the corresponding dislocation of ions to maintain electroneutrality takes place, as the
reaction zone propagates into the crystal interior.14 Electron diffusion is postulated to be
perpendicular to the electrode surface, while the ionic diffusion is parallel (Figure 4.3D).14 We
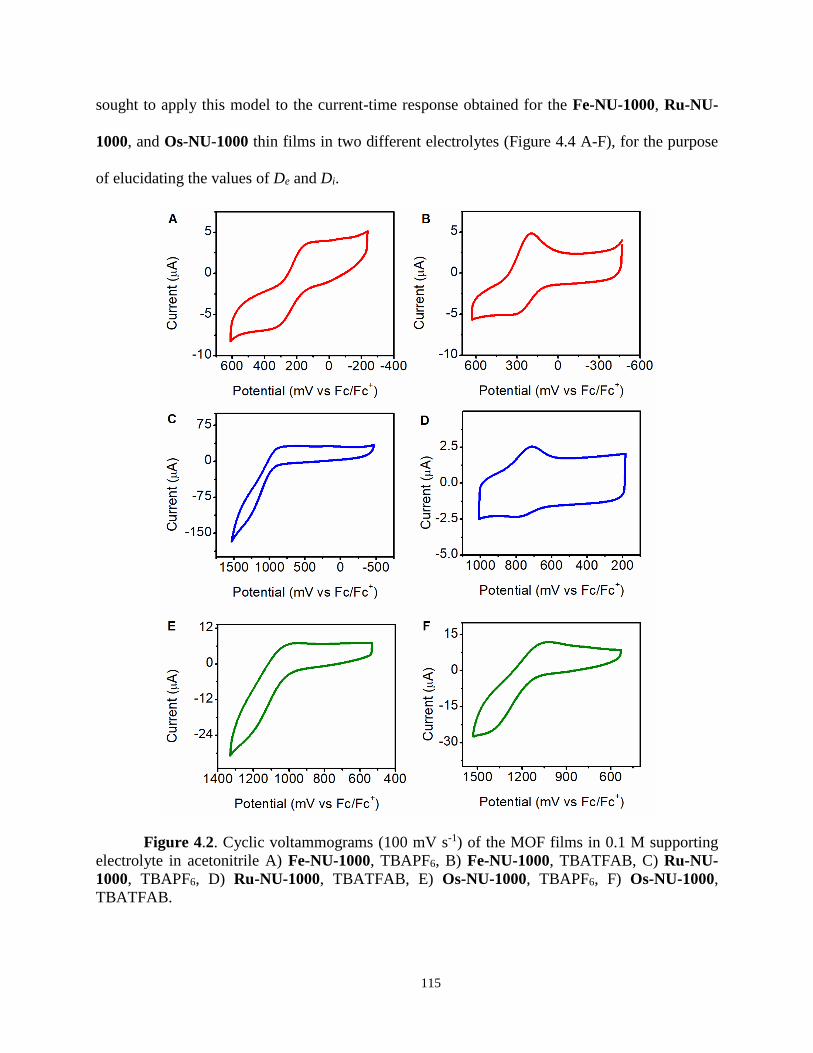
115
sought to apply this model to the current-time response obtained for the Fe-NU-1000, Ru-NU-
1000, and Os-NU-1000 thin films in two different electrolytes (Figure 4.4 A-F), for the purpose
of elucidating the values of De and Di.
Figure 4.2. Cyclic voltammograms (100 mV s-1) of the MOF films in 0.1 M supporting
electrolyte in acetonitrile A) Fe-NU-1000, TBAPF6, B) Fe-NU-1000, TBATFAB, C) Ru-NU-
1000, TBAPF6, D) Ru-NU-1000, TBATFAB, E) Os-NU-1000, TBAPF6, F) Os-NU-1000,
TBATFAB.

116
The model suggests the existence of three distinct reaction stages in the observed I vs. t
curves, representing the extent of redox conversion. When plotting the chronoamperometric
response as a I√t vs.√t plot, these three stages (denoted as A, B, and C) become evident (Figure
4.3C). During Stage A, both electron and ionic diffusion are unhindered, and the faster process
leads the spread of the initial conversion either along the crystal-solution interface or along the
crystal-electrode boundary.14 Stage B, is the maximum of the I√t vs.√t curve (Figure 4.3C) and
corresponds to the moment when all the redox centers across such interface are converted. From
this instant, the further course of the reaction into the crystal bulk is controlled by the slowest
process (Stage C), being the very end of these stage the most characteristic segment, where the
conversion of the crystal is higher than 99% (Figure 4.3C).14 The model derived separate current-
time equations for each stage, as a function of several physical parameters, including the diffusion
coefficients (De and Di).14 These equations were used to fit the experimental data at each stage, to
obtain the physical values of De and Di and their evolution as the electrochemical reaction
progresses.
First, the I√t vs.√t curves for the Fe-NU-1000, Ru-NU-1000, and Os-NU-1000 thin films
in the two different electrolytes were constructed, as shown in Figure 4.4 G-L. For each of the six
combinations of metallocene-counter anion couples, the chronoamperometry experiments were
repeated four times on different films, in order to obtain the average De and Di values and the
correspondent statistical error (see SI for detailed electrochemical procedures and a step by step
sample calculation of the applied model at the three different stages). Once the three stages (A, B,
and C) where identified from the I√t vs.√t plots (Figure 4.4 G-L), the curve fitting of the
experimental data to the appropriate current-time equation was carried out as follows:
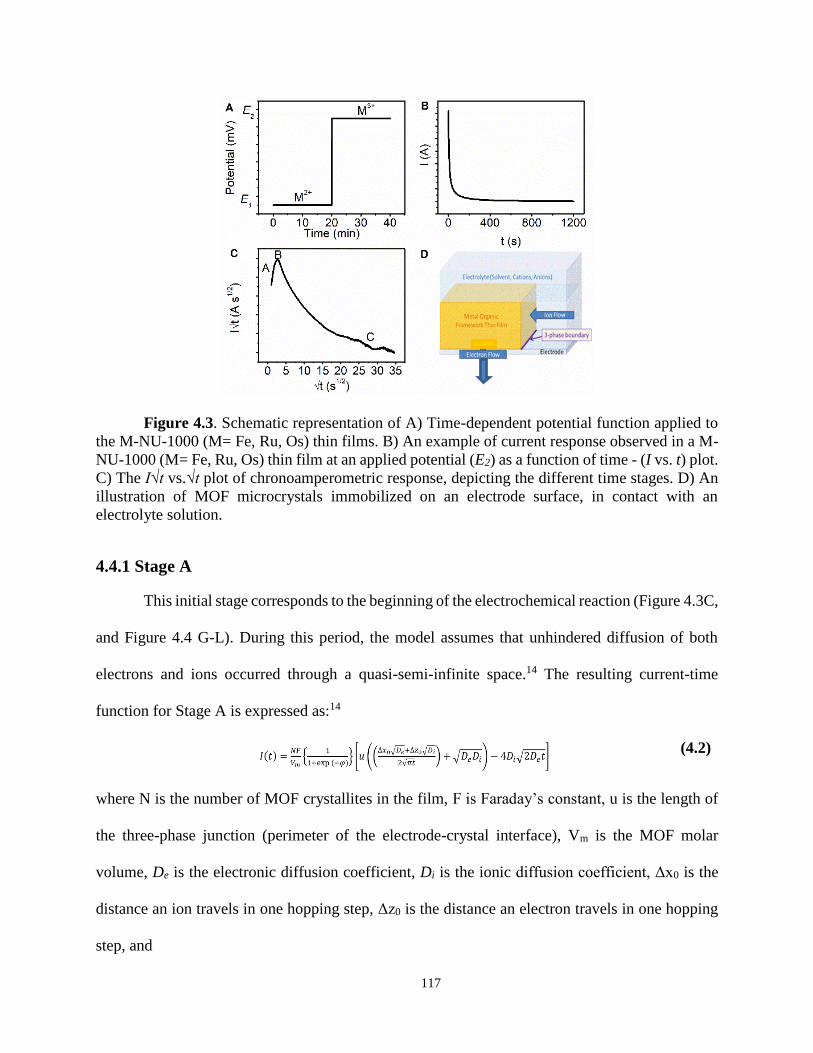
117
Figure 4.3. Schematic representation of A) Time-dependent potential function applied to
the M-NU-1000 (M= Fe, Ru, Os) thin films. B) An example of current response observed in a M-
NU-1000 (M= Fe, Ru, Os) thin film at an applied potential (E2) as a function of time - (I vs. t) plot.
C) The I√t vs.√t plot of chronoamperometric response, depicting the different time stages. D) An
illustration of MOF microcrystals immobilized on an electrode surface, in contact with an
electrolyte solution.
4.4.1 Stage A
This initial stage corresponds to the beginning of the electrochemical reaction (Figure 4.3C,
and Figure 4.4 G-L). During this period, the model assumes that unhindered diffusion of both
electrons and ions occurred through a quasi-semi-infinite space.14 The resulting current-time
function for Stage A is expressed as:14
(4.2)
where N is the number of MOF crystallites in the film, F is Faraday’s constant, u is the length of
the three-phase junction (perimeter of the electrode-crystal interface), Vm is the MOF molar
volume, De is the electronic diffusion coefficient, Di is the ionic diffusion coefficient, Δx0 is the
distance an ion travels in one hopping step, Δz0 is the distance an electron travels in one hopping
step, and
118
(4.3)
where R is the gas constant, T is temperature, E is the applied potential, and Ef is the formal
potential. All of the above parameters can be empirically obtained from the crystal structure of
NU-1000, SEM images of the films, and the Zr6/metallocene ratio calculated from NMR digestion
studies (See SI).
The fitting of Eq. 4.2 to the current- time response (I vs. t) of all the M-NU-1000 (M = Fe,
Ru, Os) thin films in both electrolytes is shown in Figure 4.4 A-F (blue traces). A generally good
fit (R2> 96%, see SI) was observed for all the films, evidencing a close agreement between the
experimental data and the theoretical model. The diffusion coefficients calculated in Stage A are
presented in Figure 4.5 and summarized in Table 4.1.
Theoretically, two different cases can occur during the initial Stage A, as the reaction zone
spreads: (1) If the ionic diffusion is faster than the electronic diffusion (De < Di), this period is
characterized by the rapid migration of ions along the electrode-crystal interface, where the redox
active centers along this boundary are quickly converted.14 On the other hand, (2) if the electronic
diffusion is faster than the ionic diffusion (De > Di), the reaction zone rapidly spreads away from
the electrode in a perpendicular direction, parallel to the electrolyte-crystal interface (the crystal
surface). As a result, the redox centers along this boundary are the first to undergo the
electrochemical transformation.14
It is evident from the model fit (Figure 4.5, Table 4.1) that the values of De (10-5 - 10-7) are
considerably higher than those of Di (10-15 - 10-18) across all the M-NU-1000 (M = Fe, Ru, Os)
thin films regardless of the counter ion size. Therefore, the mechanism of the electron/ion transport
in Stage A, follows the latter case (De > Di) with rapid electron hopping along the crystal walls.
Another important finding is the considerable variation in the De values for the M-NU-1000 (M =

119
Fe, Ru, Os) series in Stage A (Figure 4.5- Stage A). The magnitude of electronic diffusion followed
the trend of the self-exchange rates of the metallocene centers. That is, De increased in the order
Fe-NU-1000 < Ru-NU-1000 < Os-NU-1000 using PF61- as the counter anion. This result
highlights the interdependence of electronic diffusion and the self-exchange rate of the redox
centers, presenting the strategy to control the rate of electron transport in MOFs. A similar behavior
was observed using TFAB1- as the counter anion, however the trend was weaker, the De values
varied in the order of Fe-NU-1000 ≈ Ru-NU-1000 < Os-NU-1000.
Figure 4.4. Left: The current - time response (I vs. t) at an applied potential E, measured
in 0.1 M supporting electrolyte for the films of A) Fe-NU-1000, TBAPF6, B) Fe-NU-1000,
TBATFAB, C) Ru-NU-1000, TBAPF6, D) Ru-NU-1000, TBATFAB, E) Os-NU-1000, TBAPF6,
F) Os-NU-1000, TBATFAB. Black: Experimental response, Blue: Model fitting Stage A Equation
(2), Red: Model fitting Stage C Equation (4.6). Right: Chronoamperometric response expressed
as a I√t vs.√t plot at an applied potential E, measured in 0.1 M supporting electrolyte for the films
of G) Fe-NU-1000, TBAPF6, H) Fe-NU-1000, TBATFAB, I) Ru-NU-1000, TBAPF6, J) Ru-NU-
1000, TBATFAB, K) Os-NU-1000, TBAPF6, L) Os-NU-1000, TBATFAB.

120
Noteworthy, the electronic diffusion (De) was considerably faster in PF61- based electrolyte
than in TFAB1- for all the M-NU-1000 (M = Fe, Ru, Os) thin films (Figure 4.5- Stage A). This fact
suggests that the smaller volume of PF61- relative to TFAB1- facilitated the faster electron transport
across the metallocene centers. Similarly, and perhaps unsurprisingly, the ionic diffusion (Di) was
faster for PF61- compared to TFAB1-, due to its smaller ionic radius (Figure 4.5- Stage A). In
summary, the redox hopping in stage A is dominated by electron hopping along the crystal
boundary.
4.4.2 Stage B
The moment when all the redox centers in the electrolyte-crystal interface are converted,
corresponds to the maximum of the I√t vs.√t curve (Figure 4.3C, and Figure 4.4 G-L). At this
point, Eq. 4.2 loses its validity as electrons reach a physical barrier (the crystal-solution interface),
and diffusion is no longer assumed unhindered.14 Therefore, the theoretical model developed by
Scholz et al.14 defined this maximum of the I√t vs.√t curves (Figure 4.3C), as a characteristic time
tref, that follows the mathematical expression:
(4.4)
where H is the thickness of the MOF particles (1 µm, according to SEM images, Figure S4.2).
As a result, the current detected at this time (Iref) can be expressed as:14
(4.5)
The diffusion coefficients (De and Di) in Stage B were calculated using Eq.4.4 and Eq.4.5
and are summarized in Figure 4.5 and Table 4.1. Since the process is limited by ion movement,
the values of De (≈ 10-9 - 10-10) were again found to be higher than those of Di (≈ 10-11 - 10-14) for
all the metallocenes in both electrolytes. Importantly, the De values in Stage B are lower than those

121
obtained in Stage A, which is a consequence of electrons reaching the crystal-solution interface as
a physical barrier. Also, the overall ionic diffusion (Di) has increased across the series in Stage B
compared to Stage A, demonstrating that ions were initially slower to move from the electrolyte
to the crystal surface to satisfy the electroneutrality requirement in Stage A, but started to navigate
faster on the MOF channels once inside the MOF particle (Stage B).
One of the key conclusions of this modelling was that the principal trends in diffusion
coefficients observed for the M-NU-1000 (M = Fe, Ru, Os) thin films in Stage A remained largely
unchanged in Stage B (Figure 4.5). In particular, the electronic diffusion (De) also varied as a
function of the metallocene self-exchange rate. The De values in PF61- based electrolyte, increased
in the order Fe-NU-1000 < Ru-NU-1000 < Os-NU-1000. While using TFAB1- as the counter
anion, the as the order was Fe-NU-1000 < Ru-NU-1000 ≈ Os-NU-1000, which could be attributed
to the retardation of the electron diffusion of Os-NU-1000 by the slower diffusion of TFAB1- inside
the framework (Figure 4.5 - Stage B). Moreover, the use of PF61- as the counter anion resulted in
generally faster electronic diffusion relative to TFAB1-, except for the Ru-NU-1000 thin films
(Figure 4.5 - Stage B). Consequently, the electron transport across the metallocene centers of the
Fe and Os analogues appeared to be maximized in the presence of the smaller counter anion. As
for the ionic diffusion (Di), it is evident that the PF61- anion has higher mobility than TFAB1- as
they infiltrate inside the MOF particles (Figure 4.5 - Stage B).
Remarkably, the similarities in the diffusion coefficient trends (De and Di) for the M-NU-
1000 (M = Fe, Ru, Os) thin films at both Stage A and Stage B, suggest that the redox hopping rate
can be modulated (and potentially maximized) through the incorporation of molecular moieties
with rapid self-exchange rates into the MOF structure containing large channels, as well as
employing electrolytes based on smaller counter ions.

122
Figure 4.5. Summary of the diffusion coefficients for M-NU-1000 (M = Fe, Ru, Os) thin
films in PF61-and TFAB1- based electrolytes at the three reaction stages. Stage A: Electronic
diffusion coefficient De (Top left), ionic diffusion coefficient Di (Top right). Stage B: Electronic
diffusion coefficient De (Middle left), ionic diffusion coefficient Di (Middle right). Stage C: Ionic
diffusion coefficient Di (Bottom right).
4.4.3 Stage C
After the rapid exhaustion of the metallocene centers at the electrolyte-crystal interface
(maximum of the I√t vs.√t curve, or Stage B), the further course of the reaction into the crystal
bulk is controlled by the ability of ions to propagate into the MOF interior and provide the charge
balance (Stage C). More specifically, during this final stage the electrochemical reaction front
123
spreads deeper into the crystallites, where the ion migration trough the framework channels
becomes extremely important (Figure 4.3C and Figure 4.4 G-L).
During this stage, the ions diffuse into the bulk of the MOF particles trough a large
electrolyte-crystal interface, as compared to the thickness of the film. Therefore, the last period of
the electrochemical conversion is determined by the dimensions of the MOF crystallites. As a
consequence, the chronoamperometric curves for Stage C can be modeled exclusively in terms of
the ionic diffusion coefficients (Di), and the crystal dimensions:14
(4.6)
where L and B are the average length and the average width of the MOF particles, respectively
(according to SEM images, Figure S4.3). It is important to note that Eq. 4.6 has been developed
for the very last segment of Stage C, where the total conversion of the crystal is higher than 99%
(Figure 4.3C).14
The fitting of Eq. 4.6 to the current- time response (I vs. t) of all the M-NU-1000 (M = Fe,
Ru, Os) thin films in both electrolytes is shown in Figures 4.4 A-F (red traces). A generally good
fit (R2 > 90%, see SI) was achieved for the majority of the films, evidencing a good agreement
between the experimental data and the theoretical model. The diffusion coefficients obtained in
Stage C are presented in Figure 4.5 and summarized in Table 4.1.
The values of Di in this final stage are higher than those obtained in both Stage A and Stage
B, for all the M-NU-1000 (M = Fe, Ru, Os) thin films, demonstrating again that once the ions have
satisfied the electroneutrality in the crystal-solution interface, ionic diffusion is enhanced inside
the crystallite particle through the MOF channels (Figure 4.5- Stage C). Since the last segment of
Stage C represents the moment of 99% of conversion, the values obtained for Di describe an instant
where the diffusion conditions are similar to a typical twin-electrode thin film cell, and the

124
electroneutrality requirement is almost totally satisfied across the particle. Only the Di of the Ru-
NU-1000 thin film in the presence of PF61- appears to diminish from Stage B to Stage C. However,
this particular combination exhibited abnormally high ionic diffusion in the earlier stages.
Table 4.1. Summary of the electronic (De) and ionic (Di) diffusion coefficients for M-NU-
1000 (M = Fe, Ru, Os) thin films in PF61-and TFAB1-based electrolytes
Stage A
De (cm2 s-1) Di (cm2 s-1)
PF61- TFAB1- PF6
1- TFAB1-
Fe (9.99 ± 7.75) × 10-7 (3.94 ± 1.64) × 10-7 (4.01 ± 1.88) × 10-17 (1.47 ± 1.23) × 10-17
Ru (1.52 ± 1.13) × 10-5 (8.22 ± 2.33) × 10-8 (9.92 ± 7.03) × 10-15 (1.88 ± 2.76) × 10-18
Os (2.34 ± 1.33) × 10-5 (1.75 ± 1.37) × 10-5 (8.40 ± 4.62) × 10-18 (1.00 ± 1.01) × 10-17
Stage B
De (cm2 s-1) Di (cm2 s-1)
PF61- TFAB1- PF6
1- TFAB1-
Fe (1.08 ± 0.56) × 10-9 (4.34 ± 1.50) × 10-10 (3.72 ± 3.23) × 10-13 (1.42 ± 1.11) × 10-13
Ru (1.83 ± 0.38) × 10-9 (4.05 ± 1.02) × 10-9 (3.88 ± 2.36) × 10-11 (1.32 ± 0.21) × 10-14
Os (3.88 ± 0.73) × 10-9 (3.67 ± 1.01) × 10-9 (3.21 ± 2.54) × 10-12 (2.72 ± 1.59) × 10-12
Stage C
Di (cm2 s-1)
PF61- TFAB1-
Fe (1.44 ± 0.55) × 10-11 (1.64 ± 0.30) × 10-11
Ru (5.08 ± 0.12) × 10-12 (1.22 ± 0.12) × 10-11
Os (5.12 ± 0.13) × 10-12 (5.23 ± 0.24) × 10-12
Interestingly, ionic diffusion correlated with the self-exchange rates of the metallocene
centers, despite occurring on a much slower timescale. The values decreased in the order Fe-NU-

125
1000 > Ru-NU-1000 > Os-NU-1000 for both electrolytes (Figure 4.5 - Stage C). Since it was
demonstrated in Stages A and B, that the electronic diffusion increased in the order Fe-NU-1000
< Ru-NU-1000 < Os-NU-1000, this result suggests that the ionic diffusion inside the MOF
channels is enhanced by the urge of satisfying the electroneutrality requirement in the redox nodes
showing the slower electronic diffusion. However, given the difference of orders of magnitude
between the electronic and ionic diffusion coefficients obtained in this study, and the fact that
equations developed for Stage C corresponds to the moment of 99% of conversion, this correlation
may be insignificant.14
4.5 CONCLUSION
In summary, the systematic variation of metallocene redox center and counter anions in a
series of chronoamperometry experiments allowed the elucidation of the relative contribution of
electronic and ionic diffusion in metallocene-doped NU-MOF thin films. Outstandingly, the trends
observed in the diffusion coefficients (De and Di) of these systems obtained in PF61- and TFAB1-
based electrolytes at the different stages of the electrochemical reaction, demonstrated that the
redox hopping rates inside frameworks can be controlled through the modifications of the self-
exchange rates of redox centers, the use of large MOF channels, and the utilization of smaller
counter anions. The successful application of a solid-state voltammetric model to the experimental
chronoamperometry data of MOF thin films, is a significant advancement to the understanding of
electron and ion mobility in the context of electrochemical experiments, and can be used to guide
further research into other redox-active MOFs.

126
4.6 SUPPORTING INFORMATION
4.6.1 Materials and Instrumentation
4.6.1.1 Materials
All reagents and solvents were purchased from commercial sources and used without
further purification.
4.6.1.2 Nuclear Magnetic Resonance (NMR)
1H NMR spectra were acquired on a Agilent U4-DD2 spectrometer operating at 400 MHz.
Samples were analyzed as solutions in DMSO-d6 (ca. 10 mg mL−1) at 25 °C in standard 5 mm o.d.
tubes.
4.6.1.3 Powder X-Ray Diffraction (PXRD)
PXRD measurements were carried out on a Rigaku Miniflex equipped with a Cu(Kα)
radiation source (λ=1.5418 Å). The scanning rate was 1°/min using a 2θ range of 3- 50° on
continuous mode. The samples were mounted onto reflective disks with a Si (510) surface.
4.6.1.4 Scanning Electron Microscopy (SEM)
A LEO (Zeiss) 1550 high-performance Schottky field-emission scanning electron
microscope equipped with an in-lens detector was used at 5.0 kV to obtain high-resolution images
of the MOFs.
4.6.1.5 Electrochemistry
All electrochemical experiments were performed in a BASi EC Epsilon potentiostat using
a standard three-electrode configuration: The M-NU-1000 (M=Fe, Ru, Os) thin films as a working
electrode, a high surface area Pt mesh as the counter electrode, and a non-aqueous Ag/Ag+
reference electrode (0.1 M TBAPF6). Ferrocene was used to calibrate the reference electrode with
all the potentials reported vs Fc/Fc+.
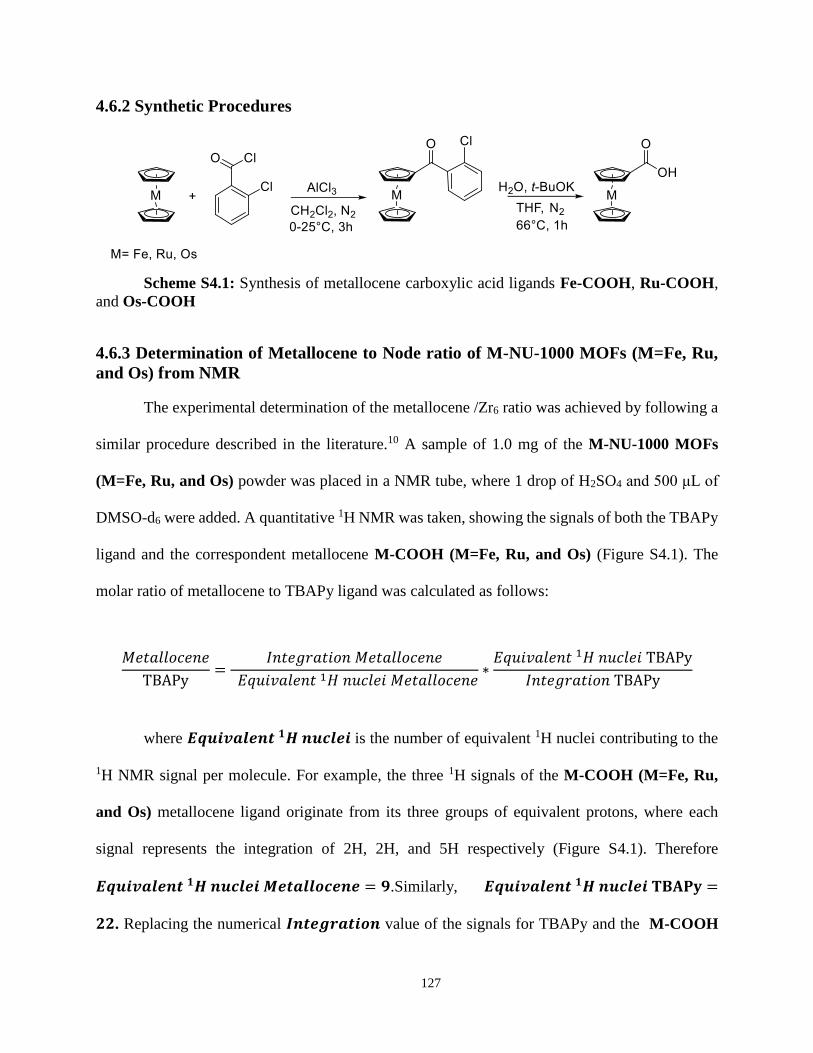
127
4.6.2 Synthetic Procedures
Scheme S4.1: Synthesis of metallocene carboxylic acid ligands Fe-COOH, Ru-COOH,
and Os-COOH
4.6.3 Determination of Metallocene to Node ratio of M-NU-1000 MOFs (M=Fe, Ru,
and Os) from NMR
The experimental determination of the metallocene /Zr6 ratio was achieved by following a
similar procedure described in the literature.10 A sample of 1.0 mg of the M-NU-1000 MOFs
(M=Fe, Ru, and Os) powder was placed in a NMR tube, where 1 drop of H2SO4 and 500 μL of
DMSO-d6 were added. A quantitative 1H NMR was taken, showing the signals of both the TBAPy
ligand and the correspondent metallocene M-COOH (M=Fe, Ru, and Os) (Figure S4.1). The
molar ratio of metallocene to TBAPy ligand was calculated as follows:
𝑀𝑒𝑡𝑎𝑙𝑙𝑜𝑐𝑒𝑛𝑒
TBAPy=
𝐼𝑛𝑡𝑒𝑔𝑟𝑎𝑡𝑖𝑜𝑛 𝑀𝑒𝑡𝑎𝑙𝑙𝑜𝑐𝑒𝑛𝑒
𝐸𝑞𝑢𝑖𝑣𝑎𝑙𝑒𝑛𝑡 1𝐻 𝑛𝑢𝑐𝑙𝑒𝑖 𝑀𝑒𝑡𝑎𝑙𝑙𝑜𝑐𝑒𝑛𝑒∗
𝐸𝑞𝑢𝑖𝑣𝑎𝑙𝑒𝑛𝑡 1𝐻 𝑛𝑢𝑐𝑙𝑒𝑖 TBAPy
𝐼𝑛𝑡𝑒𝑔𝑟𝑎𝑡𝑖𝑜𝑛 TBAPy
where 𝑬𝒒𝒖𝒊𝒗𝒂𝒍𝒆𝒏𝒕 𝟏𝑯 𝒏𝒖𝒄𝒍𝒆𝒊 is the number of equivalent 1H nuclei contributing to the
1H NMR signal per molecule. For example, the three 1H signals of the M-COOH (M=Fe, Ru,
and Os) metallocene ligand originate from its three groups of equivalent protons, where each
signal represents the integration of 2H, 2H, and 5H respectively (Figure S4.1). Therefore
𝑬𝒒𝒖𝒊𝒗𝒂𝒍𝒆𝒏𝒕 𝟏𝑯 𝒏𝒖𝒄𝒍𝒆𝒊 𝑴𝒆𝒕𝒂𝒍𝒍𝒐𝒄𝒆𝒏𝒆 = 𝟗.Similarly, 𝑬𝒒𝒖𝒊𝒗𝒂𝒍𝒆𝒏𝒕 𝟏𝑯 𝒏𝒖𝒄𝒍𝒆𝒊 𝐓𝐁𝐀𝐏𝐲 =
𝟐𝟐. Replacing the numerical 𝑰𝒏𝒕𝒆𝒈𝒓𝒂𝒕𝒊𝒐𝒏 value of the signals for TBAPy and the M-COOH
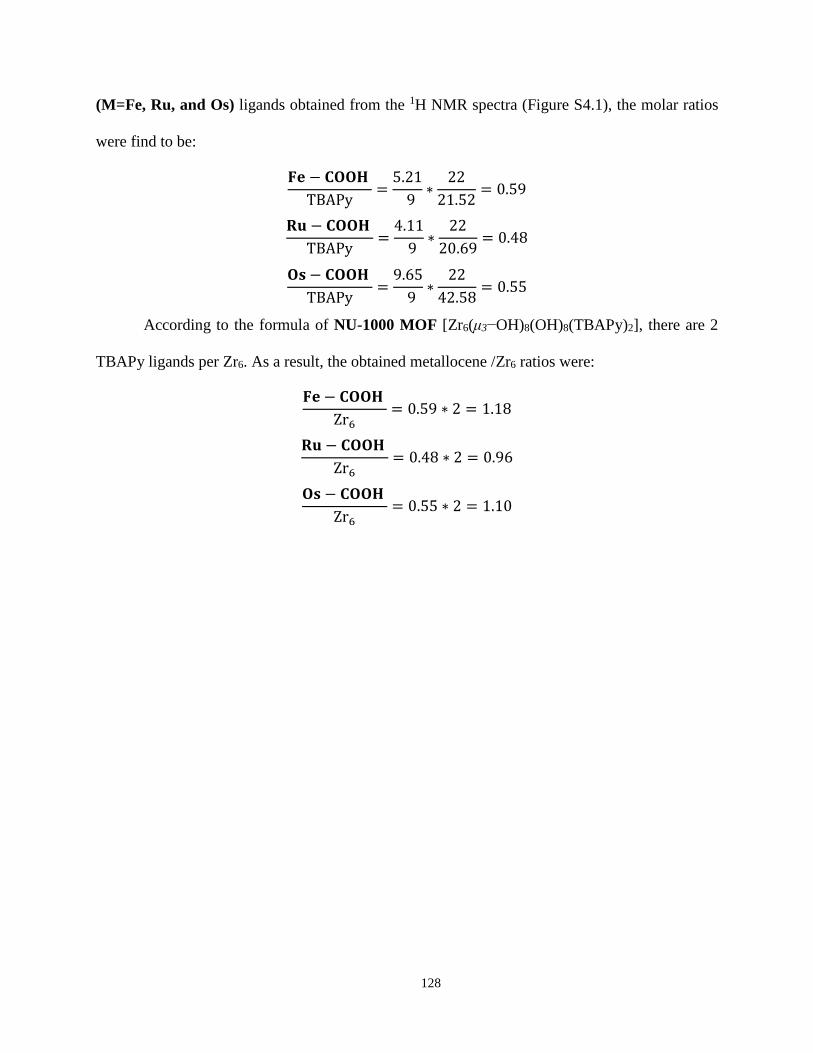
128
(M=Fe, Ru, and Os) ligands obtained from the 1H NMR spectra (Figure S4.1), the molar ratios
were find to be:
𝐅𝐞 − 𝐂𝐎𝐎𝐇
TBAPy=
5.21
9∗
22
21.52= 0.59
𝐑𝐮 − 𝐂𝐎𝐎𝐇
TBAPy=
4.11
9∗
22
20.69= 0.48
𝐎𝐬 − 𝐂𝐎𝐎𝐇
TBAPy=
9.65
9∗
22
42.58= 0.55
According to the formula of NU-1000 MOF [Zr6(μ3−OH)8(OH)8(TBAPy)2], there are 2
TBAPy ligands per Zr6. As a result, the obtained metallocene /Zr6 ratios were:
𝐅𝐞 − 𝐂𝐎𝐎𝐇
Zr6= 0.59 ∗ 2 = 1.18
𝐑𝐮 − 𝐂𝐎𝐎𝐇
Zr6= 0.48 ∗ 2 = 0.96
𝐎𝐬 − 𝐂𝐎𝐎𝐇
Zr6= 0.55 ∗ 2 = 1.10
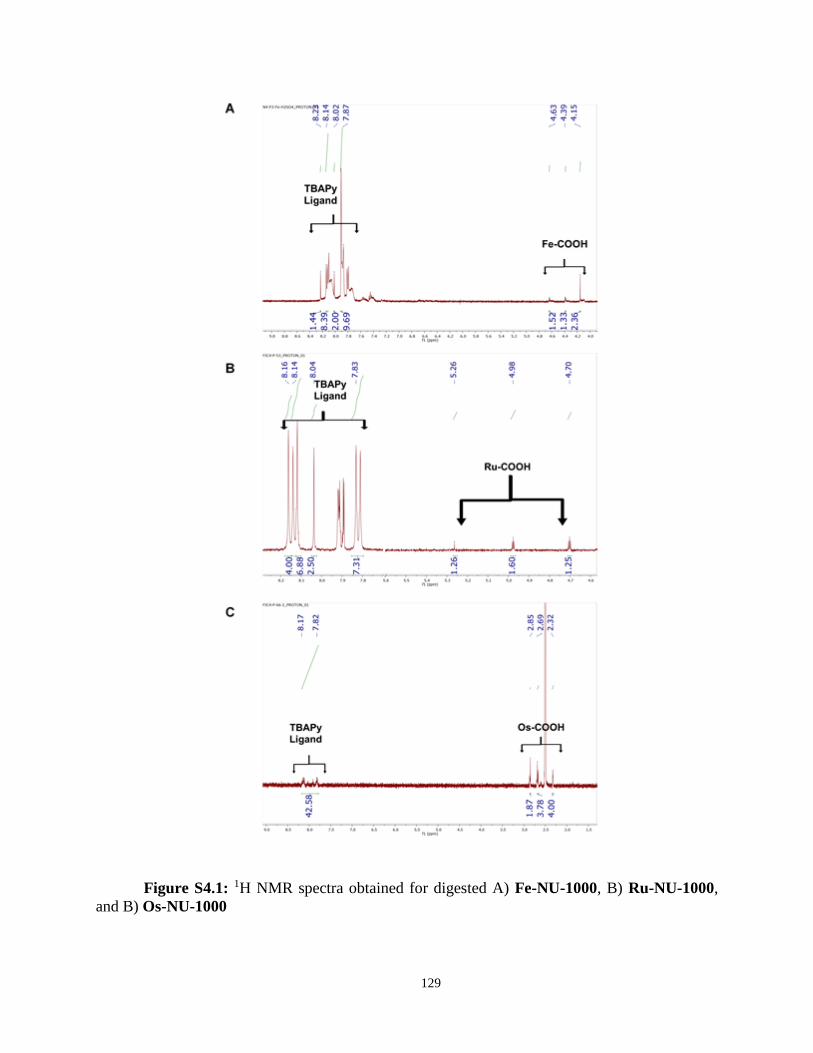
129
Figure S4.1: 1H NMR spectra obtained for digested A) Fe-NU-1000, B) Ru-NU-1000,
and B) Os-NU-1000

130
4.6.4 Scanning Electron Microscopy (SEM) Images
Figure S4.2: SEM side image of a film displaying a thickness of ≈ 1µm
Figure S4.3: SEM image of NU-1000 microcrystals across the film surface

131
Figure S4.4: SEM image of NU-1000 microcrystals across the film surface. ImageJ
program was used to calculate the average perimeter of a rod, and the number of rods per unit of
area.
4.6.5 Electrochemical Methods
Analyses were performed in a standard three-electrode array: The M-NU-1000 (M=Fe, Ru,
Os) thin film as a working electrode, a Pt mesh as the counter electrode, and a non-aqueous Ag/Ag+
reference electrode (0.1 M TBAPF6 in Acetonitrile). Solutions of either 0.1M TBAPF6 or 0.1M
TBATFAB in dry DCM (10.0 mL) were used as the supporting electrolyte. The TBAPF6
electrolyte was previously recrystallized in ethyl acetate. Before the experiment was carried out,
Argon was bubbled for 10 minutes to the solution, and then left flowing in the head-space of the
cell while running the experiment.
For each of the six combinations of metallocene-counter anion couples, the cyclic
voltammetry and chronoamperometry experiments were repeated four times on different films,
and using fresh electrolyte solution.

132
4.6.5.1 Cyclic voltammetry analysis
Cyclic voltammograms were collected at a scan rate of 100 mV s-1 for 12 cycles.
4.6.5.2 Chronoamperometry analysis – DC Potential Amperometry (DCPA)
Chronoamperometry experiments were carried out by holding the film at a potential just
below the redox peak for 20 min, and subsequently, applying a potential above the oxidation
process (as determined from CV experiments) during other 20 min. The current vs. time (I vs. t)
plots for the latter period were obtained.
4.6.6 Determination of De and Di based on the Sholtz model of solid state voltammetry
of microcrystals14
4.6.6.1 Step by step sample calculation of the model using a Fe-NU-1000 thin film
The current vs. time (I vs. t) plot obtained for one of the four Fe-NU-1000 thin films (Fe-
NU-1000-1) in TBAPF6 is presented in Figure S4.5-A. This chronoamperometric response was
plotted as a I√t vs.√t plot (Figure S4.5-B) were the three stages (denoted as A, B, and C) are
illustrated.
Figure S4.5: A) The current - time response (I vs. t) at an applied potential E, measured in
0.1 M TBAPF6 supporting electrolyte for the film Fe-NU-1000-1. Black: Experimental response,
Blue: Model fitting Stage A Equation (4.2), Red: Model fitting Stage C Equation (4.6). B)
Chronoamperometric response expressed as a I√t vs.√t plot at an applied potential E, measured in
0.1 M TBAPF6 supporting electrolyte for the film Fe-NU-1000-1

133
4.6.6.1.1 Stage A
As described in the manuscript, equation (4.2) is characteristic for Stage A:
(4.2)
(4.3)
The variables are defined as:
F: Faraday’s constant = 96485.3329 C/mol
R: Gas constant = 8.314 J/mol K
T: Temperature = 298.15 K
Ef: Formal potential (E1/2 from CV) = 0.21535 V
E: applied potential = 0.512 V
Therefore,
φ = 11.56 (dimensionless)
Vm: molar volume of NU-1000 MOF = 4609.598 cm3/mol
(from NU-1000 MOF density d = 0.473 g/cm3, and molar mass MM = 2180.34 g/mol; Vm = MM/d)
N: number of MOF crystallites in the film = 4.40 E6
(from SEM image shown in Figure S4.4. Using ImageJ program, the area of all rods in the image
is determined as 956.581 µm2, and the area of one rod is 18.789 µm2. Therefore, there are
approximately 50.912 rods in the image. The total area of the image is 2314.903 µm2 and the film
has an area of 2.00 E8 µm2. Consequently, a film will contain 8.64 E4 images. Therefore, there
are 4.40 E6 rods in the film.)

134
u: the length of the three-phase junction or perimeter of the electrode-crystal interface in one single
crystallite= 2.68E-03 cm
(from SEM image shown in Figure S4.4. Using ImageJ program, the perimeter of one rod is 26.8
µm)
Δx0: the distance an ion travels in one hopping step = 8.639 E-08 cm
(from NU-1000 MOF crystal structure, see Figure S4.6)
Δz0: the distance an electron travels in one hopping step = 1.234 E-07 cm
(from NU-1000 MOF crystal structure, see Figure S4.6)
Using all the previously defined variables, equation (4.2) can be expressed as:
𝐼(𝑡) = 9.21 ∗ 107 [2.68 ∗ 10−3 ((8.64 ∗ 10−8√𝐷𝑒 + 1.23 ∗ 10−7√𝐷𝑖
3.55√𝑡) + √𝐷𝑒𝐷𝑖) − 4𝐷𝑖√2𝐷𝑒𝑡]
(
(4.2)
The latter expression was used to fit only the data correspondent for Stage A in the current
- time response (I vs. t) plot. From Figure S4.5-B, it was determined that the maximum occurred
at √t = 2.6 s1/2. Therefore, t = 6.76 s, and the expression was fitted only for values from t =0 s to t
= 6.76 s in the (I vs. t) plot. The fit is shown as a blue trace in Figure S4.5-A. The diffusion
coefficient obtained are:
De = 8.65 E-07 cm2/s
Di = 6.85 E-17 cm2/s
with an R2 value of 0.97.

135
Figure S4.6: Crystal structure of NU-1000 MOF. The hexagonal rods grow along the c
axis, across the film surface. Therefore, Δx0 is 8.639 Å and Δz0 is 12.340 Å
4.6.6.1.2 Stage B
As described in the manuscript, the maximum of the I√t vs.√t curves (Figure S4.5-B),
corresponds to a characteristic time (tref, Iref) in the (I vs. t) plot (Figure S4.5-A), that is defined by
the following equations (4.4) and (4.5):
(
(4.4)
(
(4.5)
All the variables are defined previously is Stage A, excepting:
H: thickness of the MOF particles = 1 µm
(from SEM images, Figure S4.2)

136
From Figure S4.5-B, it was determined that the maximum occurred at √t = 2.6 s1/2.
Therefore, tref = 6.76 s. Using this value and the thickness of the film (H) in equation (4.4), the De
value in Stage B was obtained as:
De = 1.34 E-09 cm2/s
From Figure S4.5-B, it was determined that at tref = 6.76 s., the current value was Iref = 3.79
E-6. Using this value in equation (4.5), and all the variables previously defined the Di value was
calculated as:
Di = 3.38 E-13cm2/s
4.6.6.1.3 Stage C
As described in the manuscript, equation (4.6) is characteristic for Stage C:
(4.6)
All the variables are defined in the previous stages, excepting:
L: average length of the MOF particles = 11.59 µm
(from SEM images, Figure S4.3)
B: average width of the MOF particles = 1.7 µm
(from SEM images, Figure S4.3)
Replacing all the known numerical variables, equation (4.6) can be expressed as:

137
𝐼(𝑡) = (6.28 ∗ 104𝐷𝑖)𝑒𝑥𝑝[−3.42 ∗ 108𝐷𝑖𝑡] (
(4.6)
The latter expression was used to fit only the data correspondent for Stage C in the current
- time response (I vs. t) plot. The Sholtz model14 has specified that equation (4.6) has been
developed for the very last segment of Stage C, where the total conversion of the crystal is higher
than 99%. For all the films on this study, it was assumed that the very end of the conversion
occurred at √t = 20 s1/2 (Figure S4.5-B). Therefore, the expression was fitted only for values from
t = 400 to the end of the conversion in the (I vs. t) plot. The fit is shown as a red trace in Figure
S4.5-A. The diffusion coefficient obtained was:
Di = 1.52 E-11 cm2/s
with an R2 value of 0.88.
4.6.6.2 Statistical error on the De and Di values calculated in each stage
The chronoamperometry experiments were repeated four or three times on different films
for each of the metallocene-counter anion combinations. The average and standard deviation of
the De and Di values were calculated, at each stage. Also, the R2 values obtained for the fitting of
equation (4.2) in Stage A, and equation (4.6) in Stage C are presented in Table S4.1:

138
Table S4.1. Summary of the average, standard deviation, and R2 fitting values for the
electronic (De) and ionic (Di) diffusion coefficients for M-NU-1000 (M = Fe, Ru, Os) thin films
in PF61-and TFAB1-based electrolytes.
Stage A
PF61- TFAB1-
Film De (cm2 s-1) Di (cm2 s-1) Equation (2) R2 Film De (cm2 s-1) Di (cm2 s-1) Equation (2) R2
Fe-1 8.65 × 10⁻⁷ 6.85 × 10⁻¹⁷ 0.97 Fe-5 3.54 × 10⁻⁷ 6.18 × 10⁻¹⁸ 0.98
Fe-2 1.07 × 10⁻⁷ 1.59 × 10⁻¹⁷ 0.98 Fe-6 6.38 × 10⁻⁷ 3.46 × 10⁻¹⁷ 0.96
Fe-3 2.24 × 10⁻⁶ 3.54 × 10⁻¹⁷ 0.96 Fe-7 4.04 × 10⁻⁷ 1.48 × 10⁻¹⁷ 0.99
Fe-4 7.83 × 10⁻⁷ 4.07 × 10⁻¹⁷ 0.98 Fe-8 1.78 × 10⁻⁷ 3.22 × 10⁻¹⁸ 0.99
Average 9.99 × 10⁻⁷ 4.01 × 10⁻¹⁷
Average 3.94 × 10⁻⁷ 1.47 × 10⁻¹⁷
Standard
Deviation
7.75 × 10⁻⁷ 1.88 × 10⁻¹⁷ Standard
Deviation
1.64 × 10⁻⁷ 1.23 × 10⁻¹⁷
PF61- TFAB1-
Film De (cm2 s-1) Di (cm2 s-1) Equation (2) R2 Film De (cm2 s-1) Di (cm2 s-1) Equation (2) R2
Ru-1 1.30 × 10⁻⁵ 6.77 × 10⁻¹⁵ 0.92 Ru-5 8.44 × 10⁻⁸ 6.62 × 10⁻¹⁸ 1.00
Ru-2 3.43 × 10⁻⁵ 4.62 × 10⁻¹⁸ 0.99 Ru-6 8.20 × 10⁻⁸ 1.27 × 10⁻³⁴ 0.99
Ru-3 6.96 × 10⁻⁶ 1.51 × 10⁻¹⁴ 0.90 Ru-7 4.82 × 10⁻⁸ 3.05 × 10⁻³⁴ 0.99
Ru-4 6.56 × 10⁻⁶ 1.80 × 10⁻¹⁴ 0.70 Ru-8 1.14 × 10⁻⁷ 8.90 × 10⁻¹⁹ 1.00
Average 1.52 × 10⁻⁵ 9.92 × 10⁻¹⁵
Average 8.22 × 10⁻⁸ 1.88 × 10⁻¹⁸
Standard
Deviation
1.13 × 10⁻⁵ 7.03 × 10⁻¹⁵ Standard
Deviation
2.33 × 10⁻⁸ 2.76 × 10⁻¹⁸
PF61- TFAB1-
Film De (cm2 s-1) Di (cm2 s-1) Equation (2) R2 Film De (cm2 s-1) Di (cm2 s-1) Equation (2) R2
Os-1 8.16 × 10⁻⁶ 2.78 × 10⁻¹⁸ 0.99 Os-5 4.02 × 10⁻⁵ 9.28 × 10⁻³³ 0.99
Os-2 4.06 × 10⁻⁵ 8.31 × 10⁻¹⁸ 0.99 Os-6 4.03 × 10⁻⁶ 2.19 × 10⁻¹⁸ 1.00
Os-3 2.14 × 10⁻⁵ 1.41 × 10⁻¹⁷ 0.99 Os-7 1.04 × 10⁻⁵ 2.57 × 10⁻¹⁷ 0.99

139
Os-4 Os-8 1.53 × 10⁻⁵ 1.21 × 10⁻¹⁷ 0.99
Average 2.34 × 10⁻⁵ 8.40 × 10⁻¹⁸
Average 1.75 × 10⁻⁵ 1.00 × 10⁻¹⁷
Standard
Deviation
1.33 × 10⁻⁵ 4.62 × 10⁻¹⁸ Standard
Deviation
1.37 × 10⁻⁵ 1.01 × 10⁻¹⁷
Stage B
PF61- TFAB1-
Film De (cm2 s-1) Di (cm2 s-1) Film De (cm2 s-1) Di (cm2 s-1)
Fe-1 1.34 × 10⁻⁹ 3.38 × 10⁻¹³ Fe-5 2.60 × 10⁻¹⁰ 9.37 × 10⁻¹⁴
Fe-2 5.68 × 10⁻¹⁰ 3.06 × 10⁻¹⁴ Fe-6 3.12 × 10⁻¹⁰ 3.28 × 10⁻¹³
Fe-3 5.41 × 10⁻¹⁰ 8.99 × 10⁻¹³ Fe-7 5.68 × 10⁻¹⁰ 1.13 × 10⁻¹³
Fe-4 1.88 × 10⁻⁹ 2.20 × 10⁻¹³ Fe-8 5.98 × 10⁻¹⁰ 3.30 × 10⁻¹⁴
Average 1.08 × 10⁻⁹ 3.72 × 10⁻¹³ Average 4.34 × 10⁻¹⁰ 1.42 × 10⁻¹³
Standard
Deviation
0.56 × 10⁻⁹ 3.23 × 10⁻¹³ Standard
Deviation
1.50 × 10⁻¹⁰ 1.11 × 10⁻¹³
PF61- TFAB1-
Film De (cm2 s-1) Di (cm2 s-1) Film De (cm2 s-1) Di (cm2 s-1)
Ru-1 1.34 × 10⁻⁹ 5.24 × 10⁻¹¹ Ru-5 2.27 × 10⁻⁹ 1.45 × 10⁻¹⁴
Ru-2 1.88 × 10⁻⁹ 5.84 × 10⁻¹¹ Ru-6 4.64 × 10⁻⁹ 1.03 × 10⁻¹⁴
Ru-3 2.27 × 10⁻⁹ 5.60 × 10⁻¹² Ru-7 4.64 × 10⁻⁹ 1.21 × 10⁻¹⁴
Ru-4 Ru-8 4.64 × 10⁻⁹ 1.58 × 10⁻¹⁴
Average 1.83 × 10⁻⁹ 3.88 × 10⁻¹¹ Average 4.05 × 10⁻⁹ 1.32 × 10⁻¹⁴
Standard
Deviation
0.38 × 10⁻⁹ 2.36 × 10⁻¹¹ Standard
Deviation
1.02 × 10⁻⁹ 0.21 × 10⁻¹⁴
PF61- TFAB1-
Film De (cm2 s-1) Di (cm2 s-1) Film De (cm2 s-1) Di (cm2 s-1)
Os-1 4.57 × 10⁻⁹ 1.23 × 10⁻¹² Os-5 4.64 × 10⁻⁹ 5.07 × 10⁻¹²
Os-2 4.64 × 10⁻⁹ 6.97 × 10⁻¹² Os-6 4.64 × 10⁻⁹ 5.93 × 10⁻¹³
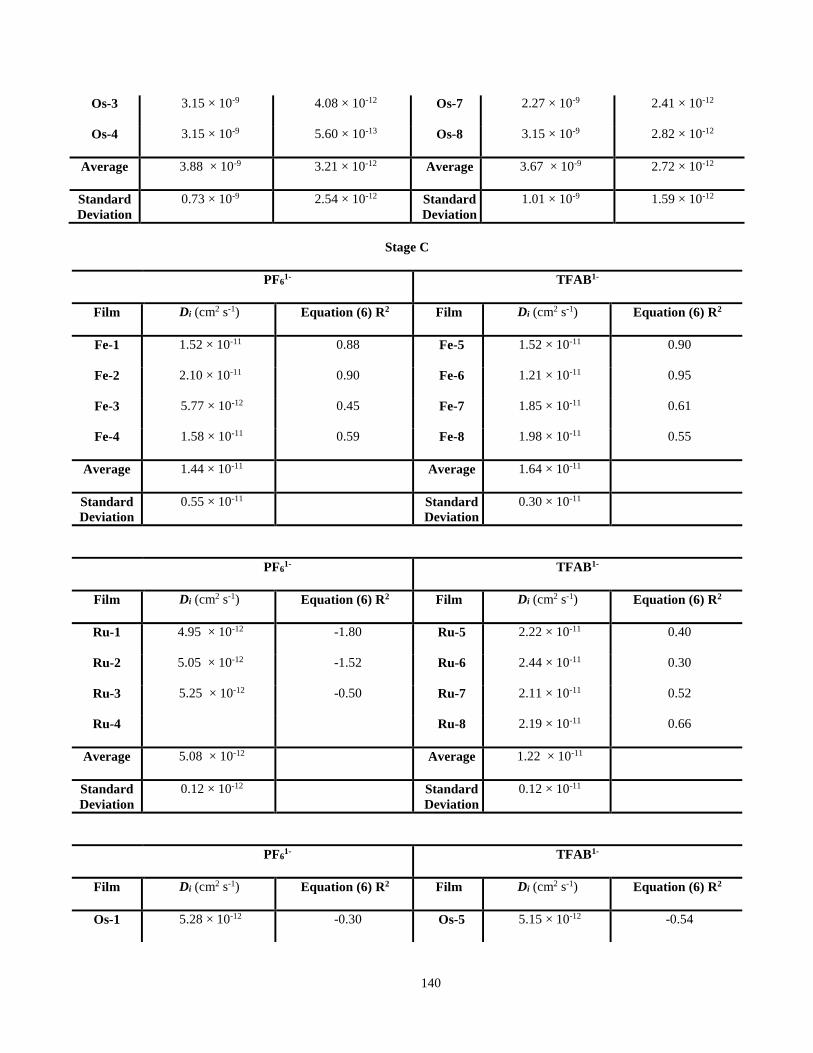
140
Os-3 3.15 × 10⁻⁹ 4.08 × 10⁻¹² Os-7 2.27 × 10⁻⁹ 2.41 × 10⁻¹²
Os-4 3.15 × 10⁻⁹ 5.60 × 10⁻¹³ Os-8 3.15 × 10⁻⁹ 2.82 × 10⁻¹²
Average 3.88 × 10⁻⁹ 3.21 × 10⁻¹² Average 3.67 × 10⁻⁹ 2.72 × 10⁻¹²
Standard
Deviation
0.73 × 10⁻⁹ 2.54 × 10⁻¹² Standard
Deviation
1.01 × 10⁻⁹ 1.59 × 10⁻¹²
Stage C
PF61- TFAB1-
Film Di (cm2 s-1) Equation (6) R2 Film Di (cm2 s-1) Equation (6) R2
Fe-1 1.52 × 10⁻¹¹ 0.88 Fe-5 1.52 × 10⁻¹¹ 0.90
Fe-2 2.10 × 10⁻¹¹ 0.90 Fe-6 1.21 × 10⁻¹¹ 0.95
Fe-3 5.77 × 10⁻¹² 0.45 Fe-7 1.85 × 10⁻¹¹ 0.61
Fe-4 1.58 × 10⁻¹¹ 0.59 Fe-8 1.98 × 10⁻¹¹ 0.55
Average 1.44 × 10⁻¹¹ Average 1.64 × 10⁻¹¹
Standard
Deviation
0.55 × 10⁻¹¹ Standard
Deviation
0.30 × 10⁻¹¹
PF61- TFAB1-
Film Di (cm2 s-1) Equation (6) R2 Film Di (cm2 s-1) Equation (6) R2
Ru-1 4.95 × 10⁻¹² -1.80 Ru-5 2.22 × 10⁻¹¹ 0.40
Ru-2 5.05 × 10⁻¹² -1.52 Ru-6 2.44 × 10⁻¹¹ 0.30
Ru-3 5.25 × 10⁻¹² -0.50 Ru-7 2.11 × 10⁻¹¹ 0.52
Ru-4 Ru-8 2.19 × 10⁻¹¹ 0.66
Average 5.08 × 10⁻¹² Average 1.22 × 10⁻¹¹
Standard
Deviation
0.12 × 10⁻¹² Standard
Deviation
0.12 × 10⁻¹¹
PF61- TFAB1-
Film Di (cm2 s-1) Equation (6) R2 Film Di (cm2 s-1) Equation (6) R2
Os-1 5.28 × 10⁻¹² -0.30 Os-5 5.15 × 10⁻¹² -0.54
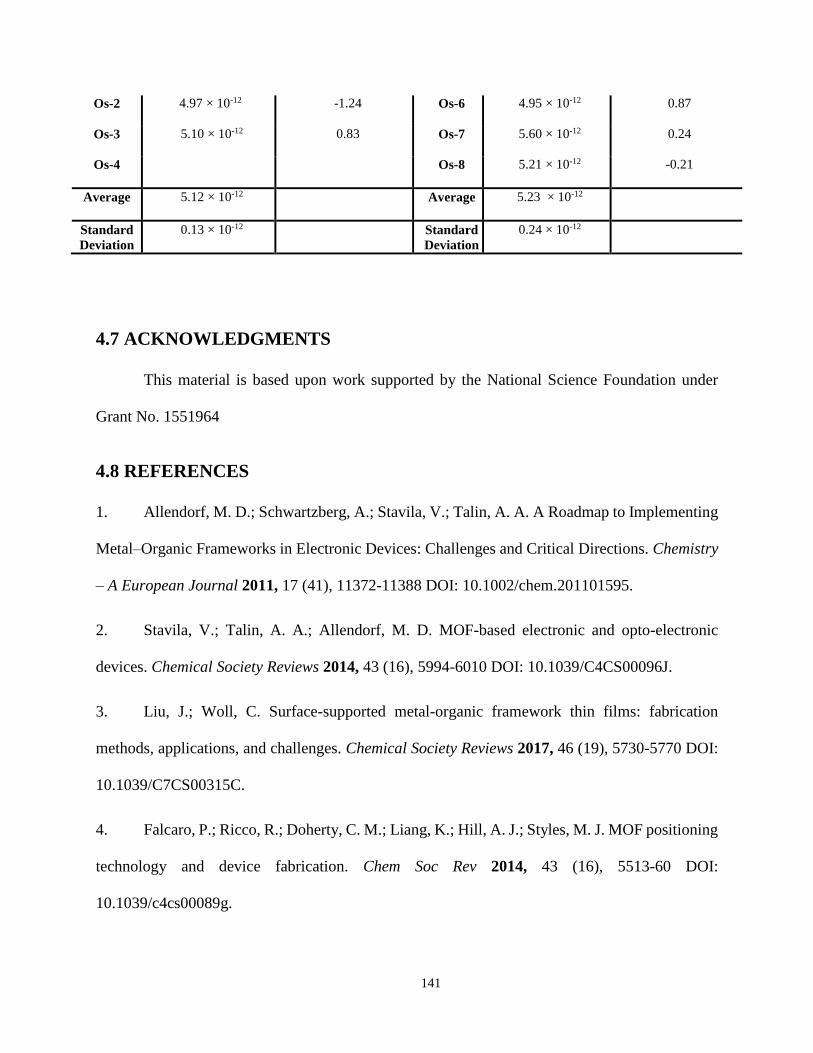
141
Os-2 4.97 × 10⁻¹² -1.24 Os-6 4.95 × 10⁻¹² 0.87
Os-3 5.10 × 10⁻¹² 0.83 Os-7 5.60 × 10⁻¹² 0.24
Os-4 Os-8 5.21 × 10⁻¹² -0.21
Average 5.12 × 10⁻¹² Average 5.23 × 10⁻¹²
Standard
Deviation
0.13 × 10⁻¹² Standard
Deviation
0.24 × 10⁻¹²
4.7 ACKNOWLEDGMENTS
This material is based upon work supported by the National Science Foundation under
Grant No. 1551964
4.8 REFERENCES
1. Allendorf, M. D.; Schwartzberg, A.; Stavila, V.; Talin, A. A. A Roadmap to Implementing
Metal–Organic Frameworks in Electronic Devices: Challenges and Critical Directions. Chemistry
– A European Journal 2011, 17 (41), 11372-11388 DOI: 10.1002/chem.201101595.
2. Stavila, V.; Talin, A. A.; Allendorf, M. D. MOF-based electronic and opto-electronic
devices. Chemical Society Reviews 2014, 43 (16), 5994-6010 DOI: 10.1039/C4CS00096J.
3. Liu, J.; Woll, C. Surface-supported metal-organic framework thin films: fabrication
methods, applications, and challenges. Chemical Society Reviews 2017, 46 (19), 5730-5770 DOI:
10.1039/C7CS00315C.
4. Falcaro, P.; Ricco, R.; Doherty, C. M.; Liang, K.; Hill, A. J.; Styles, M. J. MOF positioning
technology and device fabrication. Chem Soc Rev 2014, 43 (16), 5513-60 DOI:
10.1039/c4cs00089g.
142
5. Halls, J. E.; Jiang, D.; Burrows, A. D.; Kulandainathan, M. A.; Marken, F. In
Electrochemistry: Volume 12; The Royal Society of Chemistry: 2014; Vol. 12, pp 187-210.
6. Gándara, F.; Uribe-Romo, F. J.; Britt, D. K.; Furukawa, H.; Lei, L.; Cheng, R.; Duan, X.;
O'Keeffe, M.; Yaghi, O. M. Porous, Conductive Metal-Triazolates and Their Structural
Elucidation by the Charge-Flipping Method. Chemistry – A European Journal 2012, 18 (34),
10595-10601 DOI: 10.1002/chem.201103433.
7. Kobayashi, Y.; Jacobs, B.; Allendorf, M. D.; Long, J. R. Conductivity, Doping, and Redox
Chemistry of a Microporous Dithiolene-Based Metal−Organic Framework. Chemistry of
Materials 2010, 22 (14), 4120-4122 DOI: 10.1021/cm101238m.
8. Marshall, R. J.; Forgan, R. S. Postsynthetic Modification of Zirconium Metal-Organic
Frameworks. European Journal of Inorganic Chemistry 2016, 2016 (27), 4310-4331 DOI:
10.1002/ejic.201600394.
9. Lin, S.; Pineda-Galvan, Y.; Maza, W. A.; Epley, C. C.; Zhu, J.; Kessinger, M. C.; Pushkar,
Y.; Morris, A. J. Electrochemical Water Oxidation by a Catalyst-Modified Metal–Organic
Framework Thin Film. ChemSusChem 2017, 10 (3), 514-522 DOI: 10.1002/cssc.201601181.
10. Hod, I.; Bury, W.; Gardner, D. M.; Deria, P.; Roznyatovskiy, V.; Wasielewski, M. R.;
Farha, O. K.; Hupp, J. T. Bias-Switchable Permselectivity and Redox Catalytic Activity of a
Ferrocene-Functionalized, Thin-Film Metal–Organic Framework Compound. The Journal of
Physical Chemistry Letters 2015, 6 (4), 586-591 DOI: 10.1021/acs.jpclett.5b00019.
11. Sun, L.; Miyakai, T.; Seki, S.; Dincă, M. Mn2(2,5-disulfhydrylbenzene-1,4-dicarboxylate):
A Microporous Metal–Organic Framework with Infinite (−Mn–S−)∞ Chains and High Intrinsic

143
Charge Mobility. Journal of the American Chemical Society 2013, 135 (22), 8185-8188 DOI:
10.1021/ja4037516.
12. Narayan, T. C.; Miyakai, T.; Seki, S.; Dincă, M. High Charge Mobility in a
Tetrathiafulvalene-Based Microporous Metal–Organic Framework. Journal of the American
Chemical Society 2012, 134 (31), 12932-12935 DOI: 10.1021/ja3059827.
13. Ahrenholtz, S. R.; Epley, C. C.; Morris, A. J. Solvothermal Preparation of an
Electrocatalytic Metalloporphyrin MOF Thin Film and its Redox Hopping Charge-Transfer
Mechanism. Journal of the American Chemical Society 2014, 136 (6), 2464-2472 DOI:
10.1021/ja410684q.
14. Schröder, U.; Oldham, K. B.; Myland, J. C.; Mahon, P. J.; Scholz, F. Modelling of solid
state voltammetry of immobilized microcrystals assuming an initiation of the electrochemical
reaction at a three-phase junction. Journal of Solid State Electrochemistry 2000, 4 (6), 314-324
DOI: 10.1007/s100080000130.
15. Hod, I.; Farha, O. K.; Hupp, J. T. Modulating the rate of charge transport in a metal-organic
framework thin film using host:guest chemistry. Chemical Communications 2016, 52 (8), 1705-
1708 DOI: 10.1039/C5CC09695B.
16. Swarts, J. C.; Nafady, A.; Roudebush, J. H.; Trupia, S.; Geiger, W. E. One-Electron
Oxidation of Ruthenocene: Reactions of the Ruthenocenium Ion in Gentle Electrolyte Media.
Inorganic Chemistry 2009, 48 (5), 2156-2165 DOI: 10.1021/ic802105b.
17. Zahl, A.; van Eldik, R.; Matsumoto, M.; Swaddle, T. W. Self-Exchange Reaction Kinetics
of Metallocenes Revisited: Insights from the Decamethylferricenium−Decamethylferrocene
144
Reaction at Variable Pressure. Inorganic Chemistry 2003, 42 (12), 3718-3722 DOI:
10.1021/ic030067y.
18. Hill, M. G.; Lamanna, W. M.; Mann, K. R. Tetrabutylammonium tetrakis[3,5-
bis(trifluoromethyl)phenyl]borate as a noncoordinating electrolyte: reversible 1e- oxidations of
ruthenocene, osmocene, and Rh2(TM4)42+ (TM4=2,5-diisocyano-2,5-dimethylhexane).
Inorganic Chemistry 1991, 30 (25), 4687-4690 DOI: 10.1021/ic00025a003.
19. Smith, T. P.; Iverson, D. J.; Droege, M. W.; Kwan, K. S.; Taube, H. Halogen-mediated
electron transfer between metallocenes of ruthenium and osmium in the oxidation states 4+ and
2+. Inorganic Chemistry 1987, 26 (17), 2882-2884 DOI: 10.1021/ic00264a033.
20. Engesser, T. A.; Lichtenthaler, M. R.; Schleep, M.; Krossing, I. Reactive p-block cations
stabilized by weakly coordinating anions. Chemical Society Reviews 2016, 45 (4), 789-899 DOI:
10.1039/C5CS00672D.
21. Reeves, P. C. Carboxylation of aromatic compounds: Ferrocenecarboxylic acid. Organic
Syntheses 1977, 56, 28 DOI: DOI: 10.15227/orgsyn.056.0028.
22. Stylianou, K. C.; Heck, R.; Chong, S. Y.; Bacsa, J.; Jones, J. T. A.; Khimyak, Y. Z.;
Bradshaw, D.; Rosseinsky, M. J. A Guest-Responsive Fluorescent 3D Microporous
Metal−Organic Framework Derived from a Long-Lifetime Pyrene Core. Journal of the American
Chemical Society 2010, 132 (12), 4119-4130 DOI: 10.1021/ja906041f.
23. Mondloch, J. E.; Bury, W.; Fairen-Jimenez, D.; Kwon, S.; DeMarco, E. J.; Weston, M. H.;
Sarjeant, A. A.; Nguyen, S. T.; Stair, P. C.; Snurr, R. Q.; Farha, O. K.; Hupp, J. T. Vapor-Phase
Metalation by Atomic Layer Deposition in a Metal–Organic Framework. Journal of the American
Chemical Society 2013, 135 (28), 10294-10297 DOI: 10.1021/ja4050828.
145
5. Conclusions and Future Work
In order to design MOFs as active materials to achieve efficient charge storage in electronic
devices, a deeper understanding on the electron, ion, and proton transport pathways in these
materials is needed. In the present work, we have demonstrated that proton-coupled electron
transport can be modulated in anthraquinone-based Zr MOFs as a function of the pH, and that
structural features such as the positioning of the quinone moiety with respect to the zirconium
node, the amount of defects, and the pore size of these materials are directly influencing the
transport properties of these frameworks. The observed possibility of proton transport in MOFs
through a cooperative behavior between the ligand and the inorganic node encourage further
research in this area, since proton transport plays an important role in many processes such as
enzymatic catalysis, where MOF materials are potential candidates.
The studies of quinone accessibility and specific capacitance in the two anthraquinone-
based Zr MOFs thin films and slurry modified electrodes, showed that the pKa of the frameworks,
the defectivity, and the stabilization through hydrogen bonding have also an important effect on
the percentage of quinones active and their ability to store charge in both type of electrodes. While
the anthraquinone MOF thin films displayed superior performance than the powder-based
electrodes, improving charge transport paths in the films through crystal engineering methods is
vital to exploit the potential of these materials as charge transport agents.
Remarkably, the systematic variation of metallocene redox center and counter anions in a
series of chronoamperometry experiments allowed the elucidation, for the first time, of the relative
contribution of electronic and ionic diffusion in metallocene-doped NU-MOF thin films. The
trends observed in the diffusion coefficients (De and Di) of these systems obtained in PF61- and
146
TFAB1- based electrolytes at the different stages of the electrochemical reaction, demonstrated that
the redox hopping rates inside frameworks can be controlled through the modifications of the self-
exchange rates of redox centers, the use of large MOF channels, and the utilization of smaller
counter anions. The results constitute a significant advancement to the understanding of electron
and ion mobility in the context of electrochemical experiments, and can be used to guide further
research into other redox-active MOFs. Specifically, we encourage research efforts on applying
the theoretical method utilized on the present work to experimental data of MOFs containing the
redox moieties in the ligand itself, and displaying different pore sizes.


![Metal–Organic Framework-Functionalized Alumina Membranes ... · Metal–organic frameworks (MOFs) are an emerging group of hybrid nano-porous materials [1,2]. Formed by assembling](https://static.fdocuments.in/doc/165x107/5fc16e685df9db35603021e7/metalaorganic-framework-functionalized-alumina-membranes-metalaorganic-frameworks.jpg)


![Water-resistant porous coordination polymers for gas separation · 2018. 1. 2. · Porous coordination polymers (PCPs) [1-3], also called metal-organic frameworks (MOFs) [4-6], are](https://static.fdocuments.in/doc/165x107/611cd0eb98ab880b2806476c/water-resistant-porous-coordination-polymers-for-gas-separation-2018-1-2-porous.jpg)