Investigation on the Vibration Effect of Shock Wave in ...
17
University of Wollongong University of Wollongong Research Online Research Online Faculty of Engineering and Information Sciences - Papers: Part B Faculty of Engineering and Information Sciences 2018 Investigation on the Vibration Effect of Shock Wave in Rock Burst by In Situ Investigation on the Vibration Effect of Shock Wave in Rock Burst by In Situ Microseismic Monitoring Microseismic Monitoring Mingshi Gao Xinjiang University, China University of Mining and Technology Hongchao Zhao University of Wollongong, Xinjiang University, [email protected] Yichao Zhao China University of Mining and Technology Xiaojun Gao China University of Mining and Technology Xiangyu Wang China University of Mining and Technology Follow this and additional works at: https://ro.uow.edu.au/eispapers1 Part of the Engineering Commons, and the Science and Technology Studies Commons Recommended Citation Recommended Citation Gao, Mingshi; Zhao, Hongchao; Zhao, Yichao; Gao, Xiaojun; and Wang, Xiangyu, "Investigation on the Vibration Effect of Shock Wave in Rock Burst by In Situ Microseismic Monitoring" (2018). Faculty of Engineering and Information Sciences - Papers: Part B. 1331. https://ro.uow.edu.au/eispapers1/1331 Research Online is the open access institutional repository for the University of Wollongong. For further information contact the UOW Library: [email protected]
Transcript of Investigation on the Vibration Effect of Shock Wave in ...

University of Wollongong University of Wollongong
Research Online Research Online
Faculty of Engineering and Information Sciences - Papers: Part B
Faculty of Engineering and Information Sciences
2018
Investigation on the Vibration Effect of Shock Wave in Rock Burst by In Situ Investigation on the Vibration Effect of Shock Wave in Rock Burst by In Situ
Microseismic Monitoring Microseismic Monitoring
Mingshi Gao Xinjiang University, China University of Mining and Technology
Hongchao Zhao University of Wollongong, Xinjiang University, [email protected]
Yichao Zhao China University of Mining and Technology
Xiaojun Gao China University of Mining and Technology
Xiangyu Wang China University of Mining and Technology
Follow this and additional works at: https://ro.uow.edu.au/eispapers1
Part of the Engineering Commons, and the Science and Technology Studies Commons
Recommended Citation Recommended Citation Gao, Mingshi; Zhao, Hongchao; Zhao, Yichao; Gao, Xiaojun; and Wang, Xiangyu, "Investigation on the Vibration Effect of Shock Wave in Rock Burst by In Situ Microseismic Monitoring" (2018). Faculty of Engineering and Information Sciences - Papers: Part B. 1331. https://ro.uow.edu.au/eispapers1/1331
Research Online is the open access institutional repository for the University of Wollongong. For further information contact the UOW Library: [email protected]

Investigation on the Vibration Effect of Shock Wave in Rock Burst by In Situ Investigation on the Vibration Effect of Shock Wave in Rock Burst by In Situ Microseismic Monitoring Microseismic Monitoring
Abstract Abstract Rock burst is a physical explosion associated with enormous damage at a short time. Due to the complicity of mechanics of rock burst in coal mine roadway, the direct use of traditional investigation method applied in tunnel is inappropriate since the components of surrounding rock are much more complex in underground than that of tunnel. In addition, the reliability of the results obtained through these methods (i.e., physical simulation, theoretical analysis, and monitoring in filed application) is still not certain with complex geological conditions. Against this background, present experimental study was first ever conducted at initial site to evaluate the effect of shock wave during the rock burst. TDS-6 microseismic monitoring system was set up in situ to evaluate the propagation of shock wave resulting in microexplosions of roadway surrounding rock. Various parameters including the distance of epicentre and the characteristic of response have been investigated. Detailed test results revealed that (1) the shock wave attenuated exponentially with the increase of the distance to seismic source according to the
equation of E=E0e-ηl; particularly, the amplitude decreased significantly after being 20 m apart from explosive resource and then became very weak after being 30 m apart from the seismic source; (2) the response mechanics are characteristic with large scatter based on the real location of surrounding rock despite being at the same section. That is, the surrounding rock of floor experienced serious damage, followed by ribs, the roof, and the humeral angles. This in situ experimental study also demonstrated that microseismic monitoring system can be effectively used in rock burst through careful setup and data investigation. The proposed in situ monitoring method has provided a new way to predict rock burst due to its simple instalment procedure associated with direct and reasonable experimental results.
Disciplines Disciplines Engineering | Science and Technology Studies
Publication Details Publication Details Gao, M., Zhao, H., Zhao, Y., Gao, X. & Wang, X. (2018). Investigation on the Vibration Effect of Shock Wave in Rock Burst by In Situ Microseismic Monitoring. Shock and Vibration, 2018 8517806-1-8517806-14.
This journal article is available at Research Online: https://ro.uow.edu.au/eispapers1/1331

Research ArticleInvestigation on the Vibration Effect of Shock Wave in RockBurst by In Situ Microseismic Monitoring
Mingshi Gao,1,2 Hongchao Zhao ,1,3 Yichao Zhao,2 Xiaojun Gao,2 and XiangyuWang2
1School of Geology and Mining Engineering, Xinjiang University, Urumqi, Xinjiang 830046, China2School of Mines, Key Laboratory of Deep Coal Resource Mining, China University of Mining and Technology, Xuzhou,Jiangsu 221116, China3School of Civil, Mining and Environmental Engineering, University of Wollongong, Northfield, NSW 2500, Australia
Correspondence should be addressed to Hongchao Zhao; [email protected]
Received 20 September 2017; Accepted 4 January 2018; Published 26 March 2018
Academic Editor: Salvatore Russo
Copyright © 2018 Mingshi Gao et al. This is an open access article distributed under the Creative Commons Attribution License,which permits unrestricted use, distribution, and reproduction in any medium, provided the original work is properly cited.
Rock burst is a physical explosion associatedwith enormous damage at a short time.Due to the complicity ofmechanics of rock burstin coal mine roadway, the direct use of traditional investigation method applied in tunnel is inappropriate since the componentsof surrounding rock are much more complex in underground than that of tunnel. In addition, the reliability of the results obtainedthrough these methods (i.e., physical simulation, theoretical analysis, and monitoring in filed application) is still not certain withcomplex geological conditions. Against this background, present experimental study was first ever conducted at initial site toevaluate the effect of shock wave during the rock burst. TDS-6 microseismic monitoring system was set up in situ to evaluate thepropagation of shock wave resulting inmicroexplosions of roadway surrounding rock. Various parameters including the distance ofepicentre and the characteristic of response have been investigated. Detailed test results revealed that (1) the shock wave attenuatedexponentially with the increase of the distance to seismic source according to the equation of𝐸 = 𝐸0𝑒
−𝜂𝑙; particularly, the amplitudedecreased significantly after being 20m apart from explosive resource and then became very weak after being 30m apart from theseismic source; (2) the response mechanics are characteristic with large scatter based on the real location of surrounding rockdespite being at the same section. That is, the surrounding rock of floor experienced serious damage, followed by ribs, the roof,and the humeral angles. This in situ experimental study also demonstrated that microseismic monitoring system can be effectivelyused in rock burst through careful setup and data investigation. The proposed in situ monitoring method has provided a new wayto predict rock burst due to its simple instalment procedure associated with direct and reasonable experimental results.
1. Introduction
During the past decades, approximately 85% of rock bursthappened in roadways resulting in series fatal accidentscharacteristic with cave-ins, collapse, and even instantaneousclosure of roadways [1–4]. Enormous damage in terms ofthe claims of miners and equipment damage occurred at thesame time due to the closure of roadway which is regardedas a throat of underground mine caused by rock burst [5].Particularly, in recent years, China’s coal mining operatorshave experienced gradual transformation into a predomi-nantly deepmining. Rock burst is therefore becoming amainconcern due to its high frequency and seriousness owing to
the increase of in situ stress in terms of the mining depth[6, 7]. Correspondingly, the stability of surrounding rocksin roadway subjected to rock burst draws more and moreattentions than ever before. Many investigations have beenconducted into the generation and behaviour mechanisms ofrock burst in tunnel and, as a result, a number of theoreticalassumptions have been proposed. However, different to othermechanical phenome, it is nearly impossible to rebuild thereal occurrence of rock burst in the laboratory resulting in theuncertain of its generation mechanisms and failure mode ofsurrounding rock. These research methods can be classifiedin three categories: (a) physical simulation study with similarmaterial, (b) theoretical analysis thorough finite element
HindawiShock and VibrationVolume 2018, Article ID 8517806, 14 pageshttps://doi.org/10.1155/2018/8517806

2 Shock and Vibration
simulation, and (c) monitoring in field application [6, 8–10].In the first category, the physical simulation is mainly carriedout by means of drilling the hole to simulate the tunnel afterthe balance of the model, followed by the artificial explosivenear the tunnel. For this physical simulation method, theexperimental results mainly depend on the selection ofsimilar materials and the source of explosive. However,the main concern for this method is its reasonability andaccuracy owing to the simplification of the surrounding rockto be homogenous in simulation even though the results aremore direct. In addition, the scale of physical simulationmodel is another restriction of its wide use, because that itis well known that the transformation of explosive wave isrelevant to the scale of the model. Last but not least, it isdifficult tomonitor on-time value with traditional equipmentin laboratory. Therefore, physical simulation should be aqualitative method to evaluate the possible failure modeof tunnel at initial stage. In the second category, the rockburst is investigated using theoretical analysis depending onvarious soft programmes. Compared to physical simulation,the boundary restriction is not still a main problem withlarge calculation ability of soft program. Moreover, muchmore parameters including cracks and faults can be added tosurrounding rock subjected to rock burst so that the resultsare mostly approached to real application. However, properselection of key parameters is still on the way of developingto improve the accuracy of simulation since it is impossible torebuild the real surrounding rock due to not only the complexof rock but also the limitation of calculation ability of normalcomputer. Accordingly, it is still a new approach to mostengineer in site application to acquire theoretical analysis.For monitoring technology applied in field application, theresult is obviously clear and direct; however, it is not a cost-effectivemethod for research due to its long-termmonitoringand large number to be analysed [11–16]. In particular, somecritical parameters affecting the accuracy are still uncertainsince it is impossible to rebuild the rock burst in real mine.Most importantly, these three categories are mostly in termsof tunnelling rather thanmining engineering. In early studiesof roadway rock burst in underground mines, two typicalresearch methods mentioned were directly used in analysis.Subsequent studies, however, have shown that this directuse is inappropriate since the components of surroundingrock are much complex in underground compared to thatof tunnelling. Although a large amount of existing researchrevealed that the relationship between shock wave and rockburst can be used to predict the occurrence of rock burst[17–21], these results are inconsistent with regard to in situbehaviour. This is also because the stress distribution of sur-rounding rock is mainly influenced by other mining activi-ties. Correspondingly, the cost-effective and reliable methodto investigate the behavior of rock burst is required.
Against this background, the first author of this papertherefore proposed a new in situ approach to investigate thebehaviour of rock burst in coal mine roadway with the use ofmicroseismicmonitoring system (MMS). Compared to phys-ical simulation in laboratory, both the boundary and scale ofthe model are real without any coefficient; the results of thisexperimental approach are much more direct and reliable.
Different from FE analysis which relays on professional staff,this proposed method can be carried out by ordinal miningengineers. In addition, the use of portable monitoring systemreduces the cost and the number of engineers compared withtraditional monitoring technology in field application. Toclarify the above expected advantages, an in situ case studywas firstly conducted in 2604 working panel of Xinqiao coalmine in China by using TDS-6 microseismic monitoringsystem (MMS) to develop a deep understanding of therelationship between shake wave and microexploration andthe response characteristics. The propagation of shock wavestimulated by microexplosion and response characteristicsof the surrounding rock in the measurement of the effectsarising therefrom are investigated through in situ assessment.
2. Geology and in Site Situation
All tests were conducted at the tail gate of 2604 workingpanel of Xinqiao coal mine located at Henan province, China(Figure 1). Ground elevation of the roadway is 31.8m and thecaving depth ranges from −361m to −512m. 2604 workingpanel was excavated along the top of #2-II coal seam.The #2-II coal seam is relatively stable with slope gradient of 10∘∼15∘.Moreover, the change of thickness is not very obvious, thatis, ranging from 1.57m to 2.57m with an average of 2.07m.Coal reject consisted of dark coal,mirror coal, and glass lusterwhich has been found in coal seam.The combined geologicalcolumn of coal seam is shown in Figure 2.
The tailgate is under an anticlinal structure where thereis decrease in both ribs. The inclination of the coal seamalong is 10∘∼15∘, with an average of 13∘. It is expected that theexcavation procedure of 2604 working panel may be affectedbyDF23 fault resulting in the observation of significant crackson surrounding rock of roadway.
The width and height of the tailgate is about 3400mmand 2100mm, respectively. The primary support is the com-bination of anchor (bolt) and cable. The diameter and lengthof the high-strength bolt installed on the roof of tailgate areΦ20mm and 2000mm. All high-strength bolts spacing 800× 800mmwith the force of 80KN and preload of 150N⋅marefixed with two rolls of MSK2335 resin. In addition, 3600mmW-type steel bars (No.BHW-220-2.75) and steel mesh withgrid of 50 × 50mm have been used together with bolts.Moreover, Φ18.9mm × 6300mm anchor spacing 3000mmis installed as secondary support. All anchors were preloadedwith 100 kN. Other details information about support can befound from Figures 3 and 4.
3. TDS-6 Microseismic Monitoring System
3.1. TDS-6 MMS System. TDS-6 microseismic monitoringsystem, jointly developed by China University of Mining &Technology and the State Seismological Bureau, was used inthis case study. The system consists of six data acquisitionbranch stations and one data collection master station asshown in Figure 5.
The master station is equipped with a data receiverunit and a data recorder. Recorded files, waveforms, andseismic events can be replayed, recorded, and located through

Shock and Vibration 3
118∘00E116∘00E114∘00E112∘00E110∘00E
116∘00E114∘00E112∘00E110∘00E
36∘00N
34∘00N
32∘00N
36∘00N
34∘00N
32∘00N0 35 70 140 210 280
(km)
N
Figure 1: Location and layout of selected site mine.
master station, respectively. Mentioned branch station isequipped with a single component geophone, frequencyselection, wireless transfer, and so on. In addition, a hard-wired interface is also left at each branch station to transmitweak seismic signals to the master station. Meanwhile, 1 to𝑛 network communication mode is default to guarantee thedata transmitted in real-time with frequency domain. Oncethese data are collected and transferred to waveforms inreal-time, recorded information in master station can beanalysed through personal computer. The main performanceparameters of this system are illustrated in Table 1.
3.2. Conversion between Energy and Level Amplitude in Seis-mic Signals. It is well known that the relationship betweenthe electric level amplitude and seismic intensity in theTDS-6 microseismic monitoring system can be normalizedby regression. Similarly, the relationship between seismicenergy and level amplitude can be deduced on the basis ofthe relationship between seismic intensity and magnitude[20].
Table 1: Main performance parameters of TDS-6 MMS.
Parameter ValueVibration band 1.0 to 80.0HzVibration sensitivity 20V⋅s/mData acquisition 16 bits, A/D converterSampling rate 1,000 s−1
Transmitted power 1.5WCentre frequencies 10, 35, and 70HzCarrier frequency 450MHzReceiving sensitivity 0.3 𝜇VWorking temperature range −10∘C to 50∘C
As seen from Figure 6, the conversion between seismicintensity and level amplitude can be expressed as follows:
𝑦 = 1.4405 ln𝑥 − 1.9517. (1)

4 Shock and Vibration
Average (m)
Min∼MaxStrata
14.336.38∼22.27
2.071.57∼2.57
Clay
3.14
0.97
3.28
Thickness
Average (m)Column
2-II Coal
Siltstone
Packsand
Mediumsandstone 14.33m
2.07 m
0.97 m
3.14 m
3.28 m
Figure 2: Combined geological column of coal seams.
As seen from Figure 7, the conversion between magnitudeand seismic intensity was given by [11]
𝑦 = 0.5708𝑥 + 1.6556. (2)
While the conversion between energy and magnitude can beexpressed as (Figure 8)
𝑦 = 63207𝑒3.4538𝑥,
lg𝑦 = 4.8 + 1.5𝑥,(3)
therefore, the relationship between energy and level ampli-tude was:
lg𝑦 = 5.6 + 1.233 ln𝑥, (4)
where 𝑦 is the seismic energy of each particle, J, and 𝑥 is thelevel amplitude of the seismic signal, mV.
4. Experiment Design and Instrument
Considering that the main aims of this research are to inves-tigate the effect of blasting vibration wave propagation andthe response of blasting vibration wave at different sectionsof roadway, the stress at different time periods and wavepropagation signal dataweremeasured and analyzed to revealthe blasting vibration wave in the underground coal seamroadway. The propagation law, attenuation characteristics,and their relationship with the roadway surrounding rockwere investigated as well. To achieve the mentioned researchobjectives, two field tests were designed and conducted: one isto evaluate wave propagation and the other is to assessthe response characteristics of surrounding rock at differentlocations (e.g., roof, rib, and floor) of the same section ofroadway.

Shock and Vibration 5
20 × 2000 GG Bolt
18.9 × 6300GG cableR = 3000GG
800 × 800GG
W-Steel bar
Steel mesh
16 × 1800 GG bolt
15∘
10∘
3400 mm3600 mm
500
100
2100
2200
20∘
10∘
Figure 3: Cross section of support for tailgate.
Overall seen Roof
Driving ahead Crib
Figure 4: The photos of selected roadway.

6 Shock and Vibration
(a) Branch station (b) Master station
Figure 5: TDS-6 MMS system.
0.00
2.00
4.00
6.00
8.00
10.00
12.00
Seism
ic in
tens
ity
500 1000 1500 2000 2500 3000 3500 4000 45000Level amplitude
y = 1.4405 FH(x) − 1.9517
R2 = 0.9999
Figure 6: Intensity versus level amplitude.
3
4
5
6
7
8
9
Mag
nitu
de
4 5 6 7 8 9 10 11 12 133Seismic intensity
R2 = 0.9934
y = 0.5708x + 1.6556
Figure 7: Magnitude versus seismic intensity.
05E + 161E + 17
1.5E + 172E + 17
2.5E + 173E + 17
3.5E + 174E + 17
Ener
gy (J
)
2 4 6 8 100Magnitude
y = 63207e3.4538x
R2 = 1
Figure 8: Energy versus magnitude.

Shock and Vibration 7
1
Roof
Floor 2 3 4 5 6
Master station
Branch station
Underground roadway
Shock source
Figure 9: Test model of evaluation of shock wave propagation.
4.1. Experiment Design
4.1.1. Test 1: Propagation Effect of Vibration Wave along theRoadway. As shown in Figure 9, roadway with concretesurface located at coal seam was selected to set up MMS. Asmall scale of explosive was stimulated to simulate shocksource in rock burst. Six branch stations were placed 10mapart from the shock source along the strike direction ofroadway; the master station was placed in the middle ofthe array of branch stations. Each test should be conductedmore than three times to obtain the reliability of the testresults.
4.1.2. Test 2: Response Characteristics of Surrounding Rock atDifferent Locations around the Same Section. Before settingup any equipment, one of the sections of the same roadwayshould be selected. Considering the limit of the length ofsignal cable is limited, the substation from the main stationshould not be too far.Therefore, the selected section to installbranch stations is located at 20m apart from the explosivesource. The branch station will be fixed in whole crosssection of roadway including roof, floor, and two shoulders ofcribs. Similarly, all tests should be repeated more than threetimes. It should make sure that all branch stations receivingdigital signal are placed towards the direction of the source(Figure 10).
4.2. Experimental Procedure of Test 1. As discussed earlier,the master station was placed in a safety chamber 30m fromthe roadway heading face. Each branch station was arrangedin a line along the strike direction of roadway, with an averagespacing of 10m between each station, with the first branchstation situated 10m from the explosive source. In addition,the window for receiving signals at each branch stationwas placed toward the explosive source. Meanwhile, somecritical parameters were set up; main frequency range wasbetween 1 and 100Hz in all-pass mode; trigger threshold (i.e.,STA/LTA) is 1.2; scanning time is 1 s. All data was recordedcontinuously.
Each blast hole was drilled in the roadway heading face,with a diameter and depth of 43mm and 1m, respectively.A positive charge structure was selected, and the explosivecharge was controlled at between 70 and 80mg each time.The cartridge length was approximately 150mm, and the
length in each blast hole was plugged firmly by stemming.Moreover, the blasting operation and signal monitoringwere coordinated by a single person. The instrumentationarrangement and debugging procedure can be seen in Fig-ure 11.
4.3. Experimental Procedure of Test 2. A same cross sectionwas selected as presented in Test 1, different from the layoutof branch station, herein, six branch stations were arrangedin the middle of roof, floor, two ribs, humeral angle, andbase angles of the roadway section, respectively (Figure 10).A known mass of explosives was selected as the shocksource.
Master stations were placed 20m from the explosivesource in roadway heading face and arranged in the roof,floor, two ribs, and both humeral angles of the same roadwaysection, respectively. In addition, the window for receivingsignal of each branch station was placed so as to face theexplosive source. Meanwhile, the scanning time was set to 1 s,and the data were recorded continuously. The blast-holearrangement, charge structure, and amount of charge werebasically the same as described in the frontal tests.
The main station was equipped with computer placed inthe distance 30m from the head to avoid the chamber. As thelength of the test equipment signal cable is limited, the substa-tion from themain station should not be too far, selecting thedistance of 20m cross-site location substation.The substationwill be fixed in the roadway section of the roof, floor, tworibs, and two shoulders and shoulder position; the substationto receive the signal should be placed towards the directionof the source. After all the test equipment is finished, openthe power supply of each substation and the main station andenter the main interface of the microearthquake informationacquisition system; set the monitoring parameters, and 2604track chute vibration wave propagation effect test parametersare set the same. Data recording mode uses continuousrecording; continuous recording is selected to start monitor-ing; the program continues to record the substation to collectdata in the computer hard disk; choose stop monitoring andstop recording. Before the test, all wire connectors betweeneach equipment including substation and the main stationwere carefully detected to maintain the normal use in exper-iment. Unfortunately, all substations except for 6 substations

8 Shock and Vibration
Branch stationarrangement
Shock sourceRoof
Floor
Master station
Underground roadway
I
I
3, 4
5, 6
2
1
(a) Instrument arrangement
Branch stationarrangement
1
2
3 4
5 6
(b) Section I-I
Figure 10: Test model of response characteristics at different locations on the same roadway.
(a) Selection of location (b) Setting up master station (c) Connection of branch station
(d) Debugging system (e) Collection of data (f) Analysis data
Figure 11: Experimental procedure of Test 1.
did not work. That is, only five substations were used in thisexperiment.
5. Experimental Observations and Discussions
5.1. Data Collection from Two Experiments. The originalvoltage data recorded by the TDS-6 was converted into anMS-Access� database file and an acceleration database file,successfully. In addition, the energy time-history curves ineach branch station and from each test were then obtained
andprocessed inMS-Excel� andMATLAB� 7.0.Due to spacelimitations of article, the level amplitude and energy time-history curves from different branch stations, in each blastingtest, are provided, respectively.
The original explosive signals from microexplosions infront of the roadway heading face (from three tests) andthe amplitude-time curve of the vibration signal level ofeach branch station of 2604 panel obtained from Test 1 canbe seen in Figures 12 and 13, respectively. Correspondingly,the original signals obtained from Test 2 were presented inFigures 14 and 15, respectively.

Shock and Vibration 9
110910115940 110910115940 110910122035
Figure 12: Propagation effect of vibration wave along the roadway (original signal).
5.2. Propagation Effect of Vibration Wave along the Roadway.According to the data of the amplitude of the vibration signalin the vertical direction of each particle station, themaximumamplitude curve of each substation is obtained by dataanalysis, as shown in Figure 16.The vibration effect of blastingwave along the roadway is summarized from vibration signalreceived by each branch station. The maximum amplitude ofeach station is plotted after regression analysis.
The amplitude of the vibration signal level detected byeach test station was found by data processing from threetests conducted at each group. The average value of theamplitude of the vibration signal level monitored by eachsubstation was obtained. Correspondingly, the regressioncurves of themaximumamplitude of the vibration signal levelalong the roadway are obtained. The vibration signal ampli-tude descending curve regression equation is obtained asfollows:
𝑦 = 15133𝑒−0.05𝑥. (5)
From the amplitude curve of the vibration signal level of thecoal roadway and the regression equation, it can be seen thatthe amplitude of the distance from the source is large, butthe amplitude of the vibration signal increases along the prop-agation distance in the exponential relationship attenuation.
5.3. Energy Response Characteristics of Blasting VibrationWave in Surrounding Rock with Same Location. The energydissipation of the blasting vibration wave in the surroundingrock of the coal roadway is revealed by the energy propaga-tion effect of the blasting vibration wave in the surroundingrock of the coal roadway.The results of the energy calculationof the blasting vibration wave at the substation position of the2604 orbit test site are shown in Table 2.
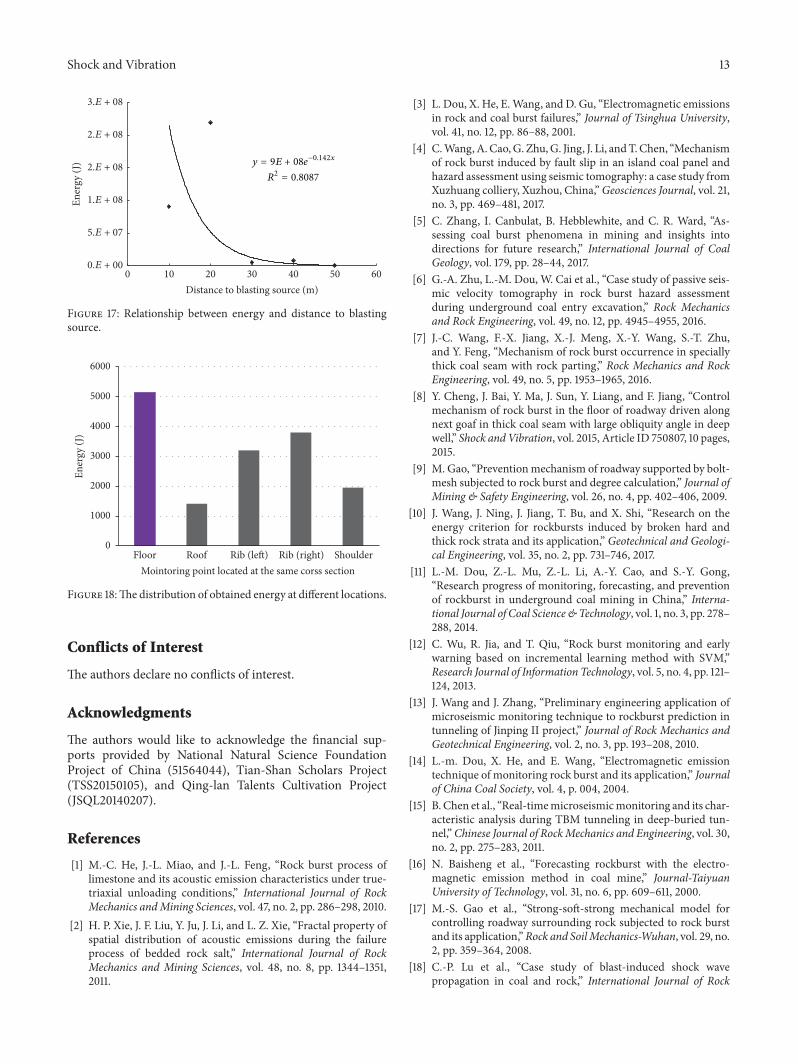
By nonlinear regression, the energy attenuation of theexplosive wave transmitted through the coal-rock mass wasobtained as follows:
𝑦 = 1 × 10⁹𝑒−0.154𝑥. (6)
Herein, 𝑦 is the seismic energy, J, and 𝑥 is the distance to theseismic source, m.
From the curves of peak amplitude and energy atten-uation, the shock wave attenuated exponentially as 𝐸 =𝐸0𝑒−𝜂𝑙 with distance from the seismic source: the amplitude
decreased significantly after 20m, and the signal was veryweak beyond 30m as shown in Figure 17.
5.4. Energy Response Characteristics of Blasting VibrationWave of Surrounding Rock in Different Locations. Calculatedpeak amplitudes and seismic energies received at differentbranch stations in each test are listed in Table 3.
The response characteristics of the underground engi-neering structure to the blast shock wave and the differenceof the response of the different location to the blasting vibra-tion wave are studied through the alteration of the energyresponse characteristics of the blasting vibration wave atdifferent sections of the same roadway. To reduce the impactof vibration damage intensity of the technical approach, theresults of the energy calculation of the blasting vibrationwaveat the substation position of the 2604 orbit test site are shownin Table 3.
It is apparent that he response mechanics are characteris-tic with the real location of surrounding rock despite being atthe same section. Compared with the surrounding rock, thefloor is under much damage, followed by the ribs, the roof,and the humeral angles (Figure 18).

10 Shock and Vibration
Table 2: Calculated peak amplitudes and energies at each branch station.
Test site Branch station Distance to source/m Peak amplitudes at each branch station/𝜇V Energy/JTest 1 Test 2 Test 3 Average value
Roadway: 2604 panel
1 10 7388.867 10680.9 9623.4 9231.056 2.19 × 10⁸
2 20 6971.067 6416.8 6991 6792.956 9.065 × 10⁷
3 30 2581.133 2915.1 2945.6 2813.944 7.508 × 10⁶
4 40 2375.733 2808.1 2235.5 2473.111 5.203 × 10⁶
5 50 984.4667 1065.3 986.3 1012.022 4.11 × 10⁵
Time (ms)
Am
plitu
de (
V)
3.E + 04
2.E + 04
1.E + 04
0.E + 00
−1.E + 04
−2.E + 04
−3.E + 04
1#branch
Time (ms)
Am
plitu
de (
V)
3.E + 04
2.E + 04
1.E + 04
0.E + 00
−1.E + 04
−2.E + 04
−3.E + 04
2#branch
Time (ms)
Am
plitu
de (
V)
3.E + 04
2.E + 04
1.E + 04
0.E + 00
−1.E + 04
−2.E + 04
−3.E + 04
4#branch
Time (ms)
Am
plitu
de (
V)
3.E + 04
2.E + 04
1.E + 04
0.E + 00
−1.E + 04
−2.E + 04
−3.E + 04
3#branch
Time (ms)
Am
plitu
de (
V)
3.E + 04
2.E + 04
1.E + 04
0.E + 00
−1.E + 04
−2.E + 04
−3.E + 04
5#branch
Time (ms)
Am
plitu
de (
V)
3.E + 03
2.E + 03
1.E + 03
0.E + 00
−1.E + 03
−2.E + 03
−3.E + 03
6#branch
Figure 13: The amplitude-time curve of the vibration signal level of each branch station of 2604 panel.

Shock and Vibration 11
Table 3: Calculated peak amplitudes and seismic energies received at each branch station.
Test site Branch station Location Maximal amplitudes of each branch station/𝜇V Energy/JTest 1 Test 2 Test 3 Average value
Roadway of 2604 coal face
1 Floor 4969.545 5527.364 4918.6 5138.503 4.15 × 10⁷
2 Roof 949.0909 2079.545 1228.8 1419.145 1.076 × 10⁶
3 Left rib 3276.091 3414.909 2922.2 3204.4 1.086 × 10⁷
4 Humeral angle 2040.364 2036.182 1792.2 1956.248 2.675 × 10⁶
5 Right rib 3575.636 4917.818 2922 3805.152 1.77 × 10⁷
110910132836 110910131838 110910130719
Figure 14: Response characteristics of surrounding rock at different locations around the same section (original signal).
6. Conclusions
This paper presents a first ever in situ experimental approachto investigate the behavior of rock burst in coalmine roadway.TDS-6 microseismic monitoring system was applied to eval-uate shock wave propagation effects caused by microexplo-sions in a roadway and the response characteristic evaluationof the rocks surrounding the roadway at different locationsaround the same section, respectively. In addition, the rela-tionship between the vibration and the damage effect wassuccessfully explored. In summary, the following conclusionscan be drawn from this in situ research:
(1) The seismic energy of a shock wave in a coal-rock mass attenuates exponentially as 𝐸 = 𝐸0𝑒
−𝜂𝑙
with increasing distance from the explosive source.However, the amplitude decreases significantly after20m and becomes very weak after 30m. It is believedthat the effect of vibration caused by blasting islimited owing to the decrease of energy observed bysurrounding rock.
(2) The response characteristics of the rocks surroundingthe roadway differ significantly at different locations
around the same section; that is, the floor suffered themost serious damage, followed by the two ribs, theroof, and the humeral angles: this is consistent withactual situations in which the floor always suffers themost serious damage after a rock burst.
(3) Compared to traditional experimental approacheswhich are either conducted in laboratory or on thesurface to simulate the occurrence of rock burst, thenew in situ experimental method presented in thispaper is much more direct and reasonable with itsreliable results.
It should be noted that the propagation effect of shock wavemainly depends on different rock surroundings with differentmechanical properties, the fillings, water saturation, and soon under particular geological condition. Even though thispaper presented a novel effective method to evaluate rockburst by in situ experimental approach, much investigationshould be conducted to deepen the understanding of behav-ior of rock burst in prevention design.

12 Shock and Vibration
Time (ms)
Am
plitu
de (
V)
1.8E + 04
1.2E + 04
6.0E + 03
0.0E + 00
−1.8E + 04
−1.2E + 04
−6.0E + 03
1#branch
Time (ms)
Am
plitu
de (
V)
1.8E + 04
1.2E + 04
6.0E + 03
0.0E + 00
−1.8E + 04
−1.2E + 04
−6.0E + 03
2#branch
Time (ms)
Am
plitu
de (
V)
1.8E + 04
1.2E + 04
6.0E + 03
0.0E + 00
−1.8E + 04
−1.2E + 04
−6.0E + 03
3#branch
Time (ms)
Am
plitu
de (
V)
1.8E + 04
1.2E + 04
6.0E + 03
0.0E + 00
−1.8E + 04
−1.2E + 04
−6.0E + 03
4#branch
Time (ms)
Am
plitu
de (
V)
1.8E + 04
1.2E + 04
6.0E + 03
0.0E + 00
−1.8E + 04
−1.2E + 04
−6.0E + 03
5#branch
Time (ms)
Am
plitu
de (
V)
3.E + 03
2.E + 03
1.E + 03
0.E + 00
−3.E + 03
−2.E + 03
−1.E + 03
6#branch
Figure 15: Level amplitude-time curves from different branch stations: different locations in the same section.
R2 = 0.809
y = 15133e−0.05x
0.E + 00
2.E + 03
4.E + 03
6.E + 03
8.E + 03
1.E + 04
Max
ampl
itude
(V
)
10 20 30 40 50 600Distance to blasting source (m)
Figure 16: Relationship between vibration signal level amplitude and distance to blasting source.
Shock and Vibration 13
0.E + 00
5.E + 07
1.E + 08
2.E + 08
2.E + 08
3.E + 08
Ener
gy (J
)
10 20 30 40 50 600Distance to blasting source (m)
R2 = 0.8087
y = 9E + 08e−0.142x
Figure 17: Relationship between energy and distance to blastingsource.
Floor Roof Rib (left) Rib (right) ShoulderMointoring point located at the same corss section
0
1000
2000
3000
4000
5000
6000
Ener
gy (J
)
Figure 18:The distribution of obtained energy at different locations.
Conflicts of Interest
The authors declare no conflicts of interest.
Acknowledgments
The authors would like to acknowledge the financial sup-ports provided by National Natural Science FoundationProject of China (51564044), Tian-Shan Scholars Project(TSS20150105), and Qing-lan Talents Cultivation Project(JSQL20140207).
References
[1] M.-C. He, J.-L. Miao, and J.-L. Feng, “Rock burst process oflimestone and its acoustic emission characteristics under true-triaxial unloading conditions,” International Journal of RockMechanics andMining Sciences, vol. 47, no. 2, pp. 286–298, 2010.
[2] H. P. Xie, J. F. Liu, Y. Ju, J. Li, and L. Z. Xie, “Fractal property ofspatial distribution of acoustic emissions during the failureprocess of bedded rock salt,” International Journal of RockMechanics and Mining Sciences, vol. 48, no. 8, pp. 1344–1351,2011.
[3] L. Dou, X. He, E.Wang, and D. Gu, “Electromagnetic emissionsin rock and coal burst failures,” Journal of Tsinghua University,vol. 41, no. 12, pp. 86–88, 2001.
[4] C.Wang,A.Cao,G. Zhu,G. Jing, J. Li, andT.Chen, “Mechanismof rock burst induced by fault slip in an island coal panel andhazard assessment using seismic tomography: a case study fromXuzhuang colliery, Xuzhou, China,”Geosciences Journal, vol. 21,no. 3, pp. 469–481, 2017.
[5] C. Zhang, I. Canbulat, B. Hebblewhite, and C. R. Ward, “As-sessing coal burst phenomena in mining and insights intodirections for future research,” International Journal of CoalGeology, vol. 179, pp. 28–44, 2017.
[6] G.-A. Zhu, L.-M. Dou, W. Cai et al., “Case study of passive seis-mic velocity tomography in rock burst hazard assessmentduring underground coal entry excavation,” Rock Mechanicsand Rock Engineering, vol. 49, no. 12, pp. 4945–4955, 2016.
[7] J.-C. Wang, F.-X. Jiang, X.-J. Meng, X.-Y. Wang, S.-T. Zhu,and Y. Feng, “Mechanism of rock burst occurrence in speciallythick coal seam with rock parting,” Rock Mechanics and RockEngineering, vol. 49, no. 5, pp. 1953–1965, 2016.
[8] Y. Cheng, J. Bai, Y. Ma, J. Sun, Y. Liang, and F. Jiang, “Controlmechanism of rock burst in the floor of roadway driven alongnext goaf in thick coal seam with large obliquity angle in deepwell,” Shock andVibration, vol. 2015, Article ID 750807, 10 pages,2015.
[9] M. Gao, “Preventionmechanism of roadway supported by bolt-mesh subjected to rock burst and degree calculation,” Journal ofMining & Safety Engineering, vol. 26, no. 4, pp. 402–406, 2009.
[10] J. Wang, J. Ning, J. Jiang, T. Bu, and X. Shi, “Research on theenergy criterion for rockbursts induced by broken hard andthick rock strata and its application,” Geotechnical and Geologi-cal Engineering, vol. 35, no. 2, pp. 731–746, 2017.
[11] L.-M. Dou, Z.-L. Mu, Z.-L. Li, A.-Y. Cao, and S.-Y. Gong,“Research progress of monitoring, forecasting, and preventionof rockburst in underground coal mining in China,” Interna-tional Journal of Coal Science&Technology, vol. 1, no. 3, pp. 278–288, 2014.
[12] C. Wu, R. Jia, and T. Qiu, “Rock burst monitoring and earlywarning based on incremental learning method with SVM,”Research Journal of Information Technology, vol. 5, no. 4, pp. 121–124, 2013.
[13] J. Wang and J. Zhang, “Preliminary engineering application ofmicroseismic monitoring technique to rockburst prediction intunneling of Jinping II project,” Journal of Rock Mechanics andGeotechnical Engineering, vol. 2, no. 3, pp. 193–208, 2010.
[14] L.-m. Dou, X. He, and E. Wang, “Electromagnetic emissiontechnique of monitoring rock burst and its application,” Journalof China Coal Society, vol. 4, p. 004, 2004.
[15] B. Chen et al., “Real-timemicroseismicmonitoring and its char-acteristic analysis during TBM tunneling in deep-buried tun-nel,”Chinese Journal of RockMechanics and Engineering, vol. 30,no. 2, pp. 275–283, 2011.
[16] N. Baisheng et al., “Forecasting rockburst with the electro-magnetic emission method in coal mine,” Journal-TaiyuanUniversity of Technology, vol. 31, no. 6, pp. 609–611, 2000.
[17] M.-S. Gao et al., “Strong-soft-strong mechanical model forcontrolling roadway surrounding rock subjected to rock burstand its application,”Rock and SoilMechanics-Wuhan, vol. 29, no.2, pp. 359–364, 2008.
[18] C.-P. Lu et al., “Case study of blast-induced shock wavepropagation in coal and rock,” International Journal of Rock

14 Shock and Vibration
Mechanics and Mining Sciences, vol. 47, no. 6, pp. 1046–1054,2010.
[19] L.-m. Dou and X.-q. He, “Model for rock burst failure andits critical values of acoustic and electromagnetic emission,”Journal-China University of Mining and Technology-ChineseEdition, vol. 33, no. 5, pp. 504–508, 2004.
[20] M.-S. Gao et al., “Experimental study on earthquake tremor fortransmitting law of rockburst in geomaterials,” Chinese Journalof Rock Mechanics and Engineering, vol. 26, no. 7, pp. 1365–1371,2007.
[21] M.-s. Gao et al., “Cusp catastrophic model for instability of coalpillar burst damage and analysis of its application,” Journal-China University of Mining and Technology-Chinese Edition, vol.34, no. 4, p. 433, 2005.

International Journal of
AerospaceEngineeringHindawiwww.hindawi.com Volume 2018
RoboticsJournal of
Hindawiwww.hindawi.com Volume 2018
Hindawiwww.hindawi.com Volume 2018
Active and Passive Electronic Components
VLSI Design
Hindawiwww.hindawi.com Volume 2018
Hindawiwww.hindawi.com Volume 2018
Shock and Vibration
Hindawiwww.hindawi.com Volume 2018
Civil EngineeringAdvances in
Acoustics and VibrationAdvances in
Hindawiwww.hindawi.com Volume 2018
Hindawiwww.hindawi.com Volume 2018
Electrical and Computer Engineering
Journal of
Advances inOptoElectronics
Hindawiwww.hindawi.com
Volume 2018
Hindawi Publishing Corporation http://www.hindawi.com Volume 2013Hindawiwww.hindawi.com
The Scientific World Journal
Volume 2018
Control Scienceand Engineering
Journal of
Hindawiwww.hindawi.com Volume 2018
Hindawiwww.hindawi.com
Journal ofEngineeringVolume 2018
SensorsJournal of
Hindawiwww.hindawi.com Volume 2018
International Journal of
RotatingMachinery
Hindawiwww.hindawi.com Volume 2018
Modelling &Simulationin EngineeringHindawiwww.hindawi.com Volume 2018
Hindawiwww.hindawi.com Volume 2018
Chemical EngineeringInternational Journal of Antennas and
Propagation
International Journal of
Hindawiwww.hindawi.com Volume 2018
Hindawiwww.hindawi.com Volume 2018
Navigation and Observation
International Journal of
Hindawi
www.hindawi.com Volume 2018
Advances in
Multimedia
Submit your manuscripts atwww.hindawi.com