Investigation of Visual Flight Cues for Timing the ...
51
ATSB RESEARCH AND ANALYSIS REPORT Aviation Safety Research Grant – B2005/0119 Final Investigation of Visual Flight Cues for Timing the Initiation of the Landing Flare Stephen Palmisano, Simone Favelle, Gavin Prowse, Richard Wadwell and Ben Sachtler School of Psychology, University of Wollongong June 2006
Transcript of Investigation of Visual Flight Cues for Timing the ...

ATSB RESEARCH AND ANALYSIS REPORT Aviation Safety Research Grant – B2005/0119
Final
Investigation of Visual Flight Cues for Timing the Initiation of the Landing Flare
Stephen Palmisano, Simone Favelle, Gavin Prowse, Richard Wadwell and Ben Sachtler
School of Psychology, University of Wollongong
June 2006


ATSB RESEARCH AND ANALYSIS REPORT
AVIATION SAFETY RESEARCH GRANT B2005/0121
Investigation of Visual Flight Cues for Timing the
Initiation of the Landing Flare
Stephen Palmisano, Simone Favelle, Gavin Prowse, Richard Wadwell and Ben Sachtler
School of Psychology, University of Wollongong
June 2006

Published by: Australian Transport Safety Bureau
Postal address: PO Box 967, Civic Square ACT 2608
Office location: 15 Mort Street, Canberra City, Australian Capital Territory
Telephone: 1800 621 372; from overseas + 61 2 6274 6590
Facsimile: 02 6274 6474; from overseas + 61 2 6274 6474
E-mail: [email protected]
Internet: www.atsb.gov.au
Aviation Safety Research Grants Program This report arose from work funded through a grant under the Australian Transport Safety Bureau’s Aviation Safety Research Grants Program. The ATSB is an operationally independent bureau within the Australian Government Department of Transport and Regional Services. The program funds a number of one-off research projects selected on a competitive basis. The program aims to encourage researchers from a broad range of related disciplines to consider or to progress their own ideas in aviation safety research.
The work reported and the views expressed herein are those of the author(s) and do not necessarily represent those of the Australian Government or the ATSB. However, the ATSB publishes and disseminates the grant reports in the interests of information exchange and as part of the overall safety aim of the grants program.
© University of Wollongong 2006
ii

CONTENTS
ACKNOWLEDGEMENTS ................................................................................. vii
ABBREVIATIONS................................................................................................ ix
EXECUTIVE SUMMARY ................................................................................... xi
1 INTRODUCTION .......................................................................................... 2 1.1 Visual cues for flare initiation .............................................................. 3
1.1.1 Critical perceived distance.................................................. 3 1.1.2 Critical perceived runway angle (ψ) ................................... 3 1.1.3 Critical perceived time to contact (TTC) ............................ 4 1.1.4 Research support for these cues.......................................... 5
1.2 The current project................................................................................ 6
2 THE EXPERIMENTS.................................................................................... 8 2.1 Experiment 1: Time to Contact judgments using the Predicted
Motion Task.......................................................................................... 8 2.1.1 Method................................................................................ 8 2.1.2 Results and discussion ...................................................... 10
2.2 Experiment 2: Six-second flare timing judgments ............................. 13 2.2.1 Method.............................................................................. 13 2.2.2 Results and discussion. ..................................................... 14
2.3 Experiment 3: Effect of feedback on six-second flare timing judgments ........................................................................................... 15 2.3.1 Method.............................................................................. 16 2.3.2 Results and discussion ...................................................... 16
2.4 Experiment 4: Effect of locus of attention on six-second flare timing judgments ................................................................................ 17 2.4.1 Method.............................................................................. 17 2.4.2 Results and discussion ...................................................... 18
2.5 Experiment 5: Two-second flare timing judgements.......................... 19 2.5.1 Method.............................................................................. 19 2.5.2 Results and discussion ...................................................... 20
2.6 Experiment 6a: Pilot landing flare survey .......................................... 21 2.6.1 Method.............................................................................. 21 2.6.2 Results and discussion ...................................................... 21
2.7 Experiment 6b: Pilot performance on the Predicted Motion task....... 22 2.7.1 Method.............................................................................. 23
iii

2.7.2 Results and discussion ...................................................... 24 2.8 Experiment 6c: Pilot performance on the two-second Flare
Timing task ......................................................................................... 26 2.8.1 Method.............................................................................. 26 2.8.2 Results and discussion ...................................................... 27
3 DISCUSSION ................................................................................................ 30 3.1 Implications for Simulator Based Flight Training.............................. 31
3.1.1 Minimal depth cue requirements for unbiased performance ...................................................................... 31
3.1.2 The importance of including aimpoint and true horizon markings ........................................................................... 31
3.1.3 The PM and Flare Timing tasks as training tools ............. 32
4 GLOSSARY .................................................................................................. 34
5 REFERENCES.............................................................................................. 36
iv
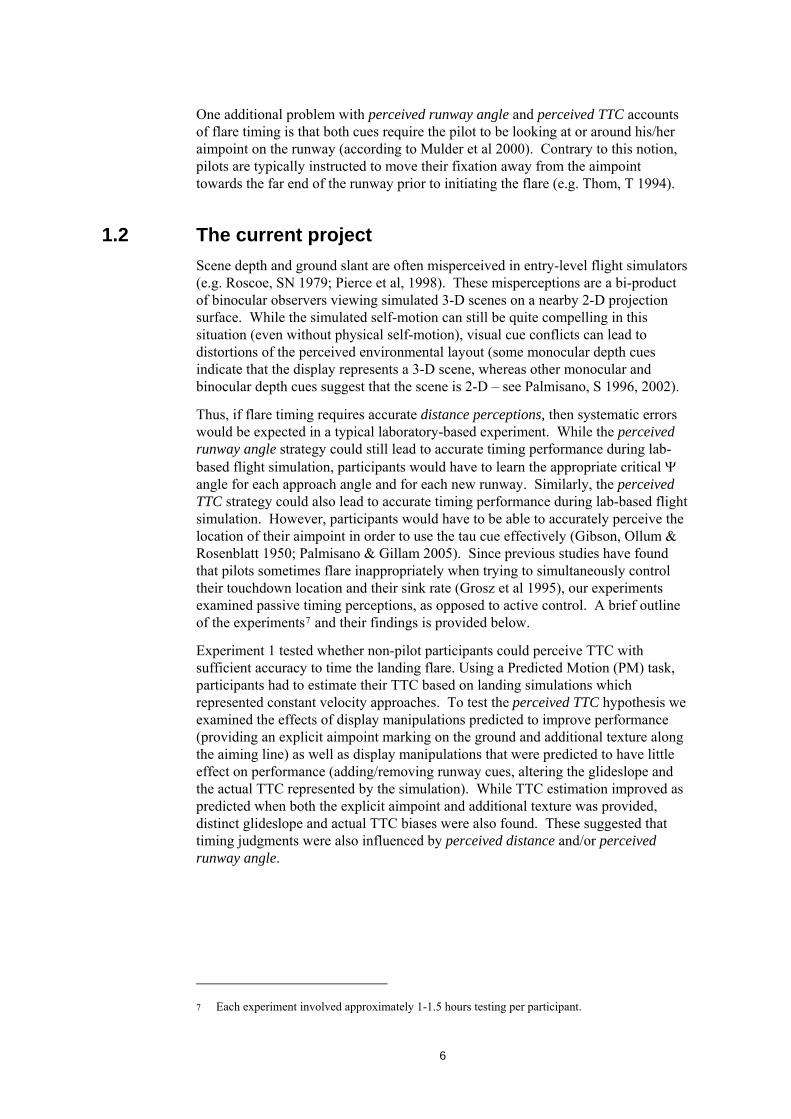
DOCUMENT RETRIEVAL INFORMATION Report No. B2005/0121
Publication date June 2006
No. of pages 51
ISBN #
Publication title Investigation of Visual Flight Cues for Timing the Initiation of the Landing Flare
Author(s) Stephen Palmisano, Simone Favelle, Gavin Prowse, Richard Wadwell and Ben Sachtler
Organisation that prepared this document School of Psychology, University of Wollongong Wollongong NSW 2522
Funded by Australian Transport Safety Bureau PO Box 967, Civic Square ACT 2608 Australia www.atsb.gov.au
Abstract While improper execution of the flare manoeuvre has been implicated in many landing incidents, very few human factors studies appear to have examined this problem. Our flight simulation study examined three different visual strategies that pilots could use to time the flare. On each trial, non-pilots, student pilots or private pilots were required to judge either: (i) their time-to-contact with the ground; or (ii) an idealised time to initiate the flare. Our data provided some support for the hypothesis that pilots initiate the flare when their perceived time-to-contact with the ground reaches a critical value. Pilot performance was generally superior to non-pilot performance. However, both pilots and non-pilots were found to demonstrate flare timing biases during impoverished visual conditions (i.e. reduced depth cues) - indicating that strategies based on perceptions of environmental distance and/or critical runway angle must also have played a role. Importantly, very accurate timing judgments were possible with richer visual displays (i.e. additional depth cues) that provided performance feedback. Thus, we conclude that entry-level flight simulators can be used for flare timing training if certain minimum visual display conditions have been met.
v

vi

ACKNOWLEDGEMENTS
The authors acknowledge the funding support provided by the Australian Government, through the Australian Transport Safety Bureau’s Aviation Safety Research Program.
We would like to thank Graham Towse for his programming assistance on this project. We would also like to thank Luke King from NSW Air and the Aerial Patrol Flight training school at Albion Park for their helpful suggestions and assistance with the pilot recruitment phase of the project.
vii

viii

ABBREVIATIONS
AGL Above ground level
ANOVA Analysis of Variance
PM Predicted Motion task
TIE Time Interval Estimation task
TIL Time Interval Learning task
TTC Time-to-contact
ix

x

EXECUTIVE SUMMARY
The landing flare is considered to be one of the most technically demanding aspects of piloting a fixed wing aeroplane. While improper timing and execution of this manoeuvre have been implicated in a significant proportion of landing incidents, very few human factors studies have examined these problems. The goal of our project was to identify and test the different visual strategies that pilots could use to accurately time the initiation of the landing flare. In a series of experiments, non-pilots, student pilots and private pilots were required to time landings in a fixed-base flight simulator (without display collimation1). Different visual displays were created - each favouring a potential visual cue. While passively viewing these simulations (which represented a constant velocity glide), participants were asked to judge either: (i) their time-to-contact (TTC) with the ground; or (ii) an idealised time to initiate the flare.
The experimental data provided some support for the hypothesis that pilots initiate the flare when their perceived TTC with the ground reaches a critical value. Consistent with this hypothesis, TTC estimates were found to be sufficiently accurate to time the flare when visual displays provided an explicit aimpoint marking on the ground plane. However, TTC estimates and flare timing judgments were highly error prone without such markings. While a significant proportion of participant error was shown to be performance-based in origin, distinct biases remained when performance errors were accounted for. The magnitude of these perceptual errors varied with both the glideslope and the actual TTC represented by the simulation. Crucially, these perceptual errors indicated that perceptions (or rather misperceptions) of environmental distance and/or runway angles also played a role in flare judgments.
While pilot performance was generally superior to non-pilot performance, the same patterns of timing errors and biases were demonstrated by all participants. Importantly, both TTC estimates and flare timing judgments were found to improve dramatically when performance feedback was provided at the end of every trial. Taken together, these findings suggested that: (i) the timing judgments required for flare initiation do not reflect innate abilities; and (ii) significant perceptual learning was required to achieve accurate timing judgments. Both of these conclusions were supported by the pilot responses to our landing flare questionnaire, which highlighted the importance of practice in the acquisition and maintenance of flare skills.
Finally, we conclude that simulator training should be facilitated by providing: (i) ground markings that indicate the future touchdown location (based on current movement); (ii) additional depth cues (such as 3-D buildings and an explicit horizon); and (iii) performance feedback directly after flare initiation. These additional display features should reduce the likelihood of perceptual errors and allow trainees to focus on mastering their flare timing skills in isolation to other tasks.
1 In more expensive simulators, lenses are used to focus the pilot’s eyes out near optical infinity (as
opposed to 1m away on the 2-D screen). These are referred to as collimated displays. Research has shown that without such lenses, perceived environmental distance tends to be significantly reduced during flight simulation (compared to the environmental distances actually simulated by the display – Pierce et al 1998).
xi

1

1 INTRODUCTION During the final stages of a landing, the pilot must reduce the aircraft’s sink rate in order to obtain a safe, smooth landing (Grosz et al 1995; Mulder et al 2000). Just prior to touchdown, he/she pulls back on the control column to increase the aircraft’s (nose-up) angle of attack. This flare manoeuvre produces an increase in the plane’s lift force, which if performed correctly, should reduce its sink rate to acceptable levels (e.g. from 2.5 to 3 m/s during the glide to between 0.5 and 1.0m/s on touch down – Grosz et al 1995). It is essential that the pilot both: (i) make a well-timed decision to initiate the flare; and (ii) apply the correct force on the control column (Langeweische, W 1972). If flare execution is “too late” then the aircraft will make hard contact with the runway. If it is “too early” then the aircraft may level out at too high an altitude – which is also problematic because runway length is being consumed at a very high rate, and any further reduction in airspeed may cause the plane to drop with an excessive velocity (Grosz et al 1995).
Figure 1: Example of a landing simulation display used in the current study with both lexical and pictorial feedback on the accuracy of flare timing.
2

The landing flare is considered one of the most technically demanding aspects of piloting. Novice and expert pilots consistently rate the landing flare as the most difficult of all flight manoeuvres (relative to steep turns, take-off roll, holding altitude, climbing, descending, taxiing, coordinated turns, forward slip2 and landing roll – Benbassat & Abramson 2002). It has been conservatively estimated that 18% of all landing accidents in the USA between 1995 and 1997 arose due to problems with the landing flare (Benbassat & Abramson 2002). Alarmingly, very few human factors studies appear to have examined this problem. Hence, the goal of this project was to identify the visual cues that pilots could use to accurately time the initiation of the landing flare (see Figure 1). In a recent survey study, Benbassat and Abramson (2002) found that 87% of 134 pilots sampled in their study indicated that they used visual cues to time the initiation of the flare. However, no consensus emerged as to which specific visual cues were required for a successful landing.
1.1 Visual cues for flare initiation A review of the available literature has identified three possible visual strategies for flare timing.
1.1.1 Critical perceived distance
Pilots could initiate the landing flare when they perceive that they are a certain critical absolute distance above the runway, from their desired aimpoint, or from the far end of the runway. This critical distance will depend on the aircraft’s wing loading (e.g. critical flare height above ground level (AGL) might be 20ft for an ordinary trainer compared to 80ft for a transport – Benbassat & Abramson 2002; Langeweische, W 1972). In principle, the pilot’s perceived distance in this situation could be based on a variety of visual cues (Langeweische, W 1972). Binocular depth cues, such as stereopsis and convergence, are based on the input from both eyes (Palmisano, S 2002). Monocular depth cues require input from only one eye and are used to represent depth in paintings, photographs and 2-D motion displays (e.g. motion pictures, certain types of flight simulation). These include relative size, familiar size, accommodation, occlusion, changing-size, motion parallax, texture gradients, height in the visual field, atmospheric perspective, shading and lighting (Riordan, RH 1974)3. Importantly, if this perceived distance strategy is used, then systematic errors might arise when using certain types of flight simulator (footnote 1 refers).
1.1.2 Critical perceived runway angle (ψ)
Alternatively, pilots could initiate the landing flare when the visual angle (ψ) formed between the left and right edges of the runway at the aiming line4 reaches a critical value (see Figure 2; Mulder et al, 2000).
2 Forward slip is commonly referred to as sideslip. 3 All of the above binocular and monocular depth cues are defined in the glossary of terms. 4 The aiming line refers to a hypothetical line which is at right angles to the runway alignment and
passes through the aim point.
3

Figure 2: Two visual angles which might be important for flare timing (ψ and θ)
However, this perceived runway angle strategy could lead to serious errors if it was applied to unfamiliar runways (e.g. using a critical ψ angle value that is appropriate for a narrow runway would lead to an early flare when landing on a wider runway). This strategy could also lead to serious errors if the critical ψ angle value used for one particular glideslope (e.g. 3º) was later utilized for other glideslopes (e.g. 6º), as this value would no longer represent the appropriate critical height or TTC relative to the ground.
1.1.3 Critical perceived time to contact (TTC)
Pilots could initiate the landing flare when their perceived time-to-contact (TTC) with the runway reaches a critical value (Grosz et al 1995; Lee, DN 1976). This strategy assumes that the pilot can perceive their TTC, or time remaining until the aircraft’s wheels make contact with the runway if no further action is taken, in both an accurate and unbiased manner (Mulder et al 2000). TTC could be perceived indirectly based on the following computation:
TTC ≈ Perceived absolute distance to aim point/Perceived absolute approach speed
However, human perceptions of absolute distance and absolute speed have been shown to be highly error prone (e.g. Foley JM 1985; Monen & Brenner 1994). Thus, many perceptual theorists believe that TTC must be estimated directly, without first estimating speed and distance, based on the following ratio (known as tau):5
TTC ≈ θ/(dθ/dt)
Where θ is the visual angle between the aimpoint and any other point on the ground plane at time one (see Figure 2); and dθ/dt is the rate of change of this angle over time (Hoyle F 1957; Kaiser & Mowafy 1993; Lee, DN 1976).
Importantly, Mulder and colleagues (2000) noted that during a landing approach the tau ratio only accurately specifies TTC for points along the aiming line (i.e. when the θ of the tau equation is the visual angle between the aimpoint and any other point on the aiming line).
5 Tau is a monocular cue to time-to-contact. During a landing, tau can be defined as the ratio of the
angular distance between any two points on the ground (which happen to lie along the aiming line) divided by how fast this angular distance is increasing. Several other versions of tau have been proposed (see Regan & Gray 2000). Most of these versions specialized for the direct approach towards a perpendicular surface (common to terrestrial locomotion).
4

According to their hypothesis, perceptions of TTC based on tau should improve when ground texture6 is added to the aiming line (as this would enable multiple, redundant estimates of TTC, which could then be averaged to improve the final estimate and reduce the effects of noise). However, perceptions of TTC based on tau should become biased if the pilot misperceives the location of his/her aimpoint and aiming line (as often occurs during so-called ‘black hole’ night landings - Palmisano & Gillam 2005). Specifically, tau information extracted from above the true aiming line will lead to TTC overestimation due to a slower rate of angular change. Conversely, tau information extracted from below the true aiming line will lead to TTC underestimation due to a faster rate of angular change.
1.1.4 Research support for these cues
The available evidence for these three flare timing cues is mixed. Consistent with the perceived distance strategy for flare timing, flight instruction manuals typically suggest that the flare should be initiated when the pilot judges that the plane has reached the appropriate distance/altitude above the runway (e.g. Thom, T 1994). However, contrary to this notion, actual aircraft landings performed under monocular viewing conditions (where pilot perceptions of depth and altitude should have been reduced/impaired) have been found to be as accurate as those performed under binocular viewing conditions (e.g. Grosslight et al 1978; Lewis & Krier 1969; Lewis et al 1973). Thus, if a perceived distance strategy is used to time the flare it appears that it is based mostly on monocular distance information.
In more recent aviation research, Mulder and colleagues (2000) found mixed support for the proposals that flare timing is based on perceived runway angle (ψ) and perceived TTC (based on tau). In their simulation study, non-pilot participants viewed schematic landing displays and simply pressed the space bar on the computer’s keyboard when they perceived that they should initiate an idealised pre-programmed flare. Interestingly, Mulder and his colleagues found that flare timing strategies appeared to change from being based on perceived runway angle when only a runway outline was provided, to being based on perceived TTC when additional texture was provided along the aiming line. Thus, this study suggested that as the visual information about TTC became more reliable, flare timing responses were predominantly based on the perceived TTC.
However, Grosz and colleagues (1995) found little support for any of the three above-mentioned strategies in their flight simulator study, where three jet transport pilots actively controlled 126 simulated landings (from a distance of 5 km from the runway to touchdown). Contrary to their predictions, they found that pilots did not initiate their flares at either a constant height above the runway, or a constant time before touchdown. They explained the failure of the above theories to account for flare timing performance by proposing that pilots in their study primarily “wanted to make contact with the runway at a specific point” (pp. 119). They suggested that future studies should constrain the response task in order to test these different strategies in terms of more relevant criteria (e.g. reducing the sink rate on touchdown to safe levels).
6 Ground texture is defined as “a spatial array of patches, lines, or points varying in size, shape,
posture, colour, or brightness” (Mulder et al 2000; pp. 298). In this case, it refers to additional dots in the display which form a schematic ground plane.
5
One additional problem with perceived runway angle and perceived TTC accounts of flare timing is that both cues require the pilot to be looking at or around his/her aimpoint on the runway (according to Mulder et al 2000). Contrary to this notion, pilots are typically instructed to move their fixation away from the aimpoint towards the far end of the runway prior to initiating the flare (e.g. Thom, T 1994).
1.2 The current project Scene depth and ground slant are often misperceived in entry-level flight simulators (e.g. Roscoe, SN 1979; Pierce et al, 1998). These misperceptions are a bi-product of binocular observers viewing simulated 3-D scenes on a nearby 2-D projection surface. While the simulated self-motion can still be quite compelling in this situation (even without physical self-motion), visual cue conflicts can lead to distortions of the perceived environmental layout (some monocular depth cues indicate that the display represents a 3-D scene, whereas other monocular and binocular depth cues suggest that the scene is 2-D – see Palmisano, S 1996, 2002).
Thus, if flare timing requires accurate distance perceptions, then systematic errors would be expected in a typical laboratory-based experiment. While the perceived runway angle strategy could still lead to accurate timing performance during lab-based flight simulation, participants would have to learn the appropriate critical Ψ angle for each approach angle and for each new runway. Similarly, the perceived TTC strategy could also lead to accurate timing performance during lab-based flight simulation. However, participants would have to be able to accurately perceive the location of their aimpoint in order to use the tau cue effectively (Gibson, Ollum & Rosenblatt 1950; Palmisano & Gillam 2005). Since previous studies have found that pilots sometimes flare inappropriately when trying to simultaneously control their touchdown location and their sink rate (Grosz et al 1995), our experiments examined passive timing perceptions, as opposed to active control. A brief outline of the experiments7 and their findings is provided below.
Experiment 1 tested whether non-pilot participants could perceive TTC with sufficient accuracy to time the landing flare. Using a Predicted Motion (PM) task, participants had to estimate their TTC based on landing simulations which represented constant velocity approaches. To test the perceived TTC hypothesis we examined the effects of display manipulations predicted to improve performance (providing an explicit aimpoint marking on the ground and additional texture along the aiming line) as well as display manipulations that were predicted to have little effect on performance (adding/removing runway cues, altering the glideslope and the actual TTC represented by the simulation). While TTC estimation improved as predicted when both the explicit aimpoint and additional texture was provided, distinct glideslope and actual TTC biases were also found. These suggested that timing judgments were also influenced by perceived distance and/or perceived runway angle.
7 Each experiment involved approximately 1-1.5 hours testing per participant.
6

Experiments 2 to 5 tested whether non-pilot participants could determine when they should initiate an idealised pre-programmed flare. A simple one-button press response was again utilized to minimise task performance requirements. While flare timing judgments were still found to be biased with this newer task (Experiment 2), performance feedback was shown to significantly improve flare timing judgments (Experiments 3 to 5). Experiment 4 also examined the effects of attending to different scene locations and implicated the horizon as an important cue.
Experiment 6a was a questionnaire study which examined student pilot and private pilot ideas about the landing flare. Experiments 6b and 6c examined the performance of these two groups of pilots on the PM and Flare Timing tasks (examined previously on non-pilots in Experiments 1 and 2 to 5 respectively). While pilot performance on both these tasks was superior to the non-pilots, student and private pilots were still found to display the same biases due to glideslope and the actual TTC of the simulation.
7
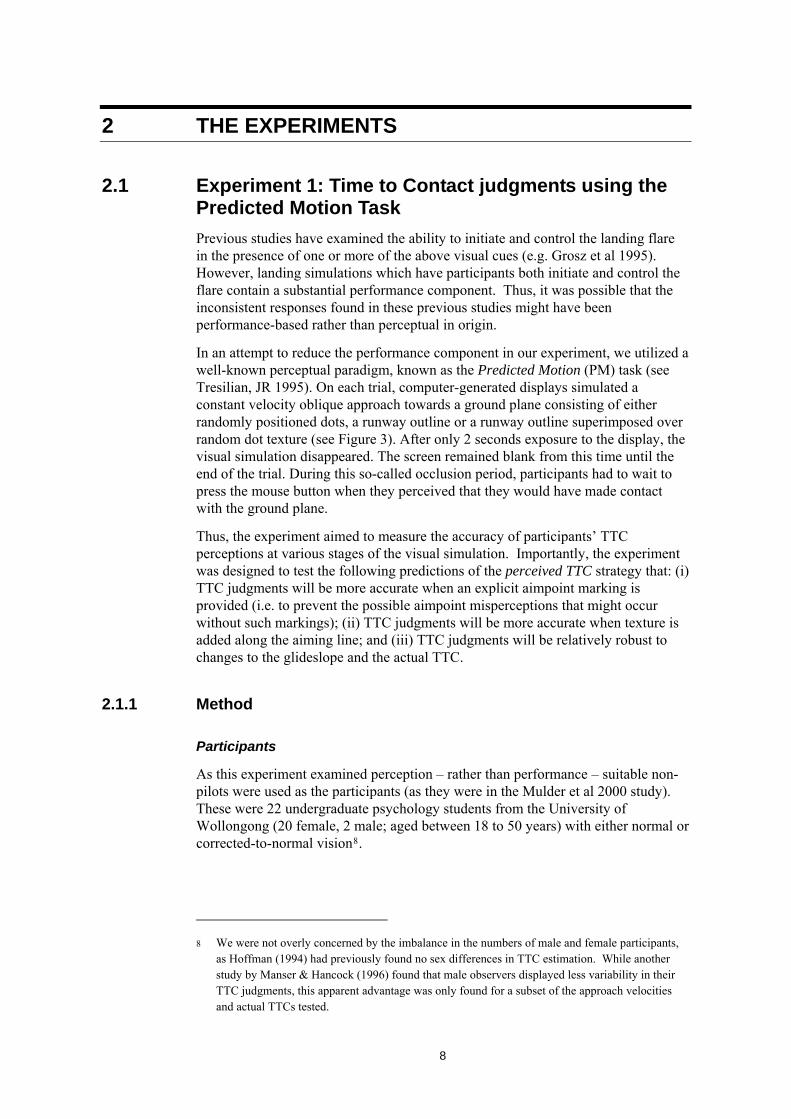
2 THE EXPERIMENTS
2.1 Experiment 1: Time to Contact judgments using the Predicted Motion Task Previous studies have examined the ability to initiate and control the landing flare in the presence of one or more of the above visual cues (e.g. Grosz et al 1995). However, landing simulations which have participants both initiate and control the flare contain a substantial performance component. Thus, it was possible that the inconsistent responses found in these previous studies might have been performance-based rather than perceptual in origin.
In an attempt to reduce the performance component in our experiment, we utilized a well-known perceptual paradigm, known as the Predicted Motion (PM) task (see Tresilian, JR 1995). On each trial, computer-generated displays simulated a constant velocity oblique approach towards a ground plane consisting of either randomly positioned dots, a runway outline or a runway outline superimposed over random dot texture (see Figure 3). After only 2 seconds exposure to the display, the visual simulation disappeared. The screen remained blank from this time until the end of the trial. During this so-called occlusion period, participants had to wait to press the mouse button when they perceived that they would have made contact with the ground plane.
Thus, the experiment aimed to measure the accuracy of participants’ TTC perceptions at various stages of the visual simulation. Importantly, the experiment was designed to test the following predictions of the perceived TTC strategy that: (i) TTC judgments will be more accurate when an explicit aimpoint marking is provided (i.e. to prevent the possible aimpoint misperceptions that might occur without such markings); (ii) TTC judgments will be more accurate when texture is added along the aiming line; and (iii) TTC judgments will be relatively robust to changes to the glideslope and the actual TTC.
2.1.1 Method
Participants
As this experiment examined perception – rather than performance – suitable non-pilots were used as the participants (as they were in the Mulder et al 2000 study). These were 22 undergraduate psychology students from the University of Wollongong (20 female, 2 male; aged between 18 to 50 years) with either normal or corrected-to-normal vision8.
8 We were not overly concerned by the imbalance in the numbers of male and female participants,
as Hoffman (1994) had previously found no sex differences in TTC estimation. While another study by Manser & Hancock (1996) found that male observers displayed less variability in their TTC judgments, this apparent advantage was only found for a subset of the approach velocities and actual TTCs tested.
8

Apparatus
Displays were generated by a Macintosh G4 personal computer and presented on a Sony Trinitron Multiscan G420 monitor (36.5cm wide by 27.5cm high, with a pixel resolution of 1280 x 1024 and an 85Hz refresh rate). A chin rest, located 40cm in front of the display, was used to align the participant’s eye level with the simulated location of the display’s true horizon.
Visual displays
Displays represented one of three different glideslopes (3º, 6º or 9º) towards a ground plane of 800 randomly distributed dots, a runway outline (with dimensions of 60 m wide by 1.3 km long), or both 800 dots and the runway outline (see Figure 3). Note the display consisted of white elements on a black background. The actual TTC for each landing simulation was either 4, 6.5, or 14 seconds. As the starting altitude was 30 m for all of the display conditions, the different actual TTCs for the simulations were produced by varying the (constant) angular approach speeds of the different trials. Half of the experimental displays provided an explicitly demarked aimpoint (a 1º horizontal bar); in the remainder the aimpoint was specified only by the display motion9. In all displays, the ground plane was truncated at a distance of 2 km (producing a false horizon 0.7º below the true horizon).
Figure 3: Schematic representations of the three scene type conditions examined in Experiment 1. (A) represents the dot-only display conditions; (B) represents the runway-only display conditions; and (C) represents the runway-dot display conditions.
Unlike half of the trials shown in the experiment, all of the above displays contain an explicit aimpoint marking (located in the centre of each circle) – indicating the final touchdown location based on their glideslope.
9 These are referred to as optic flow cues (Gibson, Olum & Rosenblatt 1955).
9

Procedure
Prior to the experiment, participants passively observed three automated exposure blocks: (i) runway-dot displays with an explicit aimpoint, (ii) runway-only displays with an explicit aimpoint, and (iii) dot-only displays with an explicit aimpoint. Each exposure block consisted of nine observation trials that represented each of the glideslopes to be examined (3º, 6º, or 9º) at each actual TTC (4, 6.5 or 14 seconds). Unlike the experimental trials (presented after these exposure trials), each automated simulation display remained visible until touchdown was achieved. These trials familiarised participants with the different display characteristics without requiring a task component. During the experimental trials, the PM task was employed to obtain the TTC error data. Experimental displays were visible for only 2 seconds and then the screen went blank for the rest of the trial. Ideally, the participants needed to press the button to indicate touchdown at 2, 4.5 or 12 seconds after display occlusion. No feedback was provided on performance accuracy for the experimental trials. In total, the testing session lasted 1.5 hours per participant.
Analyses
TTC error data was obtained by subtracting the actual TTC from the participant’s estimated TTC for each trial. A repeated measures ANOVA10 was then performed on the mean TTC judgment error data {Scene type (runway-only, dot-only, runway-dot) x Aimpoint type (Aim or NoAim) x Glideslope Type (3º, 6º or 9º) x Actual TTC (4, 6.5 or 14 seconds)}. There were four replications of each experimental condition.
2.1.2 Results and discussion
This preliminary study provided some support for the notion that the tau cue is used to perceive TTC. The perceived TTC strategy predicted that timing judgments based on the tau cue would improve when additional texture was provided along the aiming line. Consistent with this prediction, both dot-only and runway-dot displays were found to produce more accurate judgments than runway-only displays (F1,18 = 9.27, p < .0006) - as there was more texture along the aiming line in both the former displays compared to the latter (see Figure 4). The additional ground texture in the dot-only and runway-dot displays could also have reduced the TTC error by improving distance perception. The perceived runway angle hypothesis, where runway-only and runway-dot displays were expected to produce superior performance compared to dot-only displays, was not supported by this scene type finding.
10 In a repeated measures design, each participant is measured on all of the different stimulus
conditions (Gravetter & Wallnau 2004).
10
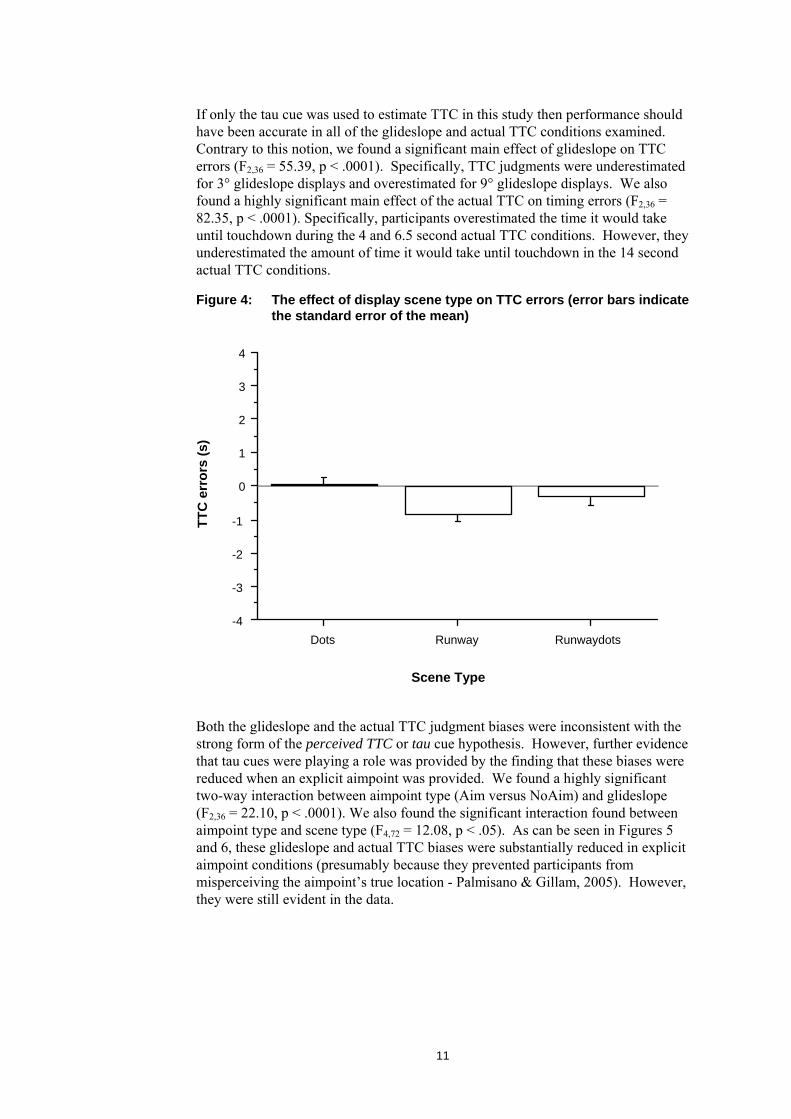
If only the tau cue was used to estimate TTC in this study then performance should have been accurate in all of the glideslope and actual TTC conditions examined. Contrary to this notion, we found a significant main effect of glideslope on TTC errors (F2,36 = 55.39, p < .0001). Specifically, TTC judgments were underestimated for 3° glideslope displays and overestimated for 9° glideslope displays. We also found a highly significant main effect of the actual TTC on timing errors (F2,36 = 82.35, p < .0001). Specifically, participants overestimated the time it would take until touchdown during the 4 and 6.5 second actual TTC conditions. However, they underestimated the amount of time it would take until touchdown in the 14 second actual TTC conditions.
Figure 4: The effect of display scene type on TTC errors (error bars indicate the standard error of the mean)
Dots Runway Runwaydots-4
-3
-2
-1
0
1
2
3
4
Both the glideslope and the actual TTC judgment biases were inconsistent with the strong form of the perceived TTC or tau cue hypothesis. However, further evidence that tau cues were playing a role was provided by the finding that these biases were reduced when an explicit aimpoint was provided. We found a highly significant two-way interaction between aimpoint type (Aim versus NoAim) and glideslope (F2,36 = 22.10, p < .0001). We also found the significant interaction found between aimpoint type and scene type (F4,72 = 12.08, p < .05). As can be seen in Figures 5 and 6, these glideslope and actual TTC biases were substantially reduced in explicit aimpoint conditions (presumably because they prevented participants from misperceiving the aimpoint’s true location - Palmisano & Gillam, 2005). However, they were still evident in the data.
TTC
err
ors
(s)
Scene Type
11

Figure 5: The effects of aimpoint type and glideslope type (3°, 6°, 9°) on TTC errors (error bars indicate the standard error of the mean)
3deg 6deg 9deg-4
-3
-2
-1
0
1
2
3
4
NoAim
Aim
glideslope
TTC
err
ors
(s)
On the one hand, these biases might reflect genuine errors in estimating the TTC. For example, they could be taken as evidence that perceived distance or perceived runway angle were biasing TTC judgments based on tau. On the other hand, it was possible that the biased performance found with the PM task reflected significant non-perceptual difficulties. Experiment 2 tested this latter performance-based explanation of timing errors.
Figure 6: The effect of aimpoint type and scene type on TTC errors (error bars indicate the standard error of the mean)
Dots Runway Runwaydots-4
-3
-2
-1
0
1
2
3
4
NoAim
Aim
Texture
TTC
err
ors
(s)
12

2.2 Experiment 2: Six-second flare timing judgments While Experiment 1 provided some support for the notion that timing judgments were based on perceived TTC and tau cues, performance was too biased to allow for accurate flare initiation. However, it was possible that the bias observed in our PM task was due to performance errors when the screen went blank (as opposed to indicating a true perceptual error). Following their brief 2-second exposure to the visual display, participants had to count down their estimated TTC from the time of the screen went blank. Even if TTC was accurately perceived using tau cues at the time of occlusion, clocking errors and poor response timing could have led to the biased judgments found in this experiment11 (DeLucia & Liddell 1998; Pei, Cook & Gong 1999; Tresilian, JR 1995).
The task used in Experiment 2 was designed to provide a purer estimate of the perceptual error. In this new Flare Timing task, participants had an uninterrupted view of the landing display until they indicated that it was time to initiate the flare (after they made their response the display disappeared). In an earlier study, Mulder et al (2000) chose 6 seconds as the critical TTC value at which their (non-pilot) participants should initiate their idealised pre-programmed flare12. Thus, we informed participants in our experiment that they should initiate an idealised pre-programmed flare 6 seconds prior to their perceived touchdown.
2.2.1 Method
Participants
These were 21 undergraduate psychology students (14 females and six males; aged between 18 and 42 years). All were non-pilots with either normal or corrected-to-normal vision. None had participated in Experiment 1.
Visual displays
Displays were similar to those used in Experiment 1, with the following exceptions: (i) they all provided an explicit aimpoint and an explicit line which coincided with the location of the true horizon; and (ii) the actual TTC at the beginning of the display was adjusted to either 8, 12, or 16 seconds, so that participants had sufficient time to initiate the 6 second flare response.
11 They could also have used a strategy referred to as cognitive motion extrapolation, where they
timed their response using “an internal model of the displayed motion trajectory” (Schiff & Oldak 1990, pp. 303). However, as Pei et al (1999) have recently shown that TTC estimates based on the PM task can be highly accurate after clocking errors are taken into account, we will not discuss this possibility further (See also Pei, J 2002).
12 Mulder et al (2000) noted that typical values of TTC in real or simulated flight tended to be less than the 6 seconds used in their study (pp. 303).
13

Procedure
The experimental procedure was similar to that in Experiment 1, with the following exceptions. In order to familiarise participants with this task, we had three training phases which were run just prior to each experimental block:
(i) A time-interval learning (TIL) task. Participants pressed the space bar and then 6 seconds later a beep would sound (10 replications).
(ii) A time-interval estimation (TIE) task. Participants pressed the space bar and then 6 seconds later clicked on the mouse button (10 replications).
(iii) Landing simulation demonstration. Participants passively observed each of the conditions examined in the main experiment. In each automated exposure trial, the computer beeped 6 seconds prior to touchdown to indicate the ideal time for the pre-programmed flare response. Visual displays continued until actual touchdown was achieved.
The experimental trials followed directly after this training and utilized the new Flare Timing task, where participants pressed a mouse button when they perceived it was 6 seconds prior to their perceived touchdown.
Analysis
Data was obtained for two tasks; the 6 second Flare Timing task and the 6 second TIE task. Errors on the Flare Timing task represent the mismatch between when the participant perceived that he/she had 6 seconds to touchdown compared to when he/she actually had 6 seconds to touchdown. A repeated measures ANOVA was then performed on this mean flare timing error data [Scenery type (runway-only, dot-only, runway-dot) x Actual TTC (8, 12 or 16 seconds) x Glideslope type (3º, 6º or 9º)]. There were 10 replications of each condition. The TIE data was then used to provide an estimate the non-perceptual component of the flare timing error.
2.2.2 Results and discussion
Unlike Experiment 1, we did not find a significant effect of scene type on flare timing errors (F2,34 = 0.58, p<0.05). Thus, it seems likely that the scenery effects found in Experiment 1 arose because participants misperceived the location of aimpoint during runway-only conditions that did not contain an explicit marking (presumably due to the lack of ground texture and the presence of an artificial false horizon in these displays). In the current experiment, an explicit aimpoint and an explicit horizon were provided in all of the displays, which would have reduced the likelihood of participants misperceiving the location of their future touchdown point (the implicit aimpoint specified by the display motion). While this explanation is consistent with the use of the tau cue, significant glideslope (F2,34 = 4.96, p<0.05) and actual TTC (F2,34 = 207.06, p <0.05) biases persisted despite the new flare timing task (see Figure 7). For example, participants overestimated the time it would take to touchdown on the runway during the 8 and 12 second actual TTC conditions. However, they underestimated the amount of time it would take to touchdown in the 16 second actual TTC conditions. Thus, it was still possible that these biases were perceptual (as opposed to performance) based in origin.
14

Figure 7: The effects of glideslope and actual TTC on flare timing errors (error bars indicate the standard error of the mean)
8s 12s 16s-4
-3
-2
-1
0
1
2
3
4
9deg
6deg
3deg
Actual TTC
Flar
e Ti
min
g E
rror
(s)
The results indicated that the absolute flare timing error was on average 2.3 seconds. Since the absolute error for the TIE control task was on average 0.72 seconds, approximately 30% of the error in the flare timing task could be attributed to general performance (i.e. non-perceptual) errors. This means that significant flare timing errors remained in Experiment 2 after display occlusion, clocking and response timing issues had been accounted for by the new task.
2.3 Experiment 3: Effect of feedback on six-second flare timing judgments Based on the perceptual biases found in the previous experiments, it was possible that participants might require performance feedback in order to identify the ideal performance strategy(ies) for this specific landing scenario (Gagnon, Fleury & Bard 1998; Tresilian, JR 1995). Experiment 3 compared the flare timing judgments produced with no feedback, lexical feedback, or experienced feedback on every trial. In no feedback and lexical feedback conditions, visual display motion ceased as soon as the participant indicated that it was time to initiate the 6-second flare (with a button press). In the lexical feedback conditions, this feedback was provided directly after the trial – with one of the following three messages written on the screen: “too early”, “too late”, or “ok”. In the experienced feedback conditions, visual display motion continued after the button was pressed until simulated touchdown (these conditions were similar to the landing simulation training displays used in Experiment 2). This allowed participants to experience the full time interval from button press to touchdown and determine how well it corresponded to the critical TTC of 6 seconds.
15

2.3.1 Method
The apparatus, visual displays and procedure were the same as those in Experiment 3, with the only exceptions being that: (i) Feedback was provided on two-thirds of the trials (either lexical or experienced); (ii) Displays all simulated a 3º glideslope towards a ground plane containing a runway outline, additional ground texture, an explicit aimpoint and an explicit horizon; and (iii) participants were instructed to use the feedback (when it was available) to help refine their flare timing judgments.
Participants
These were 14 undergraduate psychology students (nine females and five males; aged between 18 and 24 years). All were non-pilots with normal or corrected-to-normal vision. None had participated in Experiments 1 and 2.
Analysis
A repeated measures ANOVA was performed on the mean flare timing error data [Actual TTC (8, 12 or 16 seconds) x Feedback type (no feedback, lexical feedback or experienced feedback)]. There were 10 replications of each condition.
2.3.2 Results and discussion
As in previous experiments, a significant main effect of the actual TTC (F2,26 = 88.20, p <0.0001) was found. Eight second actual TTCs were overestimated and 16 second actual TTCs were underestimated (see Figure 8). While the main effect of feedback type did not reach significance (F2,13 = 2.49, p > 0.05), a significant interaction was found between actual TTC and feedback type (F4,52 = 14.61, p < 0.0001). Specifically, both underestimation and overestimation errors (produced by the different actual TTC conditions) were reduced when feedback was provided (see Figure 8). The mean absolute flare timing errors for the experiment were 1.52 seconds for no feedback, 0.92 seconds for lexical feedback and 0.81 seconds for experienced feedback. Post-hoc tests revealed that: (i) Lexical feedback significantly reduced performance error compared to no feedback (p < 0.05); (ii) Experienced feedback also significantly reduced performance error compared to no feedback (p < 0.05); and (iii) the improvements provided by lexical feedback were not significantly different to those provided by experienced feedback (p > 0.05).
16

Figure 8: The effects of actual TTC and feedback type on flare timing errors (error bars indicate the standard error of the mean)
8s 12s 16s-4
-3
-2
-1
0
1
2
3
4
Experienced
Lexical
No
Actual TTC
Flar
e Ti
min
g Er
ror (
s)
Since the actual TTC bias persisted when general performance errors13 were accounted for using the TIE control data, it seems that either distance misperceptions or an inappropriate use of the perceived runway angle strategy was responsible for this bias.
2.4 Experiment 4: Effect of locus of attention on six-second flare timing judgments Is there a particular feature of the scene that helps pilots to time the flare manoeuvre? If only the tau cue is used, then one might predict that performance should be better when the pilot looks directly at his/her aimpoint on the runway (Mulder et al 2000). Contrary to this notion, pilots are typically instructed to move their fixation away from the aimpoint towards the far end of the runway just prior to initiating the flare (e.g. Thom, T 1994). To examine the importance of the locus of attention, Experiment 4 had participants fixate on one of three different scene locations (indicated by a 1º wide x 1º high yellow cross) as they waited to initiate their flare response during the landing simulation. The three-scene locations examined were: (i) the explicit aimpoint; (ii) the explicit horizon - located 10º above the aimpoint; or (iii) a location 10º below the aimpoint.
2.4.1 Method
The apparatus and procedure were identical to those of Experiment 3 with the following exceptions: (i) participants were instructed to always fixate on the yellow cross throughout the simulation (as opposed to the red explicit aimpoint); and (ii) lexical feedback was provided after all of the experimental trials.
13 These performance errors were again approximately 30% of the total error in the flare timing task.
17

Participants
These were 17 undergraduate psychology students (12 females and five males; aged between 18 and 47 years). All were non-pilots with normal or corrected vision. None had participated in Experiments 1 to 3.
Visual displays
The displays were identical to those used in Experiment 3 with the sole exception being that an additional 1º wide x 1º high yellow fixation cross was placed either: (i) at the aimpoint location; or (ii) at a location 10º above the aimpoint on the explicit horizon line; or (iii) at a location 10º below the aimpoint on the ground.
Analysis
A repeated measures ANOVA was performed on the mean flare timing error data {Actual TTC (8, 12 or 16 seconds) x Fixation Location (horizon, aimpoint, below)}. There were 10 replications of each condition.
2.4.2 Results and discussion
We found a significant main effect of fixation location on flare timing errors (F2,32 = 3.45, p < 0.04) (see Figure 9). Specifically, there was a modest performance advantage when participants fixated on the horizon as opposed to their simulated aimpoint or a location below their simulated aimpoint (p <0.05). The mean absolute flare timing errors for the experiment were 1.0 seconds for horizon fixation, 1.2 seconds for aimpoint fixation and 1.2 seconds for below fixation. While this finding was consistent with contemporary flight training (Thom 1994), it was somewhat unexpected based on the findings of previous studies (e.g. our Experiment 1, Mulder et al 2000) that the aimpoint provides important information for timing the landing flare. As in our previous experiments, we found a significant main effect of actual TTC (F2,32 = 10.46, p < 0.0003), but no significant interaction between the fixation location and actual TTC (F4,64 = .87, p > 0.05). Thus, it appeared that actual TTC produced approximately similar judgment biases for all three fixation location conditions.
18

Figure 9: The effects of actual TTC and fixation location on critical TTC errors (error bars indicate the standard error of the mean
8s 12s 16s-4
-3
-2
-1
0
1
2
3
4
Below
Horizon
Aimpoint
Actual TTC
Flar
e Ti
min
g E
rror
s (s
)
2.5 Experiment 5: Two-second flare timing judgements Both the critical TTC and the critical height AGL at which one should initiate the flare depend on a variety of factors (e.g. aircraft type, approach speed, wing loading, sink rate, environmental conditions, etc). In Experiment 5, a shorter critical TTC for initiating our pre-programmed flare was used. Participants simply pressed a button when they perceived that they were 2 seconds from touchdown (which is closer to the ideal time to initiate the flare when landing an ordinary trainer (e.g. Thom, T 1994). Since previous studies have shown that the variability in timing judgments increases dramatically as the actual TTC increased (e.g. Tresilian, JR 1995), we predicted that flare timing errors for this 2-second timing flare task would be smaller than those in Experiments 2 to 4.
2.5.1 Method
No fixation cross was provided in this experiment. The visual displays and procedure were identical as those in Experiment 3, with the only exceptions being that: (i) participants pressed the button when they perceived that they were 2 seconds from touchdown; (ii) lexical feedback was provided for half of the trials and no feedback for the remainder; and (iii) the TIL and TIE tasks were both set for 2 seconds (as opposed to 6 seconds).
Participants
These were 19 undergraduate psychology students (nine females and 10 males; aged between 17 and 24 years). All were non-pilots with normal or corrected-to-normal vision. None had participated in Experiments 1 to 4.
19

Analysis
A repeated measures ANOVA was performed on the mean flare timing error data {Actual TTC (8, 12, or 16 seconds) x Feedback type (no Feedback or Feedback)}. There were 30 replications of each condition.
2.5.2 Results and discussion
As predicted, the flare timing error was marginally reduced with the 2-second timing task (compared to the 6-second timing task) – e.g. the absolute flare timing error was 0.77 seconds for the lexical feedback conditions. However, we still found a significant effect of the actual TTC (F2,34 = 35.05, p < .0001). Specifically, the shorter 8 second actual TTC conditions produced reasonably accurate flare timing performance, whereas the longer 16 second actual TTC conditions produced underestimation errors. As predicted, the main effect of feedback was also found to reach significance (F1,17 = 13.54, p < .002), with lexical feedback conditions leading to a substantial reduction in flare timing error compared to no feedback conditions. We also found a significant interaction between actual TTC and lexical feedback (F2,34 = 8.91, p < .001 - see Figure 10). Based on our TIE control task, we estimated that 84% of the absolute flare timing error was perceptual in origin (i.e. 0.65 seconds).
Figure 10: The effects of actual TTC and lexical feedback on 2s flare timing errors (error bars indicate the standard error of the mean)
8s 12s 16s-4
-3
-2
-1
0
1
2
3
4
Feedback
NoFeed
Actual TTC
Flar
e Ti
min
g E
rror
s (s
)
20

2.6 Experiment 6a: Pilot landing flare survey In this survey study, we examined pilot perceptions of the landing flare. In the questionnaire, student pilots and private pilots rated the perceived difficulty of the landing flare (compared to other standard flight manoeuvres) and identified the cues/factors that they believed were responsible for the successful timing and execution of this manoeuvre.
2.6.1 Method
Participants
Eight student pilots (seven males and one female) and eight private pilots (all male) were recruited for this study from the Australian Aerial Patrol Flight School located at Albion Park, New South Wales. All had normal or corrected-to-normal vision. The student pilots had a mean age of 25.6 years and had accrued 23 flight hours on average. The private pilots had a mean age of 38.4 years and had accrued 217 flight hours on average.
Materials
Pilot perceptions were assessed with a 9-item questionnaire, using items modified from the Benbassat and Abramson (2002) survey study.
Procedure
Pilots were asked to identify the most difficult manoeuvre out of a list of 10 standard flight manoeuvres. They were then asked whether they relied on visual or other information (“instrument readings”, “gut reaction”, “sense of balance”, “other”) to initiate the landing flare. If participants responded that they used “vision” to initiate the flare, they were asked to indicate whether they used one of more of the following the monocular cues (“end of the runway”, “horizon”, “runway shape” or “markings”, “angle with the runway”, “familiar object”, “motion parallax”, “sink rate”, or “other” cues). They were then asked to indicate the factors that assisted them in determining when to initiate the landing flare during their first solo (“CFI instruction”, “instrument readings”, “practice”, “pilot manual”, “ground school training” or “other”). They were also asked to indicate the factors that were responsible for current successful landing flares (“pattern practice”, “natural ability”, “sheer luck”, “aviation books”, “my instructor”, “other”).
2.6.2 Results and discussion
Consistent with the earlier Benbassat and Abramson study, 15 of the 16 participants rated the landing flare as the most difficult of the 10 standard flight manoeuvres (compared to steep turns, takeoff roll, holding altitude, climbing, descending, taxiing, coordinated turns, forward slip and the landing roll). Forward slip, coordinated turns and steep turns were also identified as difficult manoeuvres by 4 participants. All 16 participants indicated that they used vision to initiate the landing flare (4 participants also indicated that gut reaction played a lesser role; none chose sense of balance). Importantly, less consensus emerged as to which specific visual cues were required for a successful landing. All of the potential cues identified in the questionnaire were chosen by one or more of the participants (see Figure 11).
21
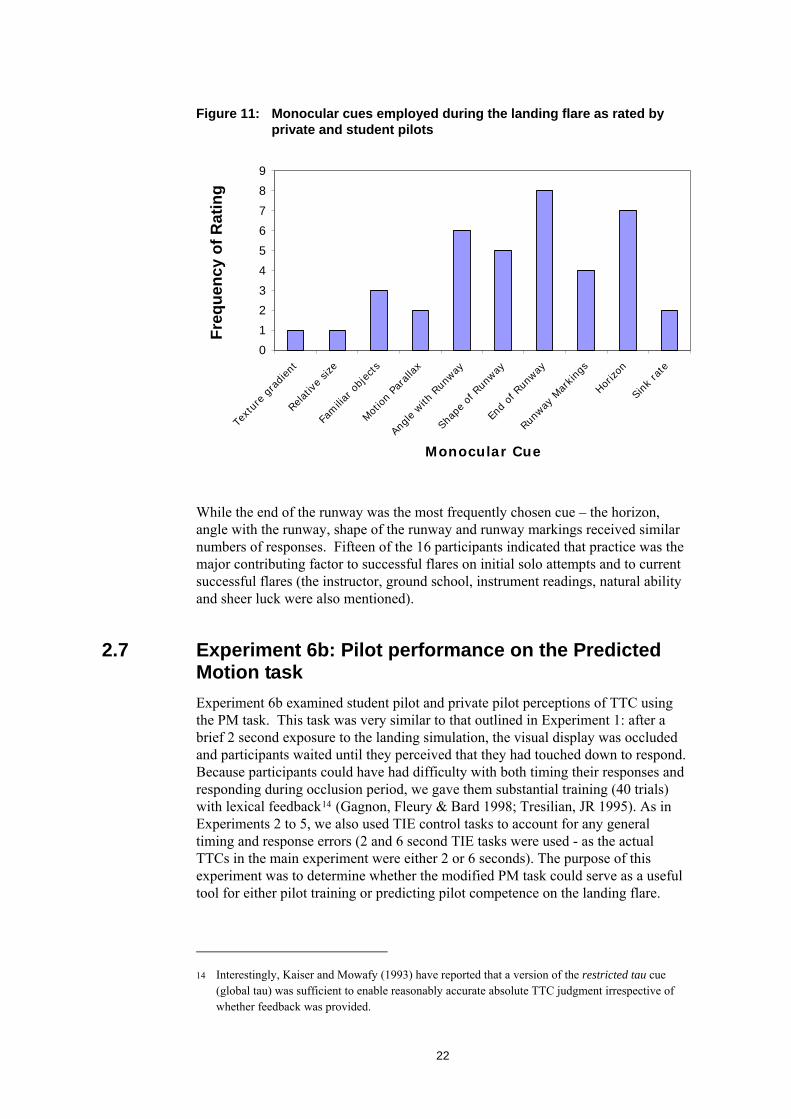
Figure 11: Monocular cues employed during the landing flare as rated by private and student pilots
0
1
2
3
4
5
6
7
8
9
Textur
e gr
adient
Relativ
e siz
e
Familia
r objec
ts
Motion Pa
ralla
x
Angle with
Run
way
Shap
e of R
unway
End of R
unway
Runw
ay M
arking
s
Horizo
n
Sink
rate
Monocular Cue
While the end of the runway was the most frequently chosen cue – the horizon, angle with the runway, shape of the runway and runway markings received similar numbers of responses. Fifteen of the 16 participants indicated that practice was the major contributing factor to successful flares on initial solo attempts and to current successful flares (the instructor, ground school, instrument readings, natural ability and sheer luck were also mentioned).
Freq
uenc
y of
Rat
ing
2.7 Experiment 6b: Pilot performance on the Predicted Motion task Experiment 6b examined student pilot and private pilot perceptions of TTC using the PM task. This task was very similar to that outlined in Experiment 1: after a brief 2 second exposure to the landing simulation, the visual display was occluded and participants waited until they perceived that they had touched down to respond. Because participants could have had difficulty with both timing their responses and responding during occlusion period, we gave them substantial training (40 trials) with lexical feedback14 (Gagnon, Fleury & Bard 1998; Tresilian, JR 1995). As in Experiments 2 to 5, we also used TIE control tasks to account for any general timing and response errors (2 and 6 second TIE tasks were used - as the actual TTCs in the main experiment were either 2 or 6 seconds). The purpose of this experiment was to determine whether the modified PM task could serve as a useful tool for either pilot training or predicting pilot competence on the landing flare.
14 Interestingly, Kaiser and Mowafy (1993) have reported that a version of the restricted tau cue
(global tau) was sufficient to enable reasonably accurate absolute TTC judgment irrespective of whether feedback was provided.
22
To test whether distance misperception influenced TTC judgments, we examined the performance with: (i) day and night lighting conditions; and (ii) with and without 3-D buildings. If accurate distance perception is required for accurate TTC perceptions, then optimal performance should be expected when displays had day lighting and contained the 3-D buildings (the worst performance would be expected when displays had night lighting and no buildings).
2.7.1 Method
Participants
The eight student pilots and eight private pilots tested in Experiment 6a also participated in this experiment.
Apparatus
Displays were generated by a Macintosh G5 personal computer and presented on a Sony Trinitron Multiscan G420 monitor (36.5 cm wide x 27.5 cm high, with a pixel resolution of 1280 x 1024 and an 85 Hz refresh rate). A chin rest was used to align the participant’s eye level with the simulated location of the display’s horizon – this chin rest was located 40 cm in front of the display.
Visual displays
Computer-generated displays simulated a constant velocity 3º approach (from a starting height of 30 m) towards a runway for 2 seconds – both day and night lighting conditions were examined in different trials. All displays provided an explicit aimpoint (red). The actual TTC with this aimpoint at the beginning of each visual display was either 4 or 8 seconds (i.e. 2 seconds later, at the time of visual display occlusion, the actual TTC with the aimpoint was 2 or 6 seconds respectively). These two actual TTC conditions were produced by manipulating the approach speed.
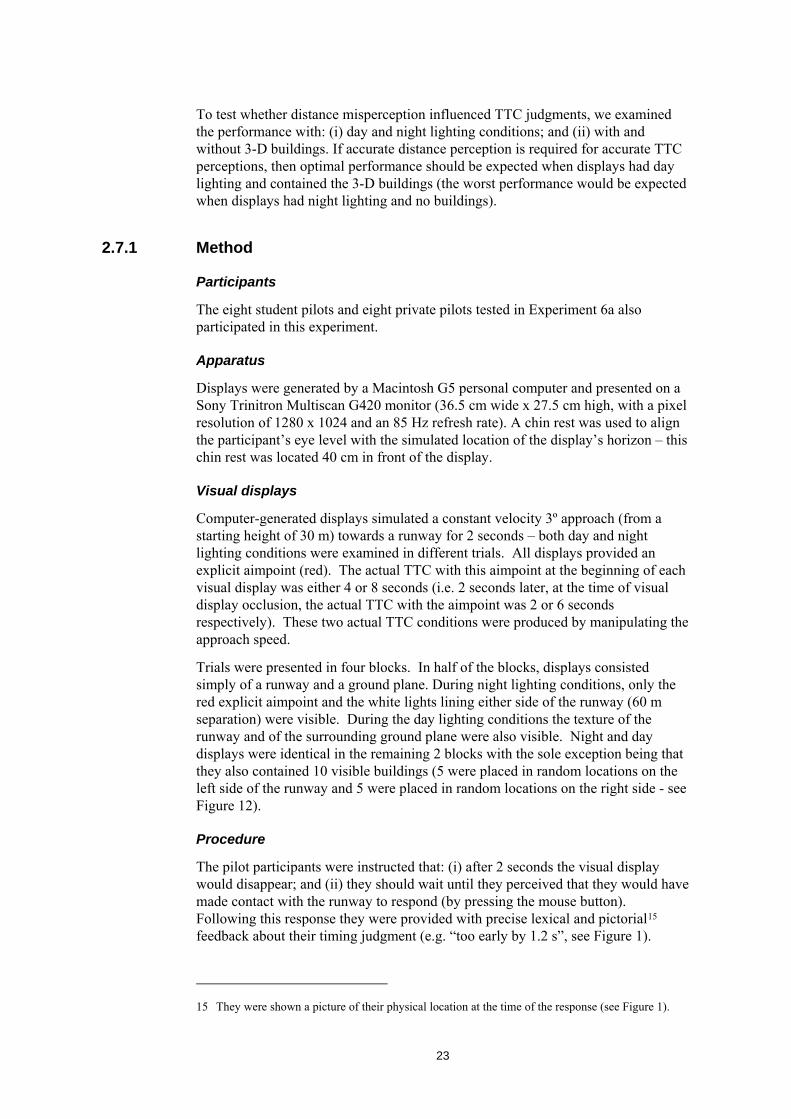
Trials were presented in four blocks. In half of the blocks, displays consisted simply of a runway and a ground plane. During night lighting conditions, only the red explicit aimpoint and the white lights lining either side of the runway (60 m separation) were visible. During the day lighting conditions the texture of the runway and of the surrounding ground plane were also visible. Night and day displays were identical in the remaining 2 blocks with the sole exception being that they also contained 10 visible buildings (5 were placed in random locations on the left side of the runway and 5 were placed in random locations on the right side - see Figure 12).
Procedure
The pilot participants were instructed that: (i) after 2 seconds the visual display would disappear; and (ii) they should wait until they perceived that they would have made contact with the runway to respond (by pressing the mouse button). Following this response they were provided with precise lexical and pictorial15 feedback about their timing judgment (e.g. “too early by 1.2 s”, see Figure 1).
15 They were shown a picture of their physical location at the time of the response (see Figure 1).
23

Figure 12: Examples of the day lighting stimuli (no buildings and buildings) used in Experiment 6b. The size of red explicit aimpoint has been increased to aid in the viewing of these images
Analyses
TTC error data was obtained by subtracting the actual TTC from the participant’s estimated TTC for each trial. A split-plot ANOVA was then performed on the mean TTC judgment error data (there were 10 replications of each condition). In this analysis, Pilot type (Student versus Private) was a between subjects factor and the each of the following was examined as within subjects factors {Scenery type (buildings or no buildings) x Actual TTC (2 or 6 seconds) x Lighting type (day or night)}.
2.7.2 Results and discussion
As in previous experiments, we found a highly significant main effect of actual TTC (F1,14 = 68.65, p < 0.0001). Specifically, the shorter the landing simulation, the smaller the TTC error (See Figure 13). Importantly, this finding indicates that both pilots and non-pilots were susceptible to this type of bias. Consistent with the notion that more visual depth cues were available during day and night lighting conditions, we found a significant main effect of lighting on TTC errors (F1,14 = 14.39, p < .01). We also found a significant main effect of display scenery (F1,14 = 6.01, p < .05). Specifically, TTC errors were reduced when 3-D buildings were placed on the ground plane (compared to no buildings in the scene, see Figure 13). This modest improvement in performance could be interpreted as evidence that perceived distance cues were influencing the participants’ TTC judgments (i.e. without the buildings, scene depth was misperceived and thus TTC was also misperceived).
While the main effect of pilot type did not reach significance in this experiment (F < 1), there was a significant interaction between all four factors (i.e. pilot type, scene type, lighting type, actual TTC; F1,14 = 5.37, p < 0.05). We interpreted this interaction as indicating that student pilot and private pilot performance was equivalent for all visual display conditions but one. Specifically, private pilots performed significantly better than student pilots during the 8s actual TTC conditions in day lighting (p < 0.05 – see Figure 14). It appears that under these particular conditions, the student pilots required buildings in the scene in order to achieve the same level of performance as the private pilots.
24

Figure 13: The effects of actual TTC and scenery type on TTC errors (error bars indicate the standard error of the mean)
2s 6s-4
-3
-2
-1
0
1
2
3
4
Buildings
No Buildings
Actual TTC
TTC
Err
ors
(s)
Figure 14: The effects of scenery type on the TTC errors of private and student pilots during day lighting conditions with 8s actual TTC. Error bars represent the standard errors of the mean.
The mean absolute TTC error for the experiment was 0.68 seconds. Thus, both our student and private pilot participants displayed the level of performance required to safely time the landing flare. Based on our TIE control task, we estimated that 70% of the flare timing error was perceptual in origin (i.e. 0.47 seconds).
TTC
Err
ors
(s)
Scene Type
25

2.8 Experiment 6c: Pilot performance on the two-second Flare Timing task Experiment 6c examined student pilot and private pilot performance on the Flare Timing task used in Experiments 2 to 5. The critical TTC value chosen for this flare timing task was 2 seconds (e.g. identical to the task conditions in Experiment 5). As in Experiment 6b, we were interested in whether our flare timing task could be useful either for pilot training or predicting pilot competence on the landing flare. To test whether distance misperception influenced flare timing judgments, we examined performance: (i) with both day and night lighting conditions; and (ii) with or without 3-D buildings. If accurate distance perception is required for accurate flare timing judgments, then optimal performance should be expected when displays had day lighting and contained the 3-D buildings.
2.8.1 Method
Participants
The eight student pilots and eight private pilots tested in Experiments 6a and 6b also participated in this experiment.
Visual displays
All displays were identical to those used in Experiment 6b except that the actual TTC was manipulated by varying the glideslope (as opposed to the simulated approach speed). Computer-generated displays simulated a constant velocity approach on either a 3º or a 6º glideslope towards a runway. As in Experiment 6b, day versus night lighting and buildings versus no buildings conditions were examined.
Procedure
Pilot participants were shown a demonstration program simulating an idealised flare initiated when the TTC with the ground (based on the constant velocity glide) reached 2 seconds. They were instructed that during the experiment they always needed to initiate the flare when they perceived that they were 2 seconds from touchdown. The rest of this procedure was identical to those of Experiments 2 to 5.
Analyses
Two separate split-plot ANOVAs were performed on the mean flare timing error data and the mean runway angle (ψ) at flare data (there were 10 replications of each condition). In each of these analyses, pilot type (student or private) was the between subjects factor and each of the following was examined as within subjects factors [Scenery type (buildings or no buildings) x Glideslope type (3º or 6º) x Lighting type (day or night)].
26
2.8.2 Results and discussion
Flare timing errors
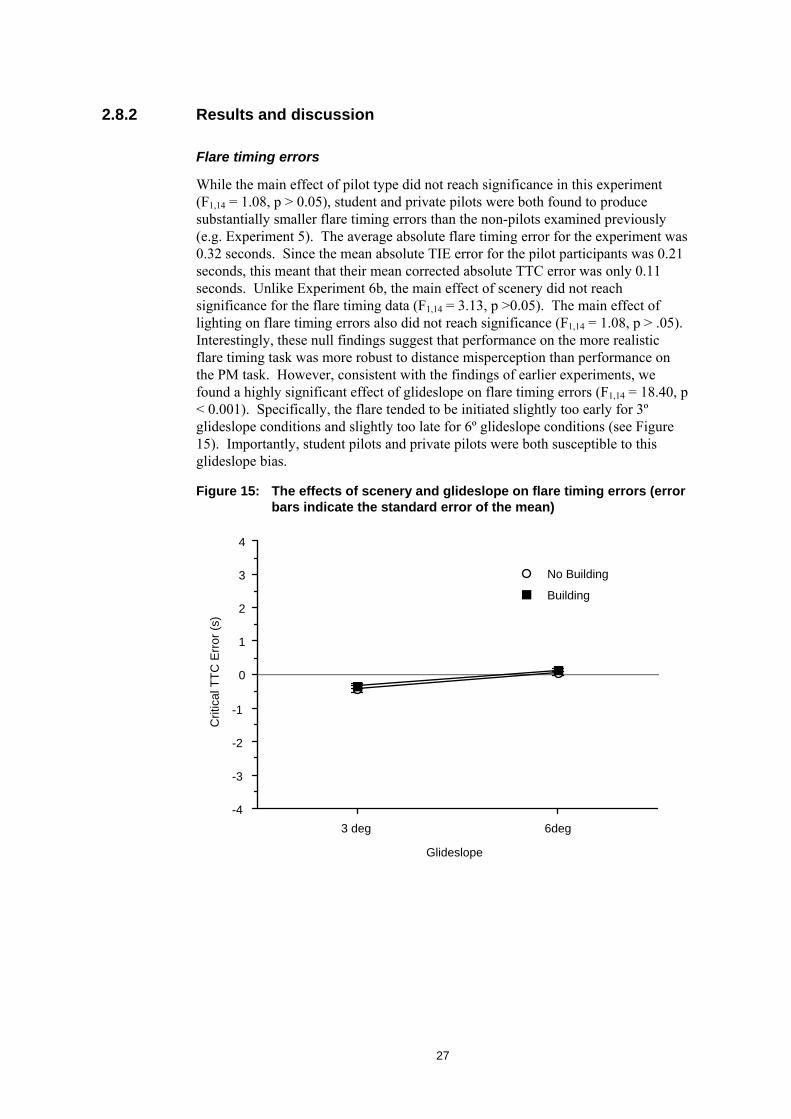
While the main effect of pilot type did not reach significance in this experiment (F1,14 = 1.08, p > 0.05), student and private pilots were both found to produce substantially smaller flare timing errors than the non-pilots examined previously (e.g. Experiment 5). The average absolute flare timing error for the experiment was 0.32 seconds. Since the mean absolute TIE error for the pilot participants was 0.21 seconds, this meant that their mean corrected absolute TTC error was only 0.11 seconds. Unlike Experiment 6b, the main effect of scenery did not reach significance for the flare timing data (F1,14 = 3.13, p >0.05). The main effect of lighting on flare timing errors also did not reach significance (F1,14 = 1.08, p > .05). Interestingly, these null findings suggest that performance on the more realistic flare timing task was more robust to distance misperception than performance on the PM task. However, consistent with the findings of earlier experiments, we found a highly significant effect of glideslope on flare timing errors (F1,14 = 18.40, p < 0.001). Specifically, the flare tended to be initiated slightly too early for 3º glideslope conditions and slightly too late for 6º glideslope conditions (see Figure 15). Importantly, student pilots and private pilots were both susceptible to this glideslope bias.
Figure 15: The effects of scenery and glideslope on flare timing errors (error bars indicate the standard error of the mean)
3 deg 6deg-4
-3
-2
-1
0
1
2
3
4
Building
No Building
Glideslope
Crit
ical
TTC
Err
or (s
)
27
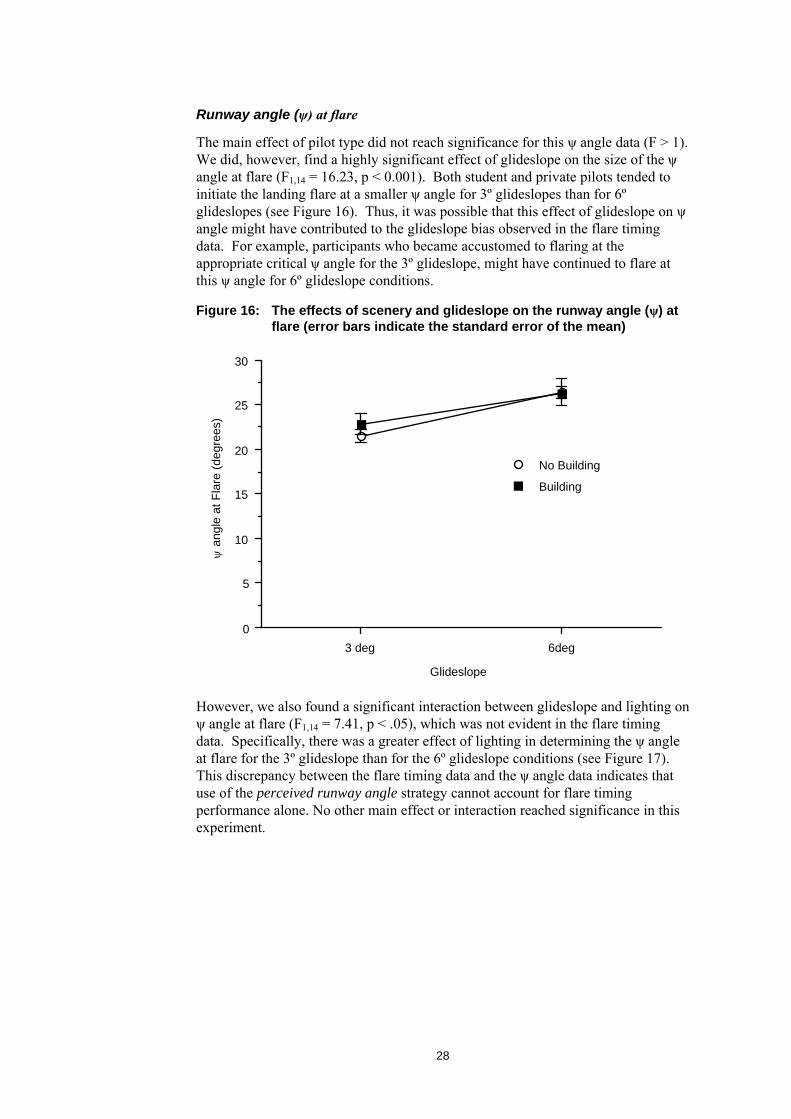
Runway angle (ψ) at flare
The main effect of pilot type did not reach significance for this ψ angle data (F > 1). We did, however, find a highly significant effect of glideslope on the size of the ψ angle at flare (F1,14 = 16.23, p < 0.001). Both student and private pilots tended to initiate the landing flare at a smaller ψ angle for 3º glideslopes than for 6º glideslopes (see Figure 16). Thus, it was possible that this effect of glideslope on ψ angle might have contributed to the glideslope bias observed in the flare timing data. For example, participants who became accustomed to flaring at the appropriate critical ψ angle for the 3º glideslope, might have continued to flare at this ψ angle for 6º glideslope conditions.
Figure 16: The effects of scenery and glideslope on the runway angle (ψ) at flare (error bars indicate the standard error of the mean)
3 deg 6deg0
5
10
15
20
25
30
Building
No Building
Glideslope
ψ a
ngle
at F
lare
(deg
rees
)
However, we also found a significant interaction between glideslope and lighting on ψ angle at flare (F1,14 = 7.41, p < .05), which was not evident in the flare timing data. Specifically, there was a greater effect of lighting in determining the ψ angle at flare for the 3º glideslope than for the 6º glideslope conditions (see Figure 17). This discrepancy between the flare timing data and the ψ angle data indicates that use of the perceived runway angle strategy cannot account for flare timing performance alone. No other main effect or interaction reached significance in this experiment.
28

Figure 17: The effects of glideslope and lighting on the runway angle (ψ) at flare (error bars indicate the standard error of the mean)
Day Night0
5
10
15
20
25
30
6deg
3 deg
Lighting
ψ a
ngle
at F
lare
(deg
rees
)
29

3 DISCUSSION The goal of our study was to identify the circumstances under which perceived time-to-contact (TTC) (based on tau as defined on page 4), perceived distance, or perceived runway angle strategies could be used to accurately time the initiation of the landing flare. Across the series of six experiments, each of these visual strategies was implicated in flare timing judgments. Consistent with the notion that TTC was perceived using the tau cue, timing judgments: (i) were shown to be highly error-prone when simulations contained only a runway outline; and (ii) improved significantly when visual displays contained an explicit aimpoint and contained extra texture along the aiming line (e.g. Experiment 1). However, significant glideslope and TTC biases were observed even under these improved conditions. Also not predicted by the tau cue hypothesis, we found that flare timing performance improved modestly when participants fixated the explicit horizon, as opposed to the explicit aimpoint or another location on the ground plane. This finding was consistent with both flight training manuals and pilot responses to our questionnaire (the ‘horizon’ and the ‘end of the runway’ were rated most frequently as the cues used to time the landing flare).
As we had hoped, private pilots (average of 217 flight hours) were found to perform better in certain visual display conditions than student pilots (average of 23 flight hours) using the modified prediction motion (PM) task (i.e. 8 second actual TTC, day lighting, no buildings). Our second flare timing task was not found to reliably discriminate student pilots and private pilots16. However, errors on this flare timing task were substantially smaller for both of our pilot types (0.11 seconds) compared to our lab-trained non-pilot participants (0.65 seconds - based on performance in identical conditions with feedback in Experiment 5). It is also important to note that the same patterns of judgment errors and biases were demonstrated on both tasks by all of our participants (non-pilots, student pilots and experienced pilots). This suggests that all of our participants were using similar strategies, the only difference being that the pilots were using them more effectively than the non-pilots.
Our control experiments indicated that a significant proportion of the timing judgment errors made by both pilots and non-pilots was performance-based in origin (ranging from 15% to 30%). However, significant perceptual biases remained when this performance error was accounted for. These glideslope and actual TTC biases indicated that perceived distance and perceived runway angle strategies must have played some role in the flare timing judgments of all our participants. We concluded that misperceptions of environmental distances and/or the inappropriate use of runway angle cues must have created these perceptual biases. For example, our finding that adding 3-D buildings to visual displays improved performance was consistent with a distance misperception account of the judgment biases.
16 Our private pilots were on average 13 years older than our student pilots. Previous studies have
reported an age effect on timing (e.g. Hancock & Manser 1997), which might have reduced the likelihood of pilot type differences in performance.
30

When performance feedback was provided at the end of every trial, the subsequent flare timing performance for both pilots and non-pilots improved dramatically. Both lexical feedback (e.g. “Too early by 0.5 s”) and experienced feedback (viewing the display after flare initiation until touchdown) were found to improve performance in a similar fashion. Contrary to notions of direct TTC perception (see 1.1.3), this marked improvement with feedback suggested that: (i) the timing judgments required for flare initiation did not reflect innate abilities; and (ii) substantial perceptual learning was required to master flare timing. Both of these conclusions were supported by the pilot survey data, which highlighted the importance of practice and feedback in both the acquisition and maintenance of flare timing skill.
3.1 Implications for Simulator Based Flight Training The findings of the present study have several possible implications for simulator training – both in terms of modifying or enhancing existing flight simulators and incorporating the types of timing tasks utilised in the present study into the training.
3.1.1 Minimal depth cue requirements for unbiased performance
Misperceptions of environmental distance and ground slant occur commonly in both entry-level flight simulators (Pierce et al 1998; Roscoe, SN 1979) and during real landings at night (Mertens, HW 1978; 1981; Palmisano & Gillam, 2005). We argued that if flare timing was based on tau cues then performance should have been unaffected by any misperceptions of environmental distance during our simulations. Contrary to this notion, we found systematic glideslope and actual TTC biases, which persisted even when conditions were optimal for the tau cue. Adding day lighting, ground texture and 3-D buildings to the landing simulations in Experiments 6b and 6c provided additional monocular depth information that was consistent with the simulated environmental distances. This additional information appears to have reduced the impact of the conflicting depth cues (stereopsis, convergence and accommodation)17, which indicated that the display was near and 2-D. The findings of the current study suggest that increasing the number of monocular depth cues in flight simulation displays, and even providing display collimation or stereoscopic depth cues where possible, should reduce judgment bias by enhancing participant perceptions of the simulated environmental depth and slant.
3.1.2 The importance of including aimpoint and true horizon markings
We also suggest two relatively simple and cost effective modifications to existing flight simulation software, which should allow the trainee to focus on mastering flare timing in isolation to other tasks (i.e. aimpoint perception, glideslope perception and control). Since performance on our PM and Flare Timing tasks improved dramatically with the inclusion of an explicit aimpoint and an explicit (true) horizon to the display, we believe that providing visual references to these locations should facilitate flare training during simulation – as they will allow trainees to focus solely on the timing of the flare manoeuvre (the focus being primarily to reduce the sink rate to safe levels).
17 See glossary of terms for definitions.
31

3.1.3 The PM and Flare Timing tasks as training tools
The TTC and flare timing tasks examined in the present study could also serve as valuable initial flight training tools in their own right. The modified PM task was shown to distinguish between private pilots and student pilots under certain visual display conditions. Furthermore, both the PM and flare timing tasks were shown to discriminate between pilot participants and non-pilot participants. We found a significant correlation between performance on the PM task and performance on the flare timing task [Pearson correlation r(60) = .36, p < .005]. However, these tasks were also non-redundant, as a substantial proportion of the variability in performance on the PM task could not be accounted for by the flare timing task (for example, significant lighting and scene effects were only evident with the PM task). Since both of our software packages focus solely on the flare stage, trainee pilots can perform hundreds of PM trials or initiate hundreds of simulated flares18 in the time that it would take to perform a single (real or simulated) ‘touch and go’. Thus, these two tasks could serve to supplement existing simulator based training.
18 In the case of commercially available simulation packages, this could be achieved by the
instructor setting the simulation to either a middle or late final approach.
32

33

4 GLOSSARY Accommodation a monocular cue to absolute egocentric distance. This
is based on muscular feedback that occurs when the eye’s lens is adjusted to allow focus on an object. Its effective range is 1-2m (Goldstein, EB 2002).
Atmospheric perspective a monocular depth cue. Farther away objects appear more blurred and bluer than closer objects (Goldstein, EB 2002).
Display collimation in more expensive simulators, lenses are used to focus the pilot’s eyes out near optical infinity (as opposed to 1m away on the 2-D screen). These are referred to as collimated displays. Research has shown that without such lenses, perceived environmental distance tends to be significantly reduced during flight simulation (compared to the environmental distances actually simulated by the display – Pierce et al 1998).
Convergence a binocular cue to absolute egocentric distance. This is based on muscle feedback that occurs when the two eyes are turned inwards or outwards to focus on an object (Foley, JM 1985).
Familiar size a monocular depth cue. Our knowledge of an objects actual size can influence its perceived distance (Goldstein, EB 2002).
Height in the Visual Field a monocular depth cue. Objects below the horizon appear to be further away when they are higher in the visual field. Objects above the horizon appear to be further away when they are lower in the visual field (Goldstein, EB 2002).
Motion parallax a monocular depth cue. This arises when the pilot is in motion. It is based on the difference in the perceived speed of movement of near and far objects (Helmholtz, H von 1866).
Occlusion a monocular depth cue. This arises when a nearer object partially hides a further away object from view (Goldstein, EB 2002).
Relative size a monocular depth cue. When two objects are similar in size, the more distant one will take up less of the field of view (Goldstein, EB 2002).
Stereopsis a binocular depth cue. Due to our horizontally separated eyes and overlapping visual fields, we simulataneously receive 2 different 2-D views of the same scene. As a result, the same object can have different horizontal and vertical positions in the 2 eyes. This binocular disparity acts as a compelling depth cue (e.g. 3-D Imax movies – Palmisano, S 2002).
34

Texture gradient a monocular depth cue. Equally spaced texture elements of equal size (e.g. blades of grass) will appear to be packed closer and closer together as distance increases. The result of this is the formation of gradients of linear perspective and compression (Goldstein, EB 2002).
Tau a monocular cue to time-to-contact. During a landing, tau can be defined as the ratio of the angular distance between any two points on the ground (which happen to lie along the aiming line) divided by how fast this angular distance is increasing (Mulder et al 2000).
Time-to-contact time remaining until the aircraft's wheels make contact with the runway if no further action is taken, in both an accurate and unbiased manner (Mulder et al 2000).
35

5 REFERENCES Benbassat, D, & Abramson, CI 2002, ‘Landing flare accident reports and pilot perception analysis’, The International Journal of Aviation Psychology, vol. 12, pp. 137-152.
DeLecia, PR, & Liddell, GW 1998 ‘Cognitive motion extrapolation and cognitive clocking in prediction motion tasks’, Journal of Experimental Psychology: Human Perception & Performance, vol. 24, pp. 901-914.
Foley, JM 1985, ‘Binocular distance perception: Egocentric distance tasks’, Journal of Experimental Psychology: Human Perception & Performance, vol. 11, pp. 133-149.
Gagnon, M, Fleury, M, & Bard, C 1988, ‘Knowledge of results and spatial-temporal control in an anticipation task among 6- to 10-yr-old children’, Canadian Journal of Psychology, vol. 42, pp. 347-363.
Gibson, JJ, Olum, P, & Rosenblatt, F 1955, ‘Parallax and perspective during aircraft landings’, American Journal of Psychology, vol. 68, pp. 372-385.
Gavetter, FJ, & Wallnau, LB 2004, Statistics for the Behavioural Sciences (6th Edition), Thompson Wadsworth, Southbank, Victoria.
Goldstein, EB 2002, Sensation and Perception (6th Edition). Wadsworth., Pacific Grove, CA.
Gray, R & Regan, D 2000, ‘Do monocular time-to-collision estimates necessarily involve perceived distance?’, Perception, vol. 28, pp. 1257-1264.
Grosslight, JH, Fletcher, HJ, Masterton, B & Hagen, R 1978, ‘Monocular vision and landing performance in general aviation pilots: Cyclops revisited’, Human Factors, vol. 20, pp. 27-33.
Grosz, J, Rysdyk, RT, Bootsma, RJ, Mulder, JA, Vaart, JC van der & Wieringen, PC W, van 1995, ‘Perceptual support for timing of the flare in the landing of an aircraft’, In JM Flach, PA Hancock, JK Caird, & KJ Vicente (Eds.), Local applications of the ecological approach to human-machine systems (pp. 104-121), Lawrence Erlbaum Associates, Hillsdale, NJ.
Hancock, PA & Manser, MP 1997, ‘Time-to-contact: More than tau alone’, Ecological Psychology, vol. 9, pp. 265-297.
Helmholtz, H von 1911, Treatise on physiological optics, Translated from 3rd German Edition ( JP Southall, Ed. & Trans.), Optical Society of America, Rochester, NY.
Hoffman, ER 1994, ‘Estimation of time to vehicle arrival: Effects of age on use of available visual information’, Perception, vol. 23, pp. 947-955.
Hoyle F, 1957, The Black Cloud. London: Penguin (pp. 26-27).
Kaiser, MK & Mowafy, L 1993, ‘Optical specification of time-to-passage: Observers’ sensitivity to global tau’, Journal of Experimental Psychology: Human Perception and Performance, vol. 19, pp. 1028-1040.
Langewiesche, W 1972, Stick and rudder. McGraw-Hill, New York.
36

Lee, DN 1976, ‘A theory of the visual control of braking based on information about time-to-collision’ Perception, vol. 5, pp. 437-459.
Lewis, CE & Krier, GE 1969, ‘Flight research program XVI: Landing performance in a jet aircraft after loss of binocular vision’, Aerospace Medicine, vol. 40, pp. 957-963.
Lewis, CE, Blakeley, RW, Masters, RL & McMurty, TC 1973, ‘Landing performance by low-time private pilots after the sudden loss of binocular vision – Cyclops II’, Aerospace Medicine, vol. 44, pp. 1241-1245.
Manser, MP & Hancock, PA 1996, ‘Influence of approach angle on estimates of time-to-contact’ Ecological Psychology, vol. 8, pp. 71-99.
Mertens, HW 1978, ‘Perceived orientation of a runway model in nonpilots during night approaches to landing’ Aviation, Space, and Environmental Medicine, vol. 49, pp. 457-460.
Mertens, HW 1981, ‘Perception of runway image shape and approach angle magnitude by pilots in simulated night landing approaches’, Aviation, Space & Environmental Medicine, vol. 52, pp. 373-386.
Monen, J & Brenner, E 1994, “Detecting changes in one’s own velocity from the optic flow” Perception, vol. 23, pp. 681-690.
Mulder, M, Pleijsant, J, Vaart, H, van der & Wieringen, P van 2000, ‘The effects of pictorial detail on the timing of the landing flare: Results of a visual simulation experiment’, The International Journal of Aviation Psychology, vol. 10, pp. 291-315.
Palmisano, S 1996, ‘Perceiving self-motion in depth: The role of stereoscopic motion and changing-size cues’, Perception & Psychophysics, vol. 58, pp. 1168-1176.
Palmisano, S 2002, ‘Consistent stereoscopic information increases the perceived speed of vection in depth’, Perception, vol 31, pp. 463-480.
Palmisano, S & Gillam, B 2005, ‘Visual perception of touchdown point during simulated landing’, Journal of Experimental Psychology: Applied, vol. 11, pp. 19-32.
Pei, J, 2002 ‘The accuracy of time-to-contact estimation in the prediction motion paradigm’, Doctoral Dissertation, University of Canberra.
Pei, J, Cook, M & Gong, J 1999, ‘The clocking process and time-to-contact estimation under different display conditions’, In D Harris (Ed.), Engineering Psychology and Cognitive Ergonomics: Vol. 3. Transportation Systems, Medical Ergonomics and Training (pp. 367-376). Aldershot: Ashgate.
Pierce, BJ, Geri, GA, & Hitt JM 1998, ‘Display collimation and the perceived size of flight simulator imagery’, Raytheon Training and services Mesa AZ (Report Number: A904953).
Regan, D & Gray, R 2000, ‘Visually guided collision avoidance and collision achievement’, Trends in Cognitive Sciences, vol. 4, pp. 99-107.
Riordan, RH 1974, ‘Monocular visual cues and space perception during the approach to landing’, Aerospace Medicine, vol. 45, pp. 766-771.
37

Roscoe, SN 1979, ‘When the day is done and shadows fall, we miss the airport most of all’, Human Factors, vol. 21, pp. 721-731.
Schiff, W & Detwiler, ML 1979, ‘Information used in judging impending collision’, Perception, vol. 6, pp. 647-658.
Thom, T 1994, The Flying Training Manual: Pre-flight Briefings and Air Exercises, Aviation Theory Centre, Williamstown.
Tresilian, JR 1995, Perceptual and cognitive processes in time-to-contact estimation: Analysis of prediction-motion and relative judgment tasks. Perception and Psychophysics, vol. 57, pp. 231-245.
38