Investigation of the interaction between hot water ... · table for domestic hot water cylinders,...
79
Prepared by: Kiwa GASTEC at CRE Prepared for: DECC Contract Number: 30047 Date: January 2013 Investigation of the interaction between hot water cylinders, buffer tanks and heat pumps
-
Upload
trannguyet -
Category
Documents
-
view
214 -
download
1
Transcript of Investigation of the interaction between hot water ... · table for domestic hot water cylinders,...

Prepared by: Kiwa GASTEC at CRE Prepared for: DECC Contract Number: 30047 Date: January 2013
Investigation of the interaction
between hot water cylinders, buffer
tanks and heat pumps

DECC 30047
© Kiwa Ltd 2013
Investigation of the interaction between hot water cylinders, buffer
tanks and heat pumps
Prepared by
Name Helen Charlick
Position Energy Consultant
Approved by
Name Iain Summerfield
Position Principal Consultant
Date January 2013
Commercial in Confidence
Kiwa GASTEC at CRE Kiwa Ltd The Orchard Business Centre Stoke Orchard Cheltenham GL52 7RZ UK Telephone: +44 (0)1242 677877 Fax: +44 (0)1242 676506 E-mail: [email protected] Web: www.kiwa.co.uk

DECC 30047
© Kiwa Ltd 2013
Executive Summary
The results from recent field trials on heat pumps [1] and solar thermal hot water systems
[2] have highlighted problems with hot water storage vessels, both for domestic hot water
and when used as heating system buffer tanks. This piece of work re-assesses the data
from the Energy Saving Trust (EST) condensing boiler field trial [3] looks at losses from
heat pump Domestic Hot Water (DHW) cylinders in different operating modes and looks at
buffer tank optimisation.
From the EST condensing boiler field trial data [3], regular boilers gave a boiler efficiency of
81% in the summer. However the efficiency of heat delivered to the taps was only 38% on
average. Large daily draw-offs led to greater overall efficiency, because the standing
losses became a smaller proportion of the heat delivered from the boiler. For combination
boilers, on average 51% of the energy was delivered to the taps (although the
measurement method excluded pipe losses). The higher energy users did not necessarily
have higher ratios of DHW output compared to losses; this was because when using a
combination boiler, the length of the draw-off was the most important factor. Long draw offs
had the highest efficiencies, indicating that the losses were dominated by start up and
shutdown losses of the boilers.
The DHW cylinder test programme showed that:
Large daily draw-offs result in high efficiency, i.e. the standing heat loss is the same
every day but if you use more water, standing losses are a smaller proportion of the
heat supplied to the cylinder.
The cylinder size should be minimised to decrease losses, however, the volume
should be large enough to ensure there is enough water for householder
satisfaction. This is further complicated by the chosen water storage temperature.
The cylinder volume needs to be larger at lower temperatures to give a satisfactory
number of consecutive large DHW draw offs.
Stratification should be encouraged, because mixing decreases the useful energy
content of the cylinder.
With low DHW use, the cylinder should be heated using off-peak electricity to supply
the heat pump.
Reheat time is dominated by the heater, therefore low heat pump flow temperatures
and low cylinder storage temperatures give the best system efficiency.
The heat pump output must be higher than the cylinder thermostat set point, to
minimise pump on-time and decrease heat loss.

DECC 30047
© Kiwa Ltd 2013
The bottom of the cylinder did not always reach the recommended temperature
during sterilisation with the immersion. To improve the likelihood of satisfactory heat
up, sterilisation cycles should be carried out during the night. However other
methods of sterilisation should be investigated.
Reheat times can be shortened by fitting fast recovery coils, with higher surface
area, this means the reheat time is then dominated by the heat supplier unit.
The buffer tank test program showed that:
Buffer tanks are less relevant with inverter driven heat pumps, where the heat pump
can modulate (down to about 30% of the rated output) because cycling is less of an
issue with this type of heat pump. With fixed speed heat pumps (especially air
source) a buffer tank is more important to decrease the cycling.
The shortest cycle time in our test program was ~11 minutes which was 5.4 starts
per hour; this is higher than the 3-4 starts per hour as recommended in (R Curtis,
2012). The on time needs to be less than 6 minutes for a GSHP and 10 minutes for
an ASHP to negatively impact the COP. This is probably because ASHP have larger
refrigerant volumes and defrost capabilities.
Buffer tanks decrease the reaction time of the system which decreases the change
in temperature.
As a result of these findings the following recommendations can be made:
Radiators in properties with a heat pump tend to be larger in order to optimise the
heat pump output through low temperature operation. This means that the radiator
volume is often large enough to not require a buffer tank. Thermostatic Radiator
Valves (TRVs) on radiators reduce the system volume when closed, this means that
TRVs should be used cautiously to prevent the system volume reducing too much.
If the required system volume is not available the system should be supplemented
by a two pipe buffer tank placed in the return pipe to the heat pump.
Central heating from heat pumps should be weather compensated with a single
internal over temperature limiter to avoid overheating.
Alternatively, the control system should use a controller with a self learning
algorithm.

DECC 30047
© Kiwa Ltd 2013
Table of Contents
1 Introduction .................................................................................................................. 1
2 Background .................................................................................................................. 2
2.1 Domestic Hot Water Cylinders .............................................................................. 2
2.2 Buffer Tanks .......................................................................................................... 2
3 Re-assessment of condensing boiler field trial data DHW systems .............................. 3
3.1 System boilers ....................................................................................................... 4
3.2 Combination boilers............................................................................................... 6
4 DHW cylinder test program ........................................................................................ 12
4.1 Testing ................................................................................................................ 12
4.2 Analysis of results ............................................................................................... 15
4.3 Results ................................................................................................................ 16
4.3.1 Heat-up and cool-down rates ....................................................................... 16
4.3.2 Characterising the 180 litre cylinder ............................................................. 16
4.3.3 Effect of source temperature on 180litre cylinder .......................................... 23
4.3.4 Off-peak heating vs. continuous water heating on 180litre cylinder .............. 25
4.3.5 Effect of immersion use and timing on the 180litre cylinder .......................... 28
4.3.6 Characterising the small cylinder (150litres) ................................................. 31
4.3.7 Characterising the large cylinder (250litres) ................................................. 33
4.3.8 Comparison of cylinder sizes ........................................................................ 35
4.3.9 Thermal imaging .......................................................................................... 36
4.4 Discussion (including look-up tables for SAP) ..................................................... 37
4.5 Recommendations .............................................................................................. 42
5 Buffer tank test program ............................................................................................. 44
5.1 Test set-up .......................................................................................................... 44

DECC 30047
© Kiwa Ltd 2013
5.2 Results ................................................................................................................ 47
5.2.1 Overshoot/Undershoot ................................................................................. 47
5.2.2 Losses from tank .......................................................................................... 48
5.2.3 Stratification of tanks .................................................................................... 49
5.2.4 Effect of hysteresis on return temperature and on time ................................ 52
5.2.5 Effect of tank volume and system volume on “on time” ................................. 54
5.2.6 Modelling the COP ....................................................................................... 56
5.2.7 Optimum configuration ................................................................................. 61
5.3 Discussion ........................................................................................................... 62
5.3.1 Off-peak tariffs.............................................................................................. 65
5.3.2 Defrost ......................................................................................................... 67
5.4 Recommendations .............................................................................................. 68
6 Bibliography ............................................................................................................... 69
Appendix 1 Test Programme ............................................................................................. 69
Appendix 2 Tapping patterns from M324 (European Commission, 2002) ......................... 71

DECC 30047
© Kiwa Ltd 2013 1
1 Introduction
The results from recent field trials on heat pumps and solar thermal hot water systems have
highlighted problems with hot water storage vessels, both for domestic hot water and when
used as heating system buffer tanks. DECC contracted Kiwa to produce a sizing look-up
table for domestic hot water cylinders, a recommendations document for buffer tanks and to
re-assess the data from the Energy Saving Trust’s (EST’s) condensing boiler trials [3].
This piece of work included two laboratory test programs:
Test Program I: Heat loss from domestic hot water cylinders for heat pumps
Test Program II: Optimisation of buffer tank size and type for heat pumps
The objectives of re-assessing the data from the EST condensing boiler field trial were to
investigate circumstances under which it is more efficient to use combination boilers
(combis) and when it is more efficient to use boilers with hot water cylinders.
The objectives of test program 1 were to carry out test rig and desk based research to
investigate the heat losses from heat pump DHW cylinders under various operating modes
and to use the results to inform the development of Standard Assessment Procedure (SAP)
and to underpin advice to consumers with a sound evidence base.
The objectives of test program 2 were to carry out test rig and desk based research to
investigate the effect of buffer tank design on heat pump performance, leading to clear
recommendations on how to size and locate buffer tanks for a range of heat pump and
heating system requirements.
The report firstly covers the re-assessment of data from the EST field trial. It then
introduces the testing protocol for each test program and goes on to analyse the data for
each part, giving recommendations for the sizing and location of heat pump buffer tanks
and producing a look-up table for SAP for DHW cylinders.

DECC 30047
© Kiwa Ltd 2013 2
2 Background
2.1 Domestic Hot Water Cylinders
Use of domestic hot water systems has changed markedly over the past 30 years, and
what was once considered acceptable performance would now be considered “uncivilised”.
In particular, the length of time householders are prepared to wait for hot water following a
large draw-off from a cylinder (e.g. filling a bath) is probably shorter now than previously.
This has an impact on the recommended DHW cylinder volume, particularly when the
cylinder is being reheated by a relatively low power heating device such as a heat pump.
The overall system efficiency of a central heating system is influenced by the loss of heat
from hot water cylinders. For heat pumps, this is a particularly important issue, because
they are less efficient when operating at the temperatures required to produce domestic hot
water (DHW). For this reason, it is particularly important to investigate the heat losses of hot
water cylinders under different operational regimes, and how these heat losses may be
minimised.
Recent work on heat pumps [1] and solar thermal hot water [2] has highlighted problems
with hot water storage vessels, particularly when stored outside of the heated envelope,
which is often the case in heat pump installations. The aim of the study was to produce
guidance on the appropriate cylinder size for a given hot water usage pattern and heating
system (heat pumps or gas/oil boilers).
2.2 Buffer Tanks
Recent work on heat pumps [1] has highlighted the potential for buffer heat storage to
improve the performance of novel heat generation technologies. This supports earlier work
on microCHP and biomass boilers. In theory, buffer tank storage should decrease cycling
of the appliance and thereby improve efficiency and reduce losses, and the wear and tear
inherently related to rapid cycling as shown in the work undertaken by EA Technology on
the effect of cycling on heat pump performance [4].
Unfortunately, it appears that many heat pump buffer systems do not seem to fulfil their
potential. Buffer tanks carry significant capital costs, and an additional circulation pump is
sometimes required (which increases the parasitic electrical consumption). The buffer tank
and pipework may also be associated with considerable standing heat losses and the
reduction in cycling may be minimal.
The aim of the study was to investigate:
The appropriate sizing of the buffer tank, relative to the radiator output, the house
heat loss and the heat pump capacity
The best location for the buffer tank (before or after the central heating system)

DECC 30047
© Kiwa Ltd 2013 3
Two or four pipe configuration
Appropriate use of buffer tanks if off-peak tariffs are used.
The implications for defrost requirements.
3 Re-assessment of condensing boiler field trial data DHW
systems
The data from the EST’s condensing boiler field trial [3] was re-assessed to look at the
efficiency of combination boilers compared with system boilers with hot water cylinders.
The condensing boiler field trial gathered data on heat output from the boiler (for system
boilers) and heat to central heating (for combination boilers) and DHW to the taps (for both
types) from 60 properties for at least a year.
The measurement configurations were as shown in Figure 1.
Combination Boiler System Boiler
Measure to central heating Measures output from boiler
Measure DHW to taps Measures DHW to taps
Figure 1: Measurement configurations for combination and system boilers
Electricity, gas and heat flows were measured along with inside and outdoor temperatures.
The energy delivered from the boiler to the central heating system was measured, as was
the energy delivered to the taps from the combination boiler or from the DHW cylinder. Hot
water production was reviewed for the summer months alone where no space heating
demand was expected.
Fig 7

DECC 30047
© Kiwa Ltd 2013 4
3.1 System boilers
For summer months, the system boilers showed good efficiencies for generating DHW to
the cylinder (average efficiency 81% energy supplied to cylinder /energy in gas) but
recorded heat delivered to taps was much lower. The average efficiency of heat delivered
to the taps was only 38%, and much lower where DHW use was low (efficiency range 13%
to 65%). SAP cylinder and primary pipework losses for the three month period are
estimated at between 400 and 600kWh while the average heat output from the boilers was
845kWh. Losses from the cylinder and primary pipework were the cause of the low
delivered DHW efficiencies for regular boilers.
There are two types of loss when considering the system boiler set up:
losses from the boiler (flue/case losses) (as for combination boilers)
losses from the cylinder.
The following figure splits the losses from the gas into the system into DHW, boiler and
cylinder losses. This analysis is undertaken on days where the external temperature was
greater than 15.5°C i.e. days when no CH was required.
Figure 2: Distribution of energy losses from system boilers
0
2
4
6
8
10
12
14
16
18
32
2
32
1
33
0
30
6
32
7
33
3
35
3
31
4
33
6
34
5
34
6
34
1
34
8
Ave
rage
En
erg
y U
se (
kWh
/day
)
Property Reference Number
Boiler Losses
Tank Losses
To DHW

DECC 30047
© Kiwa Ltd 2013 5
Figure 2 shows that the boiler losses ranged from 15% to 45% of the energy input.
However, when losses from the DHW cylinder are included, the amount of energy delivered
to the DHW ranges from 10% to 50% of the energy input to the system, with an average of
28%. The losses from the cylinder are much higher than the losses from the boiler.
Figure 3: Number of properties compared with % losses
The efficiency of the system boiler was dominated by the standing losses from the cylinder.
Large daily draw offs led to increased efficiency, this is because the cylinder heat loss was
relatively constant each day, but became a smaller proportion of the heat supplied when
large quantities of water were used. (i.e. most of the hot water in the cylinder needed to be
used to make the system approach 100% efficiency.) The smaller the total draw-off the
lower the efficiency.
0
1
2
3
4
5
6
7
8
0% 10% 20% 30% 40% 50% 60% 70% 80% 90% 100%
Fre
qu
en
cy o
f p
rop
ert
ies
% Losses
Boiler losses
Tank losses

DECC 30047
© Kiwa Ltd 2013 6
Figure 4: Relationship between DHW efficiency, cylinder size and average daily draw-offs
Figure 4 shows that there is some relationship between efficiency, draw-off and size of
cylinder. In general, the smaller daily draw-offs showed lower efficiencies; while the larger
draw-offs had higher efficiencies. It was anticipated that, as the cylinder size increased, the
draw-offs would have to increase to improve the efficiency of the cylinder, however the
sample size is too small for this conclusion to be drawn.
3.2 Combination boilers
Poor energy balances were recorded for combination boilers, especially during periods of
low consumption. A laboratory investigation into this found that with very short domestic hot
water draw offs; the instantaneous gas to heat efficiency was much lower than expected.
This was found to be a result of higher than expected flue losses and the energy required to
heat the boiler metalwork. In addition, laboratory tests of the heat meters showed that the
heat meters used in the trials had a delay in responding to changes from zero flow. In
heating situations, the long periods of operation resulted in this error being negligible.
However, during short DHW draw offs the error became significant, resulting in reduced
heat flow recorded. Both of these factors led to reductions in calculated heat delivered and
thus lower efficiencies. For the purpose of summer DHW assessment alone, an adjustment
of 25% was made to increase the heat recorded by the heat meters to attempt to reflect the
true situation. After adjustment, the combination boilers showed an average summer
0
0.5
1
1.5
2
2.5
3
3.5
4
4.5
0 50 100 150 200
Ave
rage
dai
ly d
raw
-off
(kW
h)
Tank size (l)
0-20%
30-40%
40-50%
Efficiency
bands

DECC 30047
© Kiwa Ltd 2013 7
efficiency of 73%. However, there was a large spread in efficiency which ranged from less
than 40% to above 80%.
For the set of combination boilers, days when the central heating energy use was less than
500Wh were chosen to represent days without central heating. Thus, on these days, all gas
was used for DHW production. Therefore, if gas use and DHW production are compared,
the difference is the energy loss in providing DHW.
Figure 5: Combi boiler losses compared to DHW output
Figure 5 shows the average energy supplied to the DHW system and the losses incurred in
producing the DHW for days without CH use. This shows that the higher energy users do
not necessarily have higher ratios of DHW output compared to losses; this is because when
using a combination boiler, the length of the draw-off was the most important factor. Long
draw offs had the highest efficiencies, indicating that the losses were dominated by start up
and shutdown losses.
0
1
2
3
4
5
6
7
8
9
10
31
0
30
2
35
6
30
9
30
7
31
1
34
9
30
5
32
6
34
0
30
3
31
6
34
4
35
0
33
7
31
8
33
9
34
7
35
7
31
7
35
4
33
2
31
2
32
4
30
4
31
5
30
1
34
3
30
8
35
2
31
9
32
0
35
1
32
8
35
5
32
9
Ave
rage
En
erg
y U
se (
kWh
/day
)
Property Reference Number
Boiler Losses
To DHW

DECC 30047
© Kiwa Ltd 2013 8
Figure 6: Number of properties compared with % losses
Figure 6 shows that at least 30% of the energy input to the boiler was lost during DHW
heating. The losses ranged from 80% to 30% of the energy input. On average 51% of the
energy was delivered to the taps (although the heat meter was generally installed as close
to the boiler as possible so pipe losses between the boiler and the point of DHW use were
excluded from the calculation).
Table 1 shows the theoretical performance of a combination boiler when tested to the draw-
off pattern contained in EU Mandate M324, Table 2 [5]. It can be seen that the shorter
draw-offs (hand-washing - 0.105kWh) had the lowest efficiency of 71.4%, while the longer
draw-offs (showers -1.4kWh) were 84.4% efficient.
Table 1: M324 Table 2 theoretical performance of a combination boiler (European Commission, 2002)
Useful heat Number of draw-offs
Total DHW use Gas in Efficiency
kWh kWh kWh
0.105 19 2.00 2.80 71.4%
0.315 1 0.32 0.39 80.4%
0.735 1 0.74 0.89 83.0%
1.400 2 2.80 3.32 84.4%
Totals 5.85 7.39 79.1%
0
2
4
6
8
10
12
0% 10% 20% 30% 40% 50% 60% 70% 80% 90% 100%
Fre
qu
en
cy o
f p
rop
ert
ies
% Losses

DECC 30047
© Kiwa Ltd 2013 9
The draw-off patterns were established for each site and the following figure was plotted.
This shows the number of draw-offs per day compared with the losses seen on each site on
the average day.
Figure 7: Losses compared to number of draw-offs per day
While Figure 7 has a lot of scatter there may be a general trend that the greater the number
of draw-offs, the smaller the percentage losses. One would expect, with many draw offs
throughout the day, the boiler would not have much time to cool between draw-offs.
Therefore, less energy was required to reheat the boiler metalwork and heat exchanger for
each draw-off and thus more of the energy was delivered as hot water, rather than being
lost in boiler heat losses. However, the evidence for this was not very strong in this data.
For an individual site (site 357), the daily data (Figure 8) shows that as the number of draw-
offs increased, the percentage losses decreased.
R² = 0.0762
0%
10%
20%
30%
40%
50%
60%
70%
80%
0 2 4 6 8 10 12 14 16 18
Loss
es
Number of drawoffs/day

DECC 30047
© Kiwa Ltd 2013 10
Figure 8: Losses compared to number of draw-offs per day for a particular house
Figure 9: Losses compared to percentage of small draw-offs for a particular house
R² = 0.8603
0%
10%
20%
30%
40%
50%
60%
70%
80%
90%
100%
0 2 4 6 8 10 12 14
Loss
es
Number of drawoffs per day
357
R² = 0.4129
0%
10%
20%
30%
40%
50%
60%
70%
80%
90%
100%
0 0.1 0.2 0.3 0.4 0.5 0.6 0.7 0.8 0.9 1
Loss
es
% of drawoffs that are small
357

DECC 30047
© Kiwa Ltd 2013 11
In order to examine the impact of the size of the hot water draw offs, a small draw off was
defined as containing less than 200Wh of energy. If a high percentage of the draw-offs
were small then the losses tended to be higher (Figure 9). Therefore the larger the draw-off
the less energy is lost.
It is very difficult to compare the summer performance of the regular and combination
boilers due to different measurement points and occasional summer space heating which
had a significant effect on boiler run times and hence efficiencies. Whilst the regular boilers
gave a boiler efficiency of 81% in summer, it is estimated that only about half of the heat
was used in hot water delivered to the taps, the rest being lost from the cylinder and
primary pipework.

DECC 30047
© Kiwa Ltd 2013 12
4 DHW cylinder test program
4.1 Testing
The existing EN50440 test rig at Kiwa was modified. Three cylinders were used in this
testing program, as detailed in Table 2. The cylinders were attached to the rig with a
custom built direct electric water heater (rated at 6kW, but further limited to 4.8kW which
was selected to be typical of ASHPs) with a control panel and pump via 4m of insulated
piping as shown in Figure 10 and Figure 11. The ambient temperature was kept constant at
20°C.
Figure 10: DHW cylinder rig

DECC 30047
© Kiwa Ltd 2013 13
Figure 11: Modified section of test rig including direct heater, 180litre cylinder on test rig
The electricity to the heater, output to the taps (flow rate and temperatures) and cylinder
temperatures were monitored using the EN50440 test rig, which logs every second during a
draw off and every 60 seconds throughout the rest of the test period. To supplement these
results, a heat meter was installed on the input to the coil, an electricity meter was added to
the pump and immersion heater and surface temperatures were added. The surface
temperatures were measured through evenly space holes down the side of the cylinder, so
the temperature sensor was mounted on the copper surface of the cylinder. These
measurements were logged every 5 minutes throughout each test period.
The specifications for the DHW cylinders used are shown in Table 2 below.
Table 2: Manufacturer specification for cylinders
Size (litres) Heat up time 70% re-heat
time
Heat pump
coil surface
area (m2)
Heat pump
coil kW
rating*
Heat loss
(kWh/24h)
150 19m12s 15m40s 2 23.3 1.38
180 23m19s 17m06s 3 28.3 1.63
250 34m16s 34m16s 3 27.4 2.21
*kW rating of coil when tested in accordance with BS EN 12897 [6] is stated within the
manufacturers documents. This is when heated by 80°C water at a flow rate of 0.25l/s
DECC 30047
© Kiwa Ltd 2013 14
through the coil (as opposed to typical heat pump conditions which would be 45°C and a
flow rate of maybe 0.40l/s).
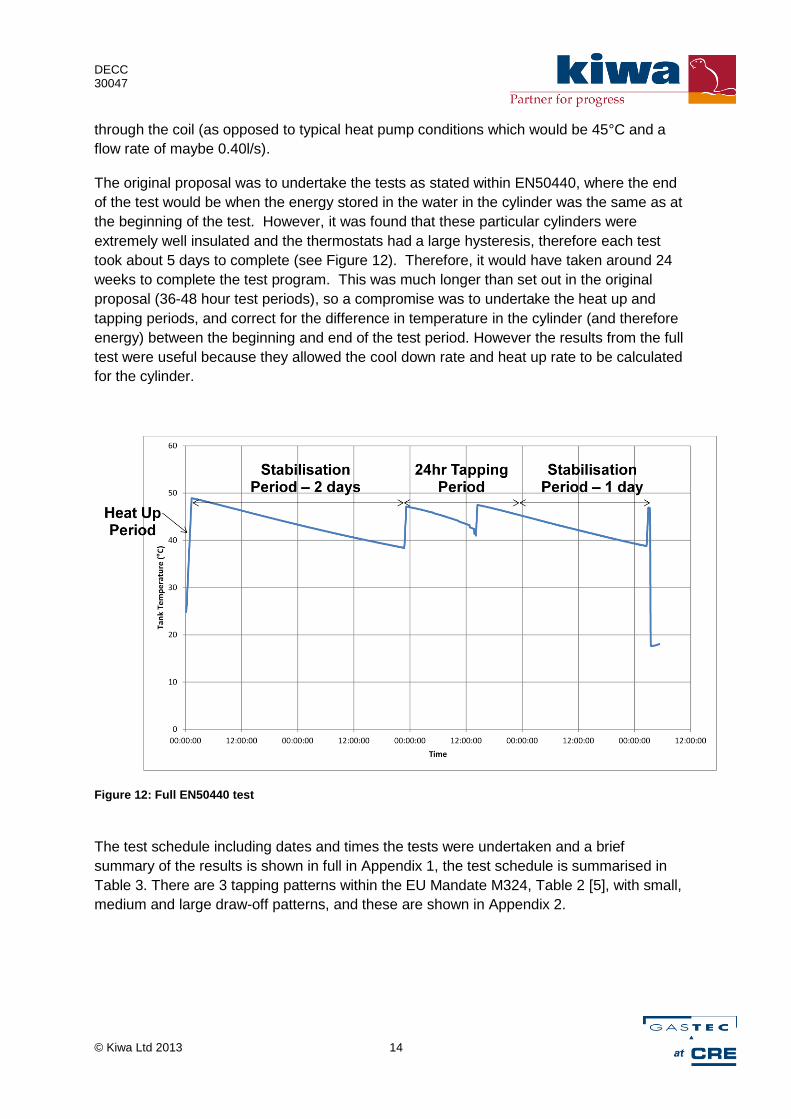
The original proposal was to undertake the tests as stated within EN50440, where the end
of the test would be when the energy stored in the water in the cylinder was the same as at
the beginning of the test. However, it was found that these particular cylinders were
extremely well insulated and the thermostats had a large hysteresis, therefore each test
took about 5 days to complete (see Figure 12). Therefore, it would have taken around 24
weeks to complete the test program. This was much longer than set out in the original
proposal (36-48 hour test periods), so a compromise was to undertake the heat up and
tapping periods, and correct for the difference in temperature in the cylinder (and therefore
energy) between the beginning and end of the test period. However the results from the full
test were useful because they allowed the cool down rate and heat up rate to be calculated
for the cylinder.
Figure 12: Full EN50440 test
The test schedule including dates and times the tests were undertaken and a brief
summary of the results is shown in full in Appendix 1, the test schedule is summarised in
Table 3. There are 3 tapping patterns within the EU Mandate M324, Table 2 [5], with small,
medium and large draw-off patterns, and these are shown in Appendix 2.

DECC 30047
© Kiwa Ltd 2013 15
Table 3: Summary of test schedule
Temperatures Tapping
pattern
Timing* Totals
Characterise medium cylinder 3 3 1 9
Investigate effect of different source
temperatures
3 1 1 3
Investigate off peak reheat, rather than
continuous heating
2 2 1 4
Investigate timing of pasteurisation
cycles
1 3 2 6
Characterise small cylinder 1 3 1 3
Characterise large cylinder 1 3 1 3
Total number of tests 28
*This relates to the timing of the pasteurisation cycle (afternoon or morning)
4.2 Analysis of results
The equation used throughout this piece of work to describe the efficiency in a 24 hour
period is:
inEnergy
deltaTEnergytappingsoutEnergyEfficiency
_
)(__
Where:
tappingsoutEnergy __ Heat energy delivered to the taps (Wh)
inEnergy _ Energy in during draw off period through
direct heater or immersion (Wh)
)(deltaTEnergy The change in energy of the cylinder from
the beginning to the end of the test (to allow
for any accumulation in energy) (Wh)

DECC 30047
© Kiwa Ltd 2013 16
4.3 Results
4.3.1 Heat-up and cool-down rates
The rate of heat supply was 80Wh/min. This is a rate of 4.8kWh/h; this is set by the
controller.
From the stabilisation tests undertaken on each cylinder the heat up and cool-down rates
could be calculated.
The hysteresis is the difference between the points where the thermostat switches the
system on or off. For example with the system set point temperature of 40°C, the
thermostat may switch the system on when it has cooled to 39°C and off again when the
system reaches 41°C. In this case the hysteresis is 2°C. Hysteresis is employed in control
systems to prevent rapid on / off cycling or “hunting”.
Table 4: Heat up and cool down rate when at 50°C storage temperature
Cylinder Volume
(litre)
Heat up rate
(°C/h)
Cool down rate
(°C/h)
Hysteresis (°C) Time to cool by
hysteresis (h)
150 25.7 0.422 9.2 21.7
180 15.2 0.235 10.5 44.7
250 19.0 0.272 8.2 30.0
4.3.2 Characterising the 180 litre cylinder
The following tests were undertaken on the 180litre cylinder with 60°C source temperature
from the heater. The thermostat on the cylinder was set to 45, 50 and 55°C. The
temperature was measured within the cylinder using a Platinum Resistance Thermometer
(PRT) probe which inserts through the DHW outlet port of the cylinder and was positioned
40cm down into the cylinder. This was higher up the cylinder than the thermostat, so was
likely to measure a slightly higher temperature. The maximum temperature measured by
this PRT was just as the thermostat switched the heater off; and this temperature was
always higher than the thermostat setting. The minimum temperature measured was just
as the thermostat switched the heating on. Throughout each 24 hour tapping period, the
average cylinder temperature was above the set point of the thermostat.

DECC 30047
© Kiwa Ltd 2013 17
Table 5: Thermostat settings
Test Number
Set Storage T
Tapping Pattern
Thermostat setting
Maximum cylinder T
Minimum cylinder T
Average cylinder T
4 45 Small 45 48.4 42.3 46.6
5 45 Medium 45 48.7 41.6 46.8
6 45 Large 45 48.4 24.2 45.0
7 50 Small 50 57.0 50.1 54.4
8 50 Medium 50 57.0 51.6 54.9
9 50 Large 50 56.2 45.6 54.0
10 55 Small 55 59.3 58.4 58.6
11 55 Medium 55 59.2 58.5 59.0
12 55 Large 55 59.2 58.5 59.1
On the test with the largest draw-off coupled with the low storage temperature (45°C), the
cylinder decreased in temperature to 24.2°C before it was reheated, this was because the
cylinder was re-heating at the same time as delivering large draw-offs, this meant that the
reheat was slower than the draw-off.
On the tests with very little temperature difference between the source and storage
temperatures (60 and 55°C), the temperature stayed high throughout the test because the
thermostat was always calling for heat.

DECC 30047
© Kiwa Ltd 2013 18
A profile of the cylinder temperatures using surface temperature sensors that were placed
on a vertical line down the side of the cylinder, showed that during test 4 (see Figure 13),
the bottom of the cylinder was only heated to 36°C at the start of the test, while the top
section of the cylinder was heated to 47.5°C, when the thermostat was set to 45°C. The
profile might be distorted by thickness of copper on the bottom of the cylinder, and the top
of the cylinder sensor was placed on the output port from the cylinder so this temperature
might be elevated compared with the other surface temperature measurements.
Figure 13: Temperature profile of 180litre cylinder when heated to 45°C at the start of the test
30
32
34
36
38
40
42
44
46
48
50
1 - Top of tank
2 3 4 5 6 - Bottom of Tank
Tem
pe
ratu
re (°C
)
Surface temperatures
Thermostat setting
Internal Probe

DECC 30047
© Kiwa Ltd 2013 19
Figure 14: Efficiency at different storage temperatures and draw-off patterns for 180litre cylinder
The cylinder efficiency was highest when the storage temperature was low. The reason for
this is that the lower storage temperature results in lower cylinder losses. When the
storage temperature was 45°C, the losses accounted for approximately 1.2kWh over the 24
hours test period of the heat delivered to the cylinder. When the storage temperature was
higher (i.e. 50°C), the losses increased to 1.9kWh in the test period as shown in Table 6.
The cylinder efficiency was also highest when the draw-off was large, this was because
more energy was used, compared to the amount of heat stored and lost from the cylinder.
The losses stay the same, so if more heat is used the proportion of energy lost from the
cylinder is lower.
0%
10%
20%
30%
40%
50%
60%
70%
80%
90%
100%
0 2 4 6 8 10 12 14
Effi
cie
ncy
Energy out (kWh)
180litre Cylinder
Storage T 45
Storage T 50
Storage T 55
Small Medium Large

DECC 30047
© Kiwa Ltd 2013 20
Table 6: 180litre cylinder: heat in, out and losses
Test Number
Set Storage T
Tapping Pattern
Heat in (kWh)
Heat out (kWh)
Energy change in cylinder (kWh)
Losses (kWh)
4 45 Small 2.7 2.1 -0.7 1.2
5 45 Medium 6.5 5.9 -0.6 1.2
6 45 Large 12.5 11.7 -0.3 1.1
7 50 Small 3.2 2.1 -0.9 1.9
8 50 Medium 7.0 5.9 -0.8 2.0
9 50 Large 13.0 11.7 -0.6 1.9
10 55 Small 7.0 2.1 -0.2 5.0
11 55 Medium 10.4 5.8 -0.2 4.7
12 55 Large 16.0 11.7 -0.1 4.5
NB: Heat in includes compensation for difference in cylinder temperature over period
Where the storage temperature and the source temperature were close (i.e. 55 and 60°C),
the system was nearly always operating see
Figure 15. The cylinder thermostat was calling for heat for long periods of time. This meant
that the whole system (including the primary pipework and heating system) was losing heat,
rather than just the cylinder; this increased the heat loss to between 4.5 and 5kWh over the
test period. When the temperature difference between the storage and the source was
large, (i.e. 45 and 60°C) the cylinder was not calling for heat all the time and therefore the
pump was not circulating water between heat up cycles, decreasing the heat losses see
Figure 17. This is a known phenomenon in gas boiler properties, where the cylinder
thermostat can be set higher than the boiler thermostat. The circulation pump then never
turns off (especially as some households leave the DHW set on continuous).
For a heat pump system, the difference between the storage and source temperatures
tends to be low. This is because the heat pump COP is highest when the heat pump
delivery temperature is lowest. Thus heat pumps are frequently set to deliver relatively low
temperature heat. In a heat pump system if the cylinder is always calling for heat i.e. the
thermostat is set to 50°C and the heat pump is only delivering temperatures of 47°C, the
heat pump will keep cycling on its own water thermostat. Some heat pumps then cannot
dissipate the heat generated by the compressor and eventually trip out on high

DECC 30047
© Kiwa Ltd 2013 21
temperature. This will lead to a large use of electrical energy to the heat pump, and can be
detrimental to component lifetimes.
During the medium draw-off pattern, Table 7 shows that the number of reheats and on time
were very similar when heating the cylinder to 45 and 50°C. However heating the cylinder
to 55°C gave a continual demand and the heater was on for 1440 minutes (24 hours), most
of the time the heat supplied was small (3Wh/min), with a larger reheat following every
DHW draw-off as shown in Figure 15.
Table 7: Number of reheats and on time of heater
Test Number Set Storage T
Number of
reheats
On time
(minutes)
Heat into
cylinder (kWh)
5 45 2 85 6.5
8 50 2 82 7.0
11 55 24 1440 (24 hours) 10.4
The cylinders were all fitted with quick recovery coils. These have larger surface areas (2
and 3m2) compared with standard tanks (0.6 – 1m2), to enable the cylinder to be reheated
quickly. These reduce tank heat up times and reduce losses from the primary pipework and
from boiler cycling.
The following diagrams show the electric heater in blue, the associated heat to the DHW
tank in green and the DHW draw off tappings in red for the 24 hour test period. This starts
with heating the tank, followed by the first draw off. In these tests the heater can fulfil any
heat demand throughout the 24 hour period. The following charts (Figure 15 to Figure 17)
show medium draw offs at different storage temperatures (55, 50 and 45°C).

DECC 30047
© Kiwa Ltd 2013 22
Figure 15: 60°C source temperature and 55°C storage temperature
Figure 16: 60°C source temperature and 50°C storage temperature
0
5
10
15
20
25
0 2 4 6 8 10 12 14 16 18 20 22 24
Ave
rage
Po
we
r (k
W)
Time (h)
180litre cylinder, source T=60°C, storage T=55°C, medium drawoff
Electric
Tapping
Heat
0
5
10
15
20
25
0 2 4 6 8 10 12 14 16 18 20 22 24
Ave
rage
Po
we
r (k
W)
Time (h)
180litre cylinder, source T = 60°C, storage T = 50°C, medium drawoff
Electric
Tapping
Heat

DECC 30047
© Kiwa Ltd 2013 23
Figure 17: 60°C Source temperature and 45°C Storage temperature
4.3.3 Effect of source temperature on 180litre cylinder
The effect of the source temperature on the efficiency of the cylinder was then investigated.
The thermostat was set to 50°C for all tests, and the source temperature was set to 45, 50,
and 55 °C. It was accepted that with a source temperature of 45°C, the required storage
temperature would not be reached. This type of control setting is commonly seen in heat
pump properties, so it was thought to be a useful test.
It was found that the temperature in the cylinder (the storage temperature) appeared to be
determined by the source temperature during these tests apart from when the source
temperature was 60°C. The lower storage temperature would then account for the change
in losses (and efficiency) rather than the source temperature. The following table shows the
average storage temperature (from the internal probe and by averaging the surface
temperature sensors) for the different source temperatures.
0
5
10
15
20
25
0 2 4 6 8 10 12 14 16 18 20 22 24
Ave
rage
Po
we
r (k
W)
Time (h)
180litre cylinder, source T=60°C, storage T=45°C, medium drawoff
Heat
Electric
Tapping

DECC 30047
© Kiwa Ltd 2013 24
Table 8: Average storage temperatures for different source temperatures
Set Source Temperature (°C)
Thermostat setting (°C)
Internal probe storage temperature (°C)
Averaged surface temperatures (°C)
45 50 44.3 41.3
50 50 49.1 46.1
55 50 54.1 50.7
60 50 54.9 46.5
60 55 59.0 55.4
60 45 46.8 39.6
The following graph (Figure 18) shows that the internal storage temperature when the
thermostat is set to 50°C (dark red line) is always 1°C lower than the black y=x line. This
means that the source temperature dictates the storage temperature. This is because the
coil in the heat pump is rated at 28kW, so all the heat supplied to it can be transferred to the
cylinder. The heater is on throughout the test period, because the limiting factor is the
source temperature. The red lines on the graph are the thermostat settings.
When the source temperature is between 55 and 60°C, the thermostat set point became
the limiting factor. The internal probe temperature is on average ~5°C higher than the set
point of 50°C.
Figure 18: Source temperature compared to set point and actual storage temperature
40
45
50
55
60
65
40 45 50 55 60 65
Inte
rnal
Sto
rage
Te
mp
era
ture
(°C
)
Source Temperature (°C)
45 50 55

DECC 30047
© Kiwa Ltd 2013 25
As in Section 4.3.2, where the source and storage temperatures were similar the system
was nearly always operating. Therefore the losses were increased (and the efficiency was
decreased) because there was more area for heat loss from the system. This is because
the heat loss area is increased from the cylinder, to include the heater and the primary pipe
work.
The following table shows the heat input during the heating period. For test 16-18, the
heater was on throughout the test because the cylinder was calling for heat. This means
that the losses are from a greater surface area i.e. the heater and the primary pipework as
well as the cylinder. The losses from test 16 are lower than from test 17 and 18 because
the temperature of the system is cooler.
Table 9: Heat in and losses at different source temperatures
Test Number
Set Source T (°C)
Set Storage T (°C)
Tapping pattern
Heat in (kWh)
Heat out (kWh)
Change in cylinder energy (kWh)
Losses (kWh)
16 45 50 Medium 7.0 5.9 -0.2 1.4
17 50 50 Medium 9.4 5.9 -0.1 3.7
18 55 50 Medium 8.3 5.9 -0.1 2.5
8 60 50 Medium 7.0 5.9 -0.8 2.0
4.3.4 Off-peak heating vs. continuous water heating on 180litre cylinder
Whether or not water heating should be undertaken continuously (i.e. controlled only by the
cylinder thermostat) or during timed periods (set by a programmer) was investigated.
During this series of off-peak tests, the cylinder started at temperature (i.e. when the
thermostat clicked off), and then it was reheated at the end of the tapping cycle.

DECC 30047
© Kiwa Ltd 2013 26
Figure 19: Off-peak vs. continuous heating and the effect on efficiency
Figure 19 shows that the efficiency was increased when off-peak heating was employed,
this was because the cylinder temperature decreased and therefore the losses decreased.
However the temperature of water had to be sufficient to be satisfactory, this is generally
considered to be above 40°C.
The large tapping cycle was unable to complete because the cylinder was emptied of hot
water. There was only 6.94kWh of energy delivered from the 180litre cylinder compared to
the 11.67kWh required for the large tapping cycle.
Figure 20 shows the temperature of the water exiting the cylinder during the off-peak reheat
tests. This shows that the temperature of the water during the 55°C tests did not drop
below 45°C, even at the end of the day. This suggests that if the cylinder was heated to
55°C once a day the efficiency was increased over continuous heating without detriment to
the water temperature.
However, with a lower cylinder temperature (45°C), during the medium tapping pattern the
temperature of the water dropped to below 40°C for the last two draw-offs of the day.
These are a small draw-off (i.e. a hand wash) and a longer draw-off (a shower). This would
therefore be unsatisfactory to the customer. During the large tapping pattern the
temperature dropped below 40C during the 11th draw-off, at 10.30, which is “floor washing”.
Small, 6055
Medium, 6055
Medium, 6045
Large, 6045
Not enough heat in tank
for large draw-off

DECC 30047
© Kiwa Ltd 2013 27
This means that for the remaining 13 draw-offs the temperature was unsatisfactory. The
energy delivered above 40°C, amounts to 5.85kWh, while another 1.09kWh was delivered
at temperatures below 40°C, and the remaining 4.715kWh could not be delivered.
Figure 20: Exit temperature of water from cylinder during off-peak tests
The points on this graphs are lines rather than dots because the reaction time of the PRT is
slower than that of the flow meter. At the end of the test period the lines are elongated
because the cylinder starts to run out of hot water, so more water is required to meet the
demands of the program.
This means that where the usage is low, the cylinder should not be heated continuously
and it is more efficient to heat it once a day.
Figure 21 shows that the cylinder surface temperatures decreased throughout the day, and
when heat was required the pump came on, but the heater did not as it was held off by the
timer. The circulation of water within the cylinder coil, led to an increase in the temperature
at the bottom of the cylinder (by around 5°C). This could have been due to increased
convection around the slightly warmer coil leading to increased mixing at the bottom of the
cylinder.
0
10
20
30
40
50
60
70
0 2 4 6 8 10 12 14 16 18 20 22 24
Tem
pe
ratu
re (°C
)
Time (h)
Small 55
Medium 55
Medium 45
Large 45

DECC 30047
© Kiwa Ltd 2013 28
Figure 21: Off peak heating
4.3.5 Effect of immersion use and timing on the 180litre cylinder
In many heat pump systems where the cylinder storage temperature is relatively low, the
control system is generally set to sterilise the water by raising its temperature to 60°C, for
one to three hours once per week. This is to prevent Legionella infection; usually the
cylinder immersion is used to carry out this sterilisation.
During this series of tests, the immersion supplied with the cylinder was used to increase
the temperature of the cylinder to 65°C for two hours. The immersion installed in the
cylinder was a 14inch Incoloy long life immersion heater; this is a standard sized immersion
heater. The timing of immersion use was tested in the morning (prior to the first draw-off)
and at lunch time.
0
10
20
30
40
50
60
1 3 5 7 9 11 13 15 17 19 21 23
Tem
pe
ratu
re (°C
)
Time (h)
180litre cylinder, source T=60°C, storage T=45°C, medium draw off, offpeak heating
1 - Top of tank
2
3
4
5
6 - Bottom of Tank

DECC 30047
© Kiwa Ltd 2013 29
Figure 22: Effect of immersion on efficiency
The immersion had little effect on the efficiency of the cylinder; because the rise in
temperature meant that the heater did not operate as frequently, i.e. with the small tapping
pattern the heater did not operate again, because the water in the cylinder stayed warm
enough to meet the heat demand. This was despite the fact that the heater was set to
continuous heating, i.e. it would operate if the cylinder temperature fell low enough.
However the immersion produces heat from electricity at a ratio of 1:1, compared to a heat
pump which should have a coefficient of performance of 1.5 or higher while heating DHW.
It should not be recommended that the immersion be used frequently.
The main point of concern was that with both timings the bottom of the cylinder did not
reach temperatures above 60°C. During the afternoon immersion cycle for the medium
draw-off pattern, the bottom of the cylinder only reached 40°C (see Figure 23); this has
implications on how well sterilisation cycles are carried out. During the morning immersion
cycle (see Figure 24), the bottom of the cylinder did not heat up but continued to cool and
was measured at around 50°C. Guidance [7] suggests that the whole of the stored water
should be heated to 60°C for at least one hour once a week.
The temperature at the bottom of the cylinder was lower after the afternoon immersion
cycle, this was because draw-offs were happening at the same time. This impacted the
temperature throughout the cylinder, it would be recommended that immersion sterilisation
cycles were undertaken during the night or periods where no hot water is used.
0%
20%
40%
60%
80%
100%
120%
0 2 4 6 8 10 12 14
Effi
cie
ncy
Draw-off (kWh)
Morning immersion
Afternoon immersion
No immersion

DECC 30047
© Kiwa Ltd 2013 30
Figure 23: Temperature profile when using immersion at lunchtime
Figure 24: Temperature profile when using immersion in the morning
0
10
20
30
40
50
60
70
0 2 4 6 8 10 12 14 16 18 20 22 24
Tem
pe
ratu
re (°C
)
Time (h)
Afternoon immersion
1 - Top of tank
2
3
4
5
6 - Bottom of Tank
0
10
20
30
40
50
60
70
0 2 4 6 8 10 12 14 16 18 20 22 24
Tem
pe
ratu
re (°C
)
Time (h)
Morning Immersion
1 - Top of tank
2
3
4
5
6 - Bottom of Tank

DECC 30047
© Kiwa Ltd 2013 31
4.3.6 Characterising the small cylinder (150litres)
The following tests were undertaken on the 150litre cylinder with 60°C source temperature
from the heater. The thermostat on the cylinder was set to 50°C. The temperature was
measured within the cylinder using a Platinum Resistance Thermometer (PRT) probe which
inserts through the DHW outlet port of the cylinder and was positioned 40cm down into the
cylinder. This was higher up the cylinder than the thermostat, so was likely to measure a
slightly higher temperature. The maximum temperature measured by this PRT was just as
the thermostat switched the heater off; and this temperature was always higher than the
thermostat setting. The minimum temperature measured was just as the thermostat
switched the heating on. Throughout each 24 hour tapping period, the average cylinder
temperature was above the set point of the thermostat.
Table 10: Thermostat settings
Test Number
Tapping Pattern
Thermostat setting
Maximum cylinder T
Minimum cylinder T
Average cylinder T
Efficiency
1 Small 50 57.0 48.4 53.6 42%
2 Medium 50 57.0 48.8 54.4 74%
3 Large 50 57.0 21.6 52.4 87%
During the largest draw-off pattern the temperature of the cylinder dropped to 21.6°C, this
was due to the rate of draw-off compared to the rate of replacement of heat. However the
water exit temperature stayed close to 50°C, with the lowest temperature during a draw-off
being around 47°C (see Figure 25). This was still useful heat because it was above 40°C;
this also shows that there was good stratification in the cylinder. Again the cylinder was
more efficient in the largest draw-off, because more energy was used, compared to the
amount of heat stored and lost from the cylinder.
Table 11: Calculating the losses for a small cylinder
Test Number Tapping Pattern
Heat in (kWh) Heat out (kWh)
Energy Change in cylinder (kWh)
Losses (kWh)
1 Small 2.4 2.1 -1.1 1.4
2 Medium 7.6 5.9 -0.2 1.9
3 Large 12.6 11.7 -0.7 1.6

DECC 30047
© Kiwa Ltd 2013 32
Figure 25: Water exit temperature from the 150litre cylinder in the large draw-off pattern (only when
there is a flow)
Figure 26: Temperature profile of 150litre cylinder when heated to 50°C at the start of the test
0
10
20
30
40
50
60
0 2 4 6 8 10 12 14 16 18 20 22 24
Tem
pe
ratu
re (°C
)
Time (h)
10
15
20
25
30
35
40
45
50
55
60
1 - Top of tank
2 3 4 5 6 - Bottom of Tank
Tem
pe
ratu
re (°C
)
Surface temperatures
Thermostat setting
Internal Probe

DECC 30047
© Kiwa Ltd 2013 33
4.3.7 Characterising the large cylinder (250litres)
The following tests were undertaken on the 250litre cylinder with 60°C source temperature
from the heater. The thermostat on the cylinder was set to 50°C.
Table 12: Thermostat settings
Test Number
Tapping Pattern
Thermostat setting
Maximum cylinder T
Minimum cylinder T
Average cylinder T
Efficiency
13 Small 50 56.0 51.3 54.0 39%
14 Medium 50 56.0 52.5 54.5 70%
15 Large 50 56.2 48.8 54.7 84%
The cylinder temperature only dropped to 48.8°C in the largest draw-off, which suggests
the rate of draw-off is slower in this case than the rate of heat replacement. This is
because there is a larger volume of water and the thermostat is likely to be much lower in
the cylinder than the cylinder temperature probe, which suggests that the cylinder was
reheated before the probe cooled significantly, unlike in the tests with smaller cylinders.
Again the cylinder was more efficient in the largest draw-off, because more energy was
used, compared to the amount of heat stored and lost from the cylinder.
Table 13: Calculating the losses for a small cylinder
Test Number Tapping Pattern
Heat in (kWh) Heat out (kWh)
Energy change in cylinder (kWh)
Losses (kWh)
13 Small 3.5 2.1 -0.7 2.1
14 Medium 7.3 5.9 -0.7 2.2
15 Large 13.2 11.7 -0.6 2.1

DECC 30047
© Kiwa Ltd 2013 34
Figure 27: Temperature profile of 250litre cylinder when heated to 50°C
10
15
20
25
30
35
40
45
50
55
60
1 - Top of tank
2 3 4 5 6 - Bottom of Tank
Tem
pe
ratu
re (°C
)
Surface temperatures
Thermostat setting
Internal Probe

DECC 30047
© Kiwa Ltd 2013 35
4.3.8 Comparison of cylinder sizes
Figure 28: Comparison of different sized cylinders
When undertaking the small draw-off pattern (i.e. a small DHW demand), the small cylinder
was the most efficient.
The large cylinder was found to be the least efficient in all cases; this is because the losses
were high as a proportion of the useful energy. Under the same conditions (i.e. storage
temperature of 50°C) the losses for each draw-off pattern were averaged for each size of
cylinder.
Table 14: Losses for different cylinder volumes measured compared to manufacturers
Cylinder volume (l) Measured losses (kWh/24h) Manufacturers stated heat
loss (kWh/24h)
150 1.65 1.38
180 1.93 1.63
250 2.14 2.21
0%
10%
20%
30%
40%
50%
60%
70%
80%
90%
100%
0 2 4 6 8 10 12 14
Effi
cie
ncy
Energy out (kWh)
150litre
180litre
250litre
Small Medium Large

DECC 30047
© Kiwa Ltd 2013 36
The table above shows that the measured losses are close to the manufacturers losses
(which are measured using 3 thermocouples at a set distance from the cylinder).
These cylinders are all the same make, with the same number of bosses, input and output
ports. They have the same type of insulation, but the larger cylinder obviously has a larger
surface area. This suggests that oversizing DHW cylinders could increase energy use,
particularly in the summer when losses from the cylinder do not supply useful heat to the
property.
Matching the size of the cylinder to the DHW demands of the property is important so that
the volume of hot water stored can be minimized. However if the householder wishes to
heat the tank in an off peak fashion then it would be desirable to have a larger stored
volume rather than run out of hot water.
4.3.9 Thermal imaging
Thermal images of the 180 litre cylinder show that there was very little heat loss from the
cylinder itself, the external temperature of the cylinder insulation was 23.9°C, which was
only 4.9°C higher than the ambient temperature (19°C) when the water temperature in the
cylinder was 55°C. Where the surface thermocouples had been inserted there was greater
heat loss through the cylinder wall. The insulation on the pipes was not as good as that on
the cylinder (being standard pipe insulation), the surface temperature of the pipes was
approximately 30.4°C.

DECC 30047
© Kiwa Ltd 2013 37
Figure 29: Thermogram of 180litre cylinder
4.4 Discussion (including look-up tables for SAP)
From the EST condensing boiler field trials [3] and the test program under taken here, the
efficiency of a standard system is dominated by the standing losses from the cylinder and
its primary pipework.
Large daily draw-offs result in high efficiency, i.e. the losses are the same every day but if
the householder uses more water, losses constitute a smaller proportion of the heat
supplied. The same thing was found in the test program. With the draw-off patterns used,
it is believed that the largest cylinder (250litre) is not required. Either the small (150 litre) or
medium (180 litre) cylinder would be sufficient for the medium or large draw-offs, while the
small cylinder was more efficient for the small draw-off pattern. However the low rate of
heat loss from the cylinder meant that the cylinder may not need to be heated every day, so
the long term efficiency may be higher.
Sizing the cylinder is important so that the volume of hot water stored can be minimized, but
too small a cylinder could lead to householder dissatisfaction. This is further complicated by
the chosen water storage temperature. The volume of DHW required by a family is to an
extent subjective but custom and practice have indicated that 120litres at 65°C is sufficient
for the typical 3 bed house. This then gives the following useful energy content (i.e. water
temperature higher than 40°C) for all the cylinders tested within this program and the
smaller 120litre volume.

DECC 30047
© Kiwa Ltd 2013 38
Table 15: Useful energy content of cylinders
Energy content (kWh) Cylinder Volume (litres)
Temperature (°C) 120 150 180 250
65 3.48 4.35 5.23 7.26
60 2.79 3.48 4.18 5.81
55 2.09 2.61 3.14 4.35
50 1.39 1.74 2.09 2.90
45 0.70 0.87 1.05 1.45
To have an 88litre (standard) bath [8] at 40°C requires 66litres of DHW at 50°C combined
with 22litres of cold water. The bath draw-off with an energy content of 3.605kWh from
M324 Table 2 draw off pattern [5] used 84litres of hot water from the cylinder in the morning
and 98litres in the evening during test number 6.
The following section assumes that there is perfect stratification in the tank and that all hot
water is delivered at the cylinder temperature, with the whole volume heated to the cylinder
temperature at the start of the day (i.e. a plug flow reactor). Assuming a bath is 88litres at
40°C, with cold water being added at 10°C, the following table calculates how much water
is drawn from the tank (at cylinder temperature) and how much is cold water.
Table 16: Volume of hot and cold water to draw a bath
Cylinder temperature (°C) Volume of water at cylinder temperature
(litres)
Volume of water at 10°C (litres)
65 48.0 40.0
60 52.8 35.2
55 58.7 29.3
50 66.0 22.0
45 75.4 12.6
This is then translated into the number of baths that could be drawn consecutively. In the
traditional set up with a 120litre cylinder operated at 65°C, the energy content of the
cylinder allowed 2 baths to be drawn consecutively (see Table 17). This table shows the
number of consecutive baths which can be drawn from different sized cylinders at different
storage temperatures. Those coloured in red do not meet the 2 bath criterion.

DECC 30047
© Kiwa Ltd 2013 39
Table 17: Number of consecutive baths (when tank is perfect stratified)
Number of baths from cylinder Cylinder volume (litres)
Temperature (°C) 120 150 180 250
65 2.50 3.13 3.75 5.21
60 2.27 2.84 3.41 4.73
55 2.05 2.56 3.07 4.26
50 1.82 2.27 2.73 3.79
45 1.59 1.99 2.39 3.31
Figure 30: Number of consecutive baths assuming plug flow
Two consecutive baths would require 150litres of hot water storage at 50°C and more than
150litres at 45°C. If storing water at around 45 to 50°C, some families (i.e. more than 2
adults) may require an 180litre cylinder. The 150litre cylinder however does not seem to
suffer the poor performance seen at very low draw off. The 150-160litre cylinder would
appear a reasonable compromise.
The worst case scenario would be if the cylinder was completely stirred (i.e. a continuous
stirred tank reactor (CSTR)), analysis was undertaken on this type of cylinder to see how
many baths could be drawn if the cold water entering the tank at 10°C, was mixed, so the
overall cylinder temperature decreased throughout the draw-off. The hot water exiting the
0
1
2
3
4
5
6
40 45 50 55 60 65 70
Nu
mb
er
of
bat
hs
Cylinder temperature (°C)
120
150
180
250

DECC 30047
© Kiwa Ltd 2013 40
tank was then combined with water at 10°C, to give a flow temperature to the bath of 40°C.
The flow rate was set to be 10 litres/minute.
Table 18: Number of consecutive baths (assuming CSTR)
Number of baths from cylinder Cylinder Volume (litres)
Temperature °C 120 150 180 250
65 1.14 1.42 1.70 2.36
60 0.91 1.14 1.36 1.90
55 0.68 0.85 1.02 1.42
50 0.45 0.57 0.68 0.95
45 0.23 0.28 0.34 0.48
Figure 31: Number of consecutive baths assuming CSTR
0
1
2
3
4
5
6
40 45 50 55 60 65 70
Nu
mb
er
of
bat
hs
Cylinder temperature (°C)
120
150
180
250

DECC 30047
© Kiwa Ltd 2013 41
Figure 32: 150litre worst case and best case scenarios
It is assumed that the typical cylinder is somewhere between the two scenarios, if the pump
is running all the time there is likely to be more mixing and heat loss, which will make it
more like a CSTR, while if the cylinder is well stratified it is likely to be more like the plug
flow scenario.
Where the DHW usage is low, the cylinder should not be heated continuously, it is more
efficient to heat it once a day because less heat input is required especially since the losses
decrease as the temperature of the cylinder decreases.
The main reason to install a larger cylinder (i.e. greater than 180litres) would be if the
property had solar thermal panels, since this would increase the storage volume or if the
householder wished to use offpeak heating and had high domestic hot water usage.
Generally the large surface area of coil within these cylinders (the lowest rating is 23kW)
means that the reheat time is dominated by the heat supplier unit. Low heat pump flow
temperatures and low cylinder storage temperatures give the best system efficiency.
The source and storage temperatures should have a fairly large temperature differential;
this is because if the cylinder is always calling for heat, the pump is on and therefore the
losses are increased. This increase in losses comes from the primary pipe work, which is
kept hot when the pump is on. It is therefore vital that the heat pump output is always
0
1
2
3
4
65 60 55 50 45
Nu
mb
er
of
Co
nse
cuti
ve b
ath
s
Cylinder Temperature (°C)
CSTR
Plug

DECC 30047
© Kiwa Ltd 2013 42
above the cylinder temperature. This is to ensure that the system does not always call for
heat i.e. the cylinder thermostat is set to 50°C and the heat pump is only delivering
temperatures of 47°C, in which case the heat pump will keep cycling and eventually trip out
on high temperature. This scenario (incorrect setting of controls) is frequently seen on
system boilers with corresponding poor performance. Primary pipe work should be
minimised and insulation should be increased. It is envisaged that a smart thermostat
could be designed that limited the cylinder storage temperature to a temperature below the
heat pump delivery temperature. This would mean that the heat pump was not attempting
to heat beyond its ability.
Control of the heat pump when outputting at two different temperatures (low for central
heating and higher for DHW) is thought to be complex. It is known that there is an issue
with gas boilers where repeated calls for DHW ‘robbed’ the CH supply to an unacceptable
level, leading to under heating of the property.
Testing of the immersion at different times of day showed no great difference to the cylinder
efficiency, although immersion use will be to the detriment of the system as a whole. The
major finding of this section of tests was that the bottom of the cylinder did not heat to 60°C,
even when the immersion was used for 3 hours and set to 65°C. This means that it is
unlikely to be sufficient to sterilise the cylinder. It is suggested that there may be better
methods of sterilisation, most basically positioning the immersion at the bottom of the tank,
or the addition of a circulation pump to stir the tank while the immersion is in operation.
There are also more complicated options including thermal stores or copper-silver
ionisation.
4.5 Recommendations
For Installers
o Avoid large cylinders with increased losses, unless the householder
especially requests additional water storage volume or is using an offpeak
heating pattern with large usage.
o Ensure the cylinder is correctly sized based on the likely demand for the
household.
o Fit with fast recovery coils to shorten reheat times. These should be sized for
the relevant delta T appropriate to the heating control strategy and cylinder
size - refer to the relevant sections.
o Limit the storage temperature by the heat pump flow temperature using a
smart cylinder thermostat, to avoid the scenario whereby the heat pump is
trying to heat beyond its ability. If the heat pump cannot dissipate the heat
generated by the compressor it may trip out on high temperature. This will

DECC 30047
© Kiwa Ltd 2013 43
lead to a large use of electrical energy to the heat pump, and can be
detrimental to component lifetimes.
o If a smart cylinder thermostat is not installed, make sure that consumer is
aware that the cylinder set point must be lower than the heat pump delivery
temperature.
o If possible install immersion at bottom of cylinder
o Cylinders with a thermostat set point below 60°C should have the facility for
weekly pasteurisation. If carried out electrically the immersion heater should
be sufficiently long to ensure that at least 95% of the volume of the tank will
reach the required temperature. Pasteurisation cycles should occur
overnight when drawoffs are unlikely.
o No cylinders should be installed outside the heated space.
o Primary pipework must be well insulated along the whole of its length, efforts
should be made to minimise on time of heater.
For DECC/Cylinder Manufacturers
o Insist cylinder manufacturers supply kW rating of heat pump cylinders using
conditions suitable for a heat pump.
o Investigate other methods of pasteurisation; there is a need for further study
in this area.
o Develop a smart cylinder thermostat, so that the cylinder set point is never
higher than the heat pump supply temperature.

DECC 30047
© Kiwa Ltd 2013 44
5 Buffer tank test program
5.1 Test set-up
The buffer tank test rig was built from a radiator rig (previously built at Kiwa) with 7
radiators. The radiators could be switched on and off as required, and were used in
configurations of 1, 4 and 7 radiators to investigate how limiting the system volume affected
cycling in terms of number of cycles in a given period, on times and return temperatures.
The radiators had the following heat outputs with the following differences between the
room and mean radiator temperatures.
Table 19: Heat output of radiators at different delta T's
Number of Radiators
Heat output at Delta T = 50
(W)
Heat output at Delta T = 25
(W)
1 1400 406
4 5600 2884
7 10200 5554
Figure 33: Buffer tank test rig at Kiwa

DECC 30047
© Kiwa Ltd 2013 45
The radiators were connected to a 6kW electric heater and a buffer tank (90litres or
120litres) in 4 different configurations, as shown in figures 34 - 36:
No buffer tank
4 pipe configuration
2 pipe in the flow from the heater
2 pipe in the return from the heater
There were 9 tests undertaken for each configuration with two different sized buffer tanks,
so in total 63 tests were done.
Figure 34: 4 pipe configuration

DECC 30047
© Kiwa Ltd 2013 46
Figure 35: 2 pipe in the flow from the heater
Figure 36: 2 pipe in the return from the heater

DECC 30047
© Kiwa Ltd 2013 47
The heater was controlled using a thermostat on the return to the heater (this control
configuration is often employed by heat pump installers). There was no room thermostat or
controls on the tank, the pump runs continuously which is not ideal for energy saving.
There are other options for controlling buffer tanks but these were not explored in this piece
of work because the method used could be consistent between configurations.
The set point was 40°C and hysteresis is shown in Table 20 below. The hysteresis is the
difference between the points where the thermostat switches the system on or off. For
example with the system set point temperature of 40°C, the thermostat may switch the
system on when it has cooled to 39°C and off again when the system reaches 41°C. In this
case the hysteresis is 2°C. Hysteresis is employed in control systems to prevent rapid on /
off cycling or “hunting”.
Table 20: Hysteresis
Range (°C) Hysteresis (°C)
39 - 41 2
37.5 - 42.5 5
35 - 45 10
The tests were generally undertaken for differing run-times, either over night, during the
morning, or during the afternoon, so results were analysed in 4 hour blocks where the
conditions (ambient temperature and heat pump cycling) were reasonably steady (or gave
regular cycles).
Energy balance validation was undertaken to check that the energy entering the tank was
the same as the energy leaving the tank plus the losses. Where the data was inconsistent it
was excluded from the results.
5.2 Results
5.2.1 Overshoot/Undershoot
It was found that the heater took about 60 seconds to come on when the lower hysteresis
point was reached so the temperature continued to decrease for 60 seconds even though
the thermostat had started to call for heat. This meant that there was an undershoot in tank

DECC 30047
© Kiwa Ltd 2013 48
temperature before the heater started (it is believed that a heat pump would take a similar
amount of time to react). This was not included in the average return temperatures when
on, because these were averaged for periods when the heater was on. There was also a
slight overshoot of temperature when the thermostat turned off, this was due to residual
heat in the system: the heater turned off immediately when the signal was sent from the
thermostat, but the temperature in the system continued to rise for a short time. This meant
that the hysteresis was usually larger than set by the controller. This is believed to be
typical of the way a heat pump operates in practice, and indeed slow start up has been
observed in other heat pump tests.
5.2.2 Losses from tank
The losses from the 90 litre tank were stated to be 0.8kWh/24hrs which is equivalent to
33W, however when the losses were calculated using standard radiation and convection
calculations the standing losses were ~200W when the tank was at a temperature of 42°C
and the ambient air temperature was 20°C. This is a daily loss of 4.8kWh.
The losses from the 120 litre tank were stated to be 1kWh/24hrs, i.e. 42W, however
calculations showed the standing losses were ~200W when the tank was at a temperature
of 42°C and the ambient air temperature was 20°C.
The tanks have similar losses because they have the same number of bosses and are
similar in surface area.
If the buffer tank was installed outside the heated space (as frequently happens with heat
pumps), at 0°C the losses would be ~400W, this would equate to 9.6kWh per day of lost
energy, or an extra 4.8kWh per day of wasted energy.
Thermal images of the tanks were taken using an infra-red camera. Example thermal
images are shown in Figure 37.

DECC 30047
© Kiwa Ltd 2013 49
Figure 37: Thermal images of the buffer tank
Most of the heat loss from the tank was around the lower and upper plain pipe connections,
with the connections being 4°C hotter than the external surface of the tank. There was also
significant heat loss from around the inspection hatch and the base of the tank. There were
more bosses on this tank than seen on the DHW cylinder which would lead to greater
losses. This was because this particular buffer tank was designed to be flexible, which was
necessary for the different configurations required within the specification, however
minimising the number of ports on the tank would decrease the heat loss.
5.2.3 Stratification of tanks
It was thought that a buffer tank would work best if the temperature difference between the
top and the bottom was maximised, to increase the system volume and keep the heater off
as long as possible between cycles. It was also thought that minimizing the return
temperature to a heat pump would be important to optimise the COP of the heat pump.
Figure 38 shows a typical graph in which the tank heated up and cooled down, but stayed
stratified throughout. There were some inaccuracies either in the calibration of the surface
thermocouples or in their placement, but in general the trends shown were as expected.
Inspection
Hatch
Base of tank
Upper plain
pipe
connections
Surface
temperature
sensors

DECC 30047
© Kiwa Ltd 2013 50
Figure 38: Stratification of the 90litre tank in the flow configuration
Figure 38 shows that the flow to the tank was higher than the tank temperature, with the
flow from the tank being the same as the top of the tank. The return to the heater was about
the same temperature as the middle of the tank. There were 4 cycles in 2 hours.
Figure 39: Stratification of the 90litre tank in the return configuration
34
36
38
40
42
44
46
48
50
0 0.5 1 1.5 2
Te
mp
era
ture
(°C
)
Time (h)
Tank top
Tank 4
Tank 3
Tank 2
Tank 1
Tank bottom
Flow to tank
Flow to CH
Return
34
36
38
40
42
44
46
48
50
0 0.5 1 1.5 2
Te
mp
era
ture
(°C
)
Time (h)
Tank top
Tank 4
Tank 3
Tank 2
Tank 1
Tank bottom
Flow
Return from rads
Return to heater

DECC 30047
© Kiwa Ltd 2013 51
Figure 39 shows the flow to the radiators, and the return from the radiators to the tank had
a delta T of about 4K, while the return to the heater was the same temperature as the top of
the tank, since it was taken from the top of the tank. There were also 4 cycles in 2 hours.
Figure 40: Stratification of the 90litre tank in the 4 pipe configuration
Figure 40 shows that the flow to the central heating and the return to the heater were the
same temperature, this is surprising because the flow to the central heating was taken from
the top port on the tank, while the return to the heater was taken from the bottom of the
tank. The return from the radiators to the tank was cooler than the return to the heater. That
means there was probably some bypassing within the tank which elevated the temperature
of the return to the heater. The flow temperature from the heater was lower in this scenario.
There were also more cycles seen in this configuration, 6 cycles within 2 hours.
Table 21 shows the minimum and maximum temperatures while the heater was on for the
conditions: hysteresis of 2, set point of 41, 4 radiators in operation for the different
configurations and size of tank (small was 90litre tank and large was 120litre tank).
34
36
38
40
42
44
46
48
50
0 0.5 1 1.5 2
Te
mp
era
ture
(°C
)
Time (h)
Tank top
Tank 4
Tank 3
Tank 2
Tank 1
Tank bottom
Flow to tank
Flow to CH
Return to tank
Return to heater

DECC 30047
© Kiwa Ltd 2013 52
Table 21: Minimum and maximum temperatures during the on periods
Configuration Max Min (on) range
Small_2P_Flow 45.3 40.7 4.7
Small_2P_Return 42.5 38.5 4.0
Small_4P 42.1 36.7 5.4
Large_2P_Flow 44.2 40.5 3.7
Large_2P_Return 42.4 39.2 3.2
Large_4P 42.2 39.0 3.3
It can be seen that the range was slightly larger on the small tank. For the small tank the 4
pipe configuration appeared to be more greatly stratified, however this was not the case for
the larger tank.
While the return temperature should have peaked at 43°C, the top of the tank varied
between 42 and 45°C (some of this was due to the effect of overshoot). The temperature at
the top of the tank was highest when the buffer was installed in the flow from the heater,
this was because this was before the heat was transferred via the radiators.
5.2.4 Effect of hysteresis on return temperature and on time
Other research implies that the return temperature to the heater may be higher with a 4
pipe arrangement compared to a 2 pipe arrangement or no buffer at all. Our data showed
that the lowest return temperatures were seen when there was no buffer tank installed. This
was related to the undershoot described in section 5.2.1.
The following plot shows the average return temperatures when the system is on for every
test configuration for each hysteresis. Therefore, there are 3 points for the no buffer tank
configuration (one for each number of radiators with the lowest temperature being when
there is only 1 radiator in operation). There are 9 points for the small and large buffer tanks,
(3 radiator options and 3 configurations).

DECC 30047
© Kiwa Ltd 2013 53
Figure 41: Average return temperature when the system is in operation for different configurations N =
no buffer tank, S = small buffer tank and L = large buffer tank.
If the small or large tank was installed the temperatures were within 1°C, and the position of
the buffer tank had a minimal effect on the overall COP (approximately 2-3% change for
GSHPs when the temperature changed from 40 to 41°C). With a hysteresis of 10°C there
was a larger spread in temperatures, and slightly higher return temperatures were reached.
Typical hysteresis seen in heat pump properties range from 2°C to 10°C, depending on
how the heat pump is set up.
38
39
40
41
42
0 1 2 3 4 5 6 7 8 9 10 11 12 13 14
Ave
rage
re
turn
te
mp
erat
ure
(w
he
n o
n)
(°C
)
Hysteresis set (see table 20) (K)
N
S
L

DECC 30047
© Kiwa Ltd 2013 54
Figure 42: On time with 4 radiators showing the effect of hysteresis and different configurations
Figure 42 shows that when hysteresis was increased from 2 minutes to 10 minutes; the on
time increased from less than 5 minutes to over 10 minutes when there was no buffer tank.
When there was a buffer tank, the on time increased from 10 minutes (already enough of
an improvement to negate the effect of cycling on the heat pump performance) to nearly 40
minutes. For a ground source heat pump this long on time of over half an hour may have a
negative effect on the ground loop temperatures.
5.2.5 Effect of tank volume and system volume on “on time”
The effect of having two different sized tanks and 3 different configurations of radiators was
investigated, to see whether larger system volumes resulted in longer on time of the heater.
0
5
10
15
20
25
30
35
40
45
None Small 4P Large 4P Small 2P Flow
Small 2P Return
Large 2P Flow
Large 2P Return
On
tim
e (
min
)
2
5
10
Hysteresis

DECC 30047
© Kiwa Ltd 2013 55
Figure 43: Effect of system size and configuration on on-time for different numbers of radiators with a
hysteresis of 5°C
It was found that when the system had no buffer tank and only 1 radiator the heater was on
for less than 5 minutes. This was less than the recommended time for optimum operation of
a heat pump as found in [4]. The 4 pipe configuration doubled the on-time of the heater for
1 radiator, but had less of an effect when there were more radiators open than the 2 pipe
configurations. The 2 pipe configurations both increased the on time substantially when
there were more radiators.
It was thought that system volume played a large part in the length of on time or cycle time
within a system. To this effect the volume of water in the radiators, pipes and heater were
measured and added to the buffer tank volume to give the total system volume as shown in
Table 22.
Table 22: Measured total system volume
Number of radiators 90litre tank 120litre tank
1 103 133
4 119 149
7 133 163
0
5
10
15
20
25
30
35
40
None Small 4P Large 4P Small 2P Return
Small 2P Flow
Large 2P Flow
Large 2P Return
On
tim
e (
min
)
1
4
7
Number of
Radiators

DECC 30047
© Kiwa Ltd 2013 56
5.2.6 Modelling the COP
A computer model was produced for ASHPs and GSHPs based on the data collected in
“The effects of cycling on heat pump performance” [4]. This model calculated the cycle
COP (which is the heat out divided by the electrical energy in during the on period of the
cycle) from the on time and return temperature (and the ambient temperature for ASHPs
which was set to 5°C in this analysis).
Because the model is a fit to data, it is suggested that small differences in the COP are not
significant and should not be relied upon. The average error in the model for GSHP is
±0.15, while for ASHP it is ±0.18.
Figure 44: GSHP model
The model showed that for a GSHP if the on time was about 4 minutes there was no
degradation of efficiency, for an ASHP this number rose to 10 minutes. Therefore when the
model was used to show the effect of the different configurations in a system with 4
radiators, there was little difference in the COP. In fact, the COP was highest when there
was no buffer tank because there was a slightly lower return temperature.

DECC 30047
© Kiwa Ltd 2013 57
Figure 45: Effect of different configurations and hysteresis on COP for a GSHP with 4 rads
Figure 46: Effect of different configurations and hysteresis on COP for an ASHP with 4 rads
0.00
0.50
1.00
1.50
2.00
2.50
3.00
3.50
4.00
None Small 4P Large 4P Small 2P Flow
Small 2P Return
Large 2P Flow
Large 2P Return
CO
P
2
5
10
0.00
0.50
1.00
1.50
2.00
2.50
3.00
3.50
4.00
None Small 4P Large 4P Small 2P Flow
Small 2P Return
Large 2P Flow
Large 2P Return
CO
P
2
5
10
Hysteresis
Hysteresis

DECC 30047
© Kiwa Ltd 2013 58
However for the air source heat pump, a greater effect was seen. When the hysteresis was
2 the COP was lowest, and increasing the hysteresis increased the COP. With hysteresis
of 2, the COP increased when a 4pipe buffer tank was installed, and increased further when
a 2pipe buffer was installed. There was a slight benefit from the buffer being large and
installed in the return. When the hysteresis was 10 the heat pump performance was
independent of the configuration (or even whether a buffer tank was installed or not).
The effect was greater when there was only 1 radiator in the system and particularly for air
source heat pumps as seen in Figure 47 and Figure 48.
In the following charts the data for the Large 4P and Large 2P Flow are missing because
the energy balance assessment was inconsistent.

DECC 30047
© Kiwa Ltd 2013 59
Figure 47: Effect of different configurations and hysteresis on COP for a GSHP with 1 rad
Figure 48: Effect of different configurations and hysteresis on COP for an ASHP with 1 rad
0.00
0.50
1.00
1.50
2.00
2.50
3.00
3.50
4.00
None Small 4P Large 4P Small 2P Flow
Small 2P Return
Large 2P Flow
Large 2P Return
CO
P
2
5
10
0.00
0.50
1.00
1.50
2.00
2.50
3.00
3.50
4.00
None Small 4P Large 4P Small 2P Flow
Small 2P Return
Large 2P Flow
Large 2P Return
CO
P
2
5
10
Hysteresis
Hysteresis

DECC 30047
© Kiwa Ltd 2013 60
This was then compared to the expected COP at the different conditions.
Figure 49: Effect of system volume on COP for ground source heat pumps
Figure 50: Effect of system volume on COP for air source heat pumps
1.00
1.20
1.40
1.60
1.80
2.00
2.20
2.40
2.60
2.80
3.00
0 20 40 60 80 100 120 140 160 180
CO
P
System Volume (litres)
None
4P
2P flow
2Preturn
1.00
1.20
1.40
1.60
1.80
2.00
2.20
2.40
2.60
2.80
3.00
0 20 40 60 80 100 120 140 160 180
CO
P
System Volume (litres)
None
4P
2P flow
2Preturn

DECC 30047
© Kiwa Ltd 2013 61
It can be seen in Figure 49 and Figure 50 that when the system volume was lowest (i.e. no
buffer tank and 1 radiator) the performance of the heat pump was at its lowest. However
just turning 3 more radiators on had a positive effect on the heat pump performance,
particularly in the air source scenario. Having a buffer tank minimised the effect of the
number of operating radiators on heat pump performance. Therefore, if the system has
thermostatic radiator valves (TRVs) which effectively reduce the system volume when they
close, a buffer tank is likely to improve efficiency. Very little difference was seen in the
predicted COP between the different configurations. (Indeed the errors in the predictions
probably outweigh the difference, so this should not be relied upon for decision making).
5.2.7 Optimum configuration
The 4 pipe tank had less effect on increasing on time than a 2 pipe tank. This is thought to
be because the tank was too small for complete stratification and therefore became too well
mixed. Figure 40 shows there was some stratification in the tank; however the temperature
returning to the heater appears to bypass some of the water volume. This may be
improved by changing the buffer tank design, for instance:
adjust the width to height ratio of the tank, hypothesis that a taller tank would have
greater stratification
adding baffles within the tank
moving the input and output ports to discourage mixing and bypassing
control on the tank, do not allow the pump to run continuously since this will stir the
tank
position the temperature sensors optimally
It was thought that separating the two systems by having a 4 pipe buffer tank should be the
most beneficial but this was not seen in this test.
The 2 pipe configurations had the best effect on the on time, with all the on times being
doubled by adding in a tank. It is thought that installing the tank on the return is the
optimum method because this should hold the return temperature down, which should
improve the efficiency of the heat pump.

DECC 30047
© Kiwa Ltd 2013 62
5.3 Discussion
Separating the central heating from the heat pump operation using a buffer tank might be
thought to be a good thing [4], particularly because the system can be designed such that
there is a lower flowrate through the radiators compared to that through the heat pump
(which should be high, generally around 20litres/minute). However, in practice, the
temperature of the 4 pipe buffer tank tends to drift up (especially in times of low demand)
relative to what it would have been on a two pipe system. Also to be taken into account is
the additional electrical demand of the second circulating pump in a 4 pipe system.
However it is possible to have two low energy pumps, operating at different flow rates,
which would mean the flow rates could be optimised such that the flowrate through the heat
pump was higher than through the radiators. Higher velocities at the tank inlet are likely to
lead to more mixing, depending on the geometry of the tank.
The main reason to install a buffer tank is to decrease short cycling of the heat pump, but
there must be space inside the property for the buffer tank and the cost must not be
prohibitive. The buffer tank should be installed within the heated envelope so that any heat
loss from the tank is into the property. This means that it should not be installed within a
garage, shed or outside.
It is known [4] [9] that high levels of short cycling are detrimental to heat pump
performance, due to the need for a minimum run time to ensure good lubrication and
negative impacts on compressor reliability. It probably also increases component stress and
shortens the life of the appliances. It is thought [9] that there is an optimal run time for a
domestic GSHP, too long and the ground loop may cool, too short and there appears to be
a reduction in efficiency. It is suggested that the compressor should be delayed from
coming on for 6 to 10 minutes between starts, with the aim of a maximum of 3-4 starts per
hour.
Our test regime had fairly long on times, so there were not many conditions where a buffer
tank would make a positive impact. To negatively impact the COP, the on time must be less
than 4 minutes for GSHPs and less than 10 minutes for an ASHP. This is probably because
ASHP have larger refrigerant volumes and have defrost capabilities. The shortest cycle
time was ~11 minutes which was 5.4 starts per hour, this is higher than the 3-4 starts per
hour as recommended in [9]. The GSHP benefits from warmer ground temperatures at the
start of each cycle, after a few minutes the ground loop temperatures stabilise at lower
temperatures.
When the system volume was lowest (i.e. no buffer tank and 1 radiator) the performance of
the heat pump was at its poorest. However just turning 3 more radiators on had a positive
effect on the heat pump performance, particularly in the ASHP scenario. Having a buffer
tank minimised the effect of the number of operating radiators on heat pump performance.
Therefore, if the system has thermostatic radiator valves (TRVs) which effectively reduce
the system volume when they close, a buffer tank is likely to improve efficiency. Very little

DECC 30047
© Kiwa Ltd 2013 63
difference was seen in the predicted COP between the different configurations. (Indeed the
errors in the predictions probably outweigh the difference, so this should not be relied upon
for decision making).
The system with no buffer tank had a faster reaction time, which meant that the return
temperature tended to under and over shoot more, this gave a larger hysteresis even when
at the same control conditions as the other configurations. Having the buffer tank means
that the reaction is a lot slower, so the amplitude of the hysteresis graph is a lot smaller.
The hysteresis of the heat pump must reduce as the flow temperatures decrease, whereas
a boiler might cycle between 55 and 65°C, a heat pump could not reasonably cycle from 30
to 40°C. The heat output to the property would not be sufficient at 30°C, and it would be too
much at 40°C, because the radiators are the limiting factor and if the temperature
differential between them and the room is low, the householder will notice that the control is
too coarse, especially with external weather compensation. If the design slope of the
external weather compensation was set to require a flow temperature of 45°C at an
external temperature of -5°C, and a flow temperature of 25°C at 15.5°C (external), then to
hold the house to ±1°C indicates a water hysteresis of about 4°C.
The reason thermostats employ hysteresis is to prevent rapid on/off cycling or “hunting”,
there are more modern thermostats which allow the user to set a minimum cycle time. The
longest on/off cycles occurred when the buffer tank was installed in the return to the heater.
In this case the buffer tank acted merely to increase the system volume. Below in Table 23
is a theoretical calculation of the required system to volume to give a 10 minute cycle time
with different hysteresis values for different system heat outputs. Heat pump systems
typically have oversized emitters with larger water volume. The calculations assume that
the system behaves like a continuous stirred tank reactor (CSTR).
Thus a 4kW heat pump requires a total system volume of 143litres with a hysteresis of 4°C
rising to 287litres with a hysteresis of 2°C. The typical radiator volume for this size of
system should be 176litres (assuming they are oversized by a factor of 4 compared with a
traditional gas boiler system design), so an 111litre buffer tank would be required if the
hysteresis was 2°C. It should be noted that the effect of TRVs on radiators is to effectively
reduce the system volume when a TRV on a particular radiator closes (i.e. the volume of
the radiator is no longer available to the system). The analysis in Table 23 and Figure 51 is
only valid if the system does not include TRVs or zone valves.
Table 23: Minimum system volume for different system heat outputs and hysteresis
Heat pump power (kW)
2 4 8 16
Minimum system volume (litres) at Hysteresis= 2°C 143.5 287.1 574.2 1148.3
Minimum system volume (litres) at Hysteresis= 4°C 71.8 143.5 287.1 574.2

DECC 30047
© Kiwa Ltd 2013 64
Table 24: Radiator volume and required buffer volume
Heat pump power (kW)
2 4 8 16
Radiator Volume (litres) 88 176 352 704
Required buffer volume (litres) at Hysteresis = 2°C 55.5 111.1 222.2 444.3
Required buffer volume (litres) at Hysteresis = 4°C -16.2 -32.5 -64.9 -129.8
Figure 51: Minimum system volume for different hysteresis at different rated outputs
Figure 51 shows that when the hysteresis is 4°C, the radiator volume is large enough to not
require a buffer tank. When the hysteresis is 2°C, the radiator volume is too small and a
buffer tank would be required to prevent cycling more rapidly than 10 minutes.
Historically it is generally acknowledged that interaction between different types of control
system can be complex and zone valves or TRVs should not be mixed with external
weather compensation as it is known to create control difficulties. Trimming of internal
temperature should be carried out with a single on/off room thermostat. Unfortunately this
advice is often perceived as contrary to the general principles developed within the
Domestic Heating Compliance Guide [10] which is generally enthusiastic about local
control. The argument is that better control of individual room temperatures (using TRVs) is
more likely to save energy than the beneficial effects of external temperature

DECC 30047
© Kiwa Ltd 2013 65
compensation. This is probably true for condensing boilers; it is probably not true for heat
pumps.
The concepts behind weather compensation have been developed which have led to
improvements such as self learning algorithms which constantly adjust the ramp curve of
the heat pump to give better performance. These use the internal and external temperature
to set the correct flow temperature for the property to maintain a stable internal
temperature.
The data in this report agrees with the test house data from EA Technology’s work on
cycling on heat pump performance [4] where heat pump performance was found to improve
as the number of open radiators increased. After a particular volume had been reached
there was no subsequent improvement as a result of increasing system volume.
Because heat pump properties tend to have oversized radiators or underfloor heating, it
should be simple to maximise the water volume, for instance only have TRVs upstairs.
However if a larger heat pump was installed there would need to be a larger water volume,
therefore it is recommended that only 50% of the radiators should have TRVs. This may
contradict building regulations i.e. the Domestic Heating Compliance Guide [10] which state
that all radiators should have TRVs, however, there are arguments to suggest that this rule
should not be applied to heat pump systems. There is a need for further investigation of the
control systems including the interactions between different systems (i.e. TRVs, weather
compensation and room thermostats).
Buffer tanks are less relevant with inverter driven heat pumps, where the heat pump can
modulate (turn down to about 30% of the rated output) because cycling is less of an issue
with this type of heat pump. With fixed speed heat pumps (especially air source) a buffer
tank is more important to decrease the cycling.
5.3.1 Off-peak tariffs
The use of buffer tanks with off-peak tariffs has been investigated. Buffer tanks are used in
some countries to store heat to even out interruption in power supplies. This means that
the energy content of the tank must be large enough to last for the length of the power
shortage. The energy content of the buffer tank has been calculated assuming that the
tank would be cooled to 30°C, at this point the heat supplied to the property would be
unlikely to keep the property at the required temperature.

DECC 30047
© Kiwa Ltd 2013 66
Figure 52: Energy content above 30°C of buffer tanks
If the property had a small HLC of 100W/K and was maintaining an internal temperature of
21°C, with an external temperature of 0°C, the amount of time the buffer tank would
continue to heat the property would be as shown in Table 25, assuming the radiators are
not limiting the heat output from the tank.
Table 25: Minutes of interrupt time when HLC = 100W/K
Temperature °C 90 litre 120 litre 150 litre 200 litre 250 litre
40 30 40 50 66 83
45 45 60 75 100 124
50 60 80 100 133 166
The larger the property, the shorter the interrupt time, i.e. if the house size was doubled the
heat required per hour to maintain the internal temperature of 21°C, doubled, therefore the
interrupt time was halved.
0.0
1.0
2.0
3.0
4.0
5.0
6.0
7.0
40 42 44 46 48 50
Use
ful E
ne
rgy
Co
nte
nt
( kW
h)
Buffer Storage Temperature (°C)
Energy Content of Buffer Tank
250 litre
200 litre
150 litre
120 litre
90 litre

DECC 30047
© Kiwa Ltd 2013 67
Table 26: Minutes of interrupt time when HLC = 200W/K
Temperature °C 90 litre 120 litre 150 litre 200 litre 250 litre
40 15 20 25 33 41
45 22 30 37 50 62
50 30 40 50 66 83
Therefore buffer tanks must be sized for each property depending on the amount of power
interrupt required. This could be problematic in UK housing stock, where available space is
limited. Most properties would struggle to have an additional 150litre tank.
5.3.2 Defrost
Defrost can be undertaken in 3 ways:
reverse cycling the hot gas refrigerant
electrically
reverse flow of heat from the heating system.
Reverse flow of heat from the heating system was the most often used method in the EST
heat pump field trial and is thought to be the most efficient method of defrost. However it
has been suggested that where the heat pump runs continuously to heat the property this
can mean the property deviates from the required temperature during defrost cycles. The
addition of a buffer tank could smooth out the requirement for heat, cooling the buffer tank
rather than the property. This could then be reheated later.
Firstly it is important to consider how much energy is associated with defrost, on average in
the field trials it was found that 3.5kWh/day of defrost was used in the coldest month. On
average over the year 3.55% of the heat provided by the heat pump was used for defrost.
Some heat pumps had the highest defrost as a percentage of total heat provided in the
summer months. This suggests that the defrost systems on these heat pumps were not
optimised.
It is thought that defrost should be most frequent at ambient temperatures of 5-7°C,
however the field trial data showed defrost at all temperatures (including during the
summer), it would be beneficial to investigate defrost further and try to minimise it. At
ambient temperatures of 5-7°C the heat pump should not be working at its maximum
capacity and therefore the impact of defrost on the temperature of the property should be
minimised.

DECC 30047
© Kiwa Ltd 2013 68
5.4 Recommendations
Recommendations for Installers
Buffer tanks are unlikely to be required when the heat pump can modulate (i.e. if the
heat pump is not fixed speed).
Buffer tanks should not be installed in unheated spaces.
Central heating to high temperature radiators should be weather compensated with
a single internal over temperature limiter to avoid overheating or a self learning
algorithm controller should be used. Underfloor or low temperature radiators will not
see much advantage from this.
Design for a minimum run time of greater than 4 minutes for a GSHP and 10
minutes for ASHP.
The volume of water always open to the heat pump i.e. without reference to
water potentially closed off by a TRV is as per Table 23 and Figure 51.
If the above volumes are not available (for example if TRVs are fitted) the
system volume should be supplemented by a two pipe buffer tank placed in the
return pipe to the heat pump with the appropriate volume (i.e. above the
minimum system volume shown in Table 23).
If TRVs are felt necessary they should only be fitted in the bedrooms (or in 50%
of the property).
Recommendations for further study:
Other configurations i.e. including bypasses and methods of buffer tank control
Interaction of controls systems: TRVs, buffer tank control, room stats, heat
pump,
Stratification in tanks and design of tanks (i.e. number of ports/width/height ratio,
baffles?)
Investigate minimising defrost

DECC 30047
© Kiwa Ltd 2013 69
6 Bibliography
[1] DECC; Dunbabin; Wickins, "Detailed analysis from the first phase of the Energy Saving
Trust’s heat pump field trial," March 2012.
[2] Energy Saving Trust, "Here comes the sun: a field trial of solar water heating systems,"
September 2011.
[3] Energy Saving Trust, Gastec at CRE, EA Technology, AECOM, "In-situ monitoring of
efficiencies of condensing boilers and use of secondary heating trial - final report,"
June 2009.
[4] DECC; EA Technology; R Green, "The effect of cycling on heat pump performance,"
2012.
[5] European Commission, "Mandate to CEN and CENELEC for the elaboration and
adoption of measurement standards for household appliances: water-heaters, hot
water storage appliances and water heating systems," Brussels, 2002.
[6] BSI, "Water Supply - Specification for indirectly heated unvented (closed) storage
water heaters," British Standard BS 12897:2006, 2006.
[7] Health and Safety Executive, Legionnaires’ disease, The control of legionella bacteria
in water systems, Approved Code of Practice and guidance L8 third edition., 2000.
[8] Market Transformation Programme, "BNWAT07: Baths - water efficiency performance
tests version 2.0," 2008.
[9] T Pine R Curtis, "Effects of cycling on domestic GSHPs," Cornwall, 2012.
[10] Communities and Local Government, "Domestic Heating Compliance Guide 2nd
edition," 2008.
Appendix 1 Test Programme
No Size of
tank (litres
)
Tapping
Pattern from M324
Source T (°C)
Storage T (°C)
Test Date and Time started
End Date and Time
1 150 Small 60 50 Continuous 24/07/2012
15:05 25/07/2012
17:03

DECC 30047
© Kiwa Ltd 2013 70
No Size of
tank (litres
)
Tapping
Pattern from M324
Source T (°C)
Storage T (°C)
Test Date and Time started
End Date and Time
2 150 Medium 60 50 Continuous 26/07/2012
08:39 27/07/2012
10:22
3 150 Large 60 50 Continuous 30/07/2012
09:51 31/07/2012
11:34
4 180 Small 60 45 Continuous 24/04/2012
07:53 25/04/2012
10:00
5 180 Medium 60 45 Continuous 26/04/2012
07:40 27/04/2012
09:25
6 180 Large 60 45 Continuous 27/04/2012
12:58 28/04/2012
15:06
7 180 Small 60 50 Continuous 30/05/2012
09:39 31/05/2012
11:59
8 180 Medium 60 50 Continuous 31/05/2012
12:15 01/06/2012
14:49
9 180 Large 60 50 Continuous 07/06/2012
11:01 08/06/2012
13:13
10 180 Small 60 55 Continuous 08/06/2012
13:54 09/06/2012
17:04
11 180 Medium 60 55 Continuous 11/06/2012
09:06 12/06/2012
11:43
12 180 Large 60 55 Continuous 12/06/2012
16:02 13/06/2012
18:46
13 250 Small 60 50 Continuous 02/08/2012
10:53 03/08/2012
14:15
14 250 Medium 60 50 Continuous 03/08/2012
14:25 04/08/2012
17:49
15 250 Large 60 50 Continuous 06/08/2012
08:26 07/08/2012
11:03
16 180 Medium 45 50 Different Source Ts
22/06/2012 08:51
23/06/2012 10:01
17 180 Medium 55 50 Different Source Ts
18/06/2012 09:02
19/06/2012 11:26
18 180 Medium 50 50 Different Source Ts
19/06/2012 11:51
20/06/2012 14:26
19 180 Medium 60 55 off peak reheat 14/06/2012
09:52 15/06/2012
12:41
20 180 Medium 60 45 off peak reheat 02/05/2012
12:45 03/05/2012
15:01
21 180 Small 60 55 off peak reheat 15/06/2012
14:57 16/06/2012
18:04
22 180 Large 60 45 off peak reheat 04/05/2012
09:16 05/05/2012
10:56
23 180 Small 60 50 Pasteurisation/morn
16/07/2012 11:40
17/07/2012 13:59
24 180 Medium 60 50 Pasteurisation/morn
17/07/2012 14:18
18/07/2012 16:39
25 180 Large 60 50 Pasteurisation/morn
19/07/2012 08:41
20/07/2012 10:45

DECC 30047
© Kiwa Ltd 2013 71
No Size of
tank (litres
)
Tapping
Pattern from M324
Source T (°C)
Storage T (°C)
Test Date and Time started
End Date and Time
26 180 Small 60 50 Pasteurisation/aft 10/07/2012
14:18 11/07/2012
16:08
27 180 Medium 60 50 Pasteurisation/aft 12/07/2012
09:13 13/07/2012
11:22
28 180 Large 60 50 Pasteurisation/aft 13/07/2012
11:28 14/07/2012
13:51
Appendix 2 Tapping patterns from M324 (European Commission,
2002)

DECC 30047
© Kiwa Ltd 2013 72

DECC 30047
© Kiwa Ltd 2013 73