Investigation of the influence of suspended optic’s motion on LIGO detector sensitivity Sanichiro...
39
Investigation of the influence of suspended optic’s motion on LIGO detector sensitivity Sanichiro Yoshida Southeastern Louisiana University
-
date post
21-Dec-2015 -
Category
Documents
-
view
216 -
download
1
Transcript of Investigation of the influence of suspended optic’s motion on LIGO detector sensitivity Sanichiro...

Investigation of the influence of suspended optic’s motion on
LIGO detector sensitivity
Sanichiro Yoshida
Southeastern Louisiana University

The beginning..
LIGO E2E (H. Yamamoto)
(1) Interested in comparing mechanical simulation of e2e and
measurement (stack motion, mirror motion).
(2) Need good seismic motion data, including correlation.
SLU (Students)
(1) Interested in studying dynamics of LIGO suspended optics.
(2) Measurement and modeling at site - Good for undergraduates.
SLU (S. Yoshida)
(1) Background- Input optics implementation.
(2) Interested in effect of input optics to LIGO performance.

Suspended optics on HAM table
Suspension point
Shadow sensor
Suspension wire
Shadow sensorWire standoff
Shadow sensor Safety stop
Stiffener plateSuspension tower
HAM (Horizontally Accessible Module) table
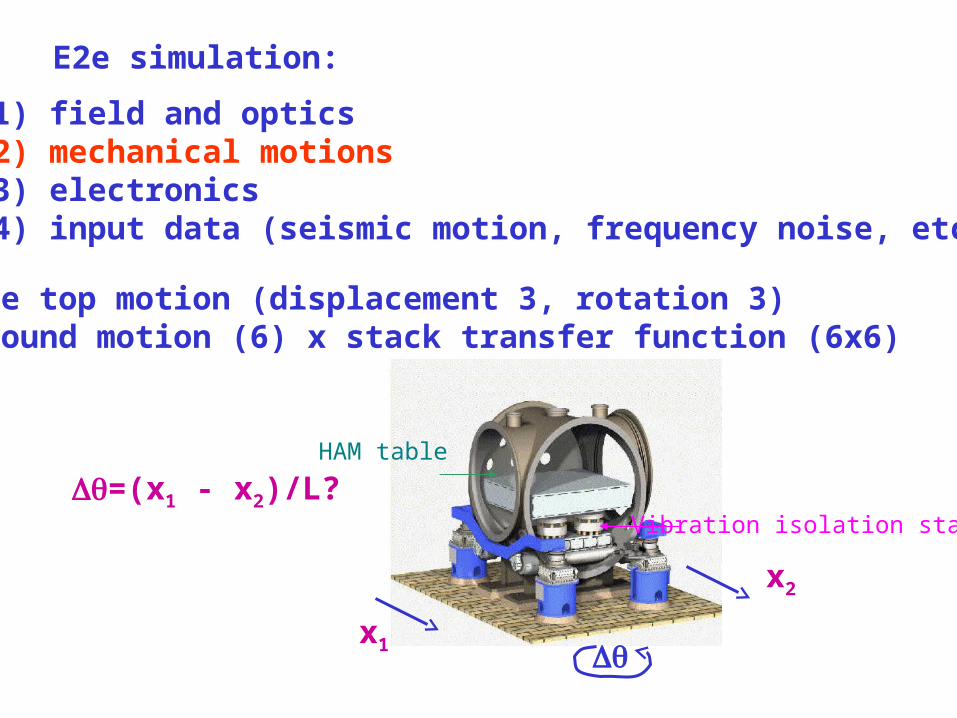
(1) field and optics(2) mechanical motions(3) electronics(4) input data (seismic motion, frequency noise, etc)
Table top motion (displacement 3, rotation 3) = ground motion (6) x stack transfer function (6x6)
=(x1 - x2)/L?
E2e simulation:
HAM table
x1
x2
Vibration isolation stacks

Model of transfer of the floor motion to optic
Optic motion (Output)
Floor motion (Input)
TG->Ht
HAM table motion
THt->Sp1
Suspension point motion
TSp->Op
Measurement 1 Measurement 2 Measurement 3
E2e simulation

LIGO research group at SLU
Undergraduate students• Raghuveer Dodda (Physics/Computer Science major)• Tiffany Findley (Physics major)
Physics Faculty• David P. Norwood (Optics)• Sanichiro Yoshida (LLO, UF LIGO)
Contents
• MMT3 motion - dark port signal coherence
• HAM1 table YAW motion measurement
• Floor motion measurement
• E2e boxes for MMT3
• Model suspension analysis at SLU
* MMT3 (Mode Matching Telescope on HAM1)

MMT3 motion - dark port signal coherence
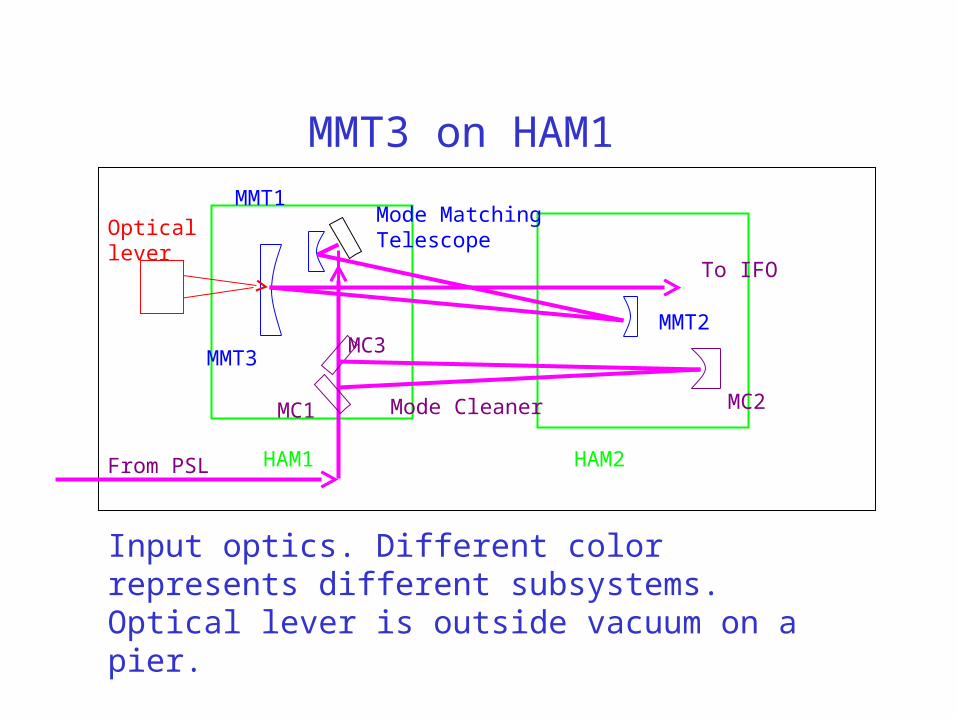
MMT3 on HAM1
Input optics. Different color represents different subsystems. Optical lever is outside vacuum on a pier.
Mode Cleaner
Mode Matching Telescope
To IFO
MC2MC1
MC3MMT2
MMT1
MMT3
From PSL HAM1 HAM2
Optical lever
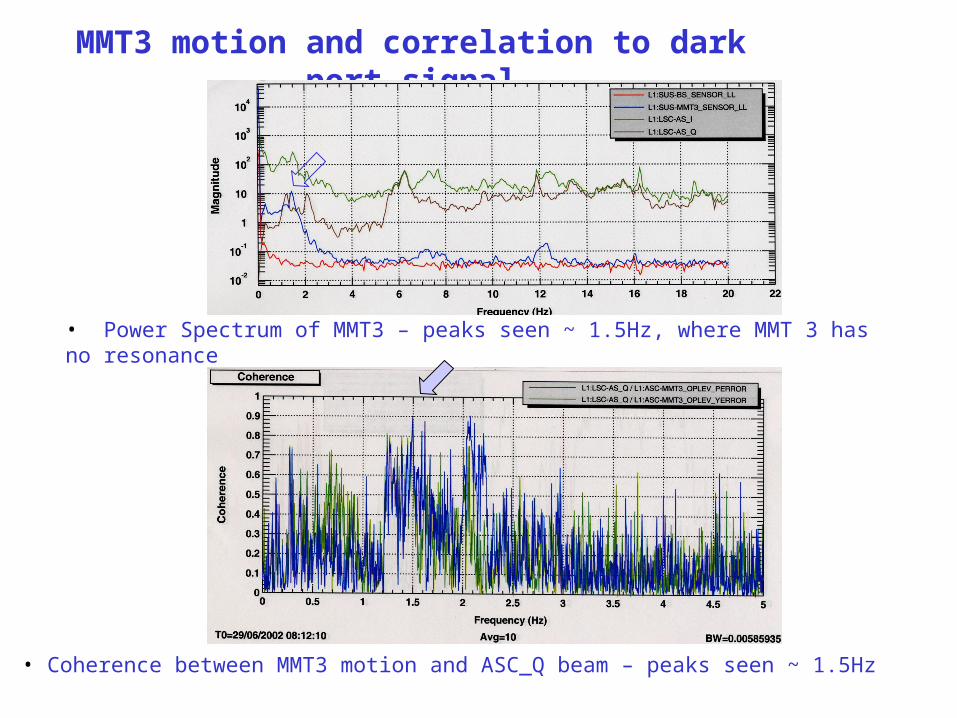
MMT3 motion and correlation to dark port signal
• Power Spectrum of MMT3 – peaks seen ~ 1.5Hz, where MMT 3 has no resonance
• Coherence between MMT3 motion and ASC_Q beam – peaks seen ~ 1.5Hz

MMT3/BS coherence to dark port signal @ ~1.5 Hz
Both data taken at the same time when arms are fully locked.
BS
MMT3
1.5 Hz
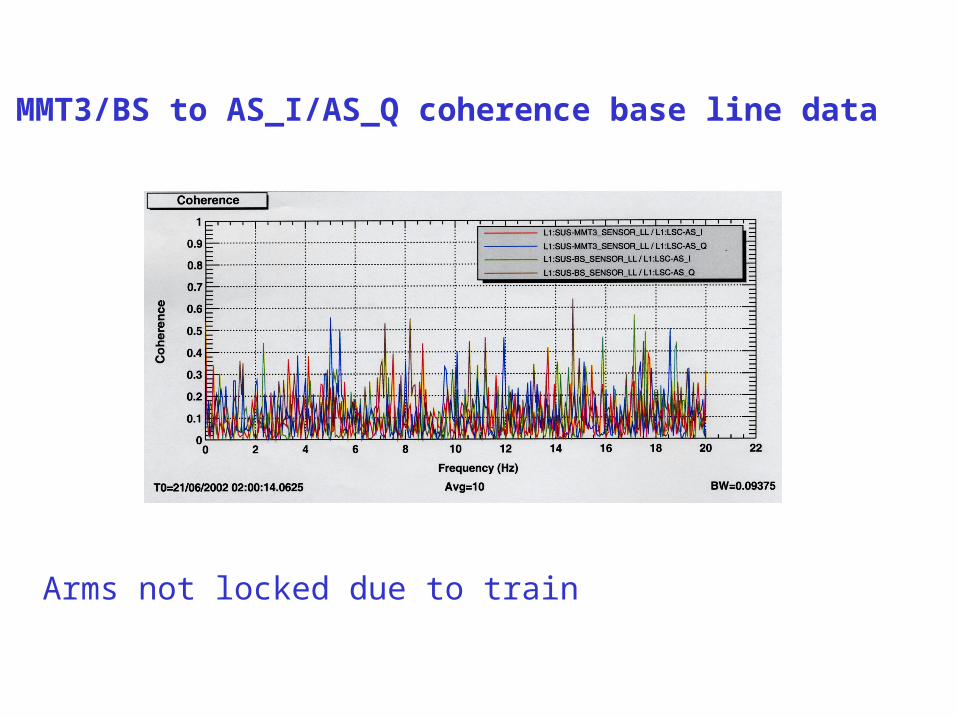
MMT3/BS to AS_I/AS_Q coherence base line data
Arms not locked due to train
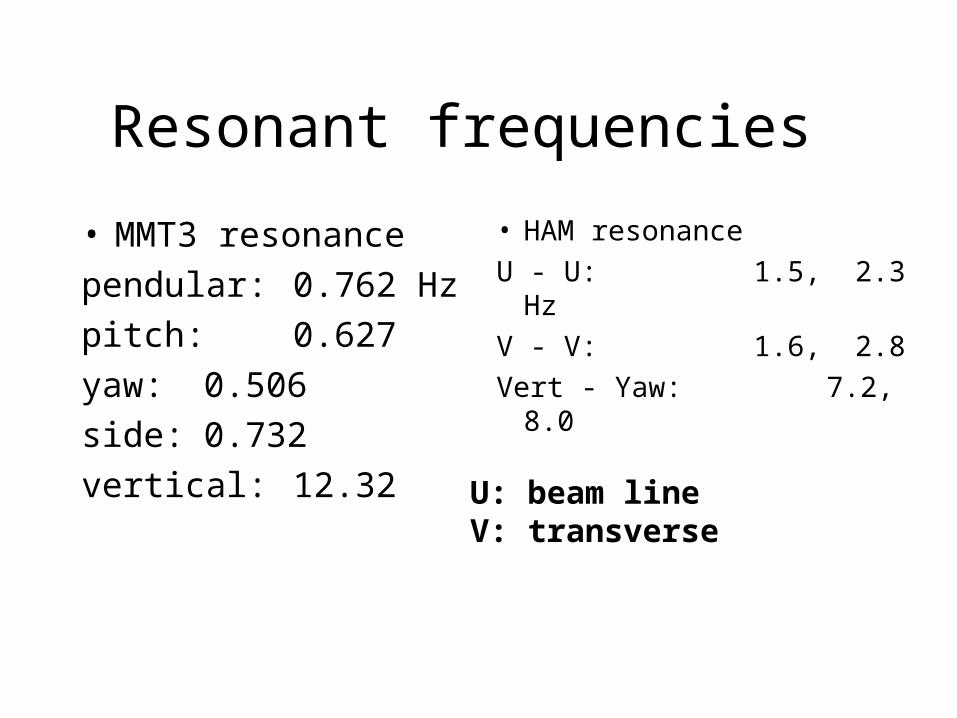
Resonant frequencies
• MMT3 resonance
pendular: 0.762 Hz
pitch: 0.627
yaw: 0.506
side: 0.732
vertical: 12.32
• HAM resonance
U - U: 1.5, 2.3 Hz
V - V: 1.6, 2.8
Vert - Yaw: 7.2, 8.0
U: beam lineV: transverse

HAM1 table YAW motion measurement
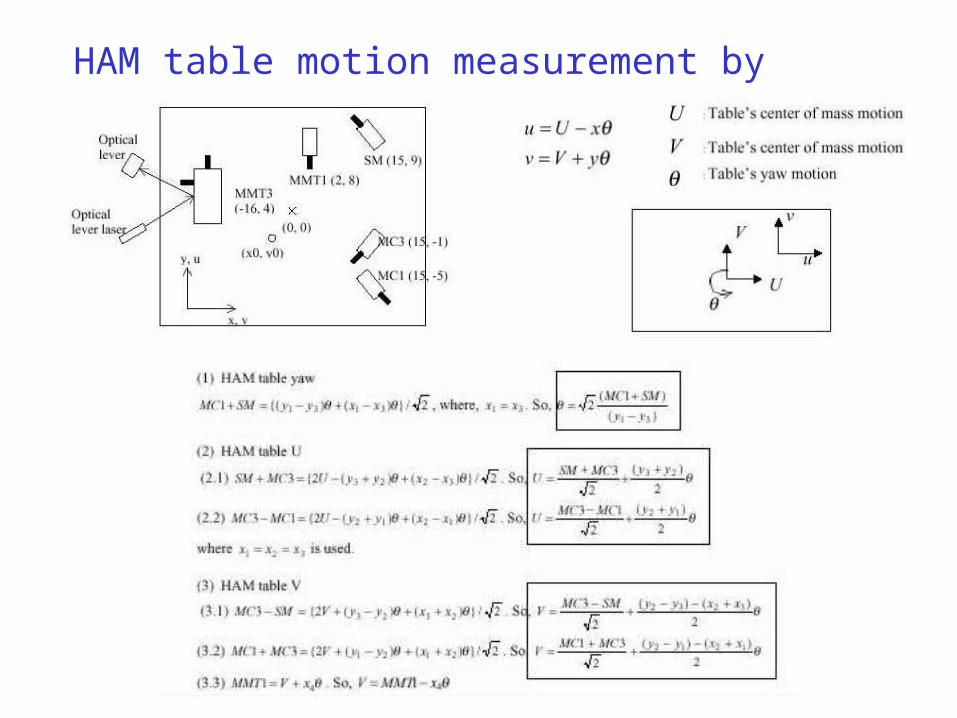
HAM table motion measurement by shadow sensors
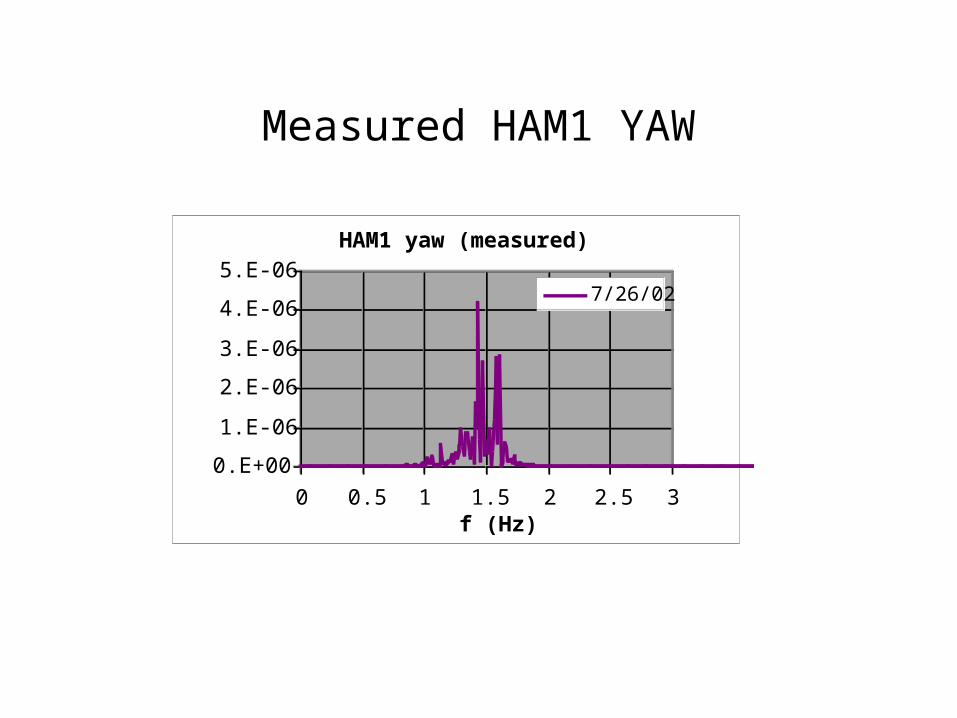
Measured HAM1 YAW
HAM1 yaw (measured)
0.E+00
1.E-06
2.E-06
3.E-06
4.E-06
5.E-06
0 0.5 1 1.5 2 2.5 3f (Hz)
power spectrum
7/26/02
Floor motion measurement

Corner station seismometer spectra (LLO)
X (U)
Y (V)

HAM1 accelerometer spectra
X (U)
Y (V)

Floor motion correlation measurement
P1 P2 P3
P4
P5
X arm
Y armPortable seismometer location
Beam splitter
LLO

Phase delay in y component along x arm
8/19/02 seis y vs position x
20
40
60
80
100
120
1 1.2 1.4 1.6 1.8 2
f (Hz)
phase (deg)
position 1
2
3x
Standing wave due to reflectionat HAM resonance? ~1.5 Hz
HAM
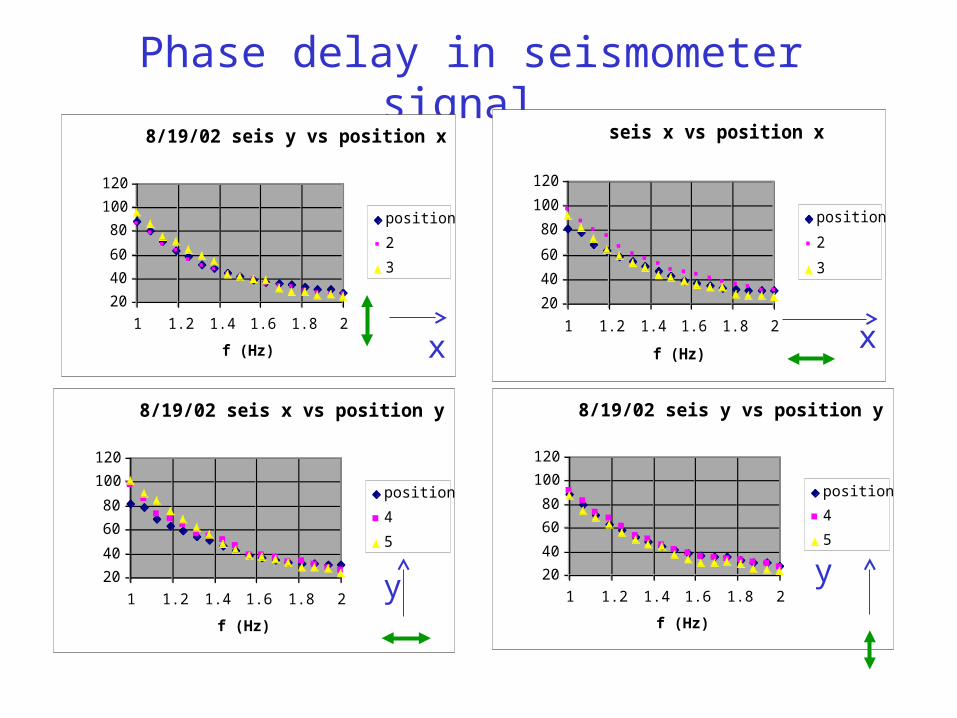
Phase delay in seismometer signal
8/19/02 seis x vs position y
20
40
60
80
100
120
1 1.2 1.4 1.6 1.8 2
f (Hz)
phase (deg)
position 1
4
5
y
8/19/02 seis y vs position x
20
40
60
80
100
120
1 1.2 1.4 1.6 1.8 2
f (Hz)
phase (deg)
position 1
2
3
x
seis x vs position x
20
40
60
80
100
120
1 1.2 1.4 1.6 1.8 2
f (Hz)
delta phase (deg)
position 1
2
3
8/19/02 seis y vs position y
20
40
60
80
100
120
1 1.2 1.4 1.6 1.8 2
f (Hz)
phase (deg)
position 1
4
5
x
y

E2e boxes for MMT3
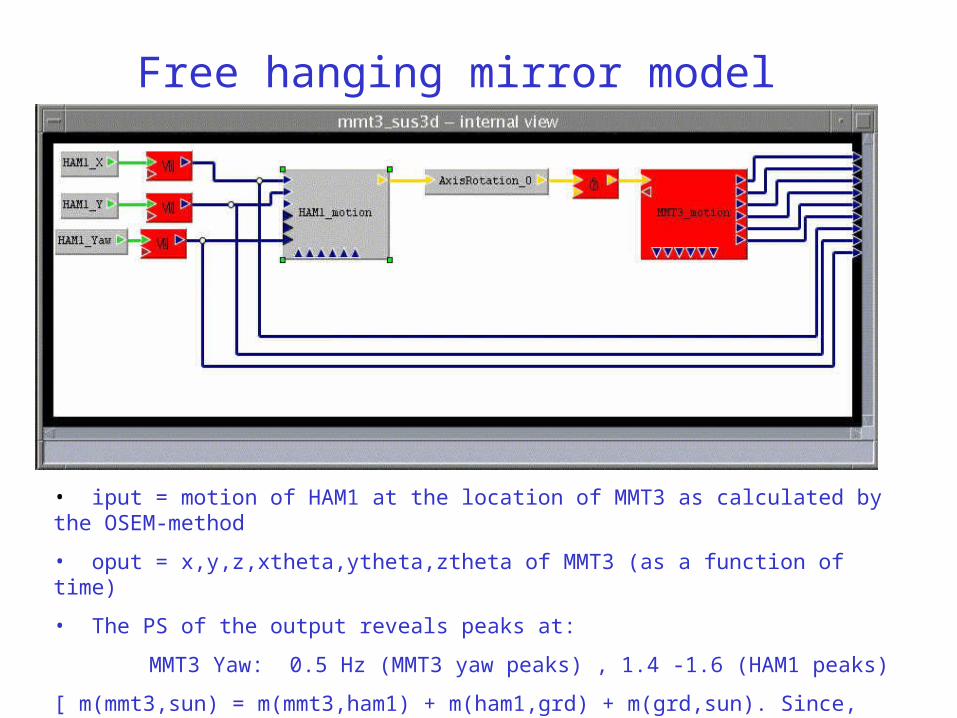
Free hanging mirror model (SUS3D.box)
• iput = motion of HAM1 at the location of MMT3 as calculated by the OSEM-method
• oput = x,y,z,xtheta,ytheta,ztheta of MMT3 (as a function of time)
• The PS of the output reveals peaks at:
MMT3 Yaw: 0.5 Hz (MMT3 yaw peaks) , 1.4 -1.6 (HAM1 peaks)
[ m(mmt3,sun) = m(mmt3,ham1) + m(ham1,grd) + m(grd,sun). Since, there is no m(grd,sun) in the iput, we should not see any m(grd,sun) peaks in oput. ]
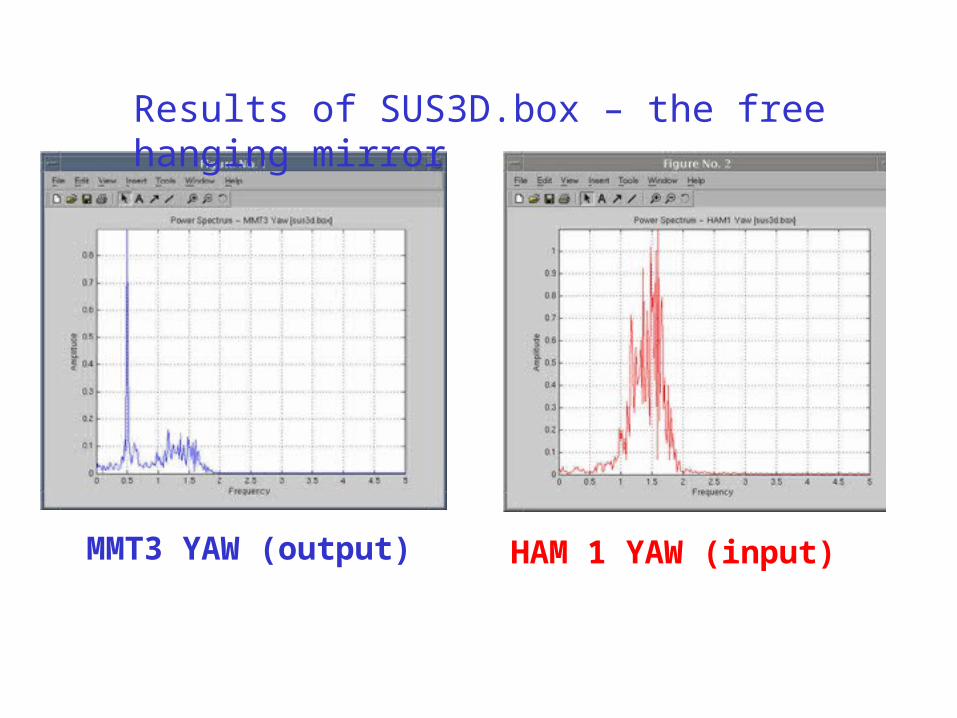
Results of SUS3D.box – the free hanging mirror
MMT3 YAW (output) HAM 1 YAW (input)

Floor to optic model (MMT3.box )
This box takes floor motion as input and outputs table motion (=suspension point motion) and optics motion
xOp(t)
xG (t)
THt->Op
TG->Htp
xHt(t)
Model suspension at SLU

SLU model suspension (1)
Mechanical Oscillator
L
m
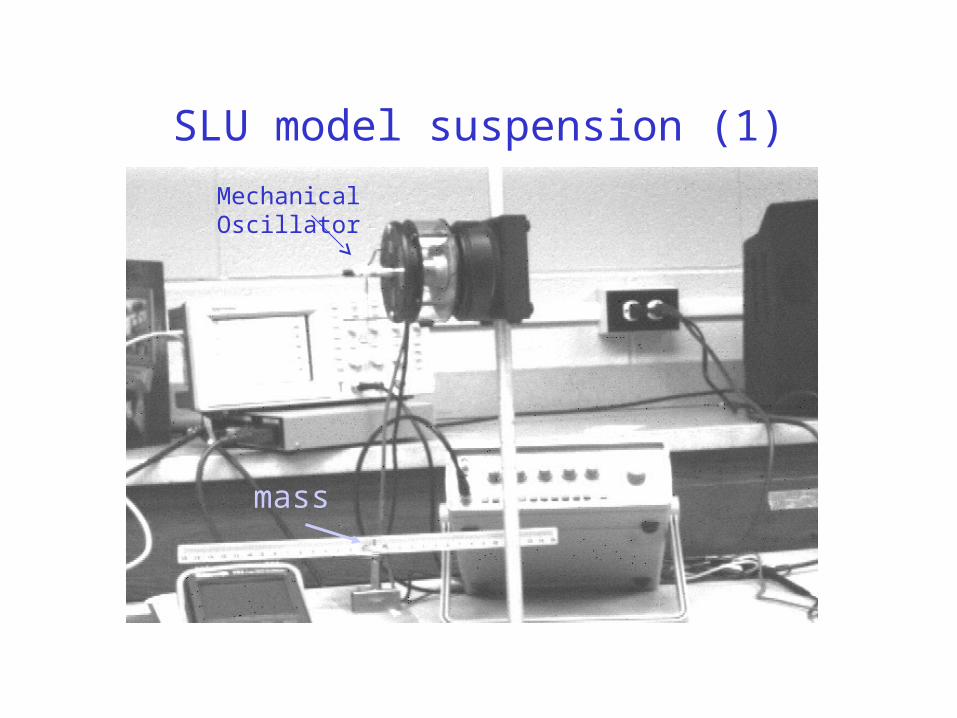
SLU model suspension (1)
mass
Mechanical Oscillator
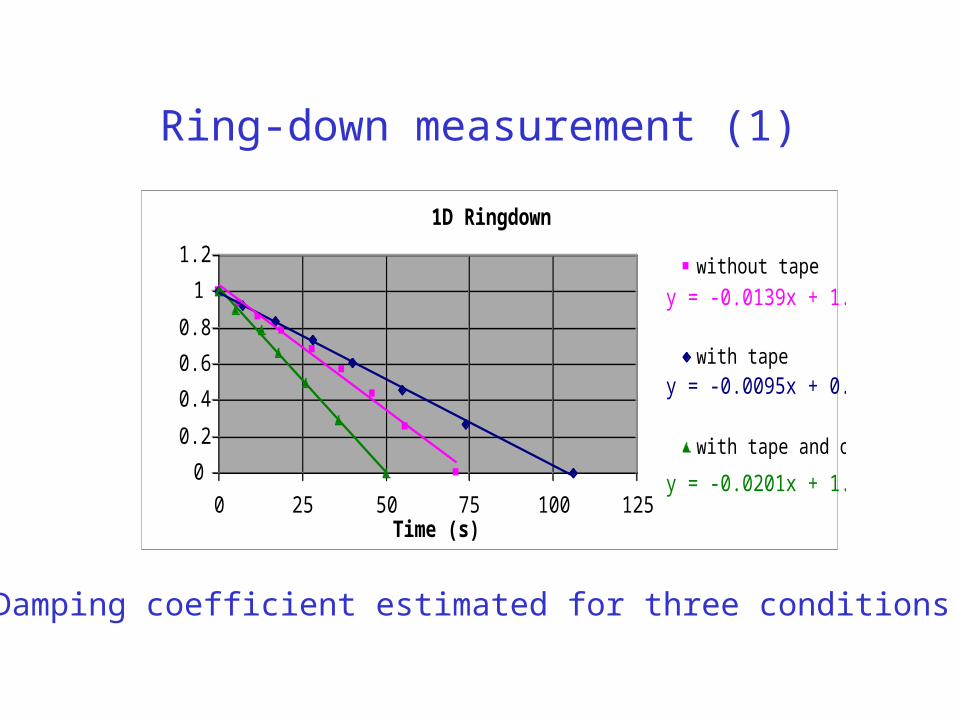
Ring-down measurement (1)
1D Ringdown
y = -0.0201x + 1.0187
y = -0.0095x + 0.9918
y = -0.0139x + 1.0353
0
0.2
0.4
0.6
0.8
1
1.2
0 25 50 75 100 125Time (s)
Amplitude ln(cm)
without tape
with tape
with tape and oil
Damping coefficient estimated for three conditions.
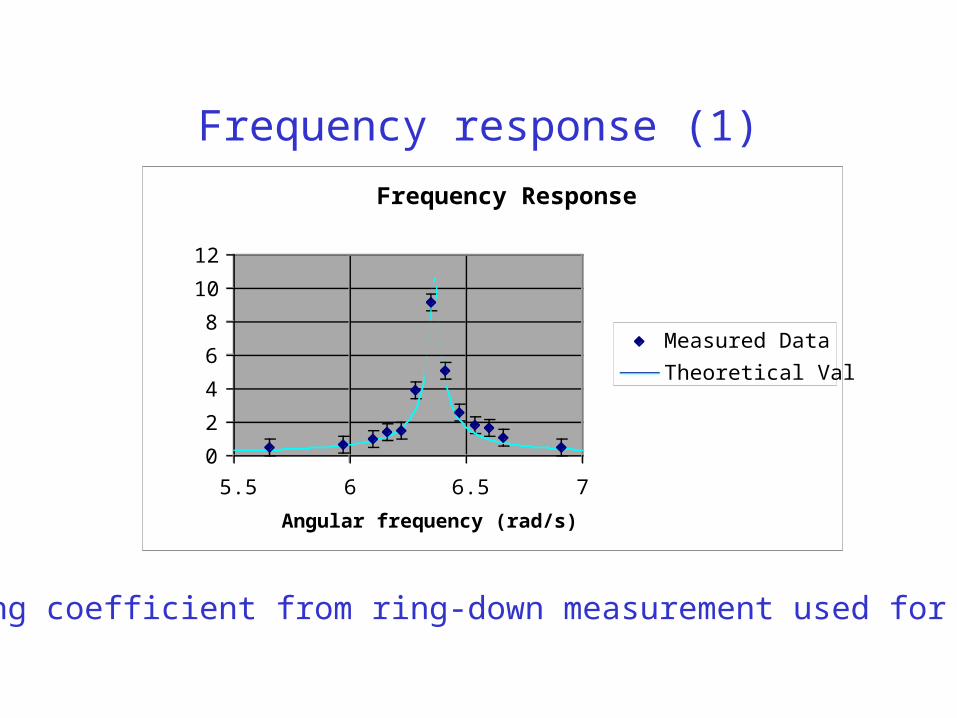
Frequency response (1)
Frequency Response
0
2
4
6
8
10
12
5.5 6 6.5 7
Angular frequency (rad/s)
Amplitude (cm)
Measured Data
Theoretical Values
Damping coefficient from ring-down measurement used for theory.

SLU model suspension (2)
Mechanical Oscillator
Suspension Block
Mirror
Block
Front View Side View
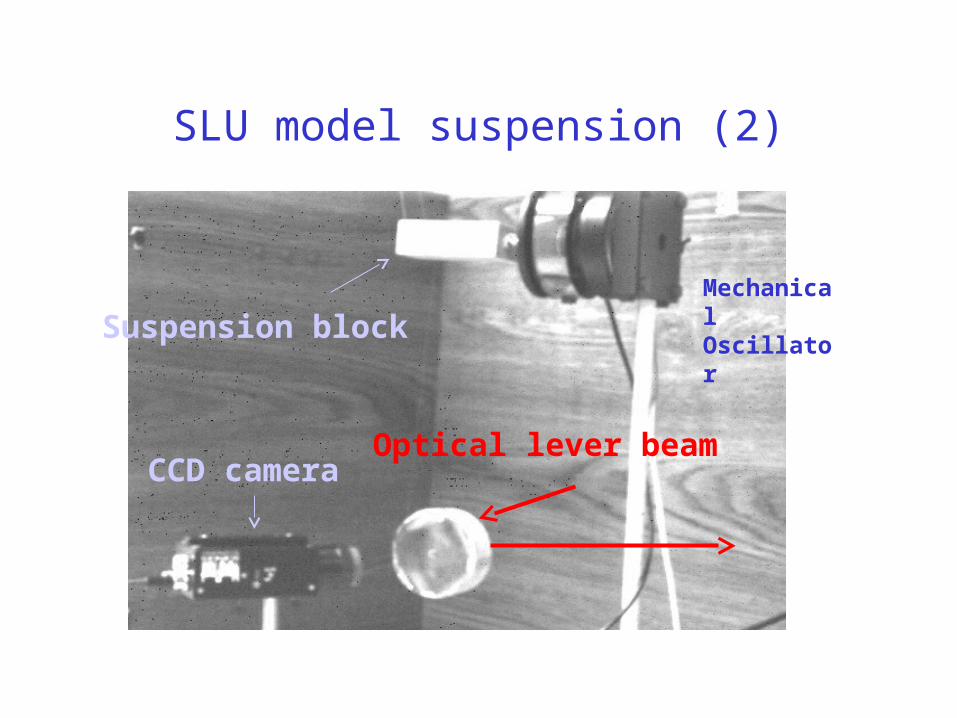
SLU model suspension (2)
Mechanical OscillatorSuspension block
Optical lever beamCCD camera
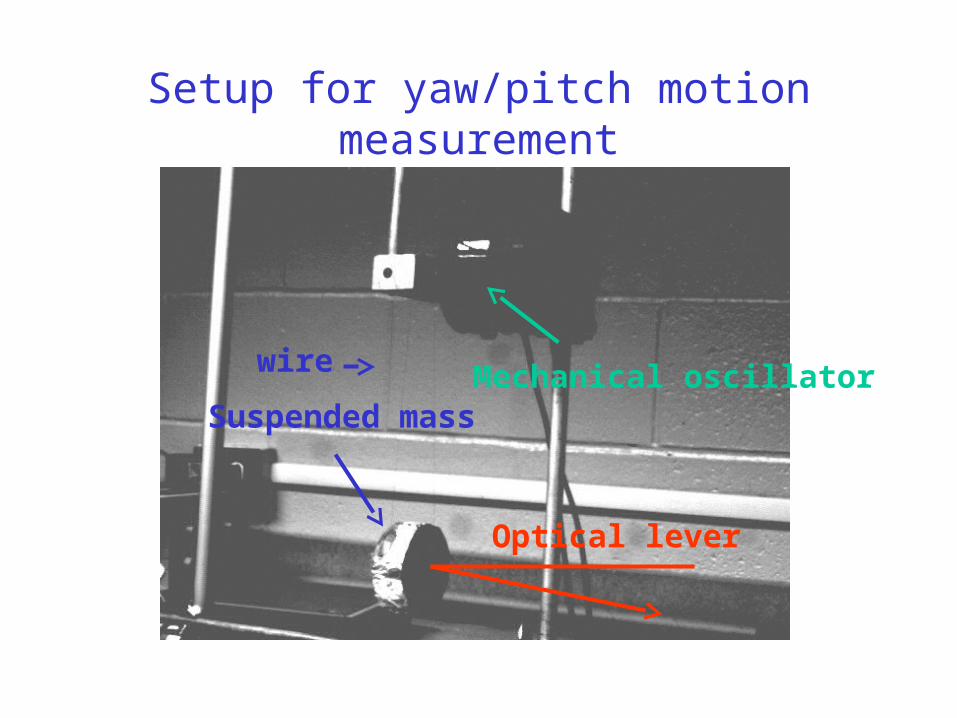
Setup for yaw/pitch motion measurement
Optical lever
Mechanical oscillatorSuspended mass
wire
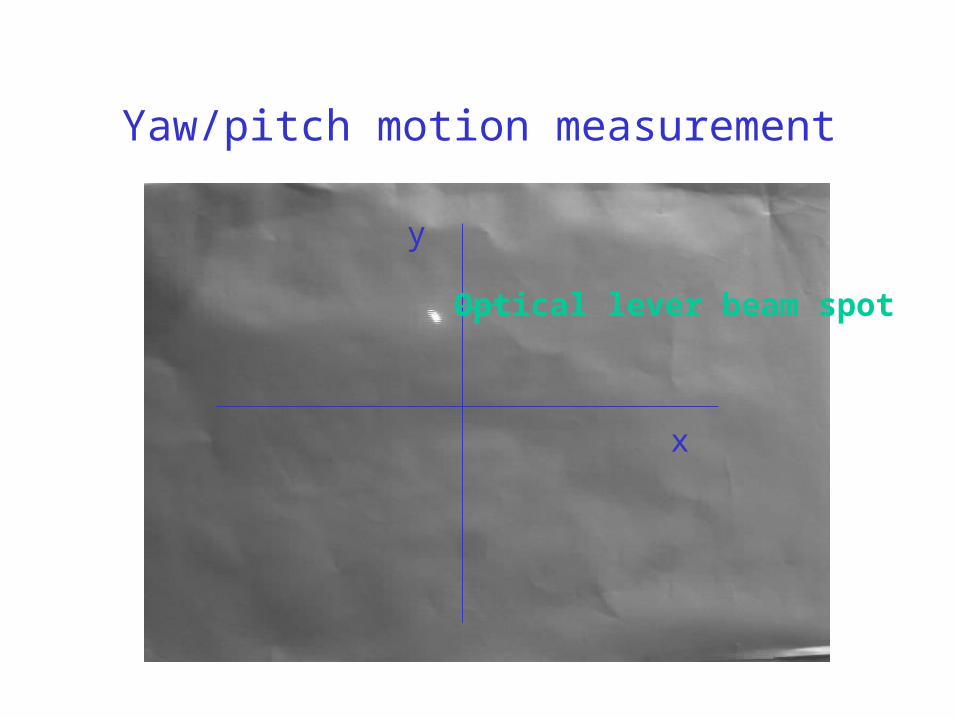
Yaw/pitch motion measurement
x
y
Optical lever beam spot
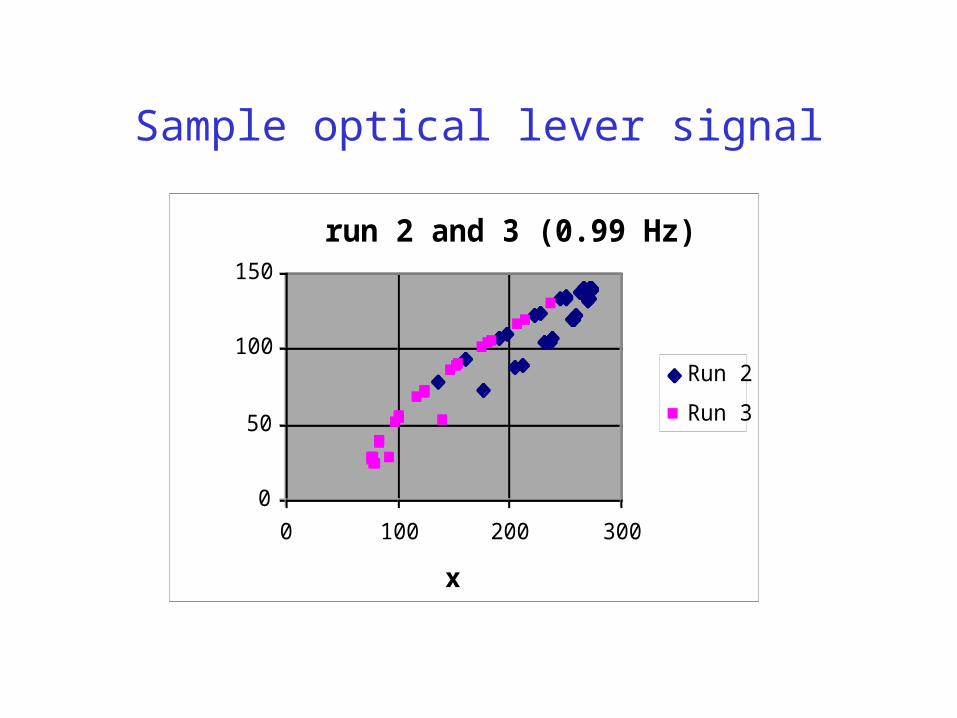
Sample optical lever signal
run 2 and 3 (0.99 Hz)
0
50
100
150
0 100 200 300
x
y Run 2
Run 3

Ring-down measurement (2)
3D Ringdown (Yaw Motion)
y = -0.0166x + 1.0066
y = -0.0085x + 0.9902
0
0.2
0.4
0.6
0.8
1
1.2
0 50 100 150
Time (seconds)
Optical lever reading
ln (cm)
without tape
with tape

Frequency dependence (2)
Frequency Response with tape
-0.1
0
0.1
0.2
0.3
0.4
0 0.5 1 1.5 2 2.5
Frequency (Hz)
Angle (rad)
Measured Data
Theoretical Values
Summary
• E2e simulation of suspended optics
– Influence on IFO
• Floor to table top modeling
– Supporting data taking
• Table top to optic modeling
– Model suspension
• Measurement of seismic motions with correlation is very important.