INVESTIGATION OF THE FLEXURAL STRENGTHENING...
94
University of Southern Queensland Faculty of Engineering & Surveying INVESTIGATION OF THE FLEXURAL STRENGTHENING OF CONCRETE BEAMS USING EXTERNAL PRESTRESSING A dissertation submitted by Mr Shawn Wayne Davis in fulfilment of the requirements of ENG4112 Research Project towards the degree of Bachelor of Engineering (Civil) Submitted: October, 2005
-
Upload
trankhuong -
Category
Documents
-
view
220 -
download
0
Transcript of INVESTIGATION OF THE FLEXURAL STRENGTHENING...
University of Southern Queensland
Faculty of Engineering & Surveying
INVESTIGATION OF THE FLEXURAL
STRENGTHENING OF CONCRETE BEAMS USING
EXTERNAL PRESTRESSING
A dissertation submitted by
Mr Shawn Wayne Davis
in fulfilment of the requirements of
ENG4112 Research Project
towards the degree of
Bachelor of Engineering (Civil)
Submitted: October, 2005
Abstract
External prestressing offers a viable strengthening and rehabilitation tool for aging,
overloaded or weakening members. This technology can therefore help to strengthen
all existing flexural members that external prestressing can practically be applied to,
including bridge girders and structural flexural beams. This project aims to investigate
the variation in flexural strength of rectangular reinforced concrete beams with the
application of an external prestress. The project aims at comparing the deflection and
crack patterns of two loading systems along with the flexural capacity increase. These
2 loading conditions can hopefully represent or model the loading patterns that such
flexural members will experience in service. With the inclusion of the external pre-
stressing, not only will the flexural strength be expected to increase, but the deflection
decrease, and crack widths minimised.
Some major aims of the project are as follows:
• To obtain the magnitude of the change in the specimens flexural strength after
prestressing.
• To observe and compare the change in the specimens deflections and crack widths.
Four test specimens were prepared and cured in a similar environment. Two of the
beams were used as control beams, and two of the beams were given an external pre-
stress. The displacement and flexural loading capacity of the test beams were compared
to the control beams for the two loading positions.
The results have shown that under both loading positions, the reinforced concrete
beams have reacted with positive results. The first test involving the loading position
ii
of A = 1 m, achieved a 50% increase in flexural strength. The deflection of the pre-
stressed beam was reduced by 63.18% after prestressing was applied. For the second
test with the loading position of A = 0.5 m, a 74% increase in flexural strength was
achieved with a 59% deflection reduction after prestress.
The large increase in flexural strength and effectiveness of the prestressing force to
close the cracks present within the beam reinforce the effectiveness of this technique as
a means to rehabilitate flexural members in service. Though this prestressing method
is a more “conventional” method, the experimental data and results further prove that
it is in-fact an effective method.
All these advantages make this classical style post-tensioning method effective in the
rehabilitation or strengthening of Australia’s concrete structures. Hopefully the project
will show positive results and lead to further studies and applications of the external
prestressing technology for flexural strengthening.
The second order effects of the prestressing effect have not been included, where at mid-
span the depth of the prestressing bar varies with load applied, as the beam deflects.
The effects have been assumed negligible for loads used in this study, but for increasing
loads, or increasing sensitive members, these effects should be taken into account.

University of Southern Queensland
Faculty of Engineering and Surveying
ENG4111/2 Research Project
Limitations of Use
The Council of the University of Southern Queensland, its Faculty of Engineering and
Surveying, and the staff of the University of Southern Queensland, do not accept any
responsibility for the truth, accuracy or completeness of material contained within or
associated with this dissertation.
Persons using all or any part of this material do so at their own risk, and not at the
risk of the Council of the University of Southern Queensland, its Faculty of Engineering
and Surveying or the staff of the University of Southern Queensland.
This dissertation reports an educational exercise and has no purpose or validity beyond
this exercise. The sole purpose of the course pair entitled “Research Project” is to
contribute to the overall education within the student’s chosen degree program. This
document, the associated hardware, software, drawings, and other material set out in
the associated appendices should not be used for any other purpose: if they are so used,
it is entirely at the risk of the user.
Prof G Baker
Dean
Faculty of Engineering and Surveying

Certification of Dissertation
I certify that the ideas, designs and experimental work, results, analyses and conclusions
set out in this dissertation are entirely my own effort, except where otherwise indicated
and acknowledged.
I further certify that the work is original and has not been previously submitted for
assessment in any other course or institution, except where specifically stated.
Mr Shawn Wayne Davis
Q11215594
Signature
Date

Acknowledgments
This research was carried out under the principal supervision of Dr Thiru Aravinthan,
whom I would like to thank for all his guidance and support. I would also like to
give a special thanks to T.G.Suntharauadivel who helped with the project specimen
preparation testing phase and Steven Luther for his assistance in this project.
Mr Shawn Wayne Davis
University of Southern Queensland
October 2005

Contents
Abstract i
Acknowledgments v
List of Figures ix
List of Tables xii
Chapter 1 Introduction 1
1.1 General Background . . . . . . . . . . . . . . . . . . . . . . . . . . . . . 1
1.2 Research Aim and Objectives . . . . . . . . . . . . . . . . . . . . . . . . 3
1.3 External Prestress . . . . . . . . . . . . . . . . . . . . . . . . . . . . . . 4
1.4 Dissertation Overview . . . . . . . . . . . . . . . . . . . . . . . . . . . . 6
1.5 Summary . . . . . . . . . . . . . . . . . . . . . . . . . . . . . . . . . . . 7
Chapter 2 Review of External Prestressing 8
2.1 Introduction . . . . . . . . . . . . . . . . . . . . . . . . . . . . . . . . . . 8
2.2 Historical Development . . . . . . . . . . . . . . . . . . . . . . . . . . . 9

CONTENTS vii
2.3 Previous Studies . . . . . . . . . . . . . . . . . . . . . . . . . . . . . . . 10
Chapter 3 Specimen Design 12
3.1 Introduction . . . . . . . . . . . . . . . . . . . . . . . . . . . . . . . . . . 12
3.2 Specimen Design Approach . . . . . . . . . . . . . . . . . . . . . . . . . 12
3.3 Beam Specimen Design . . . . . . . . . . . . . . . . . . . . . . . . . . . 15
3.3.1 Beam Dimensions . . . . . . . . . . . . . . . . . . . . . . . . . . 16
3.3.2 Steel Reinforcement . . . . . . . . . . . . . . . . . . . . . . . . . 17
3.4 Control Condition Strength Capacity . . . . . . . . . . . . . . . . . . . . 19
3.5 Prestress Design . . . . . . . . . . . . . . . . . . . . . . . . . . . . . . . 26
3.6 Prestressed Strength Capacity . . . . . . . . . . . . . . . . . . . . . . . 29
Chapter 4 Experimental Methodology 33
4.1 Introduction . . . . . . . . . . . . . . . . . . . . . . . . . . . . . . . . . . 33
4.2 Experimental Procedure and Variables . . . . . . . . . . . . . . . . . . . 34
4.3 Formwork Construction and Details . . . . . . . . . . . . . . . . . . . . 35
4.4 Steel Reinforcement Details . . . . . . . . . . . . . . . . . . . . . . . . . 37
4.5 Concreting . . . . . . . . . . . . . . . . . . . . . . . . . . . . . . . . . . 40
4.6 Instrumentation . . . . . . . . . . . . . . . . . . . . . . . . . . . . . . . . 43
4.6.1 Strain Gauge placement . . . . . . . . . . . . . . . . . . . . . . . 44
4.6.2 Linear Variable Displacement Transducer (LVDT) Placement . . 47

CONTENTS viii
4.6.3 Load Cells and Anchorage Apparatus . . . . . . . . . . . . . . . 47
Chapter 5 Results and Discussion 52
5.1 Introduction . . . . . . . . . . . . . . . . . . . . . . . . . . . . . . . . . . 52
5.1.1 Compression Testing Results . . . . . . . . . . . . . . . . . . . . 54
5.1.2 Flexural testing of Control Beams . . . . . . . . . . . . . . . . . 55
5.1.3 Flexural testing of Prestressed Beams . . . . . . . . . . . . . . . 58
5.1.4 Control Beams versus Prestressed Beams . . . . . . . . . . . . . 62
5.2 Comparison of Loading Position . . . . . . . . . . . . . . . . . . . . . . 64
5.3 Theoretical versus Experimental Results . . . . . . . . . . . . . . . . . . 68
5.4 Increases in Prestressing Force . . . . . . . . . . . . . . . . . . . . . . . 70
5.5 Conclusion . . . . . . . . . . . . . . . . . . . . . . . . . . . . . . . . . . 74
Chapter 6 Conclusion 75
6.1 Completion of Aims and Objectives . . . . . . . . . . . . . . . . . . . . 75
6.2 Conclusion . . . . . . . . . . . . . . . . . . . . . . . . . . . . . . . . . . 77
6.3 Recommendations for further studies . . . . . . . . . . . . . . . . . . . . 77
References 79
Appendix A Project Specification 80

List of Figures
3.1 Loading Position Arrangement for Test Beams . . . . . . . . . . . . . . 13
3.2 Bending Moment Diagram at A = 1 m . . . . . . . . . . . . . . . . . . 14
3.3 Bending Moment Diagram at A = 0.5 m . . . . . . . . . . . . . . . . . 14
3.4 Shear Force Diagram . . . . . . . . . . . . . . . . . . . . . . . . . . . . 15
3.5 Front View of Design Specimen . . . . . . . . . . . . . . . . . . . . . . 16
3.6 Top View of Beam Specimen . . . . . . . . . . . . . . . . . . . . . . . . 16
3.7 Typical Cross-Section of Beam Specimen . . . . . . . . . . . . . . . . . 17
3.8 Shear Reinforcing Spacing . . . . . . . . . . . . . . . . . . . . . . . . . 18
3.9 Typical Section Reinforcing . . . . . . . . . . . . . . . . . . . . . . . . . 18
3.10 Mid-Span Section Flexural Analysis . . . . . . . . . . . . . . . . . . . . 19
3.11 Strain Diagram . . . . . . . . . . . . . . . . . . . . . . . . . . . . . . . 22
3.12 Cross Section of the Anchorage Plates adn Prestressing Bars . . . . . . 28
3.13 Prestress Anchorage and Jacking System . . . . . . . . . . . . . . . . . 29
3.14 Load Cells adn Anchorage System . . . . . . . . . . . . . . . . . . . . . 30
LIST OF FIGURES x
3.15 Acting Forces within Prestressed System . . . . . . . . . . . . . . . . . 31
4.1 Section View of the Beams Formwork . . . . . . . . . . . . . . . . . . . 36
4.2 Completed Formwork . . . . . . . . . . . . . . . . . . . . . . . . . . . . 37
4.3 Completed Formwork . . . . . . . . . . . . . . . . . . . . . . . . . . . . 37
4.4 Custom Jig . . . . . . . . . . . . . . . . . . . . . . . . . . . . . . . . . . 39
4.5 Completed Reinforcing Cage . . . . . . . . . . . . . . . . . . . . . . . . 40
4.6 Steel Reinforcing Chairs . . . . . . . . . . . . . . . . . . . . . . . . . . . 41
4.7 Completed Cast Concrete . . . . . . . . . . . . . . . . . . . . . . . . . . 42
4.8 Coompression Testing Cylinder Moulds . . . . . . . . . . . . . . . . . . 43
4.9 Compression Testing of the Concrete Cylinders in the Avery Machine . 44
4.10 Testing System including Prestressing and the System 5000 . . . . . . . 45
4.11 Labelling of the Flexural Steel Strain Gauge . . . . . . . . . . . . . . . 46
4.12 Application of Shear Reinforcement Strain Gauges . . . . . . . . . . . . 47
4.13 Multimetre, Adhesive adn Acetone . . . . . . . . . . . . . . . . . . . . . 48
4.14 Top Concrete Strain Gauges . . . . . . . . . . . . . . . . . . . . . . . . 49
4.15 System 5000 Strain Gauge Data Lines . . . . . . . . . . . . . . . . . . . 49
4.16 LVDT . . . . . . . . . . . . . . . . . . . . . . . . . . . . . . . . . . . . . 50
4.17 Load Cells in Position for Initial Prestressing . . . . . . . . . . . . . . . 50
4.18 Hydraulic Jack and Prestressing Apparatus . . . . . . . . . . . . . . . . 51
LIST OF FIGURES xi
5.1 The Load versus Deflection for Control Beam 1 . . . . . . . . . . . . . 55
5.2 Mid-Span Flexural Cracking of the Control Beam . . . . . . . . . . . . 56
5.3 Load versus Deflectionf for Control Beam 3 . . . . . . . . . . . . . . . . 57
5.4 Local Crushing of the Concrete Mid-Span of the Beam . . . . . . . . . 58
5.5 Load Versus Deflection for Prestressed Beam 2 . . . . . . . . . . . . . . 59
5.6 Load Versus Deflection for Prestressed Beam 4 . . . . . . . . . . . . . . 60
5.7 The Load versus Deflection for the Control Beam and Prestressed Beam
of Loading Position of A = 1m . . . . . . . . . . . . . . . . . . . . . . . 63
5.8 The Load versus Deflectionf or the Control Beam and Prestressed Beam
for Loading Position of A = 0.5m . . . . . . . . . . . . . . . . . . . . . . 64
5.9 The Load versus Deflection for the Control Beams . . . . . . . . . . . 65
5.10 The Load versus Deflection for the Prestressed Beams . . . . . . . . . . 66
5.11 Propogation of the Shear Cracks Formed . . . . . . . . . . . . . . . . . 67
5.12 Typical Flexural Crackign Pattern for All Test Specimens . . . . . . . . 68
5.13 Increase in Prestressing Force . . . . . . . . . . . . . . . . . . . . . . . 74
List of Tables
3.1 Mechanical Properties of External Prestressing Bars, (Source-SAA HB64,
2002),Guide to Concrete Construction, pg 17.5, table 17.1 . . . . . . . . 28
5.1 Strain Gauge Labels and Relevant System 5000 Inpout Lines . . . . . . 53
5.2 Compression Test Results . . . . . . . . . . . . . . . . . . . . . . . . . . 54
5.3 Percentage Increase in Flexural Strength after Prestress . . . . . . . . . 64
5.4 Percentage Decrease in Deflection after Prestress . . . . . . . . . . . . . 65
5.5 Theoretical versus Experimental Flexural Control Beam Results . . . . 69
5.6 Theoretical versus Experimental Flexural Prestress Results . . . . . . . 69
5.7 Recorded Values of Prestressing Force within the Prestressing Tendons . 72
5.8 Recorded Value of Force versus the Predicted Force using the Recorded
value of Force within the Tendons . . . . . . . . . . . . . . . . . . . . . 73
Chapter 1
Introduction
1.1 General Background
Concrete, in its most basic form, is a mixture of cement, water and fine and coarse
aggregates (sand and crushed rock or natural gravel), which is plastic when first mixed,
but which then sets and hardens into a solid mass. When plastic, it can be moulded
or extruded into a variety of shapes. When hardened, it is strong and durable, able
to support substantial loads and, at the same time, resist the effects of fire, weather,
wear, and other deteriorating influences. It is, therefore a construction material of great
versatility and wide application (SAA HB64, 2002).
The properties of concrete in both the plastic and the hardened states are dependant
on the physical characteristics, the chemical composition, and the proportions of the
components used in the mixture. Thus by varying the components, the type of concrete
made can vary. Other forms of cement available are Blended cements; High-early
strength cements, which as suggests gains high strength earlier than Portland cements;
Low heat cements, used where limits are placed on the temperature rise associated with
the heat of hydration; Shrinkage limited cements; Sulphate resisting cements along with
various other commercially available cement mixes.
Reinforced concrete was invented by a Joseph Monier in 1861, and the concept of
reinforcement concrete was patented in 1867. Reinforced concrete is a combination

1.1 General Background 2
of steel and concrete. Concretes compressive strength is high, making it ideal for
members loaded under compressive forces. Columns and arches are perfect examples of
where concrete high compressive strength can be used. Concrete is a relatively brittle
material, where its tensile strength is very low in comparison with its compressive
strength, preventing its economical use in structural members subject to tensile forces
or biaxial loading. “To offset this limitation, it was found possible, in the second half of
the nineteenth centaury, to use steel with its high tensile strength to reinforce concrete”
(Nilson, Darwin, Dolan, 2004). The inclusion of steel also enables designers to allow
for a ductile failure, instead of what could result in brittle failure if the tensile forces
were in fact carried by the concrete. In reinforced concrete the compressive forces
are carried by the compressive area of the concrete, and the tensile forces are in part
taken by the area of steel provided in the tensile section of the reinforced concrete.
The concrete cover which exists over the steel acts as a durable fire and wear resistant
barrier, protecting the steel. The aim of the reinforced concrete designer is to combine
the reinforcement with the concrete in such a manner that sufficient of the relatively
expensive reinforcement is incorporated to resist the tensile and shear forces which may
occur, whilst utilising the comparatively inexpensive concrete to resist the compressive
forces (SAA HB64, 2002).
This resulting combination of steel and concrete is a relatively low cost material with
good weather and fire resistance, good compressive and tensile strength, high workabil-
ity and formability. These above characteristics make reinforced concrete an excellent
structural material, where present day construction purposes include buildings, bridges,
dams, tanks, reservoirs and many other uses. The widespread structural and commer-
cial use of construction using concrete stems forms its availability and cheapness.
Prestressed concrete, like reinforced concrete is a composite material. The main purpose
of using prestressing on a flexural member is to improve its load capacity behaviour,
created by an induced force which in turn creates an internal moment which opposes
that of the moment created by the imposed service loads. Resulting in less deflection
and cracking of that flexural member.
Time dependent reduction in the prestressing force, due to creep and shrinkage of
the concrete and relaxation of the prestressing steel tendon are but a few long term

1.2 Research Aim and Objectives 3
losses associated with prestressing. These losses must be taken into account for the
expected loading during the members service life for a successful implementation of the
technology to be in fact successful. Other problems that arise from external prestressing
are the long term durability problems associated with the external unbonded tendons.
Long term maintenance and supervision are required.
At present, the application of external prestressing to deteriorating, overloaded or aging
existing structures/members using unbonded tendons is proving to be a very effective
and promising means of strengthening structural elements or systems. Even in well
designed concrete members cracking is the main cause of failure. This can lead to
loss of structural integrity allowing partial or total collapse mechanisms to occur. The
applications of external prestressing type rehabilitation techniques have been shown
to not only increase the life expectancy of the member or system, but to increase the
flexural strength considerably, resulting in reduced deflection and crack widths. The
application of such models is still considered a growing technology in Australia. This
document will attempt to explain the background of the essential components within
the external prestressing system. It will also discuss the results that this research has
achieved, furthermore will hopefully add to the advancement of the research into this
exciting technology.
1.2 Research Aim and Objectives
This project aims to investigate the variation in flexural strength of rectangular rein-
forced concrete beams with the application of an external prestressing. Also to monitor
the deflections and cracks formed under loading condition. Some major aims of the
project are as follows:
• To develop a sound external prestressing application technique.
• To obtain the magnitude of the change in the specimens flexural strength after
external prestressing.
• To observe and compare the change in the specimens deflections and crack widths.

1.3 External Prestress 4
• To compare the experimental results with the theoretical predictions.
• Discuss other unexpected outcomes of the experimental phase.
External prestressing offers a viable strengthening and rehabilitation tool for aging,
overloaded or weakening members. This technology can therefore help to strengthen all
existing flexural members in which the external prestressing can practically be applied
to, including bridge girders and structural beams. The aim of this project is to compare
the increase in flexural strength form the prestressed concrete beams with the non-
prestressed concrete beams under two different loading conditions. These 2 loading
conditions can somewhat represent or model the loading patterns that such flexural
member will experience in service. With the inclusion of the external prestressing, not
only will the flexural strength be increase, but the deflection decreases, and any cracks
minimised. Hopefully the results of the project show that given an aging or weakening
member of similar proportions and under similar loading conditions, the methodologies
discussed could be used to extend the members service life, and or to increase its service
capacity without the need to replace the member.
This thesis developed and analysed the flexural strengthening of reinforced concrete
beams using the application of external prestressing. Such advancements are required
for the strengthening and rehabilitation of new or existing concrete structure. The
forever aging, weakening and overloading of our current concrete structures requires
such methods.
1.3 External Prestress
External prestressing refers to a post tensioning method in which prestressing tendons
are not enclosed or bonded within the concrete, rather are “external” and attached
through a serious of anchor points. Thus the prestress force is transferred via these
anchor points as a compressive force into the beam itself. The prestressing principle is
believed to have been well understood since about 1910, although patent applications
related to types of construction involving the principle of prestressing date back to 1888
(Libby, 1984).

1.3 External Prestress 5
Pre-tensioning and post-tensioning are forms of prestress. Where post-tensioning of
the tendon occurs after the concrete has sufficient strength to support the prestressing
force. This method is usually used primarily for in-situ construction. In pre-tensioning
the tendon is prestressed before the concrete is cast. Usually formed in a Workshop
environment and transported to site. In the case of external pre-tensioning, the order
in which the stress is applied does not vary but rather whether the tendon is contained
within the beam itself and or bonded or unbonded. In prestressed concrete members,
the concrete is placed in compression, the compression force is formed from the force or
stretching of the tendons (strands or bars) either bonded or non-bonded, transferring
the compression force to the concrete via the anchor points. This compressive force
acts to then place the concrete in compression which enables the member or system to
withstand a greater service flexural loading. The moment induced from the prestressing
force, along with the eccentricity of the tendon act against the load induced moment
form imposed and permanent loads, thus prestress increases the load capacity of the
member.
As the tendons themselves, or in the case of this project, the high tensile bars are
external to the safety of the durable concrete, the bars are therefore exposed to the ele-
ments and deterioration of the bars can occur without proper precautions. Surveillance
and maintenance measures are necessary, including the maintenance of the prestress-
ing force within the tendons, as this can decrease with time, and a re-stress may be
necessary.
Some of the advantages and limitations of this style of external prestressing on in service
flexural members have been produced below:
Advantages of Externally prestressed Unbonded Tendons:
• The tendon placement and adjustment is carried out separately to the concrete
placement and concrete works.
• Implementing external prestress on existing works as it stands, without undue
moving or dismantling the structure.
• If effectively initiated, the cracking due to overloading or aging will be closed

1.4 Dissertation Overview 6
completely without the need for crack strengthening techniques, rather crack
durability control techniques.
• The tendons are easily accessed for re-stressing and can be easily maintained or
replaced.
• The prestressing bars can be easily mounted and transported, as the bars are a
rigid stiff medium given the side area of the flexural member is available.
• Given that this project uses high tensile threaded bars as the prestressing ten-
don, the prestressing force is easily maintained and varied with plates and nuts
threaded onto the rod.
Limitations of Externally prestressed Unbonded Tendons:
• The room required for the placement and stressing of the tendon may not al-
ways be considered in the design of the specimen and can limit such prestressing
applications.
• The tendons used in external prestressing techniques are exposed to the elements
(fire, chemicals, weather, etc.), and can deteriorate without proper supervision
and maintenance. Costs over time are then implicated from such maintenance
measures.
• External bars extruding form the structure along the flexural members can be
very unsightly and detract form the aesthetics of a structure.
1.4 Dissertation Overview
An overview of the dissertation will now be included to prompt the reader of its contents
and the structural format of the this project.
Chapter 2
This chapter gives a detailed review of external prestressing, including historical back-
ground of the prestressing technique and how the technique have developed. This
chapter also attempts to explain the theory or purpose behind this study. Various
theoretical studies will be sourced.
1.5 Summary 7
Chapter 3
This chapter gives an overview on the specimen design. This will include all flexural
and shear calculations, including moment and shear diagrams. Shear reinforcing and
spacing is also be covered. Finally the design of the external prestress that was used
will be discussed.
Chapter 4
This chapter will discuss the experimental methodology used in this study, the pro-
cedure undertaken throughout the testing of the specimens, including the various
processes and preparation techniques undertaken will be discussed.
Chapter 5
This chapter will discuss all results obtained throughout the testing phase. Com-
parisons between tests, and also comparisons between the theoretical predictions and
experimental results will be shown.
Chapter 6
In this chapter the final conclusion on the projects testing and results will be made.
This chapter also strives to conclude on the aims of the research set out to be achieved
and gives recommendations for further study.
1.5 Summary
This thesis aims to inform the reader how the project results and conclusions were devel-
oped and achieved. All experimental data will be compared with the theoretical data,
and conclusions on any observations will be made. The research made will hopefully
result in further applications into this style of prestressing, and also the understanding
of how flexural members behave under loading conditions similar to those tested. The
outcomes of this study will hopefully provide enough data for finite element techniques
and further research into the areas of the test specimens stressed and why the concrete
cracked where it did.
Chapter 2
Review of External Prestressing
2.1 Introduction
Prestressing is the creation within a material of a state of stress and deformation that
will enable it to better perform its intended function, as the stresses induced by the
prestressing oppose that of the imposed stresses from loading. Prestressing can be
and has been applied to many materials including concrete, steel, stone, ceramics,
brick, timber, native rock and soil. The prestressing principle is believed to have been
well understood since about 1910, although patent applications related to types of
construction involving the principle of prestress date back to 1888. The early attempts
at prestressing were abortive, however, owing to the poor quality of materials available
in the early days as well as to a lack of understanding of the action of creep in concrete.
Prestressed concrete has gone through research and development phases during the
1930’s and 1940’s, and through specialised design and specialised construction phases
from 1955 to the present. Because of the minimal additional weight of the repair system,
this technique is effective and economical, and has been employed with great success to
correct excessive deflections and cracking in beams and slabs, parking structures and
cantilevered members.
As stated in SAA HB64 (2002) “Prestressed concrete may be defined as reinforced
concrete in which the reinforcement, high tensile steel wires or bars, is stretched or

2.2 Historical Development 9
tensioned before being bonded with the concrete in some way. The force in the steel is
transferred to the concrete, placing it in compression and thereby increasing its ability
to withstand tensile forces. The development of prestressed concrete has enabled greater
spans and more slender structures to be achieved”.
2.2 Historical Development
The first worldwide externally prestressed concrete bridge built, was in Aue, Saxony
between 1935 and 1937. The bridge was based on a proposed concept by Dischinger
(DRP 727 429). The beam bridge had variable depths, with three spans (25.2 m - 69.0
m - 23.4 m). Suspended unbonded tendons running outside the concrete cross-section
were used. However corrosion of the unbonded tendons and a high loss of prestress
caused by creep and shrinkage within the concrete led to major problems with the
bridges function.
Proceeding 1945, developments in bridge construction within Germany were concen-
trated on internal post-tensioned systems. However, in both Belgium and France ex-
ternal prestressing was being implemented. In Germany the corrosion resistances of ex-
ternal tendons were considered to be inadequate at that time, whereas post-tensioned
bridges with internal tendons appeared unproblematic and so only this construction
method was further developed and applied (VSL Report Series, 1999).
Wayass and Freytag designed and constructed a bridge over the Dortmund-Hannover
Autobahn in Oelde, FRG, in 1938, where for the first time high tensile prestressing
steel arranged inside the concrete section was used for 4 simply supported girders of
33m spans. This bridge used methods which are commonly referred in the present as
conventional prestressed concrete. Also in the year of 1938, Finsterwalder developed
his concept of the “self-stressing concrete beam”, which was put to actual test for the
bridge over the same Autobahn at Rheda-Wiendenbruck, FRG (a simply supported
girder of 34.50m span). The bar tendons were later encased in concrete, giving rise
to the “self-stressing” system. During the years of 1938 to 1943, Haggbohm designed
and built the Klockestrand Bridge near Stockholm, Sweden. For the main spans the

2.3 Previous Studies 10
Dischinger concept was applied. The main span superstructure was prestressed with a
total of 48 bars of 30 mm with a yield strength of 520 N/mm. The constructed bridges
are still in service today after 50 years of use (VSL Report Series, 1999).
During the late 1950s, the first applications of external prestress for the strengthening
of existing structures can be found. An early example is the two span steel truss bride,
spanning 48 - 48 m over the River Aare at Aarwangen, Switzerland. The bridge was
originally built in 1889 and was no longer capable of supporting increasing modern
traffic loads. In 1967 the bridge was strengthened using external prestressing tech-
niques. A rebirth of the external post-tensioning techniques can be observed from the
mid-seventies onward (VSL Report Series, 1999).
In 1978-1979 Muller introduced external post-tensioning in the United States, for the
Key Bridges in Florida. His main goals were speed of construction and economy. Since
1980, many bridges have been designed and built using either external tendons or a
combination of internal and external tendons.
2.3 Previous Studies
External prestressing has become an integral part of the strengthening and rehabilita-
tion of aging, weakening and over loading of Australias reinforced concrete members
and structures. Abstracts of AS 3600 in HB 2.2 - 2003, the concrete structures design
code for Australia, has been used for all matters entailing to the design of the concrete
members. This maintains that the specimen design will be to an Australian recog-
nised minimum standard. “This standard sets out the minimum requirements for the
design and construction of concrete structures and members that contain reinforcing
steel, or tendons, or both” (HB 2.2 -2003). These standards are in place to ensure
that the construction industry of Australia remains a “structurally” safe environment.
This can also includes the factors involved with serviceability and durability where the
member itself may be strong enough, but will sag or crack and with time corrode and
leave unsightly stains. “The aim of structural design is to provide a structure that is
durable, serviceable and has adequate strength while serving its intended function and

2.3 Previous Studies 11
that satisfies other relevant requirements much as robustness , ease of construction and
economy” (HB 2.2 -2003). Thus all factors encountered in a members life are again
taken into in my specimen design, account according to AS 3600. Other texts exist for
the calculation of the moment and shear capacities, using variations and simplifications
or formulas, but I have chosen to simply stick with the Australian standard AS 3600.
This then gives a well known and highly regarded text to which the public can relate
and reference the theories I have chosen to use.
Sayed-Ahmed, Riad and Shrive (2004) showed that experimental work carried out in
Canada, using the externally post-tensioned bars on reinforced concrete bridge girders
yielded a 19% flexural strength increase. The document discusses how the experimental
flexural strength after post tensioning was 2% below the expected theoretical increase.
These results were very encouraging, and the document states that this “classical”
type approach of external post-tensioning should not be disregarded, confirming the
existence of further studies, like my research into the field of external prestress using
the “classical” style approach. The document refers to the external post tension using
steel bars as the ”classic” approach, in relativity to the new materials such as fibre
composites that are currently being experimented with in similar rehabilitation and
strength increasing programs.

Chapter 3
Specimen Design
3.1 Introduction
This chapter will describe the different approaches that were considered for the con-
struction of the flexural test specimens used for the testing phase of this project. The
chapter will describe the analytical calculations undertaken in the specimen sizing or
beam dimensions and demonstrate the reinforcing steel required to achieve the required
flexural and shearing strengths of the design section given the loading conditions. The
external prestressing capacity calculation of the section will also be shown.
3.2 Specimen Design Approach
The test specimen chosen for the flexural testing throughout this study were rectan-
gular concrete reinforced sections. The rectangular section is not the most material
efficient section in flexural bending in comparison with a T-shaped member, though
a rectangular section suited what resources were made available and will act similarly
under induced flexural loads. For flexural members the “T” section is usually used as
the thin webs allow for the external prestressing to be placed without the prestressing
apparatus protruding from the side of the beam. Though for the purpose of the flexural
strength testing phase of this study, a rectangular reinforced and prestressed section

3.2 Specimen Design Approach 13
was deemed satisfactory.
The test specimens failure in flexure was a design parameter required to be achieved,
therefore the force required to fail the beam in flexure was much less than the force
required to fail the beam in shear. Thus the shear capacity of the beam is larger
than the flexural capacity of the beam. The beams were designed as simply supported
beams. Also with the application of the external prestress and prestressing force, the
flexural capacity of the beam will increase, and thus the force required to fail the beam
will also.
Two loading points have been chosen to demonstrate the flexural capacity of the design
beams. A total of four test beams were chosen, where two control beams and two
prestressed beams were proposed. Thus a control and prestressed beam existed for
each loading position. Shown below are the bending moment diagram and shear force
diagram for the test beams under the designed point loading positions.
Figure 3.1: Loading Position Arrangement for Test Beams
Loading Position of the Test specimens A = 1 m
A = 0.5 m
As it can be deduced from Figure /reffig:Figure32, the maximum bending moment
which exists within the test specimens under the given loading positions exist mid-
span of the 3500 mm spanning beam.

3.2 Specimen Design Approach 14
Bending Moment Diagram at loading position, A = 1 m
Figure 3.2: Bending Moment Diagram at A = 1 m
Bending Moment at Loading position, A = 0.5 m
Figure 3.3: Bending Moment Diagram at A = 0.5 m
It can be seen from the bending moment diagram in Figure 3.2 and Figure 3.3 that the
maximum bending moment occurs at mid-span of the beam. As the flexural strength is
critical, it can be therefore seen that the mid section of the beam is the critical section.
This therefore is the section of the beam which is under the maximum moment and thus
the most consideration. It can be observed form the shear force diagram (Figure 3.4)
that the mid-span is not the section that is critical in shear, but rather the region from
the beams supports to the loading points, where the shear force, V = P/2.

3.3 Beam Specimen Design 15
Figure 3.4: Shear Force Diagram
This identified shear region therefore requires considerable observation when undertak-
ing the physical testing of the specimen, as to observe any shear cracks that may form,
when loaded in both loading positions. Shear failure is not an expected outcome, as
consideration has been taken in the design for the beam not to fail in shear.
The specimen design initiated with assumed dimensions, relevant to the resources avail-
able, including the materials and testing facilities. The beams were to be post-tensioned
beams with external unbonded high tensile threaded bars anchored at either end, with
the beam simply supported at 3000 mm. Once an initial estimate of the specimen
design was achieved, initial design calculations were undertaken to check all the design
criteria.
3.3 Beam Specimen Design
This section will describe the more detailed design of the beam section itself, where the
beam dimensions; reinforcing and prestress placement are shown.

3.3 Beam Specimen Design 16
3.3.1 Beam Dimensions
The 4 test beams were all rectangular reinforced sections, with external un-bonded
post-tensioned high tensile threaded bars. The simply supported beams span 3500
mm, with section dimension of 300 x 150 mm.
Figure 3.5 and Figure 3.6 are typical of all 4 beams and give the front and side view of
the specimens:
Figure 3.5: Front View of Design Specimen
Figure 3.6: Top View of Beam Specimen
Typical cross-section of the 4 beams specimens is shown below in figure‘3.6 :
It can be seen in Figure 3.7, that the depth of the section is 300 mm and the width
of the section is 150 mm, making the 300 x 150 mm typical cross-section. Also shown
in Figure 3.7 is the cover that was used in the concrete beams. The concrete cover
was found in accordance with AS 3600 to be 25 mm. A major design parameter or
limitation was that the test beams section dimensions had to be manageable with the
University Laboratory when preparing and testing the beams.

3.3 Beam Specimen Design 17
Figure 3.7: Typical Cross-Section of Beam Specimen
3.3.2 Steel Reinforcement
Steel reinforcement was used in the compression and tensile areas of the beam, including
shear reinforcement. All steel chosen to reinforce the tensile and compressive zones was
chosen to achieve the required shear and flexural strength set by the limitation of
the shear strength exceeding that of the flexural strength. Shear reinforcement was
therefore on the conservative side.
As seen in figure 3.4 the shear regions exist from the loading point to the supports
of the simply supported beams. The general spacing of the shear reinforcing was 200
mm, throughout the middle 2400 mm of the test specimens. Though to enable that the
shear reinforcement was sufficient in the regions depicted in the shear force diagram,
the shear ligature spacing was reduced to 100 mm within the last 400 mm of the beam,
as shown in Figure 3.8. The reduced spacing also reinforcing the concrete areas where
the prestressing bars anchoring plates reside, or where the compressive force from the
prestress is induced into the concrete. The close spacing of the stirrups at the ends
of the beams also helps the beam resist the axial force (induced to the beam in the

3.3 Beam Specimen Design 18
longitudinal direction). The shear ligatures were hand bent N-6 bars. The remainder
of the beam was designed using 200 mm spacing.
Figure 3.8: Shear Reinforcing Spacing
2 N-12 bars were chosen to be used in the top compression reinforcement, and 3 N- 12
bars were chosen to be used in the bottom tensile reinforcement.
The typical steel reinforcing layout can be shown below in Figure 3.9, which was typical
for all 4 beams, both prestressed beams and the control beams.
Figure 3.9: Typical Section Reinforcing

3.4 Control Condition Strength Capacity 19
At each end where the ferules were placed for the attachment of the anchorage plate,
short lengths of N-6 bars were also used.
No extra reinforcing was used in the reinforcing of the ends of the beams where the
force is applied; it was assumed that the close spacing of the ligatures in the last 400
mm of the beam would be sufficient.
3.4 Control Condition Strength Capacity
This section deals with the computations of the moment and shear capacity of the test
beams. All computations were carried out in accordance with AS 3600, the Australian
Standard for Concrete Structures. The calculations were carried out for the mid-span
section of the beam, as this is the critical area.
Calculation of the Moment Capacity of the control beams.
Figure 3.10: Mid-Span Section Flexural Analysis
Tensile Steel Area,
Ast = (3× 12mm diameter bars) = 3× 110 = 330 mm2
Compressive Steel Area,
Asc = (2× 12mmdiameterbars) = 2× 110 = 220mm2

3.4 Control Condition Strength Capacity 20
E = 200 000 MPa
For N 12 bars,
fsy = 500MPa
For N 6 bars,
fsy = 250MPa
Concrete Compressive Strength,
f c = 40MPa
b = 150 mm (beam width),
Cover = 25 mm, in accordance with AS 3600,
For the Ultimate Moment Capacity, clause 8.1.2.2, AS 3600.
Effective Depth,
d = 300− 25− 6− (12÷ 2)
= 263mm
Therefore to find γ,
γ = 0.85− 0.007× (f c − 28)
= 0.85− 0.007× (40− 28)
= 0.766
Neutral Axis depth,
dn = ku × d (3.1)
Where ku is the neutral axis parameter,
d is the effective depth of the section.
Therefore, the sections design compressive force shown in equation 3.2,
C = 0.85× f c × γ × b× dn (3.2)
(3.3)

3.4 Control Condition Strength Capacity 21
= 0.85× 40× 0.766× 150× ku × 263, where(dn = ku × d)
Therefore, the sections design tensile force can be shown in equation 3.4,
T = Ast × fsy (3.4)
= 330× 500
To achieve equilibrium of the internal forces within the section,
CompressiveForce(Equation 3.2) = TensileForce(Equation 3.4)
0.85× 40× 0.766× 150× ku × 263 = 330× 500
Rearrange equation 3.1 for the calculation of the neutral axis parameter ku
ku = 0.16
Therefore the neutral axis depth,
dn = 0.16× 263
dn = 42.2mm
Strain diagram of the internal strains within the section
From the above strain diagram, Figure 3.11 it can be seen through similar triangles the
strain in the tensile steel reinforcing,
Therefore to calculate the strain in the tensile steel εs
εc/42.2 = εs/220.8
εs = (0.003/42.2)× 220.8
εs = 0.0156

3.4 Control Condition Strength Capacity 22
Figure 3.11: Strain Diagram
Therefore as,
εs = 0.0156 > 0.002,
Thefore it can be seen that the tensile steel has yielded as εs > 0.002. It can also be
noted that the tensile steel has yielded from the balanced section formula techniques
when ku < 0.4. Therefore the under reinforced section of the control beams will undergo
a ductile failure.
Therefore to calculate the ultimate moment capacity for the non-prestressed section or
the control beams condition (Equation 3.5):
Mu = fsy ×Ast × d× (1− 0.5× γ ×Ku) (3.5)
= 500× 330× 263× (1− 0.5× 0.766× 0.16)
= 40.7kN.m
Therefore it can be seen that the ultimate bending capacity of the control beam sections
is 40.7 kN.m.
Also to calculate the force required to induce the above moment and in-fact fail the
control beams in bending is calculated and shown below:
3.4 Control Condition Strength Capacity 23
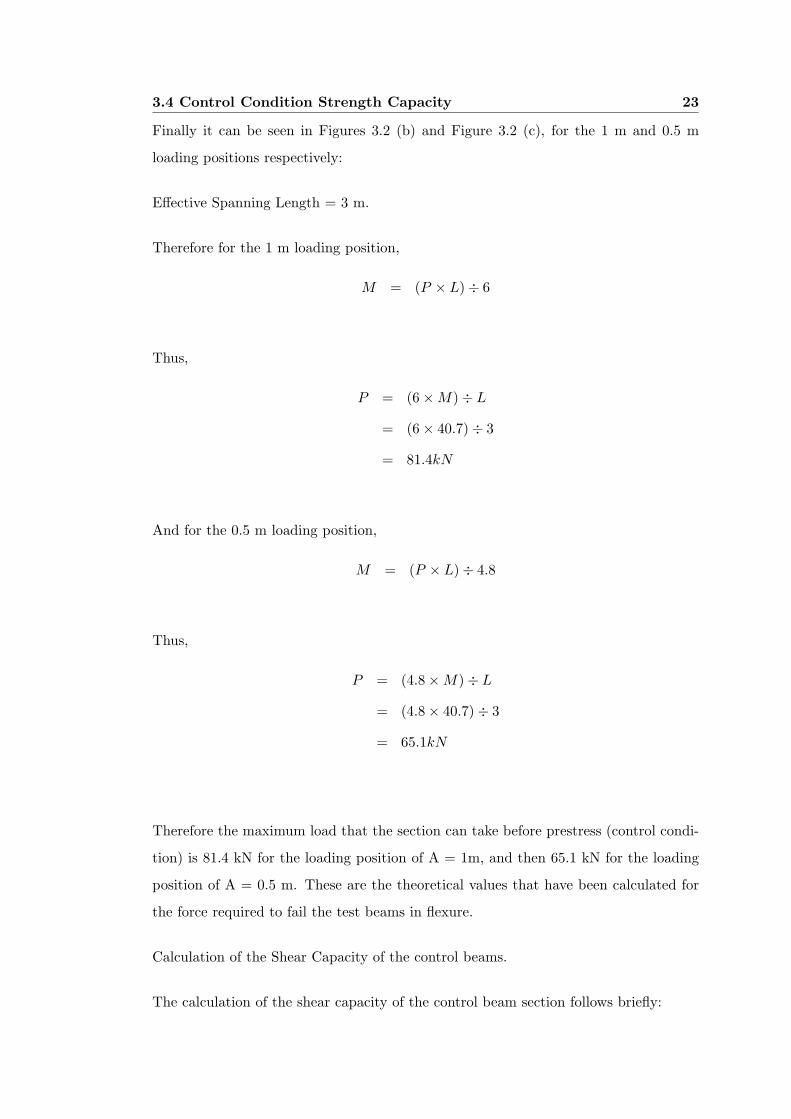
Finally it can be seen in Figures 3.2 (b) and Figure 3.2 (c), for the 1 m and 0.5 m
loading positions respectively:
Effective Spanning Length = 3 m.
Therefore for the 1 m loading position,
M = (P × L)÷ 6
Thus,
P = (6×M)÷ L
= (6× 40.7)÷ 3
= 81.4kN
And for the 0.5 m loading position,
M = (P × L)÷ 4.8
Thus,
P = (4.8×M)÷ L
= (4.8× 40.7)÷ 3
= 65.1kN
Therefore the maximum load that the section can take before prestress (control condi-
tion) is 81.4 kN for the loading position of A = 1m, and then 65.1 kN for the loading
position of A = 0.5 m. These are the theoretical values that have been calculated for
the force required to fail the test beams in flexure.
Calculation of the Shear Capacity of the control beams.
The calculation of the shear capacity of the control beam section follows briefly:
3.4 Control Condition Strength Capacity 24
Tensile steel area,
Ast = (3× 12mmbars) = 3× 110 = 330mm2
Compressive steel area,
Asc = (2× 12mmbars) = 2× 110 = 220mm2
Shear ligatures reinforcing steel,
Asv = (2× 6mmbars) = 2× 28 = 56.5mm2
For N 12 bars,
fsy = 500MPa
For N 6 bars,
fsy = 250MPa
Therefore the compresssion strength of the concrete,
f c = 40MPa
b = 150 mm (beam width),
Cover = 25 mm, in accordance with AS 3600,
For the Ultimate Shear Capacity, clause 8.2.7.1 and clause 8.2.10 from AS 3600.
Assumed that,
β3 = β3 = 1
Shear ligature spacing of 200 mm were used. The spacing of the steel ligatures is as low
as 100 mm near the ends of the beams, but for the sake of the general shear strength

3.4 Control Condition Strength Capacity 25
of the shearing area from beam supports to the point loading positions, the worst case
of 200 mm spacing will be used.
The shear capacity formula used from AS3600 is of the form shown below (Equa-
tion 3.6), where the shear capacity is made up of the shear capacity of the concrete and
the shear capacity for the shear reinforcement.
Vu = Vus + Vuc (3.6)
Therefore, the shear capacity of the concrete is given in equation 3.7 below:
Vuc = β1× β2× β3× bv × do((Ast × f ′c)÷ (bv × do))1÷3 (3.7)
This function shows the calculation of the factor β1,
β1 = 1.1× (1.6− do)÷ 1000 = 1.1× (1.6− 263)÷ 1000 = 1.47
Hence substituting Equation 3.8 into equation 3.7,
Vuc = β1× β2× β3× bv × do((Ast × f ′c)÷ (bv × do))1÷3
= 1.47× 1× 1× 150× 263× ((220× 40)÷ (150× 263))1÷3
= 40.3kN
Shown below is Equation 3.8 that AS3600 has adopted for the accessing of the shear
capacity of the steel shear reinforcement:
Vus = ((Asv × fsy × do)÷ s)× cotφv (3.8)
= ((56.5× 250× 263)÷ 200)× cotφv(whereφv = 45)
= 22.7kN

3.5 Prestress Design 26
Therefore by inputting the results from Equations 3.7 and 3.8 into equation 3.6, the
shear strength of the reinforced section can be calculated
V u = V us + V uc
= 22.7 + 40.3
= 63kN
The strength prediction equations of AS 3600 predict that given the section of concrete
and the steel reinforcement of the design section, the beam will fail in shear with a
total shearing force of 63 kN.
Hence, the force required to therefore fail the beam in shear, given the two loading
points.
As can be seen in Figure ??, the shear force is V = P / 2, thus as the shear force V is
known, the force P can be found.
V = P/2
Hence,
P = 2× V
= 2× 63
= 126kN
Thus the force required to fail the beam in shear is 126 kN. As stated this force is
greater than the 60 -82 kN force to fail the beam in flexure.
3.5 Prestress Design
The prestress design that was chosen for this test was the typical style post-tensioning
external bars. These bars exist with no eccentricity and the eccentricity that does
occur due to second order effects for this project was neglected. The Prestress tendon
chosen for this design was a 23 mm (nominal diameter) high tensile threaded steel bar.

3.5 Prestress Design 27
Two bars for each prestressed beam were used, where these bars were at set positions
and the eccentricity of the 2nd order effects caused as the beam deflects were assumed
negligible. The prestressing area of the two bars was 415 mm2 and carried a designed
prestress of 80 kN each, for a total prestressing force of 160 kN. The bars were set to the
ends of the concrete beams via two steel anchoring plates that for the sake of the tests
were sufficient. Through attaching these plates with cast in ferrules, the prestressing
bars were held 100 mm from the base of the beam. This enabled that he bars existed
in the middle 2/3 of the beam. Also, these plates were available and were used with
other students, making them more attractive for the tests. These methods listed below
assume that the steel has yielded and will result in the stresses within the external
tendons under the prestressing action. The equation used for predicting the flexural
strength of the prestressed beams was a equation used on un-cracked sections. Though
the beams in this project will in-fact be initially cracked, to achieve the “in-service”
state of a overloaded or aged flexural member. The equation is still applied throughout
the project as after the prestress has been applied, it is assumed that the prestressing
forces magnitude is great enough to close all cracks and therefore the section will again
act as a “new section”. These assumptions will be confirmed later in the research,
where the percentage of flexural increase will occur only if this has been achieved.
The general form of the ultimate stresses in unbonded tendons can be expressed as
follows:
fps = fpe + ∆fps
Where fps is the ultimate stress in the prestress tendons, fpe is the effective initial
prestress in the tendons and ∆fps is the increment of stress in the prestress tendon.
For a member with a span to depth ratio of up to 35, AS 3600 clause 8.1.6 uses the
following equation to calculate the stress in the unbonded tendon:
εpu = εp.ef + 70 + (f ′c × bef × dp)÷ (100×Apt) (3.9)
Where εpu is the ultimate stress in the prestressing tendon, εp.ef is the initial effective
stress,Apt is the area of prestressing steel which is in tension, which in the case of this
project is generally equal to Ap.
3.5 Prestress Design 28
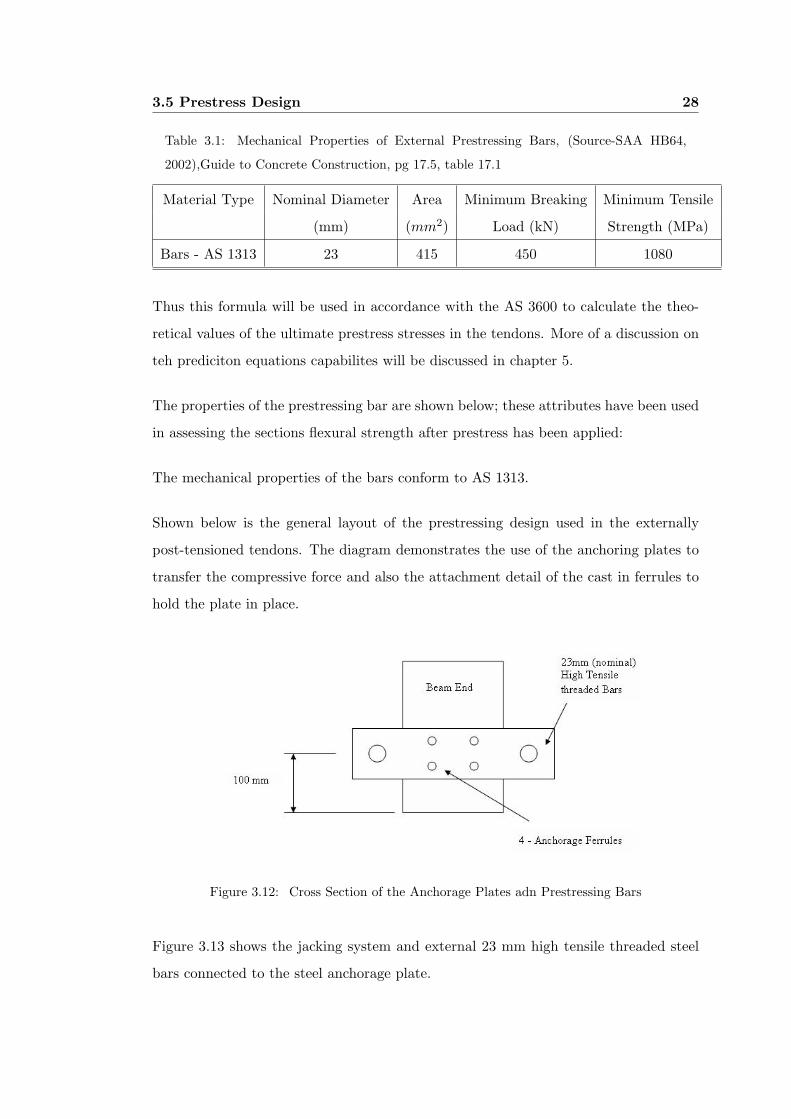
Table 3.1: Mechanical Properties of External Prestressing Bars, (Source-SAA HB64,
2002),Guide to Concrete Construction, pg 17.5, table 17.1
Material Type Nominal Diameter Area Minimum Breaking Minimum Tensile
(mm) (mm2) Load (kN) Strength (MPa)
Bars - AS 1313 23 415 450 1080
Thus this formula will be used in accordance with the AS 3600 to calculate the theo-
retical values of the ultimate prestress stresses in the tendons. More of a discussion on
teh prediciton equations capabilites will be discussed in chapter 5.
The properties of the prestressing bar are shown below; these attributes have been used
in assessing the sections flexural strength after prestress has been applied:
The mechanical properties of the bars conform to AS 1313.
Shown below is the general layout of the prestressing design used in the externally
post-tensioned tendons. The diagram demonstrates the use of the anchoring plates to
transfer the compressive force and also the attachment detail of the cast in ferrules to
hold the plate in place.
Figure 3.12: Cross Section of the Anchorage Plates adn Prestressing Bars
Figure 3.13 shows the jacking system and external 23 mm high tensile threaded steel
bars connected to the steel anchorage plate.

3.6 Prestressed Strength Capacity 29
Figure 3.13: Prestress Anchorage and Jacking System
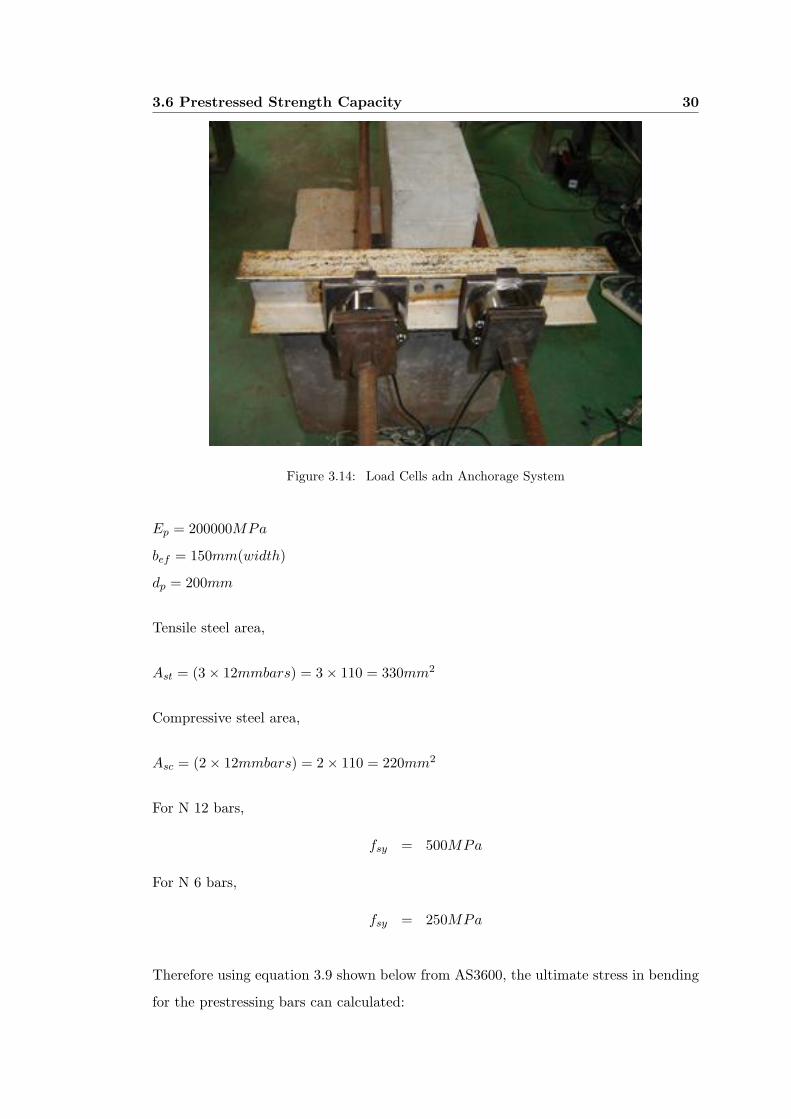
Figure 3.14 demonstrates the opposing end of the picture above. This end houses a
similar anchorage plate, but also in place are some load cells which return to the system
5000 the measured prestressing load in the two external bars.
3.6 Prestressed Strength Capacity
The calculation of the maximum flexural capacity for the prestressed sections shown
above in figure, are shown below.
Prestressing steel area,
Apt = (2× 23mmbars) = 415mm2
Therefore for the prestressing bars,
fpy = 1080MPa
Concretes compressive strength,
f c = 40MPa
3.6 Prestressed Strength Capacity 30
Figure 3.14: Load Cells adn Anchorage System
Ep = 200000MPa
bef = 150mm(width)
dp = 200mm
Tensile steel area,
Ast = (3× 12mmbars) = 3× 110 = 330mm2
Compressive steel area,
Asc = (2× 12mmbars) = 2× 110 = 220mm2
For N 12 bars,
fsy = 500MPa
For N 6 bars,
fsy = 250MPa
Therefore using equation 3.9 shown below from AS3600, the ultimate stress in bending
for the prestressing bars can calculated:
3.6 Prestressed Strength Capacity 31
Hence, with the newly calculated stress within the external tendon from equation 3.9,
the relative forces within the tendons (Tp) can be calculated. This involves a simple
calculation where the force within the tendons is equal to the stress in the tendons
multiplied by the cross-sectional area of the tendons. The force in the compression
reinforcement and the force in the tensile reinforcement have both been assumed to
have yielded are calculated as shown below in equations 3.10 and 3.11.
The tensile and compression reinforcement have been assumed to have yielded and are
calculated as shown:
Fst = Ast × fsy (3.10)
Fsc = Asc × fsy (3.11)
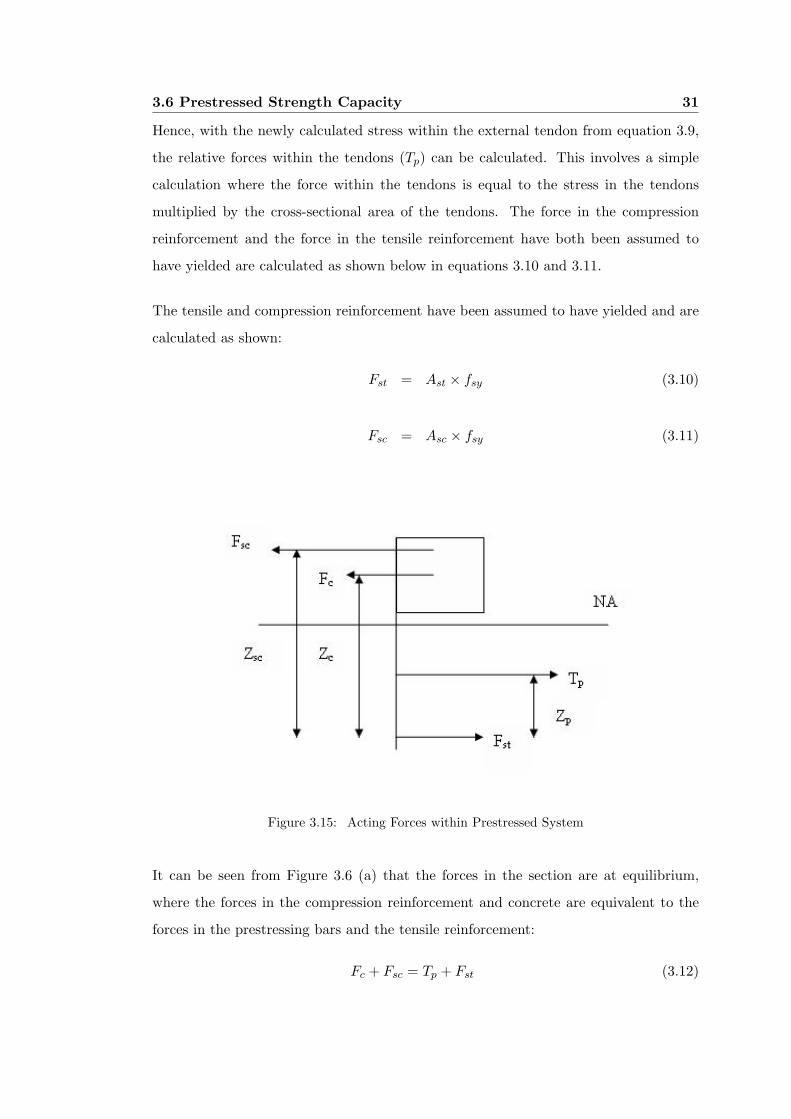
Figure 3.15: Acting Forces within Prestressed System
It can be seen from Figure 3.6 (a) that the forces in the section are at equilibrium,
where the forces in the compression reinforcement and concrete are equivalent to the
forces in the prestressing bars and the tensile reinforcement:
Fc + Fsc = Tp + Fst (3.12)

3.6 Prestressed Strength Capacity 32
Therefore by rearranging equation 3.12, the force in the concrete can be found:
Fc = Tp + Fst − Fsc
Hence, with the force in the concrete calculated the relative neutral axis depth can be
calculated for the section after prestress using equation 3.13.
x = Fc ÷ (0.85× f ′c × b× γ) (3.13)
Given the neutral axis depth on the section from equation 3.13, all the relevant lever
arms can be calculated for the forces acting on the section, shown in Figure 3.6 (a).
With all the above information from equation 3.12 and 3.13, it is possible to calculate
the new moment capacity for the section after the application of the prestressing force
equation 3.14:
Mu = Tp × Zp + Tst × Zst + Fc × Zc + Fsc × Zsc (3.14)
Then with the ultimate moment capacity (Mu), found in equation 3.14, the force then
required to fail the prestressed beam in flexure can be calculated. The force required to
induce the calculated moment is found in the same fashion as discussed in the earlier
force calculations for the control beams moments in section 3.4 of chapter 3.
The theoretical predicted ultimate strength values can be shown below for both the
prestressed sections. The strengths for A = 1m and A = 0.5 m are shown after the
application for the 160 kN prestress.
A = 1m, Force required to fail the beam in flexure = 134 kN
A = 0.5 m, Force required to fail the beam in flexure = 107 kN

Chapter 4
Experimental Methodology
4.1 Introduction
The experimentation of the concrete was carried out to model simply supported con-
crete flexural members that exist in service. The implementation of this testing was
carried out with the loading positions and specimens that have been discussed prior to
this chapter. The experimental methodology and preparation adopted for the flexural
testing of the concrete beam specimens is described in this chapter.
This chapter will describe the preparation and groundwork that was carried out in the
project. The chapter will describe the creation of the reinforcing cages, the formwork
used, the pouring of the concrete and will continue to discuss all the instruments used
in the testing phase of the experiments. Also the experimentation procedure, and beam
setup will be discussed.
The experimental phase of this project required the use of large equipment, loads and
deflections, which demands safety restrictions. Extra care and precautions were taken
in the prestressing and de-stressing of the external tendons.
4.2 Experimental Procedure and Variables 34
4.2 Experimental Procedure and Variables
As two loading position of A = 1m and A = 0.5m were being analysed for the test spec-
imens a total of four beams were required. The beams had a rectangular cross section
that remained consistent throughout all specimens. The prestressing depth remained
constant over both tests. No eccentricity of the prestressing bars was analysed (No
second order effects). The tests were carried out with the aim of achieving compara-
tive result, where the specimens ultimate flexural capacity could be compared under
the same prestressing condition, with variable loading positions. The positions were
chosen to induce variation in cracking and deflection. Given the results of the tests a
conclusion on the necessity of crack repair methods can be achieved, along with the
effectiveness of this style of prestressing on flexural member under similar loading con-
ditions. These results should give us a good indication of how the beam will act under
a variety of loading conditions given a certain prestressing force.
The four beam specimens were a total length of 3500 mm with an effective span of 3000
mm. The beam sections were 300 x 150 mm rectangular sections. Loading positions
of A = 1m and A = 0.5 m were the chosen spans between the two loading points. For
the first test of A = 1m a I beam section cross beam was used, and for the second test
of 0.5 m, a rectangular cross beam was used.
For the 1st and 2nd beams the loading position of 1m will be used. Beam 1 is the control
beam and Beam 2 is the prestressing beam for the position of A = 1m. Therefore leaving
Beam 3 to be the control beam and Beam 4 to be the prestressed beam for A = 0.5m.
Beam 1 was loaded initially without prestress. As the test was being carried out all
information was being sent to the System 5000 situated in the labs. The first beam
was loaded in increments of about 0.2 mm / sec. The loading was continued until
initial cracking of the beam occurred. At this point, the load was recorded, cracks were
marked and noted. From initial cracking on the control beam, it was then observed
until failure of the cracking patterns that were forming and crack widths were also
noted. The control beam was then loaded to failure and removed.
Beam 2 was therefore the prestressed beam for A = 1m. Beam 2 was then loaded in

4.3 Formwork Construction and Details 35
the exact manner as Beam 1, and loaded un-prestressed to the initial cracking load.
At this point the load was removed from the beam and the residual deflection noted,
with the cracks that formed. At this stage the prestressing apparatus is then applied,
achieving 80 kN prestress in each cell making a total of 160 kN initial prestress. With
the prestress applied, crack patterns were noted. With the anchorage plates, load
cells and prestressing bars all connected to the beam, the load was then re-applied.
From this stage the beam was again loaded until failure with all loads, deflections and
observations being recorded.
The above procedure was then repeated for the 2nd loading position of A = 0.5m, for
Beam 3 and Beam 4. This required the changing of the cross beam attached to the
large hydraulic ram.
4.3 Formwork Construction and Details
The formwork required for this project consisted of light pine and ply-wood panels.
Given the limited resources and laboratory space, the formwork was created with all
four beams able to be formed in a single pour and housed within one set of formwork.
This was efficient and was used for other students tests which were carried out. The
form was constructed in the University of Southern Queensland Z101 workshop by
a qualified carpenter. All measurements were given in detailed drawing and double
checked as to meet the specimen design specifications.
The specifications that were required of the formwork to effectively house the beam
specimens are listed below:
• The formwork was required to be strong enough to withstand the lateral loads and
pressures caused from the beams during pouring, but more importantly during
the removing of the beams.
• The formwork was strong enough to withstand the dead and live loads induced
during the concreting process, from pouring to the fully set beams.
• Formwork durable and rigid enough for re-use.

4.3 Formwork Construction and Details 36
• Formwork can be easily assembled and dismantled for the requirements of other
students and moving the formwork around.
• Floor is stiff enough to prevent any sagging.
• Braces were enough to hold the dividing panels in there required positions during
the pour, where when the bays were over half filled, the braces could be removed.
• Formwork was cheap and economical for construction and maintenance.
• At either end of the bays for each beam was a template made end piece that
housed the ferrules during the poor. This piece was designed to place the 4
ferrules that will later attach the anchorage plate.
The formwork that was constructed was made from 12 mm ply-wood panels. The ply-
wood was used for the floor, dividing panels and general boarding of vertical barriers
separating the beams. The general frame and bracing of the formwork was constructed
from pine joists and bearers as shown in Figure 4.1 below. Also the horizontal pine
beams support the dividing panels was achieved by 3 pine pieces with supports at
intervals to maintain the beam depth.
Figure 4.1: Section View of the Beams Formwork
All joints within the concrete pouring area of the formwork were filled with silicon, as
to prevent the concrete from filtering between the dedicated bays. This was also used
to prevent the filtering of water from the beams during the time within the formwork.
Before the pouring of the concrete, all panels that were to come into contact with the

4.4 Steel Reinforcement Details 37
Figure 4.2: Completed Formwork
Figure 4.3: Completed Formwork
concrete were covered in grease to prevent the concrete adhering to the surface of the
panels for ease of removal. The formwork was constructed in such a way that with the
side bracing removed; the beams could be accessed and removed from a single side.
That way the weight of the beams themselves could act against the suction formed
when removing the beams.
4.4 Steel Reinforcement Details
The preparation of the steel reinforcement cages of the test beams was again undertaken
in the USQ Z101 laboratory. The laboratories proved most sufficient for the purposes
of this project. Some of the major tasks that were undertaken in the preparation of
the steel reinforcing cages can be seen below:
• Tension and Compressive, N12 steel reinforcement cut to the required length.

4.4 Steel Reinforcement Details 38
• The cutting and bending of the N6 shear reinforcement ligatures.
• The tying of the shear ligatures at the required spacing to the compressive and
tension reinforcement to create the required section.
• The cutting bending and attachment of the lifting points.
• Placement of the ferrules reinforcement.
• Surface preparation to the steel reinforcement where strain gauges were to be
placed, involving the use of a grinder, file and emery paper.
The length of the compression and tensile reinforcement remained consistent through-
out all the four beams. The steel was cut to 3460 mm, where 20 mm cover was left on
each of the bars to the end of the beam. The shear ligatures were all bent by hand on
a custom made jig (Figure 4.4) to maintain the 25 mm cover and fit the section. The
completed reinforcing cages were all tied by hand.
A total of 21 shear ligatures were required for each individual reinforcing cage, therefore
for the 4 beam specimens, a total of 84 shear reinforcing ligatures were required. The
spacing for the shear ligatures can be seen from section 3.3.2.
The reinforcing cages were constructed by hanging the top flexural reinforcement on a
wooden stand that was clamped to a desk. The shear ligatures were slid into positions
and put in there general spacing which was marked along the flexural reinforcement
with a marker. The shear reinforcement was then tied to the flexural reinforcement.
The bottom flexural reinforcement was then slid into the shear ligatures and positioned
correctly. Then maintaining a square cage, the remaining ties were tied to complete the
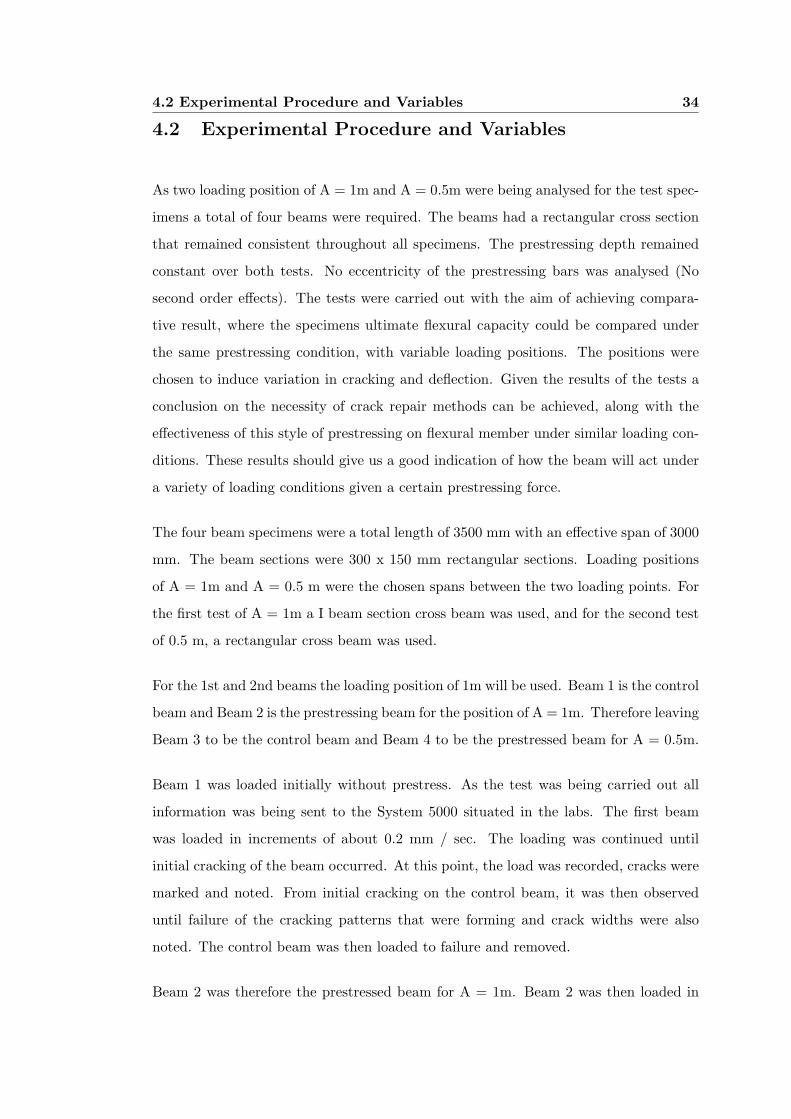
reinforcing cage. Once the cages were completed (Figure 4.5), the lifting hooks were
then tied into the shear ligatures on the underside of the reinforcing cage. The lifting
points were designed at specific locations so that when the beams were lifted from the
formwork and transported no failure or induced cracking occurred. These locations
existed 750 mm from either end of the beams, and 2000 mm between them.
The completed reinforcing cages with the lifting hooks and all strain gauges attached
were then lifted and placed within the completed formwork. Here the cages were set in

4.4 Steel Reinforcement Details 39
Figure 4.4: Custom Jig
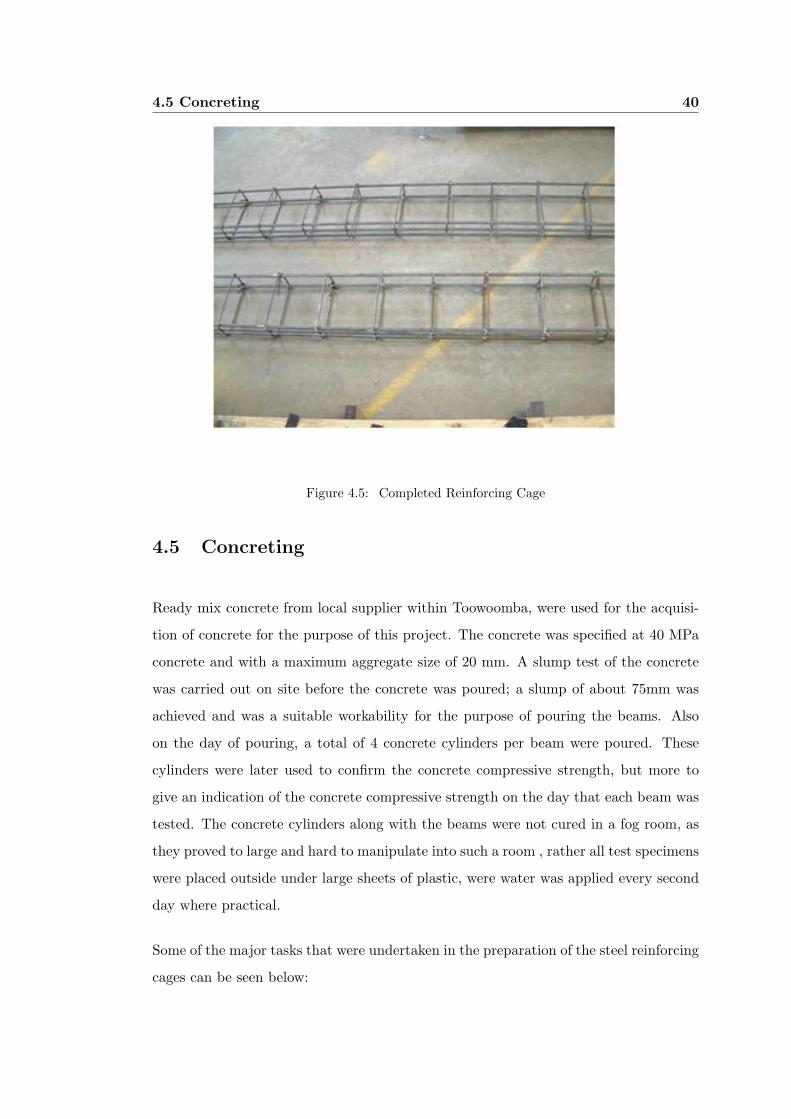
position with reinforcing chairs at the required cover of 25 mm. The chairs were placed
on either side and underneath the reinforcement to maintain the cover as the concrete
was poured and compacted. As shown in Figure 4.6 the cages have been placed within
the formwork, and all reinforcing chairs placed. It can also be seen that the strain
gauges were placed in plastic bags to protect them throughout the pouring and curing
of the concrete.
As seen in Figure 4.6 the chairs can be seen on the sides and beneath the reinforcing
cages to maintain cover of the concrete over the reinforcement.
4.5 Concreting 40
Figure 4.5: Completed Reinforcing Cage
4.5 Concreting
Ready mix concrete from local supplier within Toowoomba, were used for the acquisi-
tion of concrete for the purpose of this project. The concrete was specified at 40 MPa
concrete and with a maximum aggregate size of 20 mm. A slump test of the concrete
was carried out on site before the concrete was poured; a slump of about 75mm was
achieved and was a suitable workability for the purpose of pouring the beams. Also
on the day of pouring, a total of 4 concrete cylinders per beam were poured. These
cylinders were later used to confirm the concrete compressive strength, but more to
give an indication of the concrete compressive strength on the day that each beam was
tested. The concrete cylinders along with the beams were not cured in a fog room, as
they proved to large and hard to manipulate into such a room , rather all test specimens
were placed outside under large sheets of plastic, were water was applied every second
day where practical.
Some of the major tasks that were undertaken in the preparation of the steel reinforcing
cages can be seen below:
4.5 Concreting 41
Figure 4.6: Steel Reinforcing Chairs
• During concrete pouring all strain gauges were bagged and sealed as to not be
damaged.
• All formwork was greased prior to pour.
• All concrete works were done immediately before the concrete set.
• The pine separators used to maintain the concrete beam depths was checked to
be firmly secure as to not move during the pour.
• All chairs and reinforcement positions were checked.
• The concrete was compacted using a machine operated vibrating machine. This
machine enabled that the required compaction was achieved, and no voids were
left in the beams which could impede the beams strength or create areas where
stress concentrations may form.
• All works were carried out under supervision and safely equipment was used.
As shown in Figure 4.7 above, the concrete was hand finished and cast level to the top
of the formwork. Again you can see the strain gauges housed within the plastic bags.

4.5 Concreting 42
Figure 4.7: Completed Cast Concrete
These photos demonstrate how the beams reside in the formwork, where they all lay
on the deepest part of the section base to base. When removing the beams, the side
bracing was removed and each beam was taken by a forklift from the one side. As a
beam is being removed the self weight of the other beams acts as a dead weight.
As can be seen in Figure 4.8 the concreting required the concrete moulds to be filled.
All moulds were greased heavily for ease of removal. Four cylinders were used for
each beam. As also can be see, the large cylinders were used for an indirect tensile
test, where one cylinder existed for each beam. The smaller cylinders used for the
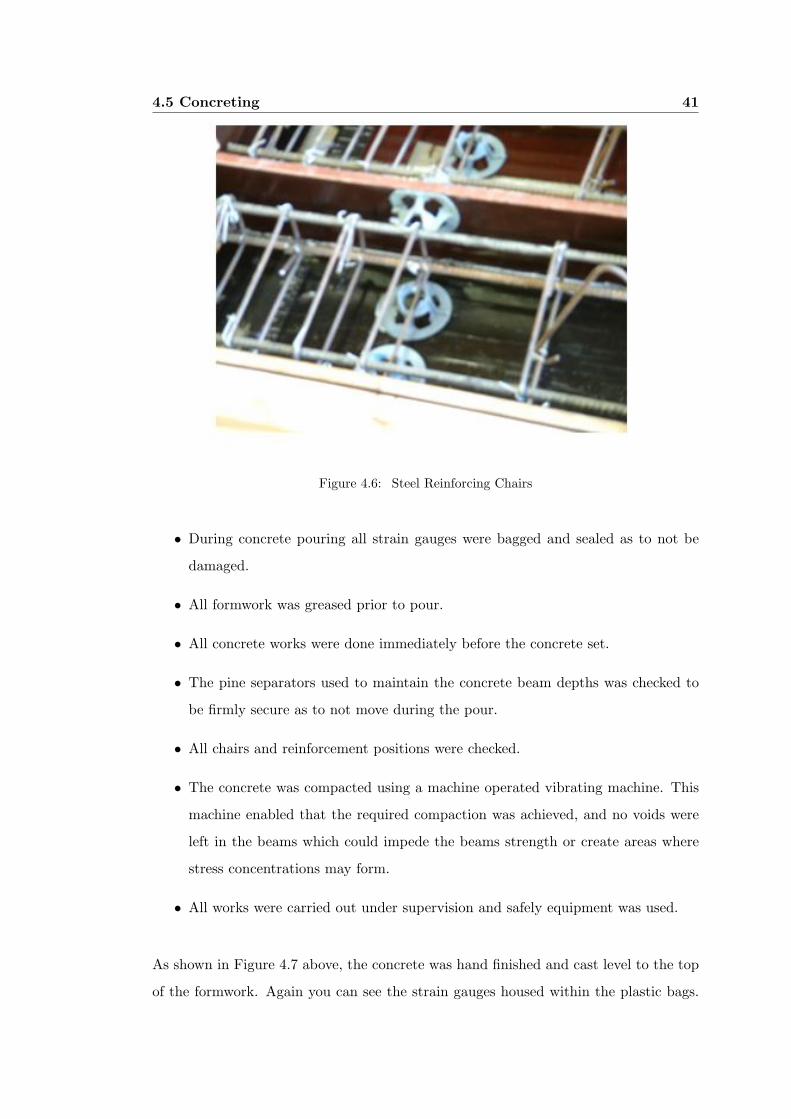
compression testing of the concrete were 100 mm in diameter and 200 mm high. The
larger cylinders were 150 mm in diameter and 300 mm high. The smaller cylinders were
cured exactly the same as the larger beams and on the day of testing, a compression
test was carried out using the Avery Testing Machine at Engineering Z101 laboratory
(shown in Figure 4.9). All safely precautions and skilled operators were present in the
testing of these cylinders.

4.6 Instrumentation 43
Figure 4.8: Coompression Testing Cylinder Moulds
4.6 Instrumentation
All instrumentation involved in this project was dedicated to the measuring of:
• Strain in internal steel
• Strain in the external concrete
• Deflections
• Load
• Load in external prestressing tendons
• Crack widths
Therefore the major instrumentation involved the placement of:
• 2 mm strain gauges on the internal steel reinforcement
• 30 mm strain gauges on the external concrete
4.6 Instrumentation 44
Figure 4.9: Compression Testing of the Concrete Cylinders in the Avery Machine
• Load Cells
• Linear Variable Displacement Transducer (LVDT)
The strain gauge data sheets have been included in Appendix B for specific details
entailing to there specifications.
Shown below in Figure 4.10 is the testing system used for all experimental testing in
this project.
4.6.1 Strain Gauge placement
The placement of the 2 mm strain gauges on the steel reinforcement was briefly dis-
cussed in section 4.4. The strain gauges were placed on the internal steel reinforcing
cage in the early stages of the specimen preparation. Each reinforcing cage required the
placement of 5 x 2 mm strain gauges. Three strain gauges were placed on the flexural
steel reinforcement and two strain gauges were placed on the shear reinforcement. The
flexural steel strain gauges were placed at mid-span, as this is the critical section of

4.6 Instrumentation 45
Figure 4.10: Testing System including Prestressing and the System 5000
the flexural stresses. Of the three strain gauges, two were placed on the tensile rein-
forcement and a single gauge was placed on the compression reinforcement. The strain
gauge that was placed on the shear reinforcement was placed on the shear ligature that
resided 800 mm from mid-span, in both directions. This strain gauge was placed in
the area where the shear was critical, as the shear cracks and thus the largest shear
force acts from the supports a distance D, equal to the depth of the beam up to the
point of contact with the point load. All strain gauges that were placed on the steel
reinforcement were placed on a prepared surface that had been ground flat and cleaned
using acetone. Wax and waterproof tape were then applied to the strain gauges to seal
them from coming in contact with the water that resides within the concrete which
could cause a short circuit.
As can be seen in Figure 4.11, the 3 strain gauges placed on the flexural steel were
labelled TF for the top flexural reinforcement, and then BF1 and BF2 respectively for
the outside bottom flexural reinforcement.
The external concrete strain gauges were placed at mid-span of the concrete beam.
Five 30 mm strain gauges were used. Two gauges were placed on the top side of the

4.6 Instrumentation 46
Figure 4.11: Labelling of the Flexural Steel Strain Gauge
concrete beams surface and then three were placed running vertically positioned about
a third of the depth between them. The concrete strain gauges were required to bond
with the concrete, to achieve this, the following process was undertaken:
• Cleaning of the surface area with a steel brush.
• Sanding the area with sand paper
• Cleaning the concrete area with acetone.
• Application of a polyester adhesive (bonds the strain gauge, with no effect from
moisture , temperature or voids)
• The adhesive was given a day to dry and harden.
• The strain gauge was then applied to the prepared region.
As shown in Figure ?? the 30 mm strain gauges are situated in the central region of
the surface prepared with the adhesive in the process described above.
All strain gauges were tested using a multimeter (Figure 4.12) to check if the bond had
been achieved correctly before continuing with the testing. Shown below in Figure 4.14
is the numbering and general placement of the concrete 30 mm strain gauges.

4.6 Instrumentation 47
Figure 4.12: Application of Shear Reinforcement Strain Gauges
4.6.2 Linear Variable Displacement Transducer (LVDT) Placement
The LVDT was placed at the mid-span of the test beams, as this is where the maximum
deflection will occur. The LVDT will measure and feed back to the system 5000 the
vertical displacement or deformation of the concrete beam under loading. As can be
seen in Figure 4.15 a small steel plate was attached to the underside of the concrete
beam. The LVDT then rested on the top surface of the plate, which is equivalent to
he bottom surface of the concrete beam. As the beam deflects the LVDTs rod will
displace and the measurement is recorded in mm in the computer.
4.6.3 Load Cells and Anchorage Apparatus
The load cells were required in the testing phase to measure the axial force within
the external prestressing bars. The cells were required to achieve the required initial
prestress as the hydraulic jack induced the compressive force in the rods. Also the
cells were required throughout the testing to monitor the axial load in the prestressing
tendons as the beam underwent loading and deflected.
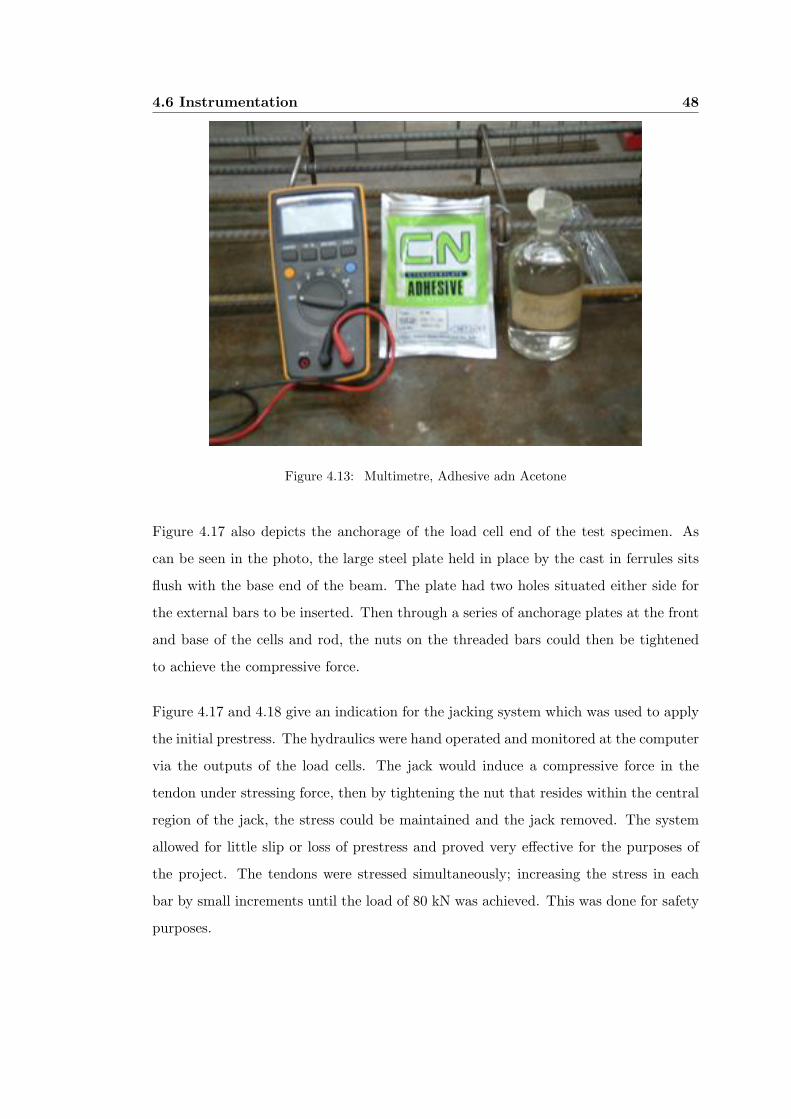
4.6 Instrumentation 48
Figure 4.13: Multimetre, Adhesive adn Acetone
Figure 4.17 also depicts the anchorage of the load cell end of the test specimen. As
can be seen in the photo, the large steel plate held in place by the cast in ferrules sits
flush with the base end of the beam. The plate had two holes situated either side for
the external bars to be inserted. Then through a series of anchorage plates at the front
and base of the cells and rod, the nuts on the threaded bars could then be tightened
to achieve the compressive force.
Figure 4.17 and 4.18 give an indication for the jacking system which was used to apply
the initial prestress. The hydraulics were hand operated and monitored at the computer
via the outputs of the load cells. The jack would induce a compressive force in the
tendon under stressing force, then by tightening the nut that resides within the central
region of the jack, the stress could be maintained and the jack removed. The system
allowed for little slip or loss of prestress and proved very effective for the purposes of
the project. The tendons were stressed simultaneously; increasing the stress in each
bar by small increments until the load of 80 kN was achieved. This was done for safety
purposes.

4.6 Instrumentation 49
Figure 4.14: Top Concrete Strain Gauges
Figure 4.15: System 5000 Strain Gauge Data Lines
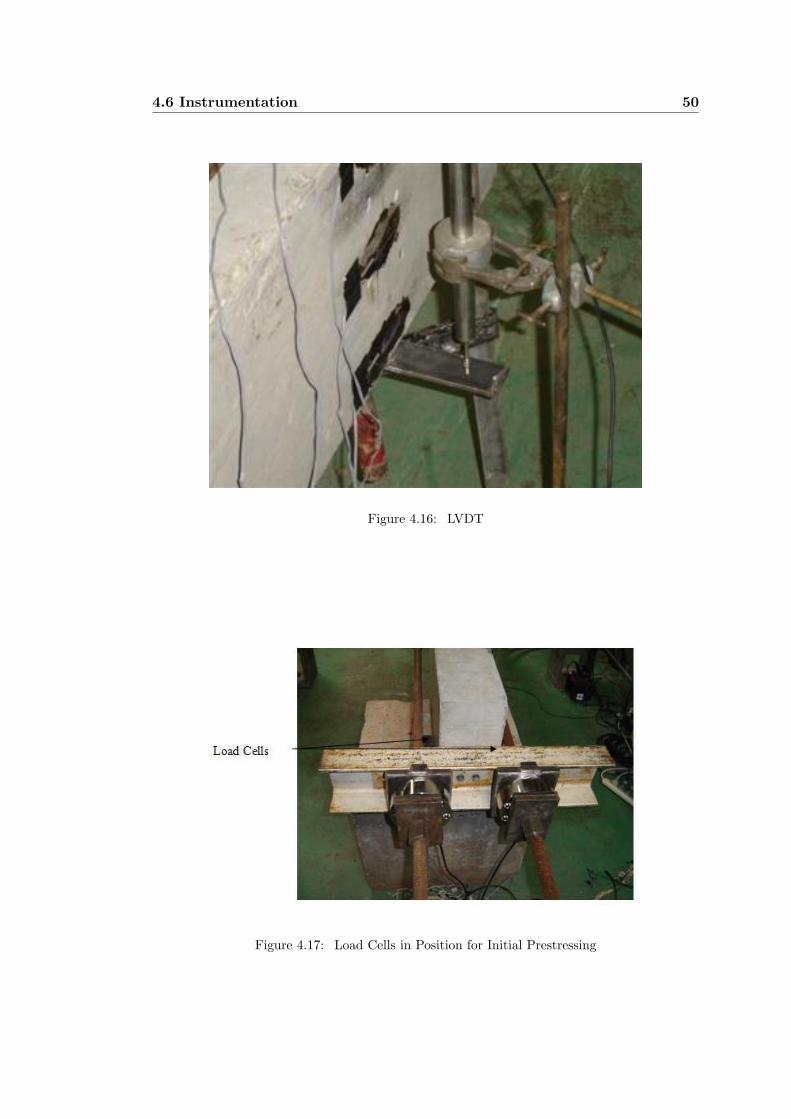
4.6 Instrumentation 50
Figure 4.16: LVDT
Figure 4.17: Load Cells in Position for Initial Prestressing

4.6 Instrumentation 51
Figure 4.18: Hydraulic Jack and Prestressing Apparatus
Chapter 5
Results and Discussion
5.1 Introduction
This chapter will discuss the results that were obtained through the testing or exper-
imental phases of the project. This chapter will also include a section that analysis
the theoretical predictions with the actual experimental results. A discussion on the
experimental outcomes in relation to real life in service applications will be undertaken.
The results will include all experimental results obtained in the following tests:
• Compression testing of concrete cylinders
• Flexural testing of control beam
• Flexural testing of the prestressed beam
Four main sets of results exist for the flexural testing. Two sets of data for the control
beam at A = 1 m and A= 0.5 m and then another two sets for the prestressed beams
at A = 1 m and A = 0.5 m.
Initially the chapter will discuss the compression testing results, resulting in the design
specimens compression strength. The results obtained through the physical testing of
the control beams will be discussed first. These results support the flexural strength

5.1 Introduction 53
Table 5.1: Strain Gauge Labels and Relevant System 5000 Inpout Lines
Strain Gauge System 5000 Data Line
1 (concrete) 31
2 (concrete) 32
3(concrete) 33
4 (concrete) 34
5 (concrete) 35
S1 (steel) 36
BF1 (steel) 37
TF (steel) 38
S2 (steel) 39
BF2 (steel) 40
of the concrete section under the defined loading positions. The results for the two
prestressed beams will follow, where the flexural strength of the prestressed beams will
be discussed. Following these two sections the loading position and theoretical versus
experimental results sections will also be introduced. This chapter will also discuss the
increase in prestressing force and look at some of the strains within the concrete.
The testing data that was recorded by the system 5000, including all strain and forces
applied to the beams have been included in Appendix C. These are the data sets as
outputted form the system 5000 system. The strain gauge readings, load cells and
deflections are all recorded within these data sheets.
For the purpose of all the test data in the Appendix C, each column represents a
different reading. Shown below in table 5.1 are the relevant readings recorded during
testing to the labels of the connections lines in the system 5000. The table shows which
strain gauge positioned on the steel and concrete is the relevant label to the input lines
into the system 5000.
It should be noted that in understanding the graphs shown throughout the results
section, the far end of all the graphs reach a maximum points then seem to arch back
towards the starting position. This is explained easily, as when the load is removed

5.1 Introduction 54
Table 5.2: Compression Test Results
Cylinder 1 2 3 4 Avearge ε
(kN) (kN) (kN) (kN) (kN) (MPa)
Test 1 305 327 307 310 309.25 39.44
Test 2 308 295 309 317 307.25 39.12
Test 3 302 310 300 305 304.25 38.7
Test 4 315 310 300 307 308 39.22
form the beams, the load then decrease, and the deflection decreases. The curve will
not return to the original position as steel has been loaded passed its elastic limit and
plastic deformation has occurred. Thus a residual deflection will remain. It is evident
that this residual is larger in the control beams compared to the prestressed beams, as
the prestressed beams then have the axial force induced form the prestress to aid the
recovery of the beam.
5.1.1 Compression Testing Results
This subsection will discuss the results obtained on the compression testing on the
concrete cylinders. The concretes strength from the compression testing was used for
the calculation of the concretes strength for each beam, as the compression tests were
carried out on the day that the test beams were tested, approximately 4 cylinders for
each beam.
It can be seen in Table 5.2 that for each test, which in-fact corresponds to each beam
(e.g. Test 1 = Beam 1), 4 cylinders were tested, and averaged to give a good indication
of the concretes compressive strength on the day of testing.
The force recorded from the Avery Machine in the laboratory is easily converted to the
Compressive strength of the concrete, as shown below:
For a simple cylindrical shaped cylinder, The compressive stress in the concrete is given
as, εs = Force / Cross-sectional Area (εs in MPA)
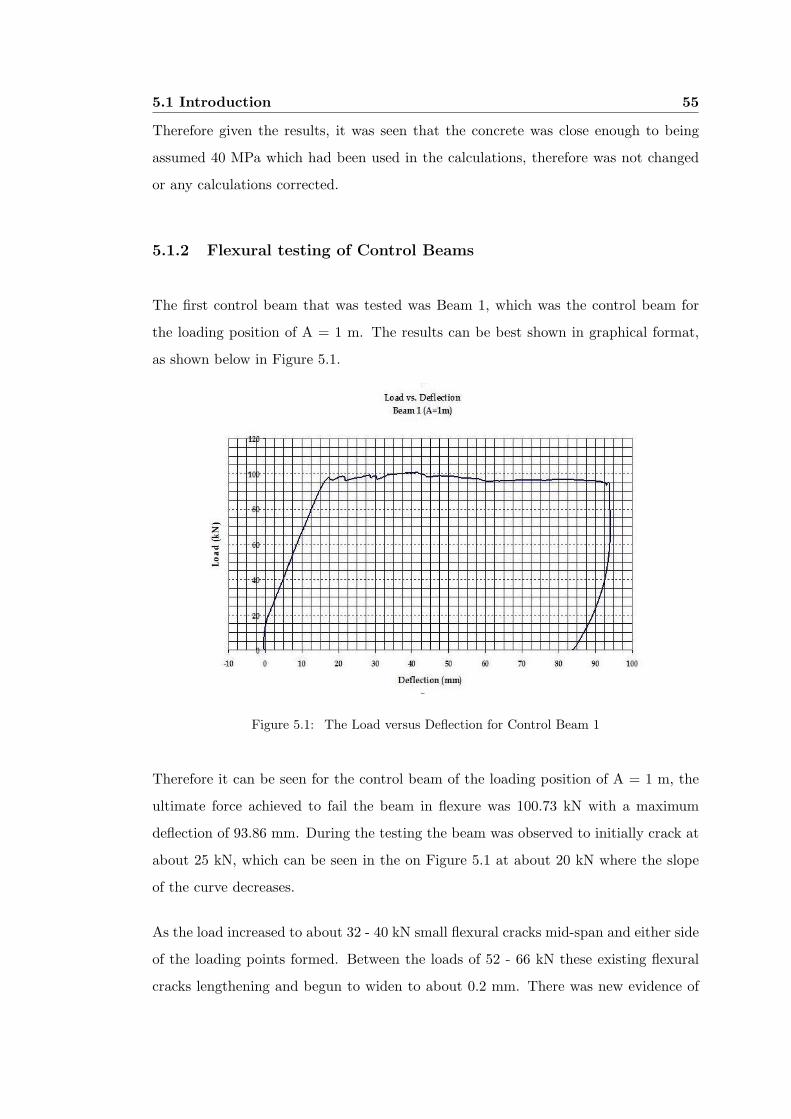
5.1 Introduction 55
Therefore given the results, it was seen that the concrete was close enough to being
assumed 40 MPa which had been used in the calculations, therefore was not changed
or any calculations corrected.
5.1.2 Flexural testing of Control Beams
The first control beam that was tested was Beam 1, which was the control beam for
the loading position of A = 1 m. The results can be best shown in graphical format,
as shown below in Figure 5.1.
Figure 5.1: The Load versus Deflection for Control Beam 1
Therefore it can be seen for the control beam of the loading position of A = 1 m, the
ultimate force achieved to fail the beam in flexure was 100.73 kN with a maximum
deflection of 93.86 mm. During the testing the beam was observed to initially crack at
about 25 kN, which can be seen in the on Figure 5.1 at about 20 kN where the slope
of the curve decreases.
As the load increased to about 32 - 40 kN small flexural cracks mid-span and either side
of the loading points formed. Between the loads of 52 - 66 kN these existing flexural
cracks lengthening and begun to widen to about 0.2 mm. There was new evidence of
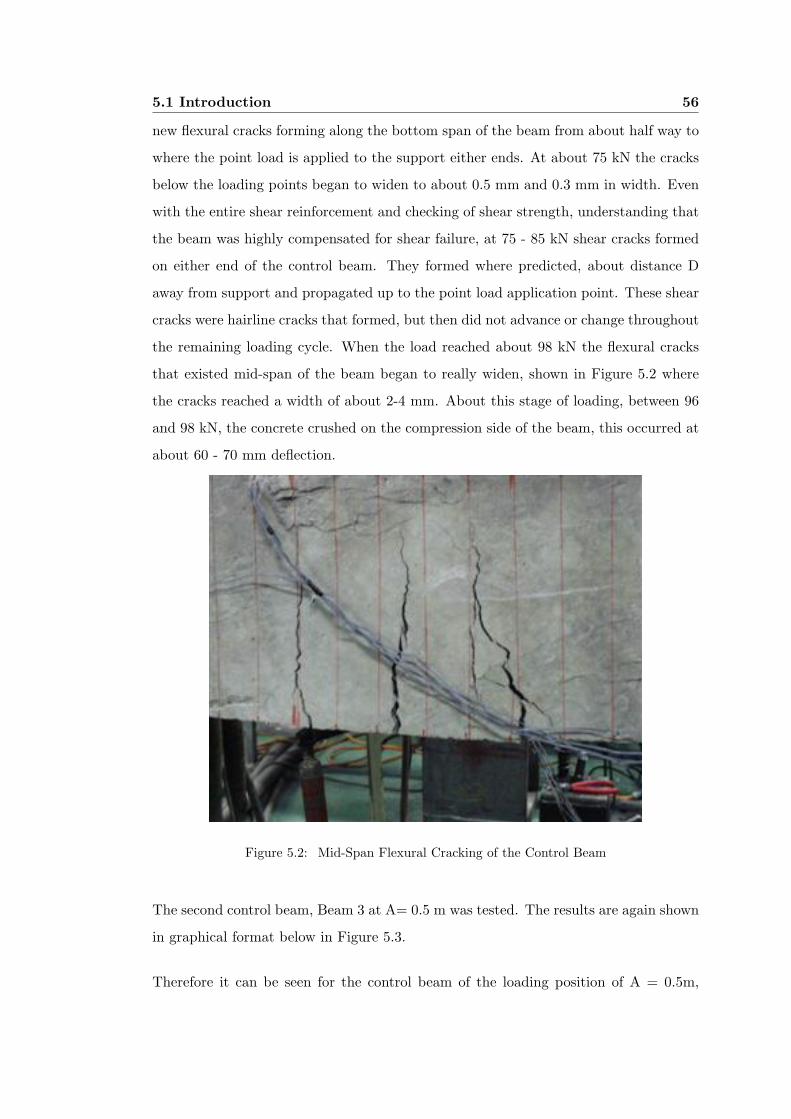
5.1 Introduction 56
new flexural cracks forming along the bottom span of the beam from about half way to
where the point load is applied to the support either ends. At about 75 kN the cracks
below the loading points began to widen to about 0.5 mm and 0.3 mm in width. Even
with the entire shear reinforcement and checking of shear strength, understanding that
the beam was highly compensated for shear failure, at 75 - 85 kN shear cracks formed
on either end of the control beam. They formed where predicted, about distance D
away from support and propagated up to the point load application point. These shear
cracks were hairline cracks that formed, but then did not advance or change throughout
the remaining loading cycle. When the load reached about 98 kN the flexural cracks
that existed mid-span of the beam began to really widen, shown in Figure 5.2 where
the cracks reached a width of about 2-4 mm. About this stage of loading, between 96
and 98 kN, the concrete crushed on the compression side of the beam, this occurred at
about 60 - 70 mm deflection.
Figure 5.2: Mid-Span Flexural Cracking of the Control Beam
The second control beam, Beam 3 at A= 0.5 m was tested. The results are again shown
in graphical format below in Figure 5.3.
Therefore it can be seen for the control beam of the loading position of A = 0.5m,
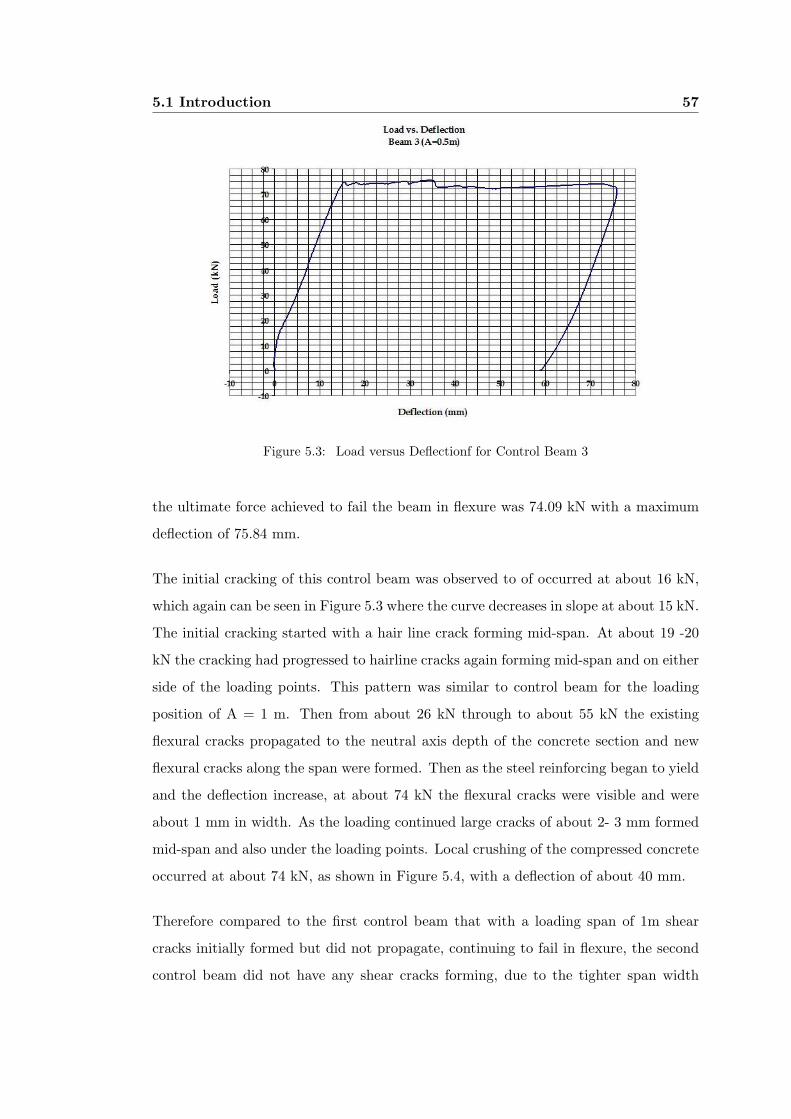
5.1 Introduction 57
Figure 5.3: Load versus Deflectionf for Control Beam 3
the ultimate force achieved to fail the beam in flexure was 74.09 kN with a maximum
deflection of 75.84 mm.
The initial cracking of this control beam was observed to of occurred at about 16 kN,
which again can be seen in Figure 5.3 where the curve decreases in slope at about 15 kN.
The initial cracking started with a hair line crack forming mid-span. At about 19 -20
kN the cracking had progressed to hairline cracks again forming mid-span and on either
side of the loading points. This pattern was similar to control beam for the loading
position of A = 1 m. Then from about 26 kN through to about 55 kN the existing
flexural cracks propagated to the neutral axis depth of the concrete section and new
flexural cracks along the span were formed. Then as the steel reinforcing began to yield
and the deflection increase, at about 74 kN the flexural cracks were visible and were
about 1 mm in width. As the loading continued large cracks of about 2- 3 mm formed
mid-span and also under the loading points. Local crushing of the compressed concrete
occurred at about 74 kN, as shown in Figure 5.4, with a deflection of about 40 mm.
Therefore compared to the first control beam that with a loading span of 1m shear
cracks initially formed but did not propagate, continuing to fail in flexure, the second
control beam did not have any shear cracks forming, due to the tighter span width
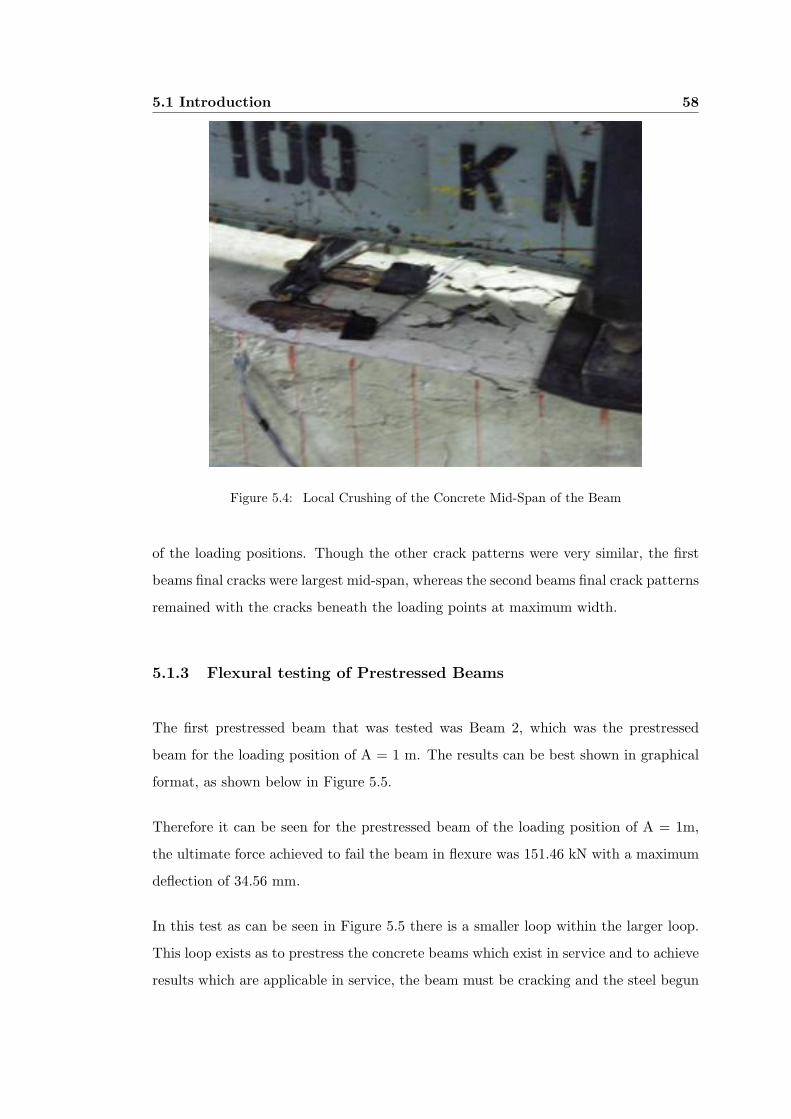
5.1 Introduction 58
Figure 5.4: Local Crushing of the Concrete Mid-Span of the Beam
of the loading positions. Though the other crack patterns were very similar, the first
beams final cracks were largest mid-span, whereas the second beams final crack patterns
remained with the cracks beneath the loading points at maximum width.
5.1.3 Flexural testing of Prestressed Beams
The first prestressed beam that was tested was Beam 2, which was the prestressed
beam for the loading position of A = 1 m. The results can be best shown in graphical
format, as shown below in Figure 5.5.
Therefore it can be seen for the prestressed beam of the loading position of A = 1m,
the ultimate force achieved to fail the beam in flexure was 151.46 kN with a maximum
deflection of 34.56 mm.
In this test as can be seen in Figure 5.5 there is a smaller loop within the larger loop.
This loop exists as to prestress the concrete beams which exist in service and to achieve
results which are applicable in service, the beam must be cracking and the steel begun

5.1 Introduction 59
Figure 5.5: Load Versus Deflection for Prestressed Beam 2
to yield, where a residual in the deflection of the beam exists. Therefore that smaller
loop is the loading of the beam to initial yielding of the steel. Later in this chapter it
can be seen that the smaller loops generally match up with the control beams curve,
this occurs as it is where the steel begins to yield. It was noted from observations
initial cracking of the un-prestressed beam, with loading position of 1m was at about
22 kN. The initial cracking consisted of hairline flexural crack mid-span. At about 27
kN, these flexural cracks began to form along the length of the span of the beam, again
from loading point to loading point. The reaction of the un-prestressed beam to the
loading again continued with general propagation of the cracks, widening and some new
cracks forming up to about 85 kN. The flexural cracks were about 0.3 - 0.5 mm wide.
The deflection at this stage was about 18 mm. The cracking patterns of this beam were
in-fact very similar to the initial testing of the control beam as expected, even the same
shear cracks formed in almost identical positions. Note that at the point of removing
the load, a 4.3 mm residual deflection remained in the beam from the yielding of the
steel. All cracks were marked with a pencil and the position marked, for comparison
on completion of the testing. After the prestress was applied, it was noted that no
cracking was easily visible and all cracks were deemed to be closed. This is caused from
the induced moment from the prestress which acts against the self weight of the beam.

5.1 Introduction 60
The load was then re-applied to the beam after prestress. No cracks were visibly
opening or forming until about a 90 kN load had been applied, where the flexural
cracks mid-span and around the loading points were becoming more visible. At about
110 kN it was evident again that the cracks were opening up and again propagating.
This was especially evident in the mid-span flexural cracks. At 155 kN, a new shear
cracked formed, parallel to the existing shear crack that by this stage still had not
formed a dominant crack, but remained about the same width throughout the test.
Not long after the 155 kN mark was reached, the compression concrete was crushed.
All flexural cracks did not exceed 1 - 2 mm at the final load and defection. After the
testing a residual deflection of about 13 mm remained (can be seen as the difference
in the starting and finishing of the prestressed curve, the two x intercepts of the larger
curve). Therefore after the first part of the test, a 4 mm residual remained which
means that the residual increase by about 8 mm after the prestressing loading had
been removed.
The second prestressed beam, Beam 4 at A= 0.5 m was tested. The results are again
shown in graphical format below in Figure 5.6.
Figure 5.6: Load Versus Deflection for Prestressed Beam 4
Therefore it can be seen for the prestressed beam of the loading position of A = 0.5m,
5.1 Introduction 61
the ultimate force achieved to fail the beam in flexure was 128.94 kN with a maximum
deflection of 31.04 mm.
In this test as can be seen in Figure 5.6 there is a smaller loop within the larger loop.
This loop exists as to prestress the concrete beams which exist in service and to achieve
results which are applicable in service, the beam must be cracking and the steel begun
to yield, where a residual in the deflection of the beam exists. Therefore that smaller
loop is the loading of the beam to initial yielding of the steel. Later in this chapter it
can be seen that the smaller loops generally match up with the control beams curve,
this occurs as it is where the steel begins to yield. It was noted from observations
initial cracking of the un-prestressed beam, with loading position of 0.5 m was at about
21.5 kN. The initial cracking consisted of hairline flexural crack mid-span. At about
38 kN, these flexural cracks began to form along the length of the span of the beam,
again from loading point to loading point. The reaction of the un-prestressed beam to
the loading again continued with general propagation of the cracks, widening and some
new cracks forming up to about 75 kN. The flexural cracks were about 0.5-1 mm wide.
The deflection at this stage of loading was about 17 mm. The cracking patterns of this
beam were in-fact very similar to the initial testing of the control beam as expected,
though this time shear cracks formed on the initial loading, where on the control beam
they did not. Note that at the point of removing the load, a 3.6.mm residual deflection
remained in the beam from the yielding of the steel. All cracks were marked with a
pencil and the position marked, for comparison on completion of the testing. After the
prestress was applied, it was noted that no cracking was easily visible and all cracks
were deemed to be closed. This is caused from the induced moment from the prestress
which acts against the self weight of the beam.
The load was then re-applied to the beam after prestress. No cracks were visibly opening
or forming until about a 57 kN load had been applied, where the flexural cracks which
existed below a loading point opened quite significantly in relation to the other flexural
cracking. It was noted that this crack was a significant crack in the initial loading
of the beam. At about 73 kN it was evident again that the cracks were opening up
and again propagating. This was especially evident in the mid-span flexural cracks.
Though at this stage no new cracks had formed, that were visibly accessible. It was

5.1 Introduction 62
also noted that the shear cracks remained closed. At 95 kN, the large flexural cracks
were easily visible and were of a width of about 1 mm. Not long after the 105 kN
mark was reached, new flexural cracks begun to form on the underside of the beam.
At about 122 kN the shear cracks again became visible, but did not propagate. At 128
kN , it was discovered that new shear cracks again formed. The crack appeared with a
more acute angle to the base of the beam then the existing shear cracks and closer to
the loading point. At about 126 kN the compression concrete was crushed, and cracks
between 1- 2 mm were observed. After the testing a residual deflection of about 11.5
mm remained. Therefore after the first part of the test, a 3.6 mm residual remained
which means that the residual increase by about 8 mm after the prestressing loading
had been removed.
5.1.4 Control Beams versus Prestressed Beams
This subsection will discuss the control beams results superimposed with the prestressed
results for each beam respectively. Again all data for the prestressed beams and control
beams can be found in Appendix A. With the graphs superimposed on each other the
strength increase and deflection decreased accompanying the prestressed beams can be
easily seen.
The results for the loading position of A = 1 m can be shown below in Figure 5.7,
where the prestressed results have been superimposed with the control beams results
As can be seen in Figure ??, the prestressed results have been superimposed on the
control beams results for the loading position of 1 m. As stated in the previous section
u can see that the smaller loop of the prestressed graph almost matches with the curve
on the control beam. This represents that the prestressed beam was attempted to
load to a point of yielding, where cracks and a residual deflection would exist. It can
easily be justified that the prestress increases the strength quite dramatically; where
the maximum flexural load of the control beam was about 100 kN compared to the
prestressed beam of about 151 kN. But most noticeably decreases the deflection of the
beam by a considerable amount, where the max deflection of the control beam was 94
mm, compared to the maximum deflection of the prestressed beam which was 34 mm.

5.1 Introduction 63
Figure 5.7: The Load versus Deflection for the Control Beam and Prestressed Beam of
Loading Position of A = 1m
The results for the loading position of A = 0.5 m can be shown below in Figure 5.8,
where the prestressed results have been superimposed with the control beams results.
As can be seen in Figure 5.8, the prestressed results have been superimposed on the
control beams results for the loading position of 0.5 m. As stated in the previous section
u can see that the smaller loop of the prestressed graph is very close to match with the
curve on the control beam. This represents that the prestressed beam was attempted
to load to a point of yielding, where cracks and a residual deflection would exist. It can
easily be justified that the prestress increases the strength quite dramatically; where
the maximum flexural load of the control beam was about 75 kN compared to the
prestressed beam of about 130 kN. But most noticeably decreases the deflection of the
beam by a considerable amount, where the max deflection of the control beam was 75
mm, compared to the maximum deflection of the prestressed beam which was 31 mm.
Table 5.3 below shows the percentage increase achieved by the prestressing force on the
control beams. This gives an indication of the expected flexural increase in the beams
strength if these prestressing techniques are applied. Also shown in Table 5.4 is the
decrease in the maximum deflection achieved by the prestressed beam in comparison
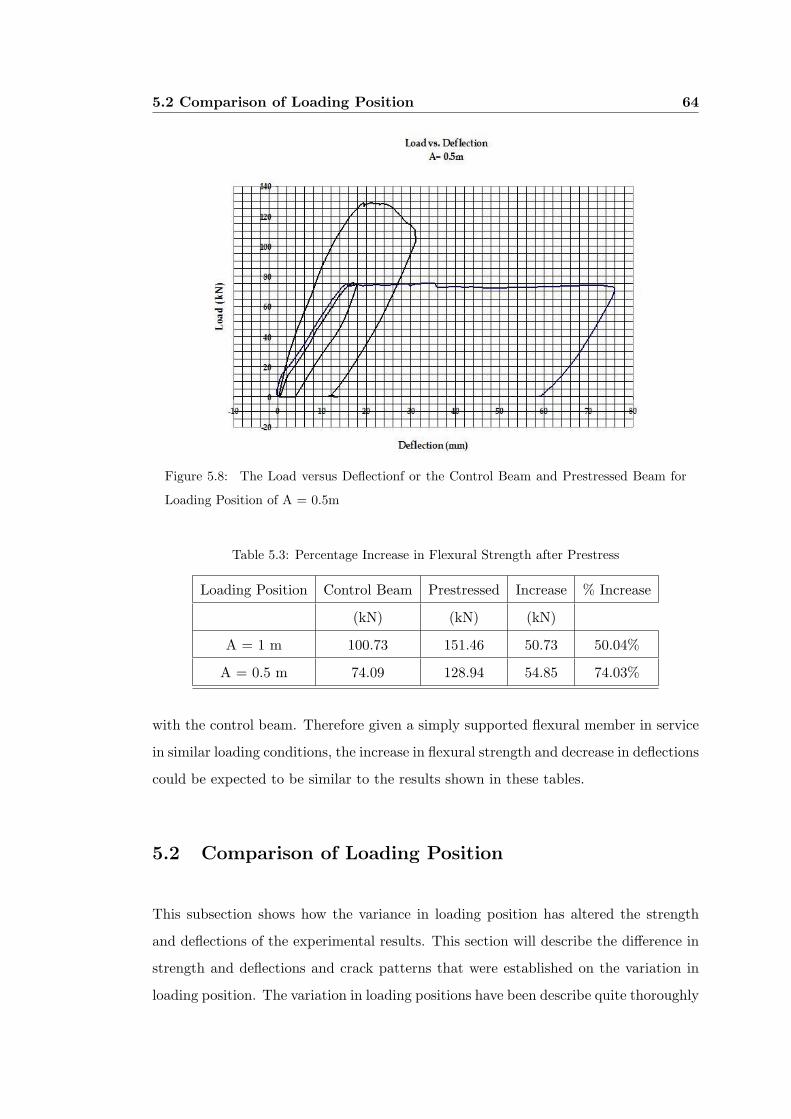
5.2 Comparison of Loading Position 64
Figure 5.8: The Load versus Deflectionf or the Control Beam and Prestressed Beam for
Loading Position of A = 0.5m
Table 5.3: Percentage Increase in Flexural Strength after Prestress
Loading Position Control Beam Prestressed Increase % Increase
(kN) (kN) (kN)
A = 1 m 100.73 151.46 50.73 50.04%
A = 0.5 m 74.09 128.94 54.85 74.03%
with the control beam. Therefore given a simply supported flexural member in service
in similar loading conditions, the increase in flexural strength and decrease in deflections
could be expected to be similar to the results shown in these tables.
5.2 Comparison of Loading Position
This subsection shows how the variance in loading position has altered the strength
and deflections of the experimental results. This section will describe the difference in
strength and deflections and crack patterns that were established on the variation in
loading position. The variation in loading positions have been describe quite thoroughly

5.2 Comparison of Loading Position 65
Table 5.4: Percentage Decrease in Deflection after Prestress
Loading Position Control Beam Prestressed Decrease % Decrease
(kN) (kN) (kN)
A = 1 m 93.86 34.56 59.3 63.18%
A = 0.5 m 75.84 31.04 44.8 59.07%
but for the sake of clarity, the two loading positions analysed was a distance of 1 m
and 0.5 m between point loadings.
The comparison between the two control beams and the two prestressed beams can
be seen in graphical format. Shown below is the comparison of the control beams in
Figure 5.9.
Figure 5.9: The Load versus Deflection for the Control Beams
It can be seen that for the loading position of 1m, Beam 1 the maximum load achieved
was about 100 kN compared to the maximum load of the 0.5m, Beam 3 which achieve
about 75 kN maximum load. This variance occurs in accordance with the theory, where
the further the load is away from the mid-span towards the supports, to fail the beam
in flexure, the force required increases. Thus the close the point loads spacing becomes
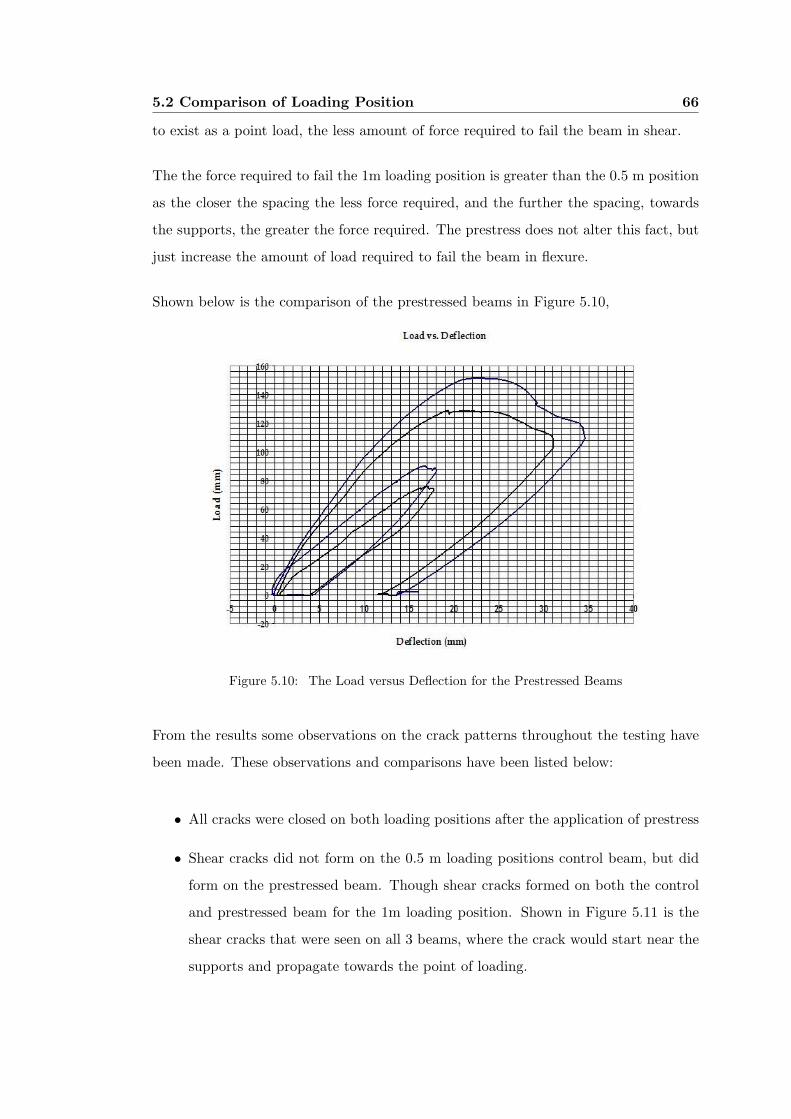
5.2 Comparison of Loading Position 66
to exist as a point load, the less amount of force required to fail the beam in shear.
The the force required to fail the 1m loading position is greater than the 0.5 m position
as the closer the spacing the less force required, and the further the spacing, towards
the supports, the greater the force required. The prestress does not alter this fact, but
just increase the amount of load required to fail the beam in flexure.
Shown below is the comparison of the prestressed beams in Figure 5.10,
Figure 5.10: The Load versus Deflection for the Prestressed Beams
From the results some observations on the crack patterns throughout the testing have
been made. These observations and comparisons have been listed below:
• All cracks were closed on both loading positions after the application of prestress
• Shear cracks did not form on the 0.5 m loading positions control beam, but did
form on the prestressed beam. Though shear cracks formed on both the control
and prestressed beam for the 1m loading position. Shown in Figure 5.11 is the
shear cracks that were seen on all 3 beams, where the crack would start near the
supports and propagate towards the point of loading.
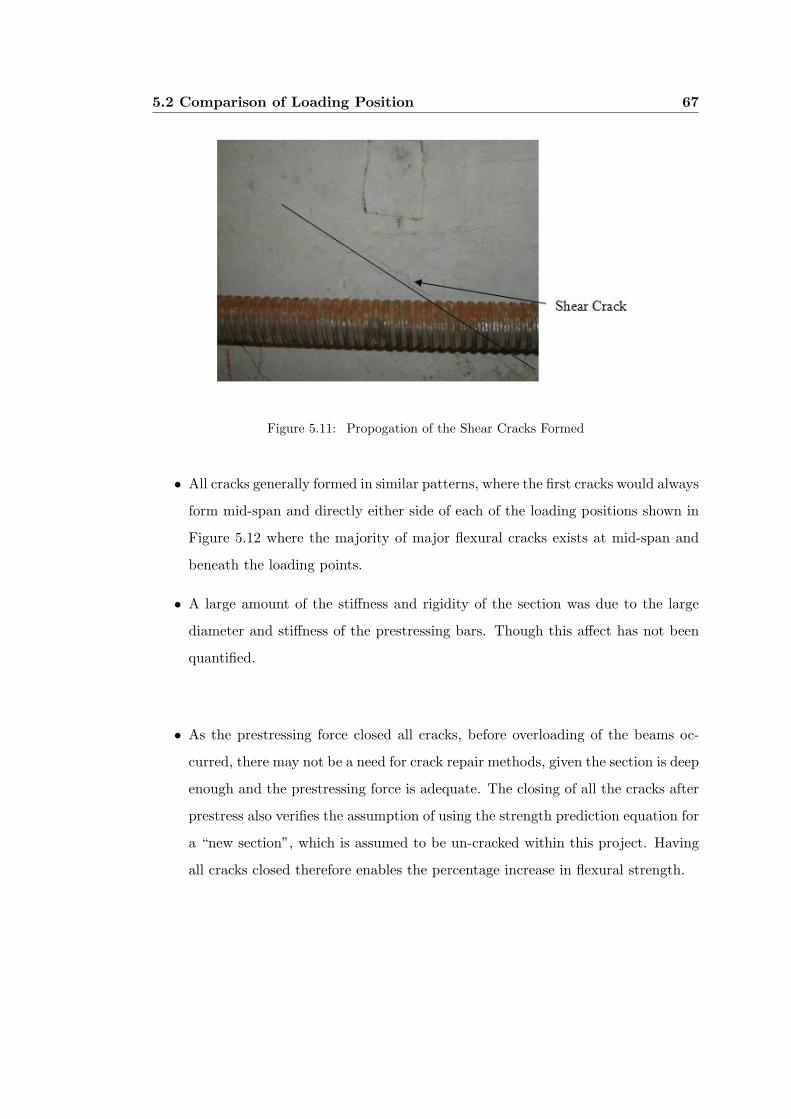
5.2 Comparison of Loading Position 67
Figure 5.11: Propogation of the Shear Cracks Formed
• All cracks generally formed in similar patterns, where the first cracks would always
form mid-span and directly either side of each of the loading positions shown in
Figure 5.12 where the majority of major flexural cracks exists at mid-span and
beneath the loading points.
• A large amount of the stiffness and rigidity of the section was due to the large
diameter and stiffness of the prestressing bars. Though this affect has not been
quantified.
• As the prestressing force closed all cracks, before overloading of the beams oc-
curred, there may not be a need for crack repair methods, given the section is deep
enough and the prestressing force is adequate. The closing of all the cracks after
prestress also verifies the assumption of using the strength prediction equation for
a “new section”, which is assumed to be un-cracked within this project. Having
all cracks closed therefore enables the percentage increase in flexural strength.

5.3 Theoretical versus Experimental Results 68
Figure 5.12: Typical Flexural Crackign Pattern for All Test Specimens
5.3 Theoretical versus Experimental Results
This subsection of chapter 4 will discuss how the experimental results achieved faired
against the theoretical predictions that were made. The section will describe the per-
centage variance in strength that was found between the theoretical and experimental
results.
Table 5.5 below shows the variance in the predicted force required to fail the control
beam in flexure compared to the actual experimental results achieved. This gives an
indication of the accuracy in the theoretical predictions to the actual experimental
results achieved. Also shown in Table 5.6 is the variance achieved in the theoretical
predictions of the maximum load required to fail the prestressed beam in flexure to the
actual recorded values.
Tables 5.5 and 5.6 show some variance in the computations in the expected flexural
strength to the experimental values. Some of the possible variance that could of lead
to the difference has been thought to include the following:

5.3 Theoretical versus Experimental Results 69
Table 5.5: Theoretical versus Experimental Flexural Control Beam Results
Loading Position Control Beam Control Beam Increase % Increase
(Theoretical) (Experimental)
(kN) (kN) (kN)
A = 1 m 81.45 100.73 19.28 23.7%
A = 0.5 m 65.16 74.09 8.93 13.7%
Table 5.6: Theoretical versus Experimental Flexural Prestress Results
Loading Position Prestressed Beam Prestressed Beam Variance % Variance
(Theoretical) (Experimental)
(kN) (kN) (kN)
A = 1 m 134.32 151.46 17.14 12.8%
A = 0.5 m 107.45 128.94 21.49 20%
• The second order effects were not taken into account; this would have an effect
especially mid-span of the beam where the eccentricity under large deflections
would induce a moment which would detract form the positive effect of the pre-
stressing force.
• The actual prestressing force within the tendons increased to larger values than
the prestressing formula predicted. The theoretical prediction of the stress in
the tendons with an initial prestress of 160 kN, resulted in a prestressing force
of about 201.7 kN with the addition of the incremental stresses caused from the
beam deflecting under the applied load. Whereas can be seen in Appendix C, for
Test 2 (prestressed beam of 1 m loading position), the force within the tendons
got as high as 259 kN (this is calculated by the addition of the force recorded in
the load cells columns of the data sheet (labelled 8 and 9)). After manipulating
the data, with the implementation of this extra recoded incremental increase in
prestress, the theoretical expected ultimate force is much closer to the actual
recorded values. A closer look at this is shown in section 5.4.
• The formulas are always conservative values, and would never be expected to
exceed the values that have been recorded.
5.4 Increases in Prestressing Force 70
From the results shown the use of the theoretical prediction equations gave results which
enabled the test to be carried out successfully and allowed the tests to be conducted
safely.
5.4 Increases in Prestressing Force
Through observation of the prestressing force recorded within the external tendons by
the System 5000 and the predicted value of the stress within the external tendons using
theoretical predictions, it was found that the increase in the stresses within the tendons
was larger than the predicted value. This increase can be assumed to be mainly from
the increase in prestressing force that occurs within the tendons as the loading occurs.
This can be demonstrated by comparing the calculated predicted stresses and the
recorded values from Appendix C for each test respectively.
The initial stresses within the external bars can be calculated as shown below, using a
simple stress calculation:
For a circular sectioned bar, the stress in the tendon is given as,
εs = Force / Cross-sectional Area
(εs in MPA)
Therefore the initial stress εp.ef ,
εs = 160 / 415.27
εs = 385.3 MPa
Hence, as described earlier, a prestressing force of 160 kN was induced onto the section,
and using the theoretical prediction equation 3.9 the ultimate stress can be found. This
equation is used to predict the maximum force that can be induced onto a section. This
section must be a un-cracked or new section for the equation to perform as intended.
For the purpose of the stress predictions made throughout this project, the assumption
that all cracks formed within the section are closed after prestress to an extent that
the section can be assumed a “new section”. Thus all predictions made were expected
5.4 Increases in Prestressing Force 71
to be approximate until verified by the results. This assumption has been identified
as fact through all observations of the prestressing tests, where all cracks were closed.
The results obtained again reassure the use of this equation, as the increase in flexural
strength in both prestressing tests confirm that the cracks were closed and the section
acted as a “new section”.
The ultimate stress calculation requires that the ultimate stress in the tendons are
calculated by the addition of the initial prestress (εp.ef ) and the incremental stress
increase under loading. The ultimate stressing calculation yields the following results:
εpu = 484.2 MPA
Hence, with the ultimate stress calculated, the force within the tendon (Tp) can be
calculated with the rearranging of equation 3.9,
Force = Cross-sectional Area x ε
Force = 201.07 kN
Therefore the force within the tendon (Tp) using the described prediction equation 3.9
from AS 3600 yields a resulting force to fail the prestressed beams in flexure as 201.07
kN. The force described is the theoretical maximum force that can the prestressed
section can hold before failure, though through observation of the System 5000 outputs
(Appendix C) of the maximum prestressing force measured through the loading cells
gives results as shown below in Table 5.7.
The values shown below are the values of the maximum force within each prestressing
tendon for the tests of Beam 2 and Beam 4, which can be seen in the columns of the
System 5000 loading cells output 8 and 9.
Beam 2 (A = 1 m) Output line 8 Output line 9 130.95 kN 125.95 kN Total prestressing
force of 256.9 kN
Beam 4 (A = 0.5 m) Output line 8 Output line 9 131.8 kN 127.93 kN Total prestressing
force of 259.73 kN
A summary of the variance of the maximum force achieved in the prestressing tendons

5.4 Increases in Prestressing Force 72
Table 5.7: Recorded Values of Prestressing Force within the Prestressing Tendons
Loading Position Total Theoretical Recorded Total Variance
Force Force(Load Cells)
(kN) (kN) (kN)
Beam 2 (A = 1 m) 201.07 256.9 55.83
Beam 4 (A = 0.5 m) 107.45 128.94 58.66
as outputted by the System 5000 results in Appendix A with the predicted ultimate
force which can be seen in Table 5.7.
Therefore by implementing these recorded maximum force values in-place of the AS
3600 predicted ultimate force calculated in section 3.6 from the initial 160 kN pre-
stressing force (where ultimate stress = initial prestress + incremental stress), an idea
of how accurate the incremental increase in stress prediction can be made. This analy-
sis is required, as the assumption of the “new section” after prestressing needs to be
verified, though the large flexural increase obtained in the results confirms that the
section itself acted as a “new section” already.
Using the recorded values of the total prestressing force within the tendons as shown in
Table 5.7 and substituting the new Tp into the prediction equations for the prediction
of the ultimate flexural strength capacity, where the results of the substitution can be
show below:
Beam 2 (A = 1 m) Recorded value to fail the prestressed section in flexure, 151.46 kN
Flexural strength predicted value of 134.32 kN to fail the prestressed section Hence,
using the recorded value of Tp the force therefore to fail the prestressed section has
therefore be calculated as, 150.55 kN.
Beam 4 (A = 0.5 m) Recorded value to fail the prestressed section in flexure, 128.94 kN
Flexural strength predicted value of 107.45 kN to fail the prestressed section. Hence,
using the recorded value of Tp the force therefore to fail the prestressed section has
therefore be calculated as, 121.07 kN.
It can therefore be seen that using the recorded value of Tp within the prediction

5.4 Increases in Prestressing Force 73
Table 5.8: Recorded Value of Force versus the Predicted Force using the Recorded value of
Force within the Tendons
Loading Position predicted Force Recorded Total Variance
(Using recorded Tp) Force
(kN) (kN) (kN)
Beam 2 (A = 1 m) 150.55 151.46 0.91
Beam 4 (A = 0.5 m) 121.07 128.94 7.87
equations, a result is achieved that is very close to the recorded loading achieved to fail
the prestressed sections, shown below in Table ??. Thus it can be deduced that the
equation given the correct increase in prestressing force, gives an accurate prediction,
though the equation itself is not applicable for cracked sections. The variance between
the initial predictions and the recorded values can therefore be traced to this limitation.
These results are of a much closer accuracy than the predicted capacity for the sec-
tions achieved by the AS 3600 equation. Thus from this it may be deducted that the
prediction equations ability to predict the incremental stress within the prestressing
tendons is limited, as the recorded values were of a greater magnitude. Even though
the sections were cracked, and then on prestressing all cracks were closed, effects on the
accuracy to predict are impeded. As shown above, given the value of Tp the equations
can predict the flexural strength to a high level of accuracy.
The increase in prestressing force can be simply quantified given the maximum values,
though it is necessary to demonstrate the increase in prestress over the loading period
of the tests. Figure 5.13 demonstrates how the prestressing force increases as the beam
deflects over time,
It can be seen in Figure 5.13 that the increase is not a linear increase. This is the second
order effects of the eccentricity on the prestressing bars increasing as the beam deflects
causing the curved slope of the line. The second order effects have not been quantified
in this project and have been assumed negligible. Figure 5.13 demonstrates that the
initial prestressing force was initiated at 160 kN which then increased as the load was
applied. As the loading increased, the deflection increased, which causes the increased

5.5 Conclusion 74
Figure 5.13: Increase in Prestressing Force
prestressing force within the tendons. The prestressing force within the tendons, as
seen on the peek of the curve, achieved about a 260 kN force.
5.5 Conclusion
The results showed a large increase in flexural strength in the flexural beam specimens
and a large reduction in deflections after prestressing. The beams all failed in a ductile
fashion and failed as the design had intended. The shear cracks formed did not lead
to any type of shear failure and the beams failed as any under-reinforced section is
expected. Also it can be concluded from the sensitivity analysis that when the value
of the force within the tendons (Tp) was altered to the recorded value from System
5000, rather than the predicted value, the equations resulted in a value that was very
much similar to the experimental results. Thus it can be concluded that external post-
tensioning is a viable technique for the rehabilitation of flexural members, given that
the prestressing force is large enough to close all cracks on the section.
Chapter 6
Conclusion
The application of external prestressing in the field of strengthening and rehabilitation
of existing concrete structures is either economically feasible or a legally bound ap-
proach to solving the problem of aging and overloading of existing concrete structures.
The process can be economical in the sense that the member or structure will either
be replaced or rebuilt if not restored through such techniques, or legally driven given
that un-safe concrete structures are bound by legislation.
6.1 Completion of Aims and Objectives
This project aimed to investigate the variation in flexural strength of rectangular rein-
forced concrete beams with the application of an external prestressing. The project also
aimed to monitor the deflections and cracks formed under the two loading conditions.
The major aims and objectives of this project accompanied with the outcomes of these
aims are listed below:
• The aim was to develop a sound external prestressing application technique.
The external prestressing technique used was simply two external prestressing
bars, which were anchored at each end via some steel plates. Both the bars and
plates and all equipment were supplied by the University, thus the prestressing

6.1 Completion of Aims and Objectives 76
technique was somewhat provided.
• To obtain the magnitude of the change in the specimens flexural strength after
external prestressing.
The magnitude of the change of the flexural strengthening of the test beams was
found and quantified in the results section. The increase in external prestress was
found to be a 50 % and 74 % increase for the loading positions of 1 m and 0.5 m
respectively.
• To observe and compare the change in the specimens deflections and crack widths.
The deflections have also been quantified throughout the results section. The
results have shown that given the prestressing system, the deflections have been
decreased by 63 % and 59% for the loading positions of 1 m and 0.5 m respectively.
• To compare the experimental results with the theoretical predictions.
The experimental and theoretical results were compared, and slight variances
were found to exist for both the control and prestressed conditions. Various
insights into why the inaccuracy has occurred have been listed. The variance of
the experimental to theoretical results has been found to be 23% and 13.7% for
the control beam condition, and 12.8% and 20 % for the prestressed condition for
the position of 1 m and 0.5 m loading respectively.
• Discuss other unexpected outcomes of the experimental phase.
The only evident unexpected outcome that was encountered throughout the project
was in-fact the difference in theoretical and experimental results. Though, section 5.4
has attempted to clarify why such differences may occur.
All major aims of this project have been achieved, with satisfactory results. A large
increase in flexural capacity has been achieved w2ith a large reduction in deflection.
The overall rigidity and stiffness of the beams have been increased, though ductile
failure was still observed. Not only was the strength of the section increased, but all
cracks closed after prestressing.

6.2 Conclusion 77
6.2 Conclusion
To conclude this research project, it is my recommendation that the further studies be
carried out on the relevant load positions, section dimensions, prestressing bar areas
and prestressing forces within the system to further improve the results. From this
project it can be concluded, that this style of prestressing yields very good flexural
strength increases, and a large decreases in deflection given the loading positions and
prestressing forces that were applied. Thus this technique proves very useful in the
rehabilitation of existing flexural members in similar loading conditions. The large
increase in flexural strength and effectiveness of the prestressing force to close the
cracks present within the beam reinforce the effectiveness of this technique as a means
to rehabilitate flexural members in service. This type of prestress could prove useful
given that no crack repair methods, such as epoxy injection should not be called for to
strengthen the beam. The extra rigidity and stuffness gained form the prestress will
ensure that the cracks remain closed unless an overloading state is achieved. Though
if the overloading is then removed, the elasticity of the system should again close all
cracks.
Though this prestressing method is a more conventional method, the experimental data
and results further prove that it is in-fact an effective method. This type of external
prestress is limited by the fact that external bars are used for the prestressing force,
thus can only be practical in shorter spans. Also the space requirements required for
the jacks, and prestressing equipment to achieve the required stress can limit such a
technique.
6.3 Recommendations for further studies
From the results of this project some recommendations for further research into certain
areas of interest which have arisen are shown below:
• The effect of the secondary effect on the results

6.3 Recommendations for further studies 78
• Loading positions greater than 1m, and the effect this has on the cracking pat-
terns, and if the shear cracks become more evident. If this loading position will
induce a shear failure.
• If crack repairing techniques in-fact increase the strength of the flexural mem-
bers evidently enough to support the use of these techniques in addition to the
prestress.
• Further tests including reduction of the section size, the size of the prestressing
bars and the prestressing force, to test if the cracks on the section still close after
prestress.
• The losses in the prestressing bars over time need to be calculated or tested, so
that management of the maintenance of the re-stressing of the prestress can be
done accurately. Accurate re-stress ensures that the cracks will remain closed
and no durability factors will influence the strength. Further study into a form
of weather resistant coating on the e
• external bars may be a possibility in the near future.
• If the need rehabilitated concrete member are in future overloaded beyond the
design prestress, cracking may again form and an increase in the prestressing
force may be required
• A detailed study into the increase in prestressing force using outside formula,
rather than using a “new section” prediction equation to predict the force of an
in-fact cracked section, though assumed to be a “new section”.

References
Cement & of Australia, C. A. (2002), Guide to Concrete Construction, SAA HB64,
Standards Australia.
E. Sayed-Ahmed, H. Raid-Amr, N. S. (2004), ‘Flexural strengthening of precast rein-
forced concrete bridge girders using bonded carbon fibre reinforced polymer strips
or external post-tensioning’, Canadian Journal of Civil Engineering 31(3).
for Civil Engineering, A. S. (2003), Structural Engineering, Standards Australia.
H.U. Aeberhard, P. Buergi, H.-P. M. P. T. S. (2005), External Post-Tensioning, VSL
International LTD.
http://www.vsl.net/downloads/VSL technical reports/PT External.pdf
current August 2005.
Nilson, A. (1997), Design of Concrete Structures, 12th edn, McGraw-Hill NY.
Nilson, A. (2004), Design of Concrete Structures, 13th edn, McGraw-Hill NY.
Nilson, A. & Winter, G. (1997), Design of Concrete Structures, 11th edn, McGraw-Hill
NY.
P.W. Abeles, B. B.-R. (1997), Prestressed Concrete Designer’s Handbook, 3rd edn,
Viewpoint Publications, Wexham Springs.
Rao, P. & Mathew, G. (1996), ‘Behaviour of externally prestressed concrete beams with
multiple deviators’, ACI Structural Journal 93(4).
R.F. Warner, B.V. Rangan, A. H. K. F. (1992), Concrete Structures, Addison Wesley
Longman, Sydney.

Appendix A
Project Specification
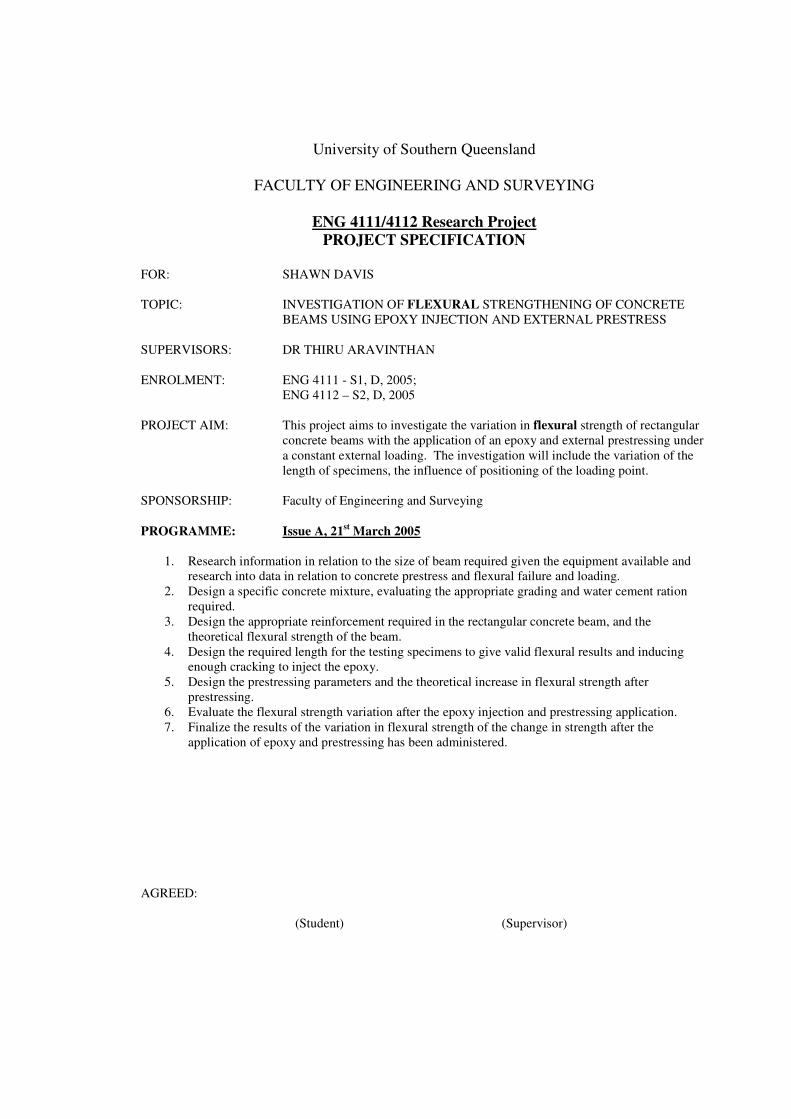
University of Southern Queensland
FACULTY OF ENGINEERING AND SURVEYING
ENG 4111/4112 Research Project
PROJECT SPECIFICATION
FOR: SHAWN DAVIS
TOPIC: INVESTIGATION OF FLEXURAL STRENGTHENING OF CONCRETE
BEAMS USING EPOXY INJECTION AND EXTERNAL PRESTRESS
SUPERVISORS: DR THIRU ARAVINTHAN
ENROLMENT: ENG 4111 - S1, D, 2005;
ENG 4112 – S2, D, 2005
PROJECT AIM: This project aims to investigate the variation in flexural strength of rectangular
concrete beams with the application of an epoxy and external prestressing under
a constant external loading. The investigation will include the variation of the
length of specimens, the influence of positioning of the loading point.
SPONSORSHIP: Faculty of Engineering and Surveying
PROGRAMME: Issue A, 21st March 2005
1. Research information in relation to the size of beam required given the equipment available and
research into data in relation to concrete prestress and flexural failure and loading.
2. Design a specific concrete mixture, evaluating the appropriate grading and water cement ration
required.
3. Design the appropriate reinforcement required in the rectangular concrete beam, and the
theoretical flexural strength of the beam.
4. Design the required length for the testing specimens to give valid flexural results and inducing
enough cracking to inject the epoxy.
5. Design the prestressing parameters and the theoretical increase in flexural strength after
prestressing.
6. Evaluate the flexural strength variation after the epoxy injection and prestressing application.
7. Finalize the results of the variation in flexural strength of the change in strength after the
application of epoxy and prestressing has been administered.
AGREED:
(Student) (Supervisor)