INVESTIGATION OF THE FILTRATION CHARACTERISTICS …
54
CA/DOH/ AIHL/SP-21 INVESTIGATION OF THE FILTRATION CHARACTERISTICS OF THE STACKED FILTER UNIT Final Report Interagency Agreement ARB Al-139-30 Prepared by Walter John, Susanne Hering, Georg Reischl and Jerome J. Wesolowski February 1980 TD 890 . J63 c.1 Air and Industrial Hygiene Laboratory Section Laboratory Services Branch California Department of Health Services 2151 Berkeley Way Berkeley, CA 94704 Submitted to: Dr. Jack Suder Research Section State of California Air Resources Board P.O. Box 2815 Sacramento, CA 95812
Transcript of INVESTIGATION OF THE FILTRATION CHARACTERISTICS …

CA/DOH/AIHL/SP-21
INVESTIGATION OF THE FILTRATION CHARACTERISTICS
OF THE STACKED FILTER UNIT
Final Report
Interagency Agreement ARB Al-139-30
Prepared by
Walter John, Susanne Hering, Georg Reischl and Jerome J. Wesolowski
February 1980
TD 890
. J63 c.1
Air and Industrial Hygiene Laboratory Section Laboratory Services Branch California Department of Health Services 2151 Berkeley Way Berkeley, CA 94704
Submitted to:
Dr. Jack Suder Research Section State of California Air Resources Board P.O. Box 2815 Sacramento, CA 95812

The statements and conclusions in this report are those of the Contractor and not
necessarily those of the State Air Resources Board. The mention of commercial
products, their source or their use in connection with material reported herein is not
to be construed as either an actual or implied endorsement of such products.
ii

CONTENTS
Figures iv
Tables V
Abstract 1
Executive Summary 1
Introduction 3
The Stacked Filter Unit 5
Physical Characterization of Nuclepore Filters 6
Nuclepore Numbering System 6
Pore Size 6
Pore Density 7
Areal Distribution of Pores 8
Filter Thickness 10
Theory of Pressure Drop 10
Pressure Drop Measurements 13
Filtration Efficiencies 15
Experimental Methods 15
Variation of Efficiency with Filter Parameters 21
Filtration Efficiencies for Liquid and Solid Particles
vs. Particle Size and Face Velocity 22
Grease-Coated Filters 29
Preparation 29
Filtration Efficiencies of Coated Filters 29
Loading Effects 31
Optimum Conditions for Ambient Sampling 38
Tests of the Stacked Filter Unit 38
Filter Support Screen 38
Flow Controller 43
Conclusions 45
Acknowledgements 46
References 47
iii

FIGURES
Number
1. Diagram of stacked filter unit 2
2. Thickness of Nuclepore filters vs. pore diameter 11
3. Pressure drop across 5,8 and 12 µm pore diameter
filters vs. face velocity 14
Experimental arrangement for filtration efficiency measurements 16
5. Dilution air system for filtration efficiency measurements 17
6. Details of the filter holder 19
7. Fixture for loading Nuclepore filters into the filter holder 20
8. Filtration efficiency vs. particle diameter for 12 µ m
Nudepore filters 23
9. Filtration efficiencies for 8 µm Nuclepore filters from
lot 51C7B4 24
10. Filtration efficiencies for 8 µ m Nuclepore filters from
lot 51D7B55 25
11. Filtration efficiencies for 5 µ m Nuclepore filters 26
12. Filtration efficiencies vs. dimensionless particle size
compared to theoretical interception 28
13. Filtration efficiencies for grease-coated filters 30
14.a Filtration efficiency vs. particle loading 32
14.b Pressure drop vs. particle loading 33
15.a Filtration efficiency vs. simultaneous loading by liquid
and solid particles 34
15.b Pressure drop vs. particle loading 35
16.a Filtration efficiencies vs. loading by ambient particulate 36
16.b Pressure drop vs loading 37
17.a Efficiency of a 5 µ m uncoated filter vs. ambient loading 39
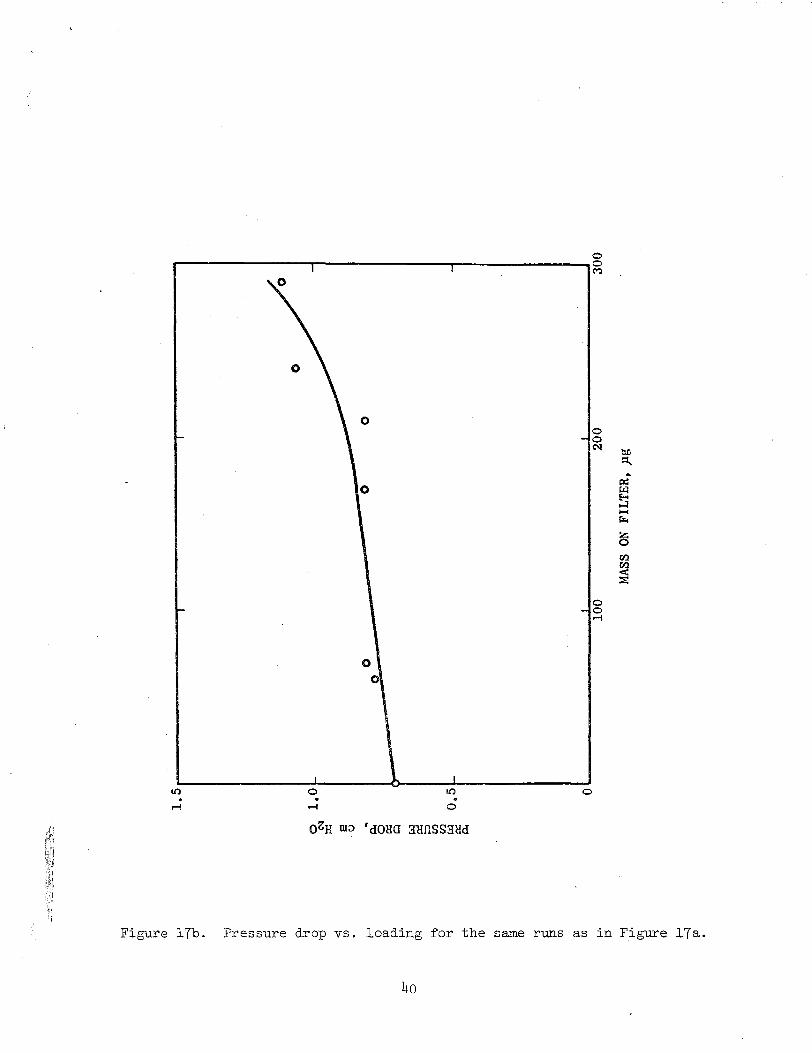
17.b Pressure drop vs loading 40
18.a,b Efficiencies of 8 µ m grease-coated filters before and
after loading, (a) 1.8 cm/s, (b) 8.4 cm/s 41
19.a,b Efficiencies of 5 µ m uncoated filters before and after
loading, (a) 1.8 cm/s, (b) 8.4 cm/s 42
20. Performance of mechanical flow controller 44
iv

TABLES
Number
1. Nuclepore filter parameters 7
2. Percentage of pores with overlapping holes 10
3. Pressure drops observed and calculated 15
4. Filtration efficiency and pressure drop for
glycerol particles 22
V

ABSTRACT
The characteristics of large pore Nuclepore filters have been investigated to evaluate
the performance of the Stacked Filter Unit as a particle size - selective sampler.
Pore densities, pore diameters, and filter thicknesses were measured for various lots
of 5, 8 and 12 µ m Nuclepore filters. A formula was developed for the pressure drop
vs flow rate, this parameter being a good empirical indicator of filtration efficiency.
Nuclepore filtration efficiencies were measured by detecting the penetration of mono
disperse particles with an optical counter. For liquid particles the efficiency increases
slowly with flow rate, indicating that the principal filtration mechanism is interception.
A theoretical calculation in the creeping flow approximation agrees well with the data.
Efficiencies for solid particles are much lower than for liquid particles and decrease
as the flow rate increases, showing the occurrence of particle bounce. Coating filters
with grease greatly reduces the bounce effect. The efficiency and pressure drop change
significantly for loadings of only a few particles per pore. Measurements of efficiency
before and after loading with ambient particulate matter indicated optimum sampling
results for grease-coated 8 µ m filters at a face velocity of 1.8 cm/s.
EXECUTIVE SUMMARY
This study is an evaluation of the Stacked Filter Unit, which is a size-selective particle
sampler (Figure 1) consisting of a large pore-size (5-12 µ m) Nuclepore filter to collect
large particles followed by a small pore-size (0.4-µm) filter to collect the smaller
particles which penetrate the first. The properties of the large pore size filters were
investigated since these determine the particle size selection and were poorly known
prior to this work.
Pore diameters, pore densities and filter thicknesses were measured for various lots
of 5, 8 and 12 µm Nuclepore filters. Within a given lot, these parameters were
uniform but there is sufficient variation between lots to require characterization of
each lot for accurate filtration measurements. Since the pressure drop is an accurate
empirical measure of the filter parameters, this was measured for various flow
1

I\)
AEROSOL PUMP
► ►
8}lffl O•4)11ll
PORE DIA.
Figure 1. Diagram of stacked filter unit.

rates. A new theoretical formula was developed which predicts the pressure drop from
the flow rate and filter parameters.
Filtration efficiencies were measured using accurately sized laboratory aerosol. For
liquid particles, the efficiency increases weakly with flow rate, indicating that the
principal filtration mechanism is interception. A theoretical calculation based on
interception alone agrees well with the data. Efficiencies for solid particles are much
lower than for liquid particles and decrease with increasing flow rate.· This indicates
that the solid particles tend to bounce from the filter surface and penetrate the pores.
A thin grease coating on the filters was found to greatly reduce the bounce effect.
The filtration efficiency and pressure drop change significantly for loadings of only a
few particles per pore. Measurements were made of the efficiency before and after
loading with ambient particles. Optimum results were obtained with 8 µm grease-coated
filters with a face velocity of 1.8 cm/s (1.5 L/min through a 47 mm filter).
It is concluded that the Stacked Filter Unit should not be regarded as a routine
monitoring tool. Particles are sized geometrically rather than aerodynamically; the
latter is preferred because it can be related to particle deposition in the lungs. The
particle cutoff is more gradual than that of an impactor. Filters must be grease-coated
to reduce particle bounce; the coating will complicate mass determination and chemistry.
A low flow rate is necessary, implying a minimum sampling period of about one week.
Within these limitations, the SFU is an inexpensive size-selective sampler which could
be useful for special projects.
INTRODUCTION
The proper assessment of the adverse effects of particulate matter in ambient air
requires particle size-selective sampling. 1 The particle size distribution is a determinant
of the relative amount of toxic material deposited in various sites within the human 2respiratory system. Visibility impairment also depends on particle size. 3 Particle
size is an important parameter for the identification of sources of particles. 4 In
addition to particle sizing, chemical analysis is essential for the evaluation of the 4toxicity and light scattering properties of the particulate matter.
3

Instruments which can collect size-segregated samples for chemical analysis are avail7able, for example, the dichotomous virtual irnpactor5 and the cyclone, 6, However,
a new sampler, the stacked filter unit (SFU), 819 has some attractive advantages, notably
simplicity and low cost. The low cost allows deployment of a number of samplers for
field studies over an extended area. The possible use of the SFU to generate data
upon which control strategies will be based requires a thorough validation of the
sampler's performance. Trial data obtained in the field so far has shown fair agreement 9between the SFU and other samplers.&, While encouraging, such field tests are not
~ufficient assurance of satisfactory performance. Laboratory measurements at AIHL lO
revealed a serious problem in the use of the SFU. Solid particles were found to be
sampled on the first filter with much less efficiency than liquid particles. The evidence
indicates that solid particles have a fairly large probability of bouncing from the filter
surface and then passing through the filter, Since the bounceoff effect increases with
flow rate, it will be necessary to limit the flow rate to keep the samoling error within
acceptable limits. In order to make a judicious choice of operating flow rate, it is
desirable to have data taken at varying flow rates with both bouncy and sticky particles.
It also desirable to have a determination of the effect of pore size on bounceoff.
Another important effect requiring investigation 1s the possible change of filtration
efficiency with filter loading, Because the particles are deposited predominantly on
the periphery of the pores, it is likely that the loading effect will be more important
than with conventional filters.
The present study was designed to determine the filtration characteristics of the SFU
using monodisperse laboratory aerosols under controlled conditions. The filtration
efficiency for solid and liquid particles was determined as a function of particle size,
air flow rate, filter pore size ancl particle loading. The measurements were extended
to grease-coated filters, which might provide a solution to the particle bounce problem.
The microscopic geometry of the Nuclepore filters was characterized, this information
being essential to the interpretation of filtration measurements and to quality assurance.
The filter support grid of the SFU was redesigned to reduce particle losses. These
data provide a basis for interpretation of sampling data, for the establishment of the
limitations of the SFU and for optimization of the operating parameters,
4

The Stacked Filter Unit
The possibility of using stacked filters for particle s1zmg was recognized by Spumy, 2et al., ll,l and investigated by Melo and Phillips. 13 Recently Parker, et al.,9 and
8Cahill, et al., suggested the use of two stacked filters for ambient air sampling with
an approximately 11 respirable1114 cutoff, i.e., a gradual cutoff with a 50% cutpoint near
3.5 µm. The SFU consists of two Nuclepore filters in a stack so that the air passes
first through a large pore size filter where large particles are deposited. Subsequently
the finer particles penetrating the first filter are removed on the second, small pore 9size filter. Parker, et al. employed a 12 µm pore size for the first filter while
8Cahill, et al. used an 8 µm pore size.
Nuclepore* filters are manufactured by a special process. The pores are initiated by
radiation damage caused by fission fragments bombarding the polycarbonate plastic.
Sodium hydroxide is then used to etch the holes to the final size. The resulting filter
co~sists of cylindrical holes passing straight through the plastic. This geometry gives
rise to the unique properties of the filter including the possibility of sizing the particles
by selective penetration. Nuclepore filters are highly suitable for automated x-ray
fluorescence analysis which yields the concentrations of approximately 20 elements 15including sulfur, lead and a number of metals. The particles are deposited on an
exposed surface rather than inside the random structure of conventional membrane
filters, simplifying the x-ray absorption correction. The Nuclepore polycarbonate
material has very low blank values, is non-hygroscopic and quite strong.
It was realized early that the Nuclepore geometry is amenable to theoretical calculation 11of the filtration efficiency. In fact? considerable success was achieved for particles
small compared to the pore size. For particles comparable to the pore size the theory
was deficient due to inadequate treatment of interception or the sieving action of the
filter. However, this is probably the most important filtration mechanism for the
SFU, as indicated by preliminary experimental and theoretical work on the SFU
conducted 1at AIHL. O
* Nuclepore Corp., Pleasanton, CA.
5

PHYSICAL CHARACTERIZATION OF NUCLEPORE FILTERS
Detailed measurements were made on the physical parameters of the Nudepore filters
for use in the interpretation of filtration efficiencies. Data were obtained on variations
from filter to filter within a batch and also between batches for quality assurance
purposes. Parameters measured include pore size, pore density, areal distribution of
holes, thickness and pressure drop vs. flow rate.
Nuclepore Number.i.ng System
It is helpful to understand the filter batch number system, which was supplied by
courtesy of the Nuclepore Corp. For example, lot number 51C7B4 denotes:
5 5 2l • l O pores/cm
1
C roll number for reactor exposure
7 year l 9T!._
B subroll for etching
4 wrap number
The first two digits give the pore density measured at the factory. Rolls are numbered
for reactor exposure which determines the pore density. Etching is carried out in
subrolls; this determines the pore size. The wrap number designates a portion of the
subroll.
Pore Size
The pores were examined in a Reichert Zetoplan microscope with a 63 X objective
and a 12.5 X eyepiece. The eyepiece reticle scale was calibrated against a stage
micrometer. The smallest scale division corresponded to 1.5 µ m on the pore. For
each filter batch 10 pores selected at random were sized on each of 10 filters. The
average pore sizes and standard deviations are listed in Table 1. The standard deviations
are larger than the estimated measurement accuracy of ± 0.2 µm. The pore size
distributions were skewed towards smaller diameters. Average pore sizes were con
sistently smaller than the nominal pore size, a consequence of the manufacturer's desire
to limit penetration to particles smaller than the nominal pore size.
One 8µm pore size filter from batch number 51C7B4 was sized on both sides for
6

comparison. The results were 7.47 ± 0.53 µ m on the shiny side and 7.29 ± 0.56 µ m
on the dull side. Therefore no significant difference was found. This does not eliminate
the possibility that the pore diameter is different within the filter.
TABLE 1. Nuciepore filter parameters
Nominal Pore Pore Pore Size Lot Density Diameter Porosity- Doublets
µm Number 10 5 cm- 2 µm % %
12 51C7C20 0.96 ± 0.25 11.1 ± 0.6 9.3 13.2 II 51C7C21 0.90 ± 0.21 11.0 ± 0.6 8.5 12.6 II 51C7C22 0.94 ± 0.22 11.0 ± 0.7 8.9 12.4 II 5lC7C23 o. 94 ± 0.27 l 0.8 ± 0.6 8.6 13.4 II 51G6C10 1. 13 ± 0.28 10.6 ± 0.5 10. l 14.5 II 51C7C6-l* 0.95 ± 0.26 9.9 ± 0. 4 7.3 9.9 " 51 C7C6-2 0.96 ± 0.25 9.6 ± 0.2 7.0 10.7 II 51G6C2-l 1.22 ± 0.29 10.9 ± 0.3 1l.4- 15.7 ii 51G6C2-2 1.26 ± 0.26 11.0 ± 0.2 i2.0 15.5
8 51C7B4 0.93 ± 0.26 7.5 ± 0.6 4.1 6.2 " 51A7B6 1.11 ± 0.34 7.3 ± 0.8 4.7 8.4 II 51 A7B12 1.07 ± 0.26 7.9 ± 0.3 5.2 7.5
" 51D7B83 0.82 ± 0.23 7.4 ± 0.5 3.5 6.6 Ii 51D7B75 0.88 ± 0.23 6.9 ± 0.4 3.3 5.5 Ii 51D7B55 0.84 ± 0.26 6.4 ± 0.5 2.7 4.3 II 5IE6A5 i.00 ± 0.26 6.2 ± 0.2 3.0 6.6
5 54E7 A126 2.69 ± 0.8 4.4 ± 0.3 4.0 7.1
" 54E7Al29 2.84 ± 1.0 4.0 ± 0.3 3.5 5.9 " 54A8A35 3.74 ± 0.9 5.2 ± 0.2 7.8 11.7 II 54A8A43 4.01 ± 1.1 4.9 ± 0.2 7.5 12.5 II 54A8A57 4. 21 ± 1.1 4-.7 ± 0.2 7.4 11.9
*The dashed numbers are used to designate boxes with the same lot number.
Pore Density
Pore densities were evaluated by counting pores in a field defined by a partially closed
field iris diaphram. On each of 10 filters in a batch, fields were located in l O radial
zones of equal area with the azimuthal angle selected by random numbers. The total
number of pores counted in each batch was of the order of 1000. Results are listed
in Table 1.
7

From the measured pore density and pore size the porosity was calculated for each
batch and listed in Table l. The porosity varies by almost a factor of 2 for a given
filter type (nominal diameter 5, 8 or 12 µ m).
Areal Distribution of Pores
Initiation of the pores by fission fragments should produce pores randomly located on
the filters. The observation of cases of many overlapping pores raised a question
about the randomness of the areal distribution. The manufacturer reported some
defective batches in earlier years. Therefore a check on the areal pore distribution
was made.
The microscopic filter image was displayed on a TV monitor with a circle on its face
to define a field which typically contained about 10 holes. The fields were chosen as
described above for the pore density measurements. Ten fields were counted on each
of 10 filters for a total of about 1000 pores in a batch. Overlapping holes were
recorded as doubles, triples, etc.
From the data, N , the number of fields with n pores can be tabulated. If the n
distribution were random, the expected number of fields with n pores, E , will be n given by the Poisson distribution:
NT(n)ne-n E = ----
n n!
where NT is the total number of fields and n is the average number of pores per field.
To evaluate the goodness of fit, the chi-squared test was applied by calculating
) 2(N - Ex2 = z __n__n__ n E
n
2For example, for batch 51 C7B4, x = l 1.0 with 13 degrees of freedom. From statistical
tables, it is found that the probability of this value to occur randomly is 50 to 70%.
Normally the probability would have to be less than l % before the departure from
randomness would be considered significant. All batches listed in Table l passed this
test.
Another test of randomness which also yields information of some practical interest
8

is afforded by the data on pores consisting of overlapping holes. For the purposes of
this discussion a hole signifies a single, cylindrical hole. We define a pore to be the
opening in a filter which may consist of a single hole or more than one overlapping
holes. A doublet is then counted as one pore with hole multiplicity n = 2. The overlap
area for a doublet is well defined. If the centers of two holes are separated by a
distance less than their diameter, D, they overlap, otherwise, they do not. The area
of the overlap region for a doublet is
The average number of holes in A is given by:2
D2n :::: n · n2 A
where n A is the average number of holes per unit area. For a random distribution,
the. probability that 2 holes will be within A2, i.e., that they will overlap is
;:::: (nz )n e-n2f(n)
n!
with n = 2. The triplet overlap probability can also be calculated from the above
equation with n = 3 although this will only be approximate since the overlap area for
a triplet, A3' is larger than A2" The percentage, P, of pores with overlap multiplicity
n is given by 00
P:::: 100 f(n)/ I f(n) n::::l
Note that the sum excludes n = o.
In Table 2, the percentage of pores with overlapping holes calculated from the above
theory is compared to measurements on three filter batches. The agreement is quite
good. The observed percentage of doublets for each filter batch is listed in Table l.
9

TABLE 2. Percentage of pores with overlapping holes
Filter Lot No.
Average Pore
Dia, µm
Overlap Multiplicity
n Number
Observed %
Observed %
Theory
51C7C20 11.1 l 2 3
956 149
21
84.9 13.2
1.9
83.3 14.9
1.8
51C7B4 7.5 l 2 3
1,165 77
5
93.4 6.2 0.4
91.9 7.7 0.4
54A8A43 4.9 l 2 3
1,136 165
14
86.4 12.5
1.1
85.4 13.3
1.3
Filter Thickness
The thickness of the filters was measured in two different ways, by weighing and by
microscope. The first method consisted of weighing 10 filters from each batch on a
Mettler balance. The thickness was caculated, knowing the diameter (47 mm), the 3
density of the plastic, 1.20 g/cm , and the porosity. The second method consis.ted of
successively focusing on the top and bottom of the filter and reading the vertical
displacement on the microscope knob. It was found helpful to apply 0.5 µ m latex
spheres to the filter since the bottom surface was indistinct. The observed displacement
was then multiplied by the index of refraction, 1.585, to obtain the thickness of the
plastic.
From the plot in Figure 2, it can be seen that the two methods yielded data in good
agreement. The slope of the line, - 1.00, indicates that the thickness decreases at the
same rate as the diameter increases, as expected from the etching process.
Theory of Pressure Drop
The usual calculation of the pressure drop across a filter considers only the pressure
drop within the filter. This has been found to be inadequate for Nuclepore filters of
( large pore size; for example, the pressure drop calculated for 12µm pores is less than
10

r-------,r-------,.-----,-,----..,.,.----------Nr--i
0 .-1
CX)
\ E!\ ::1,_ .-1 .. I P:!
0 II ~ ~ (!)
0~1Q ! ~u<1 <l Cl) f-- A
0 :r: ~ t.!) (.) ~ ~ >-1 :::E: ~ ~ '<::I'
>- ><00 00
0 X
0co c.c
mr( 'SS3:IDl:H HJ.
/ Figure 2. Thickness of Nuclepore filters vs. pore diameter. The line was fitted to the data by eye.
11

half of that observed. The theory presented here incorporates another term to include
the pressure drop from viscous flow of the air as it converges to the pore on one side
of the filter and diverges on the other side. This external pressure drop, ti.PE' can 16be derived in the creeping flow approximation for flow through an isolated orifice
in an infinitely thin plate:
where Q is the flow rate per pore, n the fluid viscosity and D the pore diameter.
The face velocity v may be introduced by:
F V Q = = NA N
2where F is the total flow rate, N the number of pores/cm and A the exposed area.
ThE:ref ore,
24vn (1)= ND3
The internal pressure drop, ti.PI' across a cylindrical Nuclepore pore of length L (filter 17thickness) is given by the Hagen - Poiseuille formula, with a slip correction.
128QnL (2) TI D4 (1 + 11.0 t/D)
= (16 J:,__) L,P ( 1 ) ( 3)3 nD E 1 + 11. 0 t/D
Where t is the mean free path of the air molecules. Thus ti P is com parable to ti PEI when the pore length is comparable to D, a condition realized for the large pore sizes.
The total pressure drop, ti PT' is obtained by adding the external and internal pressure
drops. This neglects second order effects at the pore entrance.
(4)
12
=

Equation (f./.) shows that the pressure drop is not simply related to the porosity, but
must be calculated from several filter parameters.
Pressure Drop Measurements
Pressure drops were measured with the apparatus described below in connection with
efficiency measurements. The filters were unbacked and the pressure was observed
with a manometer. The pressure drop was measured vs. flow rate. ·The typical set
of data in Figure 3 shows that the pressure drop varies linearly with face velocity as
predicted by Equation f./..
Pressure drop data for a number of filter lots are listed in Table 3. These data were
taken in the course of the efficiency measurements. The experimental pressure drops
are the average for a number of filters from the given lot and the standard deviation
is quoted.
The comparison of experiment to theory displayed in Table 3 shows that Equation f./.
predicts the pressure drop within 3% and 10% accuracy for 8 and 12µm pore diameters
respectively. There is a trend towards overestimation of the pressure drop for smaller
pores. The good agreement between the calculated and observed pressure drops is an
overall check of the accuracy of the measured filter parameters and air flow rates.
13

,--------.....----------,.----------------0rl
Ul ......._ =
© CJ .. ~ ~
~ w > w'<:I' CJ <t:
"'◄
IN
0
Figure 3. Pressure drop across 5, 8 and 12 µm pore diameter filters vs. face velocity.
14

TABLE 3. Pressure drops observed and calculated for Nuclepore filters for a face velocity of 8.4 cm/s.
Nominal Pressure Drop, cm H o Average2Pore Size Lot Theory µm Number Theory Exp. Theory /Exp. Exp.
12 51C7C20 0.49 0.55 ± 0.02 0.89 II 51C7C2l 0.56 0.56 ± 0.02 1.00 0.98 II 51C7C22 0.52 0.52 ± 0.02 1.00 ±0.06 II 51C7C23 0.55 0.53 ± 0.02 1.04
8 51C7B4 2.48 2.74 ± 0.13 0.91 0.99 II 51D7B55 5.53 5.21 ± 0.13 1.06 ± 0.11
5 54A8A43 3.38 3.30 ± 0.10 1.02 II 54E7Al29 9.73 8.8 ± 0.7 1.11 1.07II 54E7Al26 7.37 8.5 ± 0.3 0.87 II ± 0.14 54A8A35 2.82 2.49 ± 0.13 1.13 II 54A8A57 3.53 2.84 ± 0.18 1.24
FILTRATION EFFICIENCIES
Experimental Methods
The experimental arrangement used to measure filtration efficiencies is diagramed in
Figure 4. Monodisperse (a <1.02) particles were produced by a vibrating orifice aerosol g18generator . Particle charges were reduced to Boltzmann equilibrium levels by a Kr-85
beta ray source. This was followed by an ion sweeper with a weak electric field (30
V/cm) to eliminate possible charging effects from residual ions. The aerosol was then
sampled from the plenum by Clirnet optical counter Ill to monitor the particle
concentration. Aerosol was pumped through the Nuclepore filter by Climet optical
counter 112 which measured the particle penetration through the filter.
Four different flow rates through the Nuclepore filters were achieved by the apparatus
shown in Figure 5. With no dilution air, the maximum flow rate was determined by
the normal Climet flow rate of 7.2 L/min. When 3.1 L/min of dilution air was
introduced, the flow through the filter was 4.1 L/min. To obtain even lower flow
rates, the Climet flow rate was reduced to 4.0 L/min. At the lower flow rate the
15

CUMET OPTICAL
NUCLEPORE FILTER
CLIMET OPTICAL
COUNTER #2
AMPLIFIER
MUL TlCHANNEL
ANALYZER
+V
ION SWEEPER
i Kr85
VIBRATING ORIFICE
AEROSOL GENERATOR
COUNTER # 1
AMPLIFIER
SINGLE CHANNEL
ANALYZER
COUNTER
Figure 4. Experimental arrangement for filtration efficiency measurements.
16

AEROSOL IN
.- NUCLEPORE FILTER
l MANOMETERADJUSTABLEGAP
FILTERED DILUTION AIR
EXHAUST
CLIMET OPTICAL COUNTER
--''----◄J~...::ll
Figure 5. Dilution air system for filtration efficiency measurements.
17

pulses are larger for a given particle diameter, necessitating a recalibration of the
Climet with latex aerosol. When dilution air was used, the adjustable tube (Figure 5)
was positioned vertically through the O-ring seals so that the velocities of the merging
air streams were matched. The dilution air formed a dean air sheath around the
aerosol stream. The air flow rates were set by the rotameters shown in Figure 5 to
calibrate the air flow; a wet test meter was placed at the Nuclepore filter position
to measure the incoming flow. A further consistency check on relative flow rates
was afforded by the pressure drop across the filter which is linear with flow rate.
The 47mm Nuclepore filters were clamped in stainless steel holders. As shown in
Figure 6, the filters were unbacked. One O-ring sealed to the filter surface while a
second O-ring sealed to the flange, eliminating any possibility of leakage. The filter
holder was then clamped between two O-rings in the aerosol exposure apparatus; the
inside diameters of the pipes matched the filter opening to provide a smooth channel
for the aerosol flow. The filter holders could be changed in a matter of seconds by
means of the hinged arrangement. Loading of filters into the holders was facilitated
by the fixture shown in Figure 7 which provided a gentle holdown vacuum.
Liquid particles having diameters .:_1.6 µ m were generated by atomization of aqueous
solutions of glycerol. Glycerol droplets smaller than 1.6 µ m were observed (via the
optical counters) to have a size dependent on the holdup time, presumably due to
evaporation. Therefore, for diameters less than 1.6 µ m, dioctyl pthalate (DOP) in
isopropyl alcohol solution was atomized. Particle size was based on calculation from
the operating parameters of the vibrating orifice and the solution concentration.
Relative sizes were further determined from the optical counter pulse height vs.
diameter curve. Solid particles were generated from aqueous solutions of potassium
biphthalate (KHP). Potassium biphthalate forms a white, bouncy particle. Because
the particle dries with appreciable void space, the diameters were determined directly
by sizing in an optical microscope. Again, relative sizes were checked with the optical
counters. The particle mass can be calculated from the aerosol generation parameters.
This mass, in combination with the microscopic size, yields the effective density of
the potassium biphthalate particles which turns out to be almost exactly 1.0 (0.98 ±_
0.03). Therefore the aerodynamic diameter is equal to the microscopic diameter.
18

-- ---
>:rj f-'• FLEXIBLE
(Jq TUBINGi:::: 1--j (1)
CJ\
tJ (1) c+ pl f-'• I-' Cll
I-' ,,'-0 0 H;,
c+ p' \\ (1)
H;, \\
f-'• ,\I-' c+ >\(1) 1--j -p' 0 I-' p, (1)
-----~
-....... 1--j ~'\..'\.. '\.. '\..~ .
/AEROSOL I FILTERIN
I ~
m
l\\,, \
_> --r
I
I FILTER• HOLDER
I
-- .-"\ -.,,,,-'
\
--- -- -- ~ ----- .,,,.,,,. \ - ,,-- I .,,,.,,,- I
I I
I ~~ FILTER HOLDER

~ ~
~ 0 = ~ ~ ~ H ~
~
~
~i
~ ~ ~
~ 00 p 0 ~ 0 ~
Figure 7. Fixture for loading Nuclepore filters into the filter holder.
20

Measurements were also made with polystyrene latex particles (PSL) having diameters
of 1.305, 0.801 and 0.500 µ m generated with a DeVilbiss nebulizer.
The filtration efficiency, e, was determined from:
e =
Where N is the number of particles /L incident on the filter and N 1s the number/L1 2
penetrating the filter. An efficiency measurement consisted of taking a one-minute
count on Climet 112 with an empty filter holder in place. N was then determined2
by a second one-minute count with a filter in place. A third count was taken with
an empty filter holder. The average of the first and third counts gave N1. It was
found that the precision of the results was improved slightly by normalizing the counts
on Climet 112 to the counts on Climet Ill taken simultaneously.
Variation of Efficiency with Filter Parameters
The first series of tests were designed to investigate the variation of filtration efficiency
due to variation of filter parameters from filter to filter within a filter lot and from
lot to lot. For each nominal pore size the particle size and flow rate were held
constant for a series of efficiency and pressure drop measurements. The particle sizes
were chosen to give efficiencies in the 50 to 70% range; again, these filters are to
be used for the first size-selective filtration stage.
The data listed in Table 4 illustrates both aspects of the variations. The first aspect,
variation from filter to filter within a lot, is evident from the standard deviations in
efficiency and pressure drop. The standard deviation in efficiency is generally less
than 1% which attests to the small variation between filters as well as to the precision
of the measurements. The standard deviation in pressure drop is also uniformly small.
Thus, within a given filter lot, the reproducibility of filtration efficiency is entirely
satisfactory.
By contrast, the variation in filtration efficiency from lot to lot is much larger. For
example, for a nominal 8µm pore size, the efficiency for 2.6µm particles ranged from
( 55 to 66%. The pressure drop likewise showed a large variation; in fact, the filtration
efficiency increases monotonically as the pressure drop increases. Therefore the
21

pressure drop is a good empirical indicator of efficiency although the relation between
efficiency and pressure drop is analytically complex. The data show that accurate
work requires knowledge of the lot number and the corresponding filter parameters.
TABLE 4. Filtration efficiency and pressure drop for glycerol particles of a given size and a face velocity of 8.4 cm/s.
Nominal Particle No. of Average Average Pore Dia. Lot Dia. Filters Efficiency Pressure Drop
µm Number µm Tested ± Std. Dev.,% cm H o2
12 51G6C2 4.4 2 67 0.36 II 51G6C 10 II l 69 0.46 II 51C7C20 " 6 69.8 ± 0.8 0.51 ± 0.01 " 51C7C22 II 8 69.9 ± 0.7 0.52 ± 0.02 II 51C7C23 II 10 70.7 ± 0.6 0.53 ± 0.02 II 51C7C21 Ii 8 71.4 ± 0.9 0.56 ± 0.02 II 5IC7C6 II 2 77 0.81 ,
8 51 A7B12 2.6 l 55 2.2 " 51A7B6 II 1 56 2.7 " 51C7B4 " 15 56.0 ± 0.8 2.7 ± 0.1 II 51D7B83 " 1 58 3.4 " 51 E6A5 " 1 65 3.7 II 51D7B55 " 1 66 5.1
5 54A8A35 1.7 5 56.8 ± 0.6 2.5 ± 0.1 " 54A8A57 II 4 62.1 ± 0.6 2.9 ± 0.2 II 54A8A43 " 4 63.6 ± 0.3 3.3 ± 0.1 II 54B4A206 " 4 67.8 ± 0.3 3.6 ± 0.1 " 54E7Al26 II 4 75.5 ± 0.5 8.5 ± 0.3 II 54E7Al29 II t+ 76.5 ± 1.2 8.8 ± 0.7
Filtration Efficiencies For Liquid and Solid Particles vs. Particle Size and Face Velocity
Extensive measurements were made on filters from one lot of 20µm, one lot of 5µm
and two lots of 8 µ m filters, the latter two chosen to span the differing filter parameters.
Filters were changed after each measurement at a given particle size to avoid any
loading effects and to ensure a representative sampling of the filters. Face velocities
were 1.8, 2.9, 4.8, and 8.4 cm/s (1.5, 2.5, 4.1 and 7.2 L/min through 47 mm filters).
The results for both solid and liquid particles are presented in Figure 8 - 11.
22

.-------,-----~---""""T"----....-----~.....
ru
-0
_g'- D◊<l 0 ...
0 0 .....
0 00
•
•
• ◄ ♦ II
•
••
c,;i .....
00
Figure 8. Filtration efficiency vs. particle diameter for liquid and solid particles at several flow rates through 12 µm Nuclepore filters from lot 51CTC20. The line is a theoretical calculation of particle filtration by interception only.
23

b 00 . c:I
-.-4 ,:s
+1
t ....(l.) :.. 0 0..
...... c.o 3.•
...... •
0
.... M
0::
; cz:i ~
~ ◄ 411• U"l H 0
~ u H~ 0 ~
'<l' ~•◄•• Cl.
:;1D <><l u
I-<0 0:: ~
6 ~
~ c.:,
0 0 0 00 N .-I
( Figure 9. Filtration efficiencies for 8 µm N~clepore filters from lot 51C7B4. Data symbols and line are explained in Figure 8.
24

-----.-----..---------....-----co
b
·.-I -0~till s.... 0 0..
I= :::1..
i ~
.. i::i=
-Q
-~ u
~ c:lo
~ u-01:: e,..
~ ~ C,
~
0 0
□ <><] 0
0co
D <>
0 co
... • ◄•
•◄ ...
•
.... ..
0 N
co
U')
~
M
ell
0
r-4
Figure .10. Filtration efficiencies for 8 µm Nuclepore filters from lot 51D7B55. Data symbols and line are explained in Figure 8.
25

•
6 +I. • ◄ ... EI.I".) ::I._~1 .. Q.) i:t: ~ ~ 0 f-4 ~ i◄• • ~ ......
Q
~ u ...... ~ M• ◄ •• < ~
u ...... i:t:•• ~
f-4C"1
D ~ <.?:lo ts
D <><l 0
0 C"1
00 0 0 0 00 <.o r-➔
Figure 11. Filtration efficiencies for 5 µm Nuclepore filters from lot 54A8A43. Data symbols and line are explained in Figure 8.
26

Disc.ussion
The efficiencies for liquid and solid particles were found to be nearly the same for
small particles but differed markedly for larger particle diameters until the pore size
was approached. For liquid particles, filtration efficiency increased slowly with
increasing face velocity as expected from inertial impaction. However, for solid
particles the efficiency decreased with increasing face velocity. The solid particle
results are consistent with the occurrence of particle bounce. Examination of the
filters under a microscope revealed that the particle deposits were concentrated on
the peripheries of the pores as expected from the convergence of the airflow streamlines
to the pores. Therefore, if a particle bounces, it has a high probability of passing
through the pore.
The curves in Fig. 8 - 11 are from a theoretical calculation of the filtration efficiency
including interception only. The fair agreement between the data points for liquid
particles and the. calculated interception efficiency as well as the rather small increase
of. efficiency with face velocity shows that interception is the principal filtration
mechanism. The geometrical particle diameter is therefore the appropriate variable
rather than the aerodynamic diameter. By dividing the geometrical particle diameter
by the pore diameter a dimensionless parameter is obtained, allowing the data for all
pore sizes to be included in the same plot. This has been done in Fig. 12 for the
lowest face velocity, 1.8 cm/s. It can be seen that the data for all pore sizes show
the same dependence on the dimensionless particle size. For small particle size the
data agree well with the theoretical interception curve. The measured efficiency is
systematically slightly larger than the theoretical efficiency at larger particle sizes,
which may be due to changes in the air flow pattern in the presence of the particle,
an effect not taken into account by the theory.
When used as the coarse filter in the SFU, the 12µm pore filters give a reasonably 14good approximation to the industrial hygiene "respirable" cutoff curve with a 50%
cutpoint at 3.8µm (l.8 cm/s face velocity). The 8µm pore filters have a cutoff curve
shifted to smaller sizes, the 50% cutpoint being at 2.6 µ m (1.8 cm/s). This is practically 19the same as the 2.5µm cutpoint currently recommended by the Environmental
Protection Agency for ambient sampling. However, the cutoff of particles >2.5 µm is
not as sharp as that of the dichotomous virtual impactor. The 5µm pore size filters ( \ give a 50% cutpoint even lower (l.5µm at 1.8 cm/s).
27

0 0
><l t>
0
<3 0
t> X
0 co 0 (0
X
~~~ ~~~ E: E: s ~$~ ..... 01>'.X
<3
0 CN
0
00. 0
t--.. 0
U'). 0
I!'). 0
~
0
(I'). 0
N. 0
. 0
0
0 . r--i
O').
~ ~
A
' ~ C.> ~
E-<
~ A. . A
~
%'AJN3IJIAA3 NOilVHl1IA
Figure 12. Filtration efficiencies for liquid particles at face velocity of 1.8 cm/s vs. dimensionless particle size. The line is theoretical interception in the creeping flow approximation.
28

GREASE - COATEO FILTERS
Preparation
The particle bounce phenomenon observed in the present work has also been detected
in ambient sampling with the SFU. Cahill, et al., 20 have attempted to reduce the
problem by coating the filters with Apiezon vacuum grease. Coated filters, kindly
supplied by the U.C. Davis group, have been included in the present laboratory aerosol
testing.
The coatings were applied by dipping the filters in a dilute solution of Apiezon L
grease in toluene. The grease thickness was determined by weighing and the solution
concentration chosen to maximize the thickness without significantly clogging the pores
as judged by the pressure drop. Two sets of filters were tested here, lot 51D7B83
with a grease thickness of (9 ± 3) µg/cm 2, and an average increase of pressure drop
(measured during the work reported below) of 14%. The second lot, 51D7B36 had a 2 gr~ase thickness of 17 µg/cm and an increase in pressure drop of 4.5%.
Filtration Efficiencies of Coated Filters
Filtration efficiencies were measured at 8.4 cm/son 8µm filters from lot no. 51D7B36
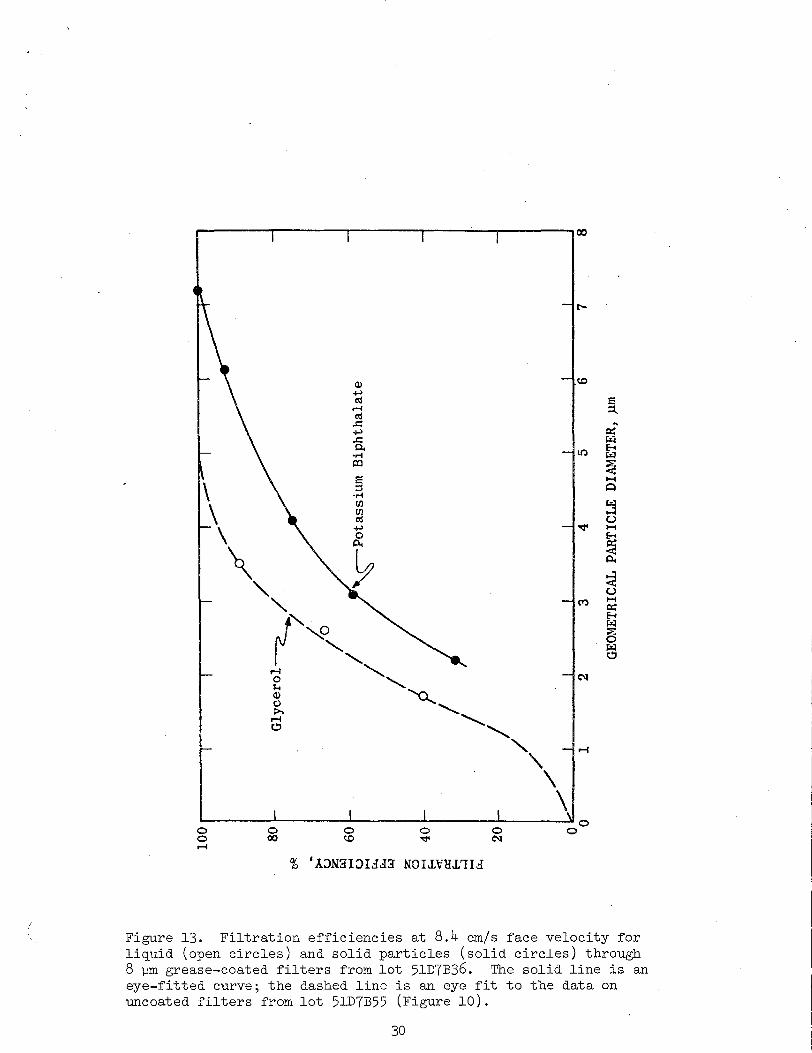
which were coated with Apiezon grease. As shown in Fig. 13, the liquid particle
(glycerol) points agree well with the dashed line representing the corresponding data
taken on uncoated 8µm filters from a similar lot, 51D7B55 (see Fig. 10). The solid
particle efficiencies (potassium biphthalate) are much closer to the liquid particle curve
than in the uncoated filter case, but are still systematically lower, for example, 27%
lower at 3 µ m diameter.
Similar results were found for grease-coated 8 µ m filters from lot 51D7B83. At 8.4
cm/s the solid particle efficiencies were about 23% less than for liquid particles. At
1.8 cm/s, solid particle efficiencies were about 15% less than for liquid particles. This
indicates less bounce at lower face velocity.
The above results show that the grease coating reduces particle bounce by a large
factor but not completely. The reason for the remaining excess penetration by solid
particles is not known. Perhaps the grease coating does not completely cover the
critical surface area near the hole.
29
------.------.-----~--..;._------oo
tOQ)
+->l'd E:
,-f ~ l'd ....c:: ex:+-'..c:: ~ 0. E-<I.I':)•.-1 co i E: 1-1 ::J ~
\ ·.-I\ (I) [/J ~ t'd (.)
+-> 'd' 1-1 0\
\ i:i.
~
~ i:i.
" ~
(.) 1-1M ex: E-< " ::a: 0 ~'---...._o, '--~
t-:1 e,
CN ,-f ' ~ ' [ 'a.........__ c:, .........."
,-f"''\ \ \
0 0 0 0 0 0 0 0 00 c.o ~ CN ,-f
% 'A.::>N3:l;)L!f.!I3: NOLLVHJ.'IB
(
Figure 13. Filtration efficiencies at 8.4 cm/s face velocity for liquid (open circles) and solid particles (solid circles) through 8 µm grease-coated filters from lot 51D7B36. The solid line is an eye-fitted curve; the dashed line is an eye fit to the data on uncoated filters from lot 51D7B55 (Figure 10).
30

Loading Effects
Since the grease coating eliminates most of the particle bounce, solid particles build
up deposits on the filters. Indeed, minute by minute increases in efficiency and pressure
drop could be seen under the conditions of the experiment. Data from the optical
counters yielded the filtration efficiency at a given time and from the accumulated
counts the number of particles deposited on the filter could be determined.
Fig. 14-a shows the filtration efficiency vs. number of particles deposited on an 8µm
grease-coated filter for 2, 3 and 7µm potassium biphthalate particles. The efficiencies
for 2 and 3µm particles show a steep initial rise, then approach a common asymptotic
trend. It is remarkable that the effect of only a few particles per pore is significant.
The curve for the 7 µ m particles is difficult to interpret; the diameter of these particles
is near the pore size. Fig. 14-b shows the pressure drops recorded during the same
runs. The 2 and 3 µ m curves have a slight inflection, while the 7 µ m particles are
very effective in plugging the pores. Again, only a few particles per pore result in
significant pressure rise.
Data for simultaneous loading by 2 µm glycerol particles and 2.68 µm latex particles
are shown in Fig. 15a and 15b. The filter had a slight loading prior to the run of 6 60.8• 10 , 4 µ m dia. and 2.7• 10 , 3 µm dia. potassium biphthalate particles. Glycerol
particles were much more effective in loading greased filters than uncoated filters.
The reason was evident under the microscope. Glycerol wets uncoated Nuclepore, the
particles spreading out into a low puddle. The glycerol particles do not wet the
greased surface, presenting a much higher droplet profile.
Because· it is difficult to predict loading effects for ambient air, filters were loaded
by operating a sampler near an open window in the Berkeley laboratory. The sampling
was interrupted periodically, the filter weighed, and the filtration efficiency determined
with laboratory aerosol.
Results for an 8µm filter are shown in Fig. 16a. The efficiency for liquid particles
rises steeply for very ·light ambient loading. The efficiency for solid particles is
initially flat, possibly even dropping slightly. This may be due to the opposing effects
of bounce off as the grease is covered with ambient particles and loading by accumulated
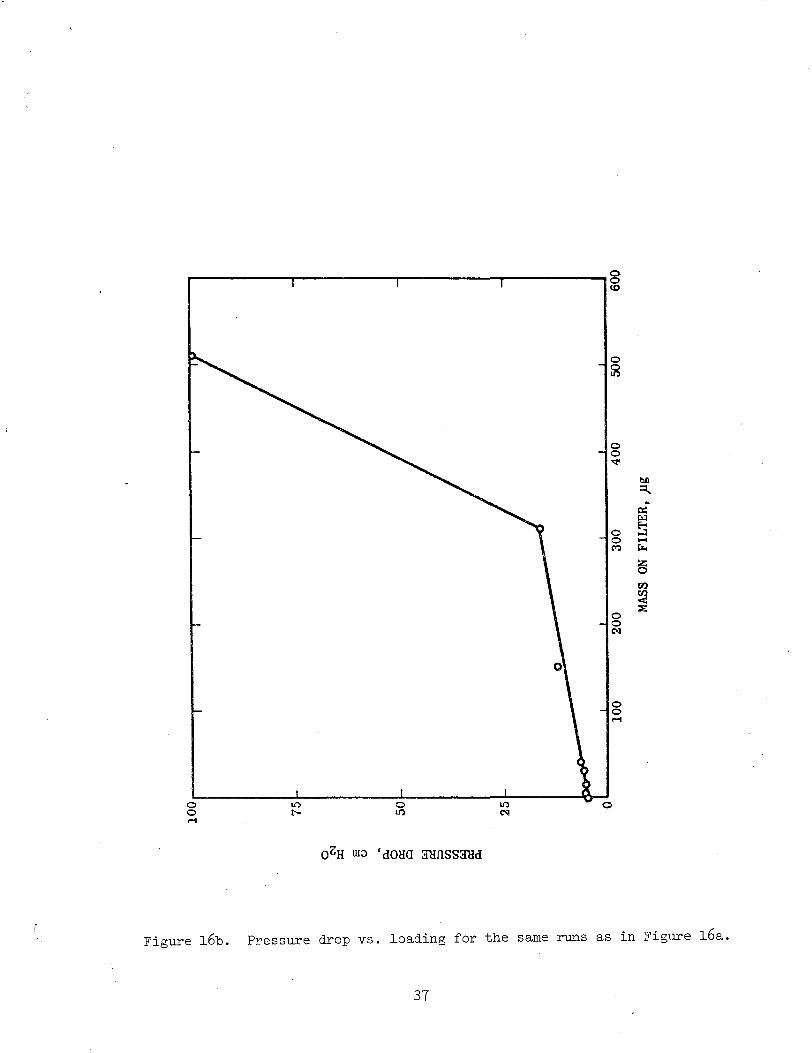
particles. The pressure drop (Fig. 16b) jumped abruptly beyond 300 µg on the filter.
31

~ ~ ...____
00
-~ u ~
~ ~
0 ~
~ w ~ ~ z
r--0 M
~ ~ 0 00
m
0 r--
00
0 ~
r--
w ~
-~ 0 ~ l(') CD z
0 00
-~ u l(')
0 ~ ~ ~
~ ~
~ ~
~ 0 w M ~
~ z M
0 N
0 M
0 0 0 ~
( Figure 14a. Filtration efficiency vs. particle loading on an 8 µm grease-coated filter from lot 51D7B36. The eye-fitted curves are labelled with the diameter of the solid, potassium biphthalate particles.
32

Pl "cl C/l f-'•
f-'• (fq ,3 NUMBER OF PARTICLES/PORE
t:::i 'i
fzj ro
10 20 30 40 50 60 70 80 f-'• f--'
(fq +'"" 30 ,3 o' 'i • ro f--' f-i:J +'"" 'i Pl ro · 25
C/l C/l ,3 'i (1)
0p, 'i ::c
(N 20
0 'd E! < C)
-C/l. Cl. w 0 w 'd 0::: 15
0~ c+ f-'• ~ () ::::,f--' ti)(1)
10ti)
f--' ~ 0 P.. p, Pl .
f-'• t:::i
(fq 5 H;i 0 'i
c+ p' (1) 0 C/l l 2 3 4 5 6 7 8 9 10
xl01~ (1) NUMBER OF PARTICLES ON FILTER 'i § C/l

~ ~
~ ~
~ '-~ ~ ~ ~ ~ 0 ~
~ ~
0 ~
~
m ~ ~ ~ z
~ 0 ~
X0 N
~ ~
~ H ~
~ z ~ 0
~
~ u H ~ ~ ~ ~
0 ~
0 ~ ~
~
~ ~ z
Figure 15a. Filtration efficiency of an 8 µm grease-coated filter from(
lot 51D7B36 for simultaneous loading by liquid (glycerol) and solid (polystyrene latex) particles. The filter had a light loading before the run as explained in the text.
34

ti') ,-4
~
' ~ IZl
~ C.) 1--1 E-< ~ 0 p,. rl
~ 0 et: i:.:i
~ :::> z
c.o 0 rl :,,:
0 N
et: ~ ...:i 1--1
r.t') ~ rl
es ltl
~ C.) 1-1 E-< ~ p,.
0 ~ rl 0
~ i:.:i
~ :::> z
in
in in 0rl
0 rl
( \ Figure 15b. Pressure drop vs. particle loading for the same runs as in
Figure 15a,
35

.-----,-----.-----,------,------g(,D
0 0 l!')
b.O :::1,.
... i:t:i
~
-~
-2. E-<
i 0 ..:1
"<:tit 0
z ~
~ 0
00i ~ ~ t.>
2.. 0 E-< CV') ~i • 0 -
1 Pt
E-< zu
! ~
~ -t.::> 0
~ 0::1.. t-. CN
0 ~
00 00 <t:::;:
0 0 r-1
0 0 00 CN.-I
•
Figure 16a. Filtration efficiencies of an 8 µm grease-coated filter from lot 51D7B36 vs. loading by ambient particulate matter.
36
,------r------,,----.....-----8CD
0 0 'St'
b.O ~ -i:i::
i:..:i s0 0 .... M r...
~ tl'l
~ ~
0 0 IN
0 0 r-4
0
0 6H w~ 'dOlla ffiifiSSffiid
Figure 16b. Pressure drop vs. loading for the same runs as in Figure 16a.
37

Since bounce off was less important for the 5 µm pore size filters, the later were
potentially useful even uncoated. Therefore loading data were taken on uncoated 5 µ m
filters (Fig. 17a and 17b). The efficiencies change less rapidly than for glycerol on
coated 8µm filters (Fig. 16a) and the solid particle curves parallel that for liquid.
The pressure drop again rose more steeply near the end of the run.
OPTIMUM CONDITIONS FOR AMBIENT SAMPLING
Two filters were chosen as the most promising as the large pore size filter to be used
in the first stage of the SFU for ambient air sampling. These were the 8 µm grease
coated filters and the 5µm filters which showed the least bounce off effect of the
uncoated filters. The selected filters were tested with laboratory aerosol before and
after loading with ambient aerosol at two different flow rates. A target loading of
200-300 µg was chosen as sufficient for gravimetric and x-ray measurements.
The results for the 8µm grease coated filter are graphed in Fig. 18. At a face
velocity of 8.4 cm/s the loading increased the spread between the efficiencies for
liquid and solid particles to more than 2µm (L8 vs. 4.0µm respectively). At 1.8 cm/s
the spread after loading was only 0.7 µ m. For t~e -? µ m uncoated filter (Fig 19), the
8.4 cm/s face velocity again produced a large bounce off effect. At 1.8 cm/s the
solid and liquid curves responded to loading almost equally, both however, shifting more
than the corresponding 8 µ m coated filter curves.
It is evident from the data that a 8.4 cm/s face velocity is too high regardless of the
choice of filter. The operating flow rate should be maintained at about 1.8 cm/s or
lower. This restricted flow rate implies a typical sampling time of about one week.
(15m 3) Of the two filter types, the 8µm grease-coated filter gave the least shift
with loading. The cutpoint is also closer to the currently favored value of 2.5 µ m
aerodynamic diameter.
TESTS OF THE STACKED FILTER UNIT
Filter Support Screen
The Stacked Filter Unit devised by the U.C. Davis group and sold commercially uses
38

r-----r------,r--------,----------00
M
00 N
bD ~ ..
,:i:: ~ ~ ..::i 1-1 i;:..
z 0 rJl en <i:
0 ~
0 ...-1
0 0 00 N...-1
Figure 17a. Filtration efficiencies of a 5 µm uncoated filter from lot 57A8A43 vs. loading by ambient particulate matter.
39
,----------,----------r----------.g0
0 0 0 ~ bD
::l._
-0
p::
~ 1--C ~
~ en ~ ::;;:
0 0 r-1
0 0
U') U')0 0. . . r-1 r-1 0
Figure 17b. Pressure drop vs. loading for the same runs as in Figure 17a,
4o

Liquid £_article,
Unloaded filter
Lo~dcd filter
O -6. - -
100 I 1 I I I
80
cf<
;,-. A
c.> . z ~ 60 c.>
.i::-- ..... /-J µ.,
µ., i:..l
8z
40 f-, ~ ~ f-, ~ ..... ~
20
1.8 cm/s
£. /
//
/ .A ~
//
/Aft
//
/
J/1 1/1I I I I I
/
Solid particles
e A
I I j I
8.4 cm/s /,l{ /
/
/ " / • /
I /I • •
I ?
II rl • A
I •j/ I
(a) (b)
• I l 2 3 4 0 l 2 3 4
GEOMETRICAL PARTICLE DIAMETER, )lJll
Figure 18a,b. Filtration efficiencies of 8 µm grease-coated filters from lot 51D7B83 before and after loading with 17 µg/cm2 of ambient particulate matter. The face velocities were (a) 1.8 cm/sand (b) 8.4 cm/s.

100. ~-- . I ,...,.,,,-I I I _.A'J;. r8.4 cm/s ~ A
1.8 cm/s / ... / f
t( A80 I ~ ff IIt; ~
I z i:.:l I J... AI.... 60
I L{ •u.... I Ii:....
i:.... J.+'"" t,.:i [\) I AIz I0 I •.... 40 I
E-<
f I
•«:i:
I I
0:: ,1E-< .... ~ i:.... I I •I20 I I
I, I (a) II (b)
I t 0
l 2 3 4 0 1 2 3 4
GEOMETRICAL PARTICLE DIAMETER, µm
Figure 19a,b. Filtration efficiencies of 5 µm uncoated filters from lot 57A8A43 before and after loading with 21 µg/cm2 of ambient particulate matter. Symbols and lines are explained under Figure 18.

a standard Nuclepore filter holder assembly whereby the first, large-pore filter is
supported on a plastic grid. Since the particles penetrating the coarse filter must
traverse the support grid, possible losses on the grid are of concern. The grid consists
of two sets of ribs at right angles. The crossings cause abrupt changes in the air
flow which could cause impaction.
Losses on the grid were measured by sampling monodisperse glycerol particles containing
a uranine tracer. The 8 µ m coarse filter, 0. 4 µ m fine filter and the grid were washed
in sol vent and the uranine quantitated on a fluorometer. At a face velocity of 5.8
cm/s, the grid deposit ranged from 13% for 0.8µm particles down to 2.2% for 7.3µm
particles. (The latter is 50% of the particles penetrating the coarse filter). The '·
support grid was replaced by a 16 mesh stainless steel screen. Scre1-:m deposits were
then found to be 1.2% at 8.4 cm/s and 1.5% at 1.2 cm/s for 2.5 µ m glycerol particles.
An alternative at the low flow rates used here is simply to eliminate the support
screen. The polycarbonate plastic can easily support the pressure. The edges should
be clamped securely against an O-ring.
Flow Controller *Four air samplers designed for the SFU, Sierra Model 202-2F, were tested. Each
unit was first subjected to an overall check for leaks by placing rotameters at the
intake and exhaust to see if the flows are equal. Typically, they are not, the cause
being loose connections. The panel flow meter (a rotameter) was calibrated against
a wet test meter and found to be linear with an rms accurracy of 15% at 2 L/min
and 4% at 10 L/min.
The flow controller was tested by placing a needle valve at the intake to produce a
variable pressure drop. The flow rate is plotted against the pressure drop in Fig. 20.
The drop off above 14 to 15 in. Hg is typical. At lower flow rates the deviation
from the set flow varies with the unit, but is within 5 to l 0%. The flow controller
performance is therefore satisfactory for the SFU.
* Sierra Instruments, Inc., Carmel Valley, CA.
43

20r-----,.------,-------,-----
16
•d •"" 12~
',) •~
~
~
9 ~
8
~
4
0 5 10 15 20
PRESSURE DROP, In. Hg
Figure 20. Performance of the Sierra mechanical flow controller for the SFU.
44
I

CONCLUSIONS
The physical parameters of the large pore size Nuclepore filters to be used as the
first, coarse filter in the SFU are uniform within a given filter lot; however, variation
between lots necessitates knowledge of the pore size and pore density for accurate
work. The pressure drop is a useful empirical indicator of the filter parameters. A
formula has been developed for the calculation of the pressure drop from· the parameters
and the flow rate.
For liquid particles the filtration efficiency increases weakly with face velocity. Most
of the particle deposition is attributed to interception. A theoretical calculation of
interception in the creeping flow approximation compares well to the data. Therefore
the particles are essentially sized geometrically rather than aerodynamically.
Efficiencies for solid particles are much lower than for liquid particles. Moreover,
the efficiency for solid particles decreases with increasing face velocity, indicating
that the particles bounce from the filter surface and penetrate the pores. Coating
the filters with grease greatly reduces but does not completely eliminate particle
bounce.
Loading of the filters with laboratory-generated particles and by particles from ambient
air shows that the efficiency and pressure drop change significantly for deposits of
only a few particles per pore. The optimum sampling conditions were found to be at
1.8 cm/s face velocity with an 8 µ m grease coated filter. This implies a minimum
sampling period of about one week.
The present work shows that the Stacked Filter Unit should not be regarded as a
routine monitoring tool. Particles are sized geometrically rather than aerodynamically
and the cutoff is not sharp. Filters must be grease-coated to eliminate particle bounce.
A low flow rate is necessary, requiring a sampling period of a week. Within these
limitations, the SFU is an inexpensive size-selective sampler which could be useful for
special projects.
45

ACKNOWLEDGEMENTS
We thank Professor Simon Goren for his continuing interest in this work and for
participation in the theoretical work. David Plotkin assisted with the early phases of
the experimental work. We thank the Nuclepore Corp. for friendly cooperation and
discussions. Dr. Tom Cahill kindly supplied an SFU and greased filters.
46

REFERENCES
1. The Current Status of Particulate Matter Monitoring, W. John, Third Interagency
Symposium on Air Monitoring Quality Assurance, Berkeley, CA, May 18-19, 1977.
2. Deposition and Retention Models for Internal Dosimetry of the Human Respiratory
Tract, Task Group on Lung Dynamics, Health Physics _!1, 173-207 (1966).
3. Atmospheric Visibility Related to Aerosol Mass Concentration: A Review. R.J.
Charlson, Envir. Sci. Technol. 1, 913-918 (1969)
4. Characterization of Aerosols in California (ACHEX), G.M. Hidy, et al. Final
Report, ARB Contract No. 358, Vol. I, Summary, Sept. 30, 1974, revised April,
1975.
5. Application of the Dichotomous Sampler to the Characterization of Ambient
Aerosols, T.G. Dzubay, R.K. Stevens and C.M. Peterson, in X-Ray Fluorescence
Analysis of Environmental Samples, T.G. Dzubay, ed., Ann Arbor Science, Ann
Arbor, MI, 1977, pp 95-105.
6. Size-Selective Monitoring Techniques for Particulate Matter in California Air,
W. John, G. Reischl and J.J. Wesolowski. Final Report, Interagency Agreement
ARB A5-00487, February, 1978.
7. A High-Volume Sampler for the Determination of Particle Size Distributions in
Ambient Air, D.M. Bernstein, M.T. Kleinman, I.I. Kneip, T.L. Chan and M.
Lippmann, J. Air Poll. Control Assoc. 26, 1069-1072 (1976).
8. Analysis of Respirable Fractions in Atmospheric Particulates via Sequential
Filtration, I.A. Cahill, LL. Ashbaugh, J.B. Barone, R.A. Eldred, P.J. Feeney,
R.G. Flocchini, C. Goodart, D.J. Shadoan and G.W. Wolfe, J. Air Poll. Control
Assoc. 27, 675-679 (1977).
9. A Two Stage Respirable Aerosol Sampler Using Nuclepore Filters in Series, R.D. r
\ Parker, G.H. Buzzard, T.G. Dzubay and J.P. Bell, Atmos. Envir. _!_!, 617-621
(1977).
I

10. Anomalous Filtration of Solid Particles by Nuclepore Filters, W. John, G. Reischl,
S. Goren and D. Plotkin, Atmos. Environ. _!1, 1555-1557 (1978).
11. Aerosol Filtration by Means of Nuclepore Filters: Structural and Filtration
Properties, K.R. Spumy, J.P. Lodge, Jr., E.R. Frank and D.C. Sheesley, Envir.
Sci. Technol. 1, 453-464 (1969a).
12. Aerosol Filtration by Means of Nuclepore Filters: Aerosol Sampling and Measure
ment, K.R. Spumy, J.P. Lodge, Jr., E.R. Frank and D.C. Sheesley, Envir. Sci.
Technol. 1, 464-468 (1969b).
13. Aerosol-Size Spectra by Means of Membrane Filters, 0.T. Melo and C.R. Phillips,
Envir. Sci. Technol. ~' 67-71 (1974).
14. Guide for Respirable Mass Sampling, Aerosol Technology Committee, American
Industrial Hygiene Association. Amer. Indust. Hyg. Assoc. J. l_!, 133-137 (1970).
15. Elemental Analysis of Environmental Samples, T.A. Cahill in New Uses of Ion
Accelerators, J. Ziegler, ed., Plenum Press (1975).
16. Low Reynolds Number Hydrodynamics, J. Happel and H. Brenner, 2nd revised
Edn., Noordhoff International, Leyden, The Netherlands, (1973), pp. 150-153.
17. Ibid, p. 34-
18. Generation of Monodisperse Aerosol Standards, R.N. Berglund and B.Y.H. Liu,
Envir. Sci. Technol. ]_, 147-153 (1973).
19. Size Considerations for Establishing a Standard for Inhalable Particles, F.J.
Miller, D.E. Gardner, J.A. Graham, R.E. Lee, Jr., W.E. Wilson and J.D. Bachmann,
J. Air Poll. Contr. Assoc. 29, 610-615 (1979).
20. T. Cahill, private communication.
CSC/O34-4 48

llllllll~llillllij~ij~f11111111 08688