Investigation of the Electric Field Enhanced PNA-DNA ...€¦ · Hybridization on Au Surface by...
140
Investigation of the Electric Field Enhanced PNA-DNA Hybridization on Au Surface by using Surface Plasmon Field-Enhanced Fluorescence Spectroscopy (SPFS) Dissertation zur Erlangung des Grades ‘Doktor der Naturwissenschaft’ am Fachbereich Chemie und Pharmazie der Johannes Gutenberg-Universität in Mainz Hyunpyo Jeon Geboren in Kangneung, Korea Mainz, 2011
-
Upload
dangnguyet -
Category
Documents
-
view
216 -
download
0
Transcript of Investigation of the Electric Field Enhanced PNA-DNA ...€¦ · Hybridization on Au Surface by...

Investigation of the Electric Field Enhanced PNA-DNA
Hybridization on Au Surface by using Surface Plasmon
Field-Enhanced Fluorescence Spectroscopy (SPFS)
Dissertation zur Erlangung des Grades
‘Doktor der Naturwissenschaft’
am Fachbereich Chemie und Pharmazie
der Johannes Gutenberg-Universität in Mainz
Hyunpyo Jeon
Geboren in Kangneung, Korea
Mainz, 2011


Dekan:
1. Berichterstatter:
2. Berichterstatter:
3. Berichterstatter:
Tag der mündlichen Prüfung: 04, Feb. 2011
Die vorliegende Arbeit wurde unter Betreuung von Herrn Prof. Dr. W. Knoll im Zeitraum
zwischen October 2004 bis December 2010 am Max-Planck-Institute für Polymerforschung,
Mainz, Deutschland angefertigt.


Table of contents
I
TABLE OF CONTENTS
CHAPTER 1 INTRODUCTION 1.1 Biosensor Technology 1 1.2 Surface plasmon based DNA sensor 2 1.3 Aim of the study 4 1.4 References 6
CHAPTER 2 THEORY 2.1 Surface Plasmon Resonance 8
2.1.1 Principle of Surface plasmon resonance 9 2.1.2 Prism coupler-based surface plasmons resonance 10 2.1.3 Excitation of surface plasmon 11 2.1.4 Application of SPR for analysis of biomolecules 17
2.2 Surface Plasmon Fluorescence Spectroscopy 19 2.2.1 Fluorescence 20 2.2.2 Resonance Energy Transfer 23 2.2.3 Fluorescence at the Metal/dielectric Interface 23 2.2.4 Excitation of chromophore by surface plasmon evanescent field 25 2.2.5 Quenching effect 26
2.3 Nucleic acid materials 26 2.3.1 Deoxynucleic Acid (DNA) 28 2.3.2 Peptide nucleic Acid (PNA) 30 2.3.3 Thermal stability 31
2.4 Interfacial biomolecular interaction analysis 32 2.4.1 Principle of Self-assembly 33 2.4.2 Self-assembled monolayers of alkanethiol on Au (111) 34 2.4.3 Simple Langmuir model 35 2.4.4 Langmuir adsorption isotherm 36
2.5 References 38
CHAPTER 3 EXPERIMENTAL 3.1 Instrumental 42
3.1.1 Electrode substrate for electric field applying 43 3.1.2 Sample assembly for SPFS 45 3.1.3 Electric inducing system 46
3.2 Sensor Surface 47 3.2.1 Au substrate for sensor matrix 48 3.2.2 Preparation of probe matrix for sensor 49 3.2.3 Characterization of sensor matrix by SPR 50 3.2.4 The control of PNA probe density in sequential preparation 53
3.3 Materials 55 3.4 Titration analysis of PNA/DNA hybridization 55 3.5 Kinetic analysis by SPFS 57

Table of contents
II
3.6 PNA synthesis 59 3.7 References 60
CHAPTER 4 PNA/DNA HYBRIDIZATION IN GENERAL 4.1 Motivation 61 4.2 Immobilization of PNA Probes 63
4.2.1 Sequence of Oligonucleotides 63 4.2.2 PNA probe assembly 64 4.2.3 Control of PNA density by dilution technique 66
4.3 Titration analysis of PNA/DNA hybridization in various ionic strength 67 4.3.1 Titration analysis in various ionic strength based on sequentially prepared PNA
probe 69 4.3.2 Titration analysis in various ionic strength based on sequentially prepared PNA
probe 77 4.4 Kinetic analysis of PNA/DNA hybridization in various ionic strength 84 4.5 Influence of Ionic Strength for Fluorescence Intensity 87 4.6 Fluorescence quenching 93 4.7 Conclusion 96 4.8 References 97
CHAPTER 5 ENHANCEMENT OF PNA/DNA HYBRIDIZATION BY POLARIZED ELECTRIC FIELD
5.1 Motivation 99 5.2 Electrode flow cell 101 5.3 Electrostatic properties of DNA on metal surface 102
5.3.1 Immobilization of DNA by electric field 103 5.3.2 Electric switching of DNA polyelectrolyte under polarized field 106
5.4 Influence of electric field for PNA/DNA hybridization 109 5.5 Electric field assisted enhancement of PNA/DNA hybridization 110
5.5.1 Ionic strength dependency 111 5.5.2 Electric field magnitude effect 115 5.5.3 Dependency of target ssDNA concentration 115 5.5.4 Size effect of target ssDNA 117
5.6 Kinetic analysis of PNA/DNA hybridization under electric field assistance 117 5.7 PNA/PCR hybridization enhanced by electric field 119 5.8 Conclusion 121 5.9 References 122
CHAPTER 6 SUMMARY 125
CHAPTER 7 SUPPLEMENT 8.1 Abbreviations 127 8.2 List of Figures 128 8.3 List of Tables 129

Table of contents
III
CURRICULUM VITAE
ACKNOWLEDGEMENTS


Introduction
1
CHAPTER 1
INTRODUCTION
1.1 Biosensor Technology
The definition of a biosensor is a sensing device with a biological or biologically derived
sensing element, which is integrated within or intimately associated with a physical transduser
[1].
Research in the field of biosensors has enormously increased over the recent years since
the feasibility of biosensing was first demonstrated by Leland Clark in the mid-1960s, when
he measured glucose concentration in solution using what has become known as the Clark
oxygen electrode [2-3]. The integration of the features such as high sensitivity, high
specificity, miniaturization, low cost and essentially real-time measurements for biosensors in
a variety of applications has generated intense commercial interest and potentially growing
markets.
In general, biosensors are compromised of the detector, which recognizes the physical or
chemical interaction and the transducer, which coverts the biological recognitions to a useful
electronic signal to be analyze and display in an appropriate format (Figure 1.1) [4].
Figure 1.1 A typical biosensor consists of a detector and an electronic device(transducer) that converts the biological signal into a measurable output.
Detecting system
Transducer
Display &
Analysis
lock-in amplifi

Introduction
2
A biosensor can be divided roughly into two groups. Affinity systems use antibodies,
receptors and nucleic acids to bind with the target substance. Reactions are quantified using
transducers based on electrochemical, optical, evanescent-wave and other techniques. These
biosensors pose the ability of affinity interactions to separate an individual or selected range
of compounds from complex mixtures of biomolecules on the basis of chemical or biological
function [5]. Catalytic sensors use enzymes, microorganisms, or whole cells to catalyze a
reaction with the target substance. These sensors are based on the recognition and binding of
an analyte followed by a catalyzed chemical conversion of the ananlyte from a non-detectable
form to a detectable form, which is detected and recorded by a transducer. Table 1.1 provides
compilations of the various biosensors in terms of the transduction mechanisms.
Sensor type Measurement
Amperometry (current variation) Electrochemical
Potentiometry (voltage variation)
Reflective index
Fluorescence Optical
Luminescence
Thermal Calorimetry
Quartz Crystal Microbalance Piezoelectric
Mass-surface acoustic waves
Electrical Conductivity
Table 1.1 Principal transduction systems used in biosensors [6].
Biosensor technology is having an increasing impact on manufacturing industry and there
is a significant opportunity for expansion of this potentially large market. The application in
areas where rapid detection, high sensitivity and high specificity are important should provide
a continuing driver for scientific development as well as commercialization.
1.2 Surface plasmon resonance biosensors in DNA detection
Biosensors are most promising in biomedical analysis since they can be easily integrated
within microprocessor-based electronics [7]. They allow an easy computation of signals and
in particular cases even the diagnosis of some diseases and/or functional disorders. According

Introduction
3
to biochemical reactions exploited for analyte detection, biosensors might be divided into
catalytic biosensors and affinity sensors. As the number of analytes detectable by affinity
sensor is by several orders of magnitude higher, at present affinity sensors are more important
for medical diag- nostics. The major classes of affinity sensors are: immunosensors [8], DNA
sensors [9] and molecularly imprinted polymer-based sensors [10]. The most promising are
the affinity sensors that allow direct detection of analyte binding in real time. However, the
transduction of analytical signal in this case is a challenging factor and just very few physical
methods are really applied for direct measurements of analytical signal in real time. These are
impedance spectroscopy [9], pulsed amperometric detection [10], quartz crystal
microbalances [11], surface plasmon resonance (SPR) [12] and reflectometric interference
spectroscopy [13].
Very promising in this case are SPR biosensors, since they are the most sensitive if
compared to other transduction principle-based biosensors. Moreover, SPR biosensors can be
applied for kinetic measurements of analytical signal, allowing a separate determination of the
association and dissociation rate constants and thus a more accurate characterization of the
kinetic reaction of an analyte in the sample of interest.
Over the recent years surface plasmon resonance has developed into a very useful
technology with numerous applications. Current technical achievements in SPR lead to
compete against application of immunoassays, which are commonly and widely used for
determination of numerous important substances and offer low-cost tests of high specificity
and sensitivity.
In 1982, the use of SPR for gas detection and biosensing was demonstrated by Nylander
and Liedberg [14, 15]. Liedberg et al. adsorbed an immunoglobulin G (IgG) antibody layer on
a gold sensing film, resulting in the subsequent selective binding and detection of IgG [16].
This approach has also shown promise in the real-time determination of concentration, kinetic
constants, and binding specificity of individual biomolecular interaction steps.
Biomedical applications take advantage of the exquisite sensitivity of SPR to the
refractive index of the medium next to the metal surface, which makes it possible to measure
accurately the adsorption of molecules on the metal surface and their eventual interactions
with specific ligands [17]. During the last years a tremendous development of SPR use in
biomedical applications emerged. Whilst several biosensor concepts have been developed,
affinity biosensors using SPR have the merit to be the first sensor instruments and systems to
be commercialized and hence have been made available to thousands of laboratories.

Introduction
4
The most common application of biosensing SPR instruments is the determination of
affinity parameters for biomolecular interactions [18]. Chemically similar molecules can be
detected by their biospecificity for an immobilized molecule. There is a linear relationship
between the amount of bound material and the shift of the SPR angle [19]. Any pair of
molecules, which exhibit specific binding, can be adapted to SPR measurement. These may
be an antigen and antibody, a DNA probe and complementary DNA strand, an enzyme and its
substrate, oil and a gas or liquid which is soluble in the oil, or a chelating agent and metal ion.
The technique is applied not only to the real-time measurement of the kinetics of ligand–
receptor interactions and to the screening of lead compounds in the pharmaceutical industry,
but also to the measurement of DNA hybridization, enzyme–substrate interactions, in
polyclonal antibody characterization, epitope mapping, protein conformation studies and
label-free immunoassays. Conventional SPR is applied in specialized biosensing instruments
[20-21].
SPR becomes an optical technique that use evanescence waves to measure changes in
refractive index very close to the sensor surface owing to a short range phenomenon with the
electric field decaying from hundreds of Angstroms to nanometer scale. A great deal of work
has been done in the exploitation of SPR for optical biosensing, since its first thin film
sensing was conducted in the late seventies. The enhancement in the localized field has long
been recognized and used for different spectroscopies of absorbing species, including Raman
scattering, fluorescence, nonlinear optical response, infrared-absorption and so on.
Correspondingly, the techniques are named to be surface plasmon enhanced Raman scattering
(SE-SERS), surface plasmon enhanced fluorescence spectroscopy (SPFS), surface-enhnaced
second harmonic generation (SHG) and surface-enhanced infrared absorption (SEIRA). In
addition, SPR offers a lateral resolution at the micrometer scale for thin film imaging purpose.
Surface plasmon microscopy (SPM) has been well-engineered and even commercialize. SPM
is also showing its compatibility to the biochip technology.
1.3 Aim of the study
Rapid, comprehensive and accurate detection of biomolecules is one of the most
important topics of modern biosensing and biochip technology because it has a tremendous
influence on the successful diagnostics. Today almost the entire biomedical analysis is
performed employing bioassays and/or biosensors.

Introduction
5
Recently, the surface plasmon field-enhanced fluorescence spectroscopy (SPFS) [22-23]
was developed as a kinetic analysis and a detection method with dual- monitoring of the
change of reflectivity and fluorescence signal for the interfacial phenomenon
Firstly, a fundamental study of PNA and DNA interaction at the surface using surface
plasmon fluorescence spectroscopy (SPFS) will be investigated in chapter 4. Furthermore,
several specific conditions to influence on PNA/DNA hybridization and affinity efficiency by
monitoring reflective index changes and fluorescence variation at the same time will be
considered. In order to identify the affinity degree of PNA/DNA hybridizaiton at the surface,
the association constant (kon) and the dissociation constant (koff) will be obtained by titration
experiment of various concentration of target DNA and kinetic investigation.
In chapter 5, for more enhancing the hybridization efficiency of PNA/DNA, a study of
polarized electric field enhancement system will be introduced and performed in detail. DNA
is well-known polyelectrolytes with naturally negative charged molecules in its structure.
With polarized electrical treatment, applying DC field to the metal surface, which PNA probe
would be immobilized at, negatively charged DNA molecules can be attracted by
electromagnetic attraction force and manipulated to the close the surface area, and have more
possibility to hybridize with probe PNA molecules by hydrogen bonding each corresponding
base sequence. There are several major factors can be influenced on the hybridization
efficiency.

Introduction
6
1.4 References
[1] Collings, A. F. & Caruso, F. Biosensors: recent advances. Reports on Progress in Physics, 1997, 60, 1397-1445.
[2] Clark, L. C.; Lyons, C. Ann. N.Y. Acad. Sci., 1962, 102, 29–45.
[3] Van den Berg, A., Lammerink, T. S., J. Top. Curr. Chem., 1997, 194, 21-49
[4] McFadden, P. BIOSENSORS: Broadband Biodetection: Holmes on a Chip. Science, 2002, 97, 2075-2076.
[5] Rogers, K. R. Handbook of biosensors and electronic noses: Medicine, Food, and the Environment, CRC Press Inc.: Boca Raton, 1997.
[6] Pearson, J. E., Gill, A. & Vadgama, P. Analytical aspects of biosensors. Annals of Clinical Biochemistry, 2000, 37, 119-145.
[7] Ramanaviciene A, Ramanavicius A. Application of polypyrrole for the creation of immunosensors. Crit. Rev. Anal. Chem., 2002, 32, 331-6.
[8] Ramanaviciene A, Vilkanauskyte A, Acaite J, Ramanavicius A. Application perspectives of conducting polymers in electrochemical immunosensors (Review). Acta Medica Lituanica, 2000, 5, 49-59.
[9] Ramanaviciene A, Ramanavicius A. Pulsed amperometric detection of DNA with an ssDNA/polypyrrole modified electrode. Anal. Bioanal. Chem., 2004, 379, 287-93.
[10] Ramanaviciene A, Ramanavicius A. Molecularly imprinted polypyrrole-based synthetic receptor for direct detection of bovine leukemia virus glycoproteins. Biosens. Bioelectron., 2004, 20, 1076-82.
[11] Ramanaviciene A, Stalnionis G, Ramanavicius A. Piezoelectric affinity sensor for detection of bovine leukaemia. Biologija 2004, 1, 33-5.
[12] Hahnefeld C, Drewianka S, Herberg FW. Determination of kinetic data using surface plasmon resonance biosensors. Methods Mol. Med., 2004, 299-320.
[13] Hanel C, Gauglitz G. Comparison of reflectometric interference spectroscopy with other instruments for label-free optical detection. Anal. Bioanal. Chem. 2002, 372, 91-100.
[14] Nylander C, Liedberg B, Lind T. Gas detection by means of surface plasmons resonance. Sens. Actuat. A., 1982, 3, 79-88.
[15] Liedberg B, Nylander C, Lundstrom I. Biosensing with surface plasmon resonance-how it all started. Biosensors Bioelectron, 1995, 10, i-ix.
[16] Liedberg B, Nylander C, Lundstrom I. Surface plasmon resonance for gas detection and biosensing. Sens. Actuat., 1983, 4, 229-304.
[17] Englebienne P, Van Hoonacker A, Verhas M. Surface plasmon resonance: principles, methods and applications in biomedical sciences. Spectroscopy, 2003, 17, 255-73.
[18] Phizicky EM, Fields S. Protein-protein interactions: methods for detection and analysis. Microbiol. Rev., 1995, 59, 94-123.

Introduction
7
[19] Stenberg E, Persson B, Roos H, Urbaniczky C. Quantitative determination of surface concentration of protein with surface plasmon resonance using radiolabeled proteins. J. Coll. Interface. Sci., 1991, 143, 513-26.
[20] Thiel AJ, Frutos AG, Jordan CE, In situ surface plasmon resonance imaging detection of DNA hybridization to oligonucleotide arrays on gold surfaces. Anal. Chem., 1997, 69, 4948-56.
[21] Herberg F. W., Biomedical application of surface plasmon resonance biosensors, Acta Medica Lituanica, 2005, 12, 3, 1-9.
[22] Liebermann, T., Knoll, W. Colloid Surf. A., 2000, 171, 115-130.
[23] Hegner, M., Wagner, P., Semenza, G., Surf. Sci., 1993, 291, 39.

Theory and Background
8
CHAPTER 2
THEORY AND BACKGROUND
2.1 Surface Plasmon Resonance (SPR)
In the late sixties, optical excitation of surface plasmons, initially described by Wood [1],
by the method of attenuated total reflection was demonstrated by Kretschmann [2] and Otto
[3]. Since then, surface plasmons have been intensively studied and biosensing have been
assessed [4-12]. Surface plasmon resonance is a charge-density oscillation that may exist at
the interface of two media with dielectric constants of opposite signs, for instance, a metal
and a dielectric. It provides a means not only for identifying energetics and quantifying their
equilibrium constants, kinetic constants and underlying energetics, but also for employing
them in very sensitive, label-free biochemical assay.
Figure 2.1. Most widely used configuration of SPR sensors: (a) prism coupler-based SPR system (ATR method); (b) grating coupler-based SPR system; (c) optical waveguide-based SPR system.

Theory and Background
9
2.1.1 Principle of surface plasmon resonance
Surface plasmon resonance is a charge-density oscillation that may exist at the interface of
two media with dielectric constants of opposite signs, for instance, a metal and a dielectic.
The charge density wave is associated with an electromagnetic wave, the field vectors of
which reach their maxima at the interface and decay evanescently into both media. This
surface plasmon resonance (SPR) is a TM-polarized wave (magnetic vector is perpendicular
to the direction of propagation of the SPR and parallel to the plane of interface). The
propagation constant of the surface plasma wave propagating at the interface between a semi-
infinite dielectric and metal is given by the following expression:
where k denotes the free space wave number, m the dielectric constant of the metal (m =
mr + imi ), and ns the refractive index of the dielectric [6]. As may be concluded from Eq. (1),
the SPR may be supported by the structure providing that 2sm n . At optical wavelengths,
this condition is fulfilled by several metals [13] of which gold and silver are the most
commonly used. Owing to high loss in the metal, the SPR propagates with high attenuation in
the visible and near-infrared spectral regions. The electromagnetic field of an SPR is
distributed in a highly asymmetric fashion and the vast majority of the field is concentrated in
the dielectric. An SPR propagating along the surface of silver is less attenuated and exhibits
higher localization of electromagnetic field in the dielectric than an SPR supported by gold.
The resonance condition that permits energy transfer from photons to plasmons depends
upon a quantum mechanical criterion related to the energy and momentum of the photons and
plasmons. For a flat metal surface, there is no wavelength of light that satisfies this constraint.
Hence, there can be no surface plasmon resonance. However, there are three configurations of
SPR devices that alter the momentum of photons in a way that fulfils the resonance criterion,
named prisms, gratings and optical waveguide-based SPR system ( Figure 2.1.). All three
have been used to generate SPR.
Generally, an SPR optical sensor comprises an optical system, a transducing medium
which interrelates the optical and (bio)chemical domains, and an electronic system supporting
the optoelectronic components of the sensor and allowing data processing. The transducing
medium transformes changes in the quantity of interest into changes in the refractive index
2
2
sm
sm
nnk
(1)

Theory and Background
10
which may be determined by optically interrogating the SPR. The optical part of the SPR
sensor contains a source of optical radiation and an optical structure in which SPW is excited
and interrogated. In the process of interrogating the SPR, an electronic signal is generated and
processed by the electronic system. Major properties of an SPR sensor are determined by
properties of the sensor’s subsystems. The sensor sensitivity, stability, and resolution depend
upon properties of both the optical system and the transducing medium. The selectivity and
response time of the sensor are primarily determined by the properties of the transducing
medium [10-12, 14-22].
2.1.2 Prism coupler-based surface plasmon resonance
Particularly the Kretschmann geometry of ATR method has been found to be very suitable
for sensing and has become the most widely used geometry in SPR sensors. In this
configuration a light wave is totally reflected at the interface between a prism coupler and a
thin metal layer (of the thickness of about 50 nm) and excites an SPW at the outer boundary
of the metal by evanescently tunneling through the thin metal layer.
In TIR, the reflected photons create an electric field on the opposite site of the interface.
This field is called evanescent wave because it decays exponentially with distance. The
evanescent wave optics is a number of optical phenomena and techniques associated with the
total internal reflection of light at the boundary between two media of different optical
properties with their different dielectric functions, i. A plane wave, e.g. from a laser light
source (wavelength, ) impinging upon that interface from the glass side, i.e. from the side of
the material with the higher refractive index, ppn , will be totally (internally) reflected if
the angle of incidence exceeds a critical value θc.
Figure 2.1 shows a typical evanescent excitation. At incident angles smaller than θc, most
of the incoming light is transmitted and hence the reflected intensity is low. As one
approaches θc, however, the reflectivity R reaches unity. θc is given by Snell’s law and
depends on the refractive indices of the two media. In the case of a glass/water interface, one
obtains p
dc n
nsin with ppn being the refractive index of the water. Beyond the
critical angle, the electric field distribution in the vicinity of the interface does not fall
abruptly to zero but instead there is a harmonic wave that travels parallel to the surface with

Theory and Background
11
amplitude that decays exponentially. The penetration depth, l, of this wave is given by the
following equation:
This propagating electromagnetic field distribution is called an evanescent wave.
Ө
Varying Ө
Metal (m)Surface plasmon~~~~
Ө
R
Өc Өm
1
Ө
R
0
1
Өc
Prism (p)
D ielectric (d )
Ө
Varying Ө
Incidence , Reflection
Evanescent wave
(a) (b)
Prism (p)
D ielectric (d )
Ө
Varying Ө
Metal (m)Surface plasmon~~~~~~~~~~~~~~~
Ө
R
Өc Өm
1
Ө
R
Өc Өm
1
Ө
R
0
1
Өc Ө
R
0
1
Өc
Prism (p)
D ielectric (d )
Ө
Varying Ө
Incidence , Reflection
Evanescent wave
(a) (b)
Prism (p)
D ielectric (d )
Figure 2.2. (a) Total internal reflection of a plane wave of wavelength and intensity Iin at a glass prism with p in contact with a dielectric medium of d < p. The reflected light is monitored with a detector. For incident angles θ > θc, the critical angle for total internal reflection, the evanescent field at the interface decays exponentially into the dielectric. (b) Attenuated total internal reflection (ATR) construct for surface plasmon excitation in the Kretschmann geometry. A thin metal film is evaporated onto the prism and acts as a resonator driven by the photon field incident at an angle θ. Note the decreasing of reflectivity until an angle θm, where maximum coupling of the surface plasmon in surface plasmon spectroscopy.
2.1.3 Excitation of surface plasmons
The prism is coated with a thin gold film on the reflection site. When the energy of the
photon electrical field is just right it can interact with the free electron constellations in the
gold surface. The surface plasmon phenomenon exists when polarized light reaches the
cn
l
,
1)sin(2 2 (2)

Theory and Background
12
interface between a thin metal film and a high density medium in Kretschmann geometry. The
electric field within the light causes oscillation of the electrons in the dielectric material. This
oscillation produces evanescent waves that are non-propagating spatially decaying fields, in
turn causing oscillations in the free delocalized electron density of the metal called surface
plasmons [1-4, 23] (Figure 2.2 (b) and Figure 2.3). The metal acts as an oscillator by the free
electron gas in the metal film, leading to resonant excitation by a coupling between the
electron oscillation and the incident light. This resonant excitation of a coupled state is called
plasmon surface polaritons (PSPs). Due to the resonance coupling, the electric field at the
interface is enhanced by about 15-20 times in case of gold and about 80 times in the case of
silver film [23].
An interface is demonstrated in the xy-plane between two half-infinite spaces, 1 and 2, of
materials the optical properties of which are described by their complex frequency-dependent
dielectric functions (Figure 2.3). Ignoring magnetic materials, surface polaritons can only be
excited at such an interface if the dielectric displacement D
of the electromagnetic mode has
a component normal to the surface can induce a surface charge density σ,
The Maxwell equations are given by
with c being the speed of light in vacuum, /1c . is a magnetic permeability.
The electrical field, E
in case of plane waves, is presented by
4)( 12 zDD
(3)
0 H
, (4)
0 E
, (5)
01
t
Hc
E
,
(6)
0
tE
cH
(7)
)(0
trkieEE (7)

Theory and Background
13
where 0E
is the electric field amplitude, r is a position vector, is the angular frequency
(=2f, f=frequency), t is a time, and k
is the wavevector which is in direction of the
propagation.
S-polarized (transversal electric, TE) light propagate along the x-direction with only
electric field components, )0,,0( yi EE
, parallel to the surface, hence, is unable to excite
surface polaritons. Only p-polarized light (transversal magnetic, TM) modes with electric
field, ),0,( zx EEE or, magnetic field, )0,,0( yHH
, can couple to such modes.
Considering the dielectric ( 01 , medium 1)/metal ( ''' 222 i , medium 2) interface,
the electromagnetic fields are expressed by:
Both fields E
and H
have to be equal at the interface, i.e.
and
From Equation 10 it follows xxx kkk 21 . Inserting from the equation 8 into 6 and 9
into 6, one obtains:
and
This leads to the only nontrivial solution if:
)(11
)(111
11
11
)0,,0(
),0,(tzkxki
y
tzkxkizx
zx
zx
eHH
eEEE
, Z>0 (8)
)(22
)(222
22
22
)0,,0(
),0,(tzkxki
y
tzkxkizx
zx
zx
eHH
eEEE
, Z<0 (9)
21 xx EE
(10)
21 yy HH
. (11)
1111 xzz Ec
Hk (12)
2222 xzz Ec
Hk . (13)
2
1
2
1
z
z
kk
. (14)

Theory and Background
14
This indicates that surface electromagnetic modes can only be excited at interfaces
between two media with dielectric constants of opposite sign with the interface between a
metal ( mmm i ~ ) and a dielectric material ( dd id ~ ) by coupling the collective
plasma oscillations of the nearly free electron gas in a metal to an electromagnetic field [24].
These excitations are called plasmon surface polaritons (PSP) or surface plasmons. From the
equations 8, 9, 12, and 13 one obtains the dospersion relation of PSP:
or
The dispersion relationship is obtained (i.e. the energy momentum relation) for surface
plasmons at a metal/dielectric interface:
The PSP modes propagating along a metal/dielectric interface exhibit a finite propagation
length, Lx, given by xx kL 2/1 . This decay has a strong impact on lateral resolution that we
want to obtain in the characterization of laterally structured samples investigated with
plasmon or waveguide light in a microscopic applications [25].
In the frequency (spectral) range of interest we have:
The surface plasmon is a bound, non-radiative evanescent wave with field amplitude, the
maximum of which is at the interface (z=0) and which is decaying exponentially into the
dielectric (and into the metal). The mode is propagating as a damped oscillatory wave (Figure
2.2). All parameters characterizing the properties of PSPs can be quantitatively described on
the basis of the dielectric functions of the involved materials.
dzdx ckk
222
(15)
22
xdzd kc
k
.
(16)
)( dm
dmx c
k
. (17)
ddm
dm
)(.
(18)

Theory and Background
15
Dielectric (s)
Metal (m)
X
Evanescent wave
++ - - + + - - + +~~~~Plasmon
EzZDielectric (s)
Metal (m)
X
Evanescent wave
++ - - + + - - + +~~~~Plasmon
Ez
Dielectric (s)
Metal (m)
X
Evanescent wave
++ - - + + - - + +~~~~~~~~Plasmon
EzZ
Figure 2.3. Schematic drawing of the charges and the electromagnetic field of surface plasmons propagating on a surface in the x-direction at the interface between a metal and a dielectric media. The electric field along z-direction decay exponentially, here shown for the Ez component.
The dispersion relation of a free photon in a dielectric (d) is
which is always smaller than the momentum of a surface plasmon mode, ksp, propagating
along an interface between that same medium and the metal (see Figure 2.3 (a)). The
dispersion of photons is described by the light line, phd kc (Figure 2.3 (b)), with
dd cc / .
For the excitation of surface plasmons, the optical momentum at the surface could match
by prism coupling. The dispersion curves before and after enhancement by the prism are
shown as curve (1) and (2) in Figure 2.3 (b)
The PSP dispersion curve (gray curve (3) in Figure 2.3 (b)) asymptotically reaches the
light line, whereas for higher energies it approaches the cutoff angular frequency
determined by the plasma frequency of the employed metal, p :
dph ck
, (19)
d
p
1.
(20)

Theory and Background
16
Figure 2.4. (a) Momentum relation between a surface plasmon, spk
, propagating along x
and a photon, phk
, incident at the metal/ dielectric interface at an angle θ. |||| spsp kk
. (b) Dispersion relation of a photon traveling as a plane wave in the dielectric medium, of a photon propagating in the prism, and of the surface plasmonmode propagating along the metal/dielectric interface. (c) Wavevector matching condition for the resonsnt coupling of photons traveling in the prism at the incident angle θ0.
Photons are not coupled directly to the metal/dielectric interface, but via the evanescent
tail of light totally internally reflected at the base of a high-index prism (with dp ). This
light is characterized by a larger momentum (Figure 2.3 (b), dashded line) that for a certain
spectral range can exceed the momentum of the PSP to be excited at the metal surface. So, by
choosing the appropriate angle of incidence θ0 (point 0 in Figure 2.3 (b)), resonant coupling
between evanescent photons and surface plasmons can be obtained. The corresponding
momentummatching condition is schematically given in Figure 2.3 (c).
This resonant coupling is observed by monitoring, as a function of the incident angle, the
laser light of energy L that is reflected by the base of the prism, which shows a sharp
minimum (see also θm in Figure 2.1 (b),). This configuration is the need to get the metal
surface close enough to the prism base, typically to within ~200 nm. Even a few dust particles
can act as spacers, thus preventing efficient coupling [26].
The surface plasmon spectroscopy is based on the configuration introduced by
Kretschmann and Raether [19]. Qualitatively, the angular dependence of the reflectivity can
be simulated by Fresnel’s equations for the layers of glass/metal-layer/dielectric.
X
0
Z
psx
ph kk
pphk
(c)
X
0
Z
psx
ph kk
pphk
X
0
Z
psx
ph kk
pphk
(c)
X
Z
Metal
Dielectric
spk
phk
(a)
X
Z
Metal
Dielectric
spk
phk
(a)
kph
0Laser
phd
kc
php
kc
(3) PSP dispersion curve
dm
dmph
d
kc
x
(1) Free photons in dielectric (2) Coupling with prism
(b)
kph
0Laser
phd
kc
php
kc
(3) PSP dispersion curve
dm
dmph
d
kc
x
(1) Free photons in dielectric (2) Coupling with prism
(b)

Theory and Background
17
2.1.4 Application of SPR for analysis of biomolecules
The first application of SPR to biosensing was demonstrated in 1983. Since then, the
detection of biospecific interaction was developed by also some other groups [27-30]. In 1994
the first survey on real-time biospecific interaction analysis methods appeared which have
since been frequently used and constantly improved for examination of kinetic and
thermodynamic constants of biomolecular interactions. SPR can be used as a sensor which is
capable of sensitive and quantitative measurement of a broad spectrum of chemical and
biological adsorption. It offers a number of important practical advantages over analytical
techniques. A sensor format may be used for immunological, nucleic acid binding, enzymatic,
chemical, and gas adsorption. Some of the potential areas of application include medical
diagnostics, environmental monitoring, agriculture pesticide and antibiotic monitoring, food
additive testing, military and civilian airborne biological and chemical agent testing, and real
time chemical and biological production process monitoring. In direct SPR biosensors, the
analyte quantification is carried out by direct detection of the binding reaction, however, the
increase in the refractive index produced by the adsorption of small molecules may not be
sufficient to be detected directly, and sandwich or assay methods may need to be used. The
following main detection approaches have been commonly used in SPR sensor:
(1) measurement of the intensity of the optical wave near the resonance
(2) measurement of the resonant momentum of optical wave including angular and wave
length interrogation of SPR
During a binding analysis SPR changes occur at a sensor chip. To perform an analysis, the
sensor surface is faced to one wall of a flow cell (Figure 2.4 (b)). Sample containing analyte is
injected over this surface in a precisely controlled flow. The binding events are detected as
changes in the particular angle where SPR creates extinction of light. This change is measured
continuously to form a sensorgram, which provides a complete record of the progress of
association or dissociation of the interactants.
The deposition of an ultrathin layer of a material with an index of refraction
layerlayern larger than that of the ambient dielectric, e.g. air n=1, for a surface plasmon
mode is equivalent to an increase of the overall effective index integrated over the evanescent

Theory and Background
18
field. The net effect is a slight shift of the dispersion curve corresponding to an increase of ksp
for any Laser. This is depicted in Figure 2.4 (a) (dashed curve labeled PSP2). As a
consequence, the angle of incidence that determines the photon wave vector projection along
the PSP propagation direction has to be slightly increased (from 1 and point 1 on curve PSP1
to 2 and point 2 on curve PSP2 in Figure 2.4) in order to again couple resonantly to PSP
modes [31].
kph
1 2Laser
(a)
k1ph k2
ph
1 2
∆
PSP2
PSP1
Ө
Ө
(b)
Prism
Polarized light Reflected light
Y YSensor surface
Flow system
Y Y
Ө
R
Өc Ө1
1
(c)
Ө2
Kinetic Exp. @ Өk
Өk
R2
R1
∆ R
time
R1
(d)
R2
R1
∆ R
x x
(1)(2)
kph
1 2Laser
(a)
k1ph k2
ph
1 2
∆
PSP2
PSP1
Ө
Ө
(b)
Prism
Polarized light Reflected light
Y YSensor surface
Flow system
Y Y
Ө
R
Өc Ө1
1
(c)
Ө2
Kinetic Exp. @ Өk
Өk
R2
R1
∆ R
Ө
R
Өc Ө1
1
(c)
Ө2
Kinetic Exp. @ Өk
Өk
R2
R1
∆ R
time
R1
(d)
R2
R1
∆ R
time
R1
(d)
R2
R1
∆ R
x x
(1)(2)
Figure 2.4. (a) Diserpersion relation, w vs. spk , of plasmon surface polaritons (PSP) at a metal/dielectric interface before (gray plot, PSP1) and after (gray dashed plot, PSP2) the adsorption of an analyte layer. Laser light of energy Laser couples at angles θ0 and θ1, given bt the energy and momentum matching condition (see the intersection of the horizontal line at Laser with the two dispersion curves). (b) Schematic drawing of analytical experiment in flow system using SPR (c) Reflectivity curves (angular scans) of surface plasmon spectroscopy before (1) and after (2) binding of analyte on the sensor surface. (d)The corresponding kinetic mode recording the reflected intensity at a fixed angle (normally 30% of reflectivity because this liner region is sensitive and reliable) of incidence as a function of time.

Theory and Background
19
A p-polarized laser beam of wavelength, on the noble-metal-coated base of the prism is
reflected, and the intensity of the reflected light is monitored with a detector as a function of .
A typical reflectivity scan-curves are given in Figure 2.4 (c). The curve labeled (1) in Figure
2.4 (c) was taken in water on a bare Au-film evaporation-deposited onto the prism base. For
< c the reflectivity is rather high compared to the total internal reflection discussed in Figure
2.1 (a) because the evaporated metal layer acts as a mirror with little transmission. The
deposition of an ultrathin analyte layer from solution to the Au-surface results in a shift of the
dispersion curve for PSP running along this modified interface and hence in a shift of the
resonance angle (from 1 to 2, see Figure 2.4 (a) and (c)).
The angular dependence of the overall reflectivity can be computed and compared with
the measured curves (Figure 2.4 (c)). If the refractive index (n) of the material is known, the
geometrical thickness (d) can be determined by the resonance angle shift:
During the interaction between the surface and analyte, the binding kinetics can be
measured with changes of reflectivity at fixed angle, k as a function of time (Figure 2.4 (d)).
2.2 Surface Plasmon Fluorescence Spectroscopy
Fluorescence techniques have been widely applied for chemical, physical, biological and
clinical purposes. The technique offers extremely high sensitivity and even becomes the
mainstream technique to achieve single molecule analysis. Fluorescence resonance energy
transfer (FRET), as an important phenomenon, has been widely applied for understanding the
microscopic/nanoscopic functions of microorganisms/proteins in living cells, as well as for
realizing elegant analytical modes, such as the molecular beacon. A number of molecular
processes can be observed by monitoring their influence on a fluorescent probe during the
fluorescence lifetime, which is typically in the range of 10 ns.
Several photophysical parameters of fluorescent probes have been exploited to monitor
analyte binding events. These include fluorescence polarization [32], fluorescence quenching
[33,34], fluorescence enhancement [33] and resonant energy transfer (RET) [35,36].
Combining one of these fluorescence schemes with other optical or electrical detection
∆ dn . (21)

Theory and Background
20
methods of interest can lead to an improvement in the sensitivity and detection limit of these
methods.
As a combination of SPR and fluorescence technique, surface plasmon fluorescence
spectroscopy (SPFS) was recently introduced [37-39], which uses greatly enhanced
electromagnetic field obtained at the surface plasmon resonance to excite the fluorescent dyes
in the vicinity of the metal/dielectric interface. Most of the intriguing features of fluorescence,
such as high-sensitivity, multiplexing detection, can be directly inherited by SPFS. With a
lower limit for a reliable signal detection corresponding to an effective layer of about 0.1-0.2
nm, SPR has generated a sufficient signal-to-noise level allowing for a detailed kinetic
analysis and determination of binding kinetics.88 However, problems arise if only a very
dilute lateral packing of the proteins can be achieved or if very small analytes of low
molecular weight are to be detected, resulting in angular shifts too low to be observed.89
Therefore, the concept of SPFS combining surface plasmon spectroscopy with fluorescence
label techniques is developed to enhance the signal response of the interfacial binding
events.SPFS has become a very powerful tool for detection and quantitative evaluation of
interfacial binding reaction.
2.2.1 Fluorescence
The absorption of electromagnetic radiation is a universal property of matter. If light in
the ultraviolet/visible part of the electromagnetic spectrum is passed through a sample in
solution, some light energy may be absorbed. Any molecule absorbs light in some wavelength
range. However, for any selected wavelength, certain types of chemical groups usually
dominate the observed spectrum. These groups are called chromophors.
The electronic transitions are restricted by spin selection rules. In the electronic ground
state of a molecule the orbitals of lowest energy are usually occupied by two electrons.
According to Pauli’s principle, the spins of the two electrons that occupy the same orbital
must be antiparallel i.e., the electrons are paired and the intrinsic angular momenta (spins) of
the electrons add to give a resultant spin of zero. These states are characterized by a total spin
quantum number S=0, which has a multiplicity 2S + 1 = 1 and are called singlet (S) states.
Another important configuration is the triplet state (T) in which the electrons have parallel
spins leading to a spin quantum number 1 and multiplicity 2S + 1 = 3. Transitions between
energy states and hence their lifetimes, are governed by selection rules. For a spin allowed
transition, S = 0, which means that the multiplicity must be conserved. A change in

Theory and Background
21
multiplicity i.e., a spin forbidden transition (triplet to singlet state) can occur by a strong
internal magnetic field arising from the orbital movement of electrons. This spin-orbit
interaction becomes more effective when atoms with higher nuclear charge are introduced in a
molecule, such as halogens, metals, sulfur or phosphorus.
All processes that involve the emission of electromagnetic radiation are called
luminescence which is of two types (Figure 2.5): Fluorescence and Phosphorescence,
depending upon the nature of the ground and excited states. Fluorescence is the emission
which results from the transition between singlet states. These high emissive rates result in
fluorescence lifetimes of nearly 10-8 s (10 ns). Phosphorescence is the emission which results
from transition between states of different multiplicity, generally a triplet excited state
returning to singlet ground state. Such transitions are not allowed and emissive rates are very
low. Typical phosphorescent lifetimes range from milliseconds to seconds.
S0
S1‘ S1
hEX hEM
Excitation
Radiationless energy loss
Emission Energy transfer
Internal convertion
Figure 2.5. Jablonski diagram illustrating the electronic and vibrational states of a fluorophore and process during photon adsorption and fluorescence emission
The absorption and emission of light is illustrated by the energy level diagram suggested
by Jablonski. The diagram shows the excitation of an electron from the electronic-vibrational
ground state S0 to excited states S1, S2 … which are characterized by different electronic
energies and by different vibrational states of the molecule. The absorption to a triplet state is
forbidden as a consequence of quantum theory, because it would require a reversal of the
electron spin. Such a spin reversal in the transition from the ground state (S0T1) is very
improbable since the antiparallel electrons are strongly coupled to the ground state.

Theory and Background
22
Upon excitation, electrons in ground state absorb a photon and jump to higher vibrational
energy levels of the excited singlet state. The transition from S0 to higher excited levels Sn is
responsible for the visible and ultraviolet absorption spectra observed. The absorption of
photon is highly specific and it takes place in about 10-15 second. This time is too short for
any significant displacement of nuclei (Frank-Condon principle).
Excitation is followed by a return to the lower vibrational levels of the excited state. With
a few rare exceptions, generally all molecules rapidly relax to the lowest vibrational level of
S1. This process is called internal conversion and occurs in about a picosecond (10-12 s).
Typical values of excited-state lifetimes are in the range of nanoseconds (10-9 s). Thus the
internal conversion is generally complete before emission takes place. The result is that all
observed fluorescence normally originates from the lowest vibrational level of the lowest
excited singlet state. This means that the spectrum of the emitted light should be independent
of the excitation wavelength.
From the excited singlet state, the chromophore (chromophore that can fluoresce, also
called fluor) returns to the electronic ground state with the emission of the photon. However,
the state to which the chromophore decays are not always the lowest vibrational state of the
ground state, but it is an equilibrium distribution of vibrational levels. An interesting
consequence of these considerations is that the absorption spectrum of the molecule reflects
the vibrational levels of the electronically excited states and the emission spectrum reflects
the vibrational levels of the ground electronic state.
The quantum yield, Q is calculated by:
Q is a measure of a molecule’s probability of fluorescence following excitation and takes
values in the range 0 to 1. Under a given set of conditions, Q will usually have a fixed value
for a particular chromophore. Molecules with larger quantum yields exhibit stronger
fluorescence. The quantum yield is a parameter which depends on the immediate environment
of the chromophore.
The number of excited molecules at the exciting wavelength e is proportional to the
number of photons absorbed i.e., proportional to (I0-I) where I0 is the incident intensity and I
is the transmitted intensity. The Beer-Lambert law can be rewritten as,
absorption of Ratecefluorescen of Rate
absorbed photons ofNumber emitted photons ofNumber Q .
(22)

Theory and Background
23
where (e) is the extinction coefficient at the exciting wavelength, e. The concentration of
the absorbing molecules is c and l is the path length.
2.2.2 Resonance Energy Transfer
Since chromophore has characteristic optical values in both its absorbance and emission
spectra, it is possible to establish an experiment in which the emission of one chromophore
(A) overlaps with the absorbance of a second chromophore (B). If these separate
chromophores have unique locations in a protein or macromolecular complex, it is possible
for emission light energy from chromophore A to be absorbed by chromophore B and to be
emitted as part of B’s emission spectrum. This phenomenon is called resonance energy
transfer and since it is strongly dependent on the distance, R, between the chromophores, it
may be used to measure distances in proteins, membranes and macromolecular assemblies
especially in the range of 10-80 Å. The efficiency of the energy transfer, E called Förster
transfer depends on the distance R between the two chromophores.
The efficiency of energy transfer, E is expressed as following:
where R is the distance between the donor and acceptor molecules and R0 is a constant related
to the donor-acceptor pair which can be calculated from their absorption and emission spectra.
2.2.3 Fluorescence at the Metal/dielectric Interface
A chromophore is excited by either direct illumination or evanescent surface plasmon
fields in front of a planar metallic surface. Since the metal film serves as a mirror the reflected
field interferes with the emitting dipole. If the reflected field is in phase with the dipole
oscillations, it will be excited by the reflected electromagnetic wave. The dipole will be
driven harder and consequently the emission will be enhanced. If the reflected field is out of
phase, the emission will be hindered. Thus, the dipole can be considered as a forced, damped,
dipole oscillator [40]: it is forced in the way that the field reflected by the boundary provides
a driving term for the oscillation of the dipole and it is damped because the oscillator radiates
lceeII )(0
(23)
660
60
RRR E
(24)

Theory and Background
24
power. With increasing distance between the dipole and the metal surface the phase difference
between incident and reflected light alters, which results in an oscillating emission rate of the
dipole. Furthermore, with increasing distance of the dye to the metal the strength of the
oscillation will decrease. The radiation field of the dipole at the surface weakens with
increasing distance to the surface and thus the strength of the reflected field will also decrease.
In addition strong quenching of the fluorescence light was found for small emitter-surface
separations. Figure 2.7 summarizes the fluorescence according to the distance dependent [41].
Figure 2.6. Schematic of fluorescence near metallic surfaces at different distance from metal to chromophors. (A) Non-radiative transition and exciton coupling, (B) coupling to surface plasmon modes, (C) emission of photons.
If the chromophore is very close to the metal within 10 nm (Figure 2.7 (A)), a substantial
de-excitation (radiation-less) with corresponding reduction of radiative lifetime and the
fluorescence intensity is found. The fluorescence is quenched dissipating the excitation
energy in the metal as heat.
In an intermediate distance (<20 nm, Figure 2.7 (B)), the optically excited chromophores
can couple back effectively to surface plasmon polaritons, by fulfilling momentum-matching
conditions. However, some of the excitation energy is dissipated in the chromophore. The
corresponding back-coupled surface plasmon is red-shifted relative to the excitation and re-
radiates (dashed arrows) via a prism at a slightly smaller angle.
At sufficient separation distances (>20 nm, Figure 2.7 (C)), free emission of the
chromophore dominates. The fluorescence yield depends on the intensity of evanescent field
which is decreased exponentially as the distance increases and the fluorescence emission
oscillates reflected from metal.
Metal
Pris m
Water
Dye
Dis
tanc
e d
(A)(B)
(C)
Metal
Pris m
Water
Dye
Dis
tanc
e d
(A)(B)
(C)

Theory and Background
25
2.2.4 Excitation of chromophore by surface plasmon evanescent field
The surface plasmon evanescence field can be used to excite the chromophore within the
vicinity of the interface. The emitted fluorescence is a strong function of the optical
evanescent field at a given wavelength and the probability of the radiative decay of the
chromophor from its excited to the ground state. The optical excitation of the chromophore
follows the strength of the evanescent field and since the strength of evanescent field is
maximum near the resonance angle, a characteristic increase in the fluorescence signal is
observed, which reaches its peak near the resonance angle and then starts decaying as the
system moves away from resonance. The peak fluorescence intensities are observed at a
slightly lower angle than the actual resonance angle due to certain phase modulations
introduced by the nature of the PSP excitation.
Figure 2.7. Fluorescence scan curves (a) and corresponding fluorescence kinetics (b) before (1) and after (2) adsorption of fluorescent labelled analyte onto the sensor surface. Due to the low molecular weight of the analyte change in reflectivity is not significant (∆R), while the excited fluorescence causes a clear signal difference (∆F) in both scan and in the kinetics.
It has been shown that chromophores close to the metal surface experience this enhanced
evanescent plasmon field and consequently will be excited resonantly [42-45]. Such
excitation of fluorescence via surface plasmons has been observed for planar systems using
prism coupling [46] as well as for grating coupling [47]. Only a few studies are know which
use the surface sensitive enhancement for sensing purposes [36,47] As discussed in chapter
2.1 the evanescent field decays exponentially into the dielectric layer adjacent to the metal
film. The penetration depth into the dielectric, at which the surface field intensity drops down
Ө
R (a) Kinetic Exp. @ Өk
Өk
R2R1 ∆ R
time
R, F(b)
R2R1, F1
F
F1
F2
∆ F
F2
(1)
(2)
(1)
(2)
Ө
R (a) Kinetic Exp. @ Өk
Өk
R2R1 ∆ R
time
R, F(b)
R2R1, F1
F
F1
F2
∆ F
F2
(1)
(2)
(1)
(2)
Ө
R (a) Kinetic Exp. @ Өk
Өk
R2R1 ∆ R
time
R, F(b)
R2R1, F1
F
F1
F2
∆ F
F2
(1)
(2)
(1)
(2)

Theory and Background
26
to 1/ of the interface value, is in the order of the used wavelength. Thus, surface sensitive
fluorescence measurements are possible, since only dyes in the proximity to the metal film
contribute significantly to a measurable signal. Chromophores further away from the metal
surface cannot be excited due to a negligible evanescent field.
In cases where SPS alone is not sensitive alone to detect the adsorption of low molecular
fluorescent dyes, a theoretical calibration approach is rather difficult. However, the difference
between the observed fluorescence increase during the adsorption of the labelled analyte and
the virtually unchanged reflectivity demonstrates the sensitivity enhancement of surface
plasmon spectroscopy (SPS) by the additional fluorescence detection in SPFS (Figure 2.6).
2.2.5 Fluorescence Quenching
Information about the properties of macromolecules and their interactions with other
molecules can be obtained from studies of the fluorescent spectra. There are many
environmental factors that affect fluorescent efficiency. Only a proportion of the light energy
originally absorbed is emitted as radiation, since some energy may be lost in vibrational
transitions. Two further processes can diminish or quench the amount of light energy emitted
from the sample. Internal quenching is due to some intrinsic structural feature of the excited
molecule involving, for example, structural rearrangement. External quenching arises either
from interaction of the excited molecule with another molecule present in the sample or
absorption of exciting or emitted light by another chromophore present in the sample. All
forms of quenching result in a non-radiative loss of energy. External quenching may be due to
contaminants present in the preparations. Hence great care must be taken in carrying out
fluorescence measurements to ensure the absence of quenchers from the sample and all
solutions used.
2.3 Nucleic acid materials
In 1868, almost a century before the Nobel Prize was awarded to Watson, Crick, Wilkins,
and Friedrich isolated something no one had ever seen before from the nuclei of cells [48]. He
called the compound "nuclein." This is today called nucleic acid, the "NA" in DNA
(deoxyribo-nucleic-acid) and RNA (ribo-nucleic-acid). Our bodies are formed from between
50 and 100 trillion cells (a trillion is a thousand billion, or a thousand, thousand million).

Theory and Background
27
These cells are organized into tissues, such as skin, muscle, and bone. Each cell contains all of
the organism's genetic instructions stored as deoxyribonucleic acid (DNA) (Figure 2.8.). The
long DNA molecule is tightly wound and packaged as a chromosome. Humans have two sets
of 23 chromosomes in every cell, one set inherited from each parent. A human cell therefore
contains 46 of these chromosomal DNA molecules. Each DNA molecule that forms a
chromosome can be viewed as a set of shorter DNA sequences. These are the units of DNA
function, called genes, each of which guides the production of one particular component of an
organism.
Figure 2.8. This drawing provides a graphic overview of the steps involved in transcription and translation. Within the nucleus of the cell, genes (DNA) are transcribed into RNA. This RNA molecule is then subject to post-transcriptional modification and control, resulting in a mature mRNA molecule that is then transported out of the nucleus and into the cytoplasm where it undergoes translation into a protein. mRNA molecules are translated by ribosomes that match the three-base codons of the mRNA molecule to the three-base anti-codons of the appropriate tRNA molecules.
A set of human chromosomes contains one copy of each of the roughly 30,000 genes in
the human "genome" the term used to refer to the complete genetic instructions for an
organism. Within a gene, the sequence of nucleotides along a DNA strand defines a protein,
which an organism is liable to manufacture or "express" at one or several points in its life
using the information of the sequence. The relationship between the nucleotide sequence and
the amino-acid sequence of the protein is determined by simple cellular rules of translation,
known collectively as the genetic code. The genetic code is made up of three letter 'words'
formed from a sequence of three nucleotides (eg. ACT, CAG, TTT). These codons can then
be translated with messenger RNA and then transfer RNA, with a codon corresponding to a
Mitochondria Ribosome
Nucleus Chromosome
Cell
DNATranscription
RNATranslation
Protein
mRNA
Mitochondria Ribosome
Nucleus Chromosome
Cell
DNATranscription
RNATranslation
Protein
mRNA

Theory and Background
28
particular amino acid. Since there are 64 possible codons, most amino acids have more than
one possible codon. There are also three 'stop' or 'nonsense' codons signifying the end of the
coding region.
2.3.1 Deoxyribo necleic acid (DNA)
A DNA molecule in a organism contains all the genetic information necessary to ensure
the normal development of that organism. Therefore, they occupy a unique position in the
biochemical world. The DNA monomers, which are referred to as nucleotides (nt), consist of
three subunits: a deoxyribose sugar, a base and a phosphate group [Saenger, 1983]. Linking of
the 3’ and 5’ OH of the sugar units via phosphodiester bonds creates a DNA strand. The
resulting ends of a DNA strand are designated as 3’ and 5’-terminus. The C1 atom of the
ribose is attached to one of the four naturally occurring bases, the purines, adenine and
guanine, or the pyrimidines, cytosine and thymine. In single-stranded (ss) DNA, the distance
between two successive phosphates is about 0.7 nm. In a DNA hybridization reaction, two
complementary single strands of DNA become oriented in an anti-parallel manner to form
double-stranded (ds) DNA via Watson Crick base pairing like the one depicted in Figure. 2.9.
[Watson, 1953].
Figure 2.9. The base pairs of G-C and A-T.
Guanine Cytosine
Thymine Adenine
(a)
(b)
Guanine CytosineGuanine Cytosine
Thymine AdenineThymine Adenine
(a)
(b)

Theory and Background
29
James Watson noted that hydrogen-bonded base pairs with the same overall dimension
could be formed only between A and T, and also G and C (Figure 2.9.) [49]. The A-T base
paired structure has two hydrogen bonds, whereas the G-C base pair has three. The hydrogen
bond pairs are formed between bases of opposing strands and can only arise if the directional
senses of the two interacting chains are opposite [Zubay et al, 1995]. This structural
information has been also proven by Francis Crick using X-Ray diffraction pattern. The
results were interpreted in terms of a helix composed of two nucleotide strands. In this
structure, the planes of the base pairs are perpendicular to the helix axis and the distance
between adjacent pairs along the helix axis is 3.4Å. The structure repeats itself after 10
residues or once every 34 Å along the helix axis (Figure. 2.10.) [Zubay et al, 1995]. The
stability of the DNA double helix structure depens on several factors. The negatively charged
phosphor groups are all located on the outer surface where they have a minimum effect on
each other. The repulsive electrostatic interactions generated by these charged groups are
often partly neutralized by the interaction with cations such as Mg+2 [Tinland, 1997].
Figure 2.10. The B form of the DNA helix.
The process of separating the polynucleotide strands of a duplex nucleic acid structure is
called denaturation. Denaturation disrupts the secondary binding forces that hold the strands
together. These secondary binding forces are the hydrogen bonds in between the base pairs of
opposing strands and the stacking forces between the planes of the adjacent base pairs.
Individually these secondary forces are weak but when they act together, they give a high
stability to the DNA duplex in an aqueous solution. The melting temperature, Tm, of the
2.0 nm
3.4 nm
2.0 nm
3.4 nm

Theory and Background
30
DNA is sequence-dependent thermodynamic stability of DNA in terms of nearest-neighbor
(n- n) base pair interaction and defined as the temperature at which 50% of the DNA becomes
single stranded [Geoffrey, 1995] The Tm is primarily determined by double stranded DNA
(dsDNA) length, degree of GC content, the higher the mole percentage of the G-C base pairs,
higher the Tm is since the G-C base pair contains three hydrogen bonds whereas the A-T base
pair has only two, and degree of the complementary between strands. Other factors present in
the aqueous solution can also affect the stability of the strand. For example, salt has a
stabilizing effect on DNA strands by acting on the repulsive electrostatic interactions between
negatively charged phosphate groups of the DNA. Salt ions can shield the charges and
therefore stabilizes the duplex structure.
2.3.2 Peptid nucleic acid (PNA)
Historically, PNA originates from attempts during the 1980s in the Danish organic
chemist Ole Buchardt’s laboratory to develop new DNA sequence-specific reagent. Based on
the observation with flow linear dichroism (LD) that a-helical poly-r-benzylglutamate (PBG)
forms stacking complexes with aromatic chromophores, it was suggested that PBG with
alternating nucleobases and acridine moieties instead of phenyls might bind sequence
selectively to duplex DNA by combined Hoogsteen base pair (bp) formation and intercalation
with the helix backbone in the major groove. The suggested compound was tentatively named
peptide nucleic acid, PNA [50-53].
Figure 2.11. Structures of double strand of PNA and DNA hybridization.
O
O
P
OOO
-O
O
P
O
OH
O
-O
O
OH
B
B
B
NB
HNO
N
O
B
HN
N
H2N
O
B
O
O
CONH2
PNA
DNA
O
O
P
OOO
-O
O
P
O
OH
O
-O
O
OH
B
B
B
NB
HNO
N
O
B
HN
N
H2N
O
B
O
O
CONH2
O
O
P
OOO
-O
O
P
O
OH
O
-O
O
OH
B
B
B
NB
HNO
N
O
B
HN
N
H2N
O
B
O
O
CONH2
PNA
DNA

Theory and Background
31
PNA is a DNA mimic in which the negatively charged phosphate deoxyribose backbone
is replaced with a pseudo-peptide one, that is, the uncharged N-(2-aminoethyl) glycine
linkages. The nucleobases are attached through methylene carbonyl linkages to the glycine
amino groups (Figure 2.11.) [54].
PNA oligomers containing both purines and pyrimidines bind to complementary single-
stranded DNA, RNA, or PNA, through Watson-Crick base pairing with high affinities. The
lack of chiral centers and electrostatic charges imposes fewer conformational restrictions on
PNA as compared to DNA or RNA. The neutral backbone may allow non-extended
conformations and short backbone-backbone distances. The structure of PNA/DNA duplex
can therefore be expected largely to be dominated by the DNA strand. In fact, the NMR
measurements reveal that the structure of PNA / DNA duplex possesses the features of A- and
B-form helixes [55-58].
Today’s PNAs are DNA analogs in which generally a 2-aminoethylglycine linkage
replaces the normal phosphodiester backbone. A methyl carbonyl linker connects standard
nucleotide bases to this backbone at the amino nitrogens. The nonprototype, yet interesting,
chemistry of this synthetic molecule has three important consequences: peptide nycleic acids
are neutral molecules, they are achiral and they are not susceptible to any hydrolytic
(enzymatic cleavage). Despite these great differences from DNA, PNA is capable of
sequence-specific recognition of DNA and RNA obeying the Watson-Crick hydrogen
bonding rules and the hybrid complexes thus formed exhibit extraordinary thermal stability
and unique ionic strength properties. Regarding applications of PNA, one obvious question is
what the advantage is of using PNA over DNA. Scientists have been working towards the
development of a wide rage of applications for Pas since 1991. These can be generalized in
four categories: first, its use as a tool for molecular biology and biotechnology, second,
towards the development of a gene-targeted drug using antigene or antisense strategy; third,
the use of PNA for diagnostics purpose and towards the development of biosensor; and fourth,
the study of basic chemistry to address the problems related to improvement of PNA.
PNA and other DNA analogues are now intensively studied for the purpose of creating
new gene-targeting drugs. Studies of PNA can also provide a better understanding of DNA
and RNA structural properties that are related to their biological roles.
2.3.3 Thermal stability of nucleic acids duplex

Theory and Background
32
The stability of duplex (DNA or PNA) is dependent on temperature, pH, ionic strength or
chaotropic agents the hydrogen bonds or the hydrophobic interactions are disrupted. If double
stranded DNA is subjected to extreme conditions, the DNA could be denatured and changed
from a double strand to a random coil of single strands. The temperature at which 50% of all
strands are separated into ssDNA (single strand DNA) is called the melting temperature Tm.
The bases in the DNA strands absorb light at 260nm. This absorption is partially suppressed
in double stranded DNA due to stacking interaction of the bases. The increase in absorbance
upon melting is referred to as hyper-chromic effect and can be used to monitor DNA melting
quantitatively by UV spectroscopy.
The stability of duplex DNA and hence the melting temperature is dependent on several
factors [59,60]:
(C+G) content of the DNA: Since a G-C pair has three hydrogen bonds and T-A only two,
the stability of the duplex is influenced by the content of cytosine and guanine.
Length of the sequence: with increasing chain length Tm increases and the slope of the
melting curve at Tm becomes steeper.
Sequence dependent nearest neighbour and end effects: the stacking interaction between
two neighboured bases along the chain is dependent on their identity.
Presence of hydrogen bond disrupting agents like formamide or urea.
Mismatches: If a double strand contains one or more non-complementary base pair
combinations like AA, AC, GG, CT etc. the stability of the duplex is reduced. The number
of hydrogen bonds is reduced and the cooperative stacking effect is influenced. Hence the
stability of the whole strand is affected. The destabilising effect of a single mismatch
decreases as the chain length increases. As a rule of thumb, 1% mismatch causes a
decrease of about 1°C in Tm for duplexes < 100 bp.
Ionic strength and pH of the solvent: At high salt concentrations, the negative charges in
the DNA backbone are screened; the melting temperature is increased and the melting
curve shows a sharp transition.
2.4 Interfacial biomolecular interaction analysis
Molecular self-assembly is a process in which molecules spontaneously form ordered
aggregates and involves no human intervention; the interactions involved usually are
noncovalent. In molecular self-assembly, the molecular structure determines the structure of

Theory and Background
33
the assembly [61]. Self-assembly is scientifically interesting and technologically important for
several reasons. The first is that it is important in life. The cell contains an astonishing range
of complex structures such as lipid membranes, folded proteins, structured nucleic acids,
protein aggregates, molecular machines, and many others that form by self-assembly [62].
The second is that self-assembly provides routes to a range of materials with regular
structures: molecular crystals [63]. liquid crystals and semicrystalline and phase-separated
polymers [64] are examples. Third, self-assembly also occurs widely in systems of
components larger than molecules, and there is great potential for its use in materials and
condensed matter science [65]. Fourth, self-assembly seems to offer one of the most general
strategies available for generating nanostructures. Thus self-assembly is important in a range
of fields: chemistry, physics, biology, materials science, nanoscience, and manufacturing.
2.4.1 Principle of self-assembly
A self-assembling system consists of a group of molecules or segments of a
macromolecule that interact with one another. These molecules or molecular segments may be
the same or different. Their interaction leads from some less ordered state (a solution,
disordered aggregate, or random coil) to a final state (a crystal or folded macromolecule) that
is more ordered [66].
Self-assembly
Molecular Supramolecular
(a)
Self-assembly
Molecular Supramolecular
(a)
r
Ener
gy
0
Attraction
RepulsionNet interaction
(b)
r
Ener
gy
0
Attraction
RepulsionNet interaction
r
Ener
gy
0
Attraction
RepulsionNet interaction
(b)
Figure 2.12. Aggregation occurs when there is a net attraction and an equilibrium separation between the components. The equilibrium separation normally represents a balance between attraction and repulsion. These two interactions are fixed in molecular self-assembly but can be engineered independently in macroscopic self-assembly.
Self-assembly occurs when molecules interact with one another through a balance of
attractive and repulsive interactions (Figure 2.12. (b)). These interactions are generally weak

Theory and Background
34
and noncovalent (van der Waals and Coulomb interactions, hydrophobic interactions, and
hydrogen bonds for self-assembly [67,68].
2.4.2 Self-assembled monolayers of alkanethiol on Au (111)
Among the known SAMs, alkanethiols [CH3(CH2)nSH] on Au(111) are one of the most
studied systems due, mainly, to their stability and ease of preparation on atomically flat Au
surfaces. From a chemical point of view, the attachment of the thiol to the Au surface is
believed to proceed through a Au-S bonding mechanism, which is known to be sufficiently
strong and stable, with bond energies typically of ~ 48 kcal/ mol-1 [69,70]. Extensive X-ray
photoelectron spectroscopic (XPS) experiments suggest that chemisorption of alkanethiols on
gold (0) surfaces yields the gold (I) thiolate (R-S-) species. The presumed adsorption
chemistry is:
which infers an oxidative addition of the S-H bond to the Au surface, followed by a reductive
elimination of the hydrogen. Thus, the liquid-phase formation of the monolayers is a two-step
process involving chemical bonding of the molecules by diffusion to the surface followed by
selfassembly aided by van der Waals interactions [71].
Figure 2.13. Self-assembled monolayers of alkanethiols on substrate (gold). The angular orientation of assembled molecules is 30 with respect to the surface normal. The surface-active head group (sulfer) is adsorbed chemically to the substrate. Van der Waals interactions are the main force in the simple alkyl chains. The surface group (tail group) could be modified with functional group (-OH, -COOH, -NH2, and so on) for further investigation.
012
0
21
nn AuHAuRSAuSHR
(25)
Substrate
Surface-active head group
Molecular interactions
Surface group
Substrate
Surface-active head group
Molecular interactions
Surface group

Theory and Background
35
The tupical tilt angles for alkanethiols on gold consisting of methylene side chains is ca.
30 with respect to the surface normal (Figure 2.13.). This orientation is preferred since it
minimizes the van der Waals interactions between the side chain units.
2.5.1 Simple Langmuir Model
The Langmuir model [72,73] was used in this study to analysis kinetics and equilibrium
constants in the case of specific interaction between immobilized probe PNA and target DNA
in solution. The Langmuir model assumes that all binding sites are equivalent and already
occupied sites do not influence the binding reaction in adjacent places and the surface is
homogenously covered by monolayers.
In a basic SPR biosensor experiment, PNA probes (A) are attached to the sensor surface.
Then DNA targets (B) interact with PNA probes (A) forming a complex (AB) with
increasing of response. Figure 2.14. shows the interactions that occur at the sensor surface.
Because binding responses are recorded in real time, it is possible to interpret kinetic
information about the interaction [74].
Figure 2.14. A typical kinetic curve of molecular interaction on the surface; after short background measurement, the association phase is observed by introduce of target to probe immobilized sensor surface, then dissociation phase is carried out by changing the target solution to fresh buffer solution. For next experiment the surface is regenerated by chemical solution (strong acid or base).
Time
Resp
onse
Asso
ciat
ion
Backgroung Next exp.
Dissociation
Regeneration
Time
Resp
onse
Asso
ciat
ion
Backgroung Next exp.
Dissociation
Regeneration

Theory and Background
36
The processes at the surface can be described by the rate constants of the adsorption, kon
and the one of dissociation, koff from the surface (Figure 2.12). The resulting time dependent
surface coverage Θ can be described by the following equation:
where c0 is the concentration of the binding species in solution. According to this equation the
surface will be occupied until all binding sites are blocked. Then (1-Θ) equals zero and this
will occur the fastest when the concentration in solution is high. On the other hand,
dissociation is only dependent on the rate koff and on the actual number of covered binding
sites. Integration of (Equation. 27) with the initial condition Θ = 0 at t= 0 leads to
In the case of a real experiment the dissociation process can be followed separately by
exchanging the analyte solution against pure buffer, since then the concentration c0 equals
zero. Thus, the rate constant koff can be determined according to:
where Θ0 is the surface coverage at the beginning of the dissociation process. Here it is
assumed that the desorbed molecules are prevented from re-adsorption by continuous rinsing
with pure buffer solution. Practically, the dissociation process should be fitted simultaneously
with the simulation of the adsorption process. Thus, dissociation rate, koff is assured to be
identical in both processes.
2.4.4 Langmuir adsorption isotherm
It is possible to monitor the complete Langmuir adsorption isotherm if the surface is
saturated stepwise. For this the sample is immersed in solutions of increasing concentration of
the adsorbing species and the system is allowed to be equilibrium before a further increase in
ABBAno
off
k
k
(26)
offon kkct
)1(0 (27)
)))(exp(1()(0
0 tkkkc
kct aoffon
on
, offona kckk 0 .
(28)
)exp()( 0 tkt off (29)

Theory and Background
37
bulk concentration. Thus, the starting value of the surface coverage for the individual
adsorption curves is larger than zero for the subsequent steps. In case of such stationary
surface coverage a simple correlation to the equilibrium constant K of the reaction can be
derived:
Figure 2.15. A typical curve of Langmuir adsorption isotherm taken titration experiment. The surface coverage is dependent on the target concentration.
The typical titration experiment allows for the determination of the Langmuir adsorption
isotherm (Figure 2.15.) and, hence, the affinity constant KA based on the evaluation of surface
coverages.
KcKc
0
0
1
(30)
Res
pons
e
c0
Res
pons
e
c0

Theory and Background
38
2.5 References [1] Wood, R. W. On a Remarkable Case of Uneven Distribution of Light in a Diffraction
Grating Spectrum. Proceedings of the Physical Society of London, 1902, 269-275.
[2] E. Kretschmann, H. Raether, Radiative decay of non-radiative surface plasmons excited by light, Z. Naturforsch., 1968, 23A. 2135-2136.
[3] A. Otto, Excitation of surface plasma waves in silver by the method of frustrated total reflection, Z.Physik, 1968, 216, 398-410.
[4] Agarwal, G. S. New Method in Theory of Surface Polaritons. Physical Review, 1973, B 8, 4768-4779.
[5] Swalen, J. D. Optical properties of Langmuir-Blodgett films. J. of Molecular Electronics, 1986, 2, 155-181.
[6] H. Raether, Surface plasmons on smooth and rough surfaces and on gratings, Springer-Verlag, Berlin,1988.
[7] A. D. Boardman (Ed.), Electromagnetic surface modes, John Wiley and Sons, 1982.
[8] I. Pockr and J. D. Swalen, J. G. Gordon, M. R. Philpott, Surface plasmon spectroscopy of organic monolayer assemblies, Surface Sci., 1978, 74, 237-244.
[9] J. G. Gordon II, S. Ernst, Surface plasmons as a probe of the electrochemical interface, Surface Sci., 1980, 101, 499-506.
[10] C. Nylander, B. Liedberg, T. Lind, Gas detection by means of surface plasmons resonance, Sensors and Actuators, 1982, 3, 79-88.
[11] B. Liedberg, C. Nylander, I. Lundstrom, Surface plasmons resonance for gas detection and biosensing, Sensors and Actuaors, 1983, 4, 299-304.
[12] B. Liedberg, C. Nylander, I. Lundstrom, Biosensing with surface plasmon resonance –how it all started, Biosensors Bioelectron., 1995, 10, i-ix.
[13] M. A. Ordal, L. L. Long, R. J. Bell, S. E. Bell, R. R. Bell, R. W. Alexander, J. Ward, C. A. Ward, optical properties of metals Al, Co, Cu, Au, Fe, Pb, Ni, Pd, Pt, Ag, Ti, and W in the infrared and far infrared, Appl.Opt., 1983, 11, 1099-1119.
[14] M. M. B. Vidal, R. Lopez, S. Aleggret, J. Alonso-Chamarro, I. Garces, J. Mateo, Determination of probable alcohol yield in musts by means of an 녞 optical sensor, Sensors and Actuators, 1993, B11, 455-459.
[15] K. Matsubara, S. Kawata, S. Minami, Optical chemical sensor based on surface plasmon measurement, Appl. Opt., 1988, 27, 1160-1163.
[16] B. Liedberg, I. Lundstrom, E. Stenberg, Principles of biosensing with an extended coupling matrix and surface plasmon resonance, Sensors and Actuators, 1993, B11, 63-72.
[17] L. M. Zhang, D. Uttamchandani, Optical chemical sensing employing surface plasmon resonance, Electron. Lett., 1988, 23, 1469-1470.

Theory and Background
39
[18] R. C. Jorgenson, S. S. Yee, A fiber-optic chemical sensor based on surface plasmon resonance, Sensors and Actuators, 1993, B12, 213-220.
[19] P. S. Vukusic, G. P. Bryan-Brown, J. R. Sambles, Surface plasmon resonance on grating as novel means for gas sensing, Sensors and Actuators, 1992, B8, 155-160.
[20] A. A. Kruchinin, Y. G. Vlasov, Surface plasmon resonance monitoring by means of polarization state measurement in reflected light as the basis of a DNA probe biosensor, Sensors and Actuators, 1996, B30, 77-80.
[21] S. G. Nelson, K. S. Johnston, S. S. Yee, High sensitivity surface plasmon resonance sensor based on phase detection, Sensors and Actuators, 1996, B35-36, 187-191.
[22] P. I. Nikitin, A. A. Beloglazov, A. V. Kabashin, M. V. Valeiko, Surface plasmon resonance interferometry for sensor applications.
[23] W. Knoll, Annu. Rev. Phys. Chem., 1998, 49, 569-638.
[24] E. Burstein, W. P. Chen, J. Vac. Sci. Technol., 1972, 11, 1004-1019.
[25] E. Aust, S. Ito, W. Knoll, Scanning, 1994, 16, 353-361.
[26] W. Hickel, W. Knoll, J. Appl. Phys., 1989, 66, 4832-4836.
[27] B. Rothenhaeusler, W. Knoll, Nature, 1988, 332, 615-617.
[28] F. Nakajima, Y. Hirakawa, T. Kaneta, T. Imasaka, Anal. Chem., 1999, 71, 2262-2265.
[29] J. Homola, I. Koudela, S. S. Yee, Sensor and Actuators, 1999, 54, 16-24.
[30] F. Yu, D. Yao, W. Knoll, Nucleic Acids Res., 2004, 32, 9, e75.
[31] J. Gordon, J. D. Swalen, Opt. Commun., 1977, 22, 374-378.
[32] T. K. Christopholous, Immunoassay, Academic Press, San Diego, 1996.
[33] D. J. Smith, FEBS. Lett. 1997, 77. 25-27.
[34] M. Lin, K. J. Nielsen, J. Bioconjugate Chem., 1997, 4
[35] E. F. Ulman, M. Schwarzberg, K.E. Rubenstein, J. Biol. Chem., 1976, 251, 4127-4178.
[36] K. W. Lazowski, L. Kaczmarek, Antisense Nucleic Acid Drud. Dev., 2000, 10, 97-103.
[37] T. Liebermann, W. Knoll, Colloid Surface A, 2000, 171, 115-130.
[38] N. Mol, E. Plomp, M. Fischer, Anal. Biochem., 2000, 279, 61-70.
[39] D. Kambhampati, P. Nielsen, W. Knoll, Biosens. Bioelectron., 2001, 16, 1109-1118.
[40] W. Barnes, J. Modern Optics, 1998, 45, 661-699.
[41] T. Neumann, M. Johansson, D. Kambhampati, W. Knoll, Adv. Funct. Mater., 2002, 12, 575-686.
[42] S. C. Kitson, W. Barnes, J. R. Jambles, N. P. K. Cotter, J. Modern Optics, 1996, 43, 573-582.

Theory and Background
40
[43] H. Knobloch, H. Brunner, A. Leitner, F. Aussenegg, W. Knoll, J. Chem. Phys., 1993, 98, 10093-10095.
[44] J. W. Attridge, P. B. Daniels, J. K. Deacon, G. A. Robinson, G. P. Davidson, Biosens. Bioelectron., 1991, 6, 201-214.]
[45] C. F. Eagen, W. H. Weber, S. L. McCarthy, R. W. Terhune, Chem. Phys. Lett., 1980, 75, 274-277.
[46] R. E. Benner, R. Dornhaus, Optics Commun., 1979, 30, 145.
[47] L. Schmidt-Mende, A. Fechtenkotter, J. C. McDonald, G. M. Whitesides, J. Am. Chem. Soc., 1996, 118, 4018-4029.
[48] R. K. Sakai, S Scharf, F. Faloona, K. B. Mullis, G. T. Horn, H. A. Erlich, N. Arnheim, Science, 1985, 230, 1350-1354.
[49] J. D. Watson, F. H. C. Crick, Nature, 1953, 71, 737-738.
[50] P. Nielsen, M. Eghholm, R. Berg., Science, 1991, 254, 1497.
[51] P. Nielsen, M. Eghholm, Bioconjugate Chem., 1994, 5, 3.
[52] B. Hyrup, P. Nielsen, Biomed. Chem., 1996, 4, 23.
[53] K. Petersen, O. Buchardt, P. Nielsen, Bioorg. Med. Chem. Lett., 1996, 6, 793.
[54] R. Saiki, D. Gelfand, S. Stoffel, Science, 1988, 239, 487-491.
[55] S. Brown, S. Thomson, J. Veal, D. Davis, Science, 1994, 265, 777-780.
[56] P. Wittung, P. Nielsen, O. Buchardt, M. Eghoim, B. Norden, Nature, 1994, 368, 561-563.
[57] D. /cherny, D. Belotserkovskii, M. Kamenetskii, M. Eghoim, R. Berg, P. Nielsen, Proc. Natl. Acad. Sci., 1993, 90, 1667.
[58] P. Nielsen, M. Eghholm, O. Buchardt, J. Mol. Recog., 1994, 7, 165.
[59] T. Neumann, dissertation, Uni. Mainz, Germany, 2001.
[60] F. Tennover, in Manual of Clinical Microbiology Washington, 1991, 119-127.
[61] G. Whitesides, E. Simanek, C. Gorman, in NATO advanced Study Institute on Chemical Synthesis: Gnosis to Prognosis, 1990, 565-588.
[62] B. Albert, D. Bay, J. Lewis, M. Raff, K. Roberts, J. Watson, Molecular Biology of the Cell, Garland, New York, 1994.
[63] K. Schwiebert, D. Chin, J. McDonald, G. Whitesides, J. Am. Chem. Soc, 1996, 118, 4018-4029.
[64] C. De Rosa, C. Park, E. Thomas, B. Lotz, Nature, 2000, 504, 433-437.
[65] G. Whitsides, Sci. Am., 1995, 273, 146-149.
[66] G. Whitesides, M. Boncheva, Proc. Natl. Acad. Sci., 2002, 99, 4769-4774.

Theory and Background
41
[67] B. Olenyuk, J. Whiteford, A. Fechtenkotter, P. Stang, Nature, 1999, 398, 796-799.
[68] J. Lehn, NATO ASI Ser. E., 1990, 320, 511-524.
[69] L. Dubois, R. Nuzzo, Ann. Phys., 1992, 43, 437.
[70] J. Schlenoff, M. Li, H. Ly, J. Am. Chem. Soc., 1995, 117, 12528.
[71] A. Ulman, An Introduction to Ultrathin Organic Films, Academic Press, 1991.
[72] P. Atkins, Physikalische Chemie, VCH, 1990.
[73] P. Weber, M. Pantoloano, L. Thomson, Biochem., 1992, 31, 9350-9354.
[74] D. Myszaka, Current Opinion in Biotechnology, 1997, 8, 50-57.

Theory and Background
42
CHAPTER 3
EXPERIMENTAL SECTION
3.1 Instrumental
The surface plasmon fluorescence spectroscopy major used in this study is based on the
classic Kretschmann configuration, as shown in Figure 3.1. [1].
A HeNe laser (Uniphase) operating at =633 nm passes firstly through a frequency
chopper (PerkinElmer), which is used also as the reference for the lock-in amplifier
(PerkinElmer). Then the laser beam passes two polarizers (Bernhard Halle) for intensity and
polarization control, respectively, before being reflected off the metal coated base of a 90°
high index (n=1.85 @ =633 nm) glass prism (LaSFN9, Schott) mounted on a -2
goniometer (Huber) arrangement. For the excitation of surface plasmon modes, the laser is
polarized in the plane of the incidence (p-polarized or TM mode). A lens (f = 50 mm, Ovis)
collects the reflected light on the photo diode (Si-photodiode), the output signal of which is
fed into the lock-in amplifier. Monitoring the reflected intensity as a function of the angle of
incidence , gives the normal angular reflectivity scans, while the time-resolved monitoring of
the reflectivity gives a kinetic measurement if the incident angle is fixed within the linear
slope of the angular scan curve (e.g. at 30% reflectivity). Instrument control and data
acquisition is handled by a custom program installed on a PC.
For detecting the emitted fluorescence signal of the sample, a collecting lens focuses the
emitted light through an interference filter = 670 nm, LOT) into a photomultiplier tube
detector (PMT, Hamamatsu), which is mounted towards the front side of the PMT. Note that
the interference filter is specifically designed for commercially versatile fluorophores such as
Cy5 dye molecule (Cyanine 5, from Amersham Pharmacia Inc.). The fluorescence detection
unit is mounted towards the base of the prism, rotating together with the prism (sample) at ,
while the photo-diode detecting the reflected light rotates at 2. The temperature in the cell
was sensed by thermocouple (PT 100), which is positioned in the center of the flow cell.

Theory and Background
43
Tygon tubing
Peristaltic pump
Sample
Laser
Prism
SubstrateAu filmPDMS spacerQuartz slide
Figure 3.1. Schematic draw of the surface plasmon fluorescence spectroscopy set-up (up) and the flow cell (down).
3.1.1 Electrode substrate for electric field applying The schematic of the home-made flow cell for our sensing system is shown in Figure 3.2.
The flow cell is specially designed with some Pt electrode patterns for electric application
system on normal watching glass or quartz substrate, and two holes can be connected to an
inlet and outlet tube to circulate the target and bulk solution in immobilization and
hybridization experiments..
In center of patterned, grid patterned of Pt for emitted fluorescence light passing through
the substrate because photomultimeter is located behind the sample stage. Besides grid pattern,
Photon counter
Motor steering
PC
Shutter controller
Prism Polarizers Chopper
Photodiode
Filter Lens
PMT Goniometry
Laser-shutter
Electrod
Laser 632.8 nm
Autolab

Theory and Background
44
several reference electrodes was established for the various purposes of referencing in
electrochemical analysis.
Figure 3.2. Schematic draw of flow cell with Pt electrode patterns.
In order to obtain the patterned cell, conventional photolithography technique is used in
micro-fabrication method [2-5]. General lithographic process is as follow in Figure 3.3.
Photolithography is the process of transferring geometric shapes on a mask to the surface of a
silicon wafer. The steps involved in the photolithographic process are wafer cleaning; barrier
layer formation; photoresist application; soft baking; mask alignment; exposure and
development; and hard-baking. In the first step, the wafers are chemically cleaned to remove
particulate matter on the surface as well as any traces of organic, ionic, and metallic
impurities. After cleaning, silicon dioxide, which serves as a barrier layer, is deposited on the
surface of the wafer. After the formation of the SiO2 layer, photoresist is applied to the
surface of the wafer. High-speed centrifugal whirling of silicon wafers is the standard method
for applying photoresist coatings in IC manufacturing. This technique, known as "Spin
Coating," produces a thin uniform layer of photoresist on the wafer surface. There are two
types of photoresist: positive and negative. For positive resists, the resist is exposed with UV
light wherever the underlying material is to be removed. Negative resists behave in just the
opposite manner. The negative resist remains on the surface wherever it is exposed, and the
developer solution removes only the unexposed portions.

Theory and Background
45
Figure 3.3. (a) Schematic draw of flow cell with Pt electrode patterns. (b) Sample assembly consistent of prism, glass, flow-cell in Kretschmann configuration.
3.1.2 Sample assembly for SPFS
All experiments were performed by using a flow cell coupled prism in the Kretschmann
configuration (Figure 3.2 (b)). For practical reason the gold layer was evaporated on the glass
slide that has the same refractive index as the prism (LaSFN9, n=1.845). The interface
between prism and glass slide was matched with high refractive index matching oil
(Hydrogenated terphenyl 1-bromonaphthalene, Cargille, n=1.700). This fluid oil should have
a similar refractive index as the prism and the glass in order to allow for unperturbed coupling.
For practical reasons a less volatile index match liquid is frequently used with the drawback
of a lower refractive index and thus non optimal match. The gold side was placed towards the
flow cell for specific binding of molecules to the gold.
It consists of a thin Teflon tape spacer (~100 μm, with a 3mm*15mm ellipse hole) and a
Pt electrode patterned glass slide (Herasil glass) through which two holes are machined and
two steel needles are glued, serving as inlet and outlet, respectively. The flow cell is attached,
via Tygon® tubing with an inner diameter of 0.76 mm, to a peristaltic pump (Ismatec,
Switzerland) and the sample tube, forming a closed circulation loop. Buffer and sample
solutions can only be manually exchanged, however, with little trouble from air bubbles.
Once the exchange is completed, the whole loop is closed and completely sealed allowing for
a long interaction time (>48 hours).

Theory and Background
46
Figure 3.4. Sample assembly consistent of prism, gold evaporated glass, spacer, flow-cell in Kretschmann configuration.
The loop volume is around 300 μL, with a minimum sample consumption of around
400~600 μL to assure the desired analyte working concentration.
3.1.3 Electric inducing system
All potential for PNA/DNA hybridization experiments was performed with an Autolab
PGSTAT (Eco Chemie B. V., Netherlands) in a three-electrode system ( PNA immobilized
gold working electrode and Pt pattern counter electrode with reference electrode) as the
potentiostat to control the electrical bias potential.
Prism
Substrate Au film
Teflon spacer
Pt patterned flow cell
Inlet Outlet

Theory and Background
47
Figure 3.5. Autolab instrument for electrical bias potential inducing with three electrode system.
3.2 Sensor Surface
Surface-confined PNA probe arrays are important in the development of novel PNA
sequencing and gene mapping technologies. A typical array-based sensor consists of single-
stranded peptide nucleic acid (PNA) of different sequences, called probes, attached to a
surface, with the identity and location of each surface-bound PNA probe known. Miniaturized
probe arrays have been fabricated containing up to 135 000 probes with specific sequences
confined to areas of 35 x 35 µm2 or less. The array is exposed to a fluorescently labeled single
strand of DNA of unknown sequence, a target, that binds or hybridizes to complementary
probes in the array. Hybridization reactions of the tagged strands are then detected using a
fluorescence technique, the array locations of the tagged strands are determined, and the
sequence of the unknown strand is deduced. While PNA array-based technologies hold great
promise for rapid and accurate sequence determination and diagnosis of genetic diseases,
surprisingly little is known about the surface structures of bound probes and the impact of the
surface on hybridization reactions. It is interesting to note that, in spite of the tremendous
potential held by these new PNA technologies, little has been done in the way of physical
characterization of the surface species. For example, the structure-function relationships of the

Theory and Background
48
immobilized probes on the surface have not been examined in great detail, nor has the role of
probe coverageon hybridization efficiency been rigorously examined.
Figure 3.5. Illustration of the self-assembled sensor matrix.
In this paper, we describe the use of alkanethiol self-assembly methods to fabricate PNA
probe-modified gold surfaces with known and reproducible probe coverages that exhibit high
hybridization activity. In our approach, we precisely control the surface coverage of thiol-
derivatized PNA on the surface by forming mixed monolayers of the thiol-derivatized probe
and a spacer thiol, 6-mercapto-1-hexanol (MCH). The spacer thiol was carefully chosen to
minimize nonspecific adsorption of single-stranded DNA. Other investigators have employed
thiolderivatized, single-stranded DNA to study hybridization reactions on surfaces; however,
the effect of probe coverage on hybridization reactions was not examined in great detail. In
this report, the two-component PNA/MCH monolayers are thoroughly characterized using
surface plasmon resonance spectroscopy analysis. In addition to studying the effect of probe
coverage on hybridization, the melt behavior of the surface-bound duplex has been examined,
and the temperature stability of the surface-bound PNA was explored (Figure 3.5).
3.2.1 Au substrate for sensor matrix
ssPNA probe
Mercaptohexanol (spacer)
~ 50 nm Au Substrate

Theory and Background
49
In order to obtain a proper sensor matrix, well-defined gold evaporated substrate is needed
for immobilization of PNA probe on top of surface. Firstly, the glass substrates were carefully
cleaned the by following procedure:
In order to recycle of the glass substrate after the experiments, The used substrates can be
reused by cleaning the gold residue on the surface. The gold films are removed by mechanical
rubbing with smooth optical paper immersed in ethanol and remained resistant gold films are
also removed in a 20 times diluted solution of 50 mL of MilliQ water, 40 g of potassium
iodine and 10 g of iodine (Aldrich). The chromium films were removed by a treatment with
an aqueous solution of ammonium cerium (IV) nitrate (Aldrich).
In the next step, Gold (99.9999%, Balzers) was deposited onto clean LaSFN9 slides by
thermal evaporation at a deposition rate of 0.1 nm/s under UHV conditions (p < 10-6 mbar) in
an evaporation apparatus (Edwards). In order to improve the adhesion of the gold film to the
glass substrate a chromium film of approximately 2 nm was evaporated if necessary.
3.2.2 Preparation of probe matrix for sensor
In order to prepare the self-assembled monolayers (SAM) of ssPNA probe, we used the
thiol-derivated ssPNA as the active probe for hybridizing with target ssDNA at the sensor
surface and 6-mercapto-1-hexanol (MCH) as spacer thiol.
1. Sonication for 10 min each in 2% alkaline detergent solution (Helmanex, Helma, Germany; sonification apparatus Super
RK510, Sonorex, Germany)
2. Sonication for 15 min in MilliQ water (18 M/ cm)
3. 15 min sonification in ethanol (Chromasolv, Riedel-de Haehn, Germany)
4. Cleaned samples were blown dry in a stream of nitrogen.

Theory and Background
50
We could choose two strategies for preparation of mixed monolayer surface containing
HS-ssDNA and MCH. One is a way of immobilizing of ssPNA and MCH step by step
(Sequential preparation method). The clean gold substrate was immersed in a 1.0 µM
solution of HS-ssDNA, which was pre-solved in 100 mM phosphate buffer (pH ~ 7.2) for a
specific amount of time (2~12 hrs), followed by a 1 h exposure of the sample to an aqueous
solution of 1.0 mM MCH. Before analysis or hybridization, each sample was rinsed
thoroughly with deionized water (Figure 3.6.(a)). All process can be monitored by surface
plasmon spectroscopy (SPR).
(a)
(b)
Figure 3.6. Procedure of mixed monolayer of ssPNA and MCH. (a) sequential immobilization of ssPNA and MCH, (b) pre mixed immobilization process.
The other method is that the gold substrate was incubated over 2 days in a binary mixed
thiol solution of a thiolated ssPNA and a spacer MCH at a molar ratio of 55:45 and a total
concentration of 1 µM in absolute ethanol (Aldrich) in order to control the surface density and
to minimize non-specific binding of analyte (target) ssDNA. (Pre-mixed preparation
method) (Figure 3.6.(b)).
OH
S
OH
S
OH
S
OH
S
OH
S
OH
S
OH
S
OH
S
OH
S
OH
S
OH
S
OH
S
OH
S
OH
S
OH
S
OH
S
OH
S
OH
S
OH
S
OH
S
OH
S
OH
S
OH
S
OH
S
OH
S
OH
S
OH
S
OH
S
OH
S
OH
S
OH
S
OH
S
OH
S
OH
S
OH
S
OH
S
OH
S
OH
S
OH
S
OH
S
OH
S
OH
S
OH
S
OH
S
OH
S
OH
S
OH
S
OH
S
OH
S
OH
S
OH
S
OH
S
OH
S
OH
S
OH
S
OH
S
OH
S
OH
S
OH
S
OH
S
OH
S
OH
S
OH
S
OH
S
OH
S
OH
S
OH
S
OH
S
OH
S
OH
S
OH
S
OH
S
OH
S
OH
S
OH
S
OH
S
OH
S
OH
S
OH
S
OH
S
OH
S
OH
S
OH
S
OH
S
OH
S
OH
S
OH
S
OH
S
OH
S
OH
S
OH
S
OH
S
OH
S
OH
S
OH
S
OH
S
OH
S
OH
S
OH
S
OH
S
S
S
S
SSS
SSS
S
S
SSS
SS
Immobilization of ssPNA Covered with MCH
Au
incubate 2~12 hrs exposed ~1 hrs
OH
S
OH
S
OH
S
OH
S
OH
S
OH
S
OH
S
OH
S
OH
S
OH
S
OH
S
OH
S
OH
S
OH
S
OH
S
OH
S
OH
S
OH
S
OH
S
OH
S
OH
S
OH
S
OH
S
OH
S
OH
S
OH
S
OH
S
OH
S
OH
S
OH
S
OH
S
OH
S
OH
S
OH
S
OH
S
OH
S
OH
S
OH
S
OH
S
OH
S
OH
S
OH
S
OH
S
OH
S
OH
S
OH
S
OH
S
OH
S
OH
S
OH
S
OH
S
OH
S
OH
S
OH
S
OH
S
OH
S
OH
S
OH
S
OH
S
OH
S
OH
S
OH
S
OH
S
OH
S
OH
S
OH
S
OH
S
OH
S
OH
S
OH
S
OH
S
OH
S
OH
S
OH
S
OH
S
OH
S
OH
S
OH
S
OH
S
OH
S
OH
S
OH
S
OH
S
OH
S
OH
S
OH
S
OH
S
OH
S
OH
S
OH
S
OH
S
OH
S
OH
S
OH
S
OH
S
OH
S
OH
S
OH
S
OH
S
OH
S
S
S
S
SS
Au
incubate over 2 days in binary mixture of ssPNA and MCH
Immobilization of ssPNA / MCH

Theory and Background
51
3.2.3 Characterization of the sensor matrix by SPR
In Figure 3.7, typical adsorption kinetics of two methodologies of preparation of PNA
probe and spacer MCH layers are given before and after each adsorption process. The surface
architecture was characterized by means of thickness determination using the simulation
software WINSPALL2.0. The scan curves and the corresponding simulations are depicted in
Figure 3.8. The used optical constants and the resulting optical thickness of the layers are
summarized in Table 3.1.
Table 3.1. Optical constants and determined thickness of sensor matrix measured by SPR.
Through the sequential preparation of ssPNA probe spaced with MCH, about 3 nm
thickness of probe monolayer matrix. After injecting the 1 µM ssPNA solution, which is
dissolved in 100 mM phosphate buffer solution, in the flow cell, all liquid were circulated at
the speed of 100 µL/min (very slow rate) with peristaltic pump. In the beginning, ssPNA
could be diffused near the surface and made a specific binding (sulphur-gold interation) and
non-specific binding (nitrogen-gold interaction or physisorption by van der Waals force)
exclusively. Afterward, this monolayer reached equilibrium state, which means the
immobilization reaction of ssPNA proceed at the same rate as their detached reaction from the
gold surface. Although almost signal of SPR caught up with the value of the plateau of
saturation of surface with ssPNA within 30 minutes, tens of minutes was more required to
obtain the stabilized PNA sensor surface (Figure 3.7.(a)).
Layer
Gold
Water
d
501.7
’ ’’
1.38
0
Layer
Gold
Pre-mixed prepared PNA probe
d / Å
10.6
’
-12.38
2.25 1.7558
’’
1.38
0 0
0 30.3 2.25 0 Sequential prepared PNA probe

Theory and Background
52
Figure 3.7. Kinetic SPR curves taken at = 55.7 (at this angle, the reflectivity changes approximately linearly with the bound optical mass) (a) sequential immobilization of ssPNA and MCH, (b) immobilization of pre-mixed ssPNA and MCH.
Another method for preparation of ssPNA probe surface is immobilization of ssPNA and
MCH to the gold substrate together with the proper molar ratio, which was optimized
carefully. A 0.55 µM thiolated-ssPNA and 0.45 µM MCH was fully mixed in 1 mL ethanol at
the appendorf tube (1 mL volume) and that mixture was injected in the flow cell for SPR
measurement or to the incubation-cell ex-situ.
0 10 20 30 40 5028
30
32
34
36
Ref
lect
ivity
R
Time / hrs
Incubation of ssPNA / MCH
OH
S
OH
S
OH
S
OH
S
OH
S
OH
S
OH
S
OH
S
OH
S
OH
S
OH
S
OH
S
OH
S
OH
S
OH
S
OH
S
OH
S
OH
S
OH
S
OH
S
OH
S
OH
S
OH
S
OH
S
OH
S
OH
S
OH
S
OH
S
OH
S
OH
S
OH
S
OH
S
OH
S
OH
S
OH
S
OH
S
OH
S
OH
S
OH
S
OH
S
OH
S
OH
S
OH
S
OH
S
OH
S
OH
S
OH
S
OH
S
OH
S
OH
S
OH
S
OH
S
OH
S
OH
S
OH
S
OH
S
OH
S
OH
S
OH
S
OH
S
OH
S
OH
S
OH
S
OH
S
OH
S
OH
S
OH
S
OH
S
OH
S
OH
S
OH
S
OH
S
OH
S
OH
S
OH
S
OH
S
OH
S
OH
S
OH
S
OH
S
OH
S
OH
S
OH
S
OH
S
OH
S
OH
S
OH
S
OH
S
OH
S
OH
S
OH
S
OH
S
OH
S
OH
S
OH
S
OH
S
OH
S
OH
S
OH
S
OH
S
S
S
S
SSS
SS
(b)
0 2 00 40 0 6 0 0 8 00 1 00 025
30
35
40
45
50
Ref
lect
ivity
R
T im e / m in
Inject of ssPNA
Rinse
Inject of MCH
S
S
S
SSS
SS
OH
S
OH
S
OH
S
OH
S
OH
S
OH
S
OH
S
OH
S
OH
S
OH
S
OH
S
OH
S
OH
S
OH
S
OH
S
OH
S
OH
S
OH
S
OH
S
OH
S
OH
S
OH
S
OH
S
OH
S
OH
S
OH
S
OH
S
OH
S
OH
S
OH
S
OH
S
OH
S
OH
S
OH
S
OH
S
OH
S
OH
S
OH
S
OH
S
OH
S
OH
S
OH
S
OH
S
OH
S
OH
S
OH
S
OH
S
OH
S
OH
S
OH
S
OH
S
OH
S
OH
S
OH
S
OH
S
OH
S
OH
S
OH
S
OH
S
OH
S
OH
S
OH
S
OH
S
OH
S
OH
S
OH
S
OH
S
OH
S
OH
S
OH
S
OH
S
OH
S
OH
S
OH
S
OH
S
OH
S
OH
S
OH
S
OH
S
OH
S
OH
S
OH
S
OH
S
OH
S
OH
S
OH
S
OH
S
OH
S
OH
S
OH
S
OH
S
OH
S
OH
S
OH
S
OH
S
OH
S
OH
S
OH
S
OH
S
OH
S
S
S
S
SSS
SS
(a)

Theory and Background
53
Figure 3.8. Angular scan curves of the reflectivity R; (1) reference gold, (2) probe
preparation of pre-mixed ssPAN and MCH, (3) sequential probe preparation of ssPNA and
MCH, (4) PNA probe layers (open circles). The inset shows a zoom-in to the angles between
56 and 59 .
In this case, there is no circulation process of liquid because MCH, small size thiol is more
predominant for immobilization with the gold surface. Only the control of mole ratio of two
components was used for obtaining the proper PNA sensor surface. Owing to no driving force
for flowing, immobilization rate is relatively slower than circulation method and it takes much
time for the complete sensor surface to obtain, over 2 days. Through this process, we could
get the about 1 nm thickness PNA sensor surface.
3.2.4 The control of PNA probe density in sequential preparation process
The PNA surface prepared by pre-mixed method is definitely less dense than that of
sequential immobilization technique. The reason is that, in pre-mixture of ssPNA and MCH
solution, thiolated ssPNA has experienced the competition reaction to the gold surface with
45 50 55 60 65
0
20
40
60
80
100
Ref
lect
ivity
R
Angle / deg
(1) (2)
(3)
56 57 58 59
0
10
20
30
40
Ref
lect
ivity
R
Angle / deg

Theory and Background
54
MCH, much smaller molecules, and relative larger amount of MCH could be immobilized.
However, there is an advantage of easy optimization of PNA density at the surface by
controlling the mole ratio of ssPNA and MCH in pre-mixed preparation method. Through the
sequential immobilization of ssPNA and MCH system, the density of PNA can also be
controlled by aging with pure MCH solution for long time, e.g. over 24 hours. Sulfur of MCH
is more reactive to gold than that of PNA and results in substitution reaction can be occurred
slowly if sufficient amouts of MCH would be supplied in the flow-cell.
Figure 3.9. (a) SPR angular scans of PNA probe surface taken after exposure of MCH
solution for (1) 0 h, (2) 12 hrs, (3) 24 hrs, (4) 36 hrs, and (5) 48 hrs respectively; (b) MCH
0 10 20 30 40 500
20
40
60
80
100
% s
tead
y st
ate
imm
obili
zatio
n
Time / hrs
fit exponantial decay (1st order)
(b)
46 48 50 52 54 56 58 60 62 64
0
20
40
60
80
100
Angle / deg
Ref
elct
ivity
R
0
1x10⁵
2x10⁵
3x10⁵
4x10⁵
5x10⁵
6x10⁵
7x10⁵
8x10⁵
9x10⁵
Fluorescence / cps
(1)
(2) (3)
(4) (5)
(a)

Theory and Background
55
exposure time vs degree of exchange from ssPNA to MCH (exponential dacay). All points are
calculated from the maximum fluorescence intensity of (a).
In 2 days, 90% of immobilized PNA on the gold surface can be replaced with MCH
followed by 1st order exponential decay.
3.3 Materials
The thiolated ssPNA probe (P2) was synthesised in our lab through the literature. It
consists of a recognition sequence of 15 bases and mercapto-hexane structure acting as spacer.
The thiolated ssPNA can be anchored to the gold surface via the interaction with sulphur-gold
linkage. All the oligonucleotides including 15, 45 and 75 bases were purchased from MWG-
Biotech and thiolated 50 bases DNA labled with Cy5 (5’ end) was synthesized with Peptide
Synthesizer. The sequences of all probes and targets used in this study are given in Table 3.2.
Table 3.2. The sequences of PNA probes.
Name Type Sequence Modification
P2 PNA HS-C6-TGT ACA TCA CAA CTA-NH2
P2-Biotin PNA H-(egl)9- TGT ACA TCA CAA CTA-NH2 Biotin (N-)
T2-15 DNA 5’-TAG TTG TGA TGT ACA-3’ Cy5 (5’)
T1-15 DNA 5’-TAG TTG TAA TGT ACA-3’ Cy5 (5’)
T2-45 DNA 5’-(TTT)5-TAG TTG TGA TGT ACA-(TTT)5-3’ Cy5 (5’)
T2-75 DNA 5’-(TTT)10-TAG TTG TGA TGT ACA-(TTT)10-3’ Cy5 (5’)
In addition to that, T45 and T75 both possess two flanks of poly T (15 bases for T45 and
30 bases for T75) on each side of the recognition sequence. All target DNA stands for the Cy5
label at the 5’ end of the oligonucleotides. The spectral properties of Cy5 make it a suitable
dye for our purposes (abs=649 nm, em=670 nm). Cy5 dye is also used in thiolated 100 bases
DNA for immobilization experiments.
3.4 Titration analysis of PNA/DNA hybridization at various ionic strength
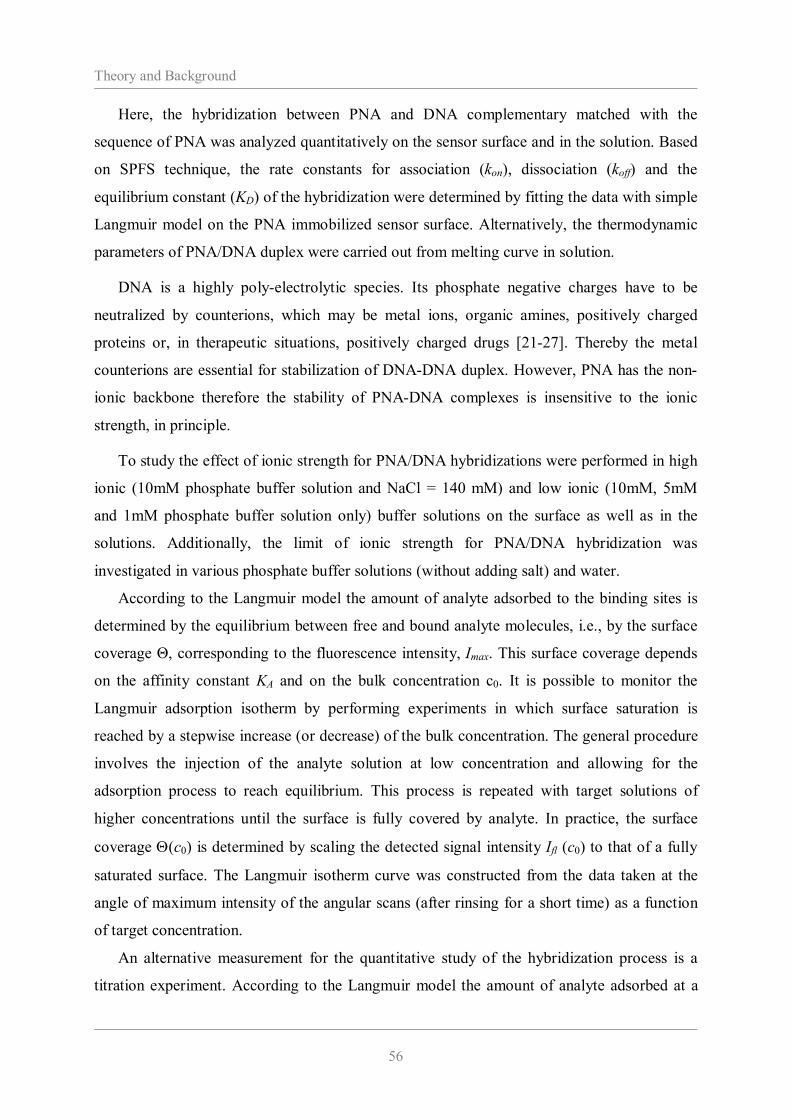
Theory and Background
56
Here, the hybridization between PNA and DNA complementary matched with the
sequence of PNA was analyzed quantitatively on the sensor surface and in the solution. Based
on SPFS technique, the rate constants for association (kon), dissociation (koff) and the
equilibrium constant (KD) of the hybridization were determined by fitting the data with simple
Langmuir model on the PNA immobilized sensor surface. Alternatively, the thermodynamic
parameters of PNA/DNA duplex were carried out from melting curve in solution.
DNA is a highly poly-electrolytic species. Its phosphate negative charges have to be
neutralized by counterions, which may be metal ions, organic amines, positively charged
proteins or, in therapeutic situations, positively charged drugs [21-27]. Thereby the metal
counterions are essential for stabilization of DNA-DNA duplex. However, PNA has the non-
ionic backbone therefore the stability of PNA-DNA complexes is insensitive to the ionic
strength, in principle.
To study the effect of ionic strength for PNA/DNA hybridizations were performed in high
ionic (10mM phosphate buffer solution and NaCl = 140 mM) and low ionic (10mM, 5mM
and 1mM phosphate buffer solution only) buffer solutions on the surface as well as in the
solutions. Additionally, the limit of ionic strength for PNA/DNA hybridization was
investigated in various phosphate buffer solutions (without adding salt) and water.
According to the Langmuir model the amount of analyte adsorbed to the binding sites is
determined by the equilibrium between free and bound analyte molecules, i.e., by the surface
coverage Θ, corresponding to the fluorescence intensity, Imax. This surface coverage depends
on the affinity constant KA and on the bulk concentration c0. It is possible to monitor the
Langmuir adsorption isotherm by performing experiments in which surface saturation is
reached by a stepwise increase (or decrease) of the bulk concentration. The general procedure
involves the injection of the analyte solution at low concentration and allowing for the
adsorption process to reach equilibrium. This process is repeated with target solutions of
higher concentrations until the surface is fully covered by analyte. In practice, the surface
coverage (c0) is determined by scaling the detected signal intensity Ifl (c0) to that of a fully
saturated surface. The Langmuir isotherm curve was constructed from the data taken at the
angle of maximum intensity of the angular scans (after rinsing for a short time) as a function
of target concentration.
An alternative measurement for the quantitative study of the hybridization process is a
titration experiment. According to the Langmuir model the amount of analyte adsorbed at a

Theory and Background
57
given temperature to the binding sites is determined by the equilibrium between free and
bound analyte molecules, i.e., by the surface coverage Θ, corresponding to the fluorescence
intensity. This surface coverage depends on the affinity constant KA and on the bulk
concentration c0. It is possible to monitor the Langmuir adsorption isotherm by performing
experiments in which surface saturation is reached by a stepwise increase (or decrease) of the
bulk concentration. The general procedure involves the injection of the analyte solution at low
concentration and allowing for the adsorption process to reach equilibrium. This process is
repeated with target solutions of higher concentrations until the surface is fully covered by
analyte. The surface coverage is described by equation (1):
Ao
Afl Kc
KcccI
1)()( 0
00 (1)
In practice, the surface coverage (c0) is determined by scaling the detected signal intensity Ifl
(c0) to that of a fully saturated surface
Based on the Langmuir model the increase of the fluorescence intensity as a function of
time is described by a simple bimolecular reaction:
with Imax being the maximum fluorescence intensity from surface-bound duplexes at c0. I0 is
the initial background fluorescence, and c0 the bulk solution concentration in the
measurement.
3.5 Kinetic analysis by SPFS
In order to monitor the molecular binding on the surface the incidence angle is fixed at a
position where the measured scan curve exhibits a linear slope (e.g. at 30% reflectivity) and
the detected reflectivity is recorded with time. The reflectivity at this fixed incidence angle is
increased if the resonance is shifted towards higher angles and the detected shift represents a
linear time dependence of the optical properties of the investigated system.
Usually, the angle of incidence was fixed at = 55.5 for monitoring the PNA/DNA
hybridization. Kinetics curves were recorded in both the reflectivity and fluorescence mode,
)))(exp(1)(()( 0max tkIItI afl , offona kckk 0 (2)

Theory and Background
58
starting with a measurement of the fluorescence background for a few minutes as a function
of time. All the experiments were performed with 1 mL for each target concentration using
the same flow cell with an inlet and outlet and a closed loop circulation at room temperature
(24 1 oC) and at a flow rate of 10 L/sec.
For the general kinetic analysis, Cy-5 labeled DNA target solutions (varying in
concentration from 1 nM up to 200 nM) were introduced into the flow cell for the association,
and allowed to interact with the PNA functionalized sensor surface until saturation point
(plateau stage). After that the dissociation was followed by rinsing with fresh buffer solution
(1~150 mM phosphate buffer solution) for each measurement two times longer than
association time. The surfaces could be fully regenerated by treatment with 50 mM NaOH in
order to remove remaining bound target DNA for another analysis cycle at the same sensor
surface.
Each single-exponential analysis was completed by applying a 10 ~ 50 nM target solution
until equilibrium was reached, followed by an extended rinsing step.
The evaluation of association (ka) and dissociation (koff) rate constants was performed by
fitting to the binding data using the 1:1 Langmuir model. All kinetic experiment data was
taken at = 55.7 at different concentrations of the target DNA with PNA probe in 2 different
ionic strength buffer solutions on the same sensor surface. Starting for a short time with the
base line measurement (the intensity of the baseline gives I0 in equation (3)), solutions of
varying concentrations of DNA targets were injected and circulated for 10 min approximately
for the association process seen by the increasing fluorescence intensity. Then the cell was
rinsed with fresh buffer solution for the dissociation process again for 10 min. Based on the
Langmuir model the increase of the fluorescence intensity as a function of time is described
by a simple biomolecular reaction:
with Imax being the maximum fluorescence intensity from surface-bound duplexes at c0, I0 is
the initial background fluorescence, and c0 the bulk solution concentration in the global
analysis.
The association kinetics is quantified with respect to the concentration dependence. Fitting
the association phase data recorded from starting the injection of target to changing the pure
buffer with equation (3) the rate constants offona kckk 0 were obtained individually at
different target concentrations. The time-dependent dissociation is described by equation (4):
)),)(exp(1)(()( 0max tkIItI afl offona kckk 0 (3)

Theory and Background
59
The dissociation is sufficiently enhanced and leads to a measurable loss of fluorescence
intensity even within the 10 min of the rinsing phase of the analysis.
)()( 0max IItI fl )exp( tkoff (4)
The affinity constant (KA) was obtained from the ratio of the rate constant (KA=kon/koff).
For each set of hybridizations, a series of independent experiments was performed over the
target concentrations of 1-200 nM.
3.6 PNAs synthesis
The PNA probe was synthesised [6-8] using solid-phase synthesis with a 433A Peptide
Synthesizer (Applied Biosystems) with the BOC strategy and O-(1H-7-azabenzotriazolyl)-
N,N,N',N'-tetramethyluronium hexafluorophosphate (HATU, Aldrich) coupling and N,N-
diisopropylethylamine (DIEA, Aldrich) as base, using commercially available PNA
monomers (Applied Biosystems), (4-methylbenhydryl)amine (MBHA) resin (Novabiochem)
as solid support. After the PNA part was completed, two coupling steps were performed using
the protected linker [2-(N-Boc-2-amioethoxy)ethoxyacetic acid dicyclohexylammonium salt
(AEEA, Applied Biosystems), and a coupling step using biotin (Aldrich). Cleavage of the
PNA from the resins was then carried out manually using a mixture of a trifluoroacetic acid
(TFA) and trifluoromethanesulfonic acid (TFMSA): thianisole: m-cresol 6:2:1:1. Swelling,
downloading and cleavage of the PNAs from the resin were done manually. The crude
product was purified by reversed phase HPLC using a Phenomenex C18 peptide column (3
m, 250 mm × 10 mm) with a binary gradient (flow rate: 4mL/min); eluent A: water /TFA =
100 : 0.1; eluent B: water/acetonitrile/TFA = 60 : 40 : 0.1; detector UV (260 nm). The
purified product was then identified by Mass Spectrometry (Micromass ZMD).

Theory and Background
60
3.7 References [1] Neumann, T. dissertation, Univ. Mainz, Germany, 2001.
[2] L. Kimberly, N. Kyle, Q. Yu. J. Chem. Edu., 2005, 82, 9, 1365-1369.
[3] H. Jeon, J. Park, New approach for 193nm resist using modified cycloolefin Resin, Proceedings of SPIE, 2002, 4690, 120.
[4] H. Jeon, J. Park, Novel approach for high resolution using cyloolefin-alt-maleic acid derivatives polymer for ArF lithography, Proceedings of SPIE, 2002, 4690, 623.
[5] H. Jeon, New ArF photoresist based on modified maleic anhydride cyloolefin polymers”, J. Photopolymer Sci. Tech., 2002, 15, 4, 541.
[6] F. Lesignoli, A. Germini, R. Corradini, S. Sforza, J. Chromatogr. A., 2001, 922, 177-185.
[7] A. Germini, A. Mezzelani, F. Lesignoli, J. Agric. Food Chem., 2004, 53, 3958-3962.
[8] A. Germini, S. Rossi, A. Znetti, R. Corradini, J. Agric. Food Chem., 2005, 88, 2745-2751.

Theory and Background
61
CHAPTER 4
PNA/DNA HYBRIDIZATION
4.1 Motivation
Biosensors are powerful tools aimed at providing selective identification of toxic chemical
compounds at ultratrace levels in industrial products, chemical substances, environmental
samples (e.g., air, soil, and water) or biological systems (e.g., bacteria, virus, or tissue
components) for biomedical diagnosis. Combining the exquisite specificity of biological
recognition probes and the excellent sensitivity of laser-based optical detection, biosensors are
capable of detecting and differentiating big/chemical constituents of complex systems in order
to provide unambiguous identification and accurate quantification. The demands for biosensor
techniques are fast, simple, having enough sensitivity and high selectivity to detect of target
molecules. For this purpose a stable biosensor surface is required. This demand is realized in
optical evanescent wave biosensors [1-7] as a versatile tool for the detection and
characterization of biological molecules. In this technique, catcher molecule is immobilized to
a sensor surface and the binding process after injection of a target analyte is monitored in real
time, detecting small local changes in refractive index at the sensor surface upon biomolecular
interaction. The most commonly employed biosensors are a surface plasmon resonance (SPR)
biosensor [8-14] with micro- fluidic sample. However for detection of short oligonucleotides
having several tens base pairs, the insignificant change of refractive index is not sufficient to
analysis in detail. Recently, surface plasmon field-enhanced fluorescence spectroscopy
(SPFS), which is a combination of SPR and fluorescence detection, has been introduced [15].
During the binding between catcher probe and target analyte labelled by chromophore, the
analyte bounded at the interface of metal/ solution is under evanescent field then the
chromophore can be excited giving rise to significant enhanced fluorescence intensity. To get
high fluorescence yield, the distance between analyte and metal surface is optimised by
employing functional self-assembled architecture avoiding quenching effect [16-19]. This
fluorescence intensity shows enough sensitivity to analysis the rate constants for the
biomolecular interaction quantitatively even at pM concentration of target. As a catcher probe,

Theory and Background
62
peptide nucleic acids (PNAs) has encouraged due to the great potential for the biosensor
application as mimics of DNA. PNA is an oligonucleotides mimic having neutral N- (2-
aminoethyl) glycine backbone to which the nucleobases are attached instead of the sugar-
phosphate one [20]. Several advantages are investigated for using PNA rather than DNA
probes for sensor-based hybridization. Firstly, the hybrid stability expressed as the thermal
stability (Tm) of PNA-DNA duplexes, displays in general a slightly higher value than the
corresponding DNA-DNA duplexes at physiological ionic strength. Secondly, given the fact
that PNA has a non-charged pseudopeptide backbone, its physico-chemical properties differ
significantly from polyanionic oligonucleotides.
Figure 4.1. Illustration of the DNA sensor matrix with PNA probe
In this chapter, ssPNA monolayer was constructed on a gold surface with self-assembly
and the hybridization between PNA and DNA was analyzed quantitatively on the sensor
surface by surface plasmon fluorescence spectroscopy (SPFS). Figure 4.1. depicts the
conventional hybridization process between single stranded PNA as probe and single stranded
DNA as target on the gold surface which is specially fabricated for SPFS detection. The
influence of ionic strength of bulk solution was investigated for optimizing PNA/DNA

Theory and Background
63
hybridization condition. Based on real-time monitoring of the kinetics, the rate constants for
association (kon), dissociation (koff) and the affinity constant (KA) of the hybridization were
determined by fitting the data with simple Langmuir model on the PNA immobilized sensor
surface. DNA is a highly poly-electrolytic species. The negative charges of phosphate
backbone have to be neutralized by counterions, which may be metal ions, organic amines,
positively charged proteins or, in therapeutic situations, positively charged drugs [21-27].
Thereby the metal counterions are essential for stabilization of DNA-DNA duplex. However,
PNA has the non-ionic backbone therefore the stability of PNA-DNA complexes is
insensitive to the ionic strength, in principle. To study the effect of ionic strength for MM0
and MM1 PNA/DNA hybridizations were performed in high ionic (Na+ = 150 mM) and low
ionic (Na+ = 5 ~ 10 mM) buffer solutions on the surface as well as in the solutions.
Additionally, the limit of ionic strength for PNA/DNA hybridization was investigated in
various phosphate buffer solutions (with adding salt) and water. Furthermore, the length effect
and discrimination of one base mismatched PNA/DNA duplex was achieved with apparent
rate constants. Finally the best conditions were proposed for detection of DNA target.
4.2 Immobilization of PNA Probes
4.2.1 Sequence of Nuleotides
The thiolated PNA probe (P2) used in this chapter was synthesized in our lab. It consist of
15 bases and nine ethylene glycols, which are required for improving the solubility of the
PNA to the water-based buffers for PNA/DNA hybridization and preventing the recognition
parts from contacting and reacting with the surface, acting as the spacer from the surface. The
thiol derivative is chemically reacted and immobilized with gold surface of the substrate. The
length of the recognition bases can range from 10 to several hundred bases, but the common
size for sensor application is 14-40 bases. From statistical considerations the minimum size of
a probe that is unique, is 20 bases. The length of the probe influences the spectificity and
sensitivity of the assay. Short probes hybridize faster than long ones, but are limited in
specificity. All target nucleotides were purchased from MWG-Biotech. The sequences of
PNA and DNA oligonuleotides used in this study are listed in Table 4.1.

Theory and Background
64
Name Type Sequence Modification
P2 PNA HS-(eg1)6-TGT ACA TCA CAA CTA-NH2 Thiolated
T2-15* DNA 5’-TAG TTG TGA TGT ACA-3’ Cy5 (5’ end)
T1-15* DNA 5’-TAG TTG TGA CGT ACA-3’ Cy5 (5’ end)
T2-45* DNA 5’-(TTT)5-TAG TTG TGA TGT ACA-(TTT)5-3’ Cy5 (5’ end)
T1-45* DNA 5’-(TTT)5-TAG TTG TGA CGT ACA-(TTT)5-3’ Cy5 (5’ end)
T2-75* DNA 5’-(TTT)10-TAG TTG TGA TGT ACA-(TTT)10-3’ Cy5 (5’ end)
T1-75* DNA 5’-(TTT)10-TAG TTG TGA CGT ACA-(TTT)10-3’ Cy5 (5’ end)
Table 4.1. The sequences of all of the PNA and DNA used in this chapter.
The three DNA targets T2-15*, T2-45*, T2-75* contain the identical 15 bases of
recognition sequence, which is fully complementary to P2 PNA. Other three DNA targets T1-
15*, T1-45*, T1-75* contain the identical 14 bases of recognition sequence and one
mismatched base ( mismatched base is underlined in the sequences of target DNA in Table
4.1.). In addition to that, T2-45*, T1-45*, T2-75* and T2-75* possess two flanks of poly T
(15 bases for T2-45* and T1-45*, 30 bases for T2-75* and T1-75*) on each side of the
recognition sequence. The symbol * stands for the Cy5 label at the 5’ end of the
oligonucleotides. The spectral properties of Cy5 make it a suitable dye for our purposes
(abs=649 nm, em=670 nm).
4.2.2 PNA probe assembly
In Figure 3.7, typical adsorption kinetics of two methodologies of preparation of PNA
probe and spacer MCH layers are given before and after each adsorption process. The surface
architecture was characterized by means of thickness determination using the simulation
software WINSPALL2.0. The scan curves and the corresponding simulations are depicted in

Theory and Background
65
Figure 3.8. The used optical constants and the resulting optical thickness of the layers are
summarized in Table 3.2.
Through the sequential preparation of ssPNA probe spaced with MCH, about 3 nm
thickness of probe monolayer matrix. After injecting the 1 µM ssPNA solution, which is
dissolved in 100 mM phosphate buffer solution, in the flow cell, all liquid were circulated at
the speed of 100 µL/min (very slow rate) with peristaltic pump. In the beginning, ssPNA
could be diffused near the surface and made a specific binding (sulphur-gold interation) and
non-specific binding (nitrogen-gold interaction or physisorption by van der Waals force)
exclusively. Afterward, this monolayer reached equilibrium state, which means the
immobilization reaction of ssPNA proceed at the same rate as their detached reaction from the
gold surface. Although almost signal of SPR caught up with the value of the plateau of
saturation of surface with ssPNA within 30 minutes, tens of minutes was more required to
obtain the stabilized PNA sensor surface (Figure 3.7.(a)).
Figure 4.2. Angular scan curves of the reflectivity R; (1) reference gold, (2) probe preparation of pre-mixed ssPAN and MCH, (3) sequential probe preparation of ssPNA and MCH, (4) PNA probe layers (open circles). The inset shows a zoom-in to the angles between 56 and 59 .
45 50 55 60 65
0
20
40
60
80
100
Ref
lect
ivity
R
Angle / deg
(1)
(2)
(3)
56 57 58 59
0
10
20
30
40
Ref
lect
ivity
R
Angle / deg

Theory and Background
66
Another method for preparation of ssPNA probe surface is immobilization of ssPNA and
MCH to the gold substrate together with the proper molar ratio, which was optimized
carefully. A 0.55 µM thiolated-ssPNA and 0.45 µM MCH was fully mixed in 1 mL ethanol at
the appendorf tube (1 mL volume) and that mixture was injected in the flow cell for SPR
measurement or to the incubation-cell ex-situ. In this case, there is no circulation process of
liquid because MCH, small size thiol is more predominant for immobilization with the gold
surface. Only the control of mole ratio of two components was used for obtaining the proper
PNA sensor surface. Owing to no driving force for flowing, immobilization rate is relatively
slower than circulation method and it takes much time for the complete sensor surface to
obtain, over 2 days. Through this process, we could get the about 1 nm thickness PNA sensor
surface.
4.2.3 The control of PNA probe density in sequential preparation process
The reason of less densed PNA surface is why ssPNA have experienced the competition
immobilization reaction with MCH and result in
Figure 4.3. Dilution degree of ssPNA surface with exposure of MCH solution in circulation. Immobilized PNA on the surface was exponentially replaced with MCH and diluted up to below 10% of full coverage by continuous aging of MCH solution.
0 10 20 30 40 500
20
40
60
80
100
% s
tead
y st
ate
imm
obili
zatio
n
Time / hrs
fit exponantial decay (1st order)

Theory and Background
67
The use of self-assembled monolayers for the fabrication of nucleic acid reconition
interfaces has opened up a host of new opportunities for DNA biosensors with regard to (1)
exploiting differences in the physical properties of single-stranded PNA probes relative to
double-stranded nucleic acids for the development of hybridization biosensors, and (2)
tailoring the interface for the control of protein interactions such that biosensors can be
developed, and also to permit access by nucleic acid modifying enzymes for the purposes of
sensing and fabrication of nucleic acid nanostructures.
4.3 Titration analysis of PNA/DNA hybridization at various ionic
strength
Here, the hybridization between PNA and DNA complementary matched with the
sequence of PNA was analyzed quantitatively on the sensor surface and in the solution. Based
on SPFS technique, the rate constants for association (kon), dissociation (koff) and the
equilibrium constant (KD) of the hybridization were determined by fitting the data with simple
Langmuir model on the PNA immobilized sensor surface. Alternatively, the thermodynamic
parameters of PNA/DNA duplex were carried out from melting curve in solution.
DNA is a highly poly-electrolytic species. Its phosphate negative charges have to be
neutralized by counterions, which may be metal ions, organic amines, positively charged
proteins or, in therapeutic situations, positively charged drugs [21-27]. Thereby the metal
counterions are essential for stabilization of DNA-DNA duplex. However, PNA has the non-
ionic backbone therefore the stability of PNA-DNA complexes is insensitive to the ionic
strength, in principle.
To study the effect of ionic strength for PNA/DNA hybridizations were performed in high
ionic (10mM phosphate buffer solution and NaCl = 140 mM) and low ionic (10mM, 5mM
and 1mM phosphate buffer solution only) buffer solutions on the surface as well as in the
solutions. Additionally, the limit of ionic strength for PNA/DNA hybridization was
investigated in various phosphate buffer solutions (without adding salt) and water.
According to the Langmuir model the amount of analyte adsorbed to the binding sites is
determined by the equilibrium between free and bound analyte molecules, i.e., by the surface
coverage Θ, corresponding to the fluorescence intensity, Imax. This surface coverage depends

Theory and Background
68
on the affinity constant KA and on the bulk concentration c0. It is possible to monitor the
Langmuir adsorption isotherm by performing experiments in which surface saturation is
reached by a stepwise increase (or decrease) of the bulk concentration. The general procedure
involves the injection of the analyte solution at low concentration and allowing for the
adsorption process to reach equilibrium. This process is repeated with target solutions of
higher concentrations until the surface is fully covered by analyte. In practice, the surface
coverage (c0) is determined by scaling the detected signal intensity Ifl (c0) to that of a fully
saturated surface. The Langmuir isotherm curve was constructed from the data taken at the
angle of maximum intensity of the angular scans (after rinsing for a short time) as a function
of target concentration.
An alternative measurement for the quantitative study of the hybridization process is a
titration experiment. According to the Langmuir model the amount of analyte adsorbed at a
given temperature to the binding sites is determined by the equilibrium between free and
bound analyte molecules, i.e., by the surface coverage Θ, corresponding to the fluorescence
intensity. This surface coverage depends on the affinity constant KA and on the bulk
concentration c0. It is possible to monitor the Langmuir adsorption isotherm by performing
experiments in which surface saturation is reached by a stepwise increase (or decrease) of the
bulk concentration. The general procedure involves the injection of the analyte solution at low
concentration and allowing for the adsorption process to reach equilibrium. This process is
repeated with target solutions of higher concentrations until the surface is fully covered by
analyte. The surface coverage is described by equation (1):
Ao
Afl Kc
KcccI
1)()( 0
00 (1)
In practice, the surface coverage (c0) is determined by scaling the detected signal intensity Ifl
(c0) to that of a fully saturated surface
Based on the Langmuir model the increase of the fluorescence intensity as a function of
time is described by a simple bimolecular reaction:
)))(exp(1)(()( 0max tkIItI afl , offona kckk 0 (2)

Theory and Background
69
with Imax being the maximum fluorescence intensity from surface-bound duplexes at c0. I0 is
the initial background fluorescence, and c0 the bulk solution concentration in the
measurement.
For the titration experiments, a 1 nM solution of target DNA (T2) was injected after
recording the background fluorescence and the increase in fluorescence intensity was
measured as a function of time until the equilibrium surface coverage was reached. Next,
target DNA solutions of 5, 10, 20, 50, 100 and 200 nM, respectively, were applied
consecutively, followed by rinsing step (dissociation reaction of PNA/DNA was occurred.)
with fresh buffer solution in between. After rinsing step, an angular scan was taken at each
equilibrium state with SPFS.
4.3.1 Titration analysis in various ionic strength based on sequentially prepared PNA
probe
The sequentially immobilized probe surface of HS-ssPNA and MCH (Mercaptohexanol)
on gold surface for hybridizing target DNA is easily prepared for in-situ analyzing system
with liquid flow cell, equipped for SPFS analysis. This method also has advantages of
preventing from outer contamination during rebuilding flow cell and controlling the surface
density of HS-ssPNA by limiting immersing time of probe solution.
For the preparation of the sequentially prepared self-assembled monolayer (SAM), the
clean gold substrate was immersed in 1.0 µM solution of HS-ssPNA, which was pre-solved in
100 mM phosphate buffer (pH ~ 7.2) for a specific amount of time (2~12 hrs), followed by 1
hr exposure of the sample to an aqueous solution of 1.0 mM MCH. Before analysis or
hybridization, each sample was rinsed thoroughly with deionized water (Figure 3.6 (a)).
- 150mM Phosphate buffer solution
Figure 4.4 (a) shows the titration experiment for PNA (P-2)/DNA (T-2, complementary
matched) hybridization in 150 mM ionic strength monitored at incidence angle = 55.3.
After the background fluorescence was recorded for several minutes, a 5 nM solution of
T-2 DNA target was injected and the increase in fluorescence intensity was measured as a
function of time until the equilibrium between the bulk concentration and the corresponding
surface coverage was reached.

Theory and Background
70
Figure 4.4. (a) Titration curves for PNA (P-2)/DNA (T-2) hybridization in 10mM phosphate and 140mM NaCl solution. The concentration of the Target DNA (T-2) was stepwise increased from 5 to 10, 20, 50, 100, 200, and 500 nM. Dots are data points collected every 3 minutes. The fluorescence intensity was obtained until the saturation (equilibrium) was reached. After every saturation was reached, the dissociation process was started by rinsing with pure buffer solution. (b) Angular scans taken after saturation was reached for the 5, 10, 20, 50, 100, 200 and 500 nM target solutions.
0 5 0 0 1 0 0 0 1 5 0 0 2 0 0 00 .0
2 .0 x 1 0 3
4 .0 x 1 0 3
6 .0 x 1 0 3
8 .0 x 1 0 3
1 .0 x 1 0 4
1 .2 x 1 0 4
1 .4 x 1 0 4
1 .6 x 1 0 4
1 .8 x 1 0 4
Fluo
resc
ence
(cps
)
T im e (m in )
(a )
5 nM
10 nM
20 nM
50 nM 100 nM
200 nM
500 nM
46 48 50 52 54 56 58 60 62 64
0
20
40
60
80
100
An gle (degree)
Ref
lect
ivity
(%)
0.0
2.0x10 3
4.0x10 3
6.0x10 3
8.0x10 3
1.0x10 4
1.2x10 4
1.4x10 4
1.6x10 4
Fluoresecnse (cps)
(b)
5 nM
10 nM
50 nM
100 nM 200 nM
500 nM
20 nM

Theory and Background
71
(a) (b)
Figure 4.5. (a) Plot of the saturated fluorescence intensity taken from Figure 4.4 versus target concentration c0. The red curve corresponds to the fit by the Langmuir isotherm. (b) Linearized Langmuir isotherm of the data of (a). The straight line is a fit to the data points and would correspond to an affinity constant 17100.5 MK A
Next, the injection of 10 nM, 20 nM, 50 nM, 100 nM, 200 nM, and 500 nM target in
solution of phosphate buffer (10mM) and NaCl salt (140mM), respectively, resulted in
correspondingly higher equilibrium surface coverage with the higher equivalent fluorescence
intensities (Figure 4.4 (a)).
In addition, a series of angular scans was taken after the surface coverage reached a new
equilibrium for each new bulk concentration as shown in Figure 4.4 (b). No significant shift
of the surface plasmon minimum angle was observed and the various reflectivity curves are
virtually superimposed. This means the negligible increase in the optical thickness upon
forming the PNA/DNA hybrid structure.
The Langmuir isotherm curve was constructed from the data taken at the angle of
maximum intensity of the angular scans (after rinsing for a short time) as a function of target
concentration. In Figure 4.5 (a) and (b), the solid squares are the data from angular scans
(Figure 4.5 (a)) and the solid line is a simulated Langmuir fit using equation (3). By analyzing
the dissociation phase of Figure. 4.5 (a), a dissociation rate constant of 131072.1 skoff
can be calculated. Figure 4.5 (b) corresponds to a linearized Langmuir isotherm (equation (5))
according to a modification of equation (3) with a slope giving the affinity constant 17106.3 MK A
0 100 200 300 400 500
0.0
2.0x10³
4.0x10³
6.0x10³
8.0x10³
1.0x10⁴
1.2x10⁴
1.4x10⁴
1.6x10⁴
Fluo
resc
ence
(cps
)
Concentration (nM)-100 0 100 200 300 400 500 600
-5.0x10⁻³
0.0
5.0x10⁻³
1.0x10⁻²
1.5x10⁻²
2.0x10⁻²
2.5x10⁻²
3.0x10⁻²
3.5x10⁻²
4.0x10⁻²
Con
cent
ratio
n/Fl
uore
scen
ce (n
M/c
ps)
Concentration (nM)

Theory and Background
72
00 1 c
KIc
Afl
(5)
Figure 4.6. (a) Titration curves for PNA (P-2)/DNA (T-2) hybridization in 10mM phosphate solution. All data points was collected every 3 min. The solid arrows indicate the injection of the target solution. The fluorescence was recorded until the saturation intensity was reached. (b) Angular scans taken after saturation was reached for the 5, 10, 20, 50 and 100 nM target solutions.
0 5 0 0 1 0 0 0 1 5 0 0 2 0 0 0
0 .0
2 .0 x 1 0 3
4 .0 x 1 0 3
6 .0 x 1 0 3
8 .0 x 1 0 3
1 .0 x 1 0 4
1 .2 x 1 0 4
1 .4 x 1 0 4
Fluo
resc
ence
/ cp
s
T im e / m in
(a )
50 nM
100 nM
20 nM
5 nM
10 nM
46 48 50 52 54 56 58 60 62 64
0
20
40
60
80
100
Ang le (degree)
Ref
lect
ivity
(%)
0.0
2 .0x10 3
4.0x10 3
6.0x10 3
8.0x10 3
1.0x10 4
1.2x10 4
1.4x10 4
Fluorescence (cps)
(b)
50 nM
100 nM
20 nM
5 nM
10 nM

Theory and Background
73
(a) (b)
Figure 4.7. (a) Plot of the saturated fluorescence intensity taken from Figure 4.6 versus target concentration c0. The red curve corresponds to the fit by the Langmuir isotherm. (b) Linearized Langmuir isotherm of the data of (a). The straight line is a fit to the data points and would correspond to an affinity constant 17100.7 MK A
- 10mM Phosphate buffer solution
Figure 4.6 (a) shows the titration experiment for PNA (P-2)/DNA (T-2, Complementary
matched) hybridization monitored in 10 mM ionic strength of phosphate buffer solution at
incidence angle = 55.3.
In addition, a series of angular scans was taken after the surface coverage reached a new
equilibrium for each new bulk concentration as shown in Figure 4.6 (b).
The Langmuir isotherm curve was constructed from the data taken at the angle of
maximum intensity of the angular scans (after rinsing for a short time) as a function of target
concentration. In Figure 4.7 (a) and (b), the solid squares are the data from angular scans
(Figure 4.7 (a)) and the solid line is a simulated Langmuir fit using equation (3). By analyzing
the dissociation phase of Figure. 4.7 (a), a dissociation rate constant of 131026.1 skoff
can be calculated. Figure 4.7 (b) corresponds to a linearized Langmuir isotherm (equation (5))
according to a modification of equation (3) with a slope giving the affinity constant 17100.7 MK A .
0 20 40 60 80 100
2x10³
3x10³
4x10³
5x10³
6x10³
7x10³
8x10³
9x10³
1x10⁴
Fluo
resc
ence
(cps
)
Concentration (nM)
KA =8.0*107 M-1
-20 0 20 40 60 80 100 1200.000
0.002
0.004
0.006
0.008
0.010
0.012
Con
cent
ratio
n/Fl
uore
scen
ce (n
M/c
ps)
Concentration (nM)

Theory and Background
74
Figure 4.8. (a) Titration curves for PNA (P-2)/DNA (T-2) hybridization in 1 mM phosphate solution. All data points was collected every 3 min. The solid arrows indicate the injection of the target solution. The fluorescence was recorded until the saturation intensity was reached. (b) Angular scans taken after saturation was reached for the 1, 5, 10, 20, 50 and 100 nM target solutions.
0 2 0 0 4 0 0 6 0 0 8 0 0 1 0 0 0 1 2 0 0
0 .0
2 .0 x 1 0 4
4 .0 x 1 0 4
6 .0 x 1 0 4
8 .0 x 1 0 4
1 .0 x 1 0 5
1 .2 x 1 0 5
1 .4 x 1 0 5
1 .6 x 1 0 5
1 .8 x 1 0 5
Fl
uore
scen
ce (c
ps)
T im e (m in )
(a )
1 nM
5 nM
100 nM
50 nM 20 nM
10 nM
Regenerated surface
46 48 50 52 54 56 58 60 62 64
0
20
40
60
80
100
Angle
Ref
lect
ivity
(%)
0.0
2.0x10 4
4.0x10 4
6.0x10 4
8.0x10 4
1.0x10 5
1.2x10 5
1.4x10 5
Fluorescence (cps)
(b)
1 nM
5 nM
20 nM
100 nM
10 nM
50 nM

Theory and Background
75
(a) (b)
Figure 4.9. (a) Plot of the saturated fluorescence intensity taken from Figure 4.4 versus target concentration c0. The red curve corresponds to the fit by the Langmuir isotherm. (b) Linearized Langmuir isotherm of the data of (a). The straight line is a fit to the data points and would correspond to an affinity constant 17101.6 MK A .
- 1mM Phosphate buffer solution
Figure 4.8 (a) shows the titration experiment for PNA (P-2)/DNA (T-2, Complementary
matched) hybridization monitored in 10 mM ionic strength of phosphate buffer solution at
incidence angle = 55.3.
In addition, a series of angular scans was taken after the surface coverage reached a new
equilibrium for each new bulk concentration as shown in Figure 4.6 (b).
The Langmuir isotherm curve was constructed from the data taken at the angle of
maximum intensity of the angular scans (after rinsing for a short time) as a function of target
concentration. In Figure 4.9 (a) and (b), the solid squares are the data from angular scans
(Figure 4.9 (b)) and the solid line is a simulated Langmuir fit using equation (3). By analyzing
the dissociation phase of Figure. 4.9 (a), a dissociation rate constant of 131023.1 skoff
can be calculated. Figure 4.9 (b) corresponds to a linearized Langmuir isotherm (equation (5))
according to a modification of equation (3) with a slope giving the affinity constant 17101.6 MK A .
0 20 40 60 80 100
0.0
2.0x10⁴
4.0x10⁴
6.0x10⁴
8.0x10⁴
1.0x10⁵
1.2x10⁵
1.4x10⁵
1.6x10⁵
Fluo
resc
ence
(cps
)
Conc. (nM)
0 20 40 60 80 100-0.0001
0.0000
0.0001
0.0002
0.0003
0.0004
0.0005
0.0006
0.0007
0.0008
Con
c./F
luor
esce
nce
(nM
/cps
)
Conc. (nM)

Theory and Background
76
Figure 4.10. (a) Titration curves for PNA (P-2)/DNA (T-2) hybridization in 10mM phosphate and 140mM NaCl solution. All data points was collected every 3 min. The solid arrows indicate the injection of the target solution. The fluorescence was recorded until the saturation intensity was reached. (b) Angular scans taken after saturation was reached for the 5, 10, 20, 50 and 100 nM target solutions
0 1 0 0 2 0 0 3 0 0 4 0 0 5 0 0 6 0 0 7 0 0
0 .0
5 .0 x 1 0 4
1 .0 x 1 0 5
1 .5 x 1 0 5
2 .0 x 1 0 5
2 .5 x 1 0 5
3 .0 x 1 0 5
Fl
uore
scen
ce (c
ps)
T im e (m in )
(a )
5 nM
10 nM
20 nM
50 nM 100 nM
5 nM
10 nM
20 nM
50 nM 100 nM
4 6 4 8 5 0 52 5 4 5 6 58 60 6 2 6 4
0
10
20
30
40
50
60
70
80
90
1 00
A n g le
Ref
lect
ivity
(b )
0
1x 1 0 5
2x 1 0 5
3x 1 0 5
Fluorescence

Theory and Background
77
(a) (b)
Figure 4.11. (a) Plot of the saturated fluorescence intensity taken from Figure 4.4 versus target concentration c0. The red curve corresponds to the fit by the Langmuir isotherm. (b) Linearized Langmuir isotherm of the data of (a). The straight line is a fit to the data points and would correspond to an affinity constant 17104.9 MK A .
4.3.2 Titration analysis in various ionic strength based on pre-mixed PNA probe
The gold substrate was directly incubated over 2 days in a binary mixed thiol solution of a
thiolated ssPNA and a spacer MCH at a molar ratio of 55:45, which is the optimized
condition in laboratory and a total concentration of 1 µM in absolute ethanol (Aldrich) in
order to control the surface density and to minimize non-specific binding of analyte (target)
ssDNA.
- 150mM Phosphate buffer solution
Figure 4.10 (a) shows the titration experiment for PNA (P-2)/DNA (T-2, Complementary
matched) hybridization monitored in 10 mM ionic strength of phosphate buffer solution at
incidence angle = 55.3.
The Langmuir isotherm curve was constructed from the data taken at the angle of
maximum intensity of the angular scans (after rinsing for a short time) as a function of target
concentration. In Figure 4.11 (a) and (b), the solid squares are the data from angular scans
(Figure 4.11 (b)) and the solid line is a simulated Langmuir fit using equation (3).
0 20 40 60 80 100
5.0x10⁻⁵
1.0x10⁻⁴
1.5x10⁻⁴
2.0x10⁻⁴
2.5x10⁻⁴
3.0x10⁻⁴
3.5x10⁻⁴
4.0x10⁻⁴
Con
c/Fl
uore
scen
ce (n
M/c
ps)
Conc (nM)0 20 40 60 80 100
0.0
5.0x10⁴
1.0x10⁵
1.5x10⁵
2.0x10⁵
2.5x10⁵
3.0x10⁵
Fluo
resc
ence
(cps
)
Conc. (nM)

Theory and Background
78
Figure 4.12. (a) Titration curves for PNA (P-2)/DNA (T-2) hybridization in 10mM phosphate solution. All data points was collected every 3 min. The solid arrows indicate the injection of the target solution. The fluorescence was recorded until the saturation intensity was reached. (b) Angular scans taken after saturation was reached for the 5, 10, 20, 50 and 100 nM target solutions
0 5 0 0 1 0 0 0 1 5 0 0 2 0 0 0 2 5 0 0
2 .0 x 1 0 3
4 .0 x 1 0 3
6 .0 x 1 0 3
8 .0 x 1 0 3
1 .0 x 1 0 4
1 .2 x 1 0 4
Fl
uore
scen
ce /
cps
T im e / m in
(a )
5 nM
10 nM
20 nM 50 nM
100 nM
500 nM
46 48 50 52 54 56 58 60 62 640
20
40
60
80
100
A ng le (deg ree )
Ref
lect
ivity
(%)
(b)
0
1x10 3
2x10 3
3x10 3
4x10 3
5x10 3
6x10 3
7x10 3
8x10 3
9x10 3
1x10 4
Fluorescence (cps)
5 nM
10 nM 20 nM
50 nM
100 nM

Theory and Background
79
(a) (b)
Figure 4.13. (a) Plot of the saturated fluorescence intensity taken from Figure 4.4 versus target concentration c0. The red curve corresponds to the fit by the Langmuir isotherm. (b) Linearized Langmuir isotherm of the data of (a). The straight line is a fit to the data points and would correspond to an affinity constant 18105.1 MK A
By analyzing the dissociation phase of Figure. 4.11 (a), a dissociation rate constant of 151063.3 skoff can be calculated. Figure 4.11 (b) corresponds to a linearized Langmuir
isotherm (equation (5)) according to a modification of equation (3) with a slope giving the
affinity constant 17104.9 MK A .
- 10mM Phosphate buffer solution
Figure 4.12 (a) shows the titration experiment for PNA (P-2)/DNA (T-2, Complementary
matched) hybridization monitored in 10 mM ionic strength of phosphate buffer solution at
incidence angle = 55.3.
The Langmuir isotherm curve was constructed from the data taken at the angle of
maximum intensity of the angular scans (after rinsing for a short time) as a function of target
concentration. In Figure 4.13 (a) and (b), the solid squares are the data from angular scans
(Figure 4.13 (b)) and the solid line is a simulated Langmuir fit using equation (3). By
analyzing the dissociation phase of Figure. 4.13 (a), a dissociation rate constant of 141049.7 skoff can be calculated. Figure 4.13 (b) corresponds to a linearized Langmuir
isotherm (equation (5)) according to a modification of equation (3) with a slope giving the
affinity constant 18105.1 MK A .
0 20 40 60 80 1003x103
4x10³
5x10³
6x10³
7x10³
8x10³
9x10³
1x10⁴
Fluo
resc
ence
(cps
)
Concentration (nM)
KA =1.9*108 M-1
-20 0 20 40 60 80 100 1200.000
0.002
0.004
0.006
0.008
0.010
0.012
Con
cent
ratio
n/Fl
uore
scen
ce (n
M/c
ps)
Concentration (nM)

Theory and Background
80
Figure 4.14. (a) Titration curves for PNA (P-2)/DNA (T-2) hybridization in 10mM phosphate. All data points was collected every 3 min. The solid arrows indicate the injection of the target solution. The fluorescence was recorded until the saturation intensity was reached. (b) Angular scans taken after saturation was reached for the 1, 10, 50 and 100 nM target solutions
0 1 0 0 0 2 0 0 0 3 0 0 0 4 0 0 00
1 x 1 0 4
2 x 1 0 4
3 x 1 0 4
4 x 1 0 4
5 x 1 0 4
6 x 1 0 4
7 x 1 0 4
8 x 1 0 4
9 x 1 0 4
1 x 1 0 5
Fluo
resc
ence
(cps
)
T im e (m in )
(a )
1 nM
10 nM
50 nM
100 nM
Regenerated surface
46 48 50 52 54 56 58 60 62 64
0
20
40
60
80
100
A ng le
Ref
lect
ivity
(%)
(b)
0
1x10 4
2x10 4
3x10 4
4x10 4
5x10 4
6x10 4
7x10 4
8x10 4
Fluorescence (cps)1 nM
10 nM
50 nM
100 nM

Theory and Background
81
(a) (b)
Figure 4.15. (a) Plot of the saturated fluorescence intensity taken from Figure 4.4 versus target concentration c0. The red curve corresponds to the fit by the Langmuir isotherm. (b) Linearized Langmuir isotherm of the data of (a). The straight line is a fit to the data points and would correspond to an affinity constant 17101.8 MK A
- 1mM Phosphate buffer solution
Figure 4.14 (a) shows the titration experiment for PNA (P-2)/DNA (T-2, Complementary
matched) hybridization monitored in 10 mM ionic strength of phosphate buffer solution at
incidence angle = 55.3.
The Langmuir isotherm curve was constructed from the data taken at the angle of
maximum intensity of the angular scans (after rinsing for a short time) as a function of target
concentration. In Figure 4.15 (a) and (b), the solid squares are the data from angular scans
(Figure 4.15 (b)) and the solid line is a simulated Langmuir fit using equation (3). By
analyzing the dissociation phase of Figure. 4.15 (a), a dissociation rate constant of 131029.1 skoff can be calculated. Figure 4.15 (b) corresponds to a linearized Langmuir
isotherm (equation (5)) according to a modification of equation (3) with a slope giving the
affinity constant 17101.8 MK A .
4.4 Kinetic analysis of PNA/DNA hybridization at various ionic strength
If a target solution is applied to a probe-modified sensor surface, it is difficult to observe a
response effectively by SPR because duplex formation with oligomeric DNA does not
0 100 200 300 400 500
0
1x10⁴
2x10⁴
3x10⁴
4x10⁴
5x10⁴
6x10⁴
7x10⁴
8x10⁴
9x10⁴
1x10⁵
Fluo
resc
ence
(cps
)
Conc. (nM)0 100 200 300 400 500
0.000
0.001
0.002
0.003
0.004
0.005
0.006
Con
c./F
luor
esce
nce
(nM
/cps
)
Conc. (nM)

Theory and Background
82
generate a significant change in the optical thickness. However, SPFS measurements
demonstrated a high sensitivity for monitoring a binding event between immobilized PNA
and chromophor-labeled target DNA even at concentrations in the fM range. This
fluorescence intensity carries kinetic information of hybridization and can be analyzed in
terms of the corresponding rate constants for association (kon), dissociation (koff), and the
affinity constant (KA).
For the general kinetic analysis, Cy-5 labeled DNA target solutions (varying in
concentration from 1 nM up to 200 nM) were introduced into the flow cell for the association,
and allowed to interact with the PNA functionalized sensor surface until saturation point
(plateau stage). After that the dissociation was followed by rinsing with fresh buffer solution
(1~150 mM phosphate buffer solution). The surfaces could be fully regenerated by treatment
with 100 mM NaOH in order to remove remaining bound target DNA for another analysis
cycle at the same sensor surface.
For the kinetic experiment of PNA/DNA hybridization, sequentially immobilized PNA
probe (seq. prepared PNA probe) of P2 PNA and MCH continuously in 100 mM phosphate
buffer and externally incubated PNA probe (pre. prepared PNA probe) of pre-mixture of P2
PNA and MCH in ethanol was used as a catcher probe surface as in the titration experiment.
The angle of incidence was fixed at = 55.3 for monitoring the PNA/DNA hybridization.
Kinetics curves were recorded in both the reflectivity and fluorescence mode, starting with a
measurement of the fluorescence background for a few minutes as a function of time. All the
experiments were performed with 1 mL for each target concentration using the same flow cell
with an inlet and outlet and a closed loop circulation at room temperature (24 1 oC) and at a
flow rate of 10 μL/sec.
The kinetic experiment was performed as follows: a 200 nM solution of target DNA T-2
was injected in specific ionic strength solution, varying 1,5, 10 and 150 mM buffer and the
increase in fluerescence intensity measured as a function of time until the surface coverage
reached equilibrium, followed by rinsing steps (dissociation reaction of PNA/DNA duplex
was occurred) with fresh phosphate buffer in between. The analysis of this experiment is also
based on the simple Langmuir model.
The collected results for the hybridization of sequentially prepared P2 PNA probe and T2
DNA target on the sensor surface are presented in Figure 4.16 (a) and Table 4.3. For a single
PNA/DNA hybridization in 150 mM buffer solution, the affinity constant was determined to
be 17107.4 MK A by using a single exponential Langmuir fit. The KA value obtained in a

Theory and Background
83
single kinetic experiment is in good agreement with the KA value calculated in the titration
analysis (Figure. 4.5 (b)).
0 100 200 300 400 500
0.0
2.0x10⁴
4.0x10⁴
6.0x10⁴
8.0x10⁴
1.0x10⁵
1.2x10⁵
1 mM5 mM10 mMFl
uore
scen
ce (c
ps)
Time (min)
150 mM
(a)
0 100 200 300 400 500 600 700 800
0.0
2.0x10⁴
4.0x10⁴
6.0x10⁴
8.0x10⁴
1.0x10⁵
1.2x10⁵
1.4x10⁵
1 mM5 mM10 mM150 mM
Fluo
resc
ence
(cps
)
Time (min)
(b)
Figure 4.16. (a) Hybridization kinetics for sequentially prepared PNA (P2) and complementary matched DNA (T2, mm0) target at different phosphate buffer solutions (1, 5, 10 and 150 mM). Kinetic curves were recorded by SPFS as a function of time (open circle). (b) Hybridization kinetics for pre-mixed prepared PNA (P2) and complementary matched DNA (T2, mm0) target at different phosphate buffer solutions. The solid curve corresponds to the fit by the Langmuir isotherm. From Langmuir model, the rate constant can be achieved.

Theory and Background
84
For varing in 5 and 10 mM buffer solution, the affinity constant ( 17109.2 MK A in 5 mM
and 17105.4 MK A in 10 mM) are not significantly different comparing with the affinity
constant of PNA/DNA hybridization in 150 mM buffer solution. The KA value from the
hybridization in 1 mM buffer solution is slightly higher than those of more ionic strength
condition.
Figure 4.17 (b) and Table 4.3 shows the kinetic experiment for the hybridization of pre-
mixed prepared P2 PNA and T2 DNA target. By using a single exponential Langmuir fit, the
affinity constants of the PNA/DNA hybridization in 1 mM ( 18100.2 MK A ), 5 mM
( 18101.1 MK A ), 10 mM ( 18103.1 MK A ) and 150 mM ( 18105.2 MK A ) buffer
solution can be achieved. Although the slight difference of each KA value in varying ionic
strength condition exists such as the kinetic experiment with sequentially prepared PNA probe,
it’s not considerable issue rather than DNA/DNA hybridization. Consequently, the ionic
strength shows poor influence on the hybridization of PNA and DNA.
However, DNA/DNA hybridization reactions, in general, are very ionic strength
dependent. Various contributions to the observed effects have been identified: (1) first of all,
DNA shows a limited solubility at low ionic strength, (2) at the single strand level, changing
the ionic strength results in a change of the degree of stretching of these oligo-electrolytes, (3)
the hybridization reaction at a single site on the sensor surface strongly responds to any
change in ionic strength of the bulk solution simply because the charges along the probes
repel the co-charges along the target strands that are approaching from solution in low ionic
strength buffer much more than at high ionic strength, and (4) single or double strands on
individual sites on the sensor surface talk to their neighbors via their electrostatic interaction
unless they are sufficiently (laterally) separated. For the employed PNA catcher probe matrix
only at the very beginning of the hybridization reaction, i.e., at a negligible DNA target
surface coverage, the ionic strength does not play a role for the hybridization reaction. As
soon as a significant fraction of the probe binding sites are occupied electrostatic cross talk
sets in. For the experiments in very low ionic strength buffer the level of fluorescence
intensity that is reached at saturation constantly increased with increasing ionic strength up to
10 mM. We interpret this dependence as a direct consequence of the electrostatic repulsion
between neighboring DNA (target) strands leading to an effective reduction of the affinity
constant and, hence, a reduced coverage for the lower ionic strength buffers at otherwise
identical conditions, in particular, at identical bulk target concentrations. Nevertheless, it is

Theory and Background
85
remarkable that a significant hybridization could be observed even in pure water. This is
impossible for DNA/DNA hybridization experiment given the solubility limits for DNA.
The other clear indication for an ionic strength dependent cross talk between individual
sites are the deviations in the kinetics with increasing coverage, again much more pronounced
for the low ionic strength, e.g., 1 mM and 5 mM, than at high ionic strength, e.g., for a 150
mM buffer (Figure 4.16).
Due to these deviations in the Langmuir fits the obtained rate constants are only approximate.
Nevertheless, it can be clearly seen that the ionic strength effect for PNA/DNA interactions
does not result in any drastic changes of the rate constants compared with the situation for
DNA/DNA hybridization. Because of the neutral nature of the PNA, the charge density
accumulating at the interface during the hybridization with DNA is considerably lower than
that of DNA/DNA hybridization minimizing repulsion effects. Based on the Langmuir model,
the rate constants, kon and koff and affinity constant, KA for individual interaction were
calculated and summarized in Table 4.3.
Table 4.2. The rate constants and affinity constants for P2 PNA and T2 DNA hybridization in 150, 10, 5 and 1 mM phosphate buffer solutions.
An additional effect can be seen in the hybridization kinetics of pre-mixed prepared PNA
probe and DNA. For the highest ionic strength at 150 mM buffer condition, the level of
fluorescence is definitely lower than that in 10 mM buffer solution. This effect comes into
play: the efficient screening of the charges of the oligonucleotide backbone results in a less
Ionic Strength / mM Na+
150 10 5 1
koff / M-1s-1 7.5 10-4 1.1 10-3 6.7 10-4 8.2 10-4
kon / s-1 3.5 104 3.0 104 2.9 104 6.4 104 Sequentially prepared
P2-PNA KA / M-1 4.7 107 2.9 107 4.5 107 7.8 107
koff / M-1s-1 6.3 10-4 6.8 10-4 5.2 10-4 6.0 10-4
kon / s-1 1.6 105 8.8 104 5.9 104 1.2 105 Pre-mixed prepared
P2-PNA KA / M-1 2.5 108 1.3 108 1.1 108 2.9 108

Theory and Background
86
stretched configuration of the oligonucleotide chain and hence places the chromophore, after
hybridization, closer to the metal surface. As a result, the emission is partially quenched and
the observed intensity of fluorescence reduced.
45 50 55 60 65
0.0
3.0x10⁵
6.0x10⁵
9.0x10⁵
1.2x10⁶
1.5x10⁶
1.8x10⁶
Fluo
resc
ence
(cps
)
Angle (degree)
70% increase
(a)
45 50 55 60 65
0.0
2.0x10⁵
4.0x10⁵
6.0x10⁵
8.0x10⁵
1.0x10⁶
Fluo
resc
ence
(cps
)
Angle (degree)
120% increase
(b)
Figure 4.17. (a) After the hybridization of sequentially prepared PNA and DNA in 150 mM buffer solution, angular scan can be taken in 150 mM fresh buffer solution (open square) and 10 mM fresh buffer solution (circle). (b) After the hybridization of pre-mixed prepared PNA and DNA in 150 mM buffer solution, angular scan can be taken in 150 mM fresh buffer solution (open square) and 10 mM fresh buffer solution (circle).
This effect is also deeply related with the density of actual catcher probe on the sensor
surface. The pre-mixed prepared PNA probe surface is approximately 3 times less dense than
the sequentially prepared PNA probe (see Chapter 3.2). In more dense probe surface
( sequentially prepared PNA surface), PNA/DNA hybrid structure can be electrically
influenced and cross-talk with neighbours and hence the changes (stretched or coiled) of the
configuration of PNA/DNA duplex is not easily happened. However, for less dense probe
surface (pre-mixed prepared PNA surface), each PNA/DNA hybrid structure is efficiently
isolated and separated probe system prevent hybridized PNA/DNA form from
electrostatically interacting with neighbours, being freely changeable in its configuration. The
other clear indication for configuration changes of PNA/DNA are fluorescence intensity
increase switching from 150 mM to 10 mM buffer solution for angular scan with SPFS. For
the pre-mixed prepared PNA probe, decrease of ionic strength of bulk solution can make the
fluorescenc intensity increasing 50 % furthermore, compared with that of sequentially
prepared PNA probe. From this result, less dense PNA/DNA duplex structure is easily
changeable by the environmental ionic strength in configuration (stretched or coiled) and
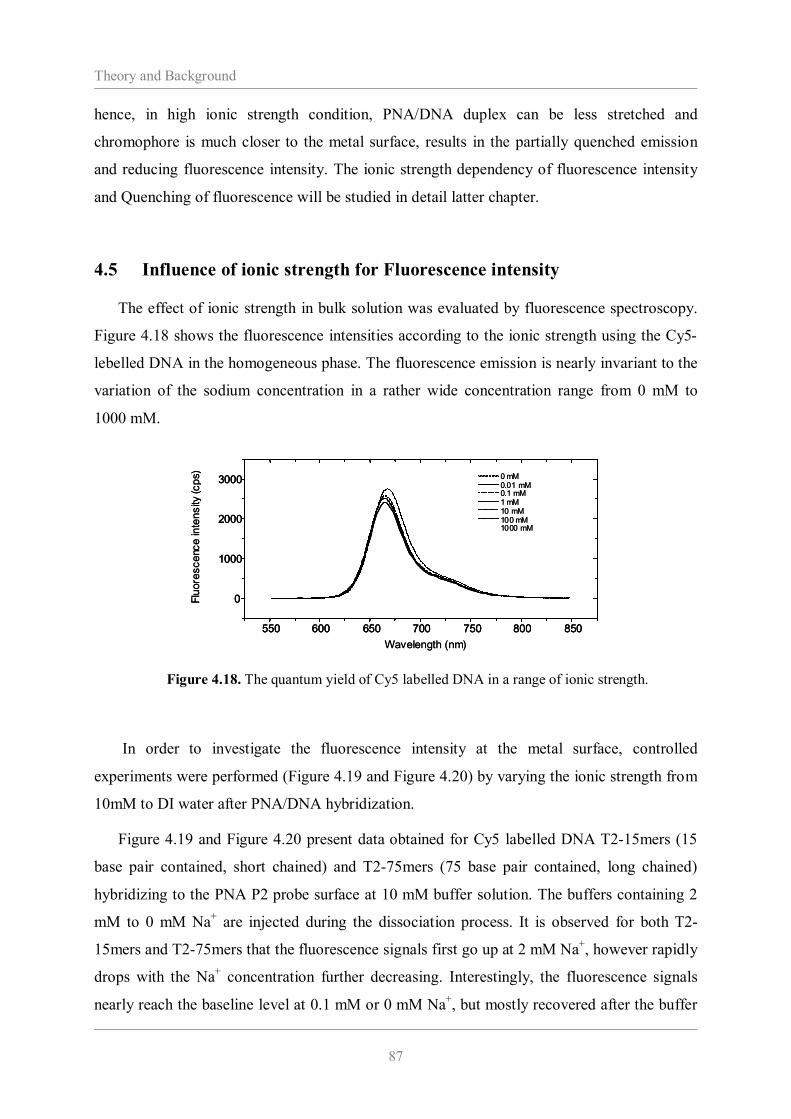
Theory and Background
87
hence, in high ionic strength condition, PNA/DNA duplex can be less stretched and
chromophore is much closer to the metal surface, results in the partially quenched emission
and reducing fluorescence intensity. The ionic strength dependency of fluorescence intensity
and Quenching of fluorescence will be studied in detail latter chapter.
4.5 Influence of ionic strength for Fluorescence intensity
The effect of ionic strength in bulk solution was evaluated by fluorescence spectroscopy.
Figure 4.18 shows the fluorescence intensities according to the ionic strength using the Cy5-
lebelled DNA in the homogeneous phase. The fluorescence emission is nearly invariant to the
variation of the sodium concentration in a rather wide concentration range from 0 mM to
1000 mM.
550 600 650 700 750 800 850
0
1000
2000
3000
Fluo
resc
ence
inte
nsity
(cps
)
Wavelength (nm)
0 mM0.01 mM 0.1 mM1 mM10 mM100 mM1000 mM
550 600 650 700 750 800 850
0
1000
2000
3000
550 600 650 700 750 800 850
0
1000
2000
3000
Fluo
resc
ence
inte
nsity
(cps
)
Wavelength (nm)
0 mM0.01 mM 0.1 mM1 mM10 mM100 mM1000 mM
Figure 4.18. The quantum yield of Cy5 labelled DNA in a range of ionic strength.
In order to investigate the fluorescence intensity at the metal surface, controlled
experiments were performed (Figure 4.19 and Figure 4.20) by varying the ionic strength from
10mM to DI water after PNA/DNA hybridization.
Figure 4.19 and Figure 4.20 present data obtained for Cy5 labelled DNA T2-15mers (15
base pair contained, short chained) and T2-75mers (75 base pair contained, long chained)
hybridizing to the PNA P2 probe surface at 10 mM buffer solution. The buffers containing 2
mM to 0 mM Na+ are injected during the dissociation process. It is observed for both T2-
15mers and T2-75mers that the fluorescence signals first go up at 2 mM Na+, however rapidly
drops with the Na+ concentration further decreasing. Interestingly, the fluorescence signals
nearly reach the baseline level at 0.1 mM or 0 mM Na+, but mostly recovered after the buffer

Theory and Background
88
concentration is switched back to 10 mM. The signal gains at 2 mM Na+ is due to the fact that
in the ultra-low salt concentration the enhanced electrostatic interaction on the dense surface
stretches the DNA strands further. This is not observed in the homogeneous phase (Figure
4.18).
Although the effect of ionic strength is negligible for the binding kinetics, the
fluorescence intensity for PNA/DNA hybridization was influenced by the ionic strength as
shown in Figure 4.19 and Figure 4.20. That phenomenon could be understood in respect of
surface plasmon optics. In principle, the chromophors near the metal/solution interface can be
excited by evanescence field generated from surface plasmon. The emitted fluorescence
photons are monitored during hybridization event in real time. In order to achieve an
optimized fluorescence signal and not to lose too much intensity by energy transfer to the
metal substrate, the chromophors have to be separated sufficiently from the metal surface.
Chromophors close to the metal is quenched easily leading low fluorescence yield. The
PNA/DNA duplex in water (low ionic strength) can be precipitated easily due to the PNA
solubility so the chromophors sit very close to the metal surface. Thereby the fluorescence
intensity for hybridizations in low ionic strength (0.1 mM and DI water) is much less than in
high ionic strength.
As a result, the chromophors are close to the metal surface loosing fluorescence intensity.
The maximum hybridization signal was achieved at about 2 mM phosphate buffer solution.
By changing with water, the fluorescence intensity dropped down immediately to the intensity
of PNA/DNA hybridization done at water (Figure 4.19 and Figure 4.20). The fluorescence
intensity was almost recovered by switching 10 mM buffer solution after all varying ionic
strength and visually appeared on the prolongation of the dissociation curve. Actually, the
fluorescence changes are not due to the amount of bound DNA target but due to the distance
of dye and metal surface.
By varying the ionic strength, the geometric rearrangement of PNA/DNA duplex might be
changed, that means different distance from surface to chromophors can influence on the
fluorescence intensity. SPFS provides enough sensitivity for small configuration change of
PNA/DNA duplex on the sensor surface.

Theory and Background
89
0 50 100 150 200 250
0
1x10⁵
2x10⁵
3x10⁵
4x10⁵
5x10⁵
6x10⁵
7x10⁵
Fluo
resc
ence
(cps
)
Time (min)
10mM 5mM 2mM 1mM 0.1mM D.I. water
(a)
-50 0 50 100 150 200 250 300 350
0.0
5.0x10⁴
1.0x10⁵
1.5x10⁵
2.0x10⁵
2.5x10⁵
Fluo
resc
ence
(cps
)
Time (min)
10mM 5mM 2mM 1mM 0.1mM D.I. water
(b)
Figure 4.19. (a) Fluorescence intensity of sequentially prepared P2 PNA and T2-(15 base pairs) DNA duplex in varying ionic strength during dissociation process. After hybridization and 20 minutes dissociation process in 10 mM buffer solution, the buffer solution was changed to 5, 2, 1, 0.1 mM phosphate buffer and DI water, respectively. (b) Fluorescence intensity of sequentially prepared P2 PNA and T2-(75 base pairs) DNA duplex in varying ionic strength during dissociation process. After hybridization and 20 minutes dissociation process in 10 mM buffer solution, the buffer solution was changed to 5, 2, 1, 0.1 mM phosphate buffer and DI water, respectively.

Theory and Background
90
0 50 100 150 200 250 300
0.0
2.0x10⁵
4.0x10⁵
6.0x10⁵
8.0x10⁵
1.0x10⁶
1.2x10⁶
Fluo
resc
ence
(cps
)
Time (min)
10mM 5mM 2mM 1mM 0.1mM 0.01mM D.I. Water
(a)
-50 0 50 100 150 200 250 300 350 400
0
1x10⁵
2x10⁵
3x10⁵
4x10⁵
5x10⁵
6x10⁵
7x10⁵
Fluo
resc
ence
(cps
)
Time (min)
10mM 5mM 2mM 1mM 0.1mM D.I. Water
(b)
Figure 4.20. (a) Fluorescence intensity of pre-mixed prepared P2 PNA and T2-(15 base pairs) DNA duplex in varying ionic strength during dissociation process. After hybridization and 20 minutes dissociation process in 10 mM buffer solution, the buffer solution was changed to 5, 2, 1, 0.1, 0.01 mM phosphate buffer and DI water, respectively. (b) Fluorescence intensity of sequentially prepared P2 PNA and T2-(75 base pairs) DNA duplex in varying ionic strength during dissociation process. After hybridization and 20 minutes dissociation process in 10 mM buffer solution, the buffer solution was changed to 5, 2, 1, 0.1 mM phosphate buffer and DI water, respectively.

Theory and Background
91
In Figure 4.21, the fluorescence intensity at varying ionic strength below 10 mM (Figure
4.19 and Figure 4.20) was summarized in reference of the fluorescence intensity in 10 mM
buffer solution. From the results, interesting phenomenon in low ionic strength region ( 5 ~ 1
mM ) and ultra-low ionic strength period ( 0.1 mM and DI water condition) have been
identified. From the experiments of switching the buffer to 5, 2 and 1 mM buffer solution, the
deviation of fluorescence intensity of PNA hybridized with a long chain DNA (75 base pairs)
is much larger than that of a short chain DNA (15 base pairs), owing to the distance changes
of chromophore from the metal surface. For a long chain DNA (75 base pairs), the difference
of the distance to gold surface between fully stretched and totally coiled configuration is
much larger, results in more deviated intensity of fluorescence. In ultra-low ionic strength
condition ( 0.1 mM phosphate buffer and DI water), the intensity of emitted fluorescence
drastically dropped down close to base line in SPFS, caused by collapsing of the PNA/DNA
duplex to the metal surface and resulting in quenching effect at near field of metal surface.
The collapsing of PNA/DNA is easily predicted because the PNA has a very poor solubility in
de-ionized water.
0
0.2
0.4
0.6
0.8
1
1.2
1.4
1.6
1.8
2
10 5 2 1 0.1 0
[Na] conc.
A.U
.
Pre-15merSeq-15merPre-75merSeq-75mer
Figure 4.21. Comparison of fluorescence intensity in varying ionic strength condition (10 mM ~ DI water) for hybridized PNA and 15mers and 75mers, prepared with a way of sequential and pre-mixed method.

Theory and Background
92
As we know, possessing a neutral backbone, PNA is nearly inert to the surrounding ionic
strength, while DNA can be viewed as a strong polyelectrolyte owing to the phosphate group
on each nucleotide. Thus the sodium ions realize the adjustment of the dye-to-surface distance
by reacting on the DNA carriers. Two kinds of electrostatic repulsions will be considered if
the bound DNA is exposed to low-salt condition, the intra- and inter-strand repulsion. They
are both arising from the mutual inter-phosphate electrostatic interaction, and would be
substantially enhanced upon reduced shielding. The intra-strand repulsion is expected to
disrupt the intra-molecular structure (such as hairpin) and stretch the strand locally.
Meanwhile, the bound DNA strands tend to repel the neighboring strands, which prevent
them from randomly lying down on the surface.
Figure 4.22. The configuration changes of DNA duplex structure depend upon the ionic strength.
Metal m
Prism p
Water d
Dye Distance d (A)
(B)
(C)
Low ionic condition High ionic condition
ssttrreecchheedd ccooiilleedd

Theory and Background
93
Geometrically, an ordered orientation of the DNA strands would be formed on an
extremely dense surface in order to minimize the repulsion, upon exposure to low salt
condition. Both of the two repulsions contribute to the stretching of the DNA strands. The two
repulsions are strongly dependent on the surrounding salt concentration, and both are reduced
in high salt condition, which elucidates the fluorescence loss during the buffer switch
presented in Figure 5.2(A) and Figure 5.2(C) and schematically illustrated in Figure 5.3.
According to Manning’s report, the local ionic strength surrounding the DNA strands
increases with the increase of the bulk ionic strength before a certain threshold; for
monovalent cations, as the local ionic strength approaches 1 M, it is relatively stable to a
further increase of the bulk ionic strength. 1 M monovalent cations can sufficiently neutralize
~76% of the DNA charges, but not further. It illustrates the tendency of the fluorescence
response with the bulk ionic strength variation. That is, as described both by Figure 5.2(B)
and Figure 5.2(D), the fluorescence decrease is sensitive to the increase of the sodium
concentration below 500 mM; while above 500 mM, the increase of the bulk sodium
concentration only induces a slight decrease of the fluorescence. It appears that 500 mM bulk
Na+ concentration is a critical point, on which the local sodium concentration approaches 1 M.
Considering the two-segment dependence, Figure 5.2(B) and Figure 5.2(D) are fitted with a
double exponential decay function, which yields calibration profiles for T75* and Mu-196.
These profiles can be used to compensate the underestimation of the fluorescence signal at
higher ionic strengths.
4.6 Fluorescence quenching
Information about the properties of macromolecules and their interactions with other
molecules can be obtained from studies of the fluorescent spectra. There are many
environmental factors that affect fluorescent efficiency. Only a proportion of the light energy
originally absorbed is emitted as radiation, since some energy may be lost in vibrational
transitions. Two further processes can diminish or quench the amount of light energy emitted
from the sample. Internal quenching is due to some intrinsic structural feature of the excited
molecule involving, for example, structural rearrangement. External quenching arises either
from interaction of the excited molecule with another molecule present in the sample or
absorption of exciting or emitted light by another chromophore present in the sample. All
forms of quenching result in a non-radiative loss of energy. External quenching may be due to

Theory and Background
94
contaminants present in the preparations. Hence great care must be taken in carrying out
fluorescence measurements to ensure the absence of quenchers from the sample and all
solutions used.
0 200 400 600 800 1000 1200
0.0
2.0x10⁴
4.0x10⁴
6.0x10⁴
8.0x10⁴
1.0x10⁵
1.2x10⁵
1.4x10⁵
1.6x10⁵
1.8x10⁵
Immobilization in 100 mM buffer
Fluo
resc
ence
(cps
)
Time (min)
FLincrease
Injection of DI water
(a)
46 48 50 52 54 56 58 60 6240
50
60
70
80
90
in 100 mM
Angle (degree)
Ref
lect
ivity
(%)
in DI water
before immobilization
0
1x10⁵
2x10⁵
3x10⁵
4x10⁵
5x10⁵
Fluorescence (cps)
(b)
Figure 4.23. (a) Fluorescence intensity during the immobilization of labelled silaned DNA-100mers on 50 nm thickness SiOx modified substrate and switching 100 mM buffer to DI water after immobilization step (b) Angular scan curves before and after the immobilization of silaned DNA on SiOx surface in each ionic strength.

Theory and Background
95
To investigate the quenching effect of self-assembled DNA strand with Cy-5
chromophores on the metal surface, approximately 50 nm thickness silicon oxide films in
metal surface by thermal evaporation. SiOx film was used as spacers to separate the
chromophore from the metal surface. The chromophore labelled 100 base paired SH-DNA
single strand was immobilized on the SiOx modified surface in 100 mM phosphate buffer
solution and fluorescence data was obtained in real-time by SPFS. In plateau of fluorescence
intensity of immobilization process, switching the buffer solution to de-ionized water and
then angular scan was followed.
Figure 4.23 (a) shows the immobilization of Cy-5 labelled and thiol-terminated 100 base
paired DNA strand in 100 mM phosphate buffer solution in general establishment process of
SAM layer. After complement of immobilization, pure 10 mM PB buffer solution and DI
water were sequentailly applied in the rinsing phase. In rinsing step with 10 mM PB buffer
and DI water, the angular scan curves were obtained by increasing the angle of incidence
(from 45° to 65°) stepwise (Figure 4,23 (b)). For the conventional sensor surface system
studied in this chapter, Au / oligonucleotide-Cy5, PNA/DNA duplex was consequently
collapsed to the metal surface in DI water buffer condition and resulted in the totally
quenched emission and reducing fluorescence intensity up to baseline of fluorescence
intensity without chromophore (see Figure 4.19 and Figure 4.20). Although the single-strand
Cy5 labelled DNA would be collapsed to the surface in DI water same as the results of above
studies for the configuration deviation of PNA/DNA duplex, directly established on the metal
surface without spacer layer, the fluorescence intensity of dye layer drastically went up tens
orders of magnitude higher compared with those of normal ionic strength (e.g. 10 mM or 100
mM buffer solution) condition as presented in Figure 4.23(b).
The dominance of the quenching effect strongly depends in the chromophore distance to
the metal surface. Shifting the Cy-5 away from the surface may lead to an emission
enhancement by orders of magnitude. This dependence is of major importance for the
optimization of surfaces that are used to support the immobilization and hybridization of
oligonucleotide labelled with chromophore. The deviation of fluorescence intensity of
labelled DNA target hybidized with probe PNA or single-strand Cy-5 labelled DNA
immobilized on metal surface in various ionic strength is well explained by the assumption of
the geometrically changes of oligonucleotide configuration and the distance-dependent
quenching effect of dye labelled strand layer to the metal surface.

Theory and Background
96
4.7 Conclusion
In this chapter, two kinds methodologies of the self-assembly PNA/MCH monolayer
(sequentially prepared and pre-mixed prepared system) directly immobilized on the metal
surface without anchoring species (e.g. straptavidin-biotin system) was studied and the
detection of DNA hybridization on sensor surface using Surface Plasmon Florescence
Spectroscopy (SPFS) was discussed. The applied detection format exploited the specific
recognition between immobilized probe sequences and fluorescence labelled target sequence.
The using of PNA as a probe has benefits of overcoming the limit of ionic strength and
detecting a point mutant efficiently with high thermal stability. From titration analysis and
kinetic experiments, the sensor surface established with PNA has reasonably high sensitive to
recognize the DNA target with enough emission of fluorescence in evanescent field induced
by surface plasmon.
Although the ionic strength would not influenced on the PNA/DNA hybridization
efficiency (Affinity Constant, KA) on the sensor surface, the deviation of fluorescence
intensity in various ionic strength condition should be dependent on the amount of ion species
in bulk solution, caused by configuration changes of PNA/DNA duplex form.
For small distances between chromophore and metal surface, the drastically reducing the
probability of exciting the chromophore by the surface field was exhibited. On the other hand,
the proximity to the metal surface gives rise to quenching effects which reduce the
measurable fluorescence intensity.

Theory and Background
97
4.8 References
[1] Thévenot, D. R.; Toth, K; Dust, R. A.; Wilson G. S. Pure Appl. Chem., 1999, 71, 2333-2348.
[2] Löfås, S.; Malmqvist, M.; Rönnberg, I.; Stenberg, E.; Liedberg, B.; Lundström, I. Sensors
[3] Cush, R.; Cronin, J. M.; Steward, W. J.; Maule, C. H.; Molloy, J.; Goddard, N. J. Biosens. Bioelectron., 1993, 8, 347–353
[4] Bernard, A.; Bosshard, H. R. Eur. J. Biochem., 1995, 230, 416–423.
[5] van den Heuvel, D. J.; Kooyman, R. P.; Drijfhout, H. J. W.; Welling, G. W. Anal. Biochem., 1993, 215, 223–230.
[6] Schuck, P. Annu. Rev. Biophys. Biomol. Struct,. 1997, 26, 541–566.
[7] Lakey, J. H.; Raggett, E. M. Curr. Opin. Struct. Biol., 1998, 8, 119–123.
[8] Wood S. J. Microchem. J., 1993, 47, 330-337
[9] Nilsson, P.; Persson, B.; Uhlen, M.; Nygren, P.A. Anal. Biochem., 1995, 224, 400–408.
[10] Gotoh, M.;Hasegawa, Y.; Shinohara, Y.; Shimizu, M.; Tosu, M. DNA Res., 1995, 2, 285–293.
[11] Herne, T.; Tarlov, M. J. Am. Chem. Soc., 1997, 119, 8916-8920.
[12] Jensen, K.K.; Ørum, H.; Nielsen, P.E.; Nordẻn, B. Bioche., 1997, 36, 5072–5077.
[13] Kai, E.; Sawata, S.; Ikebukuro, K.; Iida, T.; Houda, T.; Karube, I. Anal. Chem., 1999, 71, 796–800.
[14] Piscevic, D.; Lawall, R.; Veith, M.; Liley, M.; Okahata, Y.; Knoll, W. Appl. Surf. Sci., 1995, 90, 425–436.
[15] Liebermann, T.; Knoll, W. Colloids Surf. A, 2000, 171, 115-130.
[16] Neumann, T.; Johansson, M. –L.; Kambhampati, D.; Knoll, W. Adv. Funct. Mater., 2002, 12, 575-586.
[17] Knoll, W.; Liley, M.; Piscevic, D.; Spinke, J.; Tarlov, M. -J. Adv. Biophys., 1996, 34, 231-251.
[18] Kambhampati, D.; Nielsen P. -E.; Knoll, W. Biosens. Bioelectron., 2001, 16, 1109-1118.
[19] Knoll, W.; Park, H.; Sinner, E. -K.; Yao, D.; Yu, F. Surf. Sci., 2004, 570, 30-42.
[20] Nielsen, P. -E.; Egholm, M.; Berg, R. -H.; Buchardt, O. Science, 1991, 254, 1497-1500.
[21] Anastassopoulou, J. J. Mol. Struct., 2003, 651, 19-26.
[22] Luscombe, N. M.; Laskowski, R. A.; Thornton, J. M. Nucl. Acids Res., 2001, 29, 2860–2874.

Theory and Background
98
[23] Todd, A. K.; Adams, A.; Thorpe, J. H.; Denny, W. A.; Wakelin, L. P.; Cardin, C. J. J. Med. Chem., 1999, 25, 536–540.
[24] Liu, J.; Malinina, L.; Huynh-Dinh, T.; Subirana, J. A. FEBS Letters, 1998, 438, 211–214.
[25] Gao, Y.; Sriram, M.; Wang, A. H. -J. Nucl. Acids Res., 1993, 21, 4093–4101.
[26] Rulisek, L.; Havlas, Z. J. Am. Chem. Soc., 2000, 122, 10428–10439.
[27] Tereshko, V.; Wilds, C. J.; Minasov, G.; Prakash, T. P.; Maier, M. A.; Howard, A.; et al. Nucl. Acids Res., 2001, 29, 1208–1215.

Theory and Background
99
CHAPTER 5
Enhancement of PNA/DNA hybridization in Polarized electric field
5.1 Motivation
Combinations of the disciplines of microfabrication, chemistry, and molecular biology
have allowed the generation of large oligonuleotide probe systems which may facilitate rapid
analysis of nucleic acid samples. Previous efforts have demonstrated the successful
application of miniatuarization technology, microfabrication techniques, and highly sensitive
detection technology to obtain such genetic analysis on a chip [1-7]. However, those models
have used passive hybridization in which the reaction rate is limited by diffusion. In an
attempt to overcome and develop the limitation, the effect of electric field on biomolecular
interaction was investigated recently. With the increasing interest in molecular nano-devices
for sensing of biomolecules and their fabrication, techniques to handle, manipulate and attach
molecules such as DNA to surfaces at specific locations, using electrostatic properties of
DNA, are attracting considerable research attention.
Most substances acquire a surface electric charge when brought into contact with a polar
(e.g. aqueous) medium, the possible charging mechanisms being ionization, ion adsorption
and ion dissolution. This surface charge influences the distribution of ions in the polar
medium; ions of opposite charge (counter ions) are attracted towards the surface, and (less
important) ions of like charge (co-ions) are repelled away from the surface. This, together
with the mixing tendency of thermal motion, leads to the formation of an electric double layer
(Figure 1.1) made up of the charged surface and a neutralizing excess of counter ions over co-
ions distributed in a diffuse manner in the polar medium. In the case of nucleic acids,
application of the electric field strength allows adjustment of hybridization stringency for
homologous interactions [8-13].
If an electric field is applied tangentially along the charged surface a force is exerted on
both parts of the electric double layer. The charged surface (plus any attached materials) tends
to move in the appropriate direction, whilst the ions in the mobile part of the double layer

Theory and Background
100
show a net migration in the opposite direction carrying solvent along with them, thus causing
its flow [11,14-17]. Conversely, a potential gradient is created if the charged surface and the
diffuse part of the double layer are made to move relative to one another.
Figure 5.1. Electrophoresis schematic: The E field lines start on the positive charges and terminate on the negative charge. The negative DNA is attracted to the E field line source.
Popular methods for DNA diagnostics are denaturing HPLC (dHPLC) [18,19],
temperature gradient capillary electrophoresis [20], matrix assisted laser desorption/ionization
(MALDI) re-sequencing [21], and gel electrophoresis (Figure 5.1.). However, problems arise
due to the long associated with the consuming of analyzing time, high cost of the preparation,
and the difficulty in the detection of single nucleotide polymorphisms (SNPs). The SPFS
technique based on specific DNA sequence is suitable for rapid and sensitive detection to
identify DNAs on the surface. This optical technique detects and quantifies changes in
response signal in the vicinity of sensor chip surfaces to which probes are immobilized,
allowing detection of analytes interacting with the probes. The investigation of the effect of
probe PNAs immobilized on the surface is required for better sensing properties. Furthermore,
it is possible to measure the reliable detection limit of the DNA target on the surface using
SPFS as well as the quantitative kinetic analysis on account of the high sequence specificity
of PNA and stability of duplex [22,23].
In order to evaluate the detection of single strand DNA molecules by hybridizing with
probe surface on metal, the probe PNAs were designed carefully to be complementary to a
recognition sequence of DNAs. Using the effect of electric field on binding process [24-29],

Theory and Background
101
the hybridization of PNA and DNA on the metal surface would be controlled and investigated
by monitoring with Surface Plasmon Fluorescence Spectroscopy (SPFS). The influence of the
electric field on the hybridization of PNA and DNA would be also studied in varying the
impact factors (e.g. ionic strength, electric field intensity, configuration and DNA
concentration), which affect on the efficiency or velocity of detecting target DNA molecules
on PNA probe surface on a chip.
5.2 Electrode flow cell
For electrostatic experiments of E-field assisted immobilization and hybridization, the
designed flow cell with Pt electrode was fabricated on the glass substrate by using standard
microelectronics techniques. The desired positive pattern was obtained through
photolithographic process in a proximity mask aligner and then a 20 nm Cr adhesion layer
and a 500 nm Pt electrode layer were sequentially deposited on the glass substrate by e-beam
evaporation. A solvent was used to remove the remaining photoresist, which lifted off the Cr-
Pt layer, leaving only Cr-Pt in the electrode location.
Figure 5.2. Electrode flow cell used for E-field assisted immobilization and hybridization. Pt patterned electrode obtained through standard photolithographic process is working as counter electrode against Au electrode (working electrode) and also has reference electrode aside by counter electrode in same substrate.

Theory and Background
102
The reason that the designed check-shape patterned Pt electrode was prepared is for
detecting fluorescence emission in Photomutimeter (PMT), located behind Pt electrode
substrate.
5.3 Electrostatic properties of DNA on the metal surface
DNA is a polyelectrolyte, and in solution the phosphate groups on the sugar–phosphate
backbone dissociate to form a negatively charged molecule surrounded radially by a cloud of
positively charged counterions [30-32]. This makes the DNA highly polarizable, and in an
electric field a dipole is induced in the molecule. In a non-uniform electric field DNA
molecules will experience a dielectrophoretic force and an orientational torque as a result of
the interaction between the induced DNA dipole and the electric field [31,33,34]. The torque
and the dielectrophoretic force are a function of the magnitude and frequency of the electric
field, the dielectric properties of the medium and the DNA, and the size of the DNA [31,33].
Dielectrophoresis is a non-contact manipulation technique enabling positioning and
orientation of DNA molecules in nanotechnological devices with a high spatial resolution,
and is becoming increasingly popular. Together with the dielectrophoretic force, the torque
causes the DNA molecules to align parallel to the electric field lines thus elongating them
from their equilibrium random coil conformation. However, a detailed and quantitative
understanding of the dielectrophoresis of DNA is required to tap the full potential of the
technique. Dielectrophoretic manipulation of DNA has been widely studied in the past and a
large number of applications have emerged, including size determination of DNA, site-
specific immobilization of DNA [32, 35], molecular surgery [32, 36], DNA sequencing [37–
39] and dielectric characterization of DNA fragments [40]. The use of microelectrodes allows
the generation of the strong electric fields necessary for dielectrophoresis (of the order of 1
MV m−1) using relatively small potentials. It also facilitates the precise orientation, position
and mobility of DNA at high spatial resolution. If tethered via a thiol group onto an electrode,
DNA will be orientated and elongated out from the electrode when the electric field is applied
and will return to its random coil conformation when the field is switched off, making it
useful as a method to orientate specific DNA reversibly.

Theory and Background
103
Monolayers of DNA immobilized on solid substrates are of considerable importance not
only for applications as DNA sensors and microarray but also for investigations of the
complex behavior of polyelectrolyte molecules at interfaces. Active manipulation of DNA on
surfaces may significantly enhance the functionality of these layers.
Figure 5.3. Cross section of an electrode flow cell. PNA attached Au surface is working electrode while Pt patterned electrode is counter electrode. An application of positive potential leads negatively charged ssDNA molecules to approach to the Au surface by electrostatic attractive force. In negative potential, ssDNA was experienced repulsive force and stayed away from Au surface.
The polarization of a solid/liquid interface involves accumulation of ions in solution
adjacent to the surface to compensate for the induced charge on the metal surface. Placing a
charged macromolecule within this environment by grafting it to the surface at one end allows
for an efficient electrical manipulation at low electrode potentials, taking advantage of the
high electric field strength within the interface region. A particularly appealing yet
undisclosed aspect is to investigate the dynamics of the surface-tethered macromolecules as it
is repelled from or attracted to the surface upon reversing the charge of the metal. Moreover,
given that such dynamic properties should suspectibly depend on the intrinsic molecular
characteristics (i.e. molecular weight, size, charge, etc) functional materials of this kind would
directly meet potential applications in biosensing (e.g. the label-free detection of specific
affinity binding reaction).
5.3.1 Immobilization of DNA by electric field
LaSFN9 Au
Pt
S S S
EE
PNA probe
Cy5 labelled DNA
Reflected light
Polarized light
EE
EE
Attractive Force
Repulsive Force

Theory and Background
104
DNA molecules in solution carry a negative charge and migrate toward the positive pole
when placed in an electric field. In addition to the net charge, the electric field induces a
dipole in the molecules. This dipole has few consequences in the quasi-static, homogeneous
electric fields that are usually applied for electrophoresis of DNA.
A strong dipole can be induced in DNA because each molecule is surrounded by a cloud
of counterions that partially neutralize its charge. When an electric field is applied to the
solution, the DNA chain and the counterion cloud become distorted, creating a charge
separation. Induced-dipole forces (often called dielectrophoresis) have also been used
extensively to study and manipulate a variety of larger biological particles such as algae,
bacteria, yeast, mammalian blood cells, chloroplasts, and mitochondria (Pohl and Hawk,
1966; Pohl, 1978; Burt et al., 1990;Markx et al., 1994;Marszalek et al., 1995).This induced
polarity is demonstrated by dielectric measurements, which indicate that DNA solutions have
a very high dielectric constant (Takashima, 1963; Mandel and Odijk, 1984). Induced dipole
effects have also been recognized recently as a source of artifacts in capillary electrophoresis
(Mitnik et al., 1995). Upon application of strong electric fields, dipole-dipole attraction causes
the DNA molecules to form aggregates, which migrate with anomalous velocity. The electric
field facilitates two interactions: transport of charged molecules to selected microlocation, the
metal surface in attractive force and hence concentration over an immobilized substrate.
Subsequent reversal of the field may be used to selectively repulse those molecules with
reduced affinity for the substrate. In case of nucleic acid, the electric field strength allows
adjustment of immobilization and hybridization for homologous interactions [24-27,41-47].
In this experiment, 100-mer oligonucleotide in their single stranded (ss) conformation was
presented. For fluorescence measurement, the DNA was dye labeled (Cy5) at their 3’ end,
while the opposing 5’ end was modified with thiol linker to chemically graft the strands to Au
surface. The DNA immobilization on gold surfaces (~50 nm thickness) was carried out in
standard self-assembly process from aqueous solution. During immobilization step, electrode
cell was experienced in three different electrostatic circumstance: applying + 200 mV to
working electrode (Au surface), applying – 200 mV and open-circuit condition. Under + 200
mV potential to the gold surface, negatively charged DNA molecules are influenced by the
mutual electrostatic attraction force and manipulated to the surface, then immobilized to Au
surface in active mobility process (none diffusion). In contrast, upon applying – 200 mV to
Au electrode, DNA was partially repulsive to the negative potential surface and then
prevented from approaching and immobilizing to the surface by electrostatic repulsion force.

Theory and Background
105
Without any electric field (open-circuit), the immobilization process DNA at surface could be
normally established in terms of Langmuir adsorption theory.
0 10 20 30 40 50 60 70 80
0.0
5.0x10⁴
1.0x10⁵
1.5x10⁵
2.0x10⁵
2.5x10⁵
3.0x10⁵
3.5x10⁵
4.0x10⁵
- 200 mV
Fluo
resc
ence
(cps
)
Time (min)
+ 200 mV
open-circuit
Figure 5.4. Kinetics of immobilization thiolated 100-mers PNA molecules attached Cy5 under the control of electrostatic attractive and repulsive potential and passive immobilization at open-circuit (up). The Flow cell applied electrostatic attractive bias potential during the immobilization of HS-PNA (100 bp).
As presented in Figure 5.4., application of an attractive potential (+200 mV) increases the
rate of immobilization of thiolated ssDNA modified Cy5 chromophore to the Au surface.
V
e
Attractive force

Theory and Background
106
Within 1 hour, the equilibrium state of immobilization of thiolated ssDNA could be obtained,
while it took over 12 hours to complete the ssDNA self-assembly layer on gold surface at
normal incubation without any driving force (eg. electric field). However, the extent of
immobilization with field assistance is never larger than when immobilization is carried out
with overnight (>12 hours) incubation at open circuit. At a repulsive potential (-200 mV),
although the plateau of immobilization could be achieved as definitely fast as attractive
immobilization, the total amount of immobilized ssDNA was much smaller than normal
immobilization at open circuit since strong repulsive force at surface area prevent negative
charged ssDNA from approaching to metal surface and only a part of ssDNA could have
chance to bind to Au surface with binding sulfur-gold bond.
From the results, we found three important conclusions, as followed.
(1) Designed electrode flow cell for immobilized DNA surface system is well
applicable for electrically controllable and rapidly established sensor surface.
(2) For the formation of specific designed probe structure with DNA on metal
surface, electrode flow cell is very useful by controlling DNA manipulation
and mobility to the metal surface with dielectrophoretic (attractive or
repulsive) force.
(3) The density of specific DNA molecules which is immobilized on metal surface
as probe can be definitely controllable by varying the polarity and intensity of
electric field.
5.3.2 Electric switching of DNA polyelectrolyte under polarized field
Active manipulation of DNA on surfaces [14-17] may significantly enhance the
functionality of these grafted layers. The polarization of a solid/liquid interface involves
accumulation of ions in solution adjacent to the surface to compensate for the induced charge
on the metal surface. Placing a charged ssDNA molecules within this environment by grafting
it to the surface at one end allows for an efficient electrical manipulation at low electrode
potentials, taking advantage of the high electric field strength within the interface region. A
particularly appealing yet undisclosed aspect is to investigate the dynamics of the charged
self-assembly on metal surface as it is repelled from or attracted to the surface upon reversing
the charge of the metal [48,49]. Moreover, given that such dynamic properties should

Theory and Background
107
susceptibly depend on the intrinsic molecular characteristics (i.e., molecular weight, size,
charge, etc.) functional probe layers of this kind would directly meet potential applications in
biosensing. This experiment was studied with 100-mer oligonucleotides in their single
stranded (ss); for fluorescence detection, the DNAs were dye labeled (Cy5) at their 3′ end,
while the opposing 5′ end was modified with a thiol linker to chemically graft the strands to
gold surfaces. Cy5 labeled thiolated ssDNA was obtained from SONY GmbH in Sttutgart,
Germany.
0 50 100 150 200 250 300
3x10⁵
4x10⁵
5x10⁵
6x10⁵
Time (min)
Fluo
resc
ence
(cps
)
-400
-200
0
200
400
600
800
Potential (mV)
Figure 5.5. Electrically induced ‘switching’ of a ssDNA layer on Au surface monitored by SPFS measurement. (up) and schematic draw of the modulation of DNA molecule in electric field assistance (repulsive bias potential).

Theory and Background
108
The ssDNA immobilization on Au surfaces was adjusted by varying the following
parameters during the self-assembly process from aqueous solution: assembly time (2~12h),
DNA concentration (100 nM), salt concentration (100 mM), and salt valence (NaCl for
monovalent cations). Following DNA immobilization, mercaptohexanol (MCH) was
coadsorbed to prevent nonspecific DNA Au interactions by formation of a mixed DNA/MCH
monolayer [50,51]. The influence of the assembly time and the DNA concentration can be
described fairly well in terms of (diffusion limited) Langmuir adsorption theory. The salinity
of the aqueous electrolyte solution bears a particular importance since higher salt
concentrations (as well as salt valence) facilitate an enhanced screening of the DNA’s
intrinsic negative charge. This has a pronounced effect on the layer packing density which is
influenced by the mutual electrostatic repulsion of neighboring DNA strands. Therefore,
layers of dilute surface coverage, as eligible for the distinct observation of “DNA-switching”,
were prepared at low concentrations of monovalent salt (< 50 mM).
For high packing densities, steric interactions prevent free gyrations of the strands about
their anchoring points and the DNA molecules are forced to take an upright orientation on the
surface. Decreasing the coverage density leads to an increase in the rotational mobility of the
strands (and hence the maximal achievable switching amplitudes) until eventually mutual
collisions do not occur anymore. As expected, this regime of relatively low surface coverage
is characterized by a saturation of the switching amplitude. Thus, by adjusting the monolayer
surface coverage carefully, it is possible to access cooperative layer behavior as well as to
study the dynamics of (an ensemble of) isolated DNA strands.
Figure 5.5. depicts the electrically induced and, simultaneously, optically detected
switching of DNA orientations on a gold surface. Here, we observe the fluorescence intensity
emitted from the dye-labeled DNA-layer while alternating the bias potential applied to the
supporting Au electrodes with repulsive force (-200 mV and -400 mV). Depending on the
charging state of the surface, the intrinsically negatively charged DNA is either driven away
from, or pulled toward the electrode and hence adopts an upright or considerable tilted
orientation for negative and positive bias, respectively. Optical probing of the DNA
orientation takes advantage of nonradiative energy transfer from the excited dye molecule
(attached to the DNA’s top end) to the metal [52,53].
In conclusion, the electrically controlled, dynamic, and persistent switching of
conformations of oligonucleotide layers could be introduced. The method proves to be

Theory and Background
109
applicable to address the complex behavior and interactions of (bio-) polyelectrolytes within
the polarized region at liquid/metal interfaces [54-58]; moreover, by tuning the number
density of molecules on the surface, properties of the cooperative layer as well as of
ensembles of individual, non-interacting molecules can be examined in a straightforward
manner.
5.4 Influence of electric field on PNA/DNA hybridization
Peptide nucleic acid (PNA) is a very potent DNA mimic in which the negatively charged
sugar-phosphate backbone is substituted with a charge neutral pseudopeptide chain. The
hybridization complexes between PNA and DNA or RNA exhibit high stability and sequence
specificity, and these properties combined with high biostability have attracted attention to
PNA as a promising gene therapeutic agent. An application of PNA self-assembled probe
system for E-field assisted hybridization has a extremely advantage for controlling the
enhancement of E-field driven hybridization of ssDNA from bulk solution without
considering the change of the conformation of probe structure during electric field induced in
electrode flow cell because of neutral electrostatic properties of PNA itself.
0 5 10 15 20 25 300.0
5.0x10³
1.0x10⁴
1.5x10⁴
2.0x10⁴
FL in
tens
ity (c
ps)
Time (min)
+ 50 mV
open-circuit
- 200 mV
Figure 5.6. E-field enhancement hybridization of single base mismatched (mm1) ssDNA and PNA probe could be obtained by + 50 mV bias potential by attractive force to Au surface. At -200 mV and open-circuit, normal hybridization reaction kinetics could be observed in Langmuir adsorption theory.

Theory and Background
110
In case of DNA probe system, upon applying a positive biased potential on Au surface,
although target ssDNA could be attracted to the Au surface by electrostatic attractive force,
the probe DNA was also influenced by the attractive force and then would be ‘lying’ or
‘folding’ conformation as a result of E-field driven. The ‘lying’ or ‘folding’ DNA probe, not a
proper configuration for binding ssDNA from bulk solution, lose the reactivity for hybridizing
ssDNA and results in non-enhancement driven by electric field. In order to obtain the
enhancement of hybridization of DNA probe system by E-field, some very specific conditions
(accurate ssDNA concentration, buffer concentration, bias potential, and other considerable
factors) are definitely required through completed optimizing and tuning efforts.
For E-field assisted hybridization between PNA probe and ssDNA on surface,
hybridization allowed to proceed with no potential applied, then the potential was swept to the
desired potential, and hybridization allowed to continue.
Figure 5.6. demonstrated that an electric field (positive bias potential on Au surface) was
capable of significantly accelerating the hybidization of one base mismatched ssDNA and
PNA probe on Au surface by attractive force while no driven enhancement of hybridization
under negative bias potential (repulsive force induced on Au surface).
Interestingly, the hybridization enhancement is much more pronounced for the
mismatched target (exactly, one base mismatched ssDNA target). The extent of hybridization
with electric field assistance is never larger than when hybridization is carried out with
overnight (>12 hrs) incubation at open-circuit. An alternative means of mismatch
hybridization on the basis of the more pronounced response of the mismatched target to an
attractive field relative to passive conditions (open-circuit) could be suggested. This response,
seen when comparing matched and mismatched kinetics at open circuit and positive bias
potential, could have application in real-time detection of mismatch without the need to
monitor the full kinetic isotherm.
5.5 Electric field assisted enhancement of PNA/DNA hybridization
In general, passive hybridization reactions, in which the reaction rate is limited by
diffusion, are controlled by probe structure, ssDNA concentration, temperature of the sensor
cell and salt concentration in the solutions. The electric field enhanced probe PNA/ssDNA
hybridization designed to manipulate the ssDNA to the probe surface by electrostatic

Theory and Background
111
attractive force and to increase the hybridization rates on the sensor surface could be
developed in this study.
In recent researches, the use of single, square voltage pulses applied to the metal surface
directly or indirectly results in selective covalent bonding (immobilization) of ssDNA probes
and the hybridization of ssDNA targets to the immobilized probe. Immobilization and
hybridization rates are tens of or hundreds of times faster than in the passive control reactions
without applying electric field. However, PNA probe system is not reported in electric field
assisted sensor architecture in spite of the advantage of the electrically neutral property of
PNA as probe molecules.
In this chapter, in order to investigate the enhancement of the hybridization ssDNA and
probe PNA bound to the Au surface and the optimized condition of rapid detection of that
hybridization occurred near sensor surface, the effect of ionic strength of bulk solution (salts
concentration), electric field strength, ssDNA target concentration, target ssDNA length (>50
base pairs) are systematically studied by real-time monitoring fluorescence in Surface
Plasmon Fluorescence Spectroscopy (SPFS).
5.5.1 Ionic strength dependency
Here, the hybridization between probe PNA and one base mismatched ssDNA from bulk
solution on the sensor surface was analyzed in kinetic analysis varying different ionic strength
(from 1 mM to 1,000 mM buffer) under selective electric field (+50 mV positive to Au
surface and -300 mV). For each kinetic measurement, the hybridization reaction was carried
out by injection of 1 nM ssDNA target solution following short time background
measurement of fluorescence signal and then the desired electric field was applied to the
electrode of flow cell for field assisted hybridization of probe PNA and ssDNA after 3 min
passive hybridization reaction without any field assistance. The fluorescence intensity
increased during hybridization event. In order to compare the field influence on the
hybridization of charged ssDNA molecules to PNA probe bound to the Au, passive
hybridization (open-circuit) process was also observed in identical condition for the
hybridization except E-field. Based on the fluorescence signals of hybridized ssDNA labeled
with Cy5 chromophore using SPFS, the hybridization rate and tendency could be observed as
shown in Figure 5.7.. The probe coverage remains constant (within 10%) when regenerated
by rinsing with 100 mM NaOH solution between runs.

Theory and Background
112
0 5 10 15 20 25 30 35 40
0.0
5.0x10³
1.0x10⁴
1.5x10⁴
2.0x10⁴
2.5x10⁴
3.0x10⁴
FL in
tens
ity (c
ps)
Time (min)
+ 50 mV
- 300 mV
open-circuit(a)
0 5 10 15 20 25 30 35 40
0
1x10⁴
2x10⁴
3x10⁴
4x10⁴
5x10⁴
6x10⁴
FL in
tens
ity (c
ps)
Time (min)
+ 50 mV
- 300 mV
open-circuit
(b)
0 5 10 15 20 25 30 35 40
0
1x10⁴
2x10⁴
3x10⁴
4x10⁴
5x10⁴
6x10⁴
FL in
tens
ity (c
ps)
Time (min)
+ 50 mV
- 300 mV
open-circuit(c)
0 5 10 15 20 25 30 35 40
0
1x10⁴
2x10⁴
3x10⁴
4x10⁴
- 300 mV
FL
inte
nsity
(cps
)
Time (min)
+ 50 mV
open-circuit(d)
0 10 20 30 40 50 60 700.0
2.0x10³
4.0x10³
6.0x10³
8.0x10³
1.0x10⁴
1.2x10⁴
Fluo
resc
ence
( cp
s)
Time (min)
+ 50 mV open-circuit
- 300 mV
(e)
Figure 5.7. The kinetic profiles of the hybridization between probe PNA and ssDNA labelled Cy5 chromorphore under alternative electric field assistance (+50 mV, -300 mV) and open-circuit upon varying the ionic strength of (a) 1,000 M, (b) 150 mM, (c) 10 mM, (d) 5 mM and (e) 1 mM buffer condition.

Theory and Background
113
1000 mM 150 mM 10 mM 5 mM 1 mM0
1x10⁴
2x10⁴
3x10⁴
4x10⁴
5x10⁴
Fluo
resc
ence
/ cp
s
Na+ concentration / mM
open-circuit
- 300 mV
+ 50 mV
(a)
open-circuit - 300 mV + 50 mV0.0
2.0x10³
4.0x10³
6.0x10³
8.0x10³
1.0x10⁴
1.2x10⁴
Fluo
resc
ence
/ cp
s
(b)
Figure 5.8. (a) Plot of the saturated fluorescence intensity taken from Figure 5.7. under electrically assisted field (+50 mV and -300 mV) upon varying the ionic strength from 1 mM to 1,000 mM (b) comparison of fluorescence intensity in 1 mM buffer solution after 10 min hybridization. At +50 mV, almost hybridization could be achieved within 10 minutes in 1 mM buffer concentration, while passive hybridization was carried out in tens of or hundreds of minutes without any field assistance.
In high ionic strength circumstance (>100 mM salts concentration) in bulk solution, upon
+50 mV positive bias potential (negative charged molecules attractive force) applied to Au
surface immobilized probe PNA, the rate of hybridization represented by the increase of the
fluorescence intensity was evidently not occurred rapidly but slowly reached below saturated

Theory and Background
114
hybridization degree, while the identical hybridization efficiency studied in previous Chapter
between probe PNA and ssDNA was obtained when -300 mV negative potential was applied
to the Au surface and none was assisted at open-circuit (Figure 5.7. (a) and (b)). However,
none of any enhancement of the hybridization of PNA/DNA on the surface or identical
hybridization efficiency of passive hybridization reaction was achieved by attractive bias
potential (+50 mV) at 10 mM and 5 mM buffer condition respectively (Figure 5.7. (c) and (d)).
As presented in Figure 5.7. (e), in extremely low ionic strength, 1 mM buffer condition in
bulk solution, the improvement of the hybridization rate, comparing with diffusive
hybridization by Langmuir adsorption theory, could be observed in a few minutes. Over 90
percents of active probe PNA could be hybridized to ssDNA from bulk solution in 1 mM
buffer condition by attractive electric field assistance (+50 mV positive potential to Au
including PNA probe layer) in 5 minutes time-point. This result indicates that the rate of the
electric field assisted hybridization by attractive bias potential applied is almost 6~10 times
faster than the rate of passive hybridization or non-attractive potential (-300 mV bias potential
to Au) in very low ionic strength. Figure 5.8. shows the summary of the influence of the ionic
strength on PNA/DNA hybridization under electric assistance and open-circuit.
A likely explanation for the electric field enhancement of hybridization in definitely low
ionic strength condition is that coincidently and simultaneously accumulated negative ions to
the biding sites (PNA probe) by attractive force, during negatively charged ssDNA molecules
moved and approached to the Au surface under positive bias potential, generates a
successively repulsive ‘Coulomb barrier’ for further target ssDNA binding to the still
unoccupied binding sites. This effect could be reduced when working only removing the ions
capable of influencing on the hybridization of ssDNA to PNA probe from bulk solution. This
influence indicates PNA is a predominant molecule as a probe matrix rather than DNA
monolayer in electric field assisted sensor system, adding to the advantage of electrically
neutral property of PNA itself since immobilized ssDNA to the metal surface also plays a role
of a barrier species as ‘Coulomb barrier’ to prevent free ssDNA target from binding with
unpaired probe in available sites. If the nucleic acid alone could be influenced by electrostatic
force, migration of the negatively charged oligonucleotides would be predicted to be
proportional to the applied potential without considering the ionic strength. However, the
ionic strength is one of the dominant factors for influencing on the electric field assisted
hybridization system. In conclusion, the increase in ionic strength results in lower mobility of

Theory and Background
115
free ssDNA in bulk solution or a decreasing the rate of DNA accumulation and then slowing
the hybridization reaction in binding sites.
5.5.2 Electric field magnitude effect
Figure 5.9. shows the kinetics of the hybridization between ssDNA targets and PNA probe
on Au surface by assistance of electrostatic attractive potential (positive bias to Au surface)
with different electric field using SPFS. The data could be compared to passive hybridization
at open-circuit. As shown, higher positive potential (> +100 mV) could be influence on the
denaturation of the PNA/DNA duplex form as well as the enhancement of the hybridization
owing to highly electron transfer effect and conformational changes of duplex by excess field
influence. Therefore, a carefully optimization of proper electric field magnitude should be
required to find the effective bias potential for the enhancement of the hybridization of
specific PNA/DNA sensor matrix. In this experiment, +50 mV (widely below +100 mV) is
well optimized bias positive potential to PNA immobilized Au surface for improving the
hybridization efficiency.
0 5 10 15 20 25 30
2.0x10³
4.0x10³
6.0x10³
8.0x10³
1.0x10⁴
1.2x10⁴
1.4x10⁴
+ 400 mV
+ 100 mV
FL in
tens
ity (c
ps)
Time (min)
+ 50 mV
open-circuit
Figure 5.9. Kinetics of the electric field assisted hybridization of ssDNA and probe PNA under varying the positive bias potential of +50 mV, +100 mV and +400 mV, respectively, and passive hybridization at open-circuit.

Theory and Background
116
5.5.3 Dependency of target ssDNA concentration
To improve the hybridization of probe PNA and free ssDNA in bulk solution under
electric field assisted system, the control of the ionic strength is definitely important since
migrated free ssDNA can be electrically repelled from the binding surface and prohibited to
bind with probe PNA on Au surface by accumulated conductive ions from buffer solution, as
mentioned in Chapter 5.5.2.. The unpaired free ssDNA in bulk solution is concerned as one of
the charged moleculesand can be act as a part of ionic strength, capable of influencing on the
hybridization, directly. The remained free ssDNA can be also accumulated to the surface by
electrostatic attractive force when positive bias potential applied with the migration of small
ions to Au surface at the same time and makes repulsive circumstance to the free ssDNA to
approach for binding with PNA or already paired DNA with PNA and then results in slowing
the rate of the hybridization between probe PNA and ssDNA on the surface.
Figure 5.10. shows that over 100 nM of ssDNA concentration, no enhancement or
improvement of the hybridization efficiency of PNA/DNA duplex formation can be obtained
while the fluorescence signals resulted from the hybridization with blow 10 nM ssDNA is
more than 5-fold greater than in higher target concentration(> 100 nM ssDNA).
1 nM10 nM
100 nM
No field
+50 mV0.0E+00
4.0E+03
8.0E+03
1.2E+04
1.6E+04
Figure 5.10. Comparison of the hybridization degree in varying free ssDNA concentration (1 nM, 10 nM and 100 nM) in bulk solution in electric assisted capturing process with +50 mV attractive bias potential and at open-circuit.
Consequently, although not great factors to influence on the rate of the hybridization like
bulk ionic strength, as ssDNA accumulates above the electrode with probe PNA layer,

Theory and Background
117
diffusion increasingly opposes the electric field-mediated migration of free ssDNA, also
slowing the overall rate of accumulation and hybridization such as the consideration of the
ionic strength of bulk solution in previous studies.
5.5.4 Size effect of DNA target
The relationship between the length of the ssDNA targets and the efficiency of the
hybridization with 15 base paired PNA probes, as measured by SPFS, was also examined. In
view of the hybridization mechanism which requires hybridizable targets to pre-adsorb in the
probe-attached chip surface, the amount of targets pre-adsorbed on the probe surface
decreases with the size of target (the length of target ssDNA). Steric hindrance and cross-
talking with neighboring charged molecules, which typically occurs at high probe density
regimes, are likely to affect interfacial hybridization since longer targets are more difficult to
squeeze into the available space between immobilized PNA probes.
In experiments, longer ssDNA targets containing over 40 base pair was not enhanced by
the electric field when hybridizing with probe PNA on sensor surface. In order to overcome
the limitation of this effect under application of electric field assistance for hybridization, the
isolated probe surface (extremely diluted probe density) should be required.
5.6 Kinetic analysis of PNA/DNA hybridization under electric field
assistance
The kinetic curves of the PNA/DNA hybridization at open-circuit and at various potential
applied, respectively, are given in Figure 2. Once the hybridization reached a stable
equilibrium plateau the dissociation process was initiated by rinsing pure buffer solution
through the cell. Based on the Langmuir model, the rate constants, kon and koff and the affinity
constant, KA given by:
KA = kon / koff (1)
for each hybridization experiment were calculated and are summerized in Table 1.
Without any additional field applied, i.e., at open-circuit potential, the hybridization of the
probe PNA with the single mismatched DNA target on the surface resulted in a kon value of

Theory and Background
118
5.2 x 10⁴ M-1s-1 (Figure 5.11.). With an electric field applied between Au surface (positive)
and Pt counter electrode (negative), the rate of hybridization of PNA/DNA was significantly
increased. For a potential of +50 mV, the hybridization rate was found to be kon = 9.8 x 10⁵ M-
1s-1, which is tens of times faster than that without electric field. We attribute this to the
negative charges of the free ssDNA chains in solution that are attracted and transported with
an enhanced drift velocity to the positively charged Au surface. The target DNA are strongly
attracted to the metal surface and thus have higher possibility of hybridizing with the probe
PNA, resulting in an enhanced hybridization rate. At potentials higher than +50 mV, a
moderate further acceleration of the hybridization reaction was observed. However, while the
dissociation rate of the PNA/DNA complex for a potential of + 50 mV (koff = 7.7 x 10⁻⁴ s-1),
for the higher potentials, i.e., for +100 mV and +200 mV, respectively, the koff value of the
PNA/DNA dissociation increased.
0 20 40 60 80 100 120 1400
2
4
6
8
10
12
+ 200 mV
+ 100 mV
Fluo
resc
ence
( x1
04 cps)
Time (min)
open-circuit
+ 50 mV
Figure 5.11. Comparison of the association and dissociation kinetics of PNA/DNA hybridization (a) at open-circuit potential and at an applied potential of (b) +50mV, (c) +100mV and (d) +200mV. A 10 nM solution of dye-labeled DNA with a 1 base pairs mismatch was used for the hybridization experiment and the fluorescence intensity was monitored in real time by SPFS. The solid lines of all curves are fits according to the Langmuir model.

Theory and Background
119
The reason is that strong positive potential can transport the small negative ions in buffer
solution and result in rapid denaturation of PNA/DNA duplex by electromagnetic repulsion
force. According to the definition of the hybridization efficiency expressed as affinity
constant (KA), the hybridization efficiency of PNA/DNA could be also enhanced under
electric field control with +50 mV potential with the value of KA = 1.3 x 10⁹ M-1.
Table 5.1. Rate constants and affinity constants for PNA/DNA hybridization at open circuit
potential and at different applied potentials, as indicated
Potential bias (to Au electrode)
Passive hybrid -dization
(open-circuit) +50 mV +100 mV +200 mV
kon /M-1s-1 5.2×10⁴ 9.8×10⁵ 1.1×10⁶ 1.2×10⁶
koff /s-1 7.1×10⁻⁴ 7.7×10⁻⁴ 9.4×10⁻⁴ 1.1×10⁻³
KA /M- 7.1×10⁷ 1.3×10⁹ 1.1×10⁹ 1.1×10⁹
5.7 PNA/PCR hybridization enhanced by electric field
In order to investigate the hybridization efficiency for long ssDNA (PCR products) under
application of electric field, extremely diluted probe matrix should be required like
streptavidin-biotin muti-assembled layer, in which the isolated probe unit can be achieved.
Figure 5.12. shows the supramolecular architecture at the metal/solution interface composed
of a mixed biotinylated thiol SAM, a streptavidin monolayer and the layer of probe PNA
coupled to the streptavidin binding matrix via the specific recognition of its biotin moieties.
For the preparation of the self-assembled monolayers (SAM), the gold surface was
incubated overnight in a binary mixed thiol solution of a biotinylated thiol (Biotinamino-
capronacid-amidodioctyl-mercaptopropionamide) and a spacer thiol (11-Mercapto-1-
undecanol, Aldrich) at a molar ratio of 1: 9 and a total concentration of 0.5 mM in absolute
ethanol (Aldrich) in order to control the surface density and to minimize non-specific
adsorption of analyte (target) molecules. Then, the streptavidin solution (1 M, Kem-En-Tec
Diagnostics) was injected into the flow cell system in order to allow for binding to the self-

Theory and Background
120
assembled thiol layer at a flow rate of 10 L/sec. Subsequently, biotinylated PNAs (500 nM)
were immobilized on the streptavidin layer as catcher probes via the streptavidin/biotin
binding.
LaSFN9
SAM
Biotin
Streptavidin
Biotinylatedprobe
Au
OH
S
OH
S
OH
S
OH
S
OH
S
OH
S
OH
S
OH
S
OH
S
OH
S
OH
S
OH
S
OH
S
OH
S
OH
S
OH
S
OH
S
OH
S
N H
O
O
H N
S
O
O
OH
S
OH
S
OH
S
OH
S
S
NH
N H
N H
O
O
H N
S
O
O
S
NH
N H
N H
O
O
H N
S
O
O
S
NH
N H
N H
O
O
H N
S
O
O
S
NH
N HO O O O
OH
S
OH
S
OH
S S
OH
S
OH
S
OH
S
OH
LabeledTarget DNA
LaSFN9
SAM
Biotin
Streptavidin
Biotinylatedprobe
Au
OH
S
OH
S
OH
S
OH
S
OH
S
OH
S
OH
S
OH
S
OH
S
OH
S
OH
S
OH
S
OH
S
OH
S
OH
S
OH
S
OH
S
OH
S
N H
O
O
H N
S
O
O
OH
S
OH
S
OH
S
OH
S
S
NH
N H
N H
O
O
H N
S
O
O
S
NH
N H
N H
O
O
H N
S
O
O
S
NH
N H
N H
O
O
H N
S
O
O
S
NH
N HO O O O
OH
S
OH
S
OH
S S
OH
S
OH
S
OH
S
OH
LabeledTarget DNALabeledTarget DNA
Figure 5.12. The self-assembled sensor matrix based on Streptavidn-Biotin anchor system.
0 5 10 15 20 25 30 352.4x10³
2.8x10³
3.2x10³
3.6x10³
4.0x10³
4.4x10³
4.8x10³
FL in
tens
ity (c
ps)
Time (min)
open-circuit
+ 50 mV
Figure 5.13. The hybridization of the PNA probe and 100 pM PCR DNA product (196 base pairs) at open-circuit (■) and under control of +50mV electric field (▲).
Using PCR (polymerase chain reaction) products named as Mu-196 (196 base pair
ssDNA) supported by colleague in our lab as target molecule for the hybridization studies

Theory and Background
121
with streptavidin-biotin multilayer capture matrix, the experimental conditions of the
enhancement of the E-field assisted hybridization was examined in this Chapter.
For improvement the hybridization efficiency, the ionic strength of bulk solution is 0.1
mM buffer solution and the bias potential for attracting the Mu-196 target molecule is +50
mV. At first minute, the enhancement of the rate of the hybridization between PNA probes
and free Mu-196 target could be observed with detecting fluorescence signals through Surface
Plasmon Fluorescence Spectroscopy (SPFS), as presented in Figure 5.13.. Although the
enhancement of the PNA/Mu-196 (long target ssDNA) hybridization could be achieved,
overall fluorescence intensity detected in SPFS is relatively smaller than normal hybridization
studies and not too extinguishable from background signals (significant error and noise).
Therefore, to evaluate effective E-field assisted hybridization matrix for long chained ssDNA
target, the isolated probe surface (extremely diluted probe density) should be required. In
addition, the probe layer should be directly immobilized on metal surface without any anchor
agents or spacer molecules, such as Streptavidin-Biotin, for getting sufficient fluorescence
signals within evanescent field. However, the possibility and capability for application for
sensor system to clarify the long or highly charged molecules on the capture surface can be
introduced in these studies.
5.8 Conclusion
Since salts dependency and the limitation for application with interstrand repulsion
property of duplex, PNA (peptide nucleic acid) has been intensively studied, because of its
potential as a gene-targeting drug or a biomolecular probe. Based on a neutral backbone
(PNA) was substituted for the negatively charged phosphodiester backbone of the capture
oligonucleotide (DNA), with applying simple bias potential to the sensor electrode, since the
brilliant electric field enhanced hybridization system can be established and studied
successfully, this suggests that shielding of the phosphodiester backbone is an important
component of the electric field assisted hybridization process.
The application of electric field to PNA sensor matrix allows great acceleration and
exquisite control over the hybridization reactions. These advantages are augmented by the use
the low ionic strength and optimized attractive bias potential to Au surface. In general, these
low ionic strength buffers allow efficient migration of target oligonuleotides to descrete sites
in the presence of an applied potential.

Theory and Background
122
5.9 Reference
[1] Fodor, S., Read, J., Pirrung, M., Stryer, L., Lu, A., Science, 1991, 251, 767-773.
[2] Fodor, S., Rava, R., Huang, X., Pease, A., Holmes, C., Adams, C., Nature (London), 1993, 364, 555-556.
[3] Eggers, M., Hogan, M., Reich, R., Lamture, J., Ehrlich, D., Hollis, M., Kosicki, B., Powdrill, T., Beattie, K., Smith, S., Varma, R., Gangdadharan, R., Mallik, A., Burke, B., Wallace, D., Biotechniques, 1994, 17, 516-519.
[4] Lamture, J., Beattie, K., Burke, B., Eggers, M., Erhlich, D., Fowler, R., Hollis, M., Kosicki, B., Reich, R., Smith, S., Varma, R., Hogan, M., Nucleic Acid Res., 1994, 22, 2121-2125.
[5] Bains, W., Smith, G., J. Theor. Biol., 1988, 135, 303-307.
[6] Drmanac, R., Labat, L., Brukner, I., Crkvenjakov, R., Genomics, 1989, 4, 114-128.
[7] Southern, E., Maskos, U., Elder. J., Genomics, 1992, 1008-1017.
[8] Lahann, J., Mitragotri, S., Tran, T., Kaido, H., Sundaram, J., Choi, I., Hoffer, S., Somorjai, G., Langer, R., Science, 2003, 299, 371-374.
[9] Rant, U., Arinaga, K., Fujita, S., Yokoyama, N., Abstreiter, G., Tornow, M., Nano Lett., 2004, 4, 2441-2445.
[10] Liu, Y., Mu, L., Liu, B., Zhang, S., Yang, P., Kong, J., Chem. Commun., 2004, 1194-1195.
[11] Kelley, S., Barton, J., Jackson, N., McPherson, L., Potter, A., Spain, E., Allen, M., Hill, M., Langmuir, 1998, 14, 6781-6784.
[12] Wang, X., Kharitinov, A., Katz, E., Willner, I., Chem. Commun., 2003, 1542-1543.
[13] Pei, Y., Ma, J., J. Am. Chem. Soc., 2005, 127, 6802-6813.
[14] Bustamante, C., Bryant, Z., Smith, S., Nature, 2003, 421, 423-427.
[15] Seo, Y., Luo, H., Samuilov, V., Rafailovich, M., Sokolov, J., Gersappe, D., Chu, B., Nano Lett., 2004, 4, 659-664.
[16] Namasivayam, V., Larson, R., Burke, D., Burns, M., Anal. Chem., 2002, 74, 3378-3385.
[17] Diez, S., Reuther, C., Dinu, C., Seidel, R., Mertig, M., Pompe, W., Howard, J., Nano Lett., 2003, 3, 1251-1254
[18] O’Donovan, M., Oefner, P., Roberts, S., Genomics, 1998, 52, 44-49.
[19] Jones, A., Hoogendoorn, B., O’Donovan, M., Am. J. Hum. Genet., 1999, 65, 1196.
[20] Zhu, L., Lee, H., Lin, B., Electrophoresis, 2001, 22 3683-3687.
[21] Stanssens, P., Zabeau, M., Meersseman, G., Genome Res., 2004, 14, 126-133.

Theory and Background
123
[22] Jensen, K., Orum, H., Nielsen, P., Norden, B., Biochemistry, 1997, 36, 5072-5077.
[23] Dueholm, K., Nielsen, P., New J. Chem., 1997, 21, 19-31.
[24] Edman, C., Raymond, D., Wu, D., Tu, E., Sonsowski, R., Butler, W., Nerenberg, M., Heller, M., Nucleic Acid Res., 1997, 25, 4907-4914.
[25] Sonsowski, R., Tu, E., Butler, W.,O’Connell, J., Heller, M., Proc. Natl. Acad. Sci., 1997, 94, 1119-1123.
[26] Radtkey, R., Nucl. Acids Res., 2000, 28, e17.
[27] Heller, M., Forster, A., Tu, E., Electrophoresis, 2000, 21, 157-164.
[28] Heaton, R., Peterson, A., Georgiadis, R., Proc. Natl. Acad. Sci., 2001, 98, 3701-3704.
[29] Peterson, A., Heaton, R., Georgiadis, R., Nucl. Acids. Res., 2001, 29, 5163-5168.
[30] Asbury, C. L. Van den Engh, G., Biophys.J., 1998, 74, 1024.
[31] Suzuki, S.,Yamanashi, T., Tazawa, S., Kurosawa, O., Washizu, M., IEEE Trans. Ind. Appl., 1998, 34, 75.
[32] Washizu, M., Kurosawa, O., Arai, I., Suzuki, S., Shimamoto, N., IEEE Trans. Ind. Appl., 1995, 31, 447.
[33] Pohl, H. A., Dielectrophoresis (Cambridge: Cambridge UniversityPress), 1978.
[34] Gimsa, J., Bioelectrochemistry, 2001, 54, 23.
[35] Washizu, M., Kurosawa, O., IEEE Trans. Ind. Appl., 1990, 26, 1165.
[36] Yamamoto, T., Kurosawa,O., Kabata, H., Shimamoto, N., Washizu, M., IEEE Trans. Ind. Appl., 2000, 36, 1010.
[37] Kabata, H., Okada, W., Washizu, M., Japan. J. Appl. Phys. I, 2000, 39, 7165.
[38] Kawabata, T., Washizu, M., IEEE Trans. Ind. Appl., 2001, 37, 1625.
[39] Oana, H.,Ueda, M., Washizu, M., Biochem.Biophys.Res.Commun., 1999, 265, 140.
[40] Bakewell, D. J, Morgan, H., Milner, J. J., Characterisation of the dielectrophoretic movement of DNA in microfabricated structures, 10th Int. Conf. on Electrostatics (Cambridge) (Bristol:InstituteofPhysicsPublishing), 1999.
[41] Fixe, F., Branz, H., Louro, N., Chu, V., Prazeres, D., Conde, J., Biosens. Bioelectron., 2004, 19, 1591-1597.
[42] Fixe, F., Caneca, R., Prazeres, D., Ferreira, G., Chu, V., Conde, J., Appl. Phys. Lett., 2003, 83, 1465-1467.
[43] Balladur, V., Theretz, A., Mandrand, B., J. Colloid Interface Sci., 1997, 185, 197-209.
[44] Chan, V., Mckenzie S., Surrey, S., Fortina, P., Graves, D., J. Colloid Interface Sci., 1998, 203, 197-207.

Theory and Background
124
[45] Erickson, D., Li, D., Krull, U., Anal. Biochem., 2003, 317, 186-200.
[46] Watterson, J., Piunno, P., Krull, U., Anal. Chim. Acta, 2002, 469, 115-127.
[47] Micheal, F., Arup, K., J. Chem. Phys., 2004, 120, 4958-4968.
[48] Netz, R., Andelman, D., Physics. Rep., 2003, 380, 1-95.
[49] Ruehe, J., Balauff, M., Biesalski, M., Dziezok, P., Groehn, F., Motornov, M., Netz, R. Schmidt, M., Seidel, C., Stamm, M., Stephan, T., Usov, D., Zhang, H., Adv. Polym. Sci., 2004, 165, 79-150.
[50] Rant, U., Arinaga, K., fujita, S., Yokoyama, N., Abstreiter, G., Tornow, T., Langmuir, 2004, 20, 1251-1254.
[51] Herne, T., Tarlov, M., J. Am. Chem. Soc., 1997, 119, 8916-8920.
[52] Chance, R., Prock, A., Silbey, R., Adv. Chem. Phys., 1978, 37, 1-65.
[53] Cnossen, G., Drabe, K., Wiserma, D., J. Chem. Phys., 1992, 98, 5276-5280.
[54] Bard, A., Faulkner, L., Electrochemical Methods, 2nd ed., 2000, Wiley & Sons, New York.
[55] Marko, J., Siggia, E., Macromolecules, 1995, 28, 8759-8770.
[56] Tinland, B., Pulsen, A., Sturm, J., Weill, G., Macromolecules, 1997, 30, 5763-5765.
[57] Ikehata, A., Itoh, T., Ozaki, Y., Anal. Chem., 2004, 76, 6461-6469.
[58] Lioubimov, V., Kolomenskii, A., Mershin, A., Nanopoulos, D., Schuessler, H., Appl. Opt., 2004, 43, 3426-3432.

Theory and Background
125
CHAPTER 6
SUMMARY
Surface plasmon field-enhanced fluorescence spectroscopy (SPFS) uses the enhanced
electromagnetic field of a surface plasmon for the excitation of surface-confined fluorophores
placed near the metal-dielectric interface. SPFS was used in an in depth study of the
hybridization reaction between surface attached probes and fluorescently (Cy5) labelled
targets. The rate constants based on a simple Langmuir model for association (kon),
dissociation (koff), and the affinity (KA= kon/koff) for the interaction of probes/targets were
determined by using SPFS in hybridization kinetics.
In order to achieve high sensitivity and selectivity, a well-established architecture was
used for the sensor surface by applying self-assembly strategies using peptide nucleic acid
(PNA) probes on gold substrate as catcher. In this study, two kinds methodologies of the self-
assembly PNA/MCH monolayer (sequentially prepared and pre-mixed prepared system)
directly immobilized on the metal surface without anchoring species (e.g. straptavidin-biotin
system) was studied and the detection of DNA hybridization on sensor surface using Surface
Plasmon Florescence Spectroscopy (SPFS) was discussed. The applied detection format
exploited the specific recognition between immobilized probe sequences and fluorescence
labelled target sequence. Peptide nucleic acids (PNAs) have attracted great attention as
sensing probes for DNA targets owing to the stability of the duplex. The using of PNA as a
probe has benefits of overcoming the limit of ionic strength and detecting a point mutant
efficiently with high thermal stability. From titration analysis and kinetic experiments, the
sensor surface established with PNA has reasonably high sensitive to recognize the DNA
target with enough emission of fluorescence in evanescent field induced by surface plasmon.
Although the ionic strength would not influenced on the PNA/DNA hybridization
efficiency (Affinity Constant, KA) on the sensor surface, the deviation of fluorescence
intensity in various ionic strength condition should be dependent on the amount of ion species
in bulk solution, caused by configuration changes of PNA/DNA duplex form. For small
distances between chromophore and metal surface, the drastically reducing the probability of
exciting the chromophore by the surface resonance was exhibited. On the other hand, the
proximity to the metal surface gives rise to quenching effects which reduce the measurable

Theory and Background
126
fluorescence intensity. Through the experiment of inserting 50 nm Silicon buffer layer
between Au surface and Cy-5 labelled nucleotides, the fluorescence intensity would
drastically increased tens orders of magnitude higher in de-ionized water solution compared
with normal ionic strength (e.g. 10 nM or 100 nM) system instead of reduced up to baseline
(called ‘quenching effect’) such in case of the conventional DNA sensor matrix.
In order to evaluate the detection of single strand DNA molecules by hybridizing with
probe surface on metal, the probe PNAs were designed carefully to be complementary to a
recognition sequence of DNAs. Using the effect of electric field on binding process, the
hybridization of PNA and DNA on the metal surface could be controlled and investigated by
monitoring with Surface Plasmon Fluorescence Spectroscopy (SPFS). The influence of the
electric field on the hybridization of PNA and DNA would be also studied in varying the
impact factors (e.g. ionic strength, electric field intensity, configuration and DNA
concentration), which affect on the efficiency or velocity of detecting target DNA molecules
on PNA probe surface on a chip.
Based on a neutral backbone (PNA) was substituted for the negatively charged
phosphodiester backbone of the capture oligonucleotide (DNA), with applying simple bias
potential to the sensor electrode, since the brilliant electric field enhanced hybridization
system can be established and studied successfully, this suggests that shielding of the
phosphodiester backbone is an important component of the electric field assisted
hybridization process.
The application of electric field to PNA sensor matrix allows great acceleration and
exquisite control over the hybridization reactions. These advantages are augmented by the use
the low ionic strength and optimized attractive bias potential to Au surface. In general, these
low ionic strength buffers allow efficient migration of target oligonuleotides to descrete sites
in the presence of an applied potential.

Theory and Background
127
CHAPTER 7
SUPLEMENT
9.1 Abbreviations ATR Attenuated total reflection bp Base pairs Cy5 Cyanine dye Da Dalton (g/mol) DNA Deoxyribonucleic acid FRET Fluorescence resonance energy transfer GMO Genetically modified organism h Planck's constant HeNe Helium-Heon k
Wave vector KA Affinity constant kon Association rate koff Aissociation rate LASFN9 High refractive index glass from Schott LBL Layer-by-layer LOD Limit of detection MM0 Complementary match (base pair) MM1 Single base mismatch (base pair) n Refractive index PCR Polynerase chain reaction PBS Phosphate buffered saline (buffer) PDMS Polydimethylsiloxane PMT Photo multiplier tube PNA Peptide nuceic acid PSP Plasmon surface polariton rpm Revolutions per minute RR Round up ReadyTM RU Resonance unit S0, S1 Singlet electronic state of a molecule SA Streptavidin SAM Self-assembed monolayer SD Standard deviation SERS Surface enhanced Raman spectroscopy SPDS Surface plasmon diffraction sensor SPFM Surface plasmon fluorescence microscopy SPFS Surface plasmon fluorescence spectroscopy SP, SPP Surface plasmon polariton SPR Surface plasmon resonance TE Transversal electric (s-) polarization TIR Total internal reflection TM Transversal magnetic (p-) polarization µCP Micro-contact printing UV Ultraviolet

Theory and Background
128
9.2 List of Figures Figure 1.1 A typical biosensor consists of a detector and an electronic device(transducer) that converts the biological signal into a measurable output.
Figure 2.1. Most widely used configuration of SPR sensors: (a) prism coupler-based SPR system (ATR method).
Figure 2.2. Schematic drawing of total internal reflection and surface plasmon excitation in the Kretschmann geometry.
Figure 2.3. Schematic drawing of the charges and the electromagnetic field of surface plasmons.
Figure 2.4. Dispersion relation of photons traveling in the prism.
Figure 2.5. Diserpersion relation of plasmon surface polaritons (PSP) at a metal/dielectric interface before and after the adsorption of an analyte layer.
Figure 2.6. Jablonski diagram.
Figure 2.7. Schematic of fluorescence near metallic surfaces at different distance from metal to chromophors.
Figure 2.8. scan curves and corresponding fluorescence kinetics.
Figure 2.9. molecular interactions for self-assembly.
Figure 2.10. The base pairs of G-C and A-T. Figure 2.11. The B form of the DNA helix.
Figure 2.12. Structures of double strand of PNA and DNA hybridization.
Figure 2.13. Aggregation occurs when there is a net attraction and an equilibrium separation between the components.
Figure 2.14. A -assembled monolayers of alkanethiols on substrate (gold).
Figure 2.15. A typical kinetic curve of molecular interaction on the surface.
Figure 2.16. A typical curve of Langmuir adsorption isotherm.
Figure 3.1. Schematic Schematic draw of the surface plasmon fluorescence spectroscopy set-up and the flow cell.
Figure 3.2. Schematic draw of flow cell with Pt electrode patterns.
Figure 3.3. Lithographic process for manufacturing flow cell with Pt patterns.
Figure 3.4. Sample assembly consistent of prism, gold evaporated glass, spacer, flow-cell in Kretschmann configuration.
Figure 3.5. Autolab instrument for electrical bias potential inducing with three electrode system. Figure 3.6. Illustration of the self-assembled sensor matrix.
Figure 3.7. Procedure of mixed monolayer of ssPNA and MCH.
Figure 3.8. Kinetic SPR curves taken at = 55.7
Figure 3.9. Angular scan curves of the reflectivity R
Figure 3.10. SPR angular scans of PNA probe surface taken after exposure of MCH solution.

Theory and Background
129
Figure 4.1. Illustration of the DNA sensor matrix with PNA probe.
Figure 4.2. Angular scan curves of the reflectivity R;
Figure 4.3 Dilution degree of ssPNA surface with exposure of MCH solution in circulation.
Figure 4.4 Titration curves and angular scan for PNA (P-2)/DNA (T-2) hybridization in 10mM phosphate and 140mM NaCl solution.
Figure 4.5 Plot and fits by Langmuir isotherm of the saturated fluorescence intensity taken from Figure 4.4 versus target concentration c0.
Figure 4.6. Titration curves and angular scan for PNA (P-2)/DNA (T-2) hybridization in 10mM phosphate.
Figure 4.7. Plot and fits by Langmuir isotherm of the saturated fluorescence intensity taken from Figure 4.6 versus target concentration c0.
Figure 4.8. Titration curves and angular scan for PNA (P-2)/DNA (T-2) hybridization in 1mM phosphate.
Figure 4.9. Plot and fits by Langmuir isotherm of the saturated fluorescence intensity taken from Figure 4.8 versus target concentration c0.
Figure 4.10. Titration curves and angular scan for PNA (P-2)/DNA (T-2) hybridization in 10mM phosphate and 140mM NaCl solution.
Figure 4.11. Plot and fits by Langmuir isotherm of the saturated fluorescence intensity taken from Figure 4.10 versus target concentration c0.
Figure 4.12. Titration curves and angular scan for PNA (P-2)/DNA (T-2) hybridization in 10mM phosphate.
Figure 4.13. Plot and fits by Langmuir isotherm of the saturated fluorescence intensity taken from Figure 4.12 versus target concentration c0.
Figure 4.14. Titration curves and angular scan for PNA (P-2)/DNA (T-2) hybridization in 1mM phosphate.
Figure 4.15. Plot and fits by Langmuir isotherm of the saturated fluorescence intensity taken from Figure 4.14 versus target concentration c0.
Figure 4.16. Hybridization kinetics
Figure 4.17. Fluorescence deviation after replacing 150 mM buffer of 10 mM buffer solution.
Figure 4.18. The quantum yield of Cy5 labelled DNA in a range of ionic strength.
Figure 4.19. Fluorescence intensity deviation of sequentially prepared PNA probe and DNA hybridization in varying ionic strength during dissociation step.
Figure 4.20. Fluorescence intensity deviation of pre-mixed prepared PNA probe and DNA hybridization in varying ionic strength during dissociation step.
Figure 4.21. Plot of the saturated fluorescence intensity taken from Figure 4.20 versus target concentration c0.
Figure 4.22. The configuration changes of DNA duplex structure depend upon the ionic strength.
Figure 4.23. Fluorescence intensity of labelled DNA on SiOx buffer layer.
Figure 5.1. Electrophoresis schematic.

Theory and Background
130
Figure 5.2. Electrode flow cell used for E-field assisted immobilization and hybridization.
Figure 5.3. Cross section of an electrode flow cell. PNA attached Au surface is working electrode while Pt patterned electrode is counter electrode. An application of positive potential leads negatively charged ssDNA molecules to approach to the Au surface by electrostatic attractive force.
Figure 5.4. Kinetics of immobilization thiolated 100-mers PNA molecules attached Cy5 under the control of electrostatic attractive and repulsive potential and passive immobilization at open-circuit (up).
Figure 5.5. Electrically induced ‘switching’ of a ssDNA layer on Au surface monitored by SPFS measurement.
Figure 5.6. E-field enhancement hybridization of single base mismatched (mm1) ssDNA and PNA probe.
Figure 5.7. The kinetic profiles of the hybridization between probe PNA and ssDNA labelled Cy5 chromorphore under alternative electric field assistance (+50 mV, -300 mV) and open-circuit upon varying the ionic strength.
Figure 5.8. Plot of the saturated fluorescence intensity taken from Figure 5.7
Figure 5.9. Kinetics of the electric field assisted hybridization of ssDNA and probe PNA under varying the positive bias potential of +50 mV, +100 mV and +400 mV, respectively, and passive hybridization at open-circuit.
Figure 5.10. Comparison of the hybridization degree in varying free ssDNA concentration (1 nM, 10 nM and 100 nM) in bulk solution in electric assisted capturing process with +50 mV attractive bias potential and at open-circuit.
Figure 5.11. Comparison of the association and dissociation kinetics of PNA/DNA hybridization
Figure 5.12. The self-assembled sensor matrix based on Streptavidn-Biotin anchor system.
Figure 5.13. The hybridization of the PNA probe and 100 pM PCR DNA product (196 base pairs) at open-circuit and under control of +50mV electric field.
7.3 List of Tables Table 1.1 Principal transduction systems used in biosensors.
Table 3.1. Optical constants and determined thickness of sensor matrix measured by SPR. Table 3.2. The sequences of PNA probes.
Table 4.1. The sequences of all of the PNA and DNA used in this chapter.
Table 4.2. The rate constants and affinity constants for P2 PNA and T2 DNA hybridization in 150, 10, 5 and 1 mM phosphate buffer solutions.
Table 5.1. Rate constants and affinity constants for PNA/DNA hybridization at open circuit potential and at different applied potentials, as indicated

Theory and Background
131
Curriculum Vitae
Name : Hyun-pyo Jeon
Address : Hegelstrasse 58, 55122 Mainz, Germany
Telephone : +49 (0)6131 570 22 70, Mobile : +49 (0)160 3260 375
E-mail : [email protected]
Education & Research Activities Max Planck Institute for Polymer Research 2004 – Present Ph.D candidate, Material Science
Thesis title : “Investigation of PNA/DNA hybridization on Au surface under electric field by using Surface Plasmon Fluorescence Spectroscopy(SPFS)”
Kumho Chemical Laboratory LTD., in Korea 1997 – 2003 Senior researcher, Electronic Material Division
Project A : “Evaluation of chemically amplified photoresist for ArF excimer laser lithography”
Project B : “Evaluation of photoresist for KrF excimer laser lithography” Project C : “Photo-acid generators for chemically amplified photoresist system”
Hanyang University in Seoul, Korea 1995-1997 M.S. degree, Chemistry Department
Thesis title : “Silicon containing photoresist for ArF excimer laser lithography” Hanyang University in Seoul, Korea 1991-1995 B.S. degree, Chemistry Department Academic Activities 1. The 77th Annual Meeting of the Korean Chemical Society (Oct 20-21, 1995), “A study on
negative photoresist with hexamethoxymethylmelamine as a crosslinker” 2. The 78th Annual Meeting of the Korean Chemical Society (May 24-25, 1996), “Chemicall
y Amplified Positive Resists for ArF Excimer Laser Lithography” 3. The 79th Annual Meeting of the Korean Chemical Society (Oct 18-19, 1996), “Evaluation
of Chemically Amplified Resist Based on Aliphatic Silyl Methacrylate for 193 nm Lithography”
4. The Annual Meeting of Korean Society of Imaging Science and Technology (Dec 17-19, 1998), “Evaluation of photoresist for 248nm based on polyhydroxystyrene derivatives”
5. The 10th Lithography Workshop (May 10, 2002), “New ArF photoresists based on ROMA polymers”

Theory and Background
132
Presentation 1. The 28th Japan Nagase Microelectronics Seminar in Japan (Oct 19-20, 2000), “New app
roach for ArF photoresist” 2. Technology services for IMEC (Belgium), Sony (Japan), Mitsubishi (Japan), Toshiba (Jap
an) and INTEL (USA) (2002), “New approach for ArF photoresist” 3. The 19th Annual Conference of Photopolymer Science and Technology in Japan (Jun 26-
28, 2002), “New ArF photoresist based on modified cycloolefin polymers” 4. International Max-Planck Research School for Polymer Materials Science in Germany (Ju
n 8, 2004), “Study of Bio-functional Thin Film using Surface Plasmon Field-enhanced Fluorescence Spectroscopy (SPFS)”
5. The joint symposium of Research Center Jülich and Max-Planck Institute for polymer research in Germany (Jun 3, 2005), “Study of Direct Electric Field Effects on PNA / DNA Hybridization Using Surface Plasmon Fluorescence Spectroscopy (SPFS)”
Scientific publications 1. “New approach for 193nm resist using modified cycloolefin Resin”, Proceedings of SPIE,
4690, 120, 2002. 2. “Novel approach for high resolution using cyloolefin-alt-maleic acid derivatives polymer fo
r ArF lithography”, Proceedings of SPIE, 4690, 623, 2002. 3. “New ArF photoresist based on modified maleic anhydride cyloolefin polymers”, J. Photop
olymer Sci. Tech. 15, 4, 541, 2002. 4. “PNA based biosensor for DNA hybridization using Surface Plasmon Fluorescence Spect
roscopy (SPFS)”, Anaytical Chemistry, 2010. (applied) 5. “Electric field enhanced PNA/DNA hybridization on sensor-chip using Surface Plasmon Fl
uorescence Spectroscopy (SPFS)”, Journal of American Chemical Society, 2010. (applied)
List of Patent 1. Patent Number = KR 251464, “KrF resist compositions” 2. Patent Number = KR 265940, “KrF resist compositions” 3. Patent Number = KR 270352, “KrF resist compositions” 4. Patent Number = US 6,210,859, “Copolymer for the manufacture of chemical amplified p
ositive photoresist and a positive photoresist composition using the same” 5. Patent Number = KR 273108, “ArF resist compositions” 6. Applied Number = US 01-0029352, JP, EP 022509970, TW 91102342, “Polymer for che
mically amplified photoresist and chemically amplified resist composition containg the same”
Reference : available on request