INVESTIGATION OF THE EFFECTS OF STRESS ... - dtic.mil · and Wesley C. Gallaugher, authors) NOTIC...
128
ML-TDR-64-3 CM" - O [HARD COPY $ ., MICROFICHE , INVESTIGATION OF THE EFFECTS OF STRESS CORROSION ON HiGH-STRENGTH STEEL ALLOYS TECHNICAL DOCUMENTARY REPORT NO. ML-TDR-64-3 February 1964 DDC AF Materials Laboratory DDC-IRA Research and Technology Division Air Force Systems Command Wright-Patterson Air Force Base, Ohio Project No. 7381, Task No. 738103 4 (Prepared under Contract No. AF 33(657)-8705 by The Boeing Company, Airplane Division, Renton, Washington: Gary A. Dreyer and Wesley C. Gallaugher, authors)
Transcript of INVESTIGATION OF THE EFFECTS OF STRESS ... - dtic.mil · and Wesley C. Gallaugher, authors) NOTIC...

ML-TDR-64-3 CM" - O
[HARD COPY $ .,MICROFICHE ,
INVESTIGATION OF THE EFFECTS OF STRESS CORROSIONON HiGH-STRENGTH STEEL ALLOYS
TECHNICAL DOCUMENTARY REPORT NO. ML-TDR-64-3
February 1964DDC
AF Materials Laboratory DDC-IRA
Research and Technology DivisionAir Force Systems Command
Wright-Patterson Air Force Base, Ohio
Project No. 7381, Task No. 7381034
(Prepared under Contract No. AF 33(657)-8705 by The BoeingCompany, Airplane Division, Renton, Washington: Gary A. Dreyer
and Wesley C. Gallaugher, authors)

NOTIC ES
When Government drawings, specifications, or other data are used for anypurpose other than in connection with a definitely related Government procure-ment oper dion, the United States Government thereby incurs no responsibilitynor any obligation whatsoever; and the fact that the Government may have formu-lated, furnished, or in any way supplied the said drawings, specifications, orother data, is not to be regarded by implication or otherwise as in anN" mannerlicensing the holder or any other person or corporation, or conveying any rightsor permission to manufacture, use, or sell any patented invention that may inany way be related thereto.
Qualified requesters may obtain copies of this report from the DefenseDocumentation Center (DDC), (formerly ASTIA), Cameron Station, Bldg. 5,5010 Duke Street, Alexandria 4, Virginia.
This report has been released to the Office of Technical Services, U.S.Department of Commerce, Washington 25, D. C., in ,iock quantities for saleto the general public.
Copies of this report should not be returned to the Aeronautical SystemsDivision unless retuin is required by security considerations, contractualobligations, or notice on a specific document.
B

ML-TDR-64-3
INVESTIGATION OF THE EFFECTS OF STRESS CORROSION
ON HIGH-STRENGTH STEEL ALLOYS
TECHNICAL DOCUMENTARY REPORT NO. ML-TDR-64-3
February 1964
AF Materials Laboratory
Research and Technology Division
Air Force Systems Command
Wright-Patterson Air Force Buse, Ohio
Project No. 7381, Task No. 738103
(Prepared under Contract No. AF 33(667)-8?05 by The Boeing
Company, Airplane Division, Renton, Washington; Gary A. Dreyer
and Wesley C. Gallaugher, authors.)

FOREWORD
The program described in this report was conducted by the Metals Group,Materials and Process Unit, Structures Staff, Airplane Division, The BoeingCompany, Renton, Washington. The work was administered by the StructuralMaterials Section, Materials Applications Dbi-sion, Air Force MaterialsLaboratory, Research and Technology Division. This work was conducted underProject No. 7381, "Materials Application," Task No. 738103, "Data Collectionand Correlation." Project Engineer was Lt. R. M. Dunco of the StructuralMaterials Section.
The investigation was initiated in June 1962 and concluded in December 1963.R. A. Davis of the Metals Group directed the technical aspects of the programunder the supervision of M. A. Disotell, supervisor of the Metals Group,F. N. Markey, Chief of the Materials and Process Unit, and A. C. Larsen, StaffEngineer -Structures. Test work was carried out by G. A. Dreyer andW. C. Gallaugher, assisted by F. E. Machula. All laboratory testing and evalua-tion was done in the Metals Laboratory, Airplane Division. J. C. McMillan ofthe Airplane Division and Dr. R. M. N. Pelloux of the Boeing Scientific ResearchLaboratories aided In the preparation and interpretation of the electron micro-graph studies.
i
ABSTRACT
The stress corrosion susceptibility of several high strength steels has beenevaluated by alternate-immersion laboratory testing in a 3.5-percent sodiumchloride solution. The steels evaluated were the stainless steels AFC 77,AM 350, AM 355, and 17-4PH: the low alloy steels D6AC, 4335M, 4340, H-11.4330M, and HY-Tuf; and the high nickel steels lbNi-9Co-5Mo, lNi-7Co-5Mo,and 9Ni-4Co. The variables investigated were product form, grain direction,tensile strength level, stress level, cold working, ausforming, welding, andprotective coatings. Detailed results relating stress corrosion susceptibilityto the variables and alloys studied are included. Notch tensile and fatiguecracked fracture toughness testing was carried out for correlation with stresscorrosion susceptibility. Optical microscopy, electron microscopy. and X-raydiffraction studies were made to supplement the mechanical property and stresscorrosion testing. A literature survey of related stress corrosion test data isincluded.
This technical documentary report has been reviewed and is approved.
4..40W. P. Conrar Chief
Materials Engineering BranchMaterials Applications DivisionAF Materials Laboratory
iii

CONTENTS
Page
1. INTRODUCTION 1
II. SUMMARY 3
III. PROCEDURE 7
A. Material Evaluation 7
B. Specimen Preparation 7
C. X-Ray Residual Surface Stress Measurements 9
D. Stress-Corrosion Testing 9
E. Test Variables 12
F. Fractography and Metallography 12
G. Supplemental Information - Previous Stress- 13Corrosion Study
H. Literature Survey 13
IV. RESULTS 21
A. Material Evaluation 21
B. Specimen Preparation 21
C. X-Ray Residual Surface Stress Measurements 21
D. Stress-Corrosion Testing 24
E. Test Variablc-- 24
1. Product Shape 242. Environment 303. Grain Direction 314. Processing Variables 31
a. Strength Level 31b. Heat Treatment Variationsc. Ausforming 46d. StraIghtening 46e. Welding 49
f. coatings 495. Design Data 49
F. Fractography and Metallography 53
0. Supplemntal Information - Previous Stress-Corrosion Study 53
H. Literature Survey 53
iv

Page
V. DISCUSSION 57
A. The Effect of Material and Processing Variables onStress-Corrosion Susceptibility 57
B. Fracture Analysis of Stress-Corrosion Cracking inAlloy Steels 69
C. Stress Corrosion and Hydrogen Embrittlement 83
VI. CONCLUSIONS 89
VII. RECOMMENDATIONS 91
REFERENCES 93
Appendix I Specimen Configurations 97
Appendix II Fracture Toughness Evaluation 103
Appendix III Supplemental Work - Previous Stress-Corrosion Study 107
Appendix IV Review of Recently Published Literatureon Stress-Corrosion Cracking 119
V

ILLUSTRATIONS
Figure
1 Boeing U-Bend Configuration 10
2 Stress Level as a Function of U-Bend Configuration 10Leg Deflection
3 Sheet Stress-Corrosion Configuration 11
4 Alternate -Immersion Test Apparatus 11
5 Relationship Between Residual and Applied Stresses 25
6 Relative Stress-Corrosion Susceptibility of ComparativeAlloy Forms 25
7 Rainfall During Semi-industrial Environment Testing 32
8 Comparison Between Alternate-Immersion and Semi-industrial Exposure 32
9 Relationship Between Grain Direction and Stress-CorrosionSusceptibility 36
10 Change in Strees -Corrosion Susceptibility with StrengthLevel 36
11 Stress-Corrosion Susceptibility of AFC 77 Billet A 38
12 Stress-Corrosion Susceptibility of 18-7-5 Billet B 39
13 Stress-Corrosion Susceptibility of D6AC Billet C 40
14 Stress-Corrosion Susceptibility of 4335M Billet E 41
15 Stress-Corrosion Susceptibility of 4:140 Billet F 42
16 Stress-Corrosion Susceptibility of H-i1 Billet H 43
17 Effect of Deformation on Stress-Corrosion Susceptibility 48
18 Relative Stress-Corrosion Susceptibilities of Duplicate
Sheets, Billets, and Plates 56
19 Streas-Corrosion Susceptibilities of Air-Melt andVacuum-Melt H-I 56
20 Dependence of Intergranular Cracking on Grain Direction 59
21 Electron Micrograph of AM 355 in the DADF Heat Treat
Condition 65
22 Relative Stress-Corrosion Susceptibility of Billet Materials 65
23 Relative Stress-Corrosion Susceptibility of Plate Materials 66
vi

Figure Pa
24 Relative Stress-Corrosion Susceptibility of Sheet Materials 66
25 Relationship Between Stress-Corrosion Susceptibility andFracture Toughness 67
26 Stress-Corrosion Fracture Face of H-11 Plate Material at270 to 300 ksi Ultimate Strength. Failure Time, 127 Hours 71
27 Stress-Corrosion Fracture Face of 4340 Billet Material at220 to 240 ksi Ultimate Strength. Failure Time, 171 Hours 71
28 Stress-Corrosion Fracture Face of D6AC Billet Material at270 to 300 ksi Ultimate Strength. Failure Time, 27 Hours 71
29 Stress-Corrosion Fracture Face of 4340 Plate Material at260 to 280 ksi Ultimate Strength. Failure Time, 612 Hours 71
30 Electron Fractograph of Intergranular Cracking in H-1Billet Material at 270 to 300 ksi Heat Treat Strength Range 73
31 Electron Fractograph of Intergrartular Cracking in D6ACBillet Material at 260 to 280 kas Heat Treat Strength Range 73
32 Electron Fractograph of Intergranular Cracking in AFC 77Billet Material at 250 to 270 ksi Heat Treat Strength Range 74
33 Electron Fractograph of Intergranular Cracking in 4340 PlateMaterial at 260 to 280 ksi Heat Treat Str, ,gth Range 74
34 Electron Fractograph of Intergranular Cracking in 9Ni-4CoPlate Material at 250 to 270 ksi Heat Treat Strength Range 75
35 Fracture Surface at Origin Near Tension Surface in Aus-formed 4340 75
36 Fracture Surface at Origin Center in Aua'ormed 4340 76
37 Fracture Surface at Origin Perimeter in Ausformed 4340 76
38 Fracture Appearance o the Rapid Crack Region from aStress-Corrosion Specimen of D6AC 78
39 Fracture Appearance of the Rapid Crack Region from aStress-Corrosion Specimen of 9Ni-4Co 78
40 Micrograph of Banding in 4340 Billet Material -- ADS Etch 79
41 Micrograph of Grain Orientation in Ausforined D6AC -
ADS Etch 79
42 Fracture Faces of the Fracture Toughness Specimens FromPlate Materials so
43 Micro gractog hc Appearance of Fatigue in 9Ni-4Co 81
vii

Figure Page
44 Microfractographic Appearance of Fatigue in 18-7-5 81
45 Microfractographic Appearance of Interface BetweenFatigue and Plane-Strain Region in 9Ni-4Co 82
46 Microfractographic Appearance of Fatigue in 4335M 82
47 Microfractographic Appearance of Fatigue in 17-4PH 84
48 Microfractographic Appearance of the Plane-Strain Regionin 9Ni-4Co 84
49 Microfractographic Appearance of the Plane-Strain Regionin 18-7-5 85
50 Microfractographic Appearance of the Plane-Strain Regionin D6AC 85
51 Microfractographic Appearance of the Plane-Strain Regionin 18-9-5 86
52 Microfractographic Appearance of the Plane-Strain Regionin H-11 86
53 Fracture Origin Produced by Electrolytically Charging 4340 87
54 Fracture Origin Produced by Electrolytically Charging 18-9-5 87
55 -- Schematic Illustration of Specimen Locations from EachMaterial Form 99
56 Stress -Corrosion Specimen Configurations 100
57. Srfooth and Notched Tensile Specimen Configurations 101
58 Fracture Toughness Specimen Configurations 102
59 Imact _Properties and Stress-Corrosion Failure Times of4340 113
60 Impaczt Properties of Stress-Corrosion Failure Times of4340M 113
61 Imrpact Properties and Stress-Corrosion Failure Times of4330M 114
62 Impact Properties and Stress-Corrosion Failure Times of
H1-11 114
63 Izod Impact Failure Face of 4340 After 400*F Temper 116
64 Izod Impact Fracture Face of 4340M After 800*F Temper 116
65 Izod Impact Fracture Face of 4330M After 600F Temper 117
66 Izod Impact Fracture Face of H-11 After 1000 F Temper 117
viii

TABLES
Table
1 Summary of Least-Susceptible Alloys 4
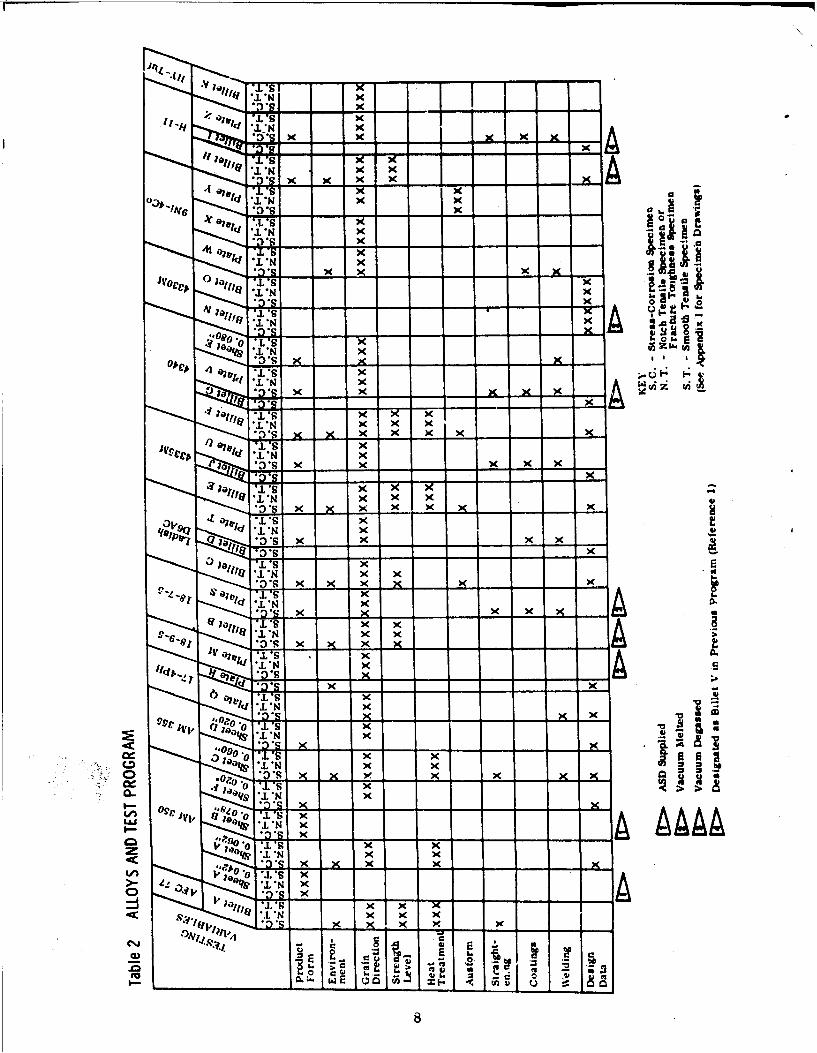
2 Alloys and Test Program
3 Description of Test Variables 14
4 Standard Steel Heat Treatment Procedures 16
5 Special Steel Heat Treatment Procedures 17
6 Coating Processes 16
7 Chemistries of Test Materials 22
8 Residual Surface Stresses in Billets and Plates 23
9 Tensile Properties of Steel Alloys - Standard Heat Treatment 26
10 Tensile Properties of Steel Alloys -Special Heat Treatment 28
11 Fracture Toughness Properties 29
12 Testing Times of Comparative Alloy Forms 30
13 Environmental Testing Times 33
14 Effect of Grain Direction on Stress-Corrosion Susceptibility 34
15 Effect of Strength Level on Stress-Corrosion Susceptibility 37
16 Testing Times of Several Alloys After Varying Heat Treatmentand Strengthening Processes 45
17 Testing Times of Deformed Alloys 47
18 Weld Wire Chemical Compositions 50
19 Testing Times of Welded Alloys 51
20 Testing Times of Coated Alloys 52
21 Comparative Testing Times of Duplicate Sheets, Billets,and Plates 54
22 Relative Susceptibility for Intergranular Cracking 58
23 Volume Percent Delta Ferrite in AM 350 and AM 355 62
24 Stress-Corrosion Fracture Modes 70
25 Summary of Least-Susceptible Alloys 90
26 Heat Treatment, Continuous-Immersion, and Alternate-
Immersion Testing of 4340 109
ix
ITable P27 Heat Treatments and Izod Impact Properties of 4340,4340M, 4330M, and H-11
28 Smooth Tensile Properties of 4340, 4340M, 4330M, and H-11 112
29 Tempering Temperatures that Produced Similarities inFracture Face Appearances 115
x

SYM BO L S
Ftu Ultimate tensile strength
Fty 0. 2-percent tensile yield strength
Fntu Notched ultimate tensile strength
N/UN Notched-to-unnotched tensile strength ratio
Gc Fracture toughness index (lb-in)
Kc Critical stress intensity factor, plane stress (ksi VIMi) (Appendix II)
KIc Critical stress intensity factor, plane strain (ksi V-1) = 0. 233 oN V/R
psi Pounds per square inch
RA Percent reduction in area
K orLk Stress intensity factor
ksi Kips per square inch
a Stress (psi or ksi)
E Young's modulus (psi)
P Plate
S Sheet
B Billet
RHR Roughness height reading
HT Heat treatment
OF Degree Fahrenheit
NF No failure in 1000 hours
ASTM American Society for Testing Materials
DADF Double age, double freeze heat treatment process
SCT Subzero cool and temper heat treatment process
SCT' Altered subzero cool and temper heat treatment process
BMS Boeing Material Specification
BAC Boeing Process Specification
xi
I. INTRODUCTION
Stress-corrosion cracking of high-strength steel alloys has been of concern with
the increased usage of these materials in the aerospace industry. The occurrence
of stress-corrosion cracking is related in a complex manner to the amount of
time a component has been exposed to both tensile stress and a corrosive environ-
ment. Because of the extreme complexity of this phenomenon in commercial
steel alloys, there is generally considerable scatter in data obtained from labora-
tory tests, which further increases the difficulty in evaluating stress-corrosion
results. Although laboratory test data have serious limitations for direct com-
parison with service performance, this type of data is the primary means of
material evaluation and selection with respect to stress -corrosion susceptibility.
The primary concern of the present investigation has.been an engineering evalu-
ation of the factors affecting stress-corrosion cracking in low-alloy, stainless,
and high-nickel steels.
This program is a continuation and expansion of a previous evaluation (Reference 1),
which was concerned with the effects of surface finish, grain direction, stress
level, residual surface stress, and heat-treat strength on the stress-corrosion
susceptibility of 4340, 4340M, 4330M, H-11, AM 350, and AM 355.
The selected steel alloys for this investigation were AFC 77, AM 350, AM 355,
17-4PH, Ladish D6AC, 18-7-5, 18-9-5, 4335M, 4340, 4330M, 9N1-4Co, H-11,and HY-Tuf. The stress-corrosion testing involved alternate immersion of
U-bend (billet and plate stock) and tensile-type (sheet) specimens in a 3. 5 percent
sodium chloride solution. The variables and alloys evaluated are summarized
in Table 2 (Page 8) and briefly described below.
A. Product Shape
The materials were in three forms: billet (8 x 8 x 12 inches), plate (3/8 x 10 x
48 inches), and sheet (0. 02 to 0. 08 gage).
B. Environment
In addition to the alternate-immersion testing, one form of each alloy was tested
in a semi-industrial atmosphere.
C. Grain Direction
Transverse and longitudinal grain directions were evaluated on all forms of each
material.
Manuscript released by authors February 1964 for publication as a Materials
Laboratory technical documentary report.
1

D. Processing Variables
1. Strength Levels
The high-strength alloys were tested in the 180- to 201,., 220- to 240-, and 260-to 280-ksi ultimate strength ranges.
2. Heat-Treat Variations
Alternate and additional heat treatments were performed on a selected numberof alloys for the evaluation of delta ferrite content, carbide distribution, andstabilized structures on stress-corrosion susceptibility. Austempering andmartempering were also evaluated on 4335M and 4340.
3. Ausforming
This method of strengthening was studied on 4340, 4335M, Ladish D6AC, and9Ni-4Co.
4. Straightening
Various percentages of deformation were applied to heat-treated specimens ofAFC 77, AM 355, 18-7-5, 4335M, 4340, and H-11 to simulate straighteningoperations.
5. Welding
Manual and automatic fusion welding were evaluated on all the alloys obtainedin plate form. Except for D6AC plate, no attempt was made to check the effectof weld wire on stress-corrosion susceptibility.
6. Coatings
Five different coating techniques - epoxy paint, cadmium plating, cadmium-titanium plating, cadmium plating plus epoxy paint, and flame-sprayed aluminumcoatings - were evaluated on all the alloys obtained in plate form.
E. Design Data
Design data were generated by evaluating two heats from eight of the 13 alloys.The specimens were stressed to 40, 60, and 80 percent of their yield strengths.
The stress-corrosion susceptibility of the alloys was related to notch sensitivityand fracture toughness. Metallography and microfractography were used tostudy the stress-corrosion fracture modes. Supplementary studies concerninganodic-cathodic charging experiments with 4340 and 18-9-5 steels and Impact-energy/stress-corrosion-susceptibilty relationships with the low-alloy steelsused In the previous program have been included In this report.
2

II. SUMMARY
The stress -corrosion cracking susceptibility of several stainless, low-alloy,and high-nickel steels was evaluated by alternate-immersion testing in a .3. 5-percent sodium chloride solution. These steels were: AFC 77, AM 350, AM 355,17-4PH, Ladish D6AC, 4335M, 4340, H-11, 4330M, HY-Tuf, 1SNi-9Co-5Mo,18Ni-7Co-5Mo, and 9Ni-4Co. Several variables were considered: alloy form,environment, grain direction, strength level, heat treatment, ausforming,straightening, welding, coatings, and stress level. Billet and plate stress-corrosion specimens were stressed to the desired levels by bending: sheet speci-mens were loaded in tension. In addition to the alternate-immersion testing,comparisons were made after semi -industrial environmental exposure. Thelongitudinal and transverse grain directions of all alloy forms were compared.All materials were heat treated to their maximum ultimate strengths and the AFC77, 18-7-5, DGAC, 4335M, 4340, and H-11 alloys, which have maximum ultimatestrengths in the 260- to 280-ksi range, were also heat treated in the 220- to240- and 180- to 200-ksi ultimate strength ranges. The heat treatment variableinvolved mill processing, martempering, and austempering of 4335M and 4340:heat treating AM 350 and AM 355 to give DADF and altered SCT 850 conditions:and expanding the tempering temperature range of AFC 77. The 4340, 4335M,D6AC, and 9Ni-4Co were ausformed and heat treated to their maximum strengths.AFC 77, AM 355, 18-7-5, 4335M, 4340, and H-11 were plastically deformedafter heat treating. Manual- and fusion-welding procedures were comparedusing 17-4PH, 18-7-5, D6AC, 4335M, 4340, 9Ni-4Co, Il-l, AM 355, andAM 350. Cadmium, cadmium-titanium, epoxy paint, cadmium plus epoxy paint,and flame-sprayed aluminum coatings were evaluated on 18-7-5, D6AC, 4335M,4340, H-11, and 9Ni-4Co. Duplicate heats of AM 350, AM 355, 17-4PH, D6AC,4335M, 4340, H-l, and 4330M were evaluated at stress levels of 80, 60, and40 percent of the 0.2-percent yield. All of the previously mentioned variableswere evaluated at the 80-percent stress level. To complement the stress-corrosion testing, x-ray residual surface stress measurements were made.Metallographic and fractographic studies were carried out using the optical andelectron microscopes. Fracture toughness panels were prepared for the plateand sheet materials and the 18-7-5, 4335M, and 4340 billet materials. Notchtensile specimens were prepared for all billet and sheet materials.
The areas covered in this program have shown the following results:
1) Plate material was usually less susceptible to stress corrosion than billetmaterial. The longitudinal grain directions were usually less susceptiblethan the transverse grain directions.
2) Alternate-immersion testing provides a laboratory means of evaluatingmaterials and processes. Final evaluation of alternate-immersion datawould depend on judgment and experience with a material having a knownservice performance.
3

!
3) Lowering the tensile strengths of AFC 77, D6AC, and 4335M billet materialsincreases the notched-to-unnotched ultimate strength ratio and decreasesthe stress-corrosion susceptibility. The 4340 at the 260- to 280-ksi strengthlevel was less susceptible than 4340 at the 220- to 440-ksi strength. Therewas no difference in the N/UN ratios of 4340 at these two strengths. Fracturetoughness was not evaluated at the 180- to 200- and 220- to 240-ksi ultimatestrength ranges for the low-alloy and high-nickel steels.
4) AM 355 in the DADF and altered SCT 850 conditions was less susceptiblethan after the SCT 850 heat treatment. Martempering, compared to oilquenching, decreased the susceptibility of 4340 and 4335M. Changes in sus-ceptibility of D6AC, 4340, and 4335M after ausforming indicated a dependenceon material chemistry.
5) Laboratory duplication of mill annealing processes on 4335M and 4340, andresults obtained from testing AM 355 thin sheet and high-nickel steels,indicate that mill processing may have an influential effect on stress-corrosionsusceptibility.
6) The least susceptible alloys as rated by alternate-immersion testing areshown in Table 1.
Tible I SUMMARY OF LEAST-SUSCEPTIBLE ALLOYS
Yield Strength (k.) Alloy Alloy Form
270 18-7-5 Billet
210 to 230 18-7-5, martempered Billet4335M, and D6AC
170 to 190 H-11, 4335M, and 4340 Billet
255 18-7-5 Plate
210 to 220 9NI-4Co, 4335M Plate
180 to 200 17-4PH Plate
7) Evaluation of plastically deformed 4340 and H-1i indicated a decrease insusceptibility after 0. 5-percent strain and an increase in susceptibility after1.0-percent strain. AM 355, after 1.0-percent strain, was less susceptiblethan before strainin or after 3.0-percent strain.
8) Manual and fusion welds were more susceptible than the base materials. Noseparation could be made between the two welding methods.
9) AU coatings decreased the failure tendencies of the test alloys. Of the fivecoatings, cadmium and cadmium-titanium plating appeared to offer the leastprotection.
10) Tests to determine a threshold stress below which stress-corrosion failureswould not occur showed duplicate 4330M billets to be failure resistant at
4

60 and 40 percent of yield and duplicate 4335.1 and 4340 hil lets to be resistantat 40 percent of yield during 1000 hours of alternate-immersion testing.
11) Final surface stresses could be determined by adding residual surfacestresses determined by x-ray measurements and applied stresses. Nocorrelation was ncted between the magnitude ot the final stresses and stress-corrosion susceptibility.
12) The optical and electron microscope studies show the primary iractureorigin to be intergranular. Electron microscope studies indicated thathydrogen embrittlement and stress-corrosion fractures are similar.
13) Increased fracture toughness generally corresx)nded to a decrease in stress-corrosion susceptibility. One exception to this general rule is the low fracturetoughness and high resistance to stress-corrosion cracking of the 17-4PHalloy.
5

III. PROCEDURE
A. MATERIAL EVALUATION
The alloys selected for evaluation in this program were the stainless steelsAFC 77, AM 350, AM 355, and 17- IPH; the low-alloy steels Ladish D6AC,4335M, 4340, H-11, 4330M, andHY-Tuf; and the high-nickel steels 18Ni-9Co-5Mo, 18Ni-7Co-5Mo, and 9Ni-4Co. Three material forms werc evaluated:billet, plate, and sheet. These alloys and their respective forms are listed inTable 2. All billets and plates were ultrasonically inspected and all billetsmacroexamined prior to testing. Preliminary tensile tests were used to deter-mine the billet transverse grain direction having the lowest ductility. This graindirection was used in the majority of testing, since previous data (Reference 1)showed that the direction having the lowest reduction in area was the most sus-ceptible to stress corrosion. Chemical compositions of all billets, plates, andsheets were determined.
B. SPECIMEN PREPARATION
Stress-corrosion specimens were removed from all materials. Smooth tensile,notch tensile, and fracture toughness specimens were cut from selected alloysand alloy forms. A breakdown of the mechanical property specimens used foreach alloy condition is given in Table 2. Typical billet, plate, and sheet speci-men locations in as-received material and detail drawings of all specimen con-figurations .rc given in Appendix I.
All billet and plate specimens were heat treated to the desired conditions andfinal machined. The stress-corrosion specimens were ground to final dimen-sions with a nominal 32 RHR finish since this had been shown to be the moststress-corrosion susceptible of several mach4ning processes (Reference 1).Aircraft process specifications require tempering of the low-alloy steels aftergrinding. This postgrind temper produced an oxide that was removed by vaporblasting. To be consistent, the surface-ground stainless and maraging steelswere also vapor blasted. Vapor-blasted specimens used in the deformationstudies were deformed by bending in four-point loading. All fusion-weldedstress-corrosion specimens were radiographically inspected after grinding tofinal dimensions. Vapor-blasted plate specimens were used to evaluate varioussurface coatings.
Sheet specimens were precoated to prevent decarburization, heat treated, gritblasted to remove the precoat, and machined to final width dimensions. Sheetdeformation specimens were deformed in tension. The amounts of deformation
in both the U-bend and sheet specimens were determined from strain-gagemeasurements. Fusion-welded sheet stress-corrosion specimens were radio-graphically inspected after welding.
7
it.1 N x
;011' -T -1 x -
x -
Kx
E V&cg1N K
11f.LN x Ila
ivr',01,1 - -O 1*N K
.1/N K
ri -1 -
-x
a' 1 0 1 1, x. --- X - -.
'.LN K
..L
.1'N K
VN- x - -
ff 9( ./N K'Psi KQ I I - K
=S Kli *L J/N K x
. J/N K
6 JO*1S - -- - -
I S K6Lf *J/N KS
00 '1LN K _ x.MI( K.
GOs .J.N K
318 K Xx
.L Kr IN -J -N -
*J/N K
E IN.. X
C)~
8
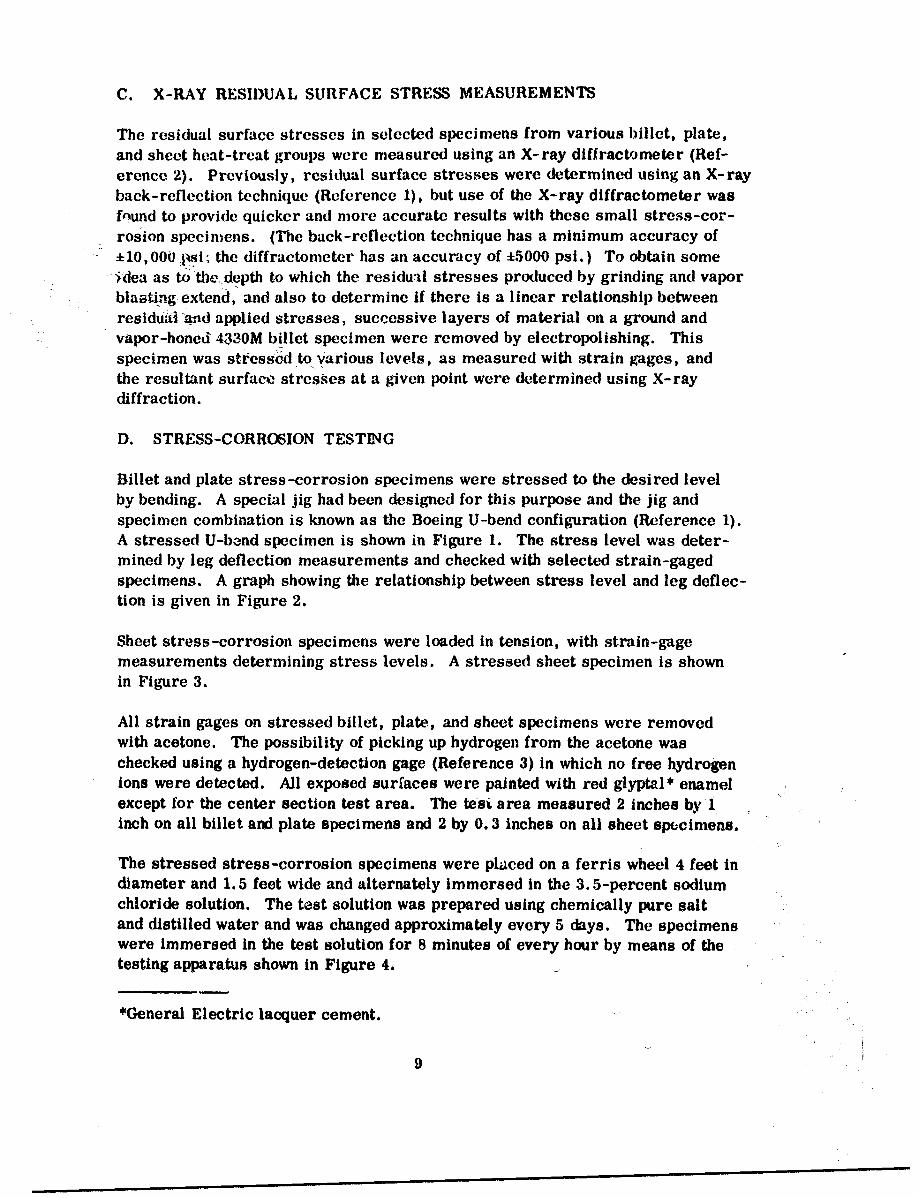
C. X-RAY RESIDUAL SURFACE STRESS MEASUREMENTS
The residual surface stresses in selected specimens from various billet, plate,and sheet heat-treat groups were measured using an X-ray diffractometer (Ref-erence 2). Previously, residual surface stresses were determined using an X-rayback-reflection technique (Reference 1), but use of the X-ray diffractometer wasfound to provide quicker and more accurate results with these small stress-cor-rosion specimens. (The back-reflection technique has a minimum accuracy ofE10,0001 -si; the diffractometer has an accuracy of :5000 psi.) To obtain someidea as to the depth to which the residual stresses produced by grinding and vaporblaailig extend, and also to determine if there is a linear relationship betweenresiduit and applied stresses, successive layers of material on a ground andvapor-honed- 4330M billet specimen were removed by electropolishing. Thisspecimen was stressed to various levels, as measured with strain gages, andthe resultant surface stresses at a given point were determined using X-raydiffraction.
D. STRESS-CORROSION TESTING
Billet and plate stress-corrosion specimens were stressed to the desired levelby bending. A special jig had been designed for this purpose and the jig andspecimen combination is known as the Boeing U-bend configuration (Reference 1).A stressed U-band specimen is shown in Figure 1. The stress level was deter-mined by leg deflection measurements and checked with selected strain-gagedspecimens. A graph showing the relationship between stress level and leg deflec-tion is given in Figure 2.
Sheet stress-corrosion specimens were loaded in tension, with strain-gagemeasurements determining stress levels. A stressed sheet specimen is shownin Figure 3.
All strain gages on stressed billet, plate, and sheet specimens were removedwith acetone. The possibility of picking up hydroger from the acetone waschecked using a hydrogen-detection gage (Reference 3) in which no free hydrogenions were detected. All exposed surfaces were painted with red glyptal* enamelexcept for the center section test area. The tesi area measured 2 inches by Iinch on all billet and plate specimens and 2 by 0.3 inches on all sheet specimens.
The stressed stress-corrosion specimens were pltced on a ferris wheel 4 feet indiameter and 1.5 feet wide and alternately immersed in the 3.5-percent sodiumchloride solution. The test solution was prepared using chemically pure saltand distilled water and was changed approximately every 5 days. The specimenswere Immersed in the test solution for 8 minutes of every hour by means of thetesting apparatus shown in Figure 4.
*General Electric lacquer cement.
9

Figure 1 BOEING U-BEND CONFIGURATION
280
260 ELASTIC MODULUSF 29.6 x 10⁶
24 - AFC 77, D6AC, 4335M,4340, 9N1+Co, H-1l1,
220 -433WM, HY-TUF
2WI
180 -ELASTIC MODULUS275x16
160 17-4, 18-9-5, 18-7-5(18-9-5 and 18-7-5
#A 140 MODULUS DETERMINEDFROM SMOOTH TENSILERESULTS)
120
60
40
20
0.2 0.4 0.6 0.8 1.0 1.2 1.4 1.6 1.6 2.0
LEG DEFLECTION (INCHES)
Figure?2 STRESS LEVEL AS A FUNCTION OF U-BEND CONFIGURATION LEG DEFLECTION
10

Figure 3 SHEET STRESS-CORROSION CONFIGURATION
IM
FIgure 4 ALTERNATE-IMMERSION TEST APPARATUS
11

Alternate-immersion stress-corrosion testing continued until failure occurredor a 1000-hour test period had elapsed. The 1000-hour test limit was selectedon the basis of previous data that indicated the majority of failures of susceptiblealloys or conditions would occur within this time. A specimen was consideredto have failed when complete fracture had occurred or when the fractured testspecimens were held together by only a small section of metal. Actual growthof cracks could not be detected on any specimens.
In addition to the alternate-immersion testing, comparative data was obtainedfrom specimens exposed to the Seattle Boeing Field atmosphere, which may beconsidered a semi-industrial environment. Specimens were left exposed untilfailure or contract time limitations curtailed further testing.
E. TEST VARIABLES
The standardization of specimen preparation methods permitted an evaluation ofthe effects of several variables on stress-corrosion susceptibility. These vari-ables were selected so that a representative range of material forms, process-ing procedures, and environmental conditions would be considered. Five group-ings were evaluated: product shape, environment, grain direction, processingvariables, and design data. Processing variables were further divided toinclude heat-treat variations, strength level, ausforming, straightening, welding,and coatings. Design variables included comparative evaluations of differentmaterial heats and the effects of altering the stress level. These groupings aredescribed in Table 3. A breakdown of the alloys tested in each phase is given inTable 2. The majority of testing was accomplished using the transverse graindirections. The only exception to this occurred when evaluating the stress-corrosion susceptibilities of the different grain directions. All materials, un-less otherwise noted, were heat treated to their highest strength levels and
4 stressed to 80 percent of the 0.2-percent yield strength.
Each alloy test phase was carried out using three stress-corrosion specimens.Mechanical properties of the billets, plates, and sheets were determined fromtwo smooth tensile and two notched tensile (or two fracture toughness) specimensrepresenting the various heat-treatment conditions.
F. FRACTOGRAPHY AND METALLOGRAPHY
Standard metallographic techniques were used to evaluate the microstructuresand determine the modes of cracking in fractured specimens. In addition to thesestandard techniques, a recently 4evised etchant permitted determination of thelow-alloy-steel grain sizes.
Fracture faces were studied using three methods: examination of etched andunetched surfaces, extraction replicas, and profile studies. The fracturereplicas studied in the electron microscope were prepared from faxfilm imprintsof the fracture faces. The faxfilm was placed in a vacuum chamber, shadowed
12

with germanium, and then with carbon. Dissolving the faxfilm in acetone producedreplicas suitable for examination. Carbide-extraction replicas were produced byvacuum deposition of carbon on a polished specimen surface and then removingthe carbon (plus carbides) in a methanol bromine solution. Fracture profileswere obtained by cutting specimens transverse to the fracture face, coating withelectroless nickel, and polishing until the origin was exposed. Direct carbonextraction replicas were also taken of these profile specimens.
G. SUPPLEMENTAL INFORMATION -PREVIOUS STRESS-CORROSION STUDY
1. Environmental Testing
During the previous study (Reference 1) of stress-corrosion cracking, a similarstudy was underway at Aerojet-General Corporation. To obtain comparative in-formation on the relative effects of the Boeing alternate-immersion and Aerojet-General constant-immersion aqueous NaC1 test solutions, stressed 4340 specimenswere sent to Aerojet. The test results were then compared to those obtained fromduplicate specimens at Boeing.
2. Impact Testing
The previous work showed that a decrease in the 4340, 4340M, 4330M, and H-11notched-to-unnotched strength ratios corresponds to an increase in stress-cor-rosion susceptibility. Comparison of these low-alloy-steel impact values reportedin the literature with the stress-corrosion results indicated that a decrease in im-pact strengths also corresponds to an increase in stress -corrosion susceptibility.To check this latter relationship, impact specimens were cut from the same billettransverse grain direction and heat treated to the same strengths as the previous4340, 4340M, 4330M, and H-li stress-corrosion specimens.
H. LITERATURE SURVEY
A continuing literature survey has been maintained during this program. Par-ticular attention has been directed to those articles dealing with stress-corrosioncracking and dislocation distributions.
13

Table 3 DESCRIPTION OF TEST VARIABLES
Phase Description
Product Shape Three alloy forms were considered- billet, plate, and sheet. Allbillets were 8 by 8 by 12 inches except for one 8-inch-diameter by12-inch billet of 4340 (Billet G). Plates were 3/8 by 10 by 48 inchesand sheet gages were between 0.02 and 0.08 inch.
Environment The majority of testing consisted of alternate immersion in a 3.5-per-cent NaCI solution for 8 minutes per hour. Supplemental testing in-volved exposure to a semi-industrial environment at Boeing Field,Seattle, Washington.
Grain Direction The longitudinal and transverse grain directions of all alloy forms were
compared.
Processing Variables
Heat Treatment Variations AM 350 and AM 355 were studied using two approaches. The firstapproach consisted of studying the relationship between percent deltaferrite and stress-corrosion susceptibility. Boeing-procured and ASD-provided sheets were compared after heat treating using the SCT processand an alteration of this process introduced by raising the If annealing
temperature by 500F. The second approach was an evaluation of theprecipitated carbide distribution in these materials after the DADFheat treatments.
A trip by Boeing metallurgists to several steel and forging companiesrevealed two processes used in the mill annealing of several steels.Comparisons between these heat-treat processes were necessary todetermine the effect of this early heat treatment on stress-corrosionsusceptibility. One process consisted of holding 4335M and 4340 at1600"F for 72 hours; the other process involved thermal cycling thesesame steels between 600 and 1200F. The latter process required 16
hours for each of three cycles.
Although oil quenching is used extensively during the heat treatment of
low-alloy steels, there are a number of instances where austemperingand martempering are used. To compare these latter two processeswith oil quenching (which was used extensively in this program) 4335Mand 4340 were chosen.
The AFC 77 tensile properties (reduction in area) were approximatelythe same between tempering temperatures of 800 and 1000°F. To deter-
mine if a similar relationship existed between stress-corrosion suscept-ibility, comparisons were made after tempering at 800, W00. and1000"F.
Heat treatment procedures are given in Tables 4 and 5.
Strength Level The AFC 77, 18-7-5, D6AC, 4335M, 4:140, and i-1l steels were heat
treated to the 260- to 280-, 220- to 240-, and 180- to 200-ksi strengthlevels. Heat-treatment procedures are given in Table .1.
14

Table 3 DESCRIPTION OF TEST VARIABLES
Phase Description
Product Shape Three alloy forms were considered- billet, plate, and sheet. Allbillets were 8 by 8 by 12 inches except for one 8-inch-diameter by12-inch billet of 4340 (Billet G). Plates were 3/8 by 10 by 48 inches
and sheet gages were between 0.02 and 0.08 inch.
Environment The majority of testing consisted of alternate immersion in a 3.5-per-
cent NaCI solution for 8 minutes per hour. Supplemental testing in-volved exposure to a semi-industrial environment at Boeing Field,
Seattle, Washington.
Grain Direction The longitudinal and transverse grain directions of all alloy forms were
compared.
Processing Variables
Heat Treatment Variations AM 350 and AM 355 were studied using two approaches. The firstapproach consisted of studying the relationship between percent deltaferrite and stress-corrosion susceptibility. Boeing-procured and ASD-provided sheets were compared after heat treating using the SCT processand an alteration of this process introduced by raising the If annealing
temperature by 500F. The second approach was an evaluation of theprecipitated carbide distribution in these materials after the DADFheat treatments.
A trip by Boeing metallurgists to several steel and forging companiesrevealed two processes used in the mill annealing of several steels.Comparisons between these heat-treat processes were necessary todetermine the effect of this early heat treatment on stress-corrosionsusceptibility. One process consisted of holding 4335M and 4340 at1600"F for 72 hours; the other process involved thermal cycling thesesame steels between 600 and 1200F. The latter process required 16
hours for each of three cycles.
Although oil quenching is used extensively during the heat treatment of
low-alloy steels, there are a number of instances where austemperingand martempering are used. To compare these latter two process-swith oil quenching (which was used extensively in this program) 4335Mand 4340 were chosen.
The AFC 77 tensile properties (reduction in area) were approximatelythe same between tempering temperatures of 800 and 1000°F. To deter-
mine if a similar relationship existed between stress-corrosion suscept-ibility, comparisons were made after tempering at 800, M0O. and
1000"F.
Heat treatment procedures are given in Tables 4 and 5.
Strength Level The AFC 77, 18-7-5, DGAC, 4335M, 4:140, and 1I-11 steels were heat
treated to the 260- to 280-, 220- to 240-, and 180- to 200-ksi strength
levels. Hteat-treatment procedures are given in Table 4.
14

Tis 4 STANDARD STEEL HEAT TREATMENT PROCEDURES
TemperingNollald Ulimle Auetliulslag Auasneatizinl Quenching Tempera- Tempering
.Akf 9ltMMSv &08 TM rstun Cn Tine Ori Mediam tu M -Time (hrjAFC "s 20 to 20 3300 0.5 Oil 900 2. 2
220 to 240 1300 0.5 Oil 1200 2 + 210 to 200 1900 0.5 Oil 1300 2 + 2
10-?-6 200 to 0i 1500 0.5 Air 900 3220 to 240 1500 0.5 Air 1075 3160 to 200 1500 0.5 Air 1150 3
DSAC 1to 20 1550 0.5 Oil 500 3 + 3220 to i40 1550 0.5 Oil 800 2.5 + 2.518616200 150 0.5 Oil 1100 1.5+ 1.5
410M 2-0 to se 160 0.5 Oil 5oo 3*3t201 40 I5o 0.5 Oil 700 2.5 o 2.5
IS101200 1550 0.5 Oil 960 1.5+ 1.5
4340 20 to 1N i3 0.5 Oil 400 3 + 3n010240 15s 0.5 Oil 600 2.5 * 2.5I* to20 1525 0.5 01 800 1.5 * 1.5
-ll M to 300 i35 0.5 01 1000 3 # 3 3t010340 low 0.5 Oil 1100 3, 3 .3
Il3o |.0 10 0.5 Oil 1150 3 # 3, 3
MY-T r 2401to 30 1oc0 0.5 Oil $S0 I # 1
2-41co00 2 I s14 0.5 Oil 400 2 . 2
1-5- 3i 10 i 1600 0.5 Air 300 3
17-4 N0s to 13 I0 0.5 Air 900 1
AM a IN10 13" IM 0.5 Air no 3
AM I10 $w 130 0.5 Air 350 3
* The.. asss W ~ e • mlmm £a -1W.lr I.~ 100mprtu8
"" IC?' US lmlii
16

Table 5 SPEC I AL STEEL HEAT TREATMENT PROCEDURES
Alloy Description of Heat Treatment
AM 350 and AM 355 Doubio, Age. Do~uble Freeze
Procedure was identical to that used for SCT s~5U condition (Table 4).except a subzero freeze (-lO0F for 3 hours) was introduced after solutionanneal.
Altered SCT 850 Condition
The solution annealing temperature was increased to 19750F (see Table 4
for procedure for SCT 850 condition).
AFC 77 800 and 1000F Tempers
Identical procedures were used in the 800 to 1000F tempers ts in the 900.* 1200. and 13006F tempers described in Table 4.
4340 and 4335M Milling Annealing
* Cycling - Specimens were thermally cycled between 600 and 120W F,allowing 6 hours at each temperature, the total elapsed time for threecor, -late cycles was 50 hours. Specimens were then heal treated to maxi-muta strength according to Table 4.
Holding - Specimens were held at I600' F for 72 hours. and then arcooled followed by heat treating to maximum strength arcording toTable 4.
Austempering
Specimens were auatenitized at 1325F for 0.5 hour, quenched in 60(rF
saft and held for 24 hours, and air cooled.
Martempering
Specimens were austenitized at 1525OF for 0.5 hour, quenched in 371i'Fsalt and held for 30 seconds, followed by air cooling. Specimens were thentempered at 450F for 4 hours.

Table 6 COATING PROCESSES
Type of Coating Coating Frocess
Epoxy Paint" The specimens were prepared by degreasing and vapor blasting. rhecoating material consisted of a Type 1 primer and a Type 2 enamel.The primer base material plus converter and thinner were mixed to givea spray viscosity of 32 to 40 neconds, determined by a No. I Zahn cup.The primer film thickness was 0.9 to 1. 1 mils. The finish coatingconsisted of an enamel base mixed with a catalyst and thinner to givea spray viscosity of 17 to 19 seconds determined by a No. 2 Zahn cup.The enamel film thickness was 2.5 to 2. 9 mils. The epoxy paint wasair dried for 10 hours - 4 ho-rs for the primer and 6 hours for theenamel.
Cadmium Platin** The specimens were prepared by vapor degreasing in trichloroethyleneand cleaned by abrasive blating with novaculite silica spherical glassbeads (180 to 625 grit). The specimens were then cold rinsed :rodmaintained in a cyanide bath at 70 to !5F until plated. The cyanideholding solution was:
Original Control
Preparatio Concentration
1) Sodium Cyanide 31 lb/ 100 gal. 4 to 5 oz gal.2) Sodium Hydroxide 10 IbilO0 gal. 1 to 2 oz, gal.
The specimens were placed directly from the cyanide bath to the cad-mium plating solution, which was maintained at a current density ofapproximately 40 ampsft2 . The cadmium plating solution was operatedat T0 to 65*F and had the following composition:
Original Control
PrEratton Concentration
1) Sodium Cyanide 146 lb 1O0 gal.2) Cadmium Oxide 47 lb 100 gal.3) Cadmium (metal) 6.5 to 7.5 oR gal.4) Sodium Carbobe 8. 0 oz gal. (mas...5) Sodium Hydroxide '.5 to 5.0 Or gal.6) Free Sodium Cyanide
(Tutal NaCn - i. 73 % Cdt 9 to 15 i, gal.7) Water. detoniaed Mamntain Volume
The specimens were then rinsed in col water, alr dried, and baked ior24 houro at 3756F.
Cnism-Tltbam PtltiqO The specimens were prepared the same as for the cailmiun plating.The hold bath " was similar, ewept it wvA operated at a maimumiron concentratlon of 50 ppm. The specimen, were rinet in cold wateran then immersed in a 2- to 4-percent IICI solution tor 35 bt cow. toactivae fit., surimes. Another cold waler rinse was given prior to tht.eadmium-titanium plating ste". The plating uolutice was maintained atTO to N'F ail had the lollowlia compoolt Ion
S1C 5118"' S604
18

Table 6 (continued)
l'ype ()l Cnating Coating Process
Control Concentration
1) Cadmium (metal) 2.5 to 3.5 oz/gallon2) Total Cyanide (;is NaCn) 13 to 17 oz/gallon.1) Sodium ilydroxide 2. 5 to 3. 1; oz./gallon.I) Total Iron Concentration 50 ppm5) Other Foreign Metal
Impuritles LZn, Sn, Ni,Cd, Pb) 39 ppm
6) Titanium 60 to 100 ppm7) Total Cyanide to Cadmium
Ratio (NaCn/Cd) 41 to 5/1
The specimens were then immersion rinsed In a 3- to 5-percent chromicacid in water solution (room temperature) for 0.5 to 2 minutes, coldwater rinsed for a maximum of 5 minutes, 3nd then air dried. Thespecimens were baked at 3751 for 12 hours.
Cadmium Plating plus Epoxy First, the specimens were cadmium plated according to the previouslyPaint described procedure. Immediately following the plating operation,
the specimens were painted (also previously described).
Flame-Sprayed Aluminum Specimens were lightly sand blasted and flash coated with MetcoSprabond. and then finished to desired thickness using high-purityaluminum.
19

IV. RESULTS
A. MATERIAL EVALUATION
The billets and plates used in this program were free from flaws larger than 3/64of an inch (minimum detectable flaw size), except for one billet of d340 and oneplate of 9Ni-4Co. Ultrasonic inspection showed a number of indications rangingfrom 3/64 to 5/64 inch at the center of the 4340 billet. Ultrasonic inspection alsorevealed a large number of indications in the 9Ni-4Co plate approximately 3/64of an inch in length. Macroetching of all billets revealed no gross segregation.All billets, plates, and sheets were within chemistry allowables. Chemical com-positions are given in Table 7.
The selection of the primary transverse grain direction (i. e., grain directionused in the majority of testing) was based on the reduction-in-area properties.Since the reduction-in-area values of each billet's two transverse grain directionswere the same, except for the 4340 billet having the flaws, the primary graindirection was arbitrarily selected. The transverse grain direction in the above4340 billet with the lowest reduction-in-area value was the grain direction tested.
B. SPECIMEN PREPARATION
Microscopic examination showed that all decarburized areas on the billet andplate stress corrosion specimens were eliminated by grinding 0.050 inch fromeach specimen side. No difficulty was encountered in obtaining a 32 RHR surfacefinish. Precoating prevented any decarburization of sheet material during heattreatment, as shown by microscopic examination. Grit blasting removed theprecoat, leaving a blue or gray discoloration on the surface.
Radiography revealed several instances of porosity in the fusion-welded specimens.This is discussed in detail in the welding subsection.
C. X-RAY RESIDUAL SURFACE STRESS MEASUREMENTS
All measured billet and plate residual surface stresses were compressive aftergrinding. Vapor blasting considerably increased the surface compressive stresses.This was revealed by X-ray residual stress measurements of 17-4PH and 18-9-5before and after vapor blasting, and agrees with the results reported previously(Reference 1). The surface stresses after vapor blasting were usually greaterthan 100 ksi, though exceptions were noted in AFC 77, Ladish D6AC, 4340, and18-9-5. No correlation was noted between residual surface stresses and heat-treat strength or chemical composition. Residual surface stresses of the billetand plate alloys are shown in Table 8.
Sheet residual surface stress measurements were very erratic, ranging from highcompression to low tension. Apparently, the discoloration on the sheet surface was
21

0000 0
0 0
a! 0!
0D00 0 0 0)el
146M0C 0 0.0 000 0 C
0a 00 00 0 000
_ -0 80000 888-. to C-2 w 00 t-0000
0 00000ODU*0 000 00 0 0 00 0)0
o o00000L C4V 00000 to000 -0 000
t- m 0) O, V- *4 0Q CO -OD O tt O) 0" 0 Ch~ LO
U).4' 4C0~ V4 c4 V-44LO- ~ c4i~ N t nc)cqce4 o00m t-u,
-_j
Lai
00~~r 00 0 0 0000 0000 00 000
m .V3 CO).
t P .
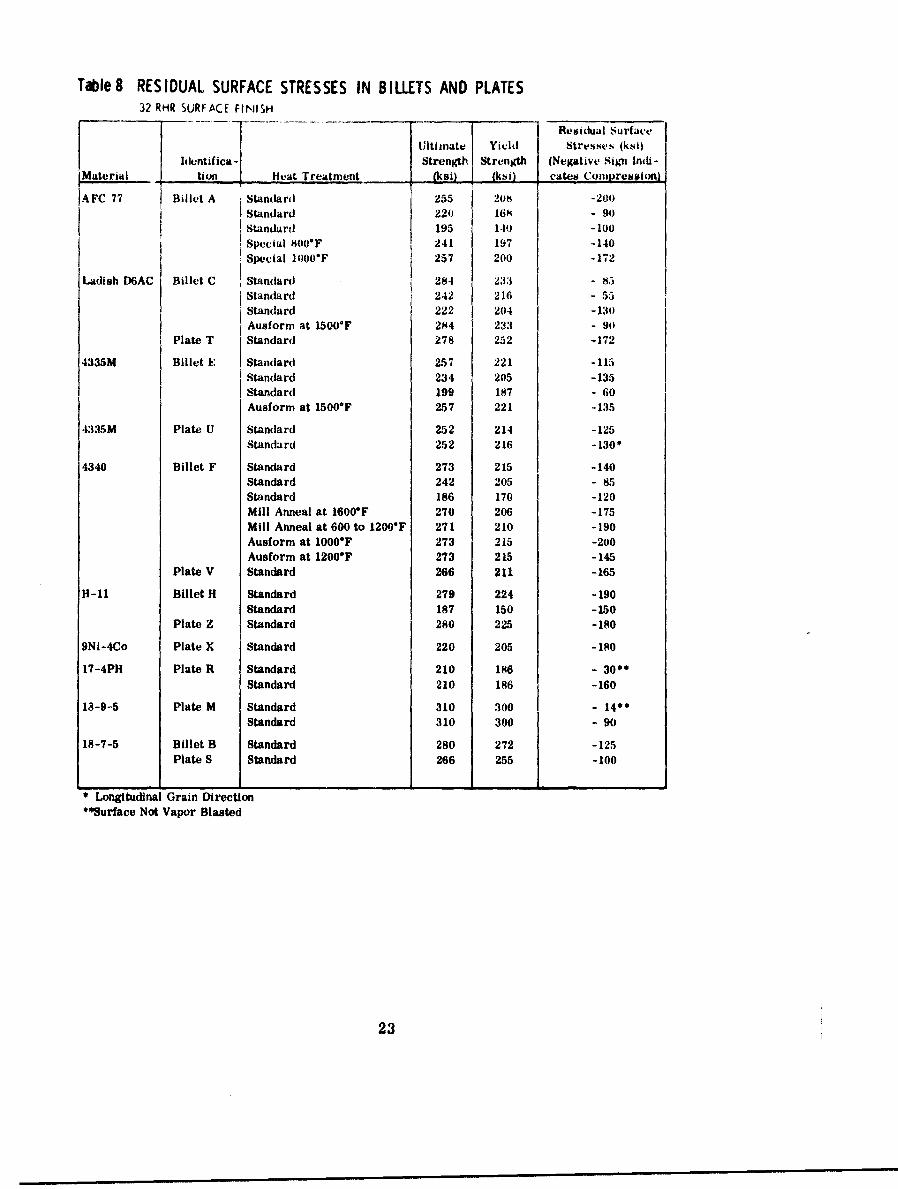
Table 8 RESIDUAL SURFACE STRESSES IN BILLETS AND PLATES32 RHR SURFACE FINISH
Residual SurfaceUltimate Yield Stresses (ksi)
luntifica- Strength Strength (Negative Sign mdi-IMaterial. tion HeaL Treatment - kai (ksi) cates Conpressln
AFC 77 Billet A Standard 255 203 -200Standard 220 16k - 95Standard 195 149 -1 00Special 8 500F 241 197 -140Special 1000tFd 257 200 -172
Ladish D6AC Billet C Standard 284 233 -15Standard 242 216 - 55Standard 222 204 - 130Ausform at 1500F 284 233 - 90
Plate T Standard 278 252 -172
4335M Billet E Standard 257 221 -115Standard 234 205 - 135Standard 199 197 - 60Ausform at 1500"F 257 221 -135
43u5M Plate U Standard 252 214 -125Standard 252 216 -130
4340 Billet F Standard 273 215 -140Standard 242 205 - 85Standard 186 170 -120Mill Anneal at 1600F 270 206 -175Mill Anneal at 600 to 12007F 271 210 -190
Ausform at 1000*FRSna 210 15 -200Ausform at 12007F 273 215 -145
Plate V Standard 266 211 -165
H-11 Billet H Standard 279 224 -190Standard 187 150 - 150
Plate Z Standard 280 225 -180
9NI-4Co Plate X Standard 220 205 -18017-4PH Plate R Standard 210 186 - 3000
Standard 210 186 - 160
13-9-5 Plate M Standard 310 300 - 14*0Standard 310 300 - 90
18-7-5 Billet B Standard 280 272 - 125Plate S Standard 266 255 - 100
* Longitudinal Grain Direction**Surface Not Vapor Blasted
23

the cause of these variations because sandpapering produced surfaces that provided
reproducible results. However, this latter condition did not represent the actualtesting surface conditions; consequen~iy, detailed sheet residual surface stressmeasurements were not made.
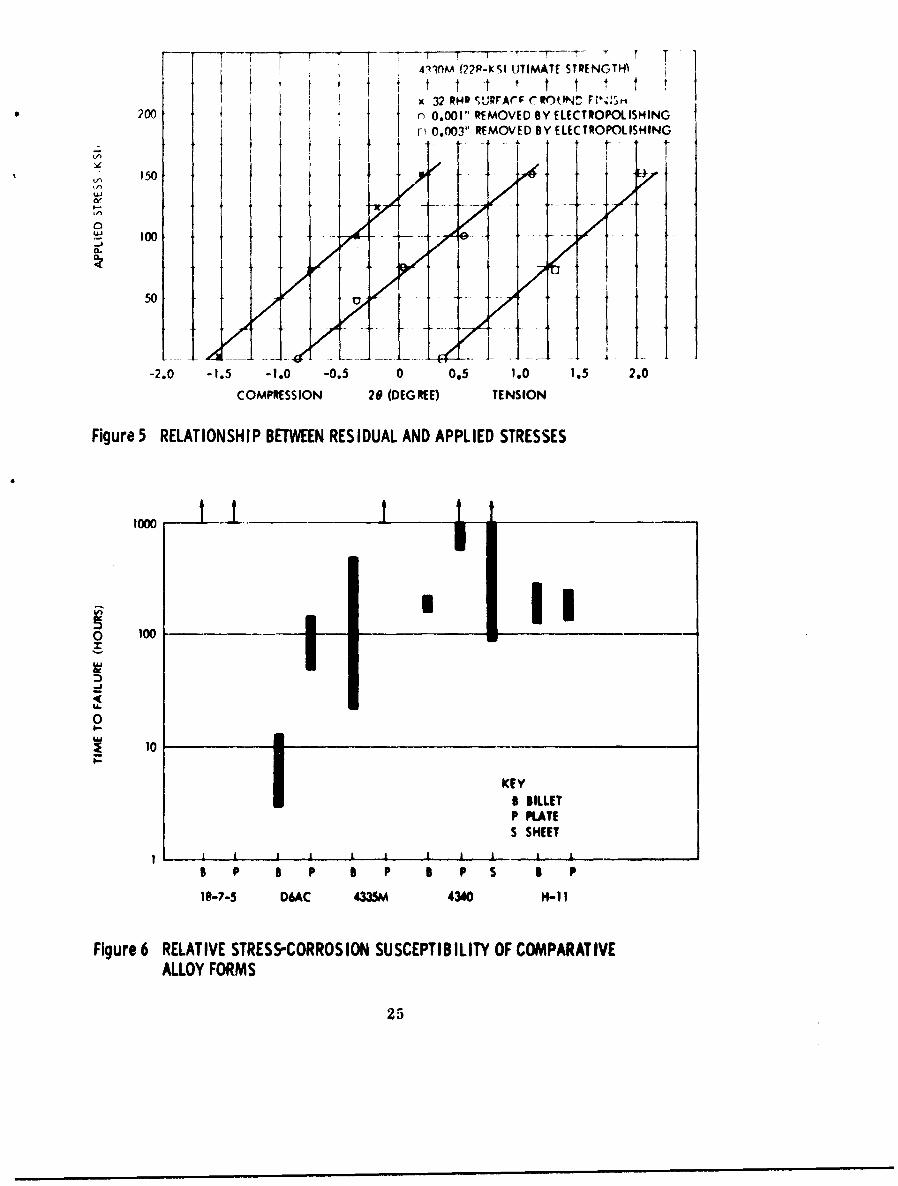
Measurements of residual surface stresses in plate and billet with the X-ray dif-fractometer revealed a linear relationship between residual surface stressesproduced by grinding and applied stresses produced during loading. The magnitudeof the final surface stresses after loading could be determined by adding residualand applied stresses. X-ray stress analysis of a 4330M U-bend specimen beforeand after electropolishing showed a change in the residual surface stresses fromcompressive to tension at approximately 0. 002 inch below the surface. Thisrelationship between residual and applied stresses with depth is shown inFigure 5.
D. STRESS-CORROSION TESTING
The stress level in loaded billet and plate specimens was checked for 1 month.The relaxation in stress level was found to occur within 24 hours after loading.The stress level of the sheet specimens was also found to be constant after theinitial 24 hours. All test specimens were rechecked after the relaxation periodand restressed when required.
The use of the U-bend configuration for evaluating billet and plate material providedan excellent means of determining relative stress-corrosion susceptibilities. Inaddition, examination of these fracture faces allowed the study of rapid-crackingand slow-cracking modes of fracture. Often these fracture modes could be directlycompared to those observed on fracture toughness specimens. Although the sheetspecimens were smaller, the electron microscope permitted observation of thefracture origin and associated areas. However, the geometrical limitations ofthese specimens did not provide the large rapid crack areas produced on the U-bend specimens.
E. TEST VARIABLES
The stress-corrosion test results are described in the following subsections.Mechanical properties of the alloys after the several heat treatments are listed in
Tables 9, 10, and 11. Appendix II describes the method of fracture toughnesstesting.
1. Product Shape
There were no 18-7-5 billet or plate failures. Comparison of the 4335M and 4340billets and plates showed that the billet material was more stress-corrosionsusceptible. Determination of the relative susceptibilities of D6AC billet and plate
depended on the grain direction under consideration. The D6AC comparisons based
on the transverse grain direction showed billet to be the more susceptible, while
24
I
• = .- ----'-m-'--------m - ------- '-- T T4'1-)M (22P-KI OTIMATE STRENGTH)- t ! t t t tx 32 RHO ;uRWrArP CRtOtPN: FI'4
200 n O.001" REMOVED BY ELECTROPOLISHINGr. 003" REMOVED BY ELECTROPOLISHING
V) 150 o kI f
50 j-2.0 -1.5 -1.0 -0.5 0 0.5 1.0 1.5 2.0
COMPRESSION 29 (DEGREE) TENSION
Figure 5 RELATIONSHIP BETWEEN RESIDUAL AND APPLIED STRESSES
1000
I-,,.
0M.
w_ w
KEY8I BILLETP PLATE
S SHEET
B B P 8 P I P S a I
18-7-5 D6AC 4335M 4340 "-1I
Figure 6 RELATIVE STRESS-CORROSION SUSCEPTIBILITY OF COMPARATIVE
ALLOY FORMS
25

T*iS 9 TENSILE PROPERTIES OF STEEL ALLOYS -STANDARD HEAT TREATMENTVALUES AVERAGED FROM TWO SPECIMENS PER CONDITION
Nached
Ilimute Yield Pleductoas UltimateOrali Mrs%* Stength Elonption In Area Strength N/UN
usla rmM l mmm. gmL fti in I to.1 .. otl RatioA•C ?T 2N 208 -5.0 3.0 161 0.63BilletA T 220 168 3.5 2.5 113 0.51
T 196 140 7.5 11.0 143 0.73T225 3 210 4.5 4.0 153 0.59
L 263 211 16.0 34.5 168 0.62
16-7-5 T 260 272 7.0 28.7 261 0.93slet T 231 213 12.0 30.6 280 1.21
T 203 177 17.0 44.6 282 1.39T2 278 270 7.0 25.6 247 0.89L 283 263 11.5 62.3 361 1.34
lAdah DGAC T 385 233 7.5 16.5 206 0.72a411a C T 242 216 8.0 26.0 266 1.23
T 222 204 11.5 35.0 287 1.29T 273 219 6.0 16.0 223 0.80L 286 241 11.0 44.0 260 0.91
433sM T 257 221 9.0 24.8 252 0.98BJllet T 234 -,205 8.0 24.3 256 1.09
T 19 - 187 12.5 32.5 251 1.26T2 26 218 10.0 28.5 252 0.98L 257 218 13.0 33.7 274 1.06
40 T 273 215 8.3 20.1 195 0.71,0.340le F T 242 206 7.3 15.7 172 0.71
T I6 170 10.5 25.2 239 1.28.0.780367 208 6.5 14.6 186 0.70
L 274 we 14.0 47.7 250 0.91
4330M Bllet N T 228 13 6.0 37.0 302 1.32
433KO Billet O T 230 196 8.0 25.0 257 1.11
H-I1 T 179 224 10.0 34.5 221 0.79Billt H T 214 130 10.5 33.5 277 1. 23
T 16 15O ... 1 1.36T2 278 225 80 16.5 178 0.69L 274 221 10.5 41.5 221 0. N0
HT-Tuf WeIt K T 243 21is 12.0 36.1 296 1.19
17-4PH T 210 186 15.0 48.7 -- 0.27plahQ L 20 18? 16.0 0.0 -- 0,.30
18-0-6 T 304 2" 6.5 .. .51
Plat M L 306 297 7.1 .0. 6
nied ltimate u h grog= tarp matc nl e eicime
26

Table 9 (continued)
NotchedUltimatt- Yield Reduction Ultimate
Grain Strength Strength Elongation in Area Strength N 'UNMaterial Direction (ksil (ksi) i% in I in.) (11 1ksi) Ratio
I1-7-5 T 261, 255 10.5 55.7 -- 0.6HPlate S L 263 257 10.0 53.3 -- 0.64
IDEAC T 27M 252 11.0 41.7 -- 0.30Plate T L 275 252 10.0 39.7 -- 0. 35
4335M T 252 214 11.0 42.5 -- 0.60Plate U L 252 216 12.0 53.5 -- 0.66
41340 T 266 211 10.0 35.0 -- 0.31Plate V L 267 214 12.5 48.0 -- 0.43
9Ni-4Co 0.26C T 244 212 11.5 62.1 -- 0.70Plate W L 225 208 12.0 64.6 -- 0.79
9Ni-4Co 0.38C T -220 -205 8.0 34.0 -- 0.56Plate X L 238 227 7.0 28.0 -- 0.41
H-I T 280 225 13.5 50.0 0.16Plate Z L 281 225 14.0 47.0 .--
AM 350 Sheet A T 194 161 11.0 163 0.84
AM 350 T 201 164 11.0 -- 173 0.86Sheet A2 L 203 167 12.7 -- 183 0.90
AM 350 Sheet B T 203 167 10.7 137 0.68
AM 350 Sheet F T 230 198 9.0 188 0.82
AM 355 T 229 195 10.8 -- 170 0.74Sheet C L 229 195 10.0 -- 150 0. 66
AM 355 Sheet D T 216 187 7.7 133 0.62
4340 T 261 210 9.8 -- 177 0,68Sheet E L 261 200 10.3 -- 169 0.65
27

Table 10 TENSILE PROPERTIES OF STEEL ALLOYS -SPECIAL HEAT TREATMENTVALUES AVERAGED FROM TWO SPECIMENS TAKEN FROM THE PRIMARYTRANSVERSE GRAIN DIRECTION
Notched
Ultimate Yield Reduction Ultimatemeat Strength Strngth Elongation in Area Strength N/UN
val rw Treatmoat I) &Oil d' in I in. 1 ) (knl) Ratio
AIC 77 a 241 197 2.5 2.5 151 0.63Met A b 267 200 3.5 2.5 154 0.60
AM3 c 203 161 18.0 -- 167 0.82AMA 2 d 204 171 14.0 -- 174 0.85
AM 3U c 220 184 16.5 o- 164 0.75Shoot C d 197 143 13.5 -- 109 0.55
DSAe 301 261 7.8 18.1 --
5must C
433M 216 230 9.3 26.2 .. ..5s1o. a f 270* -- 1.0 4.0 128 0.47
9 260 220 7.5 20.0 219 0.84Iu 265 225 7.0 16.0 '19 0.83I 19 173 10.0 33.5 239 1.20
4340 e 306 259 8.0 19.9 -- --
5111 r .2 298 251 8.5 24.0 .. ..03 287 242 8.0 20.8 ..f -- -.... 919 --
g 277 210 9.0 16.5 190 0.69h 255 221 6.0 17.5 187 0.731 197 166 8.0 24.5 221 1.12
914I-4CO 210 248 9.0 54.8 -- 0.44
"Ma-T.4 o codea - Tempered at OF for 2 + 2 hours f - Mill annealed by holding at 1600"F for 72 hours
b - Temperd at 1000F for 2 +2 bours g- Mill annealed by cycling between 600 and 1200F
c - IW comditom (dmkeMed, dambe freese) h - Martempered at 450"F
d--CT 860 coamdltm with the anmnellg tem- I -Austempered at 6007poratre lareesed by WOI
e - AusformedI -56 percewt reduwtom at 120O'F3-- 2s peraet reduc4ion at 1000'? 0pecimess broke outside the gage aecUon3-36 pos. t r o at 1000"F
28

Table 11 FRACTURE TOUGHNESS PROPERTIESALL MATERIALS HEAT TREATED TO MAXIMUM STRENGTH LEVEL
FStress Net K rKc Iko 4Grain Fty Rate Stress Max eG o Shear
Material Direction (kal) 1#0G(kal/sec) (ks) (ksi) (ksi Vn.) (ku n'. S)
17-4PH T 186 535 56.8 36.1 36.5 20.6 1Plate Q L 187 506 61.9 36.8 38.5 21.7 1
18-9-5 T 299 270 21.3 12.3 14.0 7.9 0Plate M L 297 349 31.8 20.5 20.2 11.4 1
18-7-5 T 255 500 181.0 120.8 122.2 68.9 67plate 8 L 257 500 168.0 115.3 115.7 65.3 64
18-7-5 T 270 737 137.0 79.6 80.6 45.5 30Billet B
DIAC T 252 500 83.0 55.0 60.2 34.0 13Plate T L 252 500 96.7 63.5 62.9 35.5 15
4335M T 214 701 150.0 91.7 96.8 54.6 53Plate U L 216 707 167.0 103.5 107.2 60.5 60
4335M T 221 738 102.0 66.3 61.3 34.6 17Billet E
4340 T 211 623 82.8 51.0 54.0 30.5 17Plate V L 214 712 116.0 74.6 74.4 42.0 20
4340 T 215 725 96.8 58.7 57.5 32.5 13Billet F
9Nl-4Co T 212 500 170.0 112.4 115.5 65.2 6Plate W L 208= 500 177.0 115.9 120.8 68.2 63
9NI-4Co T 205 500 124.0 82.9 83.4 47.0 18Plate X L 227 500 98.0 65.9 67.2 37.9 13
9NI-4Co T 248 500 127.0 83.0 85.2 40. 1 33Plate Y L - 500 100.0 66.2 76.5 43.2 30
H-Il T 225 506 45.6 28.0 28.9 l6.3 IPlat Z L 225 06 48.7 29.9 34.7 17.3 2
AM 355 T 187 762 79.6 53.2 129.4 73.1 I100Shot D L - 845 58.0 38.1 94.1 43. 1 144
AM 350 T 198 927 86.8 fig.5 143.7 81.o o4
Shoet F L - 963 107.6 73.3 173.0 97.6 100
4340 T 210 473 114.6 76.7 187.0 305.5 I4
sheet 9
4340* T 170 2.5 145.0 - 70.9 - .
111t F T 215 1.5 14.2 - 46.3 -
T - TransverseL - Lonoltud/nali arge Notched Tens ie SWimenh
29

comparison of the longitudinal grain direction revealed plate to be the moresusceptible. No differences were evident between H-li billet and plate. The4340 sheet data was somewhat confusing because two failures occured within 90hours, and the remaining specimen did not fracture during test. Additional testingwould be necessary before any estimates can be made concerning the susceptibilityof 4340 sheet. Figure 6 (Page 25) bhocws the relative susceptibilities of thebillets and plates. Actual testing times are given in Table 12.
TWOl 12 TESTING TIMES OF COMPARATIVE ALLOY FORMSTRANSVERSE GRAIN DIRECTION; ALL MATERIAL HEAT TREATED TO MAXIMUM STRENGTHS ANDSTRESSED TO 00 PECENT OF YIELD
eai Form* Fty -(ks 4 Stress (ks'.) Time-to-Failure (hr)1
18-7-5 B 272 215 No Failures (NF)p 255 205 NF
D6AC B =Z3 185 3, 5, 13p 252 200 -, 50, 148
4335M B 221 175 22, 162, 500P 214 170 NF
4340 B 215 170 166, 172, 238p 211 170 612, 720, N FS 210 170 90, 90, N F
H-11 B 224 180 134, 134, 295P 225 1S0 143, 174, 260
I~ A_________________ ___________ _____________________________
B, BilletP, PlateS, Sheet
2. Environment
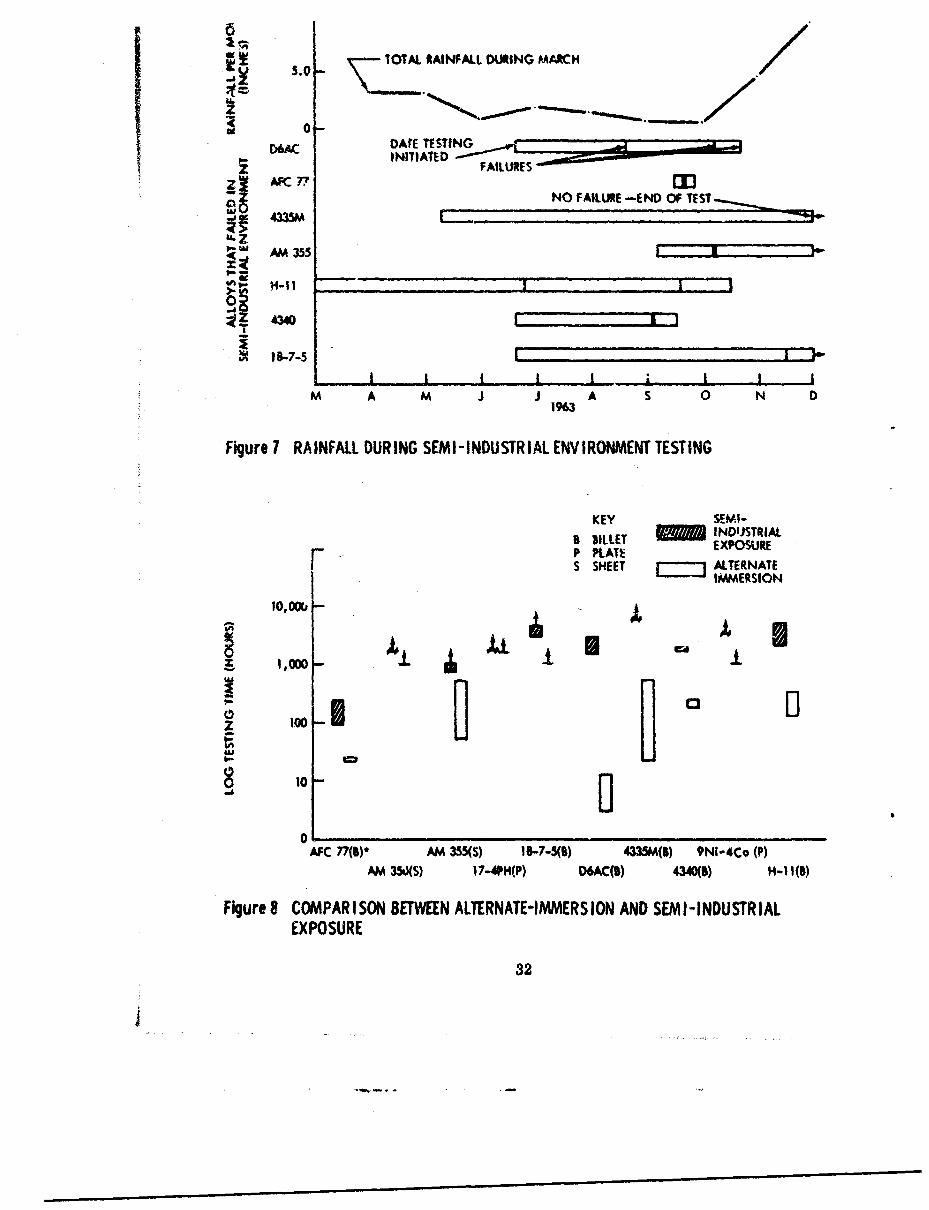
Alternate-immersion testing of mBAC, 4340t 4335M, H-l1, AFC 77, and AM 355proved to be more severe than exposure to the Seattle semi-industrial environment.Failure times of these materials,, with the exception of 4335M1, were much shorterwith alternate-immersion testing than with natural environment testing. The 4335Mwith relatively short alternaee-immervon failure times did not fall in the semi-industrial atmosphere. Comparison of these steels revesird one unexpectedabnormality. Tose materials first to fall during alternate immersion were notnecessarily the first to fail In the atmosphere. Ladish DOAC had failed within 13hours on the ferris wheel but required over 3000 hours in the atmosphere, whereasAFC 77 failure times were 25 to 238 hours, respectively. Moreover, although4340 and H-li had approximately the same failure times with alternate-immiersiontesting, the 4340 was much more stress-corrosion susceptible in the semi-industrialatmosphere. 3
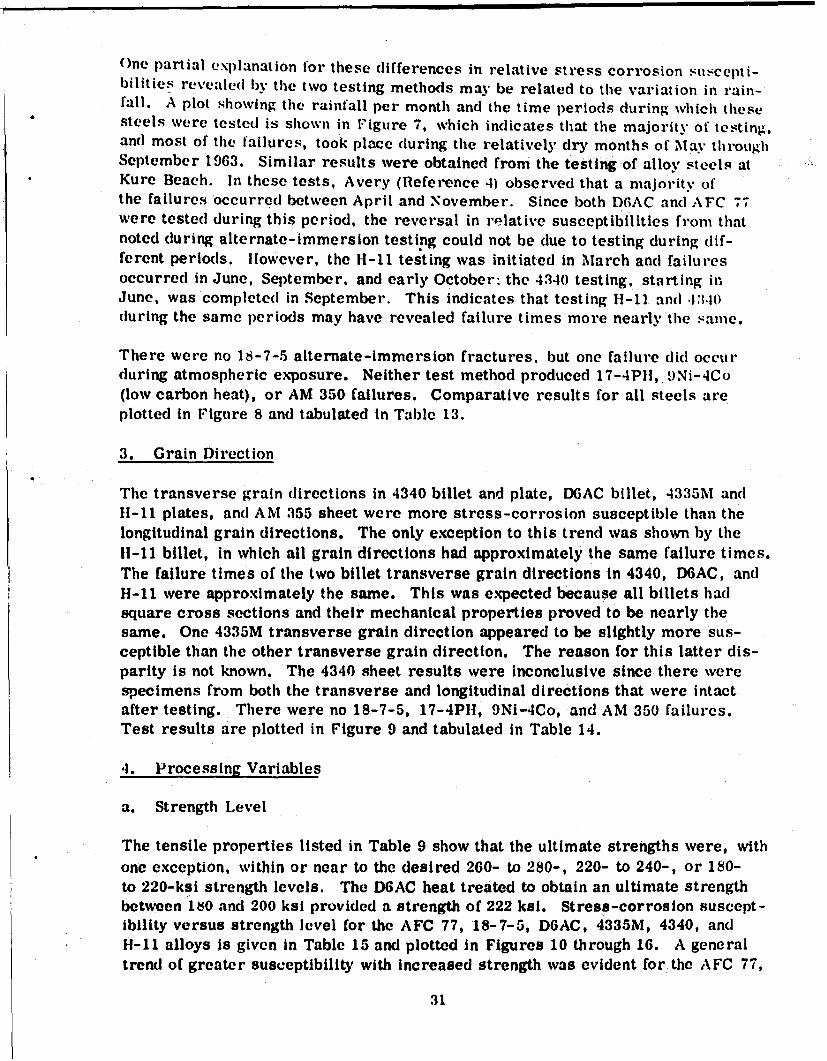
One partial explanation for these differences in relative stress corrosion ,ucepti-bilitics revealed by the two testing methods may be related to the variation in rain-fall. A plot showing the rainfall per month and the time periods during which thesesteels were tested is shown in Figure 7, which indicates that the majority of testing,and most of the failures, took place (luring the relatively dry months of May throughSeptember 1963. Similar results were obtained from the testing of alloy steels atKurc Beach. In these tests, Avery (Reference 4) observed that a majority ofthe failures occurred between April and November. Since both D6AC and AFC 77were tested during this period, the reversal in relative susceptibilities from thatnoted during alternate-immersion testing could not be due to testing during dif-ferent periods. However, the H-li testing was initiated in March and failuresoccurred in June, September, and early October: the 4340 testing, starting inJune, was completed in September. This indicates that testing H-11 and .l3l0(luring the same periods may have revealed failure times more nearly the same.
There were no 18-7-5 alternate-immersion fractures, but one failure did occur(luring atmospheric exposure. Neither test method produced 17-4PH, 9Ni-4Co(low carbon heat), or AM 350 failures. Comparative results for all steels areplotted in Figure 8 and tabulated in Table 13.
3. Grain Direction
The transverse grain directions in 4340 billet and plate, DOAC billet, 4335M andHi-11 plates, and AM 355 sheet were more stress-corrosion susceptible than thelongitudinal grain directions. The only exception to this trend was shown by theIl-l billet, in which all grain directions had approximately the same failure times.The failure times of the two billet transverse grain directions in 4340, D6AC, andH-11 were approximately the same. This was expected because all billets hadsquare cross sections and their mechanical properties proved to be nearly thesame. One 4335M transverse grain direction appeared to be slightly more sus-ceptible than the other transverse grain direction. The reason for this latter dis-parity is not known. The 4340 sheet results were inconclusive since there werespecimens from both the transverse and longitudinal directions that were intactafter testing. There were no 18-7-5, 17-4Plt, 9Ni-4Co, and AM 350 failures.Test results are plotted in Figure 9 and tabulated in Table 14.
4. Processing Variables
a. Strength Level
The tensile properties listed in Table 9 show that the ultimate strengths were, withone exception, within or near to the desired 260- to 280-, 220- to 240-, or 180-to 220-ksi strength levels. The D6AC heat treated to obtain an ultimate strengthbetween 10 and 200 ksi provided a strength of 222 ksi. Stress-corrosion suscept-ibility versus strength level for the AFC 77, 18-7-5, D6AC, 4335M, 4340, andH-i1 alloys is given in Table 15 and plotted in Figures 10 through 16. A generaltrend of greater susceptibility with increased strength was evident for the AFC 77,
31
5.0-
,,,, ...........
z FAILURESM AFC 77
NO FAILURE -END OF TESTS4335M
!Z" AM 355
S18-7-5
M A M J J A S, 0 N D1963
Figure 7 RAINFALL DURING SEMI -INDUSTRIAL ENVIRONMENT TESTING
KEY SEMI-B BILLET - INDUSTRIAL
PLATE EXPOSURES SHEET [ ALTERNATE
IMMERSION
.0,o x
0oiJl I I II I II Ij ± I
UAU
AFC 77(S1" AM 3,55(S) 16-7-5(1t) 4335M(lS) 9NI-4Co (P)
AM 350)(S) 17-4PH(P) D6AC(Sb) 43.40(S) H-IlI(S)
Figure 8 COMPARI!SON BETWE.EN ALTERNATE-IMMERS ION AND SEMI-INDUSTR IALEXPOSURE
32
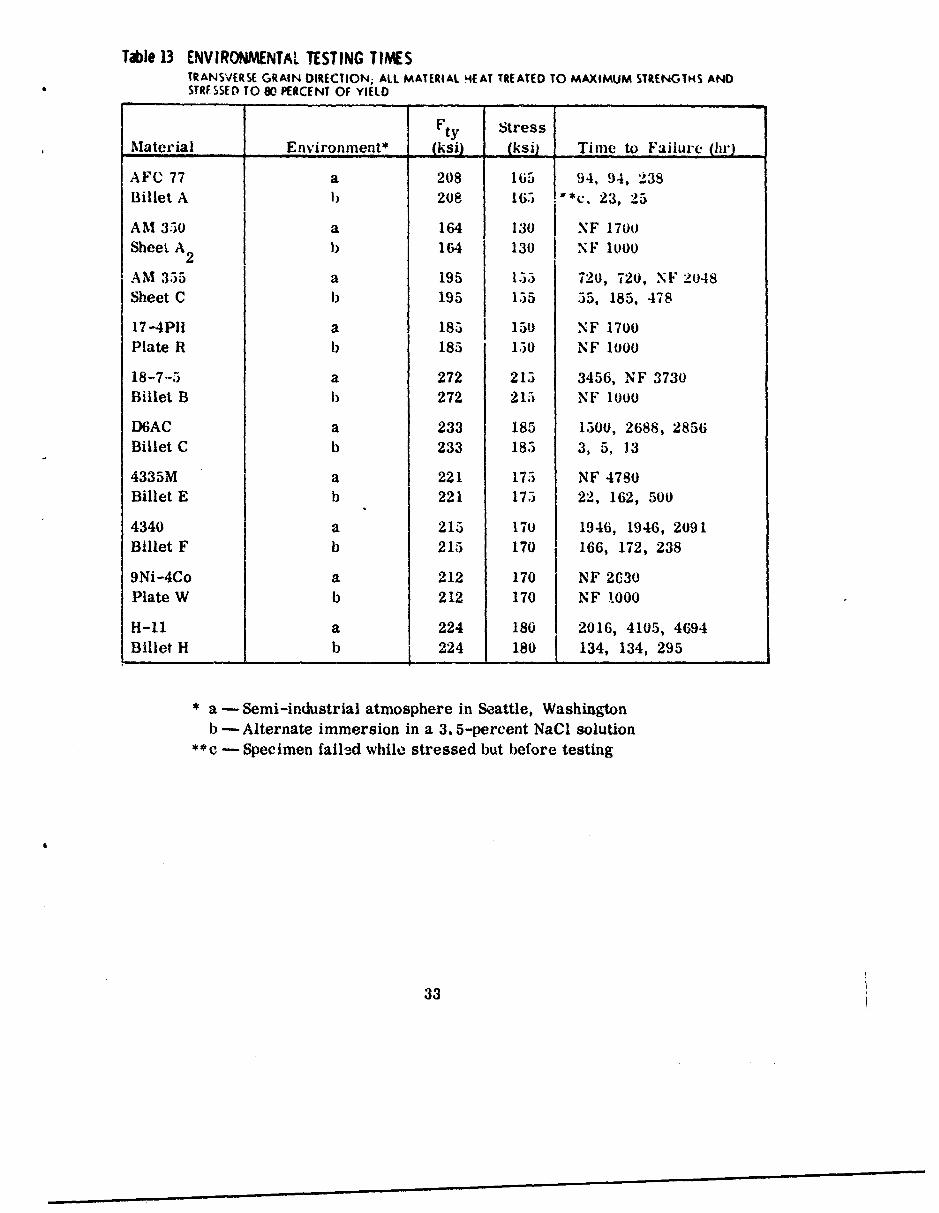
Table 13 ENVIRONMENTAL TESTING TIMESTRANSVERSE GRAIN DIRECTION; ALL MATERIAL 4EAT TREATED TO MAXIMUM STRENGTHS ANDSTRESSED TO 80 PERCENT OF YIELD
F ty Stress
Material Environment* (ksi) (ksij Time to Failure (hr)
AFC 77 a 208 165 94, 94, 238Billet A 1) 208 165 .**c, 23, 25
AM 330 a 164 130 NF 1700Sheet A2 I) 164 130 NF 1000
'AM 355 a 195 135 720, 720, NF 2048Sheet C b 195 155 55, 185, 478
17-4PI a 185 150 NF 1700Plate R b 185 150 NF 1000
18-7.-5 a 272 215 3456, NF 3730Billet B ) 272 215 NF 1000
D6AC a 233 185 1500, 2688, 2856Billet C b 233 185 3, 5, 13
4335M a 221 175 NF 4780Billet E b 221 175 22, 162, 500
4340 a 215 170 1946, 1946, 2091Billet F b 215 170 166, 172, 238
9Ni-4Co a 212 170 NF 2C30Plate W b 212 170 NF 1000
H-11 a 224 180 2016, 4105, 4694Billet H b 224 180 134, 134, 295
* a - Semi-industrial atmosphere in Seattle, Washington
b - Alternate immersion in a 3.5-percent NaCI solution** Specimen failbd while stressed but before testing
33
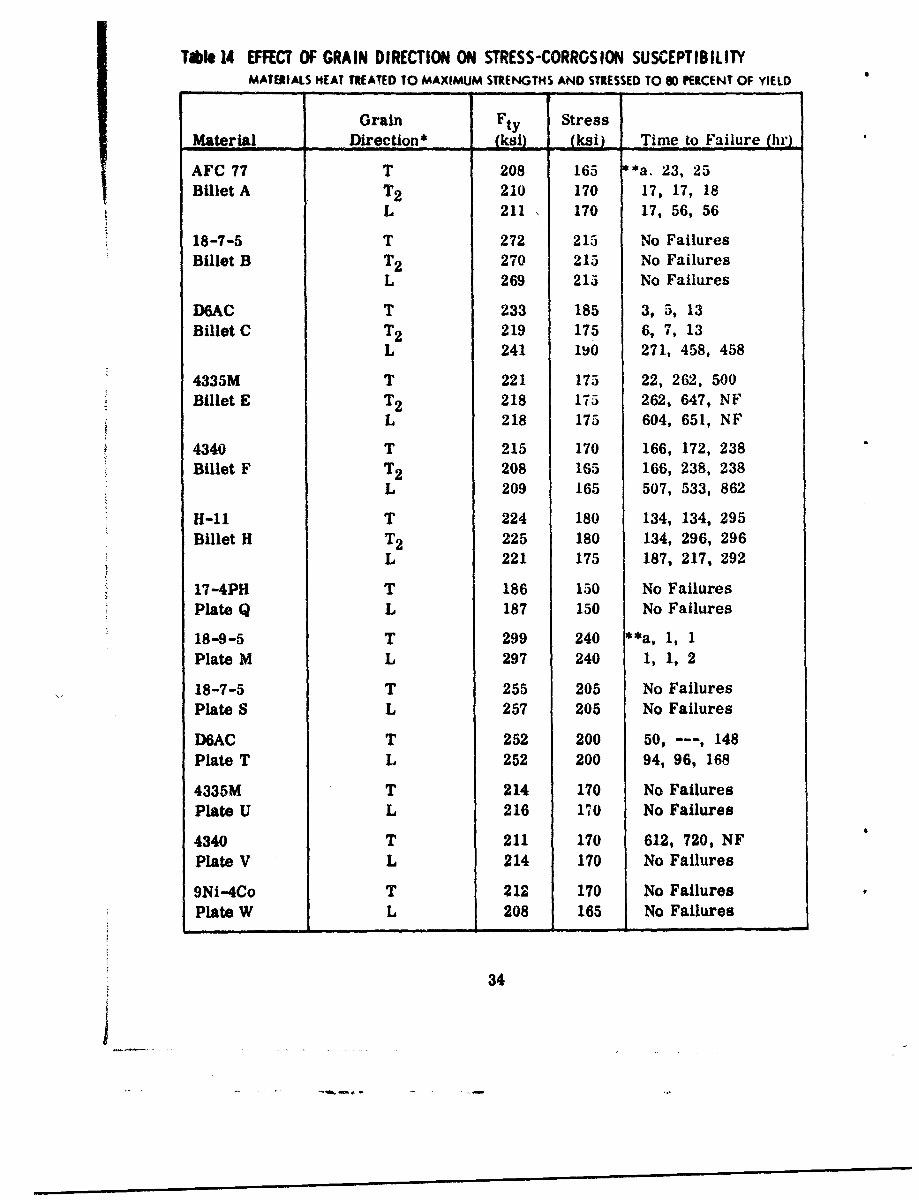
Table 14 EFFECT OF GRAIN DIRECTION ON STRESS-CORROSION SUSCEPTIBILITYMATERIALS HEAT TREATED TO MAXIMUM STRENGTHS AND STRESSED TO SO PERCENT OF YIELD
Grain Fty StressMaterial Direction* (L (ksi) Time to Failure (hr)
AFC 77 T 208 165 *a. 23, 25Billet A T2 210 170 17, 17, 18
L 211 170 17, 56, 56
18-7-5 T 272 215 No FailuresBillet B T 2 270 215 No Failures
L 269 215 No Failures
D6AC T 233 185 3, 5, 13Billet C T2 219 175 6, 7, 13
L 241 190 271, 458, 458
4335M T 221 175 22, 262, 500Billet E T2 218 175 262, 647, NF
L 218 175 604, 651, NF
4340 T 215 170 166, 172, 238Billet F T2 208 165 166, 238, 238
L 209 165 507, 533, 862
H-11 T 224 180 134, 134, 295Billet H T2 225 180 134, 296, 296
L 221 175 187, 217, 292
17-4PH T 186 150 No FailuresPlate Q L 187 150 No Failures
18-9-5 T 299 240 *a, 1, 1Plate M L 297 240 1, 1, 2
18-7-5 T 255 205 No FailuresPlate S L 257 205 No Failures
D6AC T 252 200 50, --- , 148Plate T L 252 200 94, 96, 168
4335M T 214 170 No FailuresPlate U L 216 170 No Failures
4340 T 211 170 612, 720, NFPlate V L 214 170 No Failures
9Ni-4Co T 212 170 No FailuresPlate W L 208 165 No Failures
34
I • a •• m u •

Table 14 (continued)II
Grain Ftv StressMaterial Direction* (ksi) (ksi) Time to Failure (hw)
9Ni-4Co T 205 165 263, 263, 504
Plate X L 227 180 641, 816, S16
H-11 T 225 180 143, 175, 260
Plate Z L 225 180 159, 313, 473
AM 350 T 164 130 No Failures
Sheet A L 167 130 No Failures
AM 355 T 195 155 55, 175, 478Sheet C L 195 155 175, 360, --
4340 T 210 170 90, 90, NFSheet E L 200 160 330, NF, NF
* T - Primary transverse grain direction
T 2 -Second transverse grain direction from billet material only
L - Longitudinal grain direction
**a - Specimen failed while stressed but before testing
35

I I I 'I+ -I, ' I'1I
KEY
t LONGITUDINAL GRAIN DIRECTIONT PRIMARY TRANSVERSE GRAIN DIRECTION
I0- T2 SECONDARY TRANSVERSE GRAIN DIRECTION
NOTE: 18-7-5 BILLET S AND PLATE S, 17-4PH PLATE 0,
4335M PLATE U, 9Ni-4Co PLATE W, AND AM 350SHEET A2 DATA ARE NOT SHOWN, SINCE THEREWERE N8 FAILURES OF THESE MATERIALS.
_j l I .- I- I- _ I.- _ _ 1 .- -0 NI -go- C4 I.I i4
~u () N ~ > U. LU
I-
0--:
Figure 9 RELATIONSHIP BETWEEN GRAIN DIRECTION AND STRESS-CORROSIONSUSCEPTIBILITY
woo ~ H- I 4340l18-kZi J 06ACI 118-7-5
t~ Kz0I0-
tot0 0
140 150 IV 170 I1D 190 200 210 220 230 240 250YIELD STRENGTH (KSI)
Figure 10 CHANGE IN STRESS-CORROSION SUSCEPTIBILITY WITH STRENGTH LEVEL
36

Table 15 EFFECT OF STRENGTH LEVEL ON STRESS-CORROSION SUSCEPTIBILITYTRANSVERSE GRAIN DIRECTION; MATERIALS HEAT TREATED TO THE 180- TO 20 0 - 220- TO 240-,OR 260- TO 280-KSI ULTIMATE STRENGTH RANGES AND STRESSED TO 80 PERCENT OF YIELD
Material Yield Strength (ksi) Stress (ksi) Time to Failure (hr)
AFC 77 208 165 *a, 23, 25Billet A 168 135 56, 188, NF
140 110 No Failures
18-7-5 272 220 No Failures
Billet B 213 170 No Failures177 140 No Failures
D6AC 233 185 3, 5, 13
Billet C 216 170 *b, 13, 23204 .65 No Failures
4335M 221 175 22, 262, 500Billet E 205 165 506, 566, 652
187 150 No Failures
4340 215 170 166, 172, 238
Billet F 205 165 18, 161, 171
170 135 No Failures
H-I1 224 180 134, 134, 295Billet H 190 150 180, NF, NF
150 120 No Failures
* a -Specimen failed while stressed but before testing
b- Specimen ruined during machining
37

260 ---
- - - ~ULTIMATE STRENGTH ------
220--- -I_
4A YIELD STRENGTH
160 - - - - - -
g .-0 -
z
zo
1000-------------- - 00 NF
0 100----'
1700 o090 1000 1100 1200 -30
TEMPERING TEMMEATURE J*F)
Fkgure 11 STRESS-CORROSION SUSCEPTIBILITY OF AFC 77 BILLET A
38

280
I YIELD STRENGTH ULTIMATE STRENGTH240
V)U,of
S1.5-
U
Z 1.0
o lo
I-
U,
900 1000 1100
AGING TEMPERATURE (o)
Figure 12 STRESS-CORROSION SUSCEPTIBILITY OF 18-7-5 BILLET B
39

ULTIMATE STRENGTH
260 t1A 240
YIELD STRENG(H220 - - --
mS
5 1.3------------------ -i -
zzoLI Ii
z 0.7-----
1000------------------------
J NF
S/
0 -0 - -10/
200 6 400 000 20
TUMPERING TIMATUREV (*F)
Flour# 13 STRESS-CORROSIONd SUSCEPTIBILITY OF DMAC BILLET C
40

260
ULTIMATE STRENGTH
240-
4.n
I-.
220
YIELD STRENGTH
1.5 - - - - - - --
Z0z
1000-
A AXI x
100 100_o I/i
Z]
10~
40000 600 700 Uo 900 1000TEMPE!RING TEMPIRATURE (OF)
Figure 14 STRESS-CORROSION SUSCEPTIBII.ITY OF 4335M BILLET E
41

II280 ------
ULTIMATE STRENGTH
I-I
u i
o 1.5 --z
zo
6 1.01
1000NF
x x
100--0,
Z
LA.
300 400 500 600 700 900
TEMPERING TEMPERATURE (OF)
Figure 15 STRESS-CORROSION SUSCEPTIBILITY OF 4340 BILLET F
42

ULTIMATF STRENGTH
?40,
t&J -- I0 YIELD STRENGTH- "
S1.5Z "
_____ ____.-j ... - __,___
z 0 . ..-. _.___
.-. NF| . I I'-l 1NF/ iOl. s7 7!- ! I-", 711
1000 NF- _
o __0- 10 t---
900 1000 1100 )0
TEMPERING TEMPERATURE (OF)
Figure 16 STRESS-CORROSION SUSCEPTIBILITY OF H-li BILLET H
43
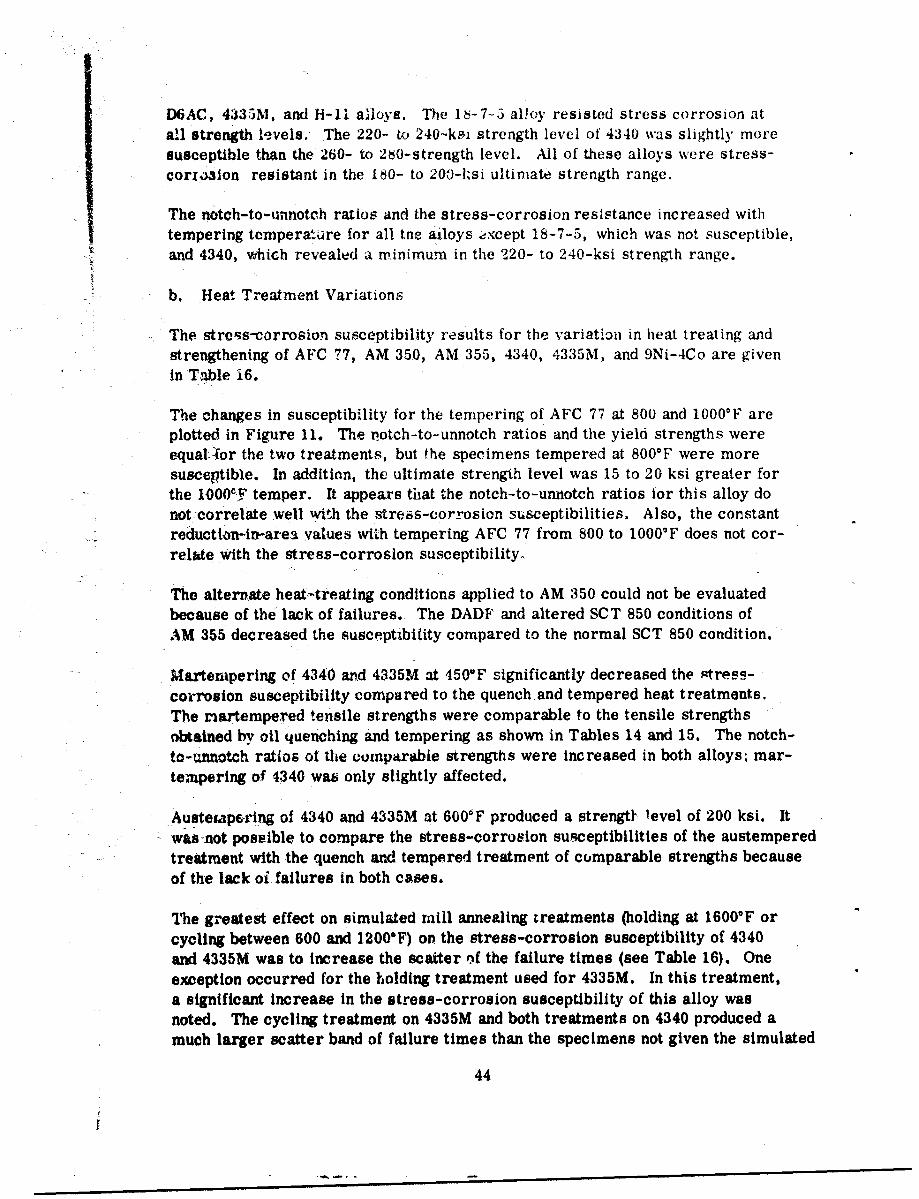
D6AC, 4335M, and H-I1 ailoys. The 16-7-5 alloy resisted stress corrosion atafl strength levels. The 220- to 240-kai strength level of 4340 was slightly moresusceptible than the 260- to 280-strength level. All of these alloys were stress-corxa3lon resistant in the 160- to 200-I;si ultimate strength range.
The notch-to-unnotch ratios and the stress-corrosion resistance increased withtempering tcmperature for all tne ailoys except 18-7-5, which was not susceptible,and 4340, which revealed a minimum in the 220- to 240-ksi strength range.
b. Heat Treatment Variations
The stress-corrosion susceptibility results for the variation in heat treating andstrengthening of AFC 77, AM 350, AM 355, 4340, 4335M, and 9Ni-4Co are givenin Table 6.
The changes in susceptibility for the tempering of AFC 77 at 800 and 1000°F areplotted in Figure 11. The notch-to-unnotch ratios and the yield strengths wereequal 4or the two treatments, but the specimens tempered at 800°F were moresusceptible. In addition, the ultimate strength level was 15 to 20 ksi greater forthe 1000,F temper. It appears that the notch-to-unnotch ratios for this alloy donot-correlate well with the stress-corrosion susceptibilities. Also, the constantreductlon-in-area values with tempering AFC 77 from 800 to 1000'F does not cor-reste with the stress-corrosion susceptibility.
The alternate heat-treating conditions applied to AM 350 could not be evaluatedbecause of the lack of failures. The DADF and altered SCT 850 conditions ofAM 355 decreased the susceptibility compared to the normal SCT 850 condition.
Martenipering of 4340 and 4335M at 450"F significantly decreased the xtress-corrosion susceptibility compared to the quench and tempered heat treatments.The riartempered tensile strengths were comparable to the tensile strengthsobtained by oil quenching and tempering as shown in Tables 14 and 15. The notch-to-unnotch ratios of the comparable strengths were increased in both alloys; mar-teWpering of 4340 was only slightly affected.
Austetap&rtng of 4340 and 4335M at 600°F produced a strengtY level of 200 ksi. Itwas-not possible to compare the stress-corrosion susceptibilities of the austemperedtreatment with the quench and tempered treatment of comparable strengths becauseof the lack oi failures in both cases.
1he greatest effect on simulated mill annealing treatments (holding at 1600"F or
cycling between 600 and 1.200°F) on the stress-corrosion susceptibility of 4340and 4335M was to increase the scatter of the failure times (see Table 16). Oneexception occurred for the holding treatment used for 4335M. In this treatment,a significant increase in the stress-corrosion susceptibility of this alloy wasnoted. The cycling treatment on 4335M and both treatments on 4340 produced amuch larger scatter band of failure times than the specimens not given the simulated
44

Table 16 TESTING TIMES OF SEVERAl ALLOYS AFTER VARYING HEAT TREATMENTAND STRENGTHENING PROCESSESTRANSVERSE GRAIN DIRECTION; ALL MATERIAL STRESSED TO RO PERCENT OF YIEIDAFTER HEAT TREATMENT
F ty StressMaterial Treatments* ksi) ksi) Time to Failure (hr
AFC 77 a 197 160 Q 29, 56Biflet A b 200 160 113, 160, 213
AM 330 c 161 130 No Failures (NF)Sheet A2 d 171 135 No Failures
AM 355 c 184 145 952. NF, NFSheet C d 143 115 598, NF, NF
D6AC e1 - 180 26, 44, 88Billet C
4335M el 175 138, 666, 786Billet E f - 175 22, 22, 67
g 220 175 67, 652, NFh 173 140 No Failures1 225 180 1050, NF, NF
4340 eI - 170 2,62, 62Billet F e2 251 170 9, 27, 142
e3 242 170 22, 26, 48f - 170 23, 404, 540
g 210 170 26, 238, 404h 166 135 No Failures1 221 175 186, 503, NF
9Ni-4Co 248 200 No FailuresPlate Y 8 Specimen failed while stressed, but before testing
Specimen ruined during machining- Tempered at 80 0 OF for 2 + 2 hours
b - Tempered at 1000°F for 2 + 2 hoursc - DA DF conditiond -Altered SCT 850 conditione -Ausformed
1-Hot/cold worked at 1500°F, 25-percent reduction2-Hot/cold worked at 1200'F, 20P-percent reduction3-Hot/cold worked at 1000°F, 25-percent reduction
f - Mill annealed by holding at 1600°F for 72 hoursg -Mill annealed by cycling between 600'F and 1200'Fh - Austempered at 600°FI -Martempered at 450Fj - Material received in ausformed condltien, heat treated to 260- to
280-kal tensile strength
45

millannealing treatments. Therefore, this overlapping o, fa~lire times makes
It difficult to determine the extent to which the mill annealing processes '!hangethe susceptibility of these two alloys. Tl-e annealing treatments dit! not aherthe smooth tensile properties, except that the holding treatment caused the 4340
tensile specimens to break in the threads. The notched tensile ultimate strengthsof 4340 ?nd 4335M alloys were significantly decreased by the holding treatment,but were not affected by the cyc1ig treatment.
c. Ausforming
Increasing the ausforming temperature from 1000 to 1500°F improved the strengthand ductility of 4340. Ausforming also improved these properties in 4335M and
D6AC over those obtained before this processing (see Tables 9 and 10). Theseausformed materials were stressed to the nonausformed stress levels so thatdirect comparisons could be made between the two processing methods.
The stress-corrosion susceptibility of the ausformed specimens varied with eachmaterial, as shown in Table 16. The D6AC ausformed specimens were lesssusceptible than thc conventionally heat-treated specimens. Ausforming of4335M did not appreciably change its susceptibility. The 4340 specimens aus-formed at different temperatures showed approximately the same amount of in-creased susceptibility. The as--received hot/cold-worked plate of 9Ni-4Co(0.35 carbon) was immune to failure within the 1000-hour time limit.
The fracture- faces from the ausformed specimens were inclined 45 degrees tothe tension surface. Fracture faces of the comparable nonausformed specimenswere normal to the tension surface.
d. Straightening
The effect oi cold deiurmatioa after heat treating on the stress-corrosion sus-ceptibility of AFC 77, AM 355, 18-7-5, 4335M, 4340, and H-I1 is given inTable 17 and plotted in Figure 17. Specimens without prior strain are alsoplotted for comparison.
There were no failures in 4335M and 18-7-5. The scatter in the failure timesof the 4340 specimens was too great for a proper evaluation. It does appear,however, that the susceptibility first decreases at 0.5-percent strain and thenincreases at 1.0-percent strain. The susceptibility of H-11 decreases slightlyat both percentages of strain. AM 355 revealed a decrease in susceptibility at1.0-percent strain and an increase at 3.0-percent strain.
The AFC 77 specimens were so brittle tha the percentages of strain did notexceed approximately 0.30 percent: consequently, the strained specimens couldnot be evaluated.
46

Table 17 TESTING TIMES OF DEFORMED ALLOYSTRANSVERSE GRAIN DIRECTiON; MATERIAL HEAT TREATED TO MAXIMUM STRENGTH, DEFORMED,AND STRESSED TO 80 PERCENT OF THE UNDEFORMED YIELD STRENGTH
I-
Strain tt StressMaterial (percent) (ksi/ (ksi) Time to Failurc (hr)
AFC 77 0 208 165 *a, 23, 251.0 208 165 )5.0 208 165 *)
AM 355 0 195 155 55, 175, 478Sheet C 1.0 195 155 *c, NF, NF
3.0 195 155 167, 192, NF
18-7-5 0 272 220 No FailuresPlate S 1.0 272 220 *b, NF, NF
5.0 272 220 No Failures
4335M 0 214 170 No FailuresPlate U 0.5 214 170 No Failures
1.0 214 170 No Failures
4340 0 211 170 612, 720, NFPlate V 0.5 211 170 781, 864, 1000
1.0 211 170 313, 612, NF
H-l1 0 224 180 143, 174, 260
Plate Z 0.5 224 180 ', 174, 6122.u 224 180 i27, 154, 612
* a -Specimen failed while stressed, but before testing
! - Specimen(s) failed during deformingc -Specimen overloaded during stressing and therefore was not tested
47

I
100100 1000j
wh. U..
0 0*- 10 'U- 1
,- )
I I I IV_ _ _ __
1.0 2.0 3.0 0.5 1.0 1.5
PERCENT STRAIN PERCENT STRAINA. AM 355 SHEET C B. 4340 PLATE V
1000
11010
I I
0.5 1.0 1.5
PERCENT STRAINC. H-1I PLATEZ
Figure 11 EFFECT OF DEFORMATION ON STRESS-CORROSION SUSCEPTIBILITY
48

e. Welding
Chemical compositions of the weld wires are given in Table 1S.
The stress-corrosion test results frr automatic and manual fusion welding of17-4P1, 18-7-5, D6AC, 4335M, 4340, 9Ni-4Co, H-11, AM 355, and AM 350are given in Table 19. A majority of the welded plate specimens failed in thewelds while the welded sheet specimens failed both in the welds and in the heat-affected zones.
The test results from the D6AC, 4335M , 4340, H-11, and 9Ni-4Co plate materialsare not typical because of the porosity detected in a number of the welded speci-mens. For all specimens with satisfactory welds, it appears that both weldingmethods have comparable stress-corrosion susceptibilities that are greater thanthe susceptibility of the base metals. There were no failures in the AM 350 and17-4PH welded specimens.
Coatings
The stress-corrosion susceptibility for the five types of coatings on 18-7-5,D6AC, 4335M, 4340, H-11, and 9Ni-4Co is given in Table 20. In all caseswhere stress-corrosion failures occurred, the susceptibility of the coated speci-mens was less than that of the bare specimens. The only failures were thecadmium-titanium plated D6AC, and the epoxy paint, cadmium plate, and cadmium-titanium coated H-11. Because the epoxy paint failures occurred outside thetest area, near the tie-down point on the U-bend specimen, these were not con-sidered typical. There were no other coated-specimen failures.
5. Design Data
The failure times of both D6AC billets were nearly the same at the 80- and 60-percent stress levels. One D6AC billet successfully passed the 1000-hour testwith no fractures at the 40-percent stress level, while the other billet had allfailures within this test period. The billets of 4340 and those of 4335M had widelyvarying times at stresses of 80 percent of yield. These latter discrepancies dis-appeared at the 60- and 40-percent stress levels. The vacuum melt H-11 provedto be less prone to failure than the air melt. Comparison of air and vacuum melt4330M billets was inconclusive, because at 80 percent of yield vacuum melt failuresoccurred between 47 hours and no failures at 1000 hours, while all air melt failuresoccurred in approximately 432 hours.
There were no 17-4PH failures at 80, 60, or 40 percent of yield. Since one sheetof AM 350 had no failures at the 80-, 60-, or 40-percent levels, the other AM 350sheet was tested only at 80 percent of yield. There were no failures of the secondgroup of AM 350 sheet specimens. AM 355 sheet results were complicated by thetesting of two gages. The thinner gage material (0. 020 inch) had failures at allstress levels, but individual specimens survived the 1000 hours of testing. The
49

00
C4 e n 00 a -a a
C)f
0 -
o0 t- 000 t
0O "t 10 q
o!0
o 0 0
00 Lo q'
00) M : 00 z :- (
a~ 50

Table 19 TESTING TIMES OF WELDED ALLOYSTRANSVERSE GRAIN DIRECTION; MATERIAL WELDED, HEAT TREATED TO MAXIMUM STRENGTHS,AND STRESSED TO 80 PERCENT OF YIELD
Fty Stress .
Material Welding Means* (ksi) (ksi) Time to Failure (hr)
17-4PII A 186 150 No Failures (NF)Plate Q M 186 150 No Failures
18-7-5 A 255 205 No FailuresPlate S M 255 205 No Failures
D6AC Q A 252 200 a, b, 28Plate T M 252 200 a, 143, 143
DGAC A 252 200 g, 110, 212Plate T M 252 200 g, 80, 140
4335M A 214 170 143c, 150c, 751Plate U M 214 170 143, 312, 503
4340 A 211 170 86, 121d, 225Plate V M 211 170 62, 134c, 225
9Ni-4Co A 212 170 751, NF, NFPlate W M 212 170 150c, NF, NF
H-I A 225 180 1b, 71c, 71Plate Z M 225 180 71c, 71, NF
AM 355 A 195 155 95, 839e, NFSheet C M 195 155 71, 532c, NF
AM 350 A 164 130 No FailuresSheet A2 M 164 130 No Failures
4340 A 210 170 696f, 936e, NFSheet E M 210 170 360e, 696c, NF
Welded with 0,36-inch carbon wireWelded with 0.47-inch carbon filler wire
* A- Automatic welding method
M- Manual welding method** a - Specimen failed while stressed, but before testing
b - Specimen had internal crack and was not testedc -X ray indicated internal porosityd -X ray indicated tungsten inclusionse- Specimen failed in heat-affected zonef - Specimen failed in base metalg - Specimen failed dui ng machining
51

Table 20 TESTING TIMES OF COATED ALLOYSTRANSVERSE GRAIN DIRECTION; MATERIAL HEAT TREATED FOR MAXIMUM STRENGIHS, COATED,AND STRESSED TO 9D0 PERCENT OF YIELD
Coating Fty StressMaterial Materials (ksi) (ksi) Time to Failure (h )
18-7-5 a 255 205 No FailuresPlate S b 255 205 No Failures
c 255 205 No Failuresd 255 205 No Failurese 255 205 No Failures
D6AC a 252 200 No FailuresPlate T b 252 200 No Failur,-
c 252 200 696, NF, NFd 252 200 No Failurese 252 200 No Failures
4335M a 214 170 No FailuresPlate U b 214 170 No Failures
c 214 170 No Failuresd 214 170 No Failurese 214 170 No Failures
4340 a 211 170 No FailuresPlate V b 211 170 No Failures
c 211 170 No Failuresd 211 170 No Failurese 211 170 No Failures
H-11 a 225 180 722*, 864*, NFPlate Z b 225 180 No Failures
c 225 180 641, 720, NFd 225 180 641, NF, NFe 225 180 No Failures
9Ni-4Co a 212 170 No FailuresPlate W b 212 170 No Failures
c 212 170 No Failures
d 212 170 No Failurese 212 170 No Failures
*Failed outside test areaa -Epoxy paintb - Cadmium platingc - Cadmium-titanium platingd - Cadmium plus epoxy painte - Flame-sprayed aluminum coating
52

thicker-material (0.060 inch) failures occurred as expected, with earliest failuresoccurring at the higher stresses. Data is given in Table 21 and plotted in F'igures1 and 19.
F. FRACTOGRAPitY AND METALLOGRAPHY
The optical microscopic examination of the low-alloy steels was greatly enhancedwith the use of the new etching reagent. In the past, it has been quite difficult todetermine the prior austenitic grain sizes of these steels in the quenched andtempered condition because of difficulty in showing prior aikstenite grain bound-
aries. This reagent, in addition to helping determf'ie grain size, was also quiteuseful in determining the mode of cracking (whether transgranular or inter-granular), and hence, supplementing much of the electron microscope work.This etchant, known as the ADS reagent, had the following nominal composition:
100-ml saturated aqueous picric acid;
1.5-gm sodium tridecyl benzene sulfonate.
Analysis of the fracture faces of 75 failed stress-corrosion and 25 fracture tough-ness specimens was accomptished using the electron microscope. The opticaland electron microscope results are described in the "Discussion" section ofthis report.
G. SUPPLEMENTAL INFORMATION- PREVIOUS STRESS-CORROSION STUDY
Comparisons between Aerojet constant- immersion and Boeing alternate-immersiontest methods indicate, although the test solutions were of slightly different con-
centrations, that alternate immersion causes much earlier failures.
The indicated correlation between impact strength and stress-corrosion suscepti-bility does exist for the 4330M, 4340, 4340M, and H-11 steels. Briefly, thelower the impact strength, the greater the stress-corrosion susceptibility. Adiscussion of the environmental and Izod test results and an analysis of the impact-specimen fracture faces is contained in Appendix II.
H. LITERATURE SURVEY
A survey of the current publications on stress-corrosion cracking is given inAppendix IV.
53

Table 21 COMPARATIVE TESTING TIMES OF DUPLICATE SHEETS, BILLETS, AND PLATESTRANSVERSE GRAIN DIRECTION; MATERIAL HEAT TREATED TO MAXIMUM STRENGTHSAND STRESSED TO 40, 60, OR 80 PERCENT OF YIELD
Material Fy (ksi) Stress (kal) . Tire .to £ailur
AM 350 164 130 No FailuresSheet A2 164 100 I No Failures
(0.060 inch) 164 65 No Failures
Sheet F 198 160 No Failures(0.020 inch) 198 120 Not tested
198 80 Not tested
AM 355 195 155 55, 175, 478Sheet C 195 115 No Failures
(0.060 inch) 195 80 No Failures
Sheet D 187 150. 95, 191, NF(0.020 inch) 187 1.0 71, 263, NF
187 75 98,--, NF
17-4PH 186 150 No FailuresPlate Q 186 110 qNo Failures
186 75 No Failures
Plate R 185 150 No Failures185 110 No Failures185 75 No Failures
D6AC 233 185 3, 5, 13Billet C 233 140 35, 295, 333
233 95 No Failures
Billet D - 185 2, 6, 22- 140 23, 27, 126- 95 504, 720, 1000
4335M 221 175 22, 262, 500Billet E 221 130 936, NF, NF
221 90 No Failures
Billet J - 175 720, NF, NF- 130 No Failures- 90 No Failures
54
, ,m • • , m • m • • •
0
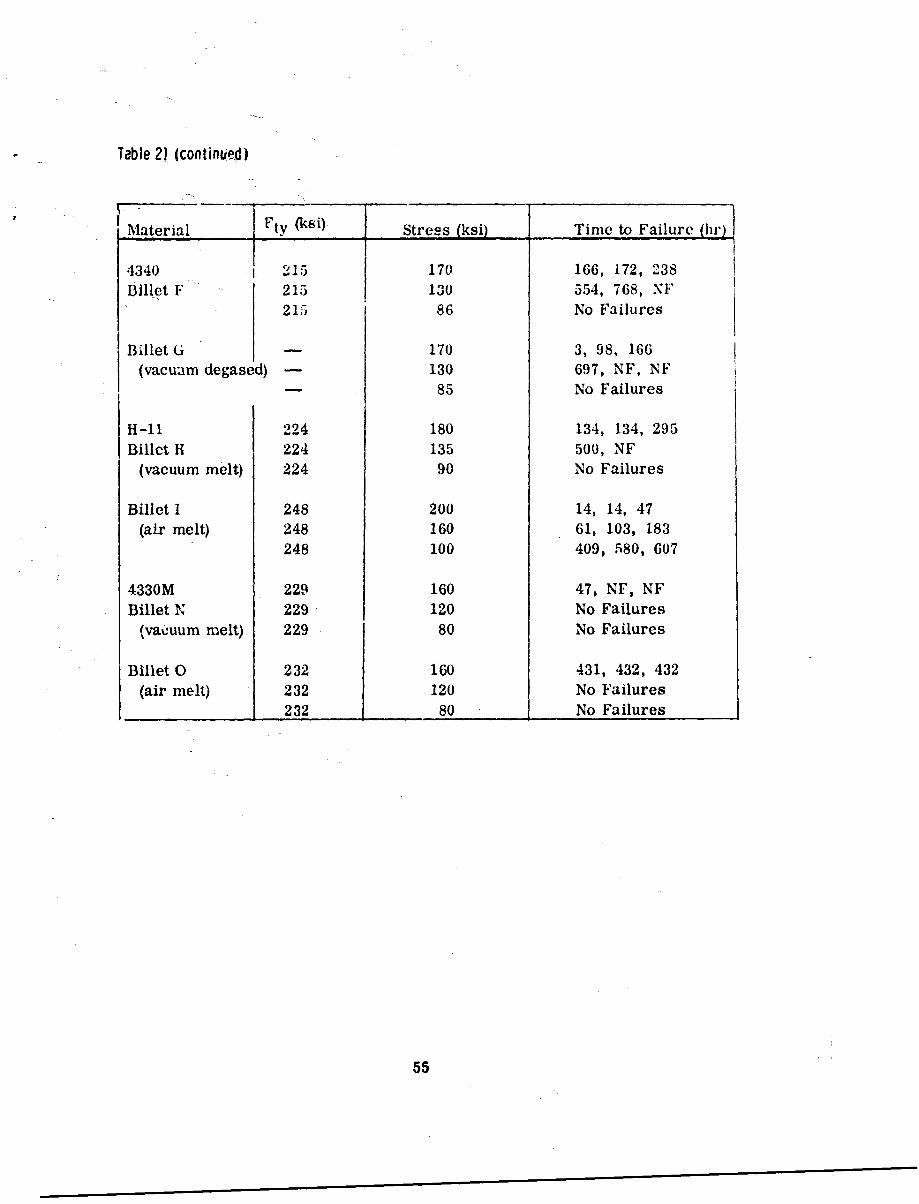
Table 2) (continued)
Material Fty (ksi) Stress (ksi) Time to Failure (hr)
4340 215 170 166, 172, 238
Billet F 215 130 554, 768, NF
215 86 No Failures
Billet G( 170 3, 98, 166
(vacuzim degased) - 130 697, NF, NF
85 No Failures
H-11 224 180 134, 134, 295
Billet H 224 135 500, NF
(vacuum melt) 224 90 No Failures
Billet I 248 200 14, 14, 47
(air melt) 248 160 61, 103, 183
248 100 409, 580, 607
4330M 229 160 47, NE, NF
Billet N 229 120 No Failures(vacuum melt) 229 80 No Failures
Billet 0 232 160 431, 432, 432
(air melt) 232 120 No Failures
232 80 No Failures
55
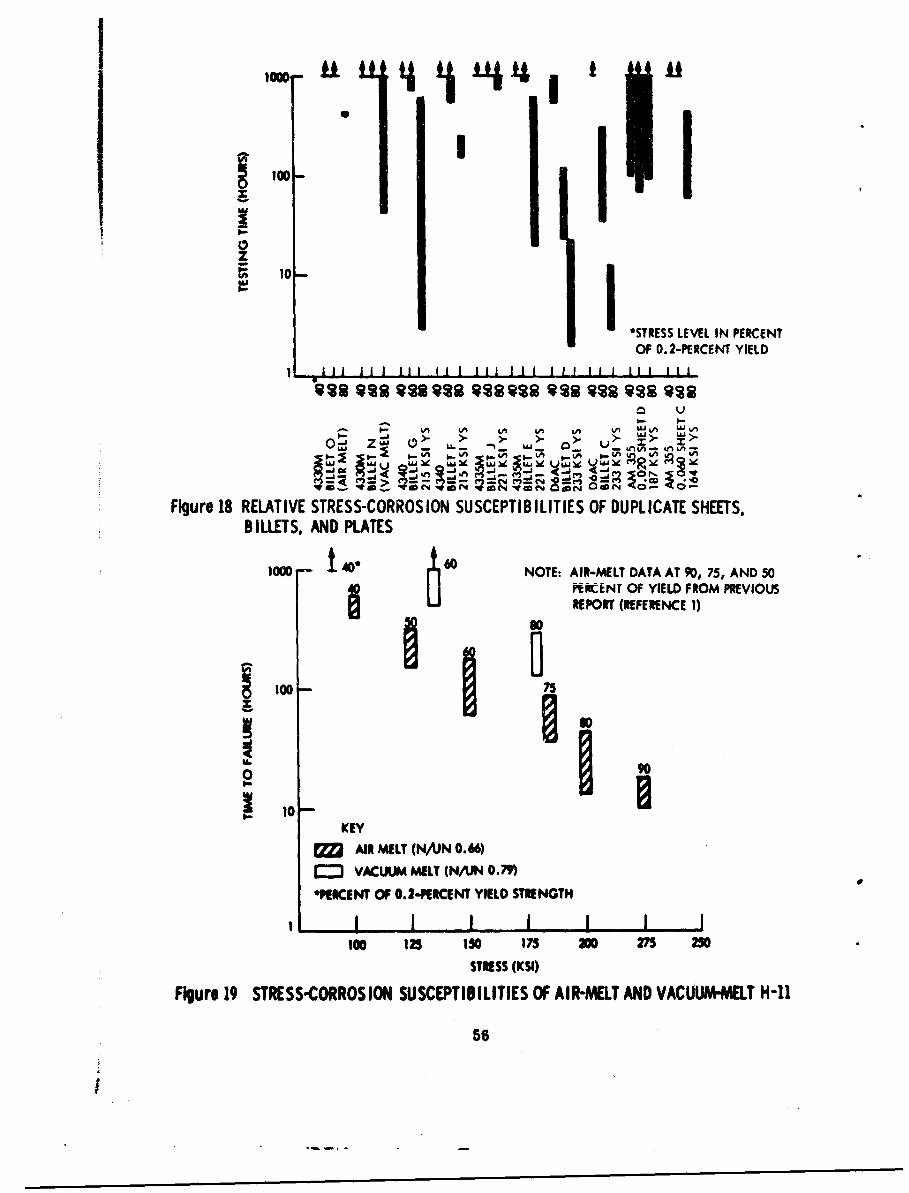
z~o
*STRESS LEVEL IN PERCENT
OF 0.2-PERCENT YIELDv~ il I I S !11 sEI la e S in
!~L BIAES VN;LAE
BILTREEE IN PERCE
low MELT (N0U NOE.RML DT T 0 5,AD5
P T OF0.-OF YIELD 0.2-PEREYIRIE O1 IIEiEEC 1)
1I) - 7-
10C rJ-~.-0
FIgure 189RELATVE STRESS-CORROSIO N SUSCEPTIBILITIES OF DPLCATE SHET6K6 PERUOF OF YIELD FRMERVIU
REPORT (REERNC 1
F~r19SRESCORS O SSEPIILTESO AIR ELT ANDAJNO.66)TH-1
Vk~WAMET (AI 056

V. DISCUSSION
This discussion is divided into three sections. The first is concerned with acomparison of the alloys and the various processes and the effect of each onstress-corrosion susceptibility. The second section describes the modes offracture and their relation to various processing variables and methods otesting. The final section includes the supplementary discussion of the fracturesobtained after cathodically or anodically charging stressed 4340 and 18-9-5specimens.
A. THE EFFECT OF MATERIAL AND PROCESSING VARIABLES ON STRESS-CORROSION SUSC EPTIBILITY
Comparison of billets and plates of the same material showed, in general, theplate materials to be less susceptible to stress corrosion than billet materials.Evaluation of these materials in both the longitudinal and transverse grain direc-tions showed this trend to prevail for all steels except H-Il and D6AC. Therewere no differences in the susceptibilities of H-11 billet and plate. The D6ACdata were contradictory. In the transverse direction, D6AC plate was less sus-ceptible than either transverse grain direction in a billet, while billet wassuperior to the plate when compared only in the longitudinal grain directions.Because of lack of information, it was not possible to determine the effects ofvarious rolling and forging processes, but optical microscopic examinationrevealed the variation between plate and billet susceptibility to be partially dueto changes in grain size. The less susceptible plate usually had a smaller grainsize than the comparison billet. H-11 plate and billet grain sizes were thesame, as indicated by their similar susceptibilities. The D6AC material indi-cated the operation of nther unidentifiable factors since the plate and billet, withASTM grain sizes 6 and 10 respectively, reversed their relative susceptibilitieswith changes in testing grain direction. The decrease in failure time with de-creasing grain size revealed in this study has also been noted in 70-30 brassand 18-8 stainless steel by Robertson and Tetelman (Reference 5). One compli-cating factor in a comparison of this type in this study was the use of materialfrom different heats. Though it is evident that the plate material is usually lesssusceptible, a more accurate determination of the degree of difference woulddepend on the evaluation of two alloy forms from the same heat.
The stress-corrosion tests of specimens taken from the various grain directionsof the billets, plates, and sheets used in this program revealed that the trans-verse grain direction specimens were more susceptible than the longitudinalgrain direction specimens. The relative susceptibility of the specimens from agiven alloy may partially be related to the amount of grain elongation experiencedduring the mill processing of each form of material. Billet H of H-il did notshow any signs of grain elongation, which may be why this particular alloy didnot reveal greater susceptibility for the transverse grain direction specimens.
57
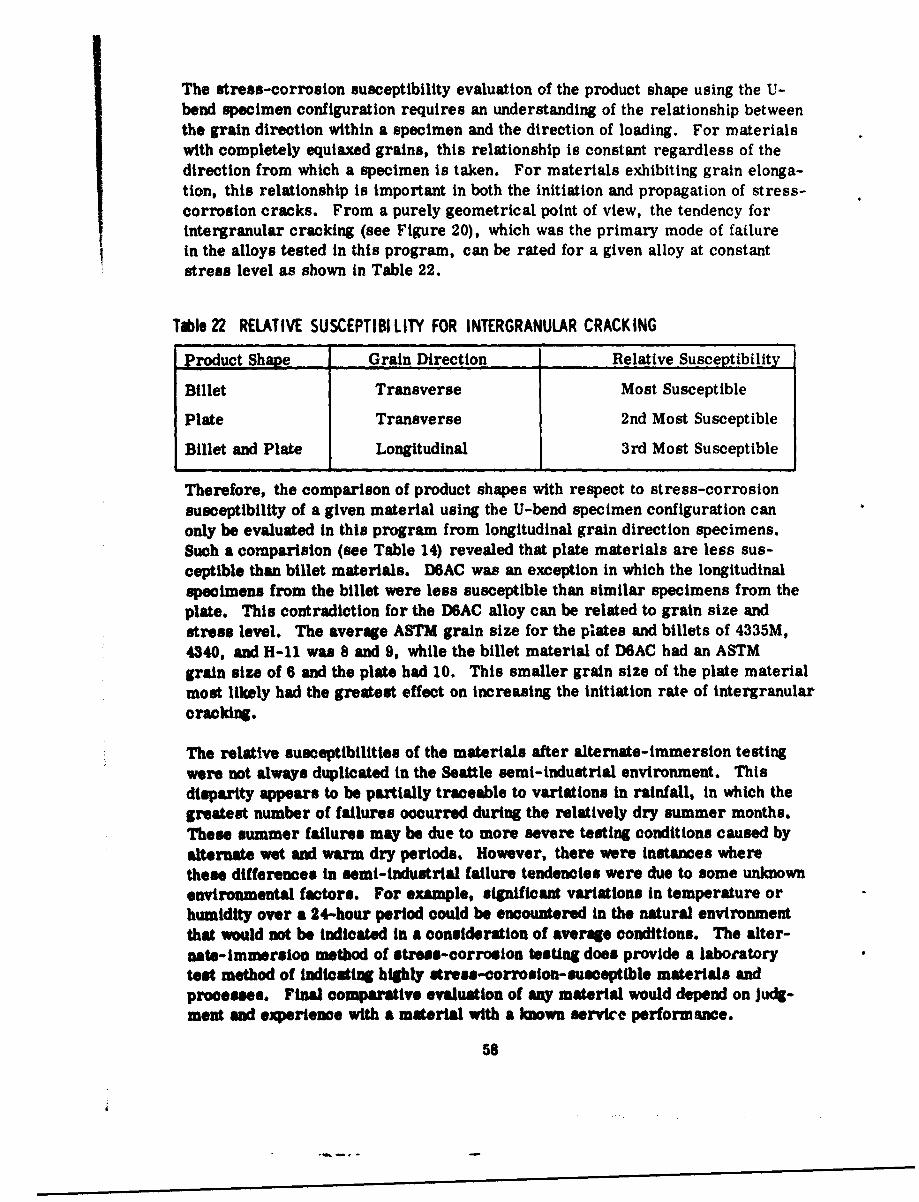
The stress-corrosion susceptibility evaluation of the product shape using the U-bend specimen configuration requires an understanding of the relationship between
the grain direction within a specimen and the direction of loading. For materialswith completely equiaxed grains, this relationship is constant regardless of thedirection from which a specimen is taken. For materials exhibiting grain elonga-tion, this relationship is important in both the initiation and propagation of stress-corrosion cracks. From a purely geometrical point of view, the tendency forintergranular cracking (see Figure 20), which was the primary mode of failurein the alloys tested in this program, can be rated for a given alloy at constantstress level as shown in Table 22.
Table 22 RELATIVE SUSCEPTIBI LITY FOR INTERGRANULAR CRACKING
Product Shave Grain Direction Relative Susceptibility
Billet Transverse Most Susceptible
Plate Transverse 2nd Most Susceptible
Billet and Plate Longitudinal 3rd Most Susceptible
Therefore, the comparison of product shapes with respect to stress-corrosionsusceptibility of a given material using the U-bend specimen configuration canonly be evaluated in this program from longitudinal grain direction specimens.Such a comparision (see Table 14) revealed that plate materials are less sus-ceptible than billet materials. D6AC was an exception in which the longitudinalspecimens from the billet were less susceptible than similar specimens from theplate. This contradiction for the D6AC alloy can be related to grain size andstress level. The average ASTM grain size for the plates and billets of 4335M,4340, and H-11 was 8 and 9, while the billet material of D6AC had an ASTMgrain size of 6 and the plate had 10. This smaller grain size of the plate materialmost likely had the greatest effect on increasing the initiation rate of intergranularcracking.
The relative susceptibilities of the materials after alternate-immersion testingwere not always duplicated in the Seattle semi-industrial environment. Thisdisparity appears to be partially traceable to variations in rainfall, in which thegreatest number of failures occurred during the relatively dry summer months.These summer failures may be due to more severe testing conditions caused byalternate wet and warm dry periods. However, there were instances wherethese differences in semi-industrial failure tendencies were due to some unknownenvironmental factors. For example, significant variations in temperature orhumidity over a 24-hour period could be encountered in the natural environmentthat would not be indicated in a consideration of average conditions. The alter-nate-immersion method of stress-corrosion tesing does provide a laboratorytest method of indicating highly stress-corrosion-susceptible materials andprocesses. Final comparative evaluation of any material would depend on judg-ment and experience with a material with a known service performance.
58

1000i 1000
KEYT TRANSVERSEL LONGITUDINALB BILLET
10 P PLATE 10
0 1 I T(B) T(P) L(SP) T(b) T(P) LBp
GRAIN DIRECTION GRAIN DIRECTIONA. 4340
B. 4335M
10001 1000
10 10
0 0
GRAIN DIRECTION GRAN DICTIOC. DWA 0. H-il
Figure 20 DEPENDENCE OF INTERGRANULAR CRACK ING ON GRAIN DIRECTION
59

The increase in the stress-corrosion susceptibility with increasing heat-treatstrength (Figure 10) hris been demonstrated by testing the billet alloys of AFC77, D6AC, 4335M, 4340, and H-11; the 18-7-5 billet alloy showed completeimmunity to stress-corrosion cracking in the 3.5-percent NaCl solution.
A semilogarithmic plot of stress-corrosion susceptibility versus yield strengthshows the relation to be somewhat linear for the AFC 77, 4:335M, and 11-11alloys while the D6AC alloy revealed a significant but nonlinear change in thesusceptibility over a small range in yield strength. The 4340 alloy revealed amaximum susceptibility at the 220- to 240-ksi ultimate strength range, which isin the "500-degree embrittlement" tempering temperature range. This embrittle-ment is related to formation of platelet cementite, which increases notch sensiti-vity and probably produces a stress-corrosion-sensitive path (Reference 6).
There appears to be some correlation between the change in susceptibility withyield strength and the change in yield strength with tempering temperature. Forthe AFC 77, 4335M, and H-11 alloys showing the near-linear change in suscepti-bility plotted in Figure 10, the curves of yield strength versus tempering temper-ature (Figures 11, 14, and 16, respectively) had negative increasing slopes.In the case of D6AC alloy, which did not show a linear change in susceptibility,the yield strength versus tempering temperature curve had a negative decreasingslope, as shown in Figure 13. The factors that control these curves have not beencompletely defined but are likely related to the change in the tempering productsand their distribution with temperature.
Tl'ere was a nearly direct correlation between the notch-to-unnotched ultimatestrength ratios (N/UN) and the stress-corrosion susceptibilities for the D6AC,4335M, and H-11 alloys. A low ratio (usually corresponding to high strength)indicated an increase in susceptibility. The 4340 N/UN ratios at the 272- and242-ksi ultimate strengths were the same, whereas the 242-ksi-strength materialwas slightly more susceptible because of temper embrittlement. The AFC 77alloy was an exception in which the ratio was nearly constant over the temperingrange of 900 to 1300"F, while the stress-corrosion susceptibility decreasedsignificantly with increasing tempering temperature. Previous stress-corrosion-susceptibility tests (Reference 1) on 4340, 4340M, 4330M, and 11-11 revealedthat these materials stressed to 90-percent of the yield strength were immuneto failure in 1000 hours when the notch-to-unnotched ratios were greater than1.20. The present results have shown the critical ratio is between 1.25 and1.35 for 4340, 4335M, H-l1, and D6AC alloys tested at 80 percent of theiryield strength. Consequently, there appear to be critical ratios above which thelow-alloy steels will exhibit immunity to stress-corrosion cracking in 1000 hoursin a 3.5-percent NaCl solution at stress levels not exceeding 90 percent of theyield strength. The AFC 77 stainless steel at 80 percent of yield revealed acritical ratio of 0.73. while the 18-7-5 maraging steel had no failures above aratio of app oxlmately 0.90. The lower ratios of AFC 77 and 18-7-5, as com-pared to 4 .0, 4340M, 4330M, and H-II alloys, may likely be associated with
60

small differences in chemistries and microstructures. These comparisons weremade from notched data obtained when using the small billet notched tensile con-figuration shown in Appendix I. Since data from the small configuration arcoften complicated by net section yielding effects,, a limited amount of data wasobtained from 4340 billet using a larger notched specimen. An analysis of thislatter configuration was presented in the previous report (Reference 1). These4340 large notched tensile results also showed that an increase in the N/UN ratiofrom 0. 34 to 0. 78 corresponds to a decrease in stress-corrosion susceptibility.The latter ratios would always be lowei than 1. 0 since the large notched tensileultimate strengths are less than the smooth tensile yield strength.
The stress-corrosion susceptibility as a function of the ultimate strength levelsfor AFC 77, D6AC, 4335M, 4340, and H-11 alloys was not directly related tothe measured residual surface stresses shown in Table 8. Although the resultantsurface stresses could be determined by adding the residual surface stressesand applied stresses, no correlation was found between these resultant stressesand susceptibility to failure. Comparison of the failure times with correctedstress levels for these alloys was inconclusive. Complicating such an attemptedcorrelation are variations introduced by the small depth (<0. 002 inch) to whichthe compressive residual surface stresses extend.
With the additional tempering treatments of AFC 77 at 800 and 1000°F, the stress-corrosion tests revealed that the susceptibility slightly Increased from 800 te9000F and then decreased from 900 to 13006F (see Figure 11). This maximumsusceptibility due to tempering at 900°1F occurred where the alloy exhibited maxi-mum yield strength. The N/UN ratios did not correlate with the susceptibilitiesover the entire tempering temperature range. The ratio was constant from 800to 1000°F, and then showed a slight decrease at 1200°F followed by an increaseat 13000F. The total change of N/UN for the entire temperature range wasonly 0.1.
The evaluation of the alternate heat-treating processes designated as DADF andaltered SCT 850 on AM 350 and AM 355 was only possible with the AM 355 alloy.The AM 350 alloy resisted stress-corrosion cracking with all heat-treatingprocesses.
For the 0.060-inch AM 355, the standard SCT 850 condition was more susceptiblethan either the DADF or the altered SCT 850 condition, in which the controllingfactor appears to be the carbide distribution. Volume percentages of the deltaferrite phase for each heat treatment of AM 350 and AM 355 were determined bylineal analysis and are shown in Table 23.
In the present study, the stress-corrosion failures of AM 355 were almost com-pletely intergranular with a noticeable amount of carbides present on the grainfaces. Carbides were also found adjacent to the delta ferrite regions, whichwere located primarily within the individual austenite grains (see F'gure 21,Page 65).
61

Tabie 23 VOLUME PERCENT DELTA FERRITE IN AM 35o AND AM 31,5
AHeat S Volume PercentAlloy She-et Gage Treament Delta Ferrit~e
AM 350 A1 0.042 SCT 850' 11.3A2 0.060 SCT 850 16.5A2 0.060 DADF 18.2A2 0 00'3 SCT 850* 17.5B 0,078 SCT 850 17.8
F 0.020 SCT 850 7.1
AM 355 C 0.060 SCT 850 2.0C 0.060 DADF 3.0C 0.060 C T 50 2.0D 0.020 SCT 850 2.0
Because of the small percentages of delta ferrite present, the difficulty in opticallydetermining the phases present, and the large differences in yield strength amongthe various treatments, the lower stress-corrosion susceptibility of the DADFand altered SCT 850 conditions on AM 355 compared to the standard SCT 850 can-not be completely explained. Indications were, however, that a greater amountof carbide precipitation occurred at the grain boundaries after the standard SCT850 treatment and, hence, contributed to increased stress-corrosion susceptibility.
The decrease in the stress-corrosion susceptibility of the martempered specimensof 4335M and 4340 compared to oil-quenched specimens agrees with the coclusionsreported by Bloom in a study of martempering 410- and 431-type stainless steels(Reference 7). Bloom predicts this decrease in susceptibility becauce of thereduction of residual stresses through martempering. However, previousresults (Reference 1) from martempering 4340 at temperatures ranging from450 to 8006F produced susceptibilities equal to or greater than the quench andtempered treatments. The notch-to-unnotched ultimate strength ratios for mar-tempered specimens were higher, in both the present and prior studies, comparedto oil-quenched specimens. The reversal in stress-corrosion results betweenthe two programs may be due to differences in chemistry, since the previous mar-tempering and oil-quenching studies involved different heats. Evaluation in thepresent study was based on data from one billet.
The ultimate strength of 200 ks. produced by austempering 4340 and 4335M at6000F did not produce stress-corrosion-susceptible conditions. Similar strengthsproduced through oil quenching and tempering of these alloys were also stress-corrosion resistant; therefore, the lack of failures in both cases precludes the
Altered SCT 850 condition.
62

possibility of evaluating the effect of a bainitic structure on stress-corrosionsusceptibility. The lower notch-to-unnotched ratio for the bainitic structureindicates that it may be more susceptible than a tempered-martensite structure.
Since the simulated mill annealing treatments of 4340 and 4335M used in thisprogram are additive to the actual treatments used in the processing of the billetsat the steel companies, their effect on the stress-corrosion susceptibility can-not be truly evaluated. The failure times of these steels after mill annealingranged over larger time periods than before mill annealing, which makes theevaluation of the relative susceptibilities difficult. The holding treatment wasmore detrimental than the cycling treatment for 4335M, while in 4340 bothtreatments had approximately the same range in failure times. The most signifi-cant effect observed from these treatments was the increase in the notch sensiti-vity from the holding treatment, which the smooth tensile specimens failed nearthe treads. X-ray diffraction analysis revealed approximately 4 volume percentretained austenite in the specimens that had been held at 1600°F, while therewere no such indications from the 600 to 1200°F cycling heat treatment. Also,from electron microscopy studies, small regions near the prior austenite grainboundaries resembled retained austenite according to the work by Pelliessier(Reference 8). This retained austenite would increase the notch sensitivity ofa material, which in turn would indicate increased stress-corrosion suscepti-bility. Although the present results are not conclusive, they do, however, pointout that mill processing may be very influential on stress-corrosion susceptibility.
The variations in stress-corrosion susceptibility caused by ausforming, wheresusceptibility may be increased or decreased (see Table 16), apparently dependson material chemistry. The behavior of ausformed D6AC, 4335M, and 4340,compared to these materials in the nonausformed condition, indicates that priormill processing may be of more significance than chemistry. The only meansof determining which is of more importance would be to obtain billets of com-parison materials that have received identical processing from the melt.
Cold deformation of heat-treated specimens by small amounts appears to have aslightly beneficial effect on the stress-corrosion susceptibility of AM 355, 4340,and H-11. There was a slight tendency for the susceptibility of 4340 and H-11to decrease at 0.5-percent strain and then to increase at 1. 0-percent strain.This was more evident in the AM 355 results in which 1.0-percent strainprovided complete immunity to stress-corrosion cracking. AM 355 that wasnot deformed failed within 478 hours and after deforming 3.0 percent providedfailures in two out of three specimens. The conclusions of Robertson andTetelman (Reference 5) and Swann and Nutting (Reference 9) seem to providean explanation for this behavior. It seems probable that in this situation thefirst effect of cold working was to increase the number of potential sites at thesurface for the initiation of cracking. With the larger number of potential cracks
forming, dissolution along any one of them would be slowed, which would decreasethe susceptibility. As the amount of cold strain increases, the stress buildup due
63

to piled up dislocations at particular regions would be great enough to cause moreselective potential crack sites and increase the likelihood of stress-corrosioncrackinC. Although these factors were not directly observed, this seems to bea reasonable explanaton since there were no indications of the mode of crackingchanging with deformation.
The variations of stress-corrosion susceptibility resulting from the mill anneal-ing treatments, ausforming, and heat-treatment variations are shown in Figures22, 23, and 24. These three graphs contain all the information so lar mentionedand relate the alloy forms and strength level to stress-corrosion susceptibility.However, it must be kept in mind that the results reported for a particular steelare from only one heat and comparison to other steels may be complicated bymill history in addition to chemistry differences. These graphs show 18-7-5steel to be the most satisfactory billet material at yield strengths ranging from200 to 272 ksi. The most satisfactory low-alloy steels within the 200- to 240-ksi yield range were martempered 4335M and D6AC. At yield strengths below200 ksi, the H-11, 4335M, and 4340 billets seemed to be equally resistant. AFC77 was very susceptible to stress corrosion except at a low yield strength of 140ksi.
Evaluation of the plate materials again shows 18-7-5 to be highly stress-corrosionresistant at the high yield strength of 240 ksi. This resistance to failure at ahigh yield strength was also exhibited by the hot/cold-worked 9Ni-4Co. The low-alloy steels D6AC, 4340, and H-11 were all susceptiblP but they could not becompared because of the widely varying yield strengths. At a yield strengthnear 210 ksi, 9Ni-4Co (0.26C) and 4335M were equally resistant, but the 9Ni-4Co (0. 38C) that had received an unsatisfactory mill annealing treatment wasvery prone to failure. It was mentioned in an earlier portion of this discussionthat lowering the billet N/UN ratio generally indicated increased stress-corrosionsusceptibility. A similar reLationship was revealed by comparing plate and billetfracture toughness properties with tendency to fail in a 3.5-percent NaCl solution.A plot of logarithmic times-to-failure versus fracture toughness is given inFigure 25. Those materials having the lower fracture toughness usually had theearliest failure times. One exception to this was shown by the 17-4PH alloy,which did not fail even though it had a relatively low fracture toughness. Com-parison of the fracture toughness for the billets and plates of 4335M, 4340, and18-7-5 revealed the plates to be slightly superior to the billets, which agreeswith the stress-corrosion susceptibilities. More extensive fracture toughnesstesting is necessary to determine any critical toughness values for stress-corrosion-cracking immunity. Of particular interest is a comparison betweenthe 18-7-5 and 18-9-5. The stress-corrosion resistance and fracture toughnessof the former was much higher. No 18-7-5 stress-corrosion failures occurred,but the 18-9-5 material cracked very rapidly (in less than 1 hour). The 4340billet large notched tensile specimen fracture toughness (Kic) values reportedin Table 11 also show that an increase in fracture toughness corresponds to adecrease in stress-corrosion susceptibility.
64

2300X
p ,
/ 1!
)
I j //
/
//
D I0
Figure 21 ELECTRON MICROGRAPH OF AM 355 IN THE DADF HEAT TREAT CONDITIONNOTE THE ISLANDS OF DELTA FERRITE OUTLINED BY CARBIDES
Q..
0 ,o
ZKEY v -_
'o Ano
t• WILL ANNEALED AT 1600°F
a AUSFORMED AT 1500°Fb AUSFORMED AT 1200OFc AUSFORMED AT 1000°F
140 1 60 180 200 220 240 260 280YIELD STRENGTH (KSI)
Figure 22 RELATIVE STRESS-CORROSION SUSCEPTIBILITY OF BILLET MATERIALSALL STEELS STRESSED TO 80% OF YIELD
65
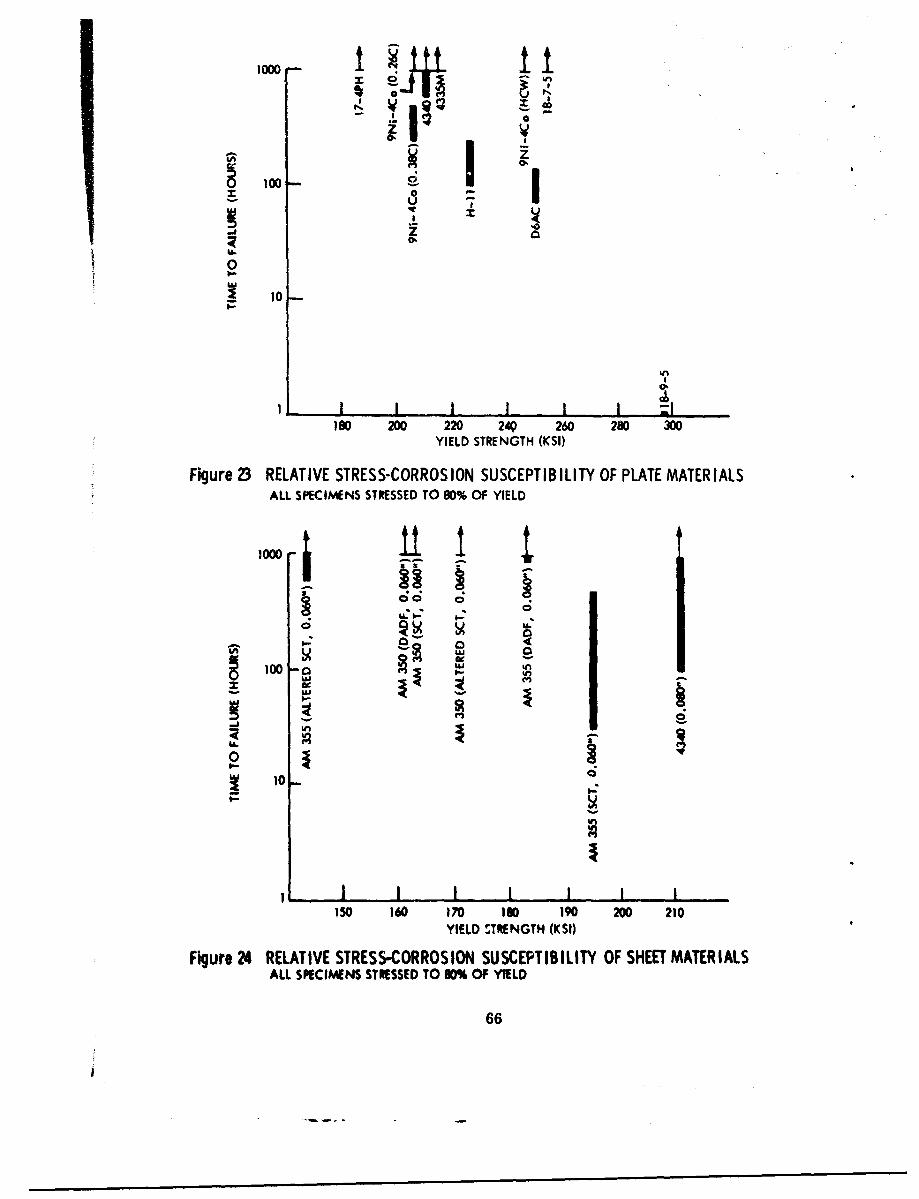
1000 tIIF.
Nz
lo
00
u
II.
0
S 10
1 I I I I I :1
180 200 220 249 260 280 300YIELD STRENGTH (KSI)
Figure Z3 RELATIVE STRESS-CORROSION SUSCEPTIBILITY OF PLATE MATERIALSALL SPECIMENS STRESSED TO 80% OF YIELD
10001 jI
lOo I.- I .-100uii
10-
150 160 170 180 190 200 210YIELD STRENGTH (KSI)
Figure 24 RELATIVE STRESS-CORROSION SUSCEPTIBILITY OF SHEET MATERIALSALL SPECIMENS STRESSED TO 10% OF YIELD
66

KEY
PLATE BILLETT Fz EQ
70 V 18-7-5(S)xwU 9Ni-4Co (W) /s (0.26C) /
/60 -
6/ 4335M(U)
//
50 -
40
/NC4335M(E)z
// OD6AC(T) -
0 4340(F)- / 4340(V)
u //
a-
/ /43S(E/ /
20 , 31o /
S / / / 17-,PH(Q)/ H-l1(fZ) ,/
/ /i /
/10 /
18-9-5(M)/
/I ,' I
I10 100 1000
TIME TO FAILURE (HOURS)
Figure 25 RELATIONSHIP BETWEEN STRESS-CORROSION SUSCEPTIBILITY ANDFRACTURE TOUGHNESS
67
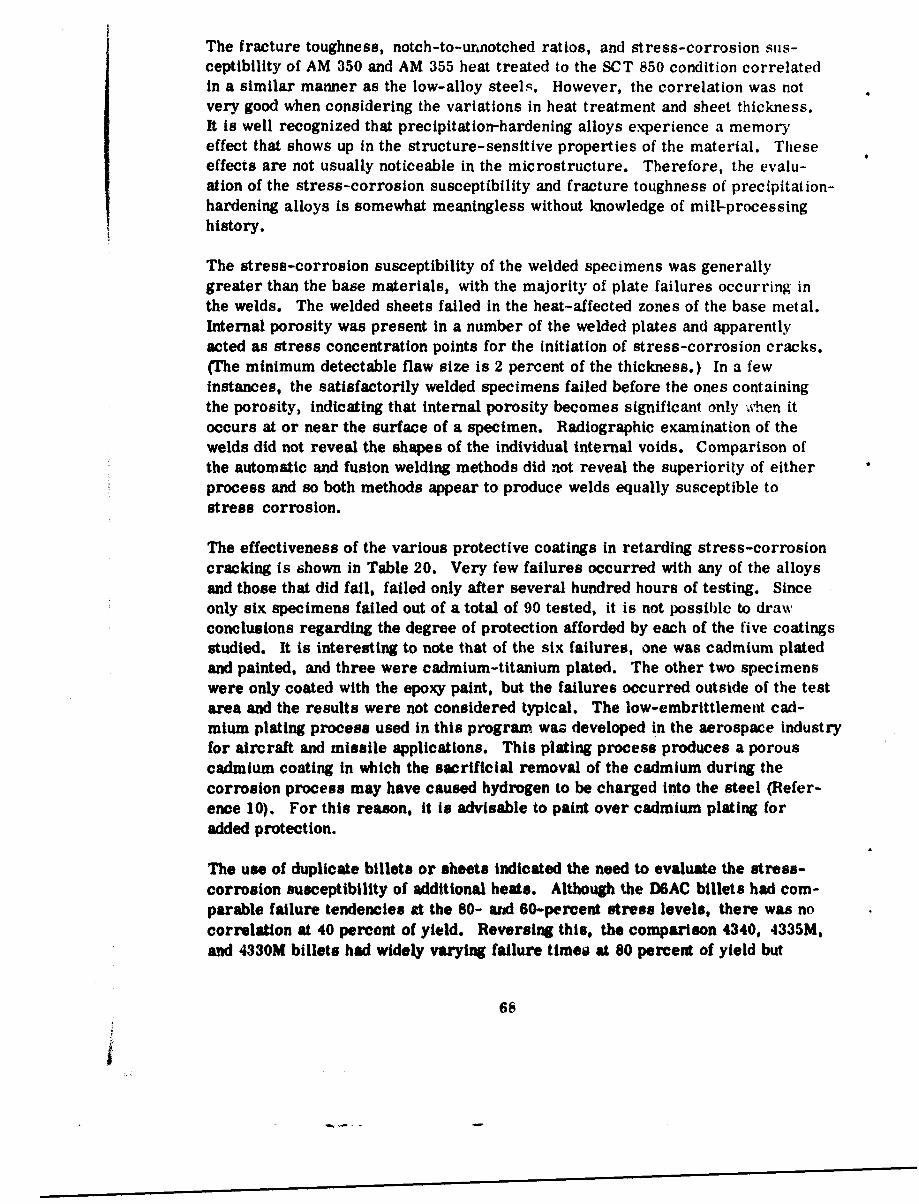
The fracture toughness, notch-to-unnotched ratios, and stress-corrosion sus-ceptibility of AM 350 and AM 355 heat treated to the SCT 850 condition correlatedin a similar manner as the low-alloy steels. However, the correlation was notvery good when considering the variations in heat treatment and sheet thickness.It is well recognized that precipitation-hardening alloys experience a memoryeffect that shows up in the structure-sensitive properties of the material. Theseeffects are not usually noticeable in the microstructure. Therefore, the evalu-ation of the stress-corrosion susceptibility and fracture toughness of precipitation-hardening alloys is somewhat meaningless without knowledge of mill-processinghistory.
The stress-corrosion susceptibility of the welded specimens was generallygreater than the base materials, with the majority of plate failures occurring inthe welds. The welded sheets failed in the heat-affected zones of the base metal.Internal porosity was present in a number of the welded plates and apparentlyacted as stress concentration points for the initiation of stress-corrosion cracks.(The minimum detectable flaw size is 2 percent of the thickness.) In a fewinstances, the satisfactorily welded specimens failed before the ones containingthe porosity, indicating that internal porosity becomes significant only when itoccurs at or near the surface of a specimen. Radiographic examination of thewelds did not reveal the shapes of the individual internal voids. Comparison ofthe automatic and fusion welding methods did not reveal the superiority of eitherprocess and so both methods appear to produce welds equally susceptible tostress corrosion.
The effectiveness of the various protective coatings in retarding stress-corrosioncracking is shown in Table 20. Very few failures occurred with any of the alloysand those that did fail, failed only after several hundred hours of testing. Sinceonly six specimens failed out of a total of 90 tested, it is not possible to drawconclusions regarding the degree of protection afforded by each of the five coatingsstudied. It is interesting to note that of the six failures, one was cadmium platedand painted, and three were cadmium-titanium plated. The other two specimenswere only coated with the epoxy paint, but the failures occurred outside of the testarea and the results were not considered typical. The low-embrittlement cad-mium plating process used in this program was developed in the aerospace industryfor aircraft and missile applications. This plating process produces a porouscadmium coating in which the sacrificial removal of the cadmium during thecorrosion process may have caused hydrogen to be charged into the steel (Refer-ence 10). For this reason, it is advisable to paint over cadmium plating foradded protection.
The use of duplicate billets or sheets indicated the need to evaluate the stress-corrosion susceptibility of additional heats. Although the D6AC billets had com-parable failure tendencies at the 80- and 60-percent stress levels, there was nocorrelation at 40 percent of yield. Reversing this, the comparison 4340, 4335M,and 4330M billets had widely varying failure times at 80 percent of yield but
68

were nearly the same at the 60- and 40-percent levels. The need for testingmore than two heats is particularly evident when studying the 11-li air-meltand vacuum-melt results. Data so far indicate vacuum-melt 11-11 is noticeablyless susceptible to stress corrosion than air-melt H-11, but the difference maybe due to trace alloy additions rather than the method of melting. No explanationcan be given as to why the 0.20-gage AM 355 had such erratic failure times atall stress levels. Since the occurrence of the 0. 060-gage AM 355 fracture wasstrongly dependent on stress levels, it appears that sheet thickness was less ofa factor than mill-processing history in the stress-corrosion susceptibility ofthe thinner sheet. This indicated sensitivity to prior processing treatmentsagain shows a need to know the complete background of a material when evalu-ating stress-corrosion results.
B. FRACTURE ANALYSIS OF STRESS-CORROSION CRACKING IN ALLOYSTEELS
During the past few years, the study of fracture characteristics has been intensi-fied with the utilization of the electron microscope. Replicas taken from selectedfractures, produced by stress-corrosion and fracture toughness specimen failures,have been studied at magnifications ranging from 2000X to 10, OOOX. It is fromthese investigations that much of the information on fracture characteristics hasbeen obtained. The main efforts in this program were directed toward deter-mining the modes of fracture (whether transgranular or intergranular), the pre-sence and distribution of precipitate particles, and the changes in fracture appear-ance with rate of crack growth.
A summary of the fracture face studies is contained in Table 24. Here it isshown that the majority of fractures originated by intergranular cracking. Theonly exceptions were the transgranular cracking of 4335M billet, which had beenmill annealed at 1600-F, and the combination of intergranular and transgranularcracking in 18-9-5 plate. The grain sizes of the steels were determined fromoptical microscope studies. The new etchant that had been used to bring out thelow-alloy-steel grain boundaries proved to be very satisfactory when used on4340, 4335M, and D6AC. Although this reagent could be used on the H-11 steels,the uniformity of etching was not as complete and study of cracking at the fracturefaces was limited.
The fracture surfaces of the stress-corrosion specimens included an origin areaand a rapid fracture area. The stress-corrosion origins were characterized bysemicircular corroded areas adjacent to the tension surface. (Examples aregiven in Figures 26 through 29.) Generally, the macro fracture appearances ofall alloys were reminiscent of H-11 fracture surfaces shown in Figure 26. Inall cases the origin area, regardless of its size, revealed a granular texturewhile the rapid fracture regions were typified by a fibrous texture with chevronmarkings radiating from the origin (see Figures 27 and 28). Product form didnot seem to influence the fracture appearance of the stress-corrosion failures,except for the plate of 4340 which revealed definite grain orientation effects
69

Table 24 'STRESS-CORROSION FRACTURE MODESStrenkth Fracture
Alloy Weight Yield Mode Grain Size&QlX Form Heat Treatment Mil Mil origin) (ASTM)
AFC 77 B Standard 255 208 1-B Standard 220 168 1
AFC 77 B Special OO0 0 F Temper 241 197 1
1B Special 10900F Temper 257 200) 1 -
LAdisb D6AC B Standard 285 2j3 1 6B Standard 242 216 1 6B Special - Ausfor med
at 15007F 301 261 1 6P Standard 278 252 1 10
4335-M B Standard 257 221 1 8B Standard 234 205 1 8B Special - Mill Annealed
at 16007F 270 - T 8B Special - Mill Annealed
at 600-12007F 260 220 1 8B Spec ial - Aufor med
at 15W0F 266 230 1 8P Standard 252 214 1
4340 B Standard 273 215 1 8B Standard 242 205 1 8B Special - Auhlormed
at 15000F 308 258 1 aB Special - Ausformed
at 12007 298 251 1 8b Special - Ausformed
at 10007 287 242 1 8P tandard 266 211 1 9
4330 8 Standard 229 197 1 -
M-11 B Standlard 279 224 K 9P Standard 260 225 1 9
1849-5 P Standard 304 299 l+T -
ONI-4Co P Standard -220 -205 1 -
AN 365 8 andakrd 22 1,5 1 68 Spcla- DDF 2n0 184 68 Specal-OCT' 19? 143 4
a swe1t T' TramevsadP plate M marflperd5 shot DAW 1Dmb A#e, Ibabl FresoI Intergranular SC?' Aiste SC? Proess
70
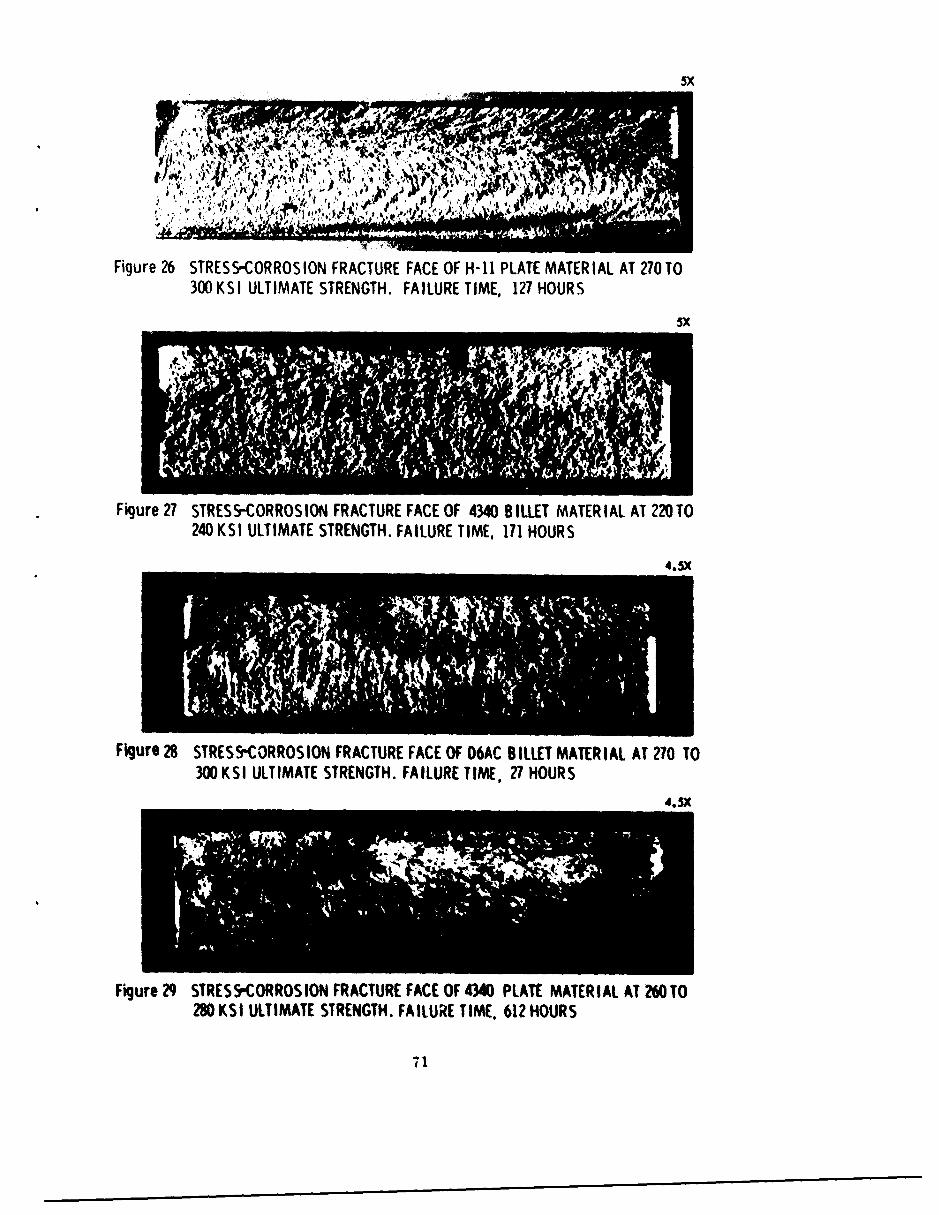
5X
Figure 26 STRESS.CORROS ION FRACTURE FACE OF H-i1 PLATE MATER IAL AT 270 TO300 KSI ULTIMATE STRENGTH. FAILURE TIME, 12? HOURS
5x
Figure??7 STRESS-CORROS ION FRACTURE FACE OF 4340 B ILLET MATER IAL AT 220 TO240 KSI ULTIMATE STRENGTH. FAILURE TIME, 171 HOURS
4.5X
A 'A
Figure 28 STRESS-CORROSION FRACTURE FACE OF D6AC BILLET MATERIAL AT 210 TO300 KSI ULTIMATE STRENGTH. FAILURE TIME, 27HOURS
Figure 29 STRESS'CORROSION FRACTURE FACE OF 4340 PLATE MATERIAL AT 260 TO280 KSI ULTIMATE STRENGTH. FAILURE TIME, 612 HOURS
75

(Figure 29). The only effect observed from the variations in heat treatment ofa given alloy was an increase in the roughness of the rapid fracture regions withdecreasing strength level. One exception was the billet specimens of 4340, whichshowed greater susceptibility at the 240-ksi strength.
The fracture faces from all alloys revealed shear lips along the tension -urfaceaway from the origin area. The size of the shear lips depended on the suscepti-bility of a material in which the more susceptible alloys such as AFC 77, D6AC,and 18-9-5 revealed very small shear lips. H-11, although not one of the moresusceptible alloys, also revealed very small shear lips as well as small originareas. The size of the origins was usually consistent for a given material withno indications of a relationship between susceptibility and origin size.
The stress-corrosion cracks propagated perpendicular to the direction of loadingin every alloy except the ausformed materials in which the origin occurred at anangle of approximately 45 degrees to the tension axis. The reason for this changeis not completely understood, but it is probably related to the rolling textureproduced during the hot/cold working. Microstructure examination did showdefinite grain elongation in the direction of rolling.
Microfractographic examination of the stress-corrosion failures revealed thatcracking occurred primarily along prior austenite grain boundaries as shown inFigures 30 through 34. The fracture surfaces revealed signs of corrosion thatin some cases, especially in H-11 (see Figure 30), altered the surface to theextent of masking the mode of failure. The AFC 77 and D6AC alloys showedsigns of secondary phase particles rutlining the grain boundaries. These AFC77 particles are shown in Figure 32. The particles were not identified in theAFC 77 alloy butX-ray diffraction revealed the carbides in D6AC to be Cr 2 C3 .
The fraclographs from the ausformed specimens produced an interesting observa-tion for the process of cracking in the U-bend specimen configuration. The signifi-cant aspect of stress-corrosion cracking in the ausformed 4340 specimens isshown in Figures 35, 36, and 37. Figure 35 was taken from the origin area verynear the tension surface. Notice the sharpness of the grain boundaries. Figure36 was taken from the center portion of the origin area and shows that the inter-section of the grain faces is becoming rounded. On the outer perimeter of theorigin region the intergranular nature of the failure is less distinct because of theextreme rounding of the prior grain boundary areas, shown in Figure 37. Theincreasing amounts of material dissolution with crack extension indicate that thepropagation rate of cracking decreases with increasing crack depth. The factorsthat govern the propagation rate of stress-corrosion cracks have not been esta-blished; consequently, no detailed explanation can be given at the present time.
The rapid fracture regions were characterized by some dimple formation, whichis typical of ductile rupturing, and traces of intergranular cracking as shown AnFigure 38. The amount of dimpling increased as the strength level decreased inall of the billet alloys except the 4340 alloy, which wau heat treated in the 500F
72

F i g u e 3 E L C I R O F R C I O R A P H O F N T E G R A N L A R C R A K I N I N H -I
Fiure 30 ELECTRON FRACTOGRAPH OF INTERGRANULAR CRACK I NG IN H-11BILLET MATERIAL AT 27TO 00 K sI HEAT TREAT STRENGTH RANGE
73

I 900x4;&, ~
i .
P-~*~ wla
~jt-bV
1--.7
-- 5VI
*,,- gk IN
Figure 32 ELECTRON FRACTOGRAPH OF INTERGRANULAR CRACK ING IN A34C P7LETMATER IAL AT 250 TO 270 KS51 HEAT TREAT STRENGTH RANGE
NOTE SMALL GRAIN SIZE
74

2550X
Figure 34 ELECTRON FRACTOGRAPH OF INTERGRANULAR CRACKING IN 9Ni-4Co PLATEMATER I AL AT 250 TO 270 K S I HEAT TREAT STRENGTH RANGENOTE CORROSION PRODUCT ON FRACTURE SURFACE
190OX
Figure 35 FRACTURE SURFACE AT ORIGIN NEAR TENSION SURFACE IN AUSFORMED 4340NOTE SHARPNESS OF PRIOR AUSTENITE GRAIN BOUNDARIES
75)
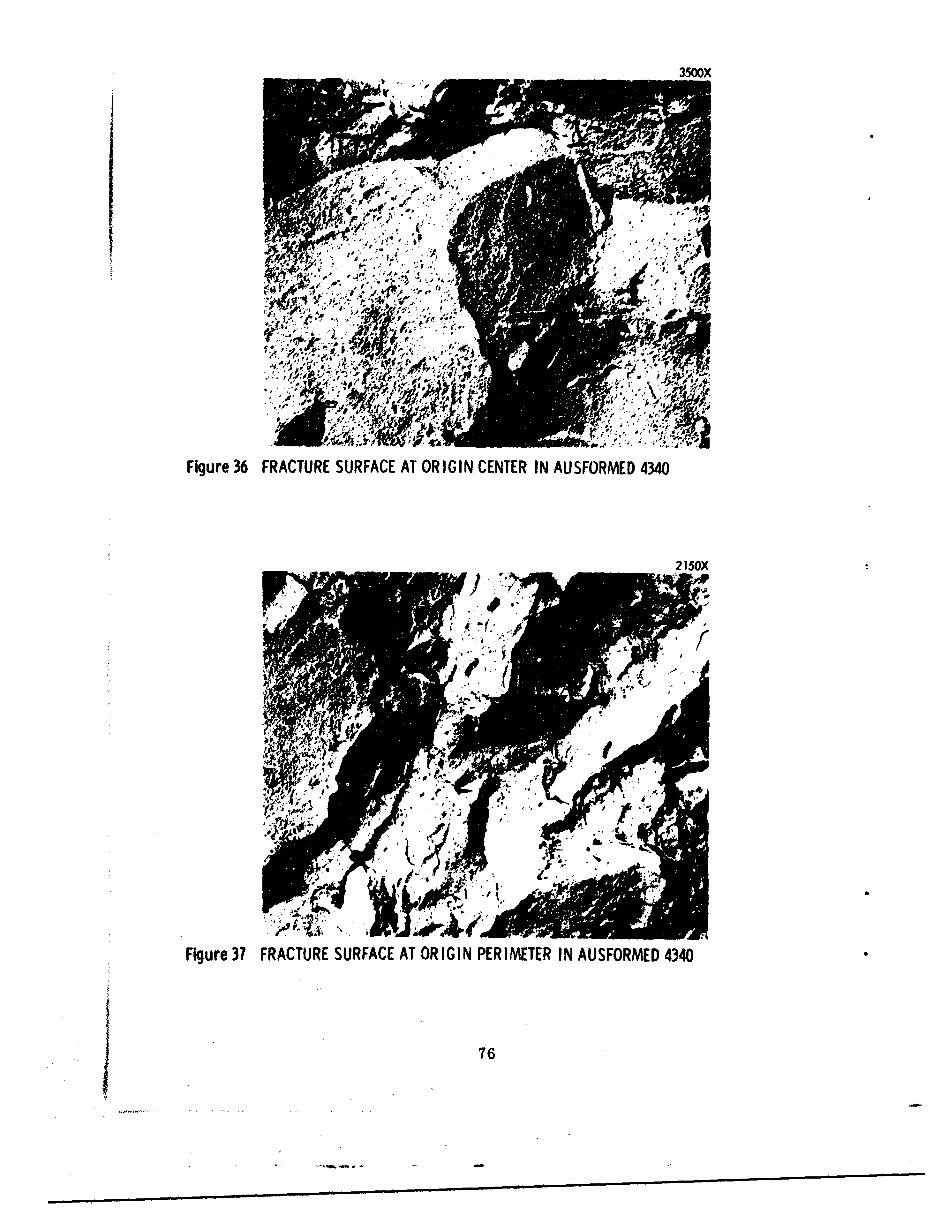
06.
.- It
Figure 36 FRACTURE SURFACE AT ORIGIN CENTER IN AUSFORMED 4340
2150)(
..o
Figure 37 FRACTURE SURFACE AT ORIGIN PERIMETER IN AUSFORMED 4340
76

embrittlement range at the 240-ksi strength range. In the plate materials, thealloys that revealed the greatest ductility also revealed the greatest amount ofdimple formation in the rapid fracture regions. This is shown in Figure 39 forthe 9Ni-4Co alloy.
Optical microscopy studies were used primarily to determine grain size and modeof failure. Phase distribution determinations were not possible because of themicrostructural complexities of alloy steels. However, some interesting aspectswere noted in the stress-corrosion specimens. The optical microscope studiesshowed that cracking in the 4340, D6AC, and 4335M steels originated inter-granularly, but that any transgranular cracking was difficult to identify. Exami-nation of the 0.250-inch (thickness) dimension of the stress-corrosion specimensindicated that the grains in these steels were equiaxed, but bands of slightlysmaller than average grains were noted in 4340 that were parallel to the originalbillet longitudinal grain direction. The grains in the 4340, 4335M, and D6ACausformed steels were slightly elongated in the direction of rolling. The bandingin 4340 and elongated grains in D6AC are shown in Figures 40 and 11, respectively.
Optical microscopy showed both the AM 355 and 4340 sheet stress-corrosionfailures to be intergranular both in the origin and in the rapid-fractiu e regions.One surprising effect of altering heat treatments of AM 355 was the grain growthdue to raising the SCT temperature by 50°F during the annealing process. Thiseffect on stress-corrosion susceptibility could not be directly determrr.ned sincethis treatment had a much lower strength than that which had received the normalSCT treatment.
The macro fracture appearances of the fracture toughness specimens is shownin Figure 42, in which the total shear lip area of each specimen is related to thefracture toughness (see Appendix 11). As previously noted, the stress-corrosionsusceptibility of the materials decreased with increasing fracture toughness.The textures of theplane-strain areas (see Appendix II for description of termi--nology) varied between the various alloys and were not directly related to thetexture from the stress-corrosion specimens.
The microfractography from the fatigue regions on the fracture toughness speci-mens revealed typical fatigue striations from all alloys. These striations werefaint and difficult to observe in a number of cases. Typical examples are shownin Figures 43 and 44. The interface between the fatigue region and the plane-strain region was sharp and easily observed in the electron microscope (Figure45). An interesting observation was noted in the fatigue regions of 4340 and 4335Mspecimens, In several areas, cracking followed prior austenite grain boundaries,resulting in localized intergranular failures (Figure 46). This type of failure isdistinguished from intergranular stress-corrosion or hydrogen-embrittlementfailures by the association of fatigue striations adjacent to the intergranular areas.The fatigue region from the 17-4PH specimens exhibited areas of crack propa-gation by cleavage (Reference 11) shown in Figure 47. The reason for the occur-rence of cleavage during fatigue is not immediately obvious.
77
350OX
I
Figure 38 FRACTURE APPEARANCE OF THE RAPID CRACK REGION FROM A STRESS-CO. "OS ION SPECIMEN OF D6ACNOTE INTERGRANULAR TENDENCIES
350OX
Figure 39 FRACTURE APPEARANCE OF THE RAPID CRACK REGION FROM A STRESS-CORROSION SPECIMEN OF 9Ni-4Co
78
mU=,==

'fox
Figure 40 MICROGRAPH OF BANDING IN 4340 BILLET MATERIAL-ADS ETCH
50OX
.. .'
tt
Figure 40 MICROGRAPH OF GAIIN RINTAIO BILE ATFEAL-ADS ETCH
79
* ,40 ,*
S .. .t, " ... ,,.. ,' "V ..* ,
• . .,, ..,. ..
-', _ at :-, ',
t* "' " " , ,
Figure 41 MICROGRAPH OF GRAIN ORIENTATION IN AUSFORMED D6AC-ADS ETCH
79

5X
D6ACL
T
L
KEY1' TRANSVERSE GRAIN DIRECTION
I L LONGITUDINAL GRAIN
4335M DIRECTION
1.5X
9H1-CoA. (O.3SC)
WI. c
T (46h
L O2C
T 1644.
Flgur 42 FRACTURE FACES OF THE FRACTURE TOUG$*SS SPEC IMS FM PLATEMATERIeALSso

350OX
FigureQ4 MICROFRACTOGRAPHIC APPEARANCE OF FATIGUE IN 9Ni-4Co
19*o
Figure 44 MICROFRACTOGRAPHIC APPEARANCE OF FATIGUE IN 18-7-5
e%

F~gure 45 MICROFRACTOGRAPHIC APPEARANCE OF INTERFACE BETWEEN FATIGUE ANDPLANE-STRAIN REGION IN 9Ni-4CoNOTE THAT ELONGATION OF DIMPL.ES IS IN DIRECTION OF CRACK PROPAGATION, ASEXPECTED FROM STATE OF STRESS
~II
Figure 46 MICROFRACTOGRAPt. IC APPEARANCE OF FATIGUE IN 035MNOTE LOCAL INTERGRANULAR CRACKING
82
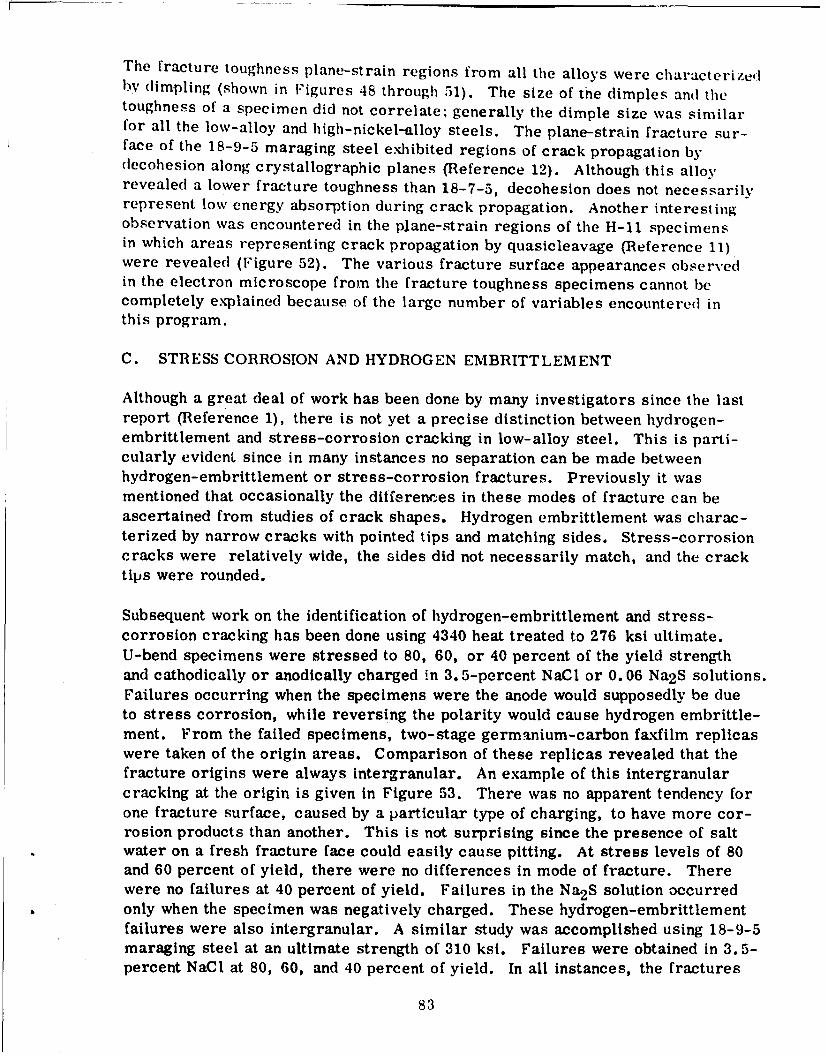
The fracture toughness plane-strain regions from all the alloys were characterizedby dimpling (shown in lFigures 48 through 51). The size of the dimples and thetoughness of a specimen did not correlate; generally the dimple size was similarfor all the low-alloy and high-nickel-alloy steels. The plane-strain fracture sur-face of the 18-9-5 maraging steel exhibited regions of crack propagation bydecohesion along crystallographic planes (Reference 12). Although this alloyrevealed a lower fracture toughness than 18-7-5, decohesion does not necessarilyrepresent low energy absorption during crack propagation. Another interestingobservation was encountered in the plane-strain regions of the H-11 specimensin which areas representing crack propagation by quasicleavage (Reference 11)were revealed (Figure 52). The various fracture surface appearances observedin the electron microscope from the fracture toughness specimens cannot becompletely explained because of the large number of variables encountered inthis program.
C. STRESS CORROSION AND HYDROGEN EMBRITTLEMENT
Although a great deal of work has been done by many investigators since the lastreport (Reference 1), there is not yet a precise distinction between hydrogen-embrittlement and stress-corrosion cracking in low-alloy steel. This is parti-cularly evident since in many instances no separation can be made betweenhydrogen-embrittlement or stress-corrosion fractures. Previously it wasmentioned that occasionally the differences in these modes of fracture can beascertained from studies of crack shapes. Hydrogen embrittlement was charac-terized by narrow cracks with pointed tips and matching sides. Stress-corrosioncracks were relatively wide, the sides did not necessarily match, and the cracktips were rounded.
Subsequent work on the identification of hydrogen-embrittlement and stress-corrosion cracking has been done using 4340 heat treated to 276 ksi ultimate.U-bend specimens were stressed to 80, 60, or 40 percent of the yield strengthand cathodically or anodically charged in 3.5-percent NaCl or 0.06 Na2S solutions.Failures occurring when the specimens were the anode would supposedly be dueto stress corrosion, while reversing the polarity would cause hydrogen embrittle-ment. From the failed specimens, two-stage germanium-carbon faxfilm replicaswere taken of the origin areas. Comparison of these replicas revealed that thefracture origins were always intergranular. An example of this intergranularcracking at the origin is given in Figure 53. There was no apparent tendency forone fracture surface, caused by a particular type of charging, to have more cor-rosion products than another. This is not surprising since the presence of saltwater on a fresh fracture face could easily cause pitting. At stress levels of 80and 60 percent of yield, there were no differences in mode of fracture. Therewere no failures at 40 percent of yield. Failures in the Na 2 S solution occurredonly when the specimen was negatively charged. These hydrogen-embrittlementfailures were also intergranular. A similar study was accomplished using 18-9-5maraging steel at an ultimate strength of 310 ksi. Failures were obtained in 3.5-percent NaCl at 80, 60, and 40 percent of yield. In all instances, the fractures
83

were a combination of intergranular plus some transgranular cracking. Anorigin, typical of both negative and positive charging, is shown in Figure 54.These 4340 and 18-9-5 studies indicated that although the causes of stress-corrosion and hydrogen-embrittiement fractures may be different, the modesof fracture are the same.27X
Figure 47 MICROFRACTOGRAPHIC APPEARANCE OF FATIGUE IN 17-4PHNOTE PRIMARY MODE OF FRACTURE 1S SY CLEAVAGE
Figur4 M ICROFRACTOGRAPH IC APPEARANCE OF THE PLANE- STRAIN REGION IN O~i -4Co
-- t 4.

LW I
Figure 49 MICROFRACTOGRAPHIC APPEARANCE OF THE PLANE-STRA IN REGION IN 18- 7-5NOTE THAT DIMPLES ARE SMALLER THAN IN QNi-4Co
Figure 50 MICROFRACTOGRAPHIC APPEARANCE OF THE PLANE-STRAIN REGION IN O6AC

51wQX
'00
I' <NFigure 53 FRACTURE ORIGIN PRODUCED BY ELECTROLYTICALLY CHARGING 4340
4 OOX
Figure 54 FRACTURE ORIGIN PRODUCED BY ELECTROLYTICALLY CHARGING 18-9-5
8700

VI. CONCLUSIONS
1. For the alloys studied in both plate and billet form, plate is generally lesssusceptible to stress corrosion than bilL material. Optical microscopestudies showed that those differences in susceptibility between plate andbillet could generally be explained on the basis of grain size - the smallerthe grain size, the lower the susceptibility.
2. Alternate-immersion testing provides a laboratory means of evaluatinghighly stress- corrosion- susceptible materials and processes. Final eval-uation of any material would depend on judgment and experience with amaterial with a known service performance.
3. The longitudinal grain directions in plate and billet have stress-corrosionsusceptibility less than or equal to that of the transverse grain directions.
4. The lower the tensile strengths of AFC 77, D6AC, and 4335M, the higherthe notehed-to-unnotched ratio, and the less the stress-corrosionsusceptibility.
5. The 4340 steel was less susceptible to stress corrosion at the 260- to 280-ksi strengths than at the 220- to 240-ksi strengths. There was no differencein notched-to-unnotched ratio between these strength levels.
6. AM 355 in the DADF and altered SCT 850 conditions was less susceptibleto stress corrosion than when in the standard SCT condition.
7. Martempered 4340 and 4335M at 450'F was less susceptible than comparableoil-quenched material. The previous work (Reference 1) provided resultsthat were exactly opposite, but the latter result may be due to the use ofseparate billets for the oil quenching and martempering evaluations.
8. Simulated mill annealing treatments carried out on the 4340 and 4335Mlow-alloy steels, coupled with the erratic results from the AM 355 thinsheet and the high-nickel steels, indicate that the history of melting andmill processing may have an influential effect on stress-corrosionsusceptibility.
9. Ausforming, compared to material not ausformed, decreased the stress-corrosion susceptibility of D6AC and increased the susceptibility of 4340,but did not affect the susceptibility of 4335M. Ausforming at temperaturesfrom 1000 to 1500F did not alter the relative susceptibility of 4340.
10. Among the alloys tested, those least susceptible to stress corrosion at theindicated strengths are shown in Table 25.
89
Amp ••••

Ttble 25 SUMMARY OF LEAST-SUSCEPTIBLE ALLOYS
Yield Strength Lksi) Alloy Alloy Form
270 18-7-5 Billet210 to 230 18-7-5, martempered Billet
4335M, and D6AC
170 to 190 H-11, 4335M, 4340 Billet225 18-7-5 Plate220 9Ni-4Co(0. 26C) 4335M Plate
180 to 200 17- 4PH Plate
11. Generally, increased fracture toughness along with an increase in the notched-to-unnotched ratio corresponds to a decrease in stress-corrosionsusceptibility.
12. Optical- and electron-microscope studies of fractured stress-corrosionspecimens showed the primary fracture mode was intergranular.
13. The final surface stress level could be determined by adding the residualsurface stresses, determined by X-ray measurements, and the appliedstresses. However, no correlation was noted between the magnitude offinal stresses, obtained by adding residual and applied stresses, andstress-corrosion susceptibility.
14. Comparisons of 4340 and H-11 after various percentages of deformationindicated a decrease in susceptibility at 0. 5-percent strain and an increasein susceptibility at 1. 0-percent strain. AM 355 after 1. 0-percent strainwas less susceptible than before straining or after 3.0-percent strain.
15. Manual- and automatic-fusion-welded D6AC, 4335M, 4340, and H-il plate,and AM 355 and 4340 sheet were more susceptible than these materialswhen not welded. No separation could be made between the two weldingmethods on the basis of relative susceptibility.
16. The five coatings studied - epoxy paint, cadmium plating, cadmium-titaniumplating, flame-sprayed aluminum, and cadmium plating plus epoxy paint-all provided increased protection against stress-corrosion cracking.Cadmium and cadmium-titanium coatings appear to provide the leastprotection.
17. Tests were made to determine a threshold stress below which stress-cor-rosion failures would not occur. Comparisons of duplicate heats providedinformation on the range in failure times that could be expected from agiven alloy. The comparative 4330M billets were failure resistant at 60and 40 percent of yield and the 4335M and 4340 billets were failure resistantat 40 percent of yield during 1000 hours of alternate-Immersion testing.
90

VII RECOMMENDATIONS
1. It is recommended that the 3. 5-percent sodium-chloride alternate-imne rsiontest be adopted as a .,andard laboratory test for the evaluation of steelalloys. In this way, future test data can be compared with that of the pre-sent study and also with that of the aluminum industry, where this methodhas been a standard test for many years.
2. It is recommended that the stress-corrosion test technique described herebe used to supplement testing carried out in other government-sponsoredprograms. In this way, increased information regarding the effects ofmelting, mill processing, and fabrication variables on stress-corrosionsusceptibility will be made available.
3. Continued support should be maintained on fundamental stress-corrosion
studies of steel alloys to further the knowledge of stress-corrosion cracking.
4. Since elevated temperatures are known to be very influential in the environ-mental behavior of other alloy systems, consideration should be given toextension of this test technique to include temperature as a variable sothat thick-section steel materials for supersonic flight applications can beevaluated.
91

REFERENCES
1. "Investigation of Susceptibility of High Strength Martensitic Steel Alloys toStress Corrosion," Air Force Report ASD-TDR-62-876, September 1962.
2. "Measurement of Stress by X-Ray," Society of Automotive EngineersReport TR-182.
3. S. C. Lawrence, Jr., "Detection and Measurement of Sorbed Hydrogen,"HydroaTn Embrittlement in Metal Finishing, Reinhold Publishing Co., NewYork, 1961.
4. C. H. Avery, "Screening Test Program for Evaluation of the Stress Cor-rosion Susceptibility of Alloys Under Consideration for Application as SkinMaterial," Douglas Aircraft Co., First Quarterly Progress Report,Report No. 30930, July 1962.
5. W. D. Robertson and A. S. Tetelman, "A Unified Structural Mechanism forIntergranular and Transgranular Cracking," ASM Symposium on Streng-thening Mechanisms in Solids, Philadelphia, 1960.
6. L. J. Klingler, W. J. Barnett, R. P. Frohmberg, and A. R. Troiano,"The Embrittlement of Alloy Steel at High Strength Levels," WADC TR-53-205, July 1963.
7. F. K. Bloom, "Stress-Corrosion Cracking of Hardenable Stainless Steels,
Corrosion, Volume 11, 1955, pp. 351t.
8. G. E. Pelliessier, Private Communication.
9. P. R. Swann and J. Nutting, "Stacking Faults and the Failure of Alloys inCorrosive Media," Journal of the Institute of Metals, Volume 88, 1959-60,pp. 478.
10. K. Bolton and L. L. Shreir, "Factors Affecting Hydrogen Absorption ofHigh-Strength Steels During Cathodic Polarization," Corrosion Science,Volume 3, No. 1, January-March 1963, pp. 17.
11. C. D. Beachem, "An Electron Fractographic Study of the Mechanisms of
Ductile Rupture in Metals," NRL Report 5871, December 31, 1962.
12. D. Crussard, F. Plateau, R. Tamhanker, G. Henry, and D. Lajeunesse,"A Comparison of Ductile and Fatigue Fractures," Fracture (SwampscottConference, 1959), John Wiley and Sons, Inc., New York, 1959.
13. G. R. Irwin, "Fracture," Encyclopedia of Physics, n. VI, Springer,Berlin, 1958, p. 551.
14. G. R. Irwin, "Relation of Crack Toughness to Practical Applications,"Welding J. Supplement, November 1962, p. 519S.
15. ASTM Committee Report, "Fracture Testing of High Strength Sheet Materials,ASTM Bulletin, January 1960, p. 29.
93
16. ASTM Committee Report, "Fracture Testing of ligh Strength SheetMaterials," ASTM Bulletin, February 1960, p. 1S.
17. ASTM Committee Report, "Fracture Testing of High Strength SheetMaterials, " Materials Research and Standards, November 1961, 1). 877.
18. W. E. Anderson and P. C. Paris, "Evaluation of Aircraft Material byFracture, " Engineering Quarterly (ASM), Volume 1, No. 2, May 1961,
p. 33.
19. M. Greenspan, "Axial Rigidity of Perforated Structural Members,"J. of Research of the National Bureau of Standards, Volume 31, 1943,p. 305.
20. "Investigation of Stress-Corrosion Cracking of High-Strength Alloys,"U.S. Army Ordnance Corps., Contract DA-04-495-ORD-3069, 1963.
21. P. Lilly and A. E. Nehrenburg, "Effect of Tempering Temperature onStress Corrosion Cracking and Hydrogen Embrittlement of MartensiticSteels, " ASM Transactions, Volume 48, 1956, p. 327.
22. F. L. Carr and F. R. Larson, "Fracture Surface Configurations of AISI4340 Steel as Affected by Temperature and Geometry," presented beforethe American Society for Testing and Materials, Philadelphia, Pennsyl-vania, June 1962.
23. E. C. Roberts, "A Review of Stress Corrosion Cracking," Boeing Docu-ment D6-7502, Contract AF33(616)-7839, June 30, 1961.
24. D. Von Rooyen, "Qualitative Mechanism of Stress Corrosion Cracking ofAustenitic Stainless Steels," Corrosion, Volume 16, 1960, pp. 421t.
25. W. C. Gallaugher, "Nature of Stress Corrosion Cracking," Boeing Docu-ment D6-4093, Appendix III, Contract No. AF33(616)-7839, AST-TDR-62-876, September 1962, pp. 178.
26. P. R. Swann, "Dislocation Substructure vs Transgranular Stress CorrosionSusceptibility of Single Phase Alloys," Corrosion, Volume 19, March 1963.
27. P. R. Swann and J. Nutting, "The influence of Stacking Fault Energy onthe Modes of Deformation of Polycrystalline Copper Alloys," Journal ofthe Institute of Metals, Volume 90, 1961-1962, p. 133.
28. D. L. Douglass, G. Thomas, and W. R. Roser, "Stacking Fault EnergyOrdering and Transgranular Stress Corrosion Cracking in AusteniticAlloys," University of California, Lawrence Radiation Laboratory, ReportNo. UCRL-10712, Contract No. W-7405-eng-48, March 1963.
29. C. Edeleanu, "Conference on the Physical Metallurgy of Stress-CorrosionFracture" (Pittsburgh, 1959), 1960, pp. 79.
30. J. G. Hines and T. P. Hoar, "The Stress-Corrosion Cracking of Austeni-tic Stainless Steels," Part II, "Fully Softened, Strain-Hardened and Re-frigerated Material," Journal of the Iron and Steel Institute, Volume 184,1956, pp. 166.
94

31. It. W. Stachle, F. It. Beck, and M. G. Fontana, "Mechanisn of StressCorrosion of Austenitic Stainless Steels in Chloride Waters, " TechnicalReport No. 4 from Ohio State University RF Project 682, Contract No.NONr-495(l1), July 1959.
32. C. J. Owen, "Stress Corrosion of High Strength Steels and Alloys: Arti-ficial Environment," Mellon Institute Report No. 16, Contract No. DA-36-034-)RD-3277RD, April 30, 1962.
33. R. J. Uzdarwin, "Investigation of Stress-Corrosion Cracking of HighStrength Alloys," Report No. 0414-01-6, Contract No. DA-04-495-ORD-3069, Aerojet-General Corp., March 1962.
34. W. 1. Weibull, "Stress Corrosion Cracking in High Strength Steel orHydrogen Embrittlement," presented at the 2nd International Congress,International Council of Aeronautical Sciences, Zurich, Switzerland,September 1960.
35. D. C. Briggs, J. U. MacEqan, and A. H. Yates, "The Corrosion Behaviorof Welded Low Alloy Steel," Corrosion, Volume 16, April 1960, pp. 205t.
36. W. L. Williams, "Chloride and Caustic Stress Corrosion of AusteniticStainless Steel in Hot Water and Steam," presented as Symposium onBasic and Applied Science in the Navy, March 19-20, 1957.
37. H. L. Logan, M. J. McBee, and M. Romanoff, "Stress-Corrosion Crack-ing of Type 304 Stainless Steel at 455 to 615'F," Materials Research andStandards (ASTM), Volume 3, No. 3, August 1963, pp. 635.
38. J. J. Harwood, "The Mechanism Stress Corrosion Cracking of AusteniticStainless Steels," ASTM Special Technical Publication No. 264, Stress-Corrosion Cracking of Austenitic Chromium-Nickel Stainless Steels,published by ASTM, Philadelphia, Pennsylvania, March 1960, pp. 22.
39. R. J. Favor, 0. L. Deel, and W. P. Achbach, "Deslgn Information onAM 350 Stainless Steel for Aircraft and Missiles. " DMIC Report 156,Battelle Memorial Institute, July 26, 1961.
40. R. Banning and S. Wilson, "Stress Corrosion Cracking Investigation onAM 350 CRT and AM 355 CRT," Boeing Document T2-1876, 1960.
41. M. Watanabe and Y. Mukai, "Study of Stress Corrosion Cracking of Aus-tenitic Stainless Steels," Technology Reports of Osaka University, Volume10, No. :192-413, March 1960, pp. 439.
95

Appendix I
SPECIMEN CONFIGURATIONS
97

BILLE MATRIALSMOOTH
FRACTURE TOUGHNESS
STEfSS-COMRSION
PLATE MATERIAL
FRACTURE TOUGHNESS SWEIN
SHEET MA TERIAL
Figure 55 SCHEMATIC ILLUSTRATION OF SPECIMEN LOCATIONS FROM EACH MATERIAL FORM
99

025
BILLET AND PLATE MATERIAL
2.0
7.00
SHEET MATERIAL
DIMENSIONS ARE IN INCHES
Figure 56 STRESS5-CORROSION SPEC IMEN CONFIGURAT IONS
100

DIMENSIONS ARE IN INCHES
.25 .o0 2.5 .
0.250D 1.25 600 0.001R
0.250
SMOOTH TENSILE BILLET SPECIMENS SMALL NOTCHED TENSILE
2.12
J.-O.754mSMOOTH TENSILE
0.7 ~PLATE SPECIMEN- 0.75 -- ' -"1.6- -'
o o1.0- 6. 75
0.25
4.0 000005 600
-SMOOTH TENSILE SHEET SPECIMENS NOTCH TENSILE
Figur-67 SMOOTH AND NOTCHED TENSILE SPECIMEN CONFIGURATIONS101

OI,*NSIONS AlE IN INCHES
A Dti n I 4D
7.0
LARGE ROUND NOTCHED SILLET
SYM
o 0o6.0
CENTER NOTCHED SHAE(CENTER CRACKS PROD VCED BY FATIGUING)
0102
sy- 2v -.& 8.

Appendix II
FRACTURE TOUGHNESS EVALUATION
103

A. DEFINITION OF FRACTURE TOUGHNESS PARAMETERS
The concept of fracture mechanics has developed from the theory of elasticity andthe testing of materials to evaluate their resistance to brittle fracture. Irwin (Ref-erences 13 and 14) has provided descriptions of both the analytical and practicalapproaches to fracture mechanics. The American Society for Testing Materials(References 15, 16, and 17) has attempted to provide some degree of standardiza-tion for fracture toughness testing of high-strength sheet materials.
One fracture mechanics approach is based on assessing the intensity of stress atthe crack tip of a centrally fatigue-cracked panel. The stress intensity factor,designated as either block K or script h may be regarded as a measure of theelastic transmission of external load into the region surrounding the crack tip(Reference 18). These are related as follows:
=a is '(psi F7 i.
K =F, k= a (psi
Here 2a is the total fatigue crack length, CG iE the gross area stress, and 0 is ageometry correction factor. This factor is required to correct for the finite sizeof specimen geometry since elasticity theory is generally based on an infinitesheet analysis. Two forms of this correction factor are in use today. One isbased on a tangent function (Reference 13) and the other is based on a polynomialexpression described by Greenspan (Reference 19). This latter factor is approxi-mately 3 percent higher than the tangent correction factor at a crack-length-to-panel-width ratio of 0.4. This difference decreases at lower ratios and the twofactors may be considered equivalent for most computations.
The polynomial expression for o is as follows:+42
2+-(+) -(+1
Here, 2b is the total panel width.
The critical stress intensity factor is calculated for the condition where the crackruns catastrophically with no increase in load. At this condition the values of thestress intensity factor are denoted as Kc or kc. When panels are statically testedin standard tensile testing equipment at loading rates of 2500 psi per second, esti-mates of the amount of slow crack extension are often made in crder to calculateK. or k.
105

With the steel alloys evaluated in this program, fracture toughness panel testswere made at loading rates of approximately 500,000 psi per second. This highloading rate was used to approximate the loading rates encountered in service.In this way slow crack extension during testing is eliminated or minimized. Also,with the high-strength steel alloys, conservative critical stress intensity factorsresult with the high loading rates.
The criterion for valid fracture toughness tests with centrally cracked panels isthat the net section stress ON must be less than 80 percent of the 0. 2-percentyield strength. If 0 is greater than 80 percent of the yield strength, the meas-ured value of Kc or %c is conservative.
The critical value of K. or kc can be measured for either plane stress or planestrain conditions. In the latter case, the critical value is denoted as KIc or -1c"With the center-cracked panels tested in this program, the low shear fractionin the rapid fracture area of most of the specimens indicates that conditions ofplane strain have been reached or closely approached (see Table 11). Interpre-tation of whether the value is plane stress or plane strain should be based on thepercent shear fracture.
Two large round notch specimens designed to yield a plane strain Kic value weretested for two strength levels of 4340. In this case Kic is calculated from thefollowing expression and the criterion for a valid test is that ON should not exceed110 percent of the 0.2-percent yield strength.
KIc = 0.233 N Vi**
B. TESTING PROCEDURE
The small panel specimens were cyclically loaded to produce a fatigue crack tip.The maximum to minimum loads (8) were maintained at a ratio of 20 to 1 duringfatigue cracking. The specimens were failed in tension at a rapid load rate in ahorizontal jig. The load rates were greater than suggested by the ASTM fracturecommittee (Reference 16) because the higher load rates were more representativeof actual loading in thick-section aircraft components. The loads were measured withan SR-4 strain-gaged dynamometer bar and recorded with a time-based oscillograph.
The large round notched specimens were not fatigue cracked. They were testedat a load rate of 2500 psi per second. Loads were recorded with the sameinstrumentation used for the panel tests.
j 106

Appendix III
SUPPLEMENTAL WORK-PREVIOUS STRESS-CORROSION STUDY
107

A. ENVIRONMENT
During the first stress-corrosion study at The Boeing Company (Seattle. Wash-ington), which was supported by an Air Force contract, a similar investigation(Reference 20) was in progress at the Aerojet-General Corporation (Azusa.California). To correlate the Aerojet and Boeing data, three 4340 specimens(275-ksi ultimate strength) were stressed to 75 percent of yield at Boeing andsent to Aerojet. These specimens were continuously immersed in the 3. 0-per-cent aqt'!ous NaCI solution at Aerojet until failure. Failure times were thencompared to those obtained from specimens of the same billet at Boeing afteralternate immersion in 3. 5-percent aqueous NaCl.
Continuous-immersion failure times were much longer than those sfter alternate-immersion testing. Whereas Aerojet failures were between 50 and 105 hours,comparable Boeing failures occurred between 1 and 26 hours. Heat treatmentand test data are contained in Table 26.
Table 26 HEAT TREATMENT, CONTINUOUS-IMMERSION, AND ALTERNATE-IMMERSIONTESTING OF 4340
Investigator Test Method Time to Failure (hr)
Aerojet-General Continuous immersion 50, 82, 105Corporation in 3.0-percent NaCI
solution
The Boeing Company Alternate immersion 1, 3, 26in 3.5-percent NaCIsolution
Heat Treatment:
Austenitize at 1500 to 1550°F for 45 minutes, oil quenched.Double temper at 400°F for 3 + 3 hours.Ultimate Strength: 275 ksi.Yield Strength: 230 kel.Stress Level: 75-percent yield (175 kei).
B. IMPACT TESTING
Evaluation of previous notched-to-unnotched ultimate strength ratios showed
that a decrease in this ratio enrresponded to an increase in stress-corrosionsusceptibility. Comparison of impact values from the literature also revealeda decrease in impact properties correlated with increased susceptibility. Todetermine if this latter relationship actually existed, Izod impact specimens werecut from the previously stress-corrosion-tested billets of 4340, 4340M, 4330M,
109
ow

and H-11. All impact specimens were cut from the same billet transverse graindirections and given the same heat treatments as the stress-corrosion specimens.The heat treatments are given in Table 27. Following heat treatment and finalmachining, all Izod specimens were tested at room temperature.
Plotting of the impact energy and stress-corrosion failure times with temperingtemperature results showed the dip in the impact curves of all steels to corres-pond with the most stress-corrosion-susceptible conditionis. Impact values andtensile properties are given in Tables 27 and 28. These stress-corrosion andimpact relationships are shown in Figures 59 through 62.
This data reveals a definite correlation between microstructure and stress-corrosion cracking sensitivity. However, the extreme complexity of thesealloys did not permit the identification of the predominant stages operatingduring the different tempering treatments. Similar work was done by Lillyand Nehrenburg (Reference 21) on 410 stainless steel. They found a correlationbetween impact properties and hydrogen embrittlement. These results suggestsimilarities between the mechanisms causing stress-corrosion cracking andhydrogen embrittlement.
Evaluation of the Izod impact fracture faces was based on the criteria used byCarr and Larson (Reference 22) in a study of fracture face appearance as afunction of testing temperature. These investigators adopted the following termsto denote three characteristic fractographic zones:
1) Fibrous- discontinuous circumferential ridges;
2) Radial shear- radial markings that appear to be shear elements;
3) Shear lip -terminal part of the fracture consisting of a smooth shearelement (macroshear) bordering the free surface or surfaces of the specimen.
In the present study, there was no evidence of a fibrous structure. All fracturefares contained the radial shear markings and shear lips along the free surfaces.Generally, the most noticeable effects of altering tempering temperatures werecoarsening of the radial markings and changes in the size of the shear lips.
With an increase in tempering temperature there was a gradual coarsening anddarkening of the radial structures. The temperatures at which this coarseningbecame most noticeable depended on the material. This behavior was leastevident when examining 4330M. Here, the difference between the 400 and 1000°Fstructures was slight. However, 4340 and 4340M showed a definite demarcationas the result of tempering temperature, where coarsening was first noted at the600 and 800F temperatures, respectively. This change in the H-11 structureoccurred at 1100 0F. There was no apparent change in the size of the 4330Mshear lips normal to the specimen notch. These same shear lips on the 4340600°F temper and 4340M 800°F temper specimens were noticeably reduced insize compared to specimens of these steels tempered at the other temperatures.
110
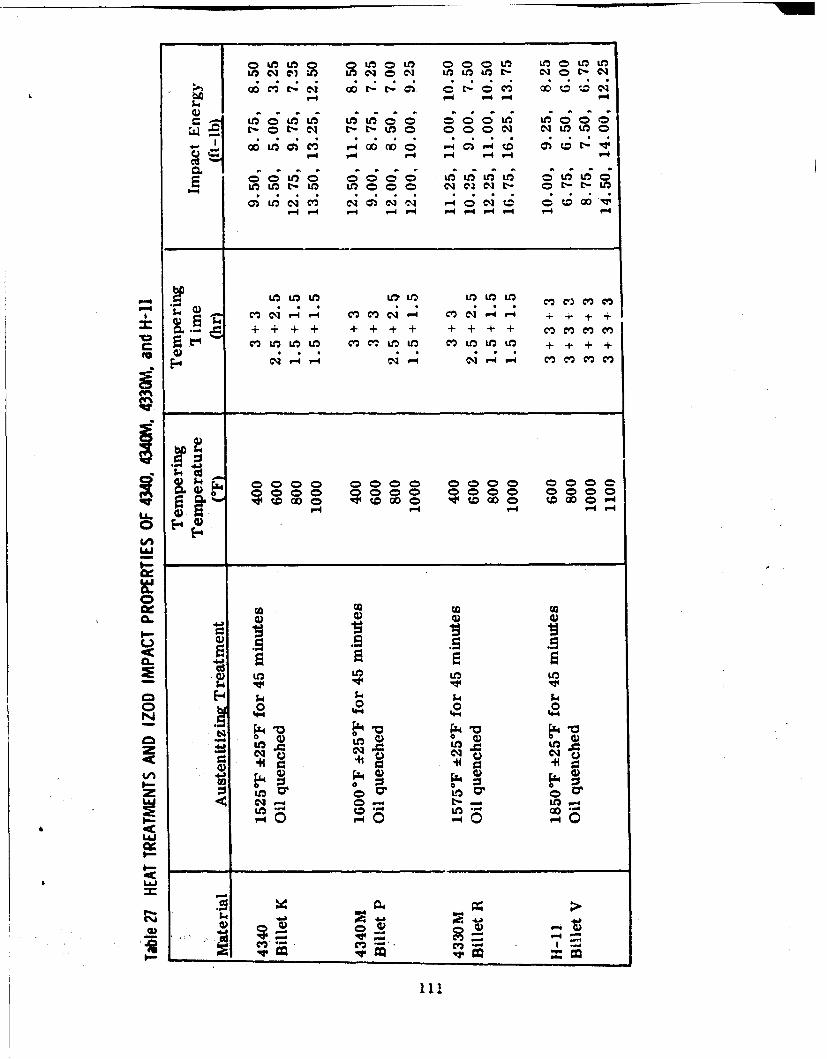
CLt UO 00 1:,0U- 0 00 ~ 11000
o;- 1,0 (6C C; 'i- 0--1
Q 0 ++++ 4=+ +++ LoL LDL
L00t o 00 N 0000 t 0 000t L
0 L LnLM n 0Dn0 ~~m) C4 '. -l c)- mCi
o + +m4 v )
WW
.5s.VEo 00 0 00
o So Go 00000W
LAJ
CL
Q) *) L=$
CJ4
1I.
t-I ;L4

000
P4 P4v40 4 P- 4N V - -
4) V- 5qqqq 0- e- m oN 0
$41 C IIP 0 eq4~U ~003 0 N N '0eLA.c cq C
CLto0 D0D0 -
CO) Cv* C) I
LL112
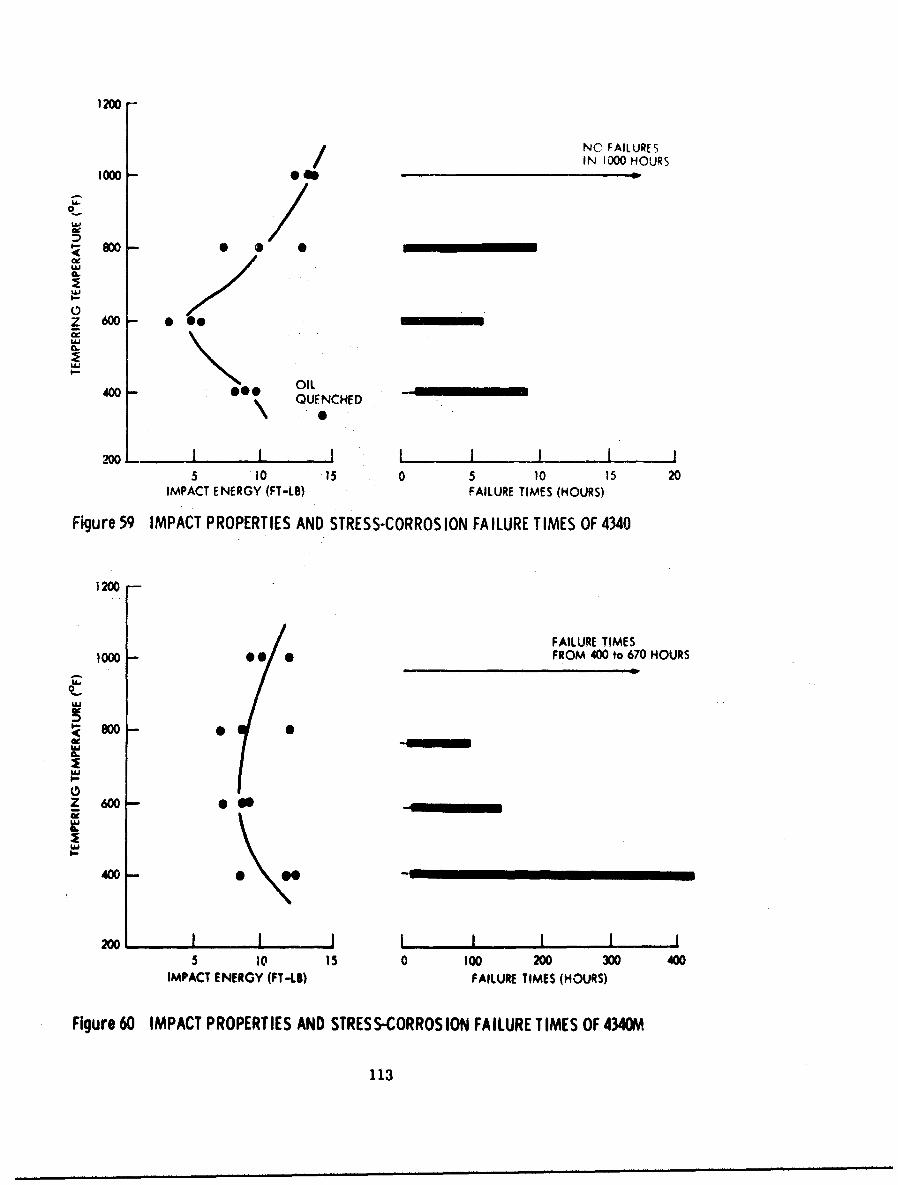
1200
NC FAILURES/ IN 1000 HOURS1000 040
00
uAJ
z 600 0 00
CL.
400 OILQUENCHED
5 10 15 0 5 10 15 20IMPACT ENERGY (FT-LB) FAILURE TIMES (HOURS)
Figure 59 IMPACT PROPERTIES AND STRESS-CORROS ION FAILURE TIMES OF 4340
1200-
FAILURE TIMES1000 00 FROM 400 to 670 HOURS
S800
a
40
2 00 0
5 10 15 0 100 200 00 400IMPACT ENERGY (FT-LI) FAILURE TIMES (HOURS)
FIgure 60 IMPACT PROPERTIES AND STRESS-CORROS ION FAILURE TIMES OF 434M
113

NO FAILURES
IWO IN 1000 HOURS
I
5 10 15 200 400 600 8O0 1000IMPACT ENERGY (FT-LB) FAILURE TIMES (HOURS)
Figure 61 IMPACT PROPERTIES AND STRESS-CORROSION FAILURE TIMES OF 4330M
1400 -
1200 - NO FAILURES IN1000 HOURS
00low --6
z Sooo - ,i
60 - 00
40 I I I I I I
5 10 15 0 5 1o 15 20IMPACT ENERGIES (PT-L) FILURE TIMES (HOURS)
Figure 62 IMPACT PROPERTIES AND STRESS-CORROSION FAILURE TIMES OF H-i
114
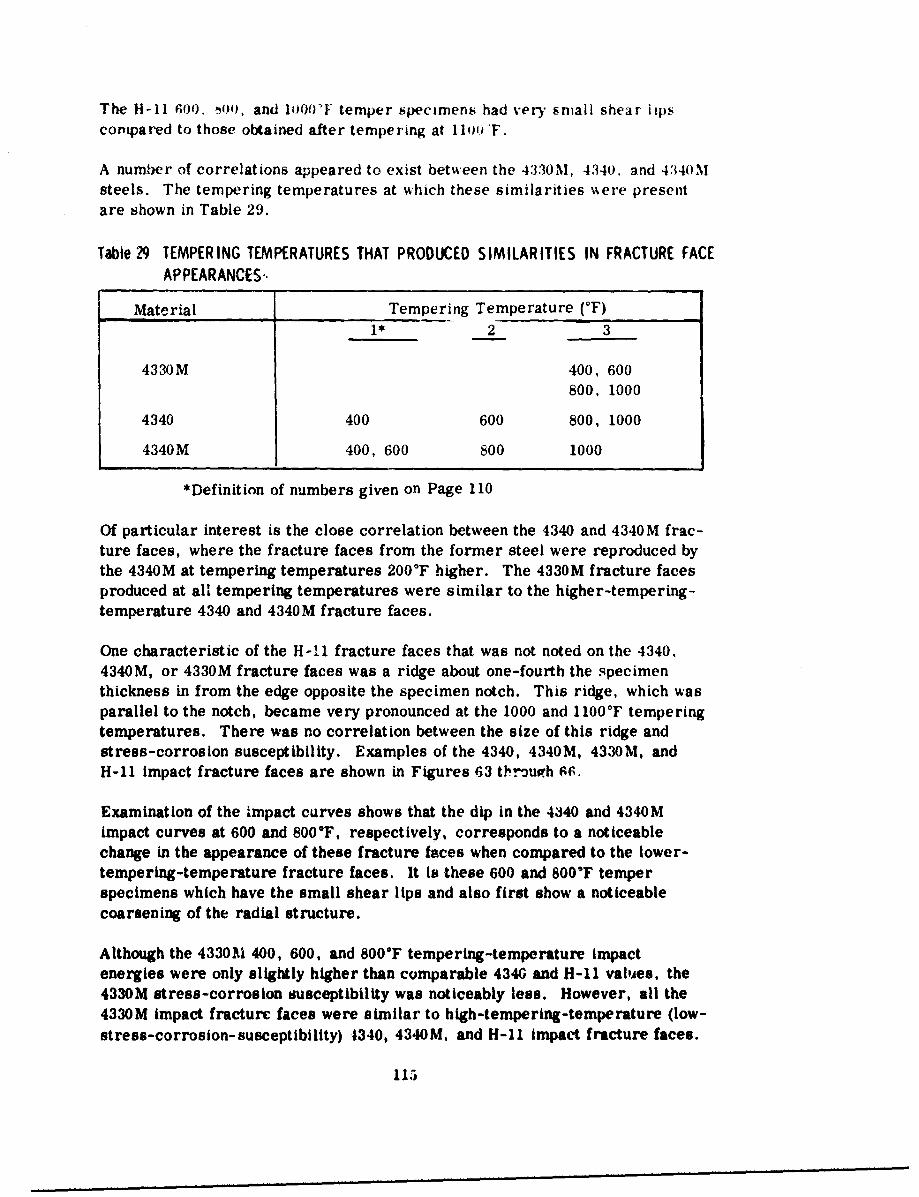
The H-1 600. 00, and l00WF temper specimens had very small shear lipscompared to those obtained after tempering at I11D F.
A number of correlations appeared to exist between the 4330M, 4340. and 4340Msteels. The tempering temperatures at which these similarities were presentare shown in Table 29.
Table 29 TEMPERING TEMPERATURES THAT PRODUCED SIMILARITIES IN FRACTURE FACEAPPEARANCES-
Material Tempering Temperature (9F)1* 2 3
4330M 400, 600800, 1000
4340 400 600 800, 1000
4340M 400, 600 800 1000
*Definition of numbers given on Page 110
Of particular interest is the close correlation between the 4340 and 4340M frac-ture faces, where the fracture faces from the former steel were reproduced bythe 4340M at tempering temperatures 200°F higher. The 4330M fracture facesproduced at all tempering temperatures were similar to the higher-tempering-temperature 4340 and 4340M fracture faces.
One characteristic of the H-41 fracture faces that was not noted on the 4340,4340M, or 4330M fracture faces was a ridge about one-fourth the specimenthickness in from the edge opposite the specimen notch. This ridge, which wasparallel to the notch, became very pronounced at the 1000 and 1100F temperingtemperatures. There was no correlation between the size of this ridge andstress-corrosion susceptibility. Examples of the 4340, 4340M, 4330M, andH-11 impact fracture faces are shown in Figures 63 throui.h 6F.
Examination of the impact curves shows that the dip in the 4340 and 4340Mimpact curves at 600 and 800°F, respectively, corresponds to a noticeablechange in the appearance of these fracture faces when compared to the lower-tempering-temperature fracture faces. It is these 600 and 800F temperspecimens which have the small shear lips and also first show a noticeablecoarsening of the radial structure.
Although the 43301I1 400, 600, and 800F tempering-temperature impactenergies were only slightly higher than comparable 4340 and H-11 values, the4330M stress-corrosion ousceptibiIty was noticeably less. However, all the4330M impact fracture faces were similar to high-tempering-temperature (low-stress-corrosion-susceptibility) 1340, 4340M, and H-11 impact fracture faces.
115
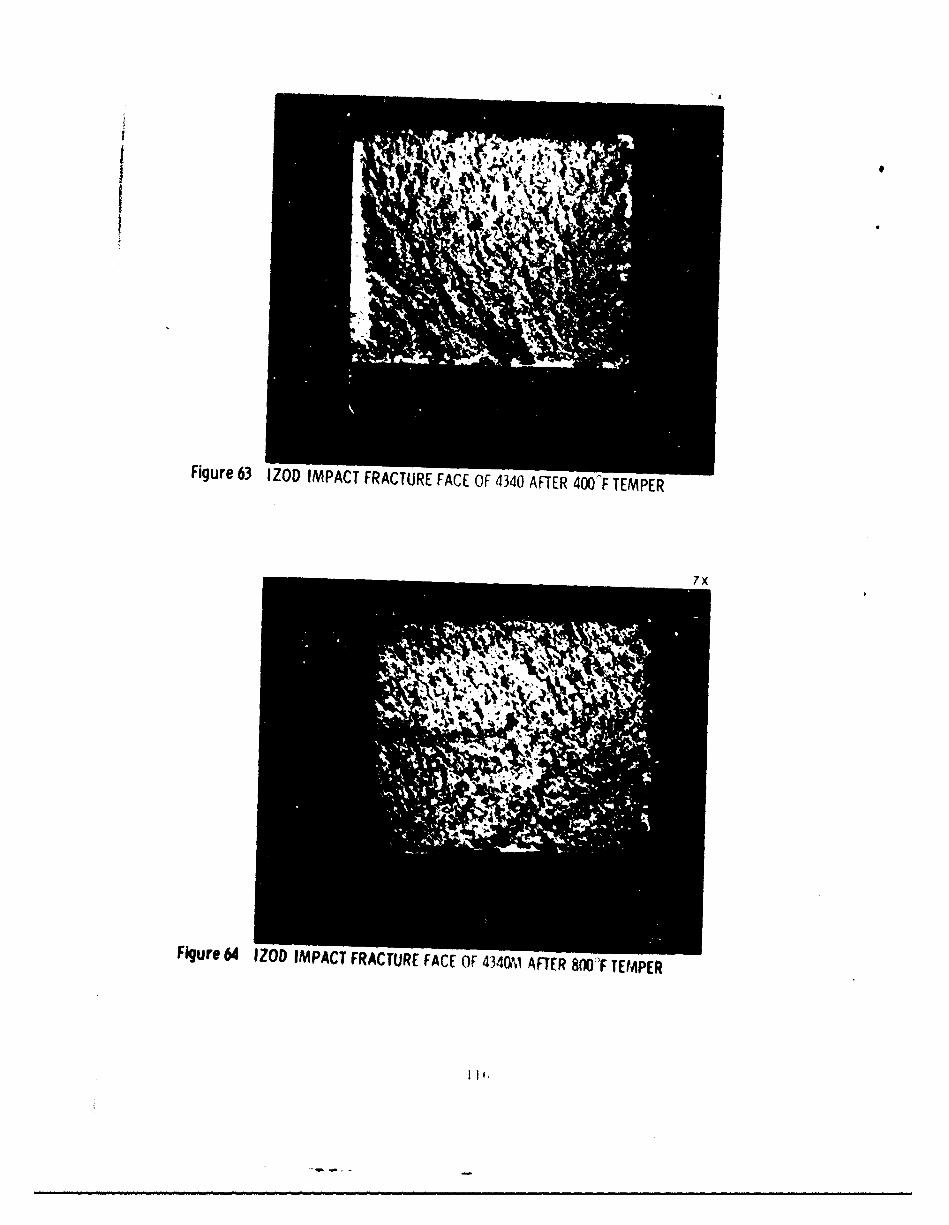
Y4
Figure 63 IZOD IMPACT FRACTURE FACE OF 4340 AFTER 400-F TEMPER
7 X
Figure 64 IZOD IMPACT FRACTURE FACE OF 4340&1 AFTER 800 F TEMPER

Figure 65 IZOD IMPACT FRACTURE FACE OF 4330M AFTER 600 'F TEMPER
Figure 66 IZOD IMPACT FRACTURE OF H-11 AFTER 1000 T TEMPER
The H-11 impact fracture faces produced by tempering (600, s00, 1000T) to themost stress-corrosion-susceptible conditions had very small shear lips. TheseH-11 Izod specimens, representing the lowest impact energies, had noticeablyless coarse radial markings than '.hose produced by tempering at 1100T. H-i1iempered at 1100F had very low ttress-corrosion susceptibility.
Briefly, the study of the 4340, 4340M, 4330M, and H-il impact specimens indi-cated the following correlations with stress-corrosion susceptibility.
1) An inverse relationship was noted between impact energies of the 11340,4340M, 4330M, and H-11 steels and stress-corrosion susceptibility. Com-parisons of different heat-treat conditions of a particular steel show that adecrease in impact properties corresponds to a more stress-corrosion-susceptible condition.
2) The most stress-corrosion-susceptible condition is represented by a slightlycoarsened radial structure on the impact fracture faces with relatively smallshear lips along the free surfaces.
3) The least stress-corrosion-susceptible condition is represented by a moreheavily coarsened radial structure with relatively large shear lips along thefree surfaces.
118

Appendix IV
REVIEW OF RECENTLY PUBLISHED LITERATURE
ON STRESS-CORROSION CRACKING
119

A. INTRODUCTION
The stress-corrosion-cracking susceptibility of materials is essentially ameasure of the interplay between stresses, corrosion, and crack-sensitivepaths with each metal or alloy having its own particular corrosive environmentthat initiates cracking through primarily an electrochemical mechanism (Refer-ence 23). There is no known case of stress-corrosion cracking in an aqueousmedium that cannot be arrested by stopping the corrosion reaction (Reference24). Stress-corrosion failures usually occur catastrophically after a time delay.
This literature survey is an extension of the previous survey (Reference 25) withemphasis on recent publications. The majority of investigations have been relatedto the study of modes of stress-corrosion failures and related factors such asthe effect of grain size, alloying elements, plastic deformation, corrosive media,heat treatment, microstructures, stress, welding, and surface conditions.
B. MECHANISMS OF STRESS-CORROSION CRACKING
All proposed theories of stress-corrosion cracking have involved some type ofelectrochemical mechanism. These theories have been designated as the electro-chemical theory, mechanical theory, strain accelerated decomposition theory,anodic shift theory, and the film theory and are described in the previous survey(Reference 25). At least one of these theories has found application in the des-cription of stress-corrosion failures from the large variety of published data,but attempts for unification of these theries have met with failure at the presenttime.
C. MODE OF CRACKING
The mode of stress-corrosion cracking can be either transgranular or inter-granular depending on the metallurgical nature of the material. Intergranularcracking has ben related to potential differences between the grain boundaryregions and the grain material. Robertson and Tetelman (Reference 5, Chapter8) have studied intergranular stress-corrosion failures from a theoretical ap-proach and have concluded that intergranular cracking is initiated by the concen-tration of stresses from piled up dislocations across a grain boundary plane.The result is a preferential and rapid attack along these planes that significantlyreduces the fracture stress of the boundary. These boundaries, which block thepassage of dislocations, can be other than grain boundaries, such as twin boundaries.
Their model for intergranular failure requires a grain size dependence in whichthey show the stress-corrosion failure time of 70/30 brass and 18-8 stainlesssteel to increase linearly with the square root of the inverse of the grain size.In face-centered cubic materials the evaluation of the grain size must includeannealing twins since their presence will reduce the number of dislocations piledup at a grain boundary. If It Is assumed that a coherent twin boundary has half
121

the energy of a stacking fault, the density of annealing twins would be greater ina material of low itacking fault energy (Reference 5). By increasing the silieoncontent in Cu-Si atloys, the stacking fault energy decreased and the susceptibilityto intergranular failure decreased. This change in susceptibility was related tothe smaller distance between barriers produced by the annealing twins.
Robertson and Tetelman have also concluded that nucleation of transgranularcracking is related to the stress concentration produced by dislocation pile-upsat Cottrell-Lomer locks. The barrier strength is related to the number of dis-locations the Cottrell-Lomer lock can withstand, which is inversely proportionalto the stacking fault energy of a system. Therefore, if a material has a highstacking fault energy, the barrier strength is low and the probability for nuclea-tion of transgranular cracks is decreased.
Swam (Reference 26) has studied the stress-corrosion susceptibility and modeof cracking in deformed single-phase alloys. He has also found that the modeof cracking is dependent on stacking fault energy, but that the relative magnitudeof stacking fault energies (SFE) produces basically two types of dislocation dis-tributions. Low SFE allows extension of the partial dislocations and hinderscross slip. As a result, the dislocations remain in their slip planes producinga coplanar dislocation array. On the other hand, a high SFE will allow the dis-locations to climb out of their slip planes and form a cellular distribution.Swam has shown that the coplanar distributions have a greater transgranularstress-corrosion susceptibility than the cellular distributions. Therefore, theaddition of solute atoms, which decreases the SFE, will cause an increase inthe stress-corrosion susceptibility. This has been observed for the addition ofZn, Al, Ge, and St to copper (Reference 27) and Cr, Mo, Nb, and Ti to austeniticsteels (Reference 28). The increase in the nickel content in the 18-8 type stain-less steel decreases the SFE, which explains the stress-corrosion resistance ofhigh-nickel-content stainless steels (References 26 and 28).
Douglass, Thomas, and Roser (Reference 28) have shown that the SFE is not theonly criterion for determining the stress-corrosion susceptibility rf a ma.terial.Short-range order (SRO) affects both stress-corrosion susceptibility and SFEas shown by the susceptibility of ordered Cu3Au, which has a high SFE. Con-sequently, both SRO and 3FE must be considered for evaluation of transgranularcracking.
D. CRACK INITIATION
Swam and Nutting (Reference 9) have reported preferential etching of thin foilpin the region of stacking faults for Cu-Zn and Cu-Al. Although the conditionsprevailing during electropolishing may not be the same as those encountered instress-corrosion tests, there are many similarities which point toward a cor-relation. This preferential etching of stacking faults gives support to Edeleanu's(Reference 29) theory of alternate slow and rapid movement of stress-corrosioncracks. "The slow movement is associated with the dissolution of the stacking
122

faults, producing a crack which propagates in a brittle manner until intersectionwith another fault."
During deformation, the number of stacking faults intersecting a surface is in-creased; causing slower dissolution of any one fault. Therefore, in a work-hardened material, cracking should be widespread. This phenomenon of branch-ing cracks has been observed byHines and Hoar (Reference 30).
All theories proposed for the initiation of stress-corrosIon cracking are relatedto physical areas on a surface concerned with stress concentration or chemicalpotential differences. Swann and Nutting's (Reference 9) preferential etchingof stacking faults is related to solute segregation. Robertson and Tetelman's(Reference 5) crack initiation is related to stress concentration at Cottrell-Loner locks.
E. CRACK PROPAGATION
There has not been ary new significant data on crack propagation rates especiallyin relation to transgranular versus intergranular failures. The generally ac-cepted net rate of stress-corrosion failures is 0.1 to 5.0 mm/hour (Reference30). However, Staehle, et al. (Reference 31) observed that the cracking of 347stainless steel occurs initially by short bursts and then in the latter stage ofcracking the bursts extend over 2 to 10 grains.
F. EXPERIMENTAL OBSERVATIONS
The following is a brief resume of the experimental observations reported in theliterature.
1. Observations of Stresc-Corrosiok Cracking in High-Strength Steels
Experimental investigations of stress-corrosion suaceptibtlity on high-strengthsteel alloys have been mainly concerned with materials and environments associ-ated with rocket motor cases. Owen (Reference 32) has reported that the effectof environment on the susceptibility of Vascojet 1000, in decreasing order, wasphosphate, chloride, sulfate, nitrate, and sulfide solutions. With the first threeexhibiting the same order of detrimental effect. The H-11 specimens shatteredin a number of pieces especially in phosphate, chloride, and sometimes sulfatesolutions. Multifractitres did not occur, however, in nitrate solutions. Thehigh-strength D6AC alloy was most resistant to stress-corrosion failures incomparison with H-11, 4137Co, and 300M.
Uzdarwin (Reference 33) has shown that the D6AC, 300M, and H-11 alloys aregenerally most susceptible in distilled water and 3.5-percent NaCl solution incomparison with tap water, Na 2 Cr 2O 2 solution (0.25-percent), I-percent mar-quenching salt solution, trichloroethylene, cosmoline, and a 4-percent solubleoil solution. The susceptibility of these alloys also decreased with decreasingyield strengths. 123

Stress-corrosion tests on bolts torsionally stressed have shown HY-Tuf to be lesssusceptible than 1366 (Swedish alloy similar to 4340) in a humidity cabinet (Refer-ence 34).
The increased resistance to corrosion adjacent to welds in SAE steel have beenassociated with change in chromium distribution during cooling (Reference 35).As the cooling rate from the austenitic temperature is decreased, the corrosionresistance increases because of the greater ret-)ntion of chromium in ferrite.At very slow cooling rates, secondary effects of carbide shape and size appearto counteract the chromium effect. However, the relative change in susceptibilityis not significant with cooling rate.
2. Observations of Stress-Corrosion Cracking in Stainless Steels
The metallurgical factors influencing intergranular cracking of austenitic stain-less steels have been fairly well established and are reported in a number ofpublihed papers. The factors affecting transgranular cracking have been pre-viously discussed.
Staehle, et al. (Reference 31) have reported that the stress-corrosion suscepti-bility of 347 stainless steel depends on a balance of oxygen and NaCI concentra-tion. As the oxygen increases, less chloride is required for cracking. Similarconditions have been reported by Eckel and Williams (Reference 36) for inter-mittent wetting and drying in alkaline-phosphate-treated chloride waters. Staehle,et al., observed stress-corrosion cracks at stresses as low as 2000 psi at 50ppm NaCI. Also, at this low NaCI concentration the tendency for cracking didnot change as the stress increased.
Stashle, et al., have also noted that a smooth surface presented a more resistantcondition for nucleation of stress-corrosion cracks. The cracks occurred in theregion of highest stress for a smooth surface while an abraded surface resultedin cracks occurring in regions of low stress. The crack distribution was relatedto residual surface stresses induced by abrading.
Logan, et al. (Reference 37) investigated the effect of temperature on the stress-corrosion susceptibility of 304 stainless steel. At 5701F, failures occurred atchloride concentrations as low as 5 ppm at 20, 000 psi. The presence of oxygenwas necessary for crack initiation. There was no correlation between tempera-ture (within range of 455 to 615"F) and susceptibility to stress-corrosion crackingat constant chloride concentration and stress.
Harwood (Reference 38) emphasizes the importance of chlorides in the stress-corrosion susceptibility of austenitic stainless steels In which, in the absence ofchlorides or caustlca cracking, will not occur in high purity water or steam.Oxygen is also necessary for pitting in austenitic stainless steels in NaCl solu-tions. However, in concentrated metal chloride solutions (i.e., MgC12) stress-corrosion and pitting can occur to deoxygenated solutions.
124
5

Harwood has stated that, in general, an increase in temperature shortens thetime to failure because of increased crack initiation, but some influence is exertedon the rate of cracking.
Favor, et al. (Reference 39) reported that the double aging treatment of AM 350was more susceptible to intergranular corrosion than the SCT treatment. Thesignificant factor was the precipitation of chromium carbides during the formertreatment. Banning and Wilson (Reference 40) reported that the SO 2 environmentcauses both AM 355 CRT and AM 350 CRT to be stress-corrosion susceptibiewhile alternate immersion in 3.5-percent Narl, cyclic humidity, and alkalinesoil environments did not produce susceptib'" conditions.
Watanabe and Mukai (Reference 41) have shown that the tensile strength of aus-tenitic stainless steels diminishes suddenly after a specimen has been immersedfor three-fourths of the failure time. Also, the number of stress-corrosioncracks increased as the stress increased, with the critical stress for crackinitiation being higher than the critical stress for crack propagation.
Numerous other investigations have shown similar results for the various factorsaffecting the stress-corrosion susceptibility of high-strength and stainless steels.The conclusions from all stress-corrosion test results are:
1) Stress-corrosion cracking is primarily an electrochemical phenomena;
2) Specific environments are required for each alboy and metal;
3) Tensile stresses, applied or internal, are required for the promotion ofstress-corrosion cracking.
125