Investigation of the degree of homogeneity and - Researchspace
29
Investigation of the degree of homogeneity and hydrogen bonding in PEG/PVP blends prepared in supercritical CO 2 : Comparison with ethanol-cast blends and physical mixtures Maya J. John a , Rotimi E. Sadiku b , Philip W. Labuschagne b* a CSIR, Materials Science and Manufacturing, Port Elizabeth 6000, South Africa b Tshwane University of Technology, Department of Polymer Technology, Private Bag X 025, Lynnwoodridge 0040, South Africa Abstract The degree of homogeneity and H-bond interaction in blends of low-molecular- mass poly(ethylene glycols) (PEG, M w = 400, 600, 1000) and poly(vinylpyrrolidone) (PVP, M w = 9 x 10 3 ) prepared in supercritical CO 2 , ethanol and as physical mixtures were studied by differential scanning calorimetry (DSC), Fourier-transform infrared (FTIR) spectroscopy and dynamic mechanical analysis (DMA) techniques. Homogeneity of samples prepared in supercritical CO 2 were greater than physically mixed samples, but slightly less than ethanol cast samples. PEG-PVP H-bond interaction was higher for ethanol cast blends when compared to blends prepared in supercritical CO 2 . This was attributed to a combination of: 1) shielding of PEG-PVP H-bond interactions when CO 2 is dissolved in the blend; 2) rapidly reduced PEG and PVP chain mobility upon CO 2 venting, delaying rearrangement for optimum PEG-PVP H- bond interaction. Keywords: supercritical fluids, polymer blends, H-bonding, diffusion *Corresponding author: Tel.: +27 12 841 2149, Fax. +27 12 841 3553 E-mail address: [email protected]
Transcript of Investigation of the degree of homogeneity and - Researchspace

Investigation of the degree of homogeneity and hydrogen bonding in
PEG/PVP blends prepared in supercritical CO2: Comparison with
ethanol-cast blends and physical mixtures
Maya J. Johna, Rotimi E. Sadikub, Philip W. Labuschagneb*
aCSIR, Materials Science and Manufacturing, Port Elizabeth 6000, South Africa bTshwane University of Technology, Department of Polymer Technology, Private Bag X 025, Lynnwoodridge 0040, South Africa Abstract
The degree of homogeneity and H-bond interaction in blends of low-molecular-
mass poly(ethylene glycols) (PEG, Mw = 400, 600, 1000) and
poly(vinylpyrrolidone) (PVP, Mw = 9 x 10³) prepared in supercritical CO2,
ethanol and as physical mixtures were studied by differential scanning
calorimetry (DSC), Fourier-transform infrared (FTIR) spectroscopy and dynamic
mechanical analysis (DMA) techniques. Homogeneity of samples prepared in
supercritical CO2 were greater than physically mixed samples, but slightly less
than ethanol cast samples. PEG-PVP H-bond interaction was higher for ethanol
cast blends when compared to blends prepared in supercritical CO2. This was
attributed to a combination of: 1) shielding of PEG-PVP H-bond interactions
when CO2 is dissolved in the blend; 2) rapidly reduced PEG and PVP chain
mobility upon CO2 venting, delaying rearrangement for optimum PEG-PVP H-
bond interaction.
Keywords: supercritical fluids, polymer blends, H-bonding, diffusion
*Corresponding author: Tel.: +27 12 841 2149, Fax. +27 12 841 3553
E-mail address: [email protected]

1. Introduction
CO2 is known to interact, via Lewis acid-base interactions, with polymers
containing electron-donating oxygen or fluorine atoms present in the functional
groups or backbone[1]. Such interactions lead to swelling and subsequent
plasticisation of polymers. This has allowed supercritical CO2 to be used as
medium for various polymer processes such as: particle formation, blending,
impregnation, foaming, chemical modifications etc.[2-5]
One application for which supercritical CO2 has received considerable attention
is as a processing medium in the preparation of drug-polymer delivery
systems[6-9]. This stems mainly from supercritical CO2’s ability to provide non-
toxic and low temperature processing conditions when compared to
conventional preparation methods in which toxic solvents or high temperatures
are required for processing. So far, supercritical CO2 has been successfully
used in the encapsulation, micronization, coating and impregnation of many
drugs[10-17].
In most drug delivery systems, the drug is dispersed or encapsulated within a
single biodegradable or bioerodible polymer[9]. The role of the polymer is to
protect the drug from degradation and to ensure controlled delivery to the
targeted site. Drug release occurs either via diffusion through the polymer
matrix or due to erosion of the polymer itself[18]. Alternative drug delivery
systems are produced when two polymers form a strong association through
interaction between complementary functional groups. The result of such

interpolymer association (usually through H-bonding) is called interpolymer
complexation and produces a drug delivery system in which the properties of
the interpolymer complex is completely different from the constituent
polymers[19]. One such example is the interpolymer complexation between
polyvinylpyrrolidone (PVP) and poly(ethylene glycol) (PEG) [20]. H-bonding
occurs between the terminal hydroxyl groups of short chain PEG molecules
(Mw: 200 to 600) and the carbonyl groups of long chain PVP molecules (Mw: 1 x
106), resulting in a high free-volume structure of PVP chains crosslinked by
flexible PEG chains. Hydration of this complex to equilibrium moisture content
forms a hydrogel which yields a product with high elasticity and excellent
adhesive strength. Combined with controlled release characteristics, such PVP-
PEG hydrogels can be employed as drug-loaded adhesive patches in
transdermal delivery devices[21].
Of specific interest is that both PEG and PVP can be plasticized in supercritical
CO2 due to the presence of electron-donating ether and carbonyl groups in
PEG and PVP molecules, respectively. Many authors have studied various
aspects of PEG-CO2 systems[22-27] while PVP is often the polymer of choice
for increasing the bioavailability of hydrophobic drugs through supercritical CO2
assisted impregnation into PVP[10;28;29].
In addition, H-bond interactions have been shown to occur in the presence of
CO2 as demonstrated with dye and drug impregnations into polymers[3;10].
Ngo et al[3] studied various conditions under which azo-dyes would impregnate
into PMMA using supercritical CO2 as processing medium. The degree of
impregnation was determined by the partition coefficient (Kc) of the system, i.e.
the ratio of dye concentration in polymer to dye concentration in supercritical
CO2. Usually, the Kc for dyes is high due to high solubility of the dye in the
polymer. Interestingly, it was found that Kc decreases, which was attributed to
H-bonds between the dyes and the PMMA. Such H-bond interactions are
believed to cause stearic hindrances, preventing other dye molecules from
migrating into the polymer. Kazarian et al[10] conducted in-situ FTIR
spectroscopic monitoring during ibuprofen impregnation into PVP. Results
showed the appearance of a new carbonyl band at a lower wavenumber which
they attributed to ibuprofen-PVP H-bonding.
In this chapter, an initial study was performed by comparing the level of
homogeneity and H-bonding in PEG/PVP blends prepared as physical
mixtures, cast from ethanol solution and in supercritical CO2. Differential
Scanning Calorimetry (DSC) was performed to monitor crystallinity changes,
Fourier-Transform Infrared (FTIR) spectroscopy was used to compare
wavenumber shifts associated with H-bond interactions and Dynamic
Mechanical Analysis (DMA) was used to investigate thermal transitions.
2. Experimental
2.1 Materials and methods
PEG (400 and 1000 Mw) and PEG (600Mw) were purchased from Unilab and
Fluka respectively. PVP (9000 Mw; Kollidon 17PF) was purchased from BASF.
Carbon dioxide (99.995% purity) was purchased from Air Products. All PEG

and PVP samples were dried for 12 hours at 70°C in a vacuum oven (Model
VO65, Vismara) prior to processing.
The supercritical CO2 processing was carried out in a Separex pilot-scale
reactor (Separex Equipements, Champigneulles, France), illustrated in Figure
1. CO2 gas was drawn from a standard commercial gas cylinder fitted with a
dip-tube. CO2 was pumped through a pre-heated chamber, set to the reactor
temperature, into the mixing chamber. The mixing chamber (0.5L capacity),
was fitted with a magnetically driven stirrer and was pre-heated with electrical
heaters.
Figure 1: Schematic diagram of the supercritical CO2 reactor: A) CO2 cylinder,
B) back-pressure regulator, C) pressure gauge, D) diaphragm pump, E) flow
meter, F) CO2 pre-heater, G) mixing chamber, H) pressure gauge, I)
temperature probe.
ATR-FTIR spectra of the samples were obtained using a Perkin Elmer
Spectrum 100 FTIR spectrometer, with wavenumbers ranging from 4000 cm-1

to 650 cm-1. A Perkin Elmer DSC-7, calibrated with indium, was used to study
the melting endotherms of the samples. Samples of 3 to 5 mg in weight were
sealed in aluminum pans with pierced lids and scanned at a heating rate of
20°C/min from -20°C to 70°C. DMA was performed with a Perkin Elmer DMA
8000. All samples (12.5 x 5 x 1mm) were exposed to a reference frequency of 1
Hz, using a single cantilever bending deformation mode. The heating rate was
5°C/min.
2.2 Preparation of blends
Blends of PEG/PVP were prepared by physical mixing, ethanol-casting and
supercritical CO2 processing. A ratio of 15/85 wt% of PEG to PVP was chosen
for all experiments. Physical mixtures were prepared by mixing the ingredients
in a Kenwood coffee grinder (Model:CG100) for 30 seconds. Ethanol-cast
blends were prepared by first adding rectified ethanol to the weighed-off
ingredients in order to obtain a 20 wt% solution. The solutions were then stirred
with a spatula until all the material was dissolved. The solutions were placed in
an oven, set at 60°C for 48 hours, after which it w as placed in a vacuum oven
(Model VO65, Vismara), set at 60°C until all ethano l was removed (as
monitored by FTIR analysis). The remaining material was then ground to a
powder in a coffee grinder. The supercritical CO2-processed blends (scCO2-
processed) were prepared by first mixing the weighed-off ingredients (20g
samples) in the coffee grinder for 30 seconds, and then placed in the
supercritical CO2 reactor, preheated to 40°C. The reactor was sealed and
charged with CO2 up to a pressure of 200 bar. After allowing for 1 hour for
reaching equilibrium, the mixture was stirred intermittently over a 2-hour period

at 100rpm. Following processing, the CO2 pump was switched off and all the
CO2 in the reactor was released over a period of ca. 3 minutes. The material
was removed from the reactor, and then ground to a powder in a coffee grinder.
All the blends were stored in airtight containers in a humidity and temperature
controlled laboratory, prior to analysis.
3. Results and Discussion
3.1 Differential Scanning Calorimetry
DSC thermograms of the PVP blends with PEG-1000 are presented in Figure 2.
The weight fraction of crystalline PEG-1000 after blending with PVP (wcrPEG)
was calculated as follows:
PEGPEG
blendcrPEG Hw
Hw
∆⋅∆
= (1)
where ∆Hblend is the heat of fusion of the PEG1000-PVP blend, wPEG the weight
fraction of PEG in the blend and ∆HPEG the heat of fusion of the pure PEG-
1000. Based on this calculation, wcrPEG is 1.1 for the physical mixtures, 0.1 for
the scCO2-processed samples while no crystalline PEG1000 was measured in
the ethanol-cast samples. It is likely that the large reductions in crystalline PEG-
1000 in the solvent cast and scCO2 processed sample are due to PEG mobility
restrictions being imposed either by H-bond interactions between PEG and
PVP molecules or by being trapped in a rigid PVP matrix, or both. This
indicates a high level of inter-dispersion. The high degree of crystalline PEG-

1000 in the physical sample indicates poor inter-dispersion. This can be
expected since the samples were prepared at room temperature, which is
below the melting range of PEG-1000 (Onset: 33°C;T m: 45.6°C)..
17
19
21
23
25
27
29
25 28 30 33 36 38 41 44 46 49 52 54
Temperature (°C)
Hea
t Flo
w (
mW
)
42.6°C (25.5J/g)
44.0°C (2.4J/g)
Figure 2: DSC thermograms of the various PEG-1000-PVP mixtures: physical
mixture (—); scCO2-processed (– –) and ethanol-cast (- - -)
Neither of the processing methods containing PEG-600 (Figure 3) or PEG-400
(Figure 4) exhibits any crystalline PEG melting peak. Most likely, the increased
mass transport properties induced by supercritical CO2 and ethanol media
assisted in the homogenous mixing of PEG and PVP molecules. Upon removal
of CO2 and the ethanol, the well dispersed PEG molecules easily interact with
the PVP molecules, preventing recrystallisation. The absence of a crystalline
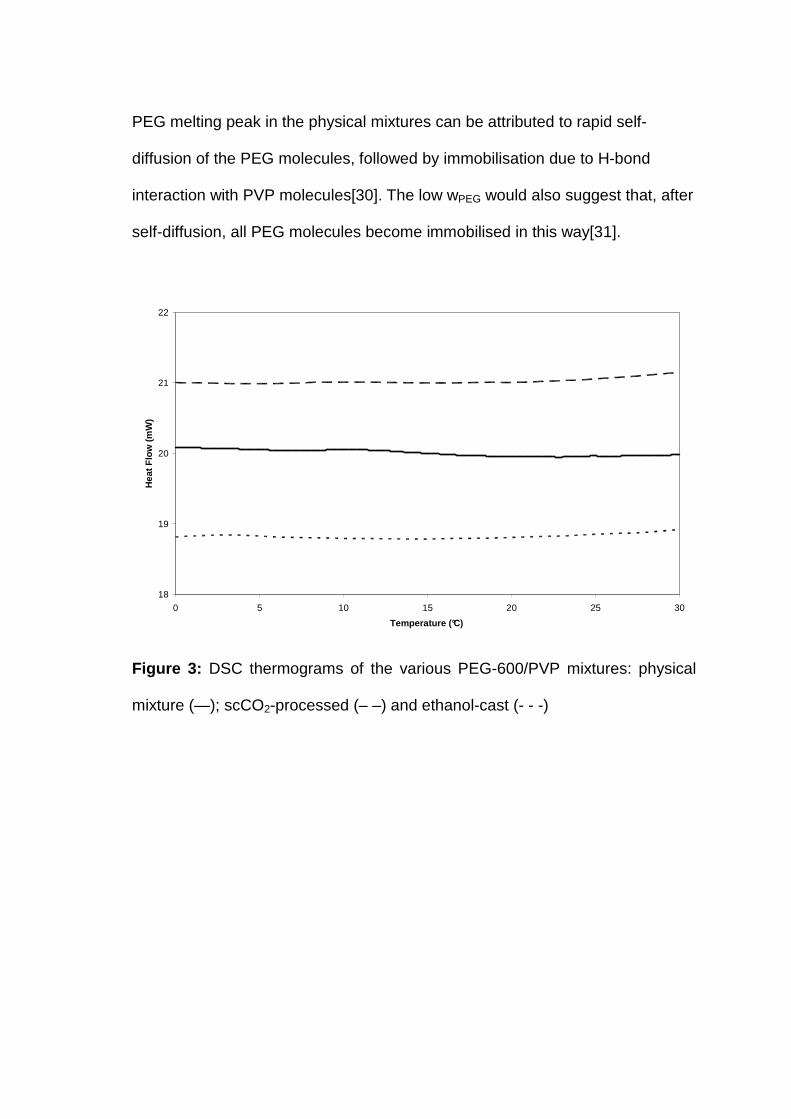
PEG melting peak in the physical mixtures can be attributed to rapid self-
diffusion of the PEG molecules, followed by immobilisation due to H-bond
interaction with PVP molecules[30]. The low wPEG would also suggest that, after
self-diffusion, all PEG molecules become immobilised in this way[31].
18
19
20
21
22
0 5 10 15 20 25 30
Temperature (°C)
Hea
t Flo
w (
mW
)
Figure 3: DSC thermograms of the various PEG-600/PVP mixtures: physical
mixture (—); scCO2-processed (– –) and ethanol-cast (- - -)

17
18
19
20
21
-2 0 2 4 6 8 10 12 14
Temperature (°C)
Hea
t Flo
w (
mW
)
Figure 4: DSC thermograms of the various PEG-400/PVP mixtures: physical
mixture (—); scCO2-processed (– –) and ethanol-cast (- - -)
3.2 Dynamic Mechanical Analysis
Analysis of the dynamic mechanical properties of these polymer blends over a
wide temperature range would give insight into the visco-elastic properties of
the materials. Variations in storage modulus (E’), an indication of rigidity, and
damping factor (Tan δ), which is the ratio of energy dissipated as heat to the
maximum energy stored in the sample and which indicates the balance of
viscous to elastic behaviour were studied. The Tan δ peak temperature is also
related to the glass transition temperature (Tg) of the material[32]. However, Tg
derived from DMA can be between 10 – 30ºC higher than that derived from
DSC, depending on variables such as frequency and heating rates, respectively
[33-35].

2.0E+09
4.0E+09
6.0E+09
8.0E+09
1.0E+10
1.2E+10
1.4E+10
1.6E+10
1.8E+10
2.0E+10
-60 -10 40 90 140
Temperature (°C)
E' (
Pa)
Figure 5: E’ curves of the PEG-1000-PVP mixtures: physical mixture (—);
scCO2-processed (– –) and ethanol-cast (- - -)
In the samples containing PEG-1000, the ethanol cast samples show the
highest E’, with the scCO2-processed samples the lowest (Figure 5). This could
be attributed to a limited degree of H-bonding between PEG-1000 and PVP in
the solvent-cast sample, thereby enhancing the cohesive strength of the
material. While PEG-1000 blends with PVP are generally regarded as
immiscible due to low PEG hydroxyl content, miscibility studies have not yet
been conducted at such low PEG-1000 concentrations[36]. Perhaps greater
intimate mixing and lower amounts of PEG ether groups competing with PVP
carbonyl group for H-bond interaction are contributing factors. The
comparatively low E’ values of the scCO2-processed sample is, possibly, an

indication of largely unbound PEG-1000 molecules dispersed in between the
PVP molecules resulting in greater PVP plasticisation.
The Tan δ curve of the physical mixture, and to a lesser extent, the sc-CO2
processed sample, show multimodal behaviour (Figure 6). The sharpness of
the Tan δ curve for the ethanol-cast sample (Figure 6) confirms greater
homogeneity. In the physical mixture, there is the presence of a minor peak at
37°C, a prominent peak at 106°C and a shoulder peak at 130°C. These peak
temperatures, which are also indications of Tgs, are possibly the result of PEG-
rich and PEG-poor domains. The Tan δ curve of the scCO2-processed sample
largely exhibits morphological homogeneity similar to the solvent cast sample,
however the shoulder at ca.106°C shows some evidenc e of heterogeneity. Tan
δ generally decreases when there is less freedom of movement of the polymer
chains, ether through reinforcement[37], crystallisation[38] or closer packing,
i.e. stereo-complexation[39]. Tan δ values are lowest for ethanol cast samples
indicating such restricted molecular mobility, which could be ascribed to greater
H-bonding within the PEG-PVP blend.

0
0.02
0.04
0.06
0.08
0.1
0.12
0.14
-60 -10 40 90 140
Temperature (°C)
Tan
d
Figure 6: Tan δ curves of the PEG-1000-PVP mixtures: physical mixture (—);
scCO2-processed (– –) and ethanol-cast (- - -)
.
DMA thermograms of the samples with PEG-600 (Figures 7 and 8) show a
reduction in E’ and Tan δ for all processing methods. Such an overall decrease
is characteristic of greater elastic-like behaviour[40]. The overall increase in
plasticisation is believed to be a combination of intimate mixing of the PEG
molecules in the PVP and the low Mw of the PEG. The most significant
reduction in E’ is found with the ethanol cast samples, showing the highest
degree of intimate mixing. The physical mixture relies on self-diffusion of the
PEG-600 molecules for intimate mixing, however immobilisation due to H-
bonding with PVP molecules limit the movement of PEG-600 molecules[30].
The scCO2-processed sample displays similar plasticisation than the physical

mixture, although a much higher Tg than the physically mixed or ethanol cast
samples is shown.
2.0E+09
4.0E+09
6.0E+09
8.0E+09
1.0E+10
1.2E+10
1.4E+10
-60 -10 40 90 140
Temperature (°C)
E' (
Pa)
Figure 7: E’ curves of the PEG-600-PVP mixtures: physical mixture (—);
scCO2-processed (– –) and ethanol-cast (- - -)

0
0.01
0.02
0.03
0.04
0.05
0.06
0.07
0.08
0.09
-60 -10 40 90 140Temperature (°C)
Tan
d
Figure 8: Tan δ curves of the PEG-600-PVP mixtures: physical mixture (—);
scCO2-processed (– –) and ethanol-cast (- - -)
The ethanol-cast and scCO2-processed samples display similar Tan δ peak
heights, indicating slightly more elastic behaviours than the physical mixture.
However, as indicated, Tgs varies significantly (52.2°C and 95.6°C
respectively). The ethanol-cast samples also show a narrow peak, suggesting
greater morphological uniformity. The physical mixture shows slightly less
elastic behaviour as indicated by the higher Tan δ values. In addition, a very
broad peak is shown, indicating less uniform morphology.
An interesting observation with samples containing PEG-400 is that E’ is higher
in all samples compared to those with PEG-600 (Figure 9). This is an indication
of greater reinforcement, possibly due to PEG-PVP H-bonding. However, it is

only the ethanol-cast samples which also show an increase in Tg, while the
physical mixture and scCO2-processed samples show a slight decrease in Tg.
2.0E+09
4.0E+09
6.0E+09
8.0E+09
1.0E+10
1.2E+10
1.4E+10
1.6E+10
1.8E+10
2.0E+10
-60 -10 40 90 140
Temperature (°C)
E' (
Pa)
Figure 9: E’ curves of the PEG-400-PVP mixtures: physical mixture (—);
scCO2-processed (– –) and ethanol-cast (- - -)
The Tan δ peak of the physical mixture (Figure 10) is broader when compared
to the ethanol cast and scCO2-processed samples, indicating a greater degree
of morphological heterogeneity. The lower Tan δ value, accompanied by a
higher Tg of the ethanol-cast sample would suggest a close-knit structure of
PVP and PEG-400 molecules, where the PEG-400 molecules are thought to be
evenly dispersed in between the PVP molecules and H-bonded. The height and
width of the Tan δ peak of the scCO2-processed samples indicate some degree
of homogeneity and a level of PEG-PVP interaction that is deemed intermediate

between that of the ethanol-cast and the physically mixed samples. This would
suggest improved PEG-PVP inter-dispersion when compared to the physically
mixed sample, but not reaching the same level of H-bond interaction found in
the solvent cast sample.
0
0.02
0.04
0.06
0.08
0.1
0.12
-60 -10 40 90 140
Temperature (°C)
Tan
d
Figure 10: Tan δ curves of the PEG-400-PVP mixtures: physical mixture (—);
scCO2-processed (– –) and ethanol-cast (- - -)
3.3 Infra-red Spectroscopy
Infra-red spectroscopy is one of the most powerful tools to detect H-bonding
between polymers. The degree of H-bonding interactions can be inferred from
changes in the peak position of the C=O stretching band where H-bonding is
evidenced by a shift to lower wavenumbers[20].

(a)
(b)

Figure 11: Transmission IR spectra with corresponding second derivative
spectra of the C=O region of PVP blends with PEG-1000 (a), PEG-600 (b) and
PEG-400 (c) prepared by: physical mixing (―); scCO2-processing (―); and
solvent casting (―).
Figure 11 (left) shows the transmission spectra of the various PEG-PVP blends
in the region 1760 – 1560 cm-1 are displayed. The bands in this region
represent the �(C=O) stretching band of PVP in different blends. These bands
show minor, but significant differences, which can be better appreciated by
studying the corresponding second derivative spectra. These spectra show that
the �(C=O) band actually consists of a multitude of smaller bands. These bands
can be attributed to carbonyl groups that are either free, bound by PVP-PVP
dipole interactions or H-bonded to another species. Specific wavenumbers
attributed to these states vary depending on the strength on interaction (or the
molecular state of the carbonyl group), but can be summarised as follows:
completely unperturbed carbonyl groups (ca. 1708 cm-1)[41;42]; carbonyl
(c)

groups involved in PVP-PVP dipole interactions (ca. 1670 - 1680 cm-1)[43;44];
H-bonded carbonyl groups (ca. 1659 – 1630 cm-1)[45;46].
The important bands in this study are those attributed to H-bonded carbonyl
groups. However, due to the strong hygroscopic nature of PVP, elucidation of
H-bonding interactions between PEG and PVP using FTIR spectroscopy can be
complicated by present water molecules. To determine whether effects of
present water can be ignored, second derivative spectra of solvent cast and
physically mixed blends of PEG-1000 with PVP are compared (Figure 11a).
The second derivative band maxima at 1692, 1681 and 1672 cm-1 are attributed
to non H-bonded carbonyl groups, while the band maxima at 1657, 1651 and
1640 cm-1 are attributed to H-bonded carbonyl groups. The second derivative
spectra show that the relative intensity of the H-bonded to non H-bonded
v(C=O) bands is highest for solvent cast blends. DSC and DMA analyses have
shown evidence of greater H-bond interaction in the solvent cast sample. Thus,
it would seem acceptable to use relative intensities of these bands to evaluate
H-bonds in the different preparation methods.
.
The general trend in Figure 11 (a) to (c) shows that by decreasing PEG Mw,
variations in H-bond interaction behaviour between the various processing
methods becomes smaller. This is likely to be due to increased diffusion
coefficients found with decreasing Mw of PEG. Thus, the lower Mw PEG
molecules are less restricted and are easily able to self-diffuse between PVP
molecules and form H-bonds. Consequently, the greatest variations in H-
bonding are found with blends containing PEG-1000, where both the physically

mixed blends and scCO2-processed samples show evidence of reduced H-
bond interaction, when compared to solvent cast samples. In physical mixtures,
this may likely be the result of poor PEG-1000/PVP inter-dispersion as
indicated by DSC and DMA analyses that showed evidence of both intact PEG-
1000 crystallites and morphological heterogeneity, respectively. The scCO2-
processed samples show evidence of greater PEG-1000 inter-dispersion when
compared to the physically mixed blend, but this did not result into the same
levels of H-bond interaction with PVP, as found with the solvent-cast blend.
The discrepancy concerning the level of H-bond interaction between solvent
cast and scCO2-processed blends is attributed to a combination of factors,
namely: shielding effects of CO2 molecules and the time-dependence of PEG-
PVP interdiffusion. Due to favourable Lewis acid-base interaction between CO2
and the electron donating ether and carbonyl groups of PEG and PVP
respectively[1], increased CO2 pressure leads to increased sorption of CO2
molecules into the polymers. This leads to swelling of the polymer, resulting in
Tg depression of amorphous polymers (i.e. PVP) and Tm reduction of semi-
crystalline polymers (i.e. PEG)[22;47]. Increased chain mobility results in
enhanced diffusion coefficients.[3;48-50] and thus polymer inter-diffusion[44].
This results in greater blend homogeneity. However, CO2 molecules interacting
with PVP carbonyl groups, effectively reduce H-bond interaction between PEG
and PVP molecules[44]. Thus, while CO2 enhances PEG-PVP inter-dispersion,
H-bond interaction is not favoured. After CO2 venting, no barriers to PEG-PVP
interaction exist, but there remains a time-dependence for rearrangement of
PEG molecules into a stable thermodynamic state within the PVP matrix[51]. In

the solvent-cast blends, samples were stored for approximately 6 days at 60 °C
in order to remove all traces of ethanol. The gradual decrease in ethanol
concentration would have provided sufficient time for the PEG and PVP chains
to rearrange and form stable associates. However, for blends processed in
supercritical CO2, CO2 venting occurred within a couple of minutes, resulting in
a rapid decrease in molecular mobility. Thus, a significantly shorter period for
molecular rearrangement was available.
Poor homogeneity was observed for the physical mixtures, although some
degree of H-bonding with PVP occurred. Dissolution of low Mw PEG molecules
into the PVP matrix is mainly enhanced by the plasticizing ability of these PEG
molecules[52]. However, diffusion of PEG molecules into the PVP matrix may
be restricted through H-bond interaction with PVP molecules[44]. With PEG-
1000 being solid, no self-diffusion can occur as shown with the intact crystalline
domains. However, FTIR spectroscopic analysis demonstrates the presence of
some H-bond interaction between PEG-1000 and PVP. It is possible that PVP
molecules adsorb onto the surface of such crystalline domains, forming H-
bonds with outwardly exposed terminal hydroxyl groups[36].
4. Conclusions and Recommendations
The ability of PVP to form a homogenous H-bonded mixture with low Mw PEG
(Mw:400, 600 & 1000) lies in the molecules being properly dispersed,
experiencing no barriers for interaction and having sufficient mobility to allow for
self-diffusion into thermodynamically favourable arrangements. In the ethanol-

cast blends, these conditions were met, allowing homogenous mixtures of
PEG/PVP with a high degree of H-bonding. With CO2 dissolution into the PEG-
PVP blends, weak Lewis acid-base interaction with the polymers results in
increased chain mobility, which in turn allows the formation of homogenous
PEG-PVP mixtures. However, the scCO2-processed samples showed lower H-
bond interaction when compared to the ethanol-cast samples. This was
attributed to a combination of factors: 1) CO2 molecules interacting with PVP
carbonyl groups limit PEG-PVP interaction, 2) once CO2 is removed molecular
mobility is severely reduced, delaying the formation of an optimally H-bonded
blend. Physically mixed samples showed poor homogeneity and limited H-
bonding, which was mainly due to restricted mobility of the PEG and PVP
chains.
These experiments were conducted under isothermal and isobaric conditions.
Many variables are thus available for further optimisation. In addition to
temperature and pressure, other processing variables, such as polymer Mw and
PEG/PVP ratios, are available.
These variables will be investigated in the next study. A valuable analytical
technique, namely in-situ FTIR spectroscopy, would give an insight into the
level of interaction between different components of polymer blends under
various conditions, including how such interactions are affected during CO2
venting.


Reference List
[1] Kazarian SG, Vincent MF, Bright FV, Liotta CL, Eckert CA. Specific intermolecular interaction of carbon dioxide with polymers. Journal of the American Chemical Society 1996; 118: 1729-1736.
[2] Kazarian SG. Polymer processing with supercritical fluids. Polymer Science - Series C 2000; 42: 78-101.
[3] Ngo TT, Liotta CL, Eckert CA, Kazarian SG. Supercritical fluid impregnation of different azo-dyes into polymer: In situ UV/Vis spectroscopic study. Journal of Supercritical Fluids 2003; 27: 215-221.
[4] Nalawade SP, Picchioni F, Janssen LPBM. Supercritical carbon dioxide as a green solvent for processing polymer melts: Processing aspects and applications. Progress in Polymer Science (Oxford) 2006; 31: 19-43.
[5] Elkovitch MD, Lee LJ, Tomasko DL. Effect of supercritical carbon dioxide on morphology development during polymer blending. Polymer Engineering and Science 2000; 40: 1850-1861.
[6] Davies OR, Lewis AL, Whitaker MJ, Tai H, Shakesheff KM, Howdle SM. Applications of supercritical CO2 in the fabrication of polymer systems for drug delivery and tissue engineering. Advanced Drug Delivery Reviews 2008; 60: 373-387.
[7] Fages J, Lochard H, Letourneau JJ, Sauceau M, Rodier E. Particle generation for pharmaceutical applications using supercritical fluid technology. Powder Technology 2004; 141: 219-226.
[8] Ginty PJ, Whitaker MJ, Shakesheff KM, Howdle SM. Drug delivery goes supercritical. Materials Today 2005; 8: 42-48.
[9] Tandya A, Mammucari R, Dehghani F, Foster NR. Dense gas processing of polymeric controlled release formulations. International Journal of Pharmaceutics 2007; 328: 1-11.
[10] Kazarian SG, Martirosyan GG. Spectroscopy of polymer/drug formulations processed with supercritical fluids: In situ ATR-IR and Raman study of impregnation of ibuprofen into PVP. International Journal of Pharmaceutics 2002; 232: 81-90.
[11] Argemí, A., Vega A, Subra-Paternault P, Saurina J. Characterization of azacytidine/poly(l-lactic) acid particles prepared by supercritical antisolvent precipitation. Journal of Pharmaceutical and Biomedical Analysis 2009; 50: 847-852.
[12] Sampaio de Sousa AR, Simplício AL, de Sousa HC, Duarte CMM. Preparation of glyceryl monostearate-based particles by PGSS-Application to caffeine. Journal of Supercritical Fluids 2007; 43: 120-125.

[13] Rodrigues M, Peirico N, Matos H, Gomes De Azevedo E, Lobato MR, Almeida AJ. Microcomposites theophylline/hydrogenated palm oil from a PGSS process for controlled drug delivery systems. Journal of Supercritical Fluids 2004; 29: 175-184.
[14] Kerè J, Knez Z, Srèiè S, Senèar-Božiè P. Micronization of drugs using supercritical carbon dioxide. International Journal of Pharmaceutics 1999; 182: 33-39.
[15] Reverchon E, la Porta G. Terbutaline microparticles suitable for aerosol delivery produced by supercritical assisted atomization. International Journal of Pharmaceutics 2003; 258: 1-9.
[16] Sauceau M, Rodier E, Fages J. Preparation of inclusion complex of piroxicam with cyclodextrin by using supercritical carbon dioxide. Journal of Supercritical Fluids 2008; 47: 326-332.
[17] Ribeiro Dos Santos I, Richard J, Pech B, Thies C, Benoit JP. Microencapsulation of protein particles within lipids using a novel supercritical fluid process. International Journal of Pharmaceutics 2002; 242: 69-78.
[18] Langer R. Polymer-controlled drug delivery systems. Accounts of Chemical Research 1993; 26: 537-542.
[19] Khutoryanskiy VV. Hydrogen-bonded interpolymer complexes as materials for pharmaceutical applications. International Journal of Pharmaceutics 2007; 334: 15-26.
[20] Feldstein MM, Lebedeva TL, Shandryuk GA, Kotomin SV, Kuptsov SA, Igonin VE, Grokhovskaya TE, Kulichikhin VG. Complex formation in poly(vinyl pyrrolidone)-poly(ethylene glycol) blends. Polymer Science - Series A 1999; 41: 854-866.
[21] Feldstein MM, Tohmakhchi VN, Malkhazov LB, Vasiliev AE, Platé NA. Hydrophilic polymeric matrices for enhanced transdermal drug delivery. International Journal of Pharmaceutics 1996; 131: 229-242.
[22] Pasquali I, Comi L, Pucciarelli F, Bettini R. Swelling, melting point reduction and solubility of PEG 1500 in supercritical CO2. International Journal of Pharmaceutics 2008; 356: 76-81.
[23] Gourgouillon D, Nunes Da Ponte M. High pressure phase equilibria for poly(ethylene glycol)s + CO2: Experimental results and modelling. Physical Chemistry Chemical Physics 1999; 1: 5369-5375.
[24] Hao J, Whitaker MJ, Serhatkulu G, Shakesheff KM, Howdle SM. Supercritical fluid assisted melting of poly(ethylene glycol): A new solvent-free route to microparticles. Journal of Materials Chemistry 2005; 15: 1148-1153.

[25] Nalawade SP, Picchioni F, Janssen LPBM. Batch production of micron size particles from poly(ethylene glycol) using supercritical CO2 as a processing solvent. Chemical Engineering Science 2007; 62: 1712-1720.
[26] Guadagno T, Kazarian SG. High-pressure CO2-expanded solvents: Simultaneous measurement of CO2 sorption and swelling of liquid polymers with in-situ near-IR spectroscopy. Journal of Physical Chemistry B 2004; 108: 13995-13999.
[27] Weidner E, Wiesmet V, Knez Ž, kerget M, Škerget M. Phase equilibrium (solid-liquid-gas) in polyethyleneglycol-carbon dioxide systems. Journal of Supercritical Fluids 1997; 10: 139-147.
[28] Gong K, Viboonkiat R, Rehman IU, Buckton G, Darr JA. Formation and characterization of porous indomethacin-PVP coprecipitates prepared using solvent-free supercritical fluid processing. Journal of Pharmaceutical Sciences 2005; 94: 2583-2590.
[29] Sethia S, Squillante E. Solid dispersion of carbamazepine in PVP K30 by conventional solvent evaporation and supercritical methods. International Journal of Pharmaceutics 2004; 272: 1-10.
[30] Vartapetian RS, Khozina EV, Ka¦êrger J, Geschke D, Rittig F, Feldstein MM, Chalykh AE. Self diffusion in poly(N-vinyl pyrrolidone) - Poly(ethylene glycol) systems. Colloid and Polymer Science 2001; 279: 532-538.
[31] Vartapetian RS, Khozina EV, K+ñrger J, Geschke D, Rittig F, Feldstein MM, Chalykh AE. Molecular dynamics in poly(N-vinylpyrrolidone)-poly(ethylene glycol) blends investigated by the pulsed-field gradient NMR method: Effects of aging, hydration and PEG chain length. Macromolecular Chemistry and Physics 2001; 202: 2648-2656.
[32] Novikov MB, Roos A, Creton C, Feldstein MM. Dynamic mechanical and tensile properties of poly(N-vinyl pyrrolidone)-poly (ethylene glycol) blends. Polymer 2003; 44: 3561-3578.
[33] Huang JM, Yang SJ. Studying the miscibility and thermal behavior of polybenzoxazine/poly(+¦-caprolactone) blends using DSC, DMA, and solid state 13C NMR spectroscopy. Polymer 2005; 46: 8068-8078.
[34] Backfolk K, Holmes R, Ihalainen P, Sirvio¦ê P, Triantafillopoulos N, Peltonen J. Determination of the glass transition temperature of latex films: Comparison of various methods. Polymer Testing 2007; 26: 1031-1040.
[35] Hagen R, Salm+¬n L, Lavebratt H, Stenberg B. Comparison of dynamic mechanical measurements and Tg determinations with two different instruments. Polymer Testing 1994; 13: 113-128.

[36] Feldstein MM, Kuptsov SA, Shandryuk GA, Platé NA. Relation of glass transition temperature to the hydrogen-bonding degree and energy in poly(N-vinyl pyrrolidone) blends with hydroxyl-containing plasticizers. Part 2. Effects of poly(ethylene glycol) chain length. Polymer 2001; 42: 981-990.
[37] Liu X, Wu Q. PP/clay nanocomposites prepared by grafting-melt intercalation. Polymer 2001; 42: 10013-10019.
[38] GRAY RW, MCCRUM NG. Origin of the U Relaxations in Polyethylene and Polyetrafluoroethylene. J Polymer Science-Polymer Physics 1969; 7: 1329-1355.
[39] Yu JM, Yu YS, Dubois P, Jerome R. Stereocomplexation of sPMMA-PBD-sPMMA triblock copolymers with isotactic PMMA: 1. Thermal and mechanical properties of stereocomplexes. Polymer 1997; 38: 2143-2154.
[40] Pouplin M, Redl A, Gontard N. Glass transition of wheat gluten plasticized with water, glycerol, or sorbitol. Journal of Agricultural and Food Chemistry 1999; 47: 538-543.
[41] Painter PC, Pehlert GJ, Hu Y, Coleman MM. Infrared band broadening and interactions in polar systems. Macromolecules 1999; 32: 2055-2057.
[42] Hu Y, Motzer HR, Etxeberria AM, Fernandez-Berridi MJ, Iruin JJ, Painter PC, Coleman MM. Concerning the self-association of N-vinyl pyrrolidone and its effect on the determination of equilibrium constants and the thermodynamics of mixing. Macromolecular Chemistry and Physics 2000; 201: 705-714.
[43] Chiu CY, Yen YJ, Kuo SW, Chen HW, Chang FC. Complicated phase behavior and ionic conductivities of PVP-co-PMMA-based polymer electrolytes. Polymer 2007; 48: 1329-1342.
[44] Fleming OS, Chan KLA, Kazarian SG. High-pressure CO2-enhanced polymer interdiffusion and dissolution studied with in situ ATR-FTIR spectroscopic imaging. Polymer 2006; 47: 4649-4658.
[45] Martinez De Ilarduya A, Iruin JJ, Fernandez-Berridi MJ. Hydrogen bonding in blends of phenoxy resin and poly(vinylpyrrolidone). Macromolecules 1995; 28: 3707-3712.
[46] Lau C, Mi Y. A study of blending and complexation of poly(acrylic acid)/poly(vinyl pyrrolidone). Polymer 2001; 43: 823-829.
[47] Wissinger RG, Paulaitis ME. Swelling and Sorption in Polymer-CO2 Mixtures at Elevated Pressures. Journal of Polymer Science, Part B: Polymer Physics 1987; 25: 2497-2510.

[48] Von Schnitzler J, Eggers R. Mass transfer in polymers in a supercritical CO2-atmosphere. Journal of Supercritical Fluids 1999; 16: 81-92.
[49] Shieh YT, Su JH, Manivannan G, Lee PHC, Sawan SP, Spall WD. Interaction of supercritical carbon dioxide with polymers. II. Amorphous polymers. Journal of Applied Polymer Science 1996; 59: 707-717.
[50] Muth O, Hirth T, Vogel H. Polymer modification by supercritical impregnation. Journal of Supercritical Fluids 2000; 17: 65-72.
[51] Vartapetyan RS, Khozina EV, Chalykh AE, Skirda VD, Feldstein MM, rger J, Geschke D. Molecular Mobility in a Poly(ethylene glycol)-Poly(vinyl pyrrolidone) Blends: Study by the Pulsed Gradient NMR Techniques. Colloid Journal of the Russian Academy of Sciences: Kolloidnyi Zhurnal 2003; 65: 684-690.
[52] Feldstein MM, Roos A, Chevallier C, Creton C, Dormidontova EE. Relation of glass transition temperature to the hydrogen bonding degree and energy in poly(N-vinyl pyrrolidone) blends with hydroxyl-containing plasticizers: 3. Analysis of two glass transition temperatures featured for PVP solutions in liquid poly(ethylene glycol). Polymer 2003; 44: 1819-1834.