
Biological Investigation of Wing Motion of the Manduca Sexta

UNIVERSITY OF MEDICINE AND PHARMACY
„GRIGORE T. POPA” IASI
FACULTY OF PHARMACY
INVESTIGATION OF SOME BIOLOGICAL AND
BIOTOXICOLOGICAL PARAMETERS IN THE CHRONIC
EXPOSURE TO TOBACCO SMOKE
PhD THESIS SUMMARY
Scientific Coordinator
Prof. Dr. Elena BUTNARU
PhD Student Doina ŞPAIUC
IAŞI 2013

PhD thesis contains:
• 179 pages (Current stage of knowledge: 53 pages, personal
contributions: 110 pages)
• 87 figures
• 80 tables
• 200 references
• Approval Study
• Consent
• Three scientific articles -1 B+; 1 ISI; 1C
This summary keeps the PhD thesis' way of numbering for
contents, tables, figures and references.
Keywords: nicotine, cotinine, haematological parameters,
biochemical parameters, tobacco smoke.

Doctoral thesis abstract
1
TABLE OF CONTENTS
Pag.
1. Introduction. Target objectives 1
A. CURRENT STAGE OF KNOWLEDGE
2. TOBACCO. GENERAL AND HISTORICAL
CONSIDERATION
4
2.1. The discovery of tobacco and its properties. Tobacco
penetration in Europe
2.2. Tobacco penetration in Romania
4
5
3. COMPOSITION AND HARMFULNESS OF TOBACCO
SMOKE
5
3.1. Tobacco products and consumption mode 9
3.2. Nicotine. Chemical structure. Physico-chemical properties 10
3.2.1. Chemical structure 10
3.2.2. Physical properties 10
3.2.3. Chemical properties 11
3.2.4. Nicotine biosynthesis 12
3.2.5. Pharmaco-toxicological profile of nicotine 13
3.2.5.1. Toxicokinetic particularities 13
3.2.5.2. Toxicodynamic particularities 20
3.2.5.3. Toxic effects of nicotine 21
3.2.6. Acute intoxication with nicotine. Treatment 22
3.2.7. Chronic intoxication with nicotine. Tabagism 22
3.3. Carbon monoxide 26
3.4. Carcinogens 26
3.5. Additive substances 27
3.6. Tar
28
4. SMOKING EFFECTS ON HEALTH 29
4.1. Respiratory diseases 29
4.2. Cardiovascular diseases 30
4.3. Digestive diseases 30
4.4. Neoplasia with different localizations 30
4.5. Smoking and neuropsychiatric diseases 31
4.6. Smoking effects on drug action 32
4.7. Passive smoking 35

Doctoral thesis abstract
2
4.8. Withdrawal syndrome. Treatment 36
4.8.1. Treatment of the nicotine withdrawal 37
4.8.2. Replacement therapy of the nicotine from cigarettes 37
4.8.3. Drugs to combat nicotine withdrawal. Non-nicotine
therapy
41
4.8.4. Complementary methods to quit smoking 43
4.9. Fight against tobacco. The pharmacist's role in the fight
against smoking
44
5. COTININE, BIOMARKER OF THE INTOXICATION
WITH NICOTINE
46
5.1. Cotinine. Chemical structure. Physico-chemical properties.
Synthesis.
46
5.1.1. Physical properties 46
5.1.2. Chemical properties 46
5.1.3. Cotinine synthesis 47
5.2. Toxicokinetic particularities 48
5.2.1. Cotinine metabolism 49
5.2.2. Renal excretion of cotinine 49
5.3. Toxicodynamic particularities 50
5.4. Cotinine, biomarker of the intoxication with nicotine 50
5.4.1. Nicotine from food, source of cotinine
50
6. METHODS OF EXTRACTION AND ANALYSIS OF
NICOTINE AND COTININE
52
6.1. Methods of nicotine extraction from tobacco 52
6.2. Methods of nicotine and cotinine extraction from biological
fluids
53
6.3. Chromatographic and spectrophotometric methods used to
determine the nicotine and the cotinine
54
6.3.1. TLC, analysis method of nicotine 54
6.3.2. Methods for the determination of nicotine and cotinine
through high performance liquid chromatography (high-
performance liquid chromatography, HPLC).
54
6.3.2.1. HPLC 55
6.3.2.2. HPLC - mass spectrometry 55
6.3.3. Gas-chromatographic method (GC) 55
6.3.3.1. Gas chromatography 56
6.3.3.2. Gas chromatography-mass spectrometry 56
6.4. UV-VIS spectrophotometric methods 57

Doctoral thesis abstract
3
B. PERSONAL CONTRIBUTION
7. THE VARIATION OF THE BIOLOGICAL PARAMETERS IN
SMOKING PATIENTS FROM THE NEUROPSYCHIATRY
CLINIC WITHIN THE MILITARY CLINICAL EMERGENCY
HOSPITAL “DR. IACOB CZIHAC” IASI DURING 2006-2007
58
7.1. Introduction 58
7.2. Method 59
7.3. Results 59
7.4. Discussions 65
7.5. Conclusions
66
8. THE ANALYSIS OF THE BIOTOXICOLOGICAL
PARAMETERS: NICOTINE AND COTININE FROM
BIOLOGICAL FLUIDS
67
8.1. Contributions to the quantitative determination of nicotine in
biological fluids through UV spectrophotometry
67
8.1.1. Introduction 67
8.1.2. Materials and methods 68
8.1.2.1. Determination of nicotine in urine samples with internal
standard
73
8.1.2.2. Determination of nicotine in serum samples with internal
standard
74
8.1.2.3. Determination of nicotine in biological samples from
smokers
77
8.1.3. Results 78
8.1.4. Discussions 78
8.1.5. Conclusions 79
8.2. Development and validation of a method for simultaneous
quantitative determination of nicotine and cotinine in biological
samples by gas chromatography coupled with mass spectrometry
80
8.2.1. Introduction 80
8.2.2. Materials and methods 80
8.2.3. Results from the validation of the method for determination
of nicotine and cotinine in biological fluids by GC-MS
81
8.2.3.1. Specificity 86
8.2.3.2. Linearity 87
8.2.3.3. The limit of detection (LD) and the limit of quantification
(LQ)
93
8.2.3.4. Accuracy 93
8.2.3.5. Accuracy (Exactness) 96
8.2.4. Conclusions regarding the determination of nicotine and 96

Doctoral thesis abstract
4
cotinine in serum by GC-MS
8.3. Application of the GC-MS method for quantitative determination
of nicotine and cotinine in biological fluids
98
8.3.1. Introduction 98
8.3.2. Materials and method 99
8.3.3. Results 100
8.3.4. Discussions 105
8.3.5. Statistical analysis of nicotine and cotinine concentrations
using ANOVA test
108
8.3.6. Results obtained by using similar methods mentioned in the
specific literature
109
8.3.7. Conclusions 112
8.4. Study regarding the influence of tobacco smoke exposure on
biological parameters
113
8.4.1. Introduction 113
8.4.2. Method 114
8.4.3. Results 114
8.4.4. Discussions 115
8.4.5. Conclusions
118
9. CHEMICAL-TOXICOLOGICAL STUDIES TO DETERMINE
THE TOBACCO NICOTINE BY GAS CHROMATOGRAPHY
COUPLED WITH MASS SPECTROMETRY
119
9.1. Development and validation of a method for determination of
nicotine in tobacco by gas chromatography coupled with mass
spectrometry (GC-MS)
119
9.1.1. Introduction 119
9.1.2. Material and method 119
9.1.3. Results from validation of the method of determination of
nicotine in tobacco by GC-MS
120
9.1.3.1. Method development 120
9.1.4. Method Validation 123
9.1.4.1. Linearity 123
9.1.4.2. The limit of detection and the limit of quantification 124
9.1.4.3. Accuracy 124
9.1.4.4. Accuracy (Exactness) 126
9.1.5. Conclusions 127
9. 2. Application of the method of determination of nicotine in
tobacco samples by GC-MS
128
9.2.1. Introduction 128
9.2.2. Materials and method 128
9.2.3. Results 128
9.2.3.1. Determination of nicotine content in cigarettes 128
Doctoral thesis abstract
5
9.2.3.2. Determination of nicotine content in cigars and pipe
tobacco
131
9.2.3.3. Determination of the nicotine content in tobacco leaves 131
9.2.4. Discussion 132
9.2.5. Conclusions
135
10. STATISTICAL INTERPRETATION OF THE DATA FROM
THE PROGRAM “STOP SMOKING” DEVELOPED BY THE
PNEUMOLOGY HOSPITAL IASI, JANUARY 2009 - FEBRUARY
2012
136
10.1. Introduction 136
10.2. Method 137
10.2.1. Presentation of the statistical parameters from the program
“Stop Smoking” conducted by the Pneumology Clinical Hospital,
during January 2009 - February 2012
137
10.2.2. The target objective: determination of the factors that
influence the treatment for nicotine abstinence.
138
10.3. Results 141
10.3.1. Centralization of the statistical data from the program “Stop
smoking” during January 2009 - February 2012.
141
10.3.2. The distribution of the patients from the program “Stop
Smoking” by groups (group A and group B); the structure of the
groups A and B according to: sex (M/F), age (years), marital status,
children, health of patients.
141
10.3.3. Data regarding the patients' motivation to quit smoking and
the evaluation of the level of nicotine dependence.
146
10.3.4. Recommendations for the antinicotine treatment, adverse
reactions to the recommended treatment, final status of the patients.
150
10.3.5. Values of the carbon monoxide concentrations determined
during the initial and final visits of the patients, as a toxicological
biomarker of exposure to tobacco smoke.
157
10.4. Discussions regarding the statistical interpretation of the data
from the program “Stop Smoking”
158
10.5. Conclusions 167
11. CONCLUSIONS 168
12. REFERENCES 172
Annex 1
Study approval
Consent
List of the works that were published from the doctoral thesis

Doctoral thesis abstract
6

Doctoral thesis abstract
7
INTRODUCTION. TARGET OBJECTIVES
Tabagism is a widespread phenomenon due to its multi-
factorial character, affecting all age groups, predominantly the age
category between 14 and 35 years; it constitutes a major public
health issue because it has significant repercussions on the
individual and the domestic levels. The tobacco intoxication is the
most common of all known drug addictions.
The World Health Organization states in the report “Women
and the tobacco epidemic - Challenges for the 21st Century”, that
there are around 4 million deaths worldwide, every year, due to
smoking. By 2020, it is estimated that this number will increase
up to 8.4 million deaths, 70% of these will appear in the
developing countries. The same WHO report shows that at a
global level, 12% of all women smoke, compared to 48% of men,
but the percentage of women who smoke is increasing.
Smoking registers the second level of the prevalence of drug
use related to the Romanian population; 62.1% of the respondents
had smoked at least once throughout their lifetime, 31.3% of them
declared that they smoked daily. The study on the statistical
relation between smoking and age, revealed that the segment of
people between 25 and 34 years old, show the highest percentage
for the three indicators of prevalence: 70.5% for lifelong use, 46%
both for recent and current use.
The tobacco addiction (tabagism), according to the criteria
adopted by the World Health Organization in the International
Classification of Diseases, fits into the category: “Mental and
behavioral disorders due to the tobacco consumption” and it is
encoded with the disease code F.17.
Nicotine, the main alkaloid in the tobacco leaves, produces
addiction 6 to 8 times higher than alcohol, as high as heroin, 95 to
100% of smokers being addicted. The nicotine penetrates the body
via the respiratory system, cutaneous system, through the mucosal
and digestive systems; absorption is extremely fast. It is
biotransformed in hepatocytes (80-90%) through oxidation at the
level of the pyrrolidine nucleus to cotinine, the major metabolite

Doctoral thesis abstract
8
with a toxic action.
The cotinine is a toxicological biomarker in the intoxication
with nicotine, in the case of smokers of cigarettes, of smokers of
other tobacco products and also in the case of persons exposed to
tobacco smoke in the environment.
In the treatment of tobacco use, the necessity of
therapeutical intervention is asserted, following a well-established
plan coordinating and fitting the treatment measures to the
particularities of every individual.
The objectives of the thesis
The purpose of this thesis is to perform a complex
epidemiological, clinical and experimental study, that respond to
the topical questions related to the study of biological and
biotoxicological parameters in the case of chronic exposure to
tobacco smoke:
Variation of the biological parameters (hematological and
biochemical) in smoking patients
Study of the biotoxicological parameters: nicotine and
cotinine in biological fluids in smoking patients. In this
study we proposed:
- to develop a method of dosing the nicotine in biological fluids
by UV spectrophotometry
- to develop and validate a method for simultaneous determination
of nicotine and cotinine in biological fluids by gas
chromatography coupled with mass spectrometry (GC-MS)
- to apply the GC-MS validated method to the quantitative
determination of nicotine and cotinine in biological fluids in
smoking patients and the study regarding the influence of
exposure to tobacco smoke on biological parameters.
The development and the validation of a method for
quantitative determination of the nicotine content in
tobacco by GC-MS and the application of the method to
determine the nicotine content in different samples of
tobacco
The statistical analysis of the data from the program “Stop
Smoking”, has pursued:

Doctoral thesis abstract
9
- the identification of the level of nicotine addiction in patients
enrolled in the program
- information regarding the patients' motivation to quit smoking
- emphasizing the decisive role of treatment and medical
counseling to succeed in giving up smoking
- the rate of the patients who become abstinent after the
administered treatment.
The paper is structured in two parts: “The current state of
knowledge” (chapters 1-6) and “Personal contributions”
(chapters 7-10).
A. The current state of knowledge includes general and
historical considerations regarding tobacco and its properties,
information on the composition and harmfulness of tobacco
smoke, the toxicokinetic and toxicodynamic properties of the
nicotine and cotinine (marker of the intoxication with nicotine),
the disorders caused by the use of tobacco products, methods of
therapy for the nicotinic withdrawal, and methods of extraction
and analysis of nicotine and cotinine, according to the literature.

Doctoral thesis abstract
10
B. PERSONAL CONTRIBUTIONS
7. THE VARIATION OF THE BIOLOGICAL PARAMETERS IN
SMOKING PATIENTS FROM THE NEUROPSYCHIATRY CLINIC
WITHIN THE MILITARY CLINICAL EMERGENCY HOSPITAL “DR.
IACOB CZIHAC” IASI DURING 2006-2007
Introduction
The study aimed to establish possible correlations between the
variation of biological parameters in smoking subjects as opposed
to non-smoking subjects. The evaluation of the results obtained by
comparing the two groups (smokers / non-smokers) refered to: the
average values, the results of the ANOVA test and the deviations
of the values of these biological parameters as opposed to the
biological interval of reference.
Method
We reviewed retrospectively the charts of the patients
hospitalized in the Neuropsychiatry Clinic from the Military
Clinical Emergency Hospital “Dr. Jacob Czihac” Iasi, during
2006-2007.
The information about the patients was noted, including:
sex, age, occupation, diagnosis, duration of hospitalization,
smoker / non-smoker / alcohol consumer, administered treatment,
hematological parameters (ESR, WBC, RBC) and biochemical
parameters (GOT, GPT, GGT, glycemia, triglycerides and
cholesterol). The data of the study were introduced into an Excel
database and analyzed using the tools menu for data analysis
(ANOVA tests and descriptive statistics) to establish whether
there were statistically significant differences between the
hematological and the biochemical parameters of the two groups
composed by smokers and respectively, non-smokers.
Doctoral thesis abstract
11
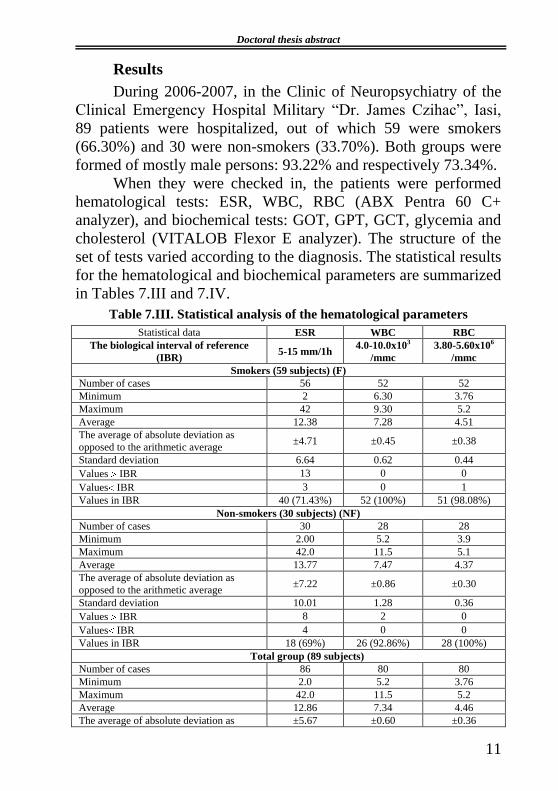
Results
During 2006-2007, in the Clinic of Neuropsychiatry of the
Clinical Emergency Hospital Military “Dr. James Czihac”, Iasi,
89 patients were hospitalized, out of which 59 were smokers
(66.30%) and 30 were non-smokers (33.70%). Both groups were
formed of mostly male persons: 93.22% and respectively 73.34%.
When they were checked in, the patients were performed
hematological tests: ESR, WBC, RBC (ABX Pentra 60 C+
analyzer), and biochemical tests: GOT, GPT, GCT, glycemia and
cholesterol (VITALOB Flexor E analyzer). The structure of the
set of tests varied according to the diagnosis. The statistical results
for the hematological and biochemical parameters are summarized
in Tables 7.III and 7.IV.
Table 7.III. Statistical analysis of the hematological parameters
Statistical data ESR WBC RBC
The biological interval of reference
(IBR) 5-15 mm/1h
4.0-10.0x10³
/mmc
3.80-5.60x10⁶
/mmc
Smokers (59 subjects) (F)
Number of cases 56 52 52
Minimum 2 6.30 3.76
Maximum 42 9.30 5.2
Average 12.38 7.28 4.51
The average of absolute deviation as
opposed to the arithmetic average ±4.71 ±0.45 ±0.38
Standard deviation 6.64 0.62 0.44
Values IBR 13 0 0
Values IBR 3 0 1
Values in IBR 40 (71.43%) 52 (100%) 51 (98.08%)
Non-smokers (30 subjects) (NF)
Number of cases 30 28 28
Minimum 2.00 5.2 3.9
Maximum 42.0 11.5 5.1
Average 13.77 7.47 4.37
The average of absolute deviation as
opposed to the arithmetic average ±7.22 ±0.86 ±0.30
Standard deviation 10.01 1.28 0.36
Values IBR 8 2 0
Values IBR 4 0 0
Values in IBR 18 (69%) 26 (92.86%) 28 (100%)
Total group (89 subjects)
Number of cases 86 80 80
Minimum 2.0 5.2 3.76
Maximum 42.0 11.5 5.2
Average 12.86 7.34 4.46
The average of absolute deviation as ±5.67 ±0.60 ±0.36
Doctoral thesis abstract
12
opposed to the arithmetic average
Standard deviation 7.95 0.90 0.42
Values IBR 21 2 0
Values IBR 7 0 1
Values in IBR 58 (67.44%) 78 (97.50%) 79 (89.75%)
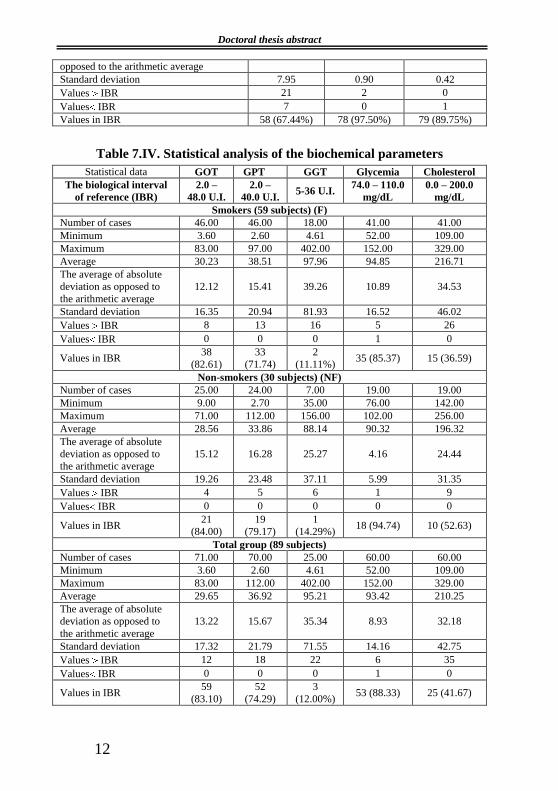
Table 7.IV. Statistical analysis of the biochemical parameters
Statistical data GOT GPT GGT Glycemia Cholesterol
The biological interval
of reference (IBR)
2.0 –
48.0 U.I.
2.0 –
40.0 U.I. 5-36 U.I.
74.0 – 110.0
mg/dL
0.0 – 200.0
mg/dL
Smokers (59 subjects) (F)
Number of cases 46.00 46.00 18.00 41.00 41.00
Minimum 3.60 2.60 4.61 52.00 109.00
Maximum 83.00 97.00 402.00 152.00 329.00
Average 30.23 38.51 97.96 94.85 216.71
The average of absolute
deviation as opposed to
the arithmetic average
12.12 15.41 39.26 10.89 34.53
Standard deviation 16.35 20.94 81.93 16.52 46.02
Values IBR 8 13 16 5 26
Values IBR 0 0 0 1 0
Values in IBR 38
(82.61)
33
(71.74)
2
(11.11%) 35 (85.37) 15 (36.59)
Non-smokers (30 subjects) (NF)
Number of cases 25.00 24.00 7.00 19.00 19.00
Minimum 9.00 2.70 35.00 76.00 142.00
Maximum 71.00 112.00 156.00 102.00 256.00
Average 28.56 33.86 88.14 90.32 196.32
The average of absolute
deviation as opposed to
the arithmetic average
15.12 16.28 25.27 4.16 24.44
Standard deviation 19.26 23.48 37.11 5.99 31.35
Values IBR 4 5 6 1 9
Values IBR 0 0 0 0 0
Values in IBR 21
(84.00)
19
(79.17)
1
(14.29%) 18 (94.74) 10 (52.63)
Total group (89 subjects)
Number of cases 71.00 70.00 25.00 60.00 60.00
Minimum 3.60 2.60 4.61 52.00 109.00
Maximum 83.00 112.00 402.00 152.00 329.00
Average 29.65 36.92 95.21 93.42 210.25
The average of absolute
deviation as opposed to
the arithmetic average
13.22 15.67 35.34 8.93 32.18
Standard deviation 17.32 21.79 71.55 14.16 42.75
Values IBR 12 18 22 6 35
Values IBR 0 0 0 1 0
Values in IBR 59
(83.10)
52
(74.29)
3
(12.00%) 53 (88.33) 25 (41.67)
Doctoral thesis abstract
13
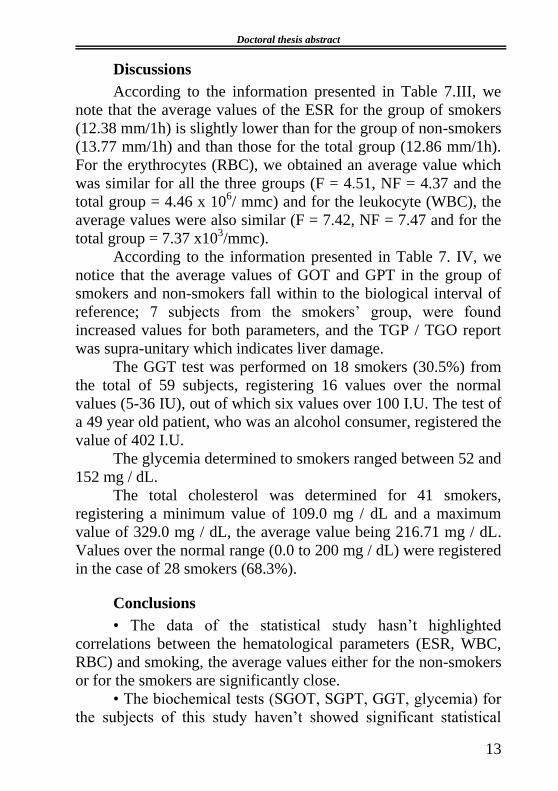
Discussions
According to the information presented in Table 7.III, we
note that the average values of the ESR for the group of smokers
(12.38 mm/1h) is slightly lower than for the group of non-smokers
(13.77 mm/1h) and than those for the total group (12.86 mm/1h).
For the erythrocytes (RBC), we obtained an average value which
was similar for all the three groups (F = 4.51, NF = 4.37 and the
total group = 4.46 x 10⁶/ mmc) and for the leukocyte (WBC), the
average values were also similar (F = 7.42, NF = 7.47 and for the
total group = 7.37 x10³/mmc).
According to the information presented in Table 7. IV, we
notice that the average values of GOT and GPT in the group of
smokers and non-smokers fall within to the biological interval of
reference; 7 subjects from the smokers’ group, were found
increased values for both parameters, and the TGP / TGO report
was supra-unitary which indicates liver damage.
The GGT test was performed on 18 smokers (30.5%) from
the total of 59 subjects, registering 16 values over the normal
values (5-36 IU), out of which six values over 100 I.U. The test of
a 49 year old patient, who was an alcohol consumer, registered the
value of 402 I.U.
The glycemia determined to smokers ranged between 52 and
152 mg / dL.
The total cholesterol was determined for 41 smokers,
registering a minimum value of 109.0 mg / dL and a maximum
value of 329.0 mg / dL, the average value being 216.71 mg / dL.
Values over the normal range (0.0 to 200 mg / dL) were registered
in the case of 28 smokers (68.3%).
Conclusions
• The data of the statistical study hasn’t highlighted
correlations between the hematological parameters (ESR, WBC,
RBC) and smoking, the average values either for the non-smokers
or for the smokers are significantly close.
• The biochemical tests (SGOT, SGPT, GGT, glycemia) for
the subjects of this study haven’t showed significant statistical

Doctoral thesis abstract
14
differences. The cholesterol level has recorded higher average
values for the smokers as compared to non-smokers.
• The statistical study conducted on a relatively small group,
for a period of only one year, showed no changes of the biological
parameters for the smokers as compared to the non-smokers.

Doctoral thesis abstract
15
8.THE ANALYSIS OF THE BIOTOXICOLOGICAL PARAMETERS:
NICOTINE AND COTININE FROM BIOLOGICAL FLUIDS
Nicotine and cotinine are the main biotoxicological
parameters that determine the acute and chronic intoxications
(tabagism) to persons who smoke or to those who use different
other treatments to substitute nicotine (chewing gum, patch, nasal
spray, oral inhaler, sublingual tablets).
8.1. Contributions to quantitative determination of nicotine in
biological fluids by UV spectrophotometry
Introduction
This study aimed to establish the methodology of
spectrophotometric UV determination of the nicotine. In the
toxicological research of nicotine, an important step is represented
by the isolation from the biological material (urine, serum).
Materials and method
Chemicals and reagents
• Nicotine (Merck) - density 1.009 g/mL
• Nicotine standard solution I: the nicotine was dissolved in
distilled water at 60°C. The stock standard solution = 2.176
mg/mL.
• Standard solution II:
a. the acid solution (50 g/mL): 1.15 mL of the nicotine
standard solution I is diluted with sulfuric acid 0.1 N to
volumetric flask of 50 mL.
b. the alkaline solution (50 g/mL): 1.15 mL of the nicotine
standard solution I was diluted with sodium hydroxide 0.1 N to
volumetric flask of 50 mL.
• Chloroform P.A. - Loch-Ner
• Absolute methanol - Chimopar S.A.
• Diethyl ether - Sigma Reidel - de Haën
• H2SO4 (Merck)
• NaOH Chemical Company

Doctoral thesis abstract
16
Equipment and glassware
• analytical balance SCALTEC, precision 0.0001 g
• water bath, Memmert WBU 45
• magnetic stirrer VEPL
• centrifuge
• separating funnels, filter funnels, pipettes, flasks,
cylinders, porcelain capsules, glass rods.
• spectrometer UV/VIS, T90/T90 type, Zuzi brand
Experimental data were evaluated using the software of the
spectrophotometer UVVIN 5.0, on Microsoft Windows
98/2000/XP program.
Procedure
Initially we recorded the absorption spectra of the nicotine
in the acid and alkaline medium, in the range of 200-300 nm; the
background correction of the apparatus/equipment was performed
with distilled water (Figures 8.2, 8.3).
Fig. 8.2. Spectrum of absorption of nicotine (50 g / mL) in acid medium
Note: The base line - H2SO4 0.1 N as opposed to distilled water
The acidic solution - 1.15 mL of the nicotine standard solution (2.176 mg / mL in
distilled water) + H2SO4 0.1 N up to 50 mL, reading as opposed to H2SO4 0.1 N
Peak: =260 nm, Abs. = 1.7641
0
4
1
2
3
2 00 4 003 00
A b s
W a v e le n g t h [n m ]
Doctoral thesis abstract
17
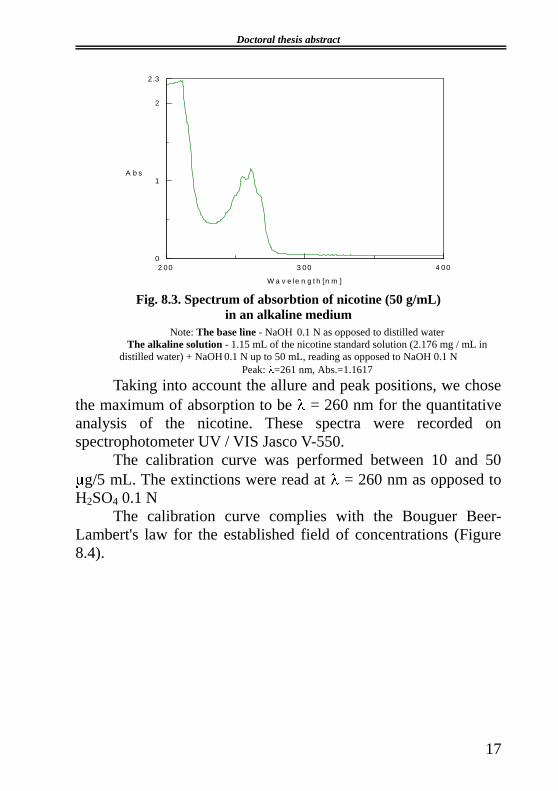
Fig. 8.3. Spectrum of absorbtion of nicotine (50 g/mL)
in an alkaline medium
Note: The base line - NaOH 0.1 N as opposed to distilled water
The alkaline solution - 1.15 mL of the nicotine standard solution (2.176 mg / mL in
distilled water) + NaOH 0.1 N up to 50 mL, reading as opposed to NaOH 0.1 N
Peak: =261 nm, Abs.=1.1617 Taking into account the allure and peak positions, we chose
the maximum of absorption to be = 260 nm for the quantitative
analysis of the nicotine. These spectra were recorded on
spectrophotometer UV / VIS Jasco V-550.
The calibration curve was performed between 10 and 50
g/5 mL. The extinctions were read at = 260 nm as opposed to
H2SO4 0.1 N
The calibration curve complies with the Bouguer Beer-
Lambert's law for the established field of concentrations (Figure
8.4).
0
2 .3
1
2
2 00 4 003 00
A b s
W a v e le n g t h [n m ]

Doctoral thesis abstract
18
Fig. 8.4. Calibration curve for nicotine
The nicotine was determined in the urine and serum
samples with internal standard (nicotine). The extraction yield of
the nicotine was better for the samples extracted in the alkaline
medium both in chloroform and in diethyl ether.
Determination of the nicotine in biological samples from
smokers
Nicotine was determined in 10 serum samples and 5 urine
samples from smoking subjects hospitalized in the Emergency
Military Hospital “Dr. James Czihac”, Iaşi. The separation of the
nicotine from the biological samples was performed by liquid-
liquid extraction of alkalinized samples (pH 9), using diethyl ether
as extraction solvent. The samples were worked in the same
conditions as the samples with internal standard. Absorbances
were read at spectrophotometer UV-VIS T90/T90 + as opposed to
0.1 N sulfuric acid at = 260 nm.
The results were expressed in g/mL.
In Table 8.VIII we synthetically presentated: the age, sex,
number of cigarettes smoked daily, nicotine concentrations in the

Doctoral thesis abstract
19
serum and urine samples ( g/mL), data regarding the provenance
of the biological samples (the initials of the patients’ name).
Table 8.VIII. The nicotine concentrations ( g / mL) in serum and urine
from smokers
Nr.
crt. N/P Sex Age
Number of
cigarettes
daily
smoked
The nicotine
concentrations
( g/mL)
Serum Urine
1 C.F. F 53 18 60.240 8.6630
2 G.E. F 50 15 25.642 3.7956
3 V.M. F 32 10 29.160 3.2972
4 C.M. F 56 15 41.768 6.0534
5 S.A. F 42 20 71.382 5.1738
6 S.S. M 36 18 26.522 -
7 L.C. M 38 18-20 26.522 -
8 C.D. M 51 25 109. 206 -
9 G.P. M 48 20 82. 524 -
10 H.P. M 43 18 45.872 -
Discussions
The group of patients comprised 10 people, five women
aged between 32 and 56 years old, with a daily consumption
between 15 and 20 cigarettes, and five men aged between 36 and
51 years old, with a daily consumption between 18 and 25
cigarettes. We had also urine samples from the female subjects.
In the case of the group of female subjects, the nicotine
concentrations ranged between 25.6420 and 71.382 g/mL in
blood samples, and between 3.2972 and 8.6630 g/mL in urine
samples. In the case of the group of male subjects, the nicotine
concentrations varied between 26.522 and 109.206 g/mL in
blood samples.
The serum values are high, which means that at the
absorption peaks of the nicotine ( = 260 nm) other substances
from the serum composition are interfering, such as the DNA
protein, with the same UV maximum absorption.
Doctoral thesis abstract
20
In the literature this method was quoted for the
determination of nicotine in different tissues of the Nicotiana
rustica plant, objects belonging to smokers (contact lenses) [130,
131, 132, 133].
Conclusions
In the case of the studies of analytical toxicology performed
by UV absorption spectrophotometry, we developed a method for
the quantitative determination of nicotine in biological samples
(serum, urine).
The UV spectrophotometric method is based on the
determination of nicotine using the absorption band at 260 nm.
In the research phase of the applicability of the
spectrophotometric method for the nicotine determination in
biological samples, the following experimental parameters were
studied and settled :
• nicotine is isolated from biological fluids (serum, urine)
through the liquid-liquid extraction at pH - alkaline (pH = 9);
• the optimum extraction solvent is diethyl ether;
• the linearity range investigated (10-50 g/ 5mL);
• in women, nicotine concentrations ranged between
25.6420 and 71.382 g/mL in serum and in urine between 3.2972
and 8.6630 g/mL;
• in men, the nicotine concentrations varied between 26.522
and 109.206 g/mL in blood samples;
• the nicotine concentrations varied depending on the
number of cigarettes consumed daily;
• the method could also be applied to the determination of
nicotine in cigarettes, in pharmaceutical products with nicotine
(chewing gum, drops, sublingual tablets, nicotine patches, nasal
sprays, or inhalation).
Doctoral thesis abstract
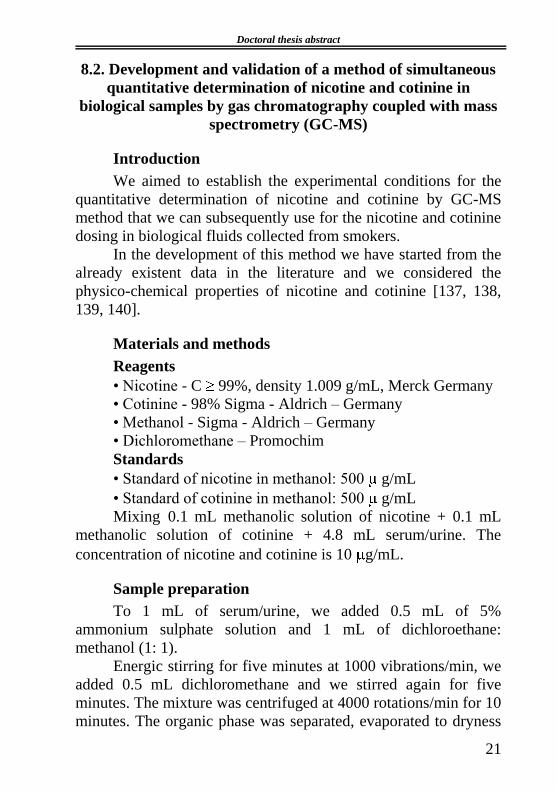
21
8.2. Development and validation of a method of simultaneous
quantitative determination of nicotine and cotinine in
biological samples by gas chromatography coupled with mass
spectrometry (GC-MS)
Introduction
We aimed to establish the experimental conditions for the
quantitative determination of nicotine and cotinine by GC-MS
method that we can subsequently use for the nicotine and cotinine
dosing in biological fluids collected from smokers.
In the development of this method we have started from the
already existent data in the literature and we considered the
physico-chemical properties of nicotine and cotinine [137, 138,
139, 140].
Materials and methods
Reagents
• Nicotine - C 99%, density 1.009 g/mL, Merck Germany
• Cotinine - 98% Sigma - Aldrich – Germany
• Methanol - Sigma - Aldrich – Germany
• Dichloromethane – Promochim
Standards
• Standard of nicotine in methanol: 500 g/mL
• Standard of cotinine in methanol: 500 g/mL
Mixing 0.1 mL methanolic solution of nicotine + 0.1 mL
methanolic solution of cotinine + 4.8 mL serum/urine. The
concentration of nicotine and cotinine is 10 g/mL.
Sample preparation
To 1 mL of serum/urine, we added 0.5 mL of 5%
ammonium sulphate solution and 1 mL of dichloroethane:
methanol (1: 1).
Energic stirring for five minutes at 1000 vibrations/min, we
added 0.5 mL dichloromethane and we stirred again for five
minutes. The mixture was centrifuged at 4000 rotations/min for 10
minutes. The organic phase was separated, evaporated to dryness

Doctoral thesis abstract
22
and it was repeated with 0.5 mL mixture of dichloromethane /
methanol (1: 1).
Apparatus
• Agilent Technologies 7890 gas chromatograph equipped
with Agilent Technologies 7683B auto-injector and mass
spectrometer detector Agilent Technologies 5975 inert MSD;
• mixer Vortex IKA VIBRAX VXR
• centrifugal
Chromatographic conditions
The analyses were performed on a chromatographic
column DB 5 MS (30 m x 0.25 mm, 0.25 µm film thickness) with
mobile phase consisting of helium with a flow rate of 1 mL/min;
the injector’s temperature was 250 ºC, the MSD quadrupole’s
temperature was 150 ºC. The temperature gradient in the column
compartment was initially 100 °C, followed by a ramp of
temperature – 10 °C/min up to 250 °C and immediately, a second
ramp - 20 °C/min up to 280° C and finally the temperature was
kept constant for 3.5 minutes; the analysis lasts for 20 minutes and
the last approximately 8 minutes are required to remove any
volatile components extracted simultaneously with nicotine and
cotinine in serum, as in the conditions described above. The
volume of solution injected was 0.5 µL, at a split ratio of 1/5.
Detection was performed by mass spectrometry in SIM mode
(single ion monitoring) (m/z for nicotine: 84 - basic peak, 133 and
162 - molecular peak; m/z for cotinine: 98 - basic peak, 118 and
176 molecular peak).
The nicotine and cotinine identification was performed by
spectral comparison with the Wiley spectra library for a standard
solution, then by comparing the retention times.
Interpretation of results: Agilent Technologies ChemStation
software.

Doctoral thesis abstract
23
Results achieved at the validation of the method for
determination of nicotine and cotinine in biological fluids by
GC-MS
To validate the method of simultaneous quantitative
determination of nicotine and cotinine in serum and urine by GC-
MS, the following parameters were monitored: specificity/
selectivity, linearity, limit of detection (LOD), limit of
quantification (QL), precision (system precision, method precision
and intermediate precision), accuracy [142, 143, 144, 145].
To determine the specificity of the method for the
simultaneous determination of nicotine and cotinine in serum, a
blank sample was processed in the mentioned conditions. The
sample thus prepared was analyzed by GC-MS in the specified
operating conditions. From the analysis of the obtained
chromatogram it can’t be noticed the apparition of any
chromatographic peak at the values of the retention times
corresponding to the nicotine (6.24 minutes) and cotinine (10.32
minutes) (Figure 8.20).
Fig. 8.20. Chromatograms for a blank sample
containing nicotine and cotinine
Doctoral thesis abstract
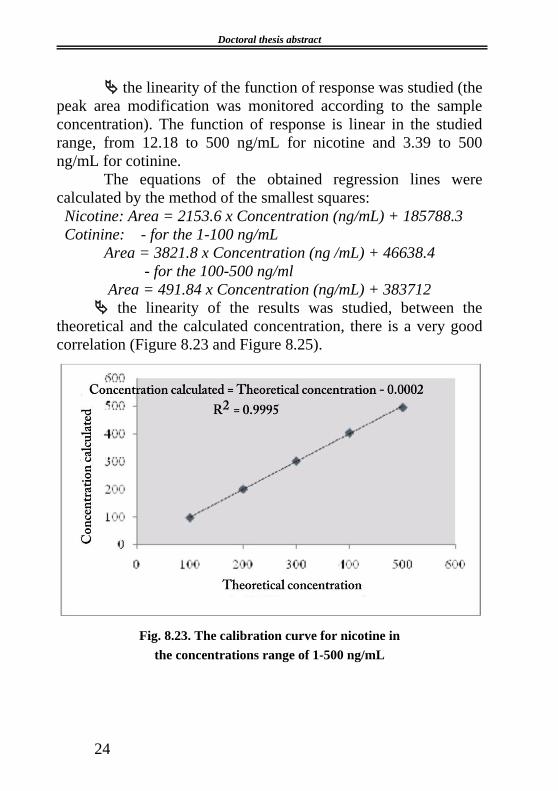
24
the linearity of the function of response was studied (the
peak area modification was monitored according to the sample
concentration). The function of response is linear in the studied
range, from 12.18 to 500 ng/mL for nicotine and 3.39 to 500
ng/mL for cotinine.
The equations of the obtained regression lines were
calculated by the method of the smallest squares:
Nicotine: Area = 2153.6 x Concentration (ng/mL) + 185788.3
Cotinine: - for the 1-100 ng/mL
Area = 3821.8 x Concentration (ng /mL) + 46638.4
- for the 100-500 ng/ml
Area = 491.84 x Concentration (ng/mL) + 383712
the linearity of the results was studied, between the
theoretical and the calculated concentration, there is a very good
correlation (Figure 8.23 and Figure 8.25).
Fig. 8.23. The calibration curve for nicotine in
the concentrations range of 1-500 ng/mL

Doctoral thesis abstract
25
Fig. 8.25. The calibration curve for cotinine in
the concentrations range of 100-500 ng / mL
the limits of detection were calculated (LOD)
• nicotine - 4.02 ng/mL (concentration range 1-500 ng/mL)
• cotinine -1.12 ng/mL (concentration range 1-100 ng/mL)
• cotinine - 13.29 (concentration range 100-500 ng/mL)
the limits of quantification (LQ), using the estimation of
these limits based on the standard deviation and of the regression
curve slope.
• nicotine -12.18 ng/mL (concentration range 1-100 ng/mL)
• cotinine - 3.39 n /mL (concentration range 1-100 ng/mL)
• cotinine - 40.27 ng/mL (concentration range 100-500 ng/
mL)
the working range was established: 12.18 to 500 ng/mL
for nicotine and 3.39 to 500 ng / mL for cotinine
to estimate the precision, it was determined:
• the repeatability of injection (the system precision) for a
number of 10 determinations, the values of relative standard
deviation (RSD) being:
Doctoral thesis abstract
26
- nicotine - 0.2505% (concentration range 1-100 ng/mL)
- cotinine - 0.28935% (concentration range 1-100 ng/mL)
- cotinine - 0.1950% (concentration range 100-500 ng/mL)
• the repeatability of analysis (the method precision) for
three independent solutions, at three different concentration levels,
for which the relative standard deviation (RSD), in the range 10-
50 ng / mL are:
- nicotine - 1.6804% (concentration range 1-100 ng/mL)
- cotinine - 1.0351% (concentration range 1-100 ng/mL)
- cotinine - 1.1279% (concentration range 100-500 ng/mL)
• the intermediate precision for three independent solutions
at three different concentration levels, for which the relative
standard deviation (RSD), in the range 10-50 ng / mL are:
- nicotine - 1.8915% (concentration range 1-100 ng/mL)
- cotinine - 1.2708% (concentration range 1-100 ng/mL)
- cotinine - 1.1927% (concentration range 100-500 ng/mL)
to estimate the exactness, the retrieval for a number of
three samples was determined for three different concentration
levels, thus obtaining an average retrieval of 100.7% (minimum
97.9%, maximum 103.6%) for nicotine, 99.97 % and 100.5%
(minimum 97.9%, maximum 101.3% and minimum 98.1%,
maximum 101.8%) for cotinine, in the range of 10-50 ng / mL.
The advantage of this established and validated method
consists in the extraction of the analytes in a single step, reduced
volume of reagents, reducing the analysis time, sensitivity and
specificity of the method.
Doctoral thesis abstract
27
8.3. Application of the GC-MS method for the quantitative
determination of nicotine and cotinine in biological fluids
Introduction
The gas chromatographic method coupled with mass
spectrometry (GC/MS) developed and validated for the
determination of nicotine and cotinine in biological fluids has
been applied to a lot of 40 smoking patients hospitalized in the
Internal medicine clinic of Emergency Clinical Military Hospital
“Dr. James Czihac”, Iasi, in September-November 2011. The
study was performed comparatively with 40 non-smoking patients
hospitalized in the same clinic. The objective of the study was to
correlate the levels of nicotine and cotinine in biological samples
of smokers with the number of cigarettes smoked daily and the
level of addiction to nicotine determined by the Fagerström test.
For the non-smoking patients, we had in view the
correlation of the nicotine and cotinine concentrations and the
level of exposure to tobacco smoke.
Materials and methods
Reagents and biological samples
• Methanol - Sigma - Aldrich - Germany
• Dichloromethane - Promochem
• Ammonium sulphate P.A. – Sellnord
• serum and urine from smokers and non-smokers
Sample collection and preparation
The volunteer patients who participated in this study signed
an information form on the study protocol. The level of addiction
to nicotine of smoking patients was determined by the Fagerström
test (score 1-4: mild addiction, score 5-8: moderate addiction,
score 9-12: severe addiction). The non-smoking patients specified
whether they were exposed to environmental tobacco smoke.
Biological samples were collected in the morning, before
eating. The venous blood was collected in tube without

Doctoral thesis abstract
28
anticoagulant or separator gel. The blood was allowed to clot at
room temperature and then it was centrifuged to separate the
serum.
Urine samples were collected in special sealed disposable
containers.
The biological samples were frozen at - 20˚C until
processing.
The preparation of the biological samples was presented in
Chapter 8.2.
Apparatus and chromatographic conditions
• The biological samples were analyzed with Agilent
Technologies 7890 gas chromatograph equipped with Agilent
Technologies 7683B autoinjector and mass spectrometer detector
Agilent Technologies 5975 inert MSD used to validate the
method, in the same chromatographic conditions.
• mixer Vortex IKA VIBRAX VXR
• centrifugal
Results
The information of the patients was centralized for the two
studied groups: sex, age, occupation, diagnosis. Men formed the
majority (80%), average age of patients for the two groups was
approximately 48 years. We mention that 22 patients in the group
of smokers and 15 patients in the group of non-smokers were
active military personnel who carried out annual medical
examinations who were performed the control tests; these patients
had no clear diagnosis, reason why the diagnosis influence was
not taken into account as the information was incomplete. Most of
the subjects were employed.
In Figure 8.28 there are graphic representations of the
average values of the nicotine and cotinine concentrations in
serum and urine, determined for the patients in the two studied
groups.

Doctoral thesis abstract
29
Fig. 8.28. The average concentrations of nicotine and cotinine in serum and
urine for smokers and non-smokers
Discussions
The information presented in figure 8.28 shows much higher
concentrations (about 3-10 times higher) of nicotine and cotinine
in serum and urine in the smokers’ group, compared with the non-
smokers’ group. The data confirm the level of nicotine addiction
(Fagerström test).
The average values of nicotine in serum were 135.18 ng/mL
in the smokers’ group and 13.87 ng/mL in the non-smokers’
group; in urine, the nicotine average value was 258.97 ng / mL for
smokers, and 23.04 ng/mL for non-smokers. Cotinine presented
an average value of 185.80 ng/mL in serum and an average 51.01
ng/mL in urine to the group of smokers. The group of non-smoker
135,18
258,97
185,80
51,01
13,87 23,04 19,03 18,81
0
50
100
150
200
250
300
serum urine serum urine
Nicotine concentration (ng/mL)Cotinine concentration (ng/mL)
ng
/mL
smokersnon-…
Doctoral thesis abstract
30
averaged a value of cotinine in serum of 19.03 ng/mL and 18.81
ng/mL in urine.
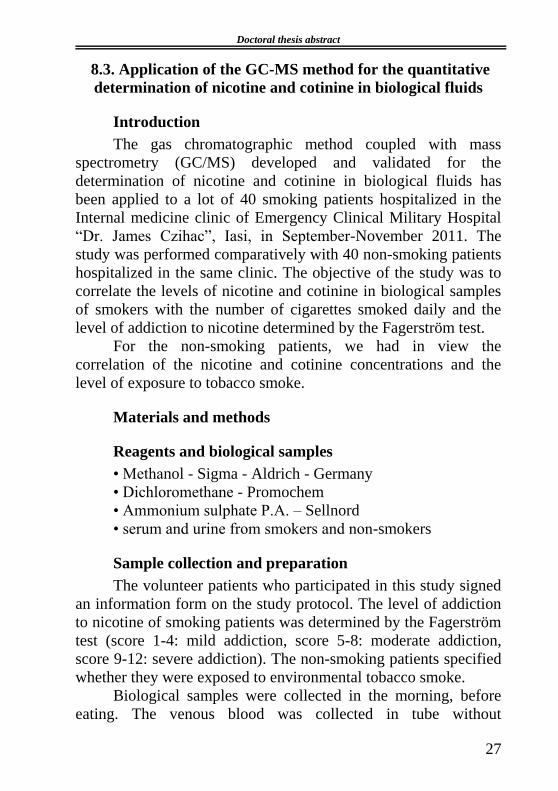
To highlight the correlation between the number of daily
smoked cigarettes respectively with the level of nicotine
addiction, and the nicotine and cotinine concentrations
determinated from the biological fluids, the smoking patients were
distributed into three groups, depending on the nicotine addiction
level (mild, moderate, severe). The average values of these
biotoxicological parameters are very close for patients with severe
nicotine addiction and for those with moderate nicotine addiction,
but higher than average values were identified for patients with
mild nicotine addiction (Figure 8.29).
Fig. 8.29. The variation of the average concentrations
of nicotine and cotinine in serum and urine in smokers depending on
nicotine addiction
Statistical analysis of the nicotine and cotinine
concentrations using ANOVA test
The values of the nicotine and cotinine concentrations from
biological samples (serum and urine) determined for smokers and
non-smokers (40 subjects from each group), presented in the table
8.XXVII, were compared using ANOVA test to determine if there
Mild
Moderate
Severe
0,00
50,00
100,00
150,00
200,00
250,00
300,00
350,00
400,00
450,00
500,00
serumNicotine
urineNicotine
serumCotinine
urineCotinine
76,41
150,27
68,83
34,42
149,04
284,80
210,87
54,37
246,50
463,73
421,80
85,58
ng/mL

Doctoral thesis abstract
31
are significant differences between the average values of the two
groups.
Table IV. The average values of the nicotine and cotinine concentrations in
serum and urine of the studied groups and ANOVA test (alpha = 0.5 and F
critical 3.96)
Concentration
Average values ANOVA Test
Co
mp
ari
son
of
the
av
erag
e of
gro
up
s
(sig
nif
ica
nt
/
insi
gn
ific
an
t)
Sm
ok
ers’
gro
up
(40
su
bje
cts
)
No
n-s
mo
ker
s’
gro
up
(40
su
bje
cts)
Th
e fu
ncti
on
va
lue
F
Prob
ab
ilit
y (
P)
Nicotine
(ng/mL serum) 135.18 13.87 174.18 << 0.01
Averages of the
two groups
differ
significantly
Nicotine
(ng/mL urine) 258.97 23.04 188.45 << 0.01
Averages of the
two groups
differ
significantly
Cotinine
(ng/mL serum) 185.80 19.03 60.54 << 0.01
Averages of the
two groups
differ
significantly
Cotinine
(ng/mL urine) 51.01 18.81 125.01 << 0.01
Averages of the
two groups
differ
significantly
Comparing the value of the function F with the value of the
Fcritic, the results are discussed as it follows: the value of the
function F for alpha = 0.5 being much higher than the value
Fcritic = 3.96 rejects the hypothesis of homogeneity of the sample
averages, therefore it results that the factor of grouping the
lots/groups had an important influence on the sample averages
(influence is very significant), ie P is 0.01, so the probability of
a significant influence is higher than 99.99%.
Results obtained by similar methods mentioned in the
literature
The results obtained for the quantitative determination of
nicotine and cotinine in biological fluids by the GC-MS method

Doctoral thesis abstract
32
are comparable to the results obtained by similar methods in the
literature (Table 8.XXVIII) [149, 159, 160, 161].
Table 8.XXVIII. Summarized situation of the minimum and maximum
concentrations of nicotine and cotinine
in various studies
Study
Nicotine
(minimum-maximum
concentration ng/mL)
Cotinine
(minimum-maximum concentration
ng/mL)
Serum/Plasma Urine Serum/Plasma Urine
No
n-s
mo
ker
s
Sm
ok
ers
No
n-s
mo
ker
s
Sm
ok
ers
No
n-s
mo
ker
s
Sm
ok
ers
No
n-s
mo
ker
s
Sm
ok
ers
Shin H.S. et.
al. 6-498 0-1590 4-96 0-2986
Moriya F and
Hashimoto Y
4.4-
62.1
158-
314
49.9-
217
68.9-
300
Massadeh AM
et. al. 76-700
181-
3702 36-890
1364-
1972
34.9-
65.19 21-4420 37-223 6-3946
Culea M 50 425-
1197 122
929-
6132
Our study 2.95 261.86 11.93 493.07 9.00 431.80 9.31 91.29
Conclusions
• The nicotine and cotinine concentrations were determined
in biological fluids (serum and urine) for 40 smoking and 40 non-
smoking patients hospitalized in the internal medicine clinic of the
Emergency Military Hospital “Dr. James Czihac”, Iasi, using a
validated GC-MS method.
• Statistical results show much higher concentrations (about
3-10 times) of nicotine and cotinine in serum and urine in the
smoking patients compared with the non-smoker patients.
• The nicotine and cotinine concentrations in serum and
urine determined in smoking patients ranged between: 47.99 and
439.07 ng/mL for nicotine and between 27.35 and 431.80 ng/mL
for cotinine.
• The nicotine and cotinine concentrations in serum and
urine determined in non-smoking patients ranged from: 2.95 and
36.13 ng/mL for nicotine and between 9.00 and 30.76 ng/mL for
cotinine.

Doctoral thesis abstract
33
• For the smoking patients a correlation was established
between the level of nicotinic addiction (mild, moderate, severe),
the number of cigarettes smoked daily, and the nicotine and
cotinine concentrations in serum and urine. The data confirms the
level of addiction to nicotine (Fagerström test).
• The patients with moderate and severe nicotinic addiction
had close average values of nicotine and cotinine concentations in
biological fluids, but higher compared to the values of these
parameters for the patients with mild nicotinic addiction.
• The non-smoking patients exposed to environmental
tobacco smoke at home and/or at work, showed no significant
differences of the average values of nicotine and cotinine
concentrations in biological fluids compared to the patients who
were not exposed to environmental tobacco smoke and for this
reason we considered that this group is homogeneous.
• The results obtained from the quantitative determination of
nicotine and cotinine in biological fluids from smokers and non-
smokers, comply with the results obtained by gas
chromatographic methods quoted in the specific literature.
8.4.The study regarding the influence of the exposure to
environmental tobacco smoke on the biological parameters
Introduction
In this chapter we have studied the correlation between the
concentrations of the nicotine and cotinine in biological fluids
determined by the validated GC-MS method, the level of
addiction to nicotine and the biological parameters
(haematological and biochemical parameters) and how they are
influenced in chronic exposure to tobacco smoke.
Method
We analyzed the hematological parameters (ESR, RBW,
RBC) and the biochemical parameters (GOT, GPT, glycemia,
triglycerides, cholesterol) of the smokers group compared with the

Doctoral thesis abstract
34
control goup, non-smoker patients, in the context of the nicotine
and cotinine concentrations determined in serum and urine.
From the 40 smokers, we selected 25 subjects consuming
more than 10 cigarettes/day (moderate and severe dependence);
from the non-smokers’ group we selected 25 patients, eliminating
the patients who were exposed to environmental tobacco smoke.
We also removed the subjects who didn't have all the determined
hematological and biochemical parameters.
Results and Discussion
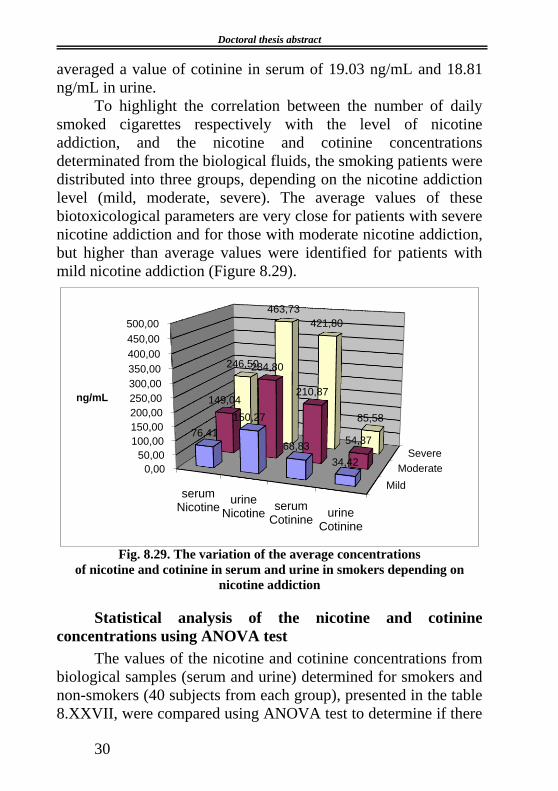
The data presented in Table 8.XXXI and Figure 8.33 shows
the average values of the nicotine and cotinine concentrations in
the biological fluids significantly higher for the smoking patients
compared to those of the non-smokers, confirming the statistical
results and conclusions presented in Chapter 8.3.
Table 8.XXXI. The average concentrations of the nicotine and cotinine
concentrations in serum and urine for selected groups and the ANOVA
test (alpha = 0.5 and Fcritic = 4.04)
Co
nce
ntr
ati
on
Average value ANOVA Test
Comparison of
average
concentrations
determined for the
groups of 25 subjects
(significant /
insignificant)
Sm
ok
ers
No
n-s
mo
ker
s
Th
e a
ver
ages
rati
o
Lo
t S
mok
er /
no
n-s
mo
ker
Va
lue
of
the
fun
ctio
n F
Prob
ab
ilit
y
(P)
Nicotine
(ng/mL
serum)
158.20 13.71 11.54 255.09 < 0.01 The averages differ
significantly
Nicotine
(ng/mL
urine)
305.25 22.05 13.84 255.87 < 0.01 The averages differ
significantly
Cotinine
(ng/mL
serum)
225.63 18.77 12.02 70.66 < 0.01 The averages differ
significantly
Cotinine
(ng/mL
urine)
57.16 17.28 3.31 194.10 < 0.01 The averages differ
significantly
Doctoral thesis abstract
35
Fig. 8.33. The average of the nicotine and cotinine concentrations in serum
and urine
The values of the hematological and biochemical parameters
for the smoker and non-smoker groups were compared using the
ANOVA test to determine if there are significant differences
between the two groups and if the exposure to tobacco smoke,
evidenced by the nicotine and cotinine concentrations in
biological fluids, influence these parameters. Results of the
statistical analysis are shown in Table 8.XXXII and Figure 8.34.
158,2
305,25
225,63
57,16
13,71 22,05 18,77 17,280
50
100
150
200
250
300
350
serum urine serum urine
Nicotine concentration Cotinine concentration
ng
/mL
smokers
Doctoral thesis abstract
36
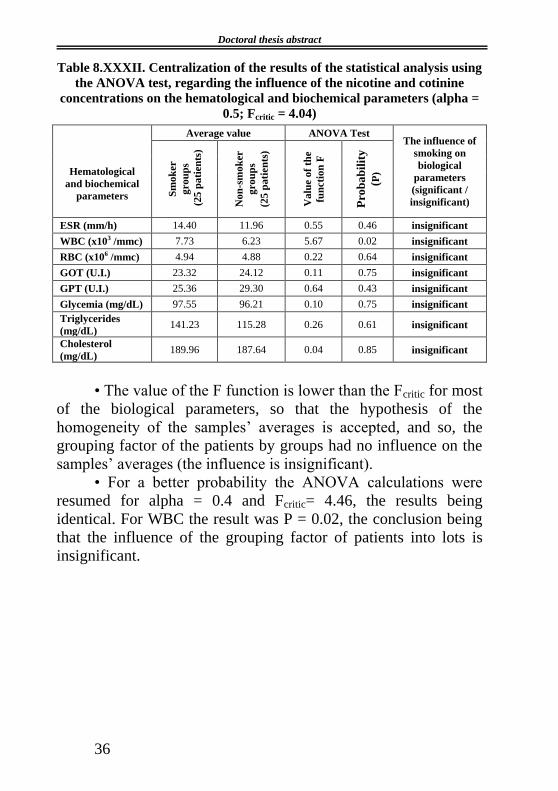
Table 8.XXXII. Centralization of the results of the statistical analysis using
the ANOVA test, regarding the influence of the nicotine and cotinine
concentrations on the hematological and biochemical parameters (alpha =
0.5; Fcritic = 4.04)
Hematological
and biochemical
parameters
Average value ANOVA Test The influence of
smoking on
biological
parameters
(significant /
insignificant)
Sm
ok
er
gro
up
s
(25
pa
tien
ts)
No
n-s
mo
ker
gro
up
s
(25
pa
tien
ts)
Va
lue
of
the
fun
ctio
n F
Prob
ab
ilit
y
(P)
ESR (mm/h) 14.40 11.96 0.55 0.46 insignificant
WBC (x103 /mmc) 7.73 6.23 5.67 0.02 insignificant
RBC (x106 /mmc) 4.94 4.88 0.22 0.64 insignificant
GOT (U.I.) 23.32 24.12 0.11 0.75 insignificant
GPT (U.I.) 25.36 29.30 0.64 0.43 insignificant
Glycemia (mg/dL) 97.55 96.21 0.10 0.75 insignificant
Triglycerides
(mg/dL) 141.23 115.28 0.26 0.61 insignificant
Cholesterol
(mg/dL) 189.96 187.64 0.04 0.85 insignificant
• The value of the F function is lower than the Fcritic for most
of the biological parameters, so that the hypothesis of the
homogeneity of the samples’ averages is accepted, and so, the
grouping factor of the patients by groups had no influence on the
samples’ averages (the influence is insignificant).
• For a better probability the ANOVA calculations were
resumed for alpha = 0.4 and Fcritic= 4.46, the results being
identical. For WBC the result was P = 0.02, the conclusion being
that the influence of the grouping factor of patients into lots is
insignificant.

Doctoral thesis abstract
37
Fig. 8.34. The variation of the average values of the hematological and
biochemical parameters
Conclusions
The exposure to tobacco smoke (evidenced by the nicotine
and cotinine concentrations in biological samples of smokers), as
a factor of influence of the hematological parameters- ESR, RBC,
WBC and biochemical parameters - GOT, GPT, glycemia,
triglycerides, cholesterol is insignificant, evidenced both in
patients with moderate and severe nicotine addiction.
The average values of the hematological parameters (ESR,
WBC, RBC) and biochemical parameters (glucose, triglycerides,
cholesterol) were highlighted, as slightly increased in the case of
smokers compared with those in the case of the non-smokers. The
results obtained in this study were correlated with the data from
the literature [111, 116, 121, 122, 175, 176].
VSH (mm/h)WBC (x1000/
mmc)
RBC
(x1000000/mm
c)
GOT (U.I.) GPT (U.I.)Glycemia
(mg/dL)
Triglycerides
(mg/dL)
Cholesterol
(mg/dL)
smokers 14,4 7,73 4,94 23,32 25,36 97,55 141,23 189,96
non-smokers 11,96 6,23 4,88 24,12 29,3 96,21 115,28 187,64
0
20
40
60
80
100
120
140
160
180
200

Doctoral thesis abstract
38
9. CHEMICAL AND TOXICOLOGICAL STUDIES OF NICOTINE
DETERMINATION IN TOBACCO BY GAS CHROMATOGRAPHY
COUPLED WITH MASS SPECTROMETRY
9.1. Development and validation of a method for nicotine
determination in tobacco by gas chromatography coupled
with mass spectrometry (GC-MS)
Introduction
In this chapter we aimed to develop and validate a method
for the quantitative determination of nicotine in tobacco by GC-
MS.
By the gas chromatographic analysis of tobacco samples
we monitored the nicotine separation from a tobacco organic
extract for the identification and quantitative determination. Due
to the high variability of the substances found in tobacco, in order
to achieve the separation, identification and quantitative
determination of nicotine by gas chromatography coupled with
mass spectrometry, we performed originally a series of tests in
order to determine the optimal experimental conditions for the
analysis. [179, 180, 181, 182].
The following parameters were monitored: specificity/
selectivity, linearity and linearity range, limit of detection and
limit of quantification, precision (repeatability), accuracy
(retrieval coefficient).
Materials and methods
Reagents
• Nicotine-density 1.009 g/mL (Merck)
• Methanol chromatographic purity (Merck)
• Dichloromethane chromatographic purity (Merck)
• Solvent: methanol/dichloromethane (1/1)
The standard nicotine solution - concentration 201.8 g/mL.

Doctoral thesis abstract
39
Apparatus and chromatographic conditions
Agilent Technologies gas chromatograph 7890 A, mass
spectrometer coupled with an Agilent Technologies 5975C inert
MSD as detection system.
• Mobile phase: helium at a flow rate of 1 mL/minute
• Stationary phase: gas chromatographic column DB 5 MS
(30 mx 0.25 mm, 0.25 μm)
• The injector’s temperature was 250 C. The temperature
gradient in the column compartment: increased from 100 C to
190 C with a growth rate of 10 C /min, followed by an increased
of 20 C/min to 280 C where the temperature was kept constant
for another 5 minutes.
• MSD source temperature was 230 C, MSD quadrupole
temperature was 150 C. Acquisition mode spectra: SCAN
(tracing all the lines in the mass spectrum);
• the followed table field was : 10-450 atomic mass units.
Interpretation of results: Agilent Technologies ChemStation
software.
The results obtained from the validation of the method
of nicotine determination from tobacco by GC-MS
We validated a method for the nicotine analysis by gas
chromatography coupled with mass spectrometry, establishing the
working conditions [142-145].
the volume of the solution injected was 0.3 L and split
ratio of 1/10 to the input port of the injector which has a
temperature of 250 C;
detection was performed by mass spectrometry, MSD
source temperature of 230 C and the MSD quadrupole
temperature of 150 C;
nicotine identification was performed by comparing
spectra with Wiley spectra library.
the linearity of the function of response was studied (the
peak area modification depending on the sample concentration

Doctoral thesis abstract
40
was monitored). The function of response is linear in the studied
range (1.01 to 201.8 g/mL) (Figure 9.6). The equation for the
regression slope obtained was calculated by using the method of
least squares: Area = 4877.4 x Concentration ( g/mL) +
1569486.174;
Fig. 9.6. Calibration curve for the nicotine determination
in tobacco by GC-MS
the limit of detection (LOD = 3.6 g/mL) and the limit of
quantification (LQ = 10.8 g/mL) were calculated using the
estimation of these limits based on the standard deviation of the
regression slope.
To estimate the precision we determined:
the repeatability of the injection (precision system) for a
number of 5 determinations, the relative standard deviation (RSD)
being 0.3763%;
the repeatability of the analysis (method precision) for
three independent solutions at three different concentration levels,
the relative standard deviation (RSD) is 0.6562% in the range of
70.63 -131.17 g/mL;

Doctoral thesis abstract
41
the intermediate precision for three independent solutions
at three different concentration levels for which the relative
standard deviation (RSD) is 0.7121% in the range of 70.63-
131.17 g/mL.
To estimate the exactness, the recovery was determined
for a number of three samples at three different concentration
levels obtaining an average recovery of 100.28% over the range of
99.08 to 100.96 g / mL.
The GC-MS validated method was applied to determine
nicotine in various tobacco samples.
9.2. Application of GC-MS method to the quantitative
determination of nicotine in tobacco samples
Introduction
The developed GC-MS method for the dosage of nicotine
was used for its quantitative determination from various tobacco
samples: different types of cigarettes, cigars, pipe tobacco and
tobacco leaves.
Materials and methods
Reagents
• methanol chromatographic purity (Merck)
• dichloromethane chromatographic purity (Merck)
• mixer Vortex IKA VIBRAX VXR
• centrifugal
• laboratory glassware
Apparatus and chromatographic conditions
The analyses were performed on the same equipment used
in the validation of the method, under the same experimental

Doctoral thesis abstract
42
conditions used for the GC-MS determinations in order to validate
the method.
The nicotine was identified by comparing the retention peak
times corresponding to the chromatograms of tobacco extracts
with the chromatogram of a standard solution containing nicotine,
and by comparing the mass spectra.
Using the peak areas corresponding to nicotine, the nicotine
concentration was calculated using the equation of the calibration
curve obtained from the linearity study of this method.
Tobacco samples
A number of 39 samples of tobacco were analyzed, namely:
- 31 samples from different cigarettes types,
corresponding to 15 brands, purchased from local
retail poits
- five samples of cigars
- one sample of pipe tobacco
- two samples of tobacco leaves, from two geographical
regions (Timisoara and Iasi)
Preparation of samples
The samples of tobacco (1.0-1.5 g) were extracted in a
mixture of methanol/dichloromethane (1/1, v/v) by stirring for one
hour at 500 vibrations/min. After filtration, the solution was
diluted at 50 mL, followed by another dilution of 1 mL to 4 mL
with the same solvent; 0.3 µL of these solutions were injected in
the GC/MS instrumentequipment in the mentioned conditions.
For each sample, three measurements were made.
The nicotine content was expressed in mg/g tobacco.
The statistical evaluation of the results was performed using
Microsoft Excel.
Results and discussion
After the GC/MS analysis, the peak of nicotine was
identified and the peak area was measured.

Doctoral thesis abstract
43
In the figure 9.7 as an example, there is the chromatogram
for the Jewels vanilla cigar sample, at the retention time of 6.23
minutes.
Figure 9.7. Gas chromatogram for Jewels vanilla cigar sample
In the conditions of the proposed method (extraction in
methanol/dichloromethane (1/1, v/v) and analysis by GC - MS,
there are no additional peaks at retention times close to that of
nicotine (approximately 6.2 minutes). Furthermore, by comparing
the mass spectrum of the peak corresponding to nicotine with
those from spectral libraries (Wiley) a high purity is obtained
(over 98%). These arguments demonstrate that other components
present in the samples of tobacco (alkaloids or other compounds)
do not interfere.
In table 9.XIII we tabulated the minimum, average and
maximum measurements of nicotine content in tobacco samples
that were analyzed.

Doctoral thesis abstract
44
Table 9.XIII. The minimum, average and maximum measurements of
nicotine content from cigarettes, cigars, pipe tobacco and tobacco leaves
mg nicotine/
g tobacco Cigarettes
Cigars and pipe
tobacco Tobacco leaves
Minimum 10.14 13.15 -
Average 15.35 22 26.79
Maximum 21.15 28.38 -
Fig. 9.11. The average values of nicotine determined in tobacco samples
Figure 9.11. compares the average content of the nicotine
from different tobacco samples studied.
Conclusions
The content in nicotine from 39 tobacco samples was
determined by using a validated GC/MS method.
For the 31 tobacco samples corresponding to 15 cigarette
brands, the variation limits of the nicotine content were more
restricted (10.14-21.15 mg/g) in comparison with the 6 samples of
cigars and pipe tobacco for which the nicotine content varied in a
larger range of values, 13.15-28.38 mg/g. For the two samples of
tobacco leaves, the nicotine’s concentration registered very close
values.
According to the average values, the highest nicotine
content was registered in the case of the tobacco leaves (26.79
15,35
22
26,79
0
5
10
15
20
25
30
Cigarettes Cigars and pipe tobacco Tabacco leavesmg
nic
oti
ne/g
to
bacco
Doctoral thesis abstract
45
mg/g), followed by cigars and pipe tobacco (22 mg/g), and by the
cigarettes (15.35 mg/g).
The obtained results are in accordance with the information
identified in the specific literature and confirm the method’s
applicability [187, 191, 192, 194].
Doctoral thesis abstract
46
10. STATISTICAL INTERPRETATION OF THE DATA FROM THE
PROGRAM “STOP SMOKING”, CONDUCTED BY THE
PNEUMOLOGY HOSPITAL IASI, DURING JANUARY 2009 -
FEBRUARY 2012
The purposes of the statistical interpretation of the data from
the program “Stop Smoking” provided by the Pneumology
Hospital Iaşi were:
• identifying the level of the addiction to nicotine of the
patients enrolled in the program
• identifying the reasons that underlie the intent to quit
smoking
• emphasizing the decisive role of the treatment and medical
advice in succeeding in quitting smoking
The study was performed on 190 patients divided into two
groups as it follows: group A, patients who presented associated
diseases - 81 patients (42.63%) and group B, patients without
other associated diseases - 109 patients (57.37%).
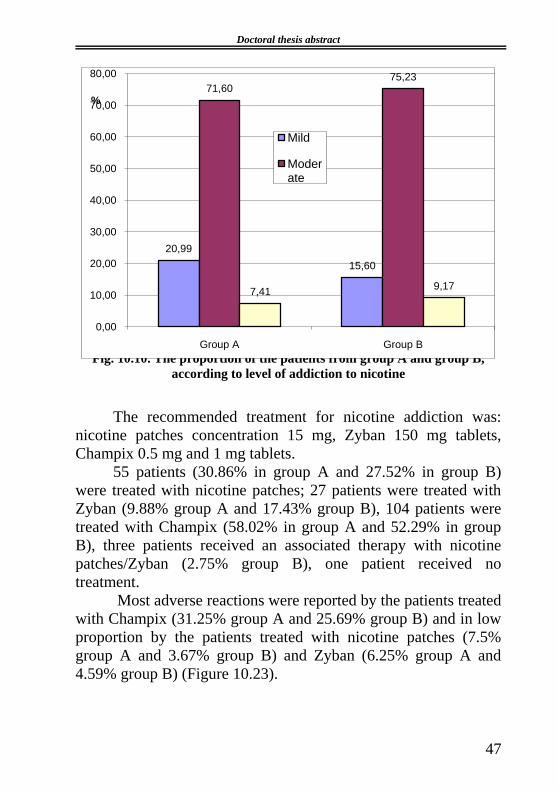
Figure 10.10 shows that in both groups, the largest share is
represented by the patients with moderate nicotine addiction (5-8
Fagerström scale), 71.60% in group A and 75.23% in group B.
Doctoral thesis abstract
47
Fig. 10.10. The proportion of the patients from group A and group B,
according to level of addiction to nicotine
The recommended treatment for nicotine addiction was:
nicotine patches concentration 15 mg, Zyban 150 mg tablets,
Champix 0.5 mg and 1 mg tablets.
55 patients (30.86% in group A and 27.52% in group B)
were treated with nicotine patches; 27 patients were treated with
Zyban (9.88% group A and 17.43% group B), 104 patients were
treated with Champix (58.02% in group A and 52.29% in group
B), three patients received an associated therapy with nicotine
patches/Zyban (2.75% group B), one patient received no
treatment.
Most adverse reactions were reported by the patients treated
with Champix (31.25% group A and 25.69% group B) and in low
proportion by the patients treated with nicotine patches (7.5%
group A and 3.67% group B) and Zyban (6.25% group A and
4.59% group B) (Figure 10.23).
20,99
15,60
71,6075,23
7,419,17
0,00
10,00
20,00
30,00
40,00
50,00
60,00
70,00
80,00
Group A Group B
%
Mild
Moderate

Doctoral thesis abstract
48
Fig. 10.23. The share of patients who presented adverse effects according
to the treatment administered
Following the treatment, 130 patients (68.42%) became
abstinent, 60 patients (31.58%) reduced the number of cigarettes
smoked per day.
This study emphasizes the role of the National Program
“Stop Smoking” in helping patients determined to quit smoking
through medical counseling and appropriate medication.
0,00
10,00
20,00
30,00
40,00
50,00
60,00
70,00
80,00
90,00
Mild Moderate Severe Total number of patients
8,224,11 2,74
15,070,00 10,96 1,37
12,33
2,74
60,27
9,59
72,60
%
Champix
Doctoral thesis abstract
49
GENERAL CONCLUSIONS. ORIGINAL CONTRIBUTIONS.
PERSPECTIVES OF RESEARCH
GENERAL CONCLUSIONS
The research undertaken within this thesis led to the
following conclusions:
1. The statistical study of the hematological parameters
(ESR, WBC, RBC) and biochemical parameters (GOT, GPT,
GGT, glycemia and cholesterol) conducted on a relatively small
group, 89 patients, that included 59 smokers and 30 non-smokers
for a period of one year, revealed no significant changes in the
biological parameters in smoking patients compared to non-
smoking patients.
2. The spectrophotometric method in UV can be applied for
the nicotine determination in serum and urine, using the
absorption band from 260 nm, and the following experimental
parameters: nicotine is isolated from the biological material by
liquid-liquid extraction at pH - alkaline, the ethyl ether as
optimum extraction solvent, the linearity was investigated
between the limits: 10-50 g/5 mL. The nicotine’s concentration
ranged between 25.6420 and 71.382 g/mL in serum, and
between 3.2972 and 8.6630 g/mL in urine, in the case of the
group of women. In the case of men, the nicotine’s concentration
varied between 26.522 and 109.206 g/mL in serum.
3. The quantitative determination of the nicotine and
cotinine in biological samples by the validated gas
chromatographic method coupled with mass spectrometry (GC-
MS), required the validation and subsequently the application of
the protocol. To perform the analysis we used a gas
chromatograph Agilent Technologies 7890A, equipped with
autoinjector Agilent Technologies 7683B and mass spectrometer
detector Agilent Technologies 5975 inert MSD; the
chromatographic separation was achieved on a DB 5 MS column
(30 mx 0.25 mm, 0.25 μm), using helium as the mobile phase with

Doctoral thesis abstract
50
a flow rate of 1 ml / min with the following temperature gradient
in the column compartment: initially the column temperature was
100 ° C followed by a temperature ramp - 10°C / min up to 250°C
and immediately a second ramp - 20 °C/min up to 280°C and
finally the temperature is kept constant for another 3.5 minutes.
The validation parameters studied were: specificity,
linearity, limit of detection and limit of quantification, system
precision, method precision, intermediate precision and accuracy.
Linearity range was 12.18 to 500 ng/mL for nicotine and 3.39 to
500 ng/mL for cotinine.
4. The validated GC-MS method was applied to determine
the concentrations of nicotine and cotinine in biological fluids
(serum and urine) from 40 smokers and 40 non-smokers
hospitalized in the internal medicine clinic of the Clinical
Emergency Military Hospital “Dr. James Czihac”, Iaşi. In the case
of smokers, the nicotine and cotinine concentrations in serum and
urine ranged between 47.99 and 439.07 ng/mL for nicotine and
between 27.35 and 431.80 ng/mL for cotinine. In the case of non-
smokers, the determined nicotine and cotinine concentrations in
serum and urine were ranged between 2.95 and 36.13 ng/mL for
nicotine and between 9.00 and 30.76 ng/mL for cotinine. The data
suggests much higher concentrations (about 3 to 10 times higher)
of the nicotine and cotinine in serum and urine in the group of
smokers compared to the non-smokers.
For the smokers a correlation was established between the
level of nicotinic addiction (mild, moderate, severe), the number
of cigarettes smoked daily, and the nicotine and cotinine
concentrations in serum and urine. The data confirms level of
nicotinic addiction (Fagerström test).
The patients with moderate and severe nicotinic addiction
had close average values of nicotine and cotinine concentations in
biological fluids, but higher compared to the values of these
parameters in the case of patients with mild nicotinic addiction.
The non-smokers exposed to environmental tobacco smoke
at home and/or at work, showed no significant differences of the
average values of nicotine and cotinine concentrations in

Doctoral thesis abstract
51
biological fluids compared to the patients who were not exposed
to environmental tobacco smoke and for this reason we considered
that this group is homogeneous.
The results obtained to the quantitative determination of
nicotine and cotinine in biological fluids from smokers and non-
smokers, are in accordance with the results obtained by gas
chromatographic methods quoted in the specific literature.
5. The exposure to tobacco smoke (evidenced by the
nicotine and cotinine concentrations in biological samples of
smokers) as an influencing factor of haematological parameters-
ESR, RBC, WBC and biochemical parameters- GOT, GPT,
glycemia, triglycerides, cholesterol, is insignificant, evidenced
both in patients with moderate and severe level of nicotine
addiction.
There were highlighted average values of haematological
parameters (ESR, WBC, RBC) and biochemical parameters
(glucose, triglycerides, cholesterol) that are slightly increased in
smokers compared to non-smokers.
6. The quantitative determination of the nicotine in tobacco
by gas chromatography coupled with mass spectrometry was
performed using gas chromatograph Agilent Technologies 7890A,
by applying the GC-MS validated method. The validation
parameters were specificity, linearity, limit of detection and limit
of quantification, system precision, method precision,
intermediate precision and accuracy.
The concentration of nicotine in various samples of tobacco
was determined by the GC-MS validated method using a DB 5
MS column and helium as the mobile phase. Nicotine was
extracted from 39 tobacco samples with methanol/
dichloromethane (1/1, v/v). For the 31 tobacco samples
corresponding to 15 cigarette brands, the variation limits of the
nicotine content were more restricted (10.14-21.15 mg/g) in
comparison with the 6 samples of cigars and pipe tobacco for
which the nicotine content varied in a larger range of values,
13.15-28.38 mg/g. For the two samples of tobacco leaves, the
nicotine’s concentration registered very close values.
Doctoral thesis abstract
52
According to the average values, the highest nicotine
content was registered in the case of the tobacco leaves (26.79
mg/g), followed by cigars and pipe tobacco (22 mg/g), and by the
cigarettes (15.35 mg/g).
The obtained results are in accordance to the information
identified in the specific literature and confirm the method’s
applicability.
7. The statistical analysis of all the information from the
program “Stop Smoking” provided by Pulmonary Hospital Iasi
from January 2009-February 2012, intended to highlight the
importance of the anti-nicotine treatment and medical counseling
in quitting smoking. The study was performed on 190 patients
divided into two groups as it follows: group A, patients who had
associated diseases - 81 patients (42.63%) and group B, patients
without other associated diseases- 109 patients (57.37%).
The recommended treatment for nicotine addiction was:
nicotine patches with 15 mg concentration, Zyban 150 mg tablets,
Champix 0.5 mg and 1 mg tablets; following the treatment, 130
patients (68.42%) became abstinent, 60 patients (31.58%) reduced
the number of cigarettes smoked per day. Out of the 189 patients
who received medical treatment, 140 (77.04%) had moderate
nicotine addiction, 33 mild nicotine addiction (17.46%) and 16
patients (8.46%) had severe nicotine addiction.
55 patients were treated with nicotine patches (30.86% in
group A and 27.52% in group B), 27 patients were treated with
Zyban (9.88% group A and 17.43% group B), 104 patients were
treated with Champix (58.02% in group A and 52.29% in group
B), three patients received a combined treatment with nicotine
patches/Zyban (2.75% group B), one patient received no
treatment. Most adverse reactions were reported by the patients
treated with Champix (31.25% group A and 25.69% group B) and
in low proportion by the patients treated with nicotine patches and
Zyban. The study emphasizes the important role of the program
“Stop Smoking” in helping patients to quit smoking.

Doctoral thesis abstract
53
ORIGINAL CONTRIBUTIONS
The studies conducted within the thesis “Investigation of
some biological and biotoxicological parameters in chronic
exposure to tobacco smoke”, is reflected in the following original
contributions:
• The statistical analysis of the hematological parameters
(ESR, WBC, RBC) and biochemical parameters (GOT, GPT,
GGT, glycemia and cholesterol), in the case of smoking patients
compared to those in the case of non-smoking patients, using the
Anova test.
• The development of a quantitative method for the
determination of nicotine in biological samples (serum, urine) by
UV spectrophotometry using the absorption band from 260 nm.
• The development and the validation of a method for
simultaneous quantitative determination of the nicotine and
cotinine in biological samples (serum and urine) by gas
chromatography coupled with mass spectrometry (GC-MS) and
the application of this method in the the determination of nicotine
and cotinine in biological fluids, prelevated from smoking
subjects, compared to non-smoking subjects.
• The analysis regarding the influence of exposure to
tobacco smoke on hematological and biochemical parameters
correlated with the concentrations of nicotine and cotinine in
biological fluids determined by GC-MS, and the levels of
addiction to nicotine (Fagerström test).
• The development and the validation of a method for the
quantitative determination of nicotine in tobacco by GC-MS and
the evaluation of nicotine concentrations in different tobacco
products through this method.
• The statistical interpretation of the data from the program
“Stop Smoking” and the emphasis on the role of the anti-nicotine
therapy and medical counseling for successful smoking cessation.
Doctoral thesis abstract
54
PERSPECTIVES OF RESEARCH
The results obtained in this thesis provide the premises for
some new research directions:
• The monitoring of the hematological and biochemical
parameters in epidemiological studies on smoking subjects
compared to non-smoking subjects, in order to evaluate the effects
of smoking on health.
• The study on the rate of metabolism and elimination of the
nicotine and cotinine by analyzing biological samples prelevated
at different moments of a day, e.g. morning and evening.
• The analysis of the levels of nicotine and cotinine in
biological samples of smokers, depending on the number of
cigarettes smoked daily, on the brand of cigarettes and on the
nicotine content determined in the tobacco smoke for the brands
used.
• The analysis of other biotoxicological markers:
thiocyanates, carboxyhemoglobin, which may be used to assess
the level of exposure to smoke.
Doctoral thesis abstract
55
11. REFERENCES
111. Bennudez EA, Rifai N, Buring JE, et al. Relation between markers of systemic
vascular inflammation and smoking in wornen. Cardiol. 2002; 89: 1117-19.
116. Asgary S, Naderi GH, Ghannady A.Effects of cigarette smoke, nicotine and cotinine
on red blood cell hemolysis and their -SH capacity. Exp Clin Cardiol. 2005; 10(2): 116–119.
121. Ghazanfar AS, Syed SA. Effect of smoking on erythrocyte sedimentation rate (ESR)
and lipid profile in adults. Pakistan Journal of Medical & Health Sciences. Vol. 1 Issue, Mar. 2007.
122. Asgary S, Naderi GH, Sarrafzadegan N, Gharypur M. In vitro effect of nicotine and
cotinine on the susceptibility of LDL oxidation and hemoglobin glycosylation. Molecular and
Cellular Biochemistry. April 2003; Volume 246, Issue 1-2, 117-120.
130. Howelle JA, Hargis LG. Ultraviolet and light absorption spectrometry. Anal Chem
1982; 54(5): 171R-188R.
131. Crummett WB, Hummel RA. Ultraviolet spectrometry. Anal Chem 1970; 42(5):
239R-248R.
132. Pei-Hsing Lin Wu, Sharp WR. A rapid technique for the detection of nicotine in
developing tobacco seedlings. The Ohio Journal of Science 1973; 73(6): 353.
133. Bense T, Gastellú CE, La Buonora D. Smoke - Applied Spectroscopy, 1988; 42(6):
1131-1132.
137. Dhar P. Measuring tobacco smoke exposure: quantifying nicotine/cotinine
concentration in biological samples by colorimetry, chromatography and immunoassay methods. J
Pharm Biomed Anal. 2004 Apr 1;35(1):155-68.
138. Man CN, Gam LH, Ismail S, Lajis R, Awang R. Simple, rapid and sensitive assay
method for simultaneous quantification of urinary nicotine and cotinine using gas chromatography-
mass spectrometry. J Chromatogr B Analyt Technol Biomed Life Sci. 2006; 5;844(2):322-7.
139. Cognard E, Staub C. Determination of nicotine and its major metabolite cotinine in
plasma or serum by gas chromatography-mass spectrometry using ion-trap detection. Clin Chem
Lab Med. 2003 Dec;41(12):1599-607.
140. Jacob P 3rd, Wu S, Yu L, Benowitz NL. Simultaneous determination of
mecamylamine, nicotine, and cotinine in plasma by gas chromatography-mass spectrometry. J
Pharm Biomed Anal. 2000 Sep;23(4):653-61.
142. Yuwono M, Indryanto G. Validation of Chromatographic method of analysis,
Profiles of Drug Substances, Excipients, and Related Methodology, Vol. 32, Edited by Harry G.
Brittain, Academic Press, Elsevier, 2005, 243 – 262.
143. * * * ICH Topic Q2B: Validation of Analytical Procedures (CPMP / ICH / 281 /
95) – The European Agency for the Evaluation of Medicinal Products. 1996.
144. Robert L., Grob PhD., Eugen F., Barry PhD. Modern Practice of Gas
Cromatography 4 th Edition. ISBN 978-0-471-22983-4. 2004.
145. Roman L., Bojiţă M., Săndulescu R. Validarea metodelor de analiză şi control, Ed.
Medicală. 1998.
149. Culea M. Exposure Assessment of Nicotine and Cotinine by GC-MS. Indoor Air.
2004;14(2):83-6.
159. Shin HS, Kim JG, Shin YJ, Jee SH. Sensitive and simple method for the
determination of nicotine and cotinine in human urine, plasma and saliva by gas chromatography-
mass spectrometry. J. Chromatogr. B. Analyt. Technol. Biomed.Life Sci. 2002 ;Mar .25.769(1):177-
83.
160. Moriya F, Hashimoto Y. Nicotine and cotinine levels in blood and urine from
forensic autopsy cases. Leg Med (Tokyo). 2004; Jul;6(3):164-9.
161. Massadeh A.M., Gharaibeh A.A., Omari K.W. A single-step extraction method for
the determination of nicotine and cotinine in Jordanian smokers' blood and urine samples by RP-
HPLC and GC-MS. J Chromatogr Sci. 2009; Feb.47(2):170-7.
175. Bornemisza P, Suciu I. Effect of cigarette smoking on the blood glycemia level in
normals and diabetics. Med Interne. 1980; 18(4):353-6.
Doctoral thesis abstract
56
176. Zamir Ahmad Akbari M, Muhammad Sarwar Bhatti, Muhammad Shakoor. Lipid
profil in smokers. JAMC, 2000; Vol. 12, No. 3, 19-21.
179. Lisko JG, Stanfill SB, Duncan BW, Watson CH. Application of GC-MS/MS for the
Analysis of Tobacco Alkaloids in Cigarette Filler and Various Tobacco Species. Anal Chem. 2013
Feb 27.
180. Lee JG, Lee CG, Kwag JJ, Rhee MS, Buglass AJ, Lee GH. Fast analysis of nicotine
in tobacco using double-shot pyrolysisgas chromatographymass spectrometry. J Agric Food Chem.
2007; 55(4):1097-102.
181. Sheng LQ, Ding L, Tong HW, Yong GP, Zhou XZ, Liu SM. Determination of
Nicotine-Related Alkaloids in Tobacco and Cigarette Smoke by GC-FID. Chromatographia 2005;
Volume 62, Issue 1-2, 63-68.
182. Jibao Cai, Baizhan Liu, Ping Lin, Qingde Su. Fast analysis of nicotine related
alkaloids in tobacco and cigarette smoke by megabore capillary gas chromatography Journal of
Chromatography A. Volume 1017, Issues 1–2, 2003; 187–193.
187. Wu W., Ashley D.L., Watson C.H. Determination of nicotine and other minor
alkaloids in international cigarettes by solid-phase microextraction and gas chromatography/mass
spectrometry. Anal. Chem. 2002; Oct. 1;74(19):4878-84.
191. Kozlowski L.T., Mehta N.Y., Sweeney C.T., Schwarz S.S., Vogler G.P., Jarvis M.J.,
West R.J. Filter ventilation and nicotine content of tobacco in cigarettes from Canada, the United
Kingdom, and the United States. Tobacco Control, 1998; 7:369-375.
192. Fukumoto M., Kubo H., Ogamo A. Determination of nicotine content of popular
cigarettes. Vet Hum Toxicol. 1997; 39(4):225-227.
194. Vlase L, Filip L, Mândruţău I, Leucuţa SE. Determination of nicotine from tobacco
by LC-MS-MS. Studia Universitatis Babeş-Bolyai, Physica, L, 4b, 2005.


![Smoking produces rapid rise of [ C]nicotine in human brain · ORIGINAL INVESTIGATION Smoking produces rapid rise of [11C]nicotine in human brainMarc S. Berridge & Scott M. Apana &](https://static.fdocuments.in/doc/165x107/5f0a769b7e708231d42bc212/smoking-produces-rapid-rise-of-cnicotine-in-human-brain-original-investigation.jpg)