
Investigation of single-frequency high-power Raman fiber ...
162
University of New Mexico UNM Digital Repository Optical Science and Engineering ETDs Engineering ETDs 6-22-2015 Investigation of single-frequency high-power Raman fiber amplifier for guide star application Christopher Vergien Follow this and additional works at: hps://digitalrepository.unm.edu/ose_etds is Dissertation is brought to you for free and open access by the Engineering ETDs at UNM Digital Repository. It has been accepted for inclusion in Optical Science and Engineering ETDs by an authorized administrator of UNM Digital Repository. For more information, please contact [email protected]. Recommended Citation Vergien, Christopher. "Investigation of single-frequency high-power Raman fiber amplifier for guide star application." (2015). hps://digitalrepository.unm.edu/ose_etds/42
Transcript of Investigation of single-frequency high-power Raman fiber ...

University of New MexicoUNM Digital Repository
Optical Science and Engineering ETDs Engineering ETDs
6-22-2015
Investigation of single-frequency high-powerRaman fiber amplifier for guide star applicationChristopher Vergien
Follow this and additional works at: https://digitalrepository.unm.edu/ose_etds
This Dissertation is brought to you for free and open access by the Engineering ETDs at UNM Digital Repository. It has been accepted for inclusion inOptical Science and Engineering ETDs by an authorized administrator of UNM Digital Repository. For more information, please [email protected].
Recommended CitationVergien, Christopher. "Investigation of single-frequency high-power Raman fiber amplifier for guide star application." (2015).https://digitalrepository.unm.edu/ose_etds/42

i
Christopher L. Vergien Candidate Physics and Astronomy Department This dissertation is approved, and it is acceptable in quality and form for publication: Approved by the Dissertation Committee: Dr. Jean-Claude Diels, Chairperson Dr. James Thomas Dr. Ladan Arissian Dr. Iyad Dajani

ii
INVESTIGATION OF SINGLE-FREQUENCY HIGH-POWER
RAMAN FIBER AMPLIFIER FOR GUIDE STAR
APPLICATION
BY
CHRISTOPHER LEE VERGIEN
B.S., Physics, California State University Northridge, 2006
M.S., Optical Sciences and Engineering, University of New Mexico, 2009
DISSERTATION
Submitted in Partial Fulfillment of the Requirements for the Degree of
Doctor of Philosophy
Optical Science and Engineering
The University of New Mexico Albuquerque, New Mexico
December, 2014

iii
DEDICATION
I dedicate the work presented in this dissertation to my wife, Yeon Jeong. I give
my deepest expression of love and appreciation for your steadfast encouragement, and
the sacrifices you made during my graduate program. I could not have done this without
you.

iv
ACKNOWLEDGMENTS
I would like to express a special appreciation and thanks to my advisor Dr. Iyad
Dajani, you have been a remarkable mentor and personal friend. The dedication and time
you invested in me for my academic and professional career is astounding. You
encouraged my research and taught me how to grow as a scientist, for this I am eternally
grateful. Thank you.
I would also like to recognize Dr. Jean-Claude Diels for the dedication and
commitment to having me finish the doctorate program. I could not have completed the
program without your advisement.
I also thank my committee members, Dr. Ladan Arissian and Dr. James Thomas
for their time and advisement during the final stages of my graduate career.
I thank the leadership and management of the Air Force Research Laboratory and
Defense Threat Reduction Agency for support as I pursued my academic goals while
being employed. I also thank the following people for their help and encouragement:
Ramesh Shori, Clint Zeringue, Craig Robin, Art Lucero, Angel Flores, Louis Noble,
Harold Miller, Gerry Moore, and Alan Paxton.

v
INVESTIGATION OF SINGLE-FREQUENCY HIGH-POWER RAMAN FIBER
AMPLIFIER FOR GUIDE STAR APPLICATION
by
Christopher Lee Vergien
B.S., PHYSICS, CALIFORNIA STATE UNIVERSITY NORTHRIDGE, 2006
M.S., OPTICAL SCIENCES AND ENGINEERING, UNIVERSITY OF NEW MEXICO, 2009
PH.D., OPTICAL SCIENCES AND ENGINEERING, UNIVERSITY OF NEW MEXICO, 2014
ABSTRACT
This work presents theoretical, numerical, and experimental investigations of
power scaling of core-pumped single-frequency Raman fiber amplifiers operating at
1178 nm. A numerical model was developed that accounts for stimulated Raman
vi
scattering (SRS) and stimulated Brillouin scattering (SBS) in relation to the fiber mode
field diameter, length, seed power, and available pump power in both co-pumped and
counter-pumped configurations. The backward travelling Stokes light is initiated from
both spontaneous Brillouin and spontaneous Raman processes. In order to mitigate the
SBS process for further power scaling, a multi-step longitudinal temperature distribution
along the gain fiber was employed and optimized. Although higher amplifier efficiency is
obtained with higher seed power, the output power diminishes at SBS threshold if the
same length of fiber is considered. However, if the fiber length is optimized for a given
seed power, more power can be extracted; thus indicating further power scaling is
expected by constructing a two-stage amplifier system. As an initial experimental step, a
commercial off-the-shelf (COTS) fiber is used to obtain 10 W of single-frequency output
power through the application of a multi-step thermal gradient in a counter-pumped
configuration. A cutback experiment performed on the COTS fiber indicated a linear
relation between signal output and pump power at SBS threshold; a result that showed
agreement with the theoretical predictions. In addition, 18 W of output was achieved in
the single-stage amplifier by designing and utilizing an acoustically tailored fiber for SBS
suppression. Further power scaling was demonstrated by constructing a counter-pumped
two-stage amplifier system as predicted by the numerical model. In comparing co- and
counter-pumped systems, it was shown that while the latter preserves the single-
frequency characteristic of the seed laser, the former leads to spectral broadening of the
amplified signal output.

vii
TABLE OF CONTENTS
LIST OF FIGURES .......................................................................................................... x
LIST OF TABLES ....................................................................................................... xviii
Chapter 1 Introduction .................................................................................................... 1
Scope of Work ................................................................................................................ 1
Background ..................................................................................................................... 2
Rare Earth-Doped Fiber Lasers ...................................................................................... 5
Photonic Bandgap Fiber Lasers ...................................................................................... 9
Raman Fiber Lasers ...................................................................................................... 11
Laser Guide Star System ............................................................................................... 20
Laser Guide Star Requirements ................................................................................ 22
Laser Guide Star Technology ................................................................................... 25
Fiber Laser Technology for Laser Guide Star .......................................................... 27
Stimulated Brillouin Scattering Fundamentals ............................................................. 33
Significance of the Work .............................................................................................. 38

viii
Chapter 2 Theoretical Analysis of Raman Fiber Amplifier ....................................... 41
RFA Power Equations .................................................................................................. 41
Initiation of SBS from Brillouin and Raman Noise ...................................................... 47
Uniform Temperature Profile Simulations ................................................................... 49
Fiber Length and Seed Power Simulations ................................................................... 52
SBS Mitigation Techniques .......................................................................................... 58
Mode-Field Diameter .................................................................................................... 62
Multi-Step Temperature Profile Power Equations ........................................................ 64
Multi-Step Temperature Profile Simulations ................................................................ 67
Two-Stage RFA Simulations ........................................................................................ 72
Two-Signal RFA ........................................................................................................... 74
Power Equations ....................................................................................................... 74
Amplitude Equations ................................................................................................ 77
Simulations and Analysis .......................................................................................... 80
Chapter 3 Single-Stage RFA Experiment and Results ............................................... 84
Brillouin Gain Spectrum Measurements of COTS Fiber .............................................. 84
Characterization of Seed, Pump, and Wavelength Division Multiplexer (WDM)s ..... 88
Seed Laser ................................................................................................................. 89
50 W Pump Laser and WDMs .................................................................................. 91

ix
WDM ........................................................................................................................ 92
100 W Pump Laser .................................................................................................... 96
Co-Pumped Single-Stage RFA ..................................................................................... 97
Counter-Pumped Single-Stage RFA ........................................................................... 100
RFA Scalability with Pump Power ............................................................................. 106
Chapter 4 Acoustically Tailored Fiber and Two-Stage RFA .................................... 110
Acoustically Tailored Fiber Design ............................................................................ 110
Brillouin Gain Spectrum Measurements of Acoustically Tailored Fiber ................... 114
Single-Stage Acoustically Tailored RFA ................................................................... 117
Counter-Pumped Two-Stage RFA .............................................................................. 120
Co-Pumped Two-Stage RFA ...................................................................................... 124
Two-line RFA via Phase Modulation ......................................................................... 128
Chapter 5 Conclusion .................................................................................................. 131
Summary of Results ................................................................................................ 131
Suggested Future Work ........................................................................................... 133
References ...................................................................................................................... 134

x
LIST OF FIGURES
Figure 1: Double-clad fiber design. The core guides the signal light while the cladding is
designed to guide pump light. The outer cladding is typically composed of polymer
material. ...................................................................................................................... 5
Figure 2: (a) Full absorption (dotted) and emission (solid) cross-sections of Yb-doped
germanosilicate glass [13]. (b) Emission cross-sections at longer wavelengths. ....... 7
Figure 3: Most common rare-earth doped fiber emission wavelength ranges of interest. .. 8
Figure 4: Current state of the art results for various rare-earth doped fiber lasers and
Raman fiber lasers. ...................................................................................................... 9
Figure 5: Typical photonic bandgap fiber design with an air core [17]. ........................... 10
Figure 6: Schematic of amplification by stimulated Raman scattering in an optical silica
fiber. The insert shows the Raman Stokes interaction between a pump and signal
photon [24]. ............................................................................................................... 13
Figure 7: Raman gain spectrum for bulk silica for two cases when the pump and signal
are copolarized (solid curve) and ortogonally polarized (dashed curve). Spectra are
normalized to the peak of the copolarized spectrum [24]. ........................................ 16
Figure 8: The measured Raman gain efficiency spectra for three germaniosilicate fiber
types pumped at 1450 nm with differenet effective core areas [24]. ........................ 18
Figure 9: Scheme of an n th-order CW cascaded Raman fiber laser. ............................... 19
Figure 10: Typical sodium beacon guide star setup [32]. If a Rayleigh beacon is
considered, the distance will be 10-20 km rather than 90 km as shown. .................. 22

xi
Figure 11: Energy level diagram of a sodium atom described by the orbital-shell (Bohr
Model), the intermediate model (Na D Fine Structure), and nuclear spin model (Na
D2 Hyperfine Structure) [34]. ................................................................................... 24
Figure 12: Schematic diagram showing main subsystems and control loops of FASOR
developed by AFRL [36]. ......................................................................................... 26
Figure 13: Experimental setup of 1178 nm single-frequency amplification using a
photonic bandgap fiber [41]. ..................................................................................... 28
Figure 14: (a) Signal output power and backward power measurement from the Yb-PBGF
amplifier. (b) Output spectra of the seed (black curve) and amplified signal (blue
curve) [41]. ................................................................................................................ 29
Figure 15: Schematic diagram of a counter-pumped distributed feedback diode laser
seeded Raman amplifier [43]. ................................................................................... 31
Figure 16: A schematic diagram of the optical setup for coherent beam combination and
external cavity resonant frequency doubling [44]. ................................................... 32
Figure 17: (a) Schematic diagram of the laser system with a two stage amplifier and (b)
diagram of a single stage Raman fiber amplifier [45]. ............................................. 33
Figure 18: Schematic of stimulated Brillouin scattering in an optical fiber [48]. ............ 34
Figure 19: Raman signal evolution at SBS threshold for co- and counter-pumped cases
with optimized length and a pump power of 200 W. ............................................... 52
Figure 20: (a) Raman power and (b) efficiency as a function of seed power and fiber
length for co-pumping. Inset in figure shows linear dependence of Raman output
with pump power at SBS threshold for one of the seed cases. ................................. 53

xii
Figure 21: Stokes gain per unit length at SBS threshold for (a) 25 m fiber and (b) 150 m
fiber. The total gain is the sum of the Brillouin and Raman gain. ............................ 57
Figure 22: Power evolution of a typical Yb-doped amplifier in a co- and counter-pumped
configuration. ............................................................................................................ 59
Figure 23: Calculated signal power evolution (dotted), the designed strain distribution
(solid, green), and the applied strain distribution (solid, blue) along the fiber [45]. 61
Figure 24: Investigation of mode field diameter effect using a pump power of 200W
while the fiber length varied until SBS threshold is reached. SBS reflectivity is
shown in green and corresponds to each fiber length. .............................................. 63
Figure 25: (a) Raman power and (b) efficiency achieved for both co-pumping and
counter-pumping as a function of seed power and length of fiber using a three-step
temperature profile (i.e. four temperature regions). .................................................. 67
Figure 26: Linear dependence simulation of amplifier output with pump power at SBS
threshold at optimized length for a three-step temperature profile (i.e. four
temperature regions) seeded with 16 mW. ............................................................... 68
Figure 27: (a) The evolution of each Stokes signal in a 150 m fiber until SBS threshold
was reached. (b) The characteristic evolution of each Stokes channel at the
respective calculated length. ..................................................................................... 69
Figure 28: Three-step temperature profile (i.e. four different temperature regions) applied
to a 150 m fiber seeded with 16 mW showing the relative lengths of the fiber
segments. ................................................................................................................... 70
xiii
Figure 29: Raman signal evolution at SBS threshold for co- and counter-pumped cases
with optimized fiber length for both three-step temperature profile (i.e. four
temperature regions) and uniform temperature profile. ............................................ 71
Figure 30: Simulation results of output power at SBS threshold vs. seed power for the
acoustically tailored fiber described in [50]. Also, shown is the corresponding
optimal fiber length. .................................................................................................. 74
Figure 31: (a) The spatial evolution of the two Raman signals in a 150 m fiber for co-
pumped and counter-pumped configurations. (b) The spatial evolution of the
corresponding FWM sidebands. ............................................................................... 81
Figure 32: (a) The spatial evolution of the two Raman signals in a 25 m fiber for co-
pumped and counter-pumped configurations. (b) The spatial evolution of the
corresponding FWM sidebands. ............................................................................... 82
Figure 33: Experimental setup for the pump-probe technique for the Brillouin gain
bandwidth measurement. .......................................................................................... 86
Figure 34: Experimental data of the Brillouin gain spectrum in the PM980-XP fiber
obtained by conducting a pump-probe experiment. The peak gain occurs at a
Brillouin shift of approximately 15.9 GHz and the bandwidth is 78 MHz. .............. 87
Figure 35: Experimental data and the numerical fit corresponding to the pump-probe
study of the Brillouin gain in the PM980-XP fiber. The fit yielded a value for the
Brillouin gain coefficient of 1.2 × 10⁻¹¹ m/W. .......................................................... 88
Figure 36: Characterization of the Toptica seed laser using an optical spectrum analyzer.
................................................................................................................................... 89

xiv
Figure 37: Toptica seed laser polarization characterization for the azimuth and ellipticty
at the output from the fiber-coupled diode. .............................................................. 90
Figure 38: Degree of polarization for the Toptica seed laser. ........................................... 90
Figure 39: Power data for the 50 W IPG laser. The duration was 30 minutes and indicates
there is negligible polarization drift over time. The measurements at power meter 1
and power meter 2 compare the polarization cross talk. ........................................... 92
Figure 40: Characterization of the 50 W IPG pump laser indicating initial pump power,
available pump power, and WDM loss power. ......................................................... 93
Figure 41: WDM loss in dB as the pump power is increased to 88%. ............................. 94
Figure 42: 50 W IPG spectral content indicating there is second-order Stokes present
(green line). The second-order Stokes was suppressed (blue line) using a wavelength
division multiplexer (WDM). ................................................................................... 95
Figure 43: Spectral content of the IPG 1120 nm output at 50% and 90% of total output
power indicating relative rise in 1178 nm light as the output power is increased. The
1178 nm light is due to the second-order .................................................................. 97
Figure 44: Experimental setup with the co-pumping configuration used in an all
monolithic PM design. The output from the amplifier was frequency doubled using a
PPKTP single pass crystal to generate 589 nm signal. ............................................. 98
Figure 45: Initial Raman power generated from the experimental setup as a function of
launched pump power. .............................................................................................. 99
Figure 46: Picture showing output light from a single pass PPKTP crystal to demonstrate
frequency conversion to 589 nm signal. ................................................................. 100

xv
Figure 47: Experimental setup of the counter-pumped single-stage RFA. The WDMs
were used to combine/separate the different wavelengths. The TAP was used to
monitor the forward and backward traveling light and the amplifier output was angle
polished. .................................................................................................................. 101
Figure 48: 1178 nm signal and backward power vs. 1120 nm pump power for the Nufern
PM980-XP fiber for the cases of a two-step and uniform temperature profiles. The
application of thermal gradients led to 2.6x the output power of the uniform
temperature case. ..................................................................................................... 104
Figure 49: Stokes light spectrum as captured by a Fabry-Perot interferometer for two
different reflectivities. Due to gain narrowing, the bandwidth is much smaller than
the spontaneous Brillouin gain bandwidth. The plot in green is the captured
spectrum below SBS threshold at an output power of ~3 W, while that in blue was
obtained at ~3.8 W. ................................................................................................. 105
Figure 50: Spectral linewidth of the 1178 nm light at 10 W output showing it to be within
the resolution limit of the interferometer. No spectral broadening was observed for a
counter-pumped RFA. ............................................................................................. 106
Figure 51: Normalized signal power vs. normalized pump power at SBS threshold for
counter-pumped RFA. The fiber lengths used in the studies were varied from a
length of 55 m to 80 m in increments of 5 m. The data indicates a linear dependence.
................................................................................................................................. 108
Figure 52: Notional design of SBS mitigating fiber showing the radial profiles of the
acoustic velocity and optical index of refraction. ................................................... 113

xvi
Figure 53: Experimental setup of pump probe experiment. The pump power was
amplified up to 1 W by using an amplifier (Amp). ................................................. 114
Figure 54: BGS measurement of the acoustically tailored fiber at 40 °C and 80 °C. There
are multiple peaks associated with the fiber as well as one peak due to the connector
fiber. ........................................................................................................................ 115
Figure 55: (left) 1178 nm signal and backward power vs. 1120 nm pump power for the
Nufern PM980-XP fiber, and (right) similar plots for the acoustically tailored fiber
................................................................................................................................. 117
Figure 56: Single-frequency signal power vs. launched pump power for the acoustically
tailored RFA utilizing a thermal gradient. .............................................................. 118
Figure 57: Beam profile of the (left) acoustically tailored fiber and (right) spectral
linewidth of the 1178 nm light at 18Woutput, showing it to be within the resolution
limit of the interferometer. ...................................................................................... 120
Figure 58: Experimental setup of two-stage counter-pumped RFA. The first stage and
second stage are comprised of acoustically tailored fiber. A 3 W isolator (ISO) is
inserted between the amplifier stages to protect against backward travelling light.
................................................................................................................................. 122
Figure 59: 1178 nm output power vs. 1120 nm pump power for several seed powers. The
length of the RFA was ~25 m. For seed powers of 100 mW and 500 mW, the output
is pump limited; however, the output for 900 mW and 1200 mW was SBS limited.
................................................................................................................................. 124

xvii
Figure 60: Experimental setup of co-pumped second stage RFA. It is seeded through a
counter-pumped RFA. Both stages are comprised of acoustically tailored fiber. A 3
W isolator (ISO) is inserted between the amplifier stages to protect against backward
travelling light. ........................................................................................................ 125
Figure 61: Spectral content near 1178 nm as captured on a high-resolution optical
spectrum analyzer indicating spectral broadening as the pump power was increased
in a co-pumped second stage RFA. ......................................................................... 127
Figure 62: Amplified signal at ~5.2 W of 1178 nm output demonstrating generation of
multiple spectral lines through phase modulation. The separation between adjacent
sidebands is 886 MHz which corresponds after frequency doubling to the separation
between the D2a and D2b energy levels for sodium (Na). ........................................ 130

xviii
LIST OF TABLES
Table 1: Common fused silica fiber dopants and the qualitative effect” on acoustic and
optical refractive index. .......................................................................................... 112

1
Chapter 1
Introduction
Scope of Work
The scope of this dissertation is limited to single-frequency core-pumped Raman
fiber amplifiers operating at 1178 nm. Single-frequency in this context refers to laser
outputs possessing spectral linewidths on the order of several MHz or less. At these
linewidths, high conversion efficiencies are expected in nonlinear cavities where the
1178 nm radiation is frequency doubled to generate 589 nm radiation. However, the
generation of the light in the amplifier is challenging, as the linewidth is much narrower
than the Brillouin gain bandwidth. It should be noted that in theory and practice, the
effective stimulated Brillouin scattering (SBS) gain is just as large for fiber lasers
operating at several MHz as it is at several kHz.
Raman gain in an optical fiber can potentially occur at all wavelengths, but the
effort reported here is focused on the generation of 1178 nm light for use as a pump
source in an external second harmonic generation (SHG) single-pass crystal or cavity in
order to generate 589 nm light. The application here is to utilize the 589 nm light in a
sodium guide star beacon. A proof of principle to generate 589 nm light was
demonstrated via an external single-pass periodically poled potassium titanyl phosphate
(PPKTP) crystal. Other than this demonstration, the work in this dissertation pertains to
2
the modeling of single-frequency Raman fiber amplifiers, experimental results from the
implementation of SBS mitigation techniques, and power scaling of the 1178 nm light
using single-stage and two-stage amplifiers. While the numerical model developed
utilizes 1120 nm and 1178 nm as pump and seed sources, respectively, there is nothing in
principle that prevents this model from being applied to other wavelengths. Background
fiber losses at 1120 nm and 1178 nm are small at these wavelengths and have been
ignored in the numerical model. Nevertheless, these background losses, if significant, can
be accounted for in the model to capture Raman conversion at other wavelengths.
Similarly, the SBS mitigation techniques utilized in this work can, in practice, be
implemented at other wavelengths in order to achieve power scaling.
This research was performed at the Air Force Research Laboratory, Directed Energy
Directorate, on Kirtland AFB.
Background
Since the invention of the laser, there has been continued interest in developing
high-efficiency sources with near diffraction-limited beam quality. Ideally, these lasers
would be scalable to high power level while still being relatively compact. Towards this
goal, many laser materials and architectures have been studied over the past 50+ years.
Perhaps of all the laser architectures that have been investigated, none has seen more
rapid development and commercialization in the past two decades than the fiber laser.
Historically, the earliest demonstrations of fiber lasers are traced back to the work of

3
Snitzer et al. in the early 1960’s who demonstrated a flashlamp pumped neodymium
(Nd)-doped fiber amplifier operating at 1064 nm [1].
The development of fiber lasers would not have been possible without the massive
investment in telecommunications. One major research and development objective of the
telecommunication industry was the reduction in optical fiber loss. The early silica-based
optical fibers possessed very high losses (>1000 dB/km) [2]. But, following the work in
1970 by Kapron, Keck, and Maurer, the loss was reduced to < 20 dB/km [3]. By 1979,
the fiber loss has been reduced further to approximately 0.2 dB/km in the 1.55 µm region;
thus approaching the fundamental limit imposed by Rayleigh scattering [4]. Despite these
very low losses, optical transmission of information across long distances required, in the
early days, the use of periodically spaced electronic regenerators. Such regenerators
consisted of a photo-detector to detect the signal, electronic amplifiers, timing circuitry,
and a laser to re-launch the signal along the next span. These regenerators were limited in
performance by the speed of their electronic components. Therefore, it was readily
recognized that the development of optical amplifiers would provide a tremendous boost
to the fiber optic telecommunication industry.
Rare-earth doping of single-mode fibers was first demonstrated at Bell Telephone
Laboratories in 1983 [5]. Further work by a team of researchers at the University of
Southampton led to a lower loss single-mode rare-earth doped fiber. In 1987, erbium-
doped (Er-doped) fiber amplifiers were demonstrated independently and almost
simultaneously by two groups of researchers at the University of Southampton [6] and
AT&T Bell Laboratories [7]; thus marking the beginning of the “modern” era of fiber
4
lasers. Both amplifiers were pumped by dye lasers, and by 1989, Nakawaza et al.
reported on a diode pumped Er-doped laser [8]. By 1996, fiber amplifiers were being
utilized in long haul fiber optic systems. While the fiber optic telecommunication
industry continues to be one significant application area for fiber lasers, they have found
applications in several other areas to include material processing, remote sensing,
spectroscopy, and medicine. As an example, fiber lasers currently account for 20% of the
market for laser sources used for materials processing; which is more than twice their
market share from 5 years ago [9]. The advantages that fiber lasers offer for material
processing (relative to the currently used CO2 lasers) are compactness, faster cutting
rates, higher efficiencies, and lower operating and maintenance costs.
Over the past two decades, important developments in rare earth-doped lasers and
supporting optical components were reached. Double clad fiber designs, first proposed
by Snitzer et al. in 1988, were crucial in enabling power scaling in fiber lasers [10]. In
this design, the inner cladding is used to confine the signal light in the core, while the
outer cladding allows for confinement of the pump light (see Figure 1). Typically, the
outer clad is composed of polymer material, although all glass double clad designs have
been demonstrated. The rare earth dopant concentration in the core as well as the ratio of
the area of the core to that of the clad determines the pump absorption.

5
Figure 1: Double-clad fiber design. The core guides the signal light while the cladding is designed to guide pump light. The outer cladding is typically composed of polymer material.
In addition, development in the area of pump diode lasers has had a significant
impact on the maturation of fiber laser technology. In the early days of diode laser
development, major obstacles included poor spatial beam quality, high threshold current,
limited lifetime, and operation at cryogenic temperatures. While these obstacles were
overcome for the most part, the cost of laser diodes remained relatively high (>$500/W).
Nowadays, the cost of diodes operating at wavelengths of utility to pump rare-earth
doped fiber lasers can be as low as $10/W.
Rare Earth-Doped Fiber Lasers
With the improvement in performance of pump diode lasers, the output power
from fiber lasers continued to increase rapidly. Of all the rare earth dopants used in fiber

6
lasers, ytterbium (Yb) has so far proved to be the most scalable and versatile [11]. Power
scaling in erbium (Er)-doped fiber lasers had proved difficult primarily due to
concentration quenching by interionic energy transfer and homogeneous up-conversion
[12]. Concentration quenching is the reduction in the quantum efficiency of an ion with
increasing concentration. Researchers noted the fact that concentration quenching may
be avoided by improving the fabrication process to account for any clustering of ions.
Despite the improvement in the fiber fabrication processing, homogeneous up-conversion
imposes finite limits on the quantum efficiency of erbium-doped fiber amplifiers
(EDFA).
Yb-doped fiber lasers (YDFL) gained significant attention in the mid-90’s that
resulted in a detailed characterization of Yb-doped glass. Snitzer in Ref. [1], discusses
the advantages particular to Yb-doped fiber lasers relative to other rare earth dopants.
Specifically, the low quantum defect heating (for pump diodes operating at
97x nm) and relatively high permissible dopant concentrations (i.e., high pump
absorption per unit length) allow for significant power scaling. Additionally, YDFLs are
not subject to the complications of excited state absorption and concentration quenching
like other rare-earth dopants.
Figure 2 shows the absorption (dotted line) and emission (solid line) cross-
sections for Yb-doped glass fiber. Based on the spectroscopic properties, YDFLs can be
efficiently pumped with diodes operating at 915 nm or 976 nm. Typically, Yb-doped
amplifiers operate in the range of 1030-1090 nm. Figure 2 implies that operation in the
950-1030 nm and 1090-1200 nm regimes is possible. Yet, the major impediment to

7
operating over the full emission spectrum is amplified spontaneous emission (ASE),
which makes scalability at these wavelengths ranges highly problematic (see Figure 2b).
This point is elaborated further in this dissertation where difficulties associated with
generating 1178 nm light in YDFLs are discussed.
a.
b.
Figure 2: (a) Full absorption (dotted) and emission (solid) cross-sections of Yb-doped germanosilicate glass [13]. (b) Emission cross-sections at longer wavelengths.

8
Beyond the aforementioned rare earth dopants, other rare earth elements have garnered
interest within the fiber laser community. Some of these rare earth dopants include
thulium (Tm), holmium (Ho), neodymium (Nd) and praseodymium (Pr). Figure 3
illustrates some of the dopants and associated emission wavelengths.
Figure 3: Most common rare-earth doped fiber emission wavelength ranges of interest.
Apart from YDFLs, Tm-doped fiber lasers have so far proved to be the most scalable,
providing up to 1 kW of output with a near diffraction-limited beam quality [14]. Tm-
doped fiber lasers are typically pumped at ~790 nm, where efficient diodes are available.
At that wavelength, through a cross relaxation process, two Tm ions are excited for one
pump photon absorbed. Despite this impressive 1 kW result, it is well below the
maximum output demonstated in Yb-doped fiber laser which currently stands at 10 kW;
with good beam quality output [15]. Figure 4 provides a comparison of maximum output
power with near-diffraction limited beam quality obtained to date for Yb-, Er-, Tm-, and
Ho-doped fiber lasers.

9
Figure 4: Current state of the art results for various rare-earth doped fiber lasers and Raman fiber lasers.
Photonic Bandgap Fiber Lasers
Photonic bandgap fiber (PBGF) is an alternative to bridge part of the spectral gap
between rare earth-doped fibers shown in Figure 3. These fibers offer a unique approach
with their microstructured inner cladding that can limit the wavelengths of light that are
able to propagate within the core region. The core is created by introducing a defect in
the microstructure. An example of this is an air hole in the center; thus creating a region
where light can be confined. This specific type of PBGF is referred to as a hollow core
fiber. In this case, the guiding in the core is not achieved through total internal reflection.
Conceptually, this fiber design can be thought of as creating a two-dimensional Bragg

10
grating. This hollow fiber design provides an attractive approach for high power delivery
without introducing nonlinear effects or material damage. Furthermore, the core can be
filled with gasses or particles for high harmonic generation [16]. In a special class of
PBGFs, a solid core that exibits the same filtering properties of the hollow core fiber is
possible. It has been shown that the spectral filtering effect can be implemented in a
PBGF with a rare earth-doped core, such as ytterbium; thus allowing for lasing at
wavelengths with weak emission gain [17] without the detrimental effect of amplified
spontaneous emission (ASE).
Figure 5: Typical photonic bandgap fiber design with an air core [17].
Referring back to Figure 2, it is clear that gain in Yb-doped fibers exists at wavelengths
out to ~1200 nm. A significant challenge, when operating at these wavelengths, is the
high gain at the 1030 – 1100 nm spectral region, which creates strong amplified
spontaneous emission and leads to parasitic lasing (high unsaturated laser gain) [18]. The
wavelength filtering effect of the PBGF leads to the supression of ASE at the undesired
wavelenghts. This PBGF allows for direct laser diode pumping, and provides for efficient

11
frequency doubling to visible wavelengths. This wavelength region is useful for various
medical applications, high-resolution spectroscopy, and laser guide star applications. An
alternative approach to access these spectral regions through stimulated Raman scattering
in passive fiber as described below.
Raman Fiber Lasers
The scattering of light in transparent media has been the subject of numerious
experimental and theoretical investigations. In 1928 C.V. Raman published a paper [19]
that describes a scattering process which was henceforth termed in the scientific literature
as Raman scattering. This scattering involved coupling of light with vibrational or
rotational modes in a medium. Shortly following the advent of the laser, stimulated
Raman scattering (SRS) was discovered by Woodbury and Ng [20]. They detected an
infared component while studying the Q-switching of a ruby laser with a nitrobenzene
Kerr cell. The frequency revealed was downshifted from the laser frequency by
1345 cm-1, which corresponded to the vibrational frequency of the strongest Raman mode
of nitrobenzene. Several researchers verified this effect in liquid (O2 , N2) and other
groups found similar results in gases (H2) and solids (InSb). These groups measured the
frequency shift, linewidth, scattering cross-section of spontaneous Raman scattering and
corresponding stimulated Raman gain [20]. The first observation of stimulated Raman
emission within an oscillator cavity containting CS2 was demonstrated by E.P. Ippen
[21]. By 1972, stimulated Raman emission was demonstrated in an oscillator using a

12
silica-based optical fiber [22]. The first fiber-based Raman fiber amplifiers (RFAs)
capable of providing more than 30 dB of gain was realized in 1981 by M. Ikeda [23].
These amplifiers are very attractive due to their potential for providing a relatively flat
gain over a wide bandwidth.
Referring back to Figure 4, there is a laser emission spectral gap between
ytterbium – erbium and erbium – thulium. Raman fiber lasers can bridge this gap and are
similar to other fiber lasers; however, the amplifying medium is based on Raman gain
(stimulated Raman scattering - SRS) rather than stimulated emission from excited atoms
or ions. The Raman process is unique since any Raman laser wavelength can be achieved
with a suitable selection of the pump wavelength. Moreover, Raman gain has a spectral
shape, which depends on the frequency separation of the pump and signal and not on
their absolute frequencies.
Spontaneous Raman occurs due to light interacting with resonant modes of a
molecular system and the frequency shift is determined by these discrete molecular
resonances. In this regime, low intensity light causes thermal excitation of the medium
with the amount of scattering being proportional to the incident intensity. As such, two
Raman scattering processes occur: vibrational and rotational. The more significant
Raman scattering is associated with vibrational modes of the molecule since the
rotational Raman scattering is an order of magnitude smaller. Interestingly, Raman
scattering can occur in all materials, and since fibers are commonly comprised of silica
glass, the dominate Raman lines are due to the bending motion of the Si-O-Si bond as
shown below in Figure 6 [24]:

13
Figure 6: Schematic of amplification by stimulated Raman scattering in an optical silica fiber. The insert shows the Raman Stokes interaction between a pump and signal photon [24].
SRS differs from spontaneous scattering since it is observed at thresholds of high
light intensity conditions. Thus, lasers provide the sufficient temporal and spatial
coherence to achieve stimulated Raman scattering. Above a critical intensity, stimulated
Raman scattering occurs and is characterized by exponential amplification of the
scattered radiation. To understand this further, we consider a simple model of a single
continuous wave (CW) pump beam launched into an optical fiber. The pump power does
not remain constant along the fiber, thus incorporation of the nonlinear interaction
between pump and Stokes waves are included. In this convention, the Stokes wave refers
to the Raman signal. As such, the SRS process in a co-propagating configuration is
goverened by the following set of coupled equations [25]:
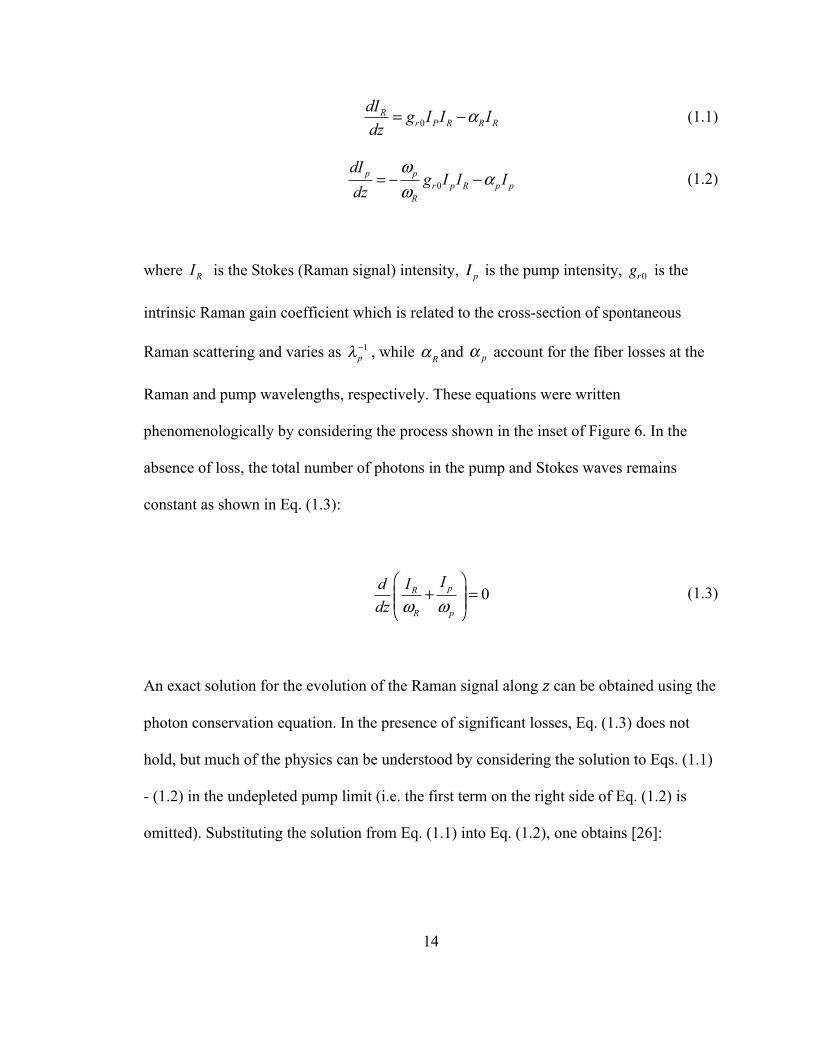
14
0R
r P R R RdI g I I Idz
α= − (1.1)
0p p
r p R p pR
dIg I I I
dzω
αω
= − − (1.2)
where RI is the Stokes (Raman signal) intensity, is the pump intensity, is the
intrinsic Raman gain coefficient which is related to the cross-section of spontaneous
Raman scattering and varies as , while α R and account for the fiber losses at the
Raman and pump wavelengths, respectively. These equations were written
phenomenologically by considering the process shown in the inset of Figure 6. In the
absence of loss, the total number of photons in the pump and Stokes waves remains
constant as shown in Eq. (1.3):
0pR
R p
IIddz ω ω
⎛ ⎞+ =⎜ ⎟⎜ ⎟⎝ ⎠
(1.3)
An exact solution for the evolution of the Raman signal along 𝑧 can be obtained using the
photon conservation equation. In the presence of significant losses, Eq. (1.3) does not
hold, but much of the physics can be understood by considering the solution to Eqs. (1.1)
- (1.2) in the undepleted pump limit (i.e. the first term on the right side of Eq. (1.2) is
omitted). Substituting the solution from Eq. (1.1) into Eq. (1.2), one obtains [26]:
I p gr0
λp−1 α p
15
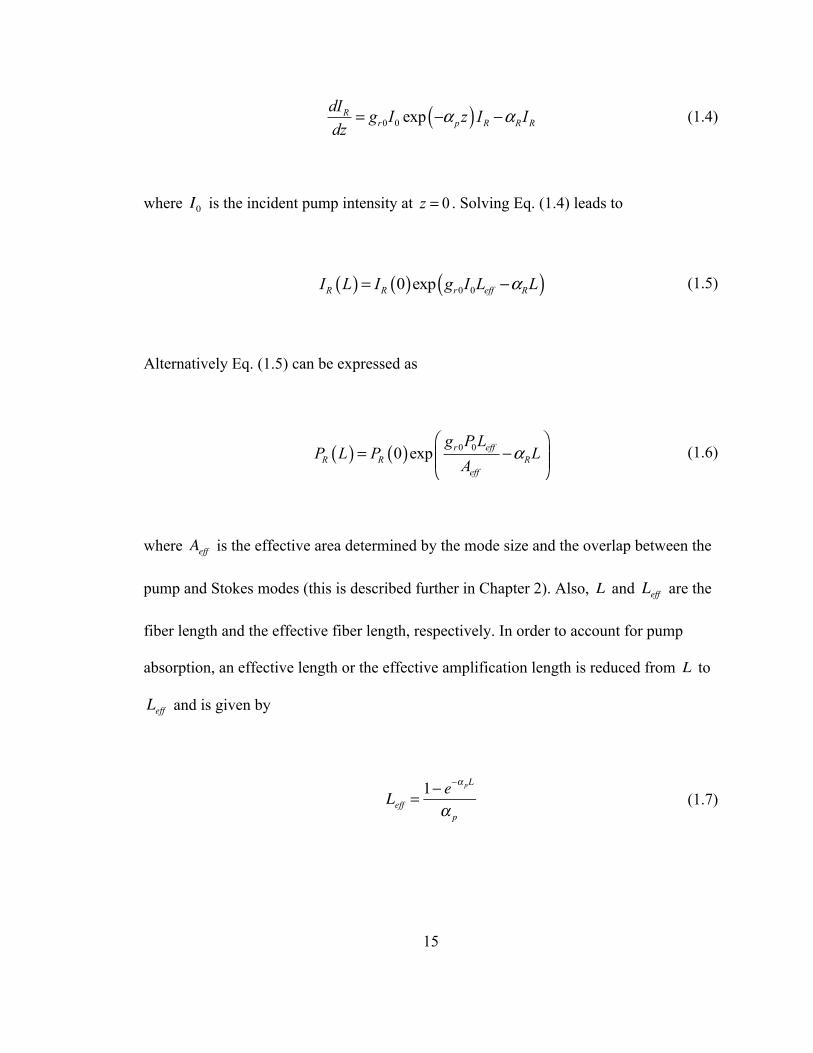
( )0 0 expRr p R R R
dI g I z I Idz
α α= − − (1.4)
where is the incident pump intensity at 0z = . Solving Eq. (1.4) leads to
( ) ( ) ( )0 00 expR R r eff RI L I g I L Lα= − (1.5)
Alternatively Eq. (1.5) can be expressed as
( ) ( ) 0 00 exp r effR R R
eff
g P LP L P L
Aα
⎛ ⎞= −⎜ ⎟⎜ ⎟⎝ ⎠
(1.6)
where is the effective area determined by the mode size and the overlap between the
pump and Stokes modes (this is described further in Chapter 2). Also, and are the
fiber length and the effective fiber length, respectively. In order to account for pump
absorption, an effective length or the effective amplification length is reduced from to
and is given by
(1.7)
I0
Aeff
L Leff
L
Leff
Leff =1− e−α pL
α p

16
Moreover, high Raman gain can be achieved with high pump power, long effective
lengths, small effective area, high stimulated Raman scattering gain coefficients while
maintaining low signal and pump attenuations. Considering these features, the most
important feature to recognize is the Raman gain since this will dictate fiber length,
required seed power and pump power. The Raman gain spectrum has been measured for
silica-based fibers and shown in Figure 7 [24]. Typically, the Raman gain coefficient in
fused silica peaks at 13.2 THz with a 3 dB bandwidth of about 6 THz.
Figure 7: Raman gain spectrum for bulk silica for two cases when the pump and signal are copolarized (solid curve) and ortogonally polarized (dashed curve). Spectra are normalized to the peak of the copolarized spectrum [24].

17
The polarization states of the pump and signal have a significant effect on the Raman
gain spectrum of silica. As shown in Figure 7, the peak gain is approximately an order of
magnitude greater when pump and signal are co-polarized than the case wherein their
polarization states are orthogonal. This effect is described as polarization-dependent gain
(PDG) [24], which can lead to amplitude fluctuations or amplified signal fluctuations. It
should be noted that it is not necessary in the co-polarized case for the fields to be
linearly polarized to obtain maximum effective Raman gain. For example, when both
pump and signal waves are propagating along the fiber with the same elliptical
polarization [27], maximum Raman gain is still obtained.
Another point to consider is the Raman gain efficiency of the fiber (CR), which
has units of (W-km)-1, and is imapcted by the effective area of the fiber. Figure 8 shows
measurements of the Raman gain efficiency for three fiber types where the fiber was
pumped at 1450 nm and provided gain near 1550-nm as shown in Ref. [24]. The fiber
types are: dispersion compensating fiber (DCF)-15 µm2, nonzero dispersion fiber
(NZDF)-55 µm2 and the superlarge effective area fiber (SLA)-105 µm2. There are clear
differences between the Raman gain efficiency for each fiber. The peak values depend
on the effective areas of the fiber and the degree of overlap between the pump and signal
transverse mode spatial profile. This influence of the effective area on the Raman gain
will be discussed further in Chapter 2. Another consideration for the variation shown in
Figure 8 is the fiber compositional differences of each fiber. For example, GeO2 is used
for fibers with small effective areas. An increase by a factor of 7 is expected for DCF
since the effective area is reduced, but the remaining increase is due to a higher doping

18
level of germania. GeO2 molecules exibit a larger Raman gain that peaks near 13.1 THz.
Subsequently, the spectral changes in the three fibers are attributed to the GeO2 doping
levels [24].
Figure 8: The measured Raman gain efficiency spectra for three germaniosilicate fiber types pumped at 1450 nm with differenet effective core areas [24].
As discussed previously, an important feature of the Raman amplification process
is that amplification can occur at any wavelength given the appropriate pump
wavelength. Thus, a cavity can be created at the appropriate signal frequency by the
utilization of Bragg reflectors/gratings. These gratings are a periodic or aperiodic
perturbation of the effective refractive index in the core of an optical fiber. This refractive
index perturbation leads to the reflection of light that propagates along the fiber in a
narrow range of wavelengths, for which the Bragg condition is satisfied. An advantage of

19
this approach is the Bragg grating can be written into the fiber directly, therefore
mitigating loss in the oscillator setup. If several gratings are placed at the ends of the
fiber, a nested scheme can generate a cascade of n-frequencies through stimulated Raman
scattering where each subsequent frequency is separated appropriately based on the fiber
composition (see Figure 9).
Figure 9: Scheme of an n th-order CW cascaded Raman fiber laser.
Some of the limitations with the setup in Figure 9 are: broad linewidth, small residual
fractions of intermediate wavelengths at the output, and low conversion efficiency.
Despite these shortcomings, this architecture was employed to seed a single-pass
cascaded Raman amplifier [28]. The low power cascaded oscillator provided all the
necessary wavelengths due to the presence of residual intermediate Stokes orders. The
output of this cascaded Raman laser was combined in a RFA with 450 W output from an
Yb-doped fiber laser operating at 1117 nm. This led to an output power of >300 W at the
5th order Stokes frequency with a conversion efficiency of ~64% (quantum-limited
efficiency is 75% at 1117 – 1480 nm) [28]. In spite of accessing wavelengths lying within
the spectral gaps between the rare earth doped fiber lasers shown in Figure 3, and the

20
impressive output power, the signal was spectrally broad for utility in applications that
require single-frequency output. For example, single-frequency output is required for
high efficiency nonlinear frequency conversion in a resonant cavity in order to generate
high power in the 550-750 nm visible region. One wavelength of considerable interest
lying within this range is 589 nm; used in a sodium guide star beacon. Generation of
single-frequency 1178 nm output via a single-frequency RFA is thus highly desired.
Laser Guide Star System
In 1953 Horace Babcock first proposed the idea of adaptive optics as a method to
improve the resolution of astronomical telescopes by correcting distortions introduced by
the atmosphere [29]. Now, over 60 years later, the advent of the laser has commercialized
adaptive optical systems, thereby making this technology more affordable and reliable for
various observatories around the globe. An essential component of the adaptive optical
telescope is the laser source required to create an artifical star (laser guide star – LGS) by
exciting a resonance fluorescence. There are two types of laser guide stars that can be
implemented in the adaptive optic system.
One approach is the Rayleigh beacon which relies on Rayleigh scattering in the
lower atmosphere. Since this is not based on a narrowband resonance, the laser
properties are relaxed and the photon return has a wavelength dependence of ~λ-4. The
atmosphere is primarily composed of nitrogen that has a Rayleigh cross section of
5.1 × 10⁻³¹ m2 at a wavelength of 532 nm. At atmospheric pressure there are are

21
~2 × 1025 molecules per cubic meter, which results in ~10-5 of the light being scattered
for every meter of propagation. A significant limiting factor is propagation distances
beyond 10 – 20 km where the photon backscatter is significantly reduced due to
inherantely lower nitrogen concentrations. Thus, atmospheric aberations intoduced at
heigher altitudes are not sufficiently resolved.
The second approach is a sodium beacon that utilizes a laser tuned to one or more
resonances of sodium atoms at 589 nm from the mesospheric layer located 85-95 km
above the earth’s surface [30]. The sodium in the mesosphere is from the ablation of
meteors and tends to be ionized. However, atmospheric sodium below this layer is
normally chemically bound in compounds (Na2O). The atoms of sodium in this layer are
typically in an excited state and radiate weakly at a wavelength of ~589.2 nm. Therefore,
illumination of the mesosphere with a laser operating at this wavelength results in photon
returns obtained through fluorescence of the D2 line of sodium atoms. Further
enhancement of the photon return can be achieved by illuminating both the D2a and D2b
lines [31]. The return light is then used in an adaptive optics system to correct for
atmospheric turbulence. Figure 10 shows a typical guide star system for the sodium
beacon and the various components required for an adaptive optics system. The Rayleigh
beacon is similar; however, the artificial star created is at a distance of about 10-20 km.

22
Figure 10: Typical sodium beacon guide star setup [32]. If a Rayleigh beacon is considered, the distance will be 10-20 km rather than 90 km as shown.
Laser Guide Star Requirements
Since the sodium beacon provides improved wave front correction capabilities,
the focus here is to understand the sodium layer at the atomic level. There are 11
electrons with a single valance electron outside closed shells. Figure 11 shows the
ground state is 1s22s22p63s2S1/2 and the first excited state is 1s22s22p63s2P1/2,3/2, while the
interaction of the magnetic moment of the electron with the magnetic field associated
with the orbital motion of the electron leads to the energy level splitting within the first
excited state: 32P1/2 and 32P3/2. These two states are separated in energy by about
23
520 GHz and the transitions between the upper state (32P3/2) and ground state (32S1/2)
cause the emission or absorption of the D2 line at 589.2 nm. On the other hand, the
transitions between the lower state (32P1/2) and the ground state (32S1/2) cause the
emission and absorption of the D1 line at 589.6 nm [33].
The total electronic angular momentum of the ground state and first excited state
are J = 1/2 and J = 1/2, 3/2, respectively. Naturally occurring sodium is composed
virtually 100% of one isotope, which has a nuclear spin of I = 3/2. The interaction of an
electron with the nuclear magnetic moment leads to the hyperfine structures associated
with the ground and excited states of the sodium atom. The total angular momentum
quantum number F is the sum of nuclear spin I and the electron spin J yielding the total
momentum: F = I + J. The resulting total angular momentum quantum numbers are F = 1,
2 for the sodium ground state 32S1/2, F = 1, 2 for the 32P1/2 excited state, and F = 0, 1, 2, 3
for the 32P3/2 excited state. The energy difference between the hyperfine state F = 2 and
F = 1 in the ground state is 1.772 GHz. The energy separation for the hyperfine splitting
in the J = 1/2 state of the first excited state is 188.6 MHz, while the energy separations of
the J = 3/2 state are 15.8, 34.4, and 58.3 MHz for the four hyperfine states with F = 0, 1,
2, 3, respectively [33].

24
Figure 11: Energy level diagram of a sodium atom described by the orbital-shell (Bohr Model), the intermediate model (Na D Fine Structure), and nuclear spin model (Na D2 Hyperfine Structure) [34].
The sodium layer is about 10 km thick with a density of ~5000 atoms/cm3 and has
24 states that embody the D2 sodium transition; however, there are two states which give
the greatest photon return flux: D2a (λ2a = 589.15908) and D2b (λ2b = 589.15709).
Moreover, there is a factor of two greater total line strength in the D2 line over the D1 line
and the optical pumping characteristics of the D2 line results in a more efficient excitation
of the sodium atoms. As such, the D2 line is of interest in generating a guide star. The
temperature of the atoms in the mesospheric sodium layer is about 200 K, thus the
sodium atoms have a Maxwell Boltzmann velocity distribution along the beam of about
25
±350 m/sec full width half maximum and a collision time between 60 – 100 µs. Notably,
the Doppler shifted atoms will respond to the beam at different wavelengths since the
atoms are at different velocities. The velocity distribution implies a frequency spread of
1.1 GHz FWHM and since sodium has a natural linewidth of 10 MHz, there are about
120 velocity classes [34].
Laser Guide Star Technology
Over the past two decades, several sodium guide star lasers have been constructed
and tested beginning with systems based on dye lasers. The early systems used copper
vapor laser pumped dye lasers, which offer tunability and control in terms of the
lineshape, but present a significant challenge to maintain [35]. Sources based on sum-
frequency generation of the 1064 nm and 1319 nm lines of Nd:YAG gain serendipitously
provide the precise amount of tuning required for resonance of the sodium lines. This
system has a narrow linewidth, near-diffraction limited beam quality, and continuous
wave laser output of 50 W; referred by the acronym FASOR (Frequency Addition Source
of Coherent Optical Radiation). The FASOR is comprised of four main subsystems as
shown in Figure 12.

26
Figure 12: Schematic diagram showing main subsystems and control loops of FASOR developed by AFRL [36].
An external sum frequency generation (SFG) cavity uses a lithium triborate
(LBO) crystal and is simultaneously resonant with two Nd:YAG injection locked lasers
operating at 1064 nm and 1319 nm. Tuning to the D2a resonance is achieved through the
use of a precision wavemeter that is calibrated and locked to the fluorescence of a sodium
vapor cell. The 1064 nm laser consists of 4 side-pumped rods, while the 1319 nm laser
consists of 6 side-pumped rods. Consequently, this system is difficult to build and
maintain. These drawbacks become more pronounced when considering extremely large
telescopes (ELTs), whereby multiple laser sources may be required for guide star
tomography.
Resonant cavity frequency conversion offers several advantages over the single
pass crystal. The achievable optical intensities are much higher which increases the
conversion efficiency by more than an order of magnitude. In addition, the cavity will
circulate the unconverted power which would otherwise be lost in the external single pass

27
configuration. One point of consideration with this approach is the linewidth of the laser.
The mirror configuration is considerably more sensitive to the laser linewidth than the
phase-matching bandwidth of the nonlinear crystal. As such, the constructive interference
between the reflected and generated waves cannot be maintained if the bandwidth of the
laser exceeds the cavity specifications [37].
Fiber Laser Technology for Laser Guide Star
The complexity of the system can be significantly reduced by first generating
laser light at 1178 nm followed by second harmonic generation (SHG) to produce 589 nm
light. The SHG interaction as an exchange of photons between various frequency
components of the field such that two photons of frequency ω are annihilated, and a
photon of frequency 2ω is simultaneously created in a single-quantum mechanical
process [38]. Accordingly, only a single wavelength is required to pump the nonlinear
crystal cavity; thus reducing the complexity of the system. Furthermore, fiber lasers are
generally more compact than their bulk solid-state laser counterparts with the potential of
eliminating much of the free space optics while delivering diffraction-limited beams.
One approach is to develop a single-frequency PBGF (discussed previously)
amplifier operating at 1178 nm. While reasearch in the area of hollow core PBGFs dates
back to the middle of the last decade, work in the area of solid core rare-earth doped
PBGFs is relatively new. In 2006, Isomaki and Okhotnikov, reported on an Yb-doped
PBGF to develop a femtosecond soliton mode-locked laser [39]. In 2008, Pureur et al.

28
built a Yb-doped PBGF laser operating at 980 nm while supressing the ASE above 1 µm
due to the wavelength filtering capabilities of the PBGF [40]. Similarily, this design can
be employed for operation in the longer wavelength region (1100 – 1200 nm) by tightly
coiling the fiber to shift the ASE peak. Unfortunately, this technique suffers from
significant bend losses. More recently, researchers at NKT succeded in spectrally shifting
the ASE peak to longer wavelengths (Figure 14b shows the suppression of ASE) by re-
scaling the dimensions of the fiber. This successful design was used recently by
researchers at NKT Photonics and the University of Electro-Communications where they
demonstrated an 1178 nm single-frequency ytterbium doped photonic bandgap fiber
amplifier (see Figure 13) with an output power of 24.6 W [41].
Figure 13: Experimental setup of 1178 nm single-frequency amplification using a photonic bandgap fiber [41].
29
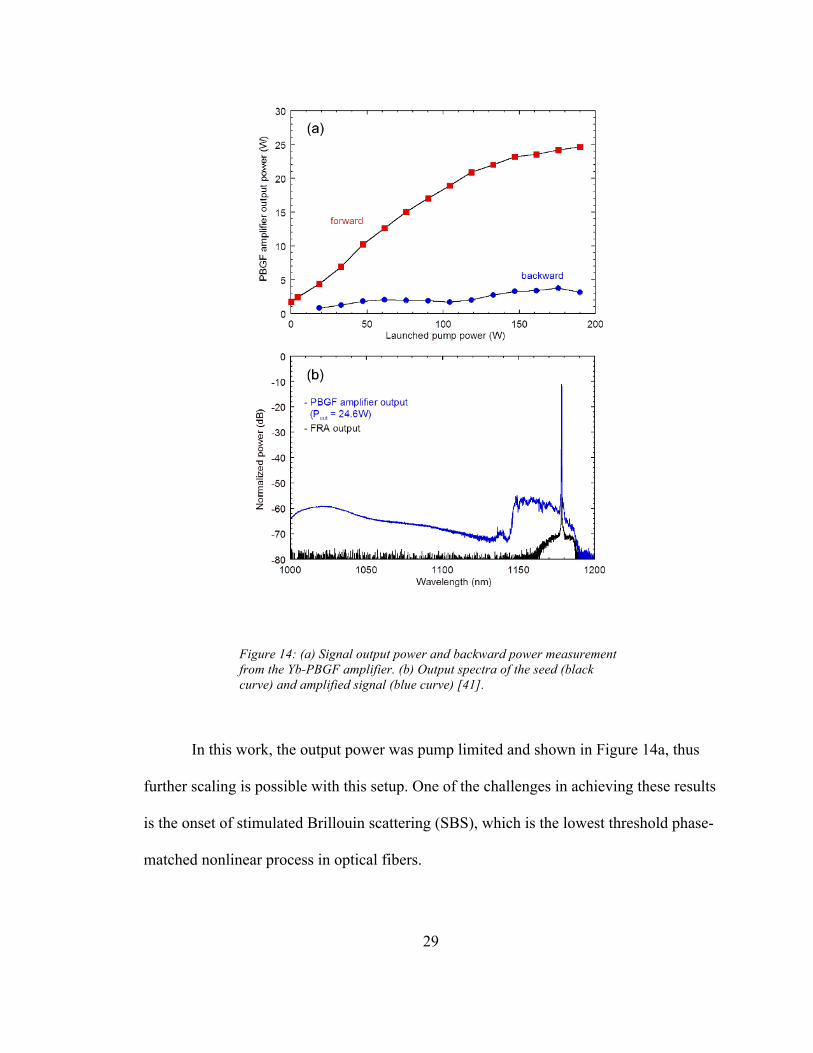
Figure 14: (a) Signal output power and backward power measurement from the Yb-PBGF amplifier. (b) Output spectra of the seed (black curve) and amplified signal (blue curve) [41].
In this work, the output power was pump limited and shown in Figure 14a, thus
further scaling is possible with this setup. One of the challenges in achieving these results
is the onset of stimulated Brillouin scattering (SBS), which is the lowest threshold phase-
matched nonlinear process in optical fibers.

30
Another approach to generate 1178 nm coherent radiation is through the use of a
Raman laser. The Raman gain profile makes Raman lasers and amplifiers versatile
tunable devices that can access wavelengths not currently reachable by traditional laser
devices. However, it would appear that in order to obtain good conversion relatively long
fiber lengths are needed which will make the suppression of SBS challenging. SBS is
discussed in further detail below.
There has been much effort devoted over the years to generate 1178 nm in a
Raman fiber laser. In 2004, Feng et al. demonstrated emission of 589 nm light by
interacavity frequency doubling of a Raman fiber laser at 1178 nm in a type-1 non-
critically phase matched LBO crystal [42]. Here, a maximum of 10 mW of 589 nm light
was generated before the higher-order Stokes Raman emission and the broad linewidth of
the 1178 nm signal prevented higher conversion efficiency. It was not until 2008 when
multi-watts of 1178 nm emission was reported in the literature [43]. In this work, up to
4.8 W of 1178 nm light with a linewidth of ~10 MHz was obtained by Raman
amplification of a distributed feedback diode laser in standard non-PM single-mode fiber.
An 1120 nm Yb-doped fiber laser was used as a pump source and the experimental setup
is shown in Figure 15.
31
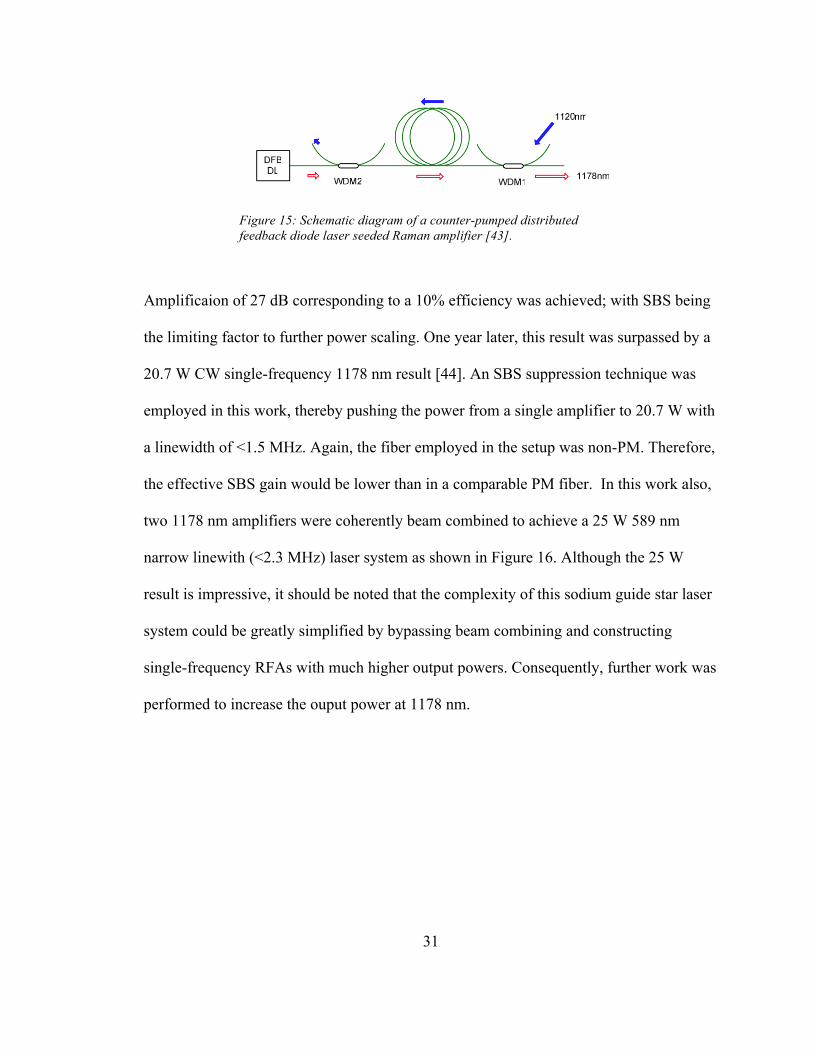
Figure 15: Schematic diagram of a counter-pumped distributed feedback diode laser seeded Raman amplifier [43].
Amplificaion of 27 dB corresponding to a 10% efficiency was achieved; with SBS being
the limiting factor to further power scaling. One year later, this result was surpassed by a
20.7 W CW single-frequency 1178 nm result [44]. An SBS suppression technique was
employed in this work, thereby pushing the power from a single amplifier to 20.7 W with
a linewidth of <1.5 MHz. Again, the fiber employed in the setup was non-PM. Therefore,
the effective SBS gain would be lower than in a comparable PM fiber. In this work also,
two 1178 nm amplifiers were coherently beam combined to achieve a 25 W 589 nm
narrow linewith (<2.3 MHz) laser system as shown in Figure 16. Although the 25 W
result is impressive, it should be noted that the complexity of this sodium guide star laser
system could be greatly simplified by bypassing beam combining and constructing
single-frequency RFAs with much higher output powers. Consequently, further work was
performed to increase the ouput power at 1178 nm.

32
Figure 16: A schematic diagram of the optical setup for coherent beam combination and external cavity resonant frequency doubling [44].
Although the authors in the work described above obtained significant results, the SBS
mitigation techniques were not disclosed. In 2012, Zhang et al. demonstrated 44 W of
1178 nm emission in a PM single-frequency two-stage RFA [45]. A distributed feedback
diode laser seeded a variably strained polarization-maintaining fiber with an optical
efficiency of 52%. The application of the strain was to suppress the SBS process. The
pump lasers were two 1120 nm linearly polarized fiber lasers operating at 20 W and
85 W for each stage. The output of the RFA was then used to pump a nonlinear cavity
leading to 24.3 W of 589 nm light.

33
Figure 17: (a) Schematic diagram of the laser system with a two stage amplifier and (b) diagram of a single stage Raman fiber amplifier [45].
More recently, this same research group headed by Prof. Yan Feng was successful in
pushing the output of the RFA to ~80 W using a similar technique to suppress SBS but
with higher available pump power at 1120 nm [46] [47].
Stimulated Brillouin Scattering Fundamentals
The phenomenon of stimulated Brillouin scattering (SBS) is initiated from light
interaction between the pump and Stokes fields through an acoustic wave (acoustic
phonons). As such, the electric fields will generate an acoustic wave through the process
of electrostriction.

34
Figure 18: Schematic of stimulated Brillouin scattering in an optical fiber [48].
Electrostriction is a property of all dielectric materials whereby the material will
become compressed in the presence of an electric field. As shown in Figure 18, the pump
field scatters off the refractive index perturbations due to the density variations. The
scattered light is Stokes shifted and will add constructively with the Stokes light, which
results in a significant increase in the probability of scattering the pump field through
Bragg diffraction. Conservation of energy and momentum must be conserved in these
scattering events, thereby the following equation describes the frequencies and wave
vectors of the pump, scattered, and acoustic fields:
(1.8)
(1.9)
ΩB =ω p −ω s
!q =!kp −!ks

35
where and are the optical frequencies and wave vectors of the pump and
Stokes shifted fields. The Brillouin frequency, , and the wave vector of the acoustic
field are related by the phonon dispersion relation given by [48]:
(1.10)
where is the speed of sound in the medium and θ is the angle between the pump and
Stokes fields. In a single mode fiber, the relevant θ values are 0 and since the
maximum is in the backward direction ( ) and vanishes in the forward direction
( ). Thus, SBS only occurs in the backward direction with a Brillouin shift given by
[25]:
νB =ΩB
2π=2nυAλp
(1.11)
For a plane wave treatment, the three fields (pump, Stokes, and acoustic) and their
interaction can be represented by a set of coupled mode equations in steady state as
follows [38]:
ω p, s kp, s
ΩB
q
ΩB =
!q υA ≈ 2υA
!kp sin θ
2( )
υA
π
θ = π
θ = 0

36
22 2
02 2
02p s pe
B B
dA A Ai qdz nc i
ε ω γρ
=Ω −Ω − ΩΓ
(1.12)
2
2 20
2 202
p ss e
B B
A AdA i qdz nc i
ε ω γρ
= −Ω −Ω + ΩΓ
(1.13)
The electric field amplitudes of the pump and Stokes waves are represented by ,p sA ,
is the reciprocal of the phonon lifetime, is the density of the material, represents
the electrostrictive coupling coefficient of the medium, and is the frequency of the
driven acoustic wave. From these equations, one can identify the amplitude of the density
(acoustic) wave , which is given by
(1.14)
The form of Eqs. (1.12) and (1.13) show that SBS is a pure gain process; i.e. the SBS
process is automatically phase matched. Thus, it is convenient here to introduce coupled
equations for the intensities of the pump and Stokes waves. If the intensity is defined as
*02i i iI nc A Aε= (1.15)
ΓB
ρ0 γ e
Ω
ρ z,t( )
ρ z,t( ) = ε0γ eq2 ApAs
*
ΩB2 −Ω2 − iΩΓB
37
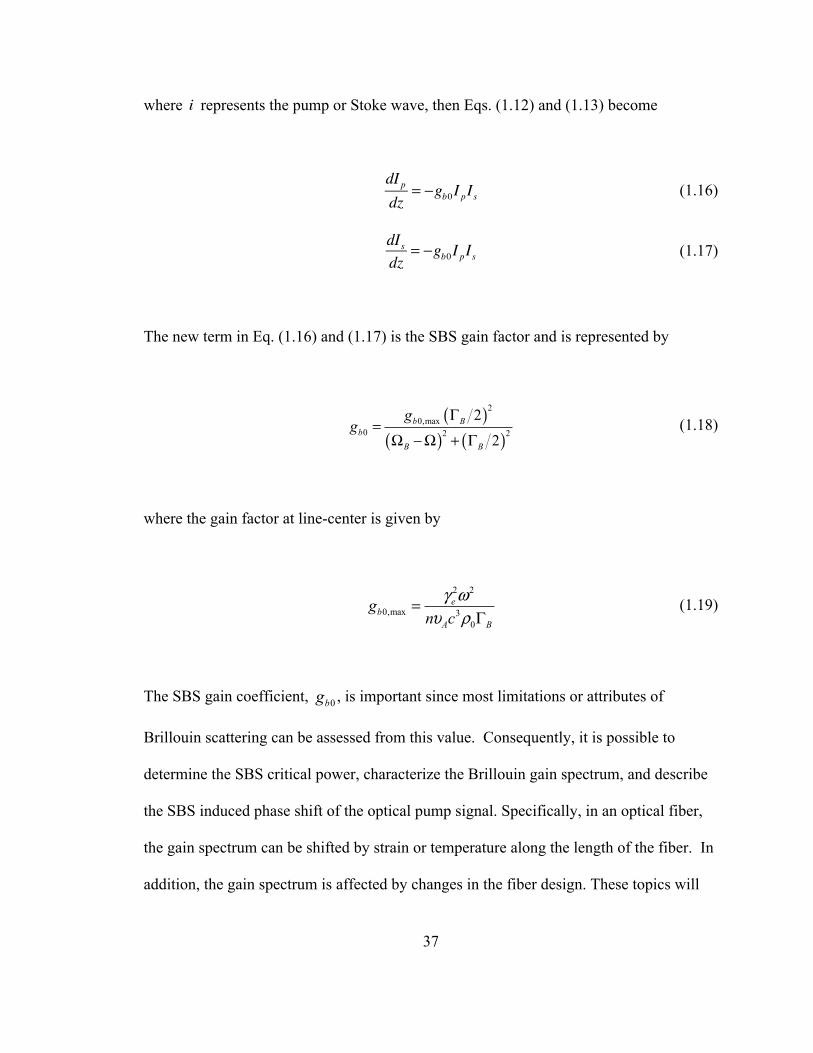
where represents the pump or Stoke wave, then Eqs. (1.12) and (1.13) become
(1.16)
(1.17)
The new term in Eq. (1.16) and (1.17) is the SBS gain factor and is represented by
( )( ) ( )
20,max
0 2 2
2
2b B
bB B
gg
Γ=
Ω −Ω + Γ (1.18)
where the gain factor at line-center is given by
2 2
0,max 30
eb
A B
gn c
γ ωυ ρ
=Γ
(1.19)
The SBS gain coefficient, 0bg , is important since most limitations or attributes of
Brillouin scattering can be assessed from this value. Consequently, it is possible to
determine the SBS critical power, characterize the Brillouin gain spectrum, and describe
the SBS induced phase shift of the optical pump signal. Specifically, in an optical fiber,
the gain spectrum can be shifted by strain or temperature along the length of the fiber. In
addition, the gain spectrum is affected by changes in the fiber design. These topics will
i
dI pdz
= −gb0I pIs
dIsdz
= −gb0I pIs

38
be discussed in subsequent chapters. Another important parameter is the SBS gain
bandwidth, BΓ , as it dictates the amount of frequency shift required when applying
temperature or stress gradients in order to mitigate SBS. This point is discussed further in
Chapter 2.
Significance of the Work
During the past two decades, Raman fiber lasers and amplifiers have garnered
intense interest, leading to an appreciable body of work appearing in the scientific
literature. However, until a few years ago, little of this work was devoted to single-
frequency operation. This recent work in single-frequency Raman fiber amplifiers
(RFAs) was motivated by a desire to generate 1178 nm light in order to convert it through
SHG into 589 nm light for the sodium guide star application. While at least two other
research groups have contributed significantly to this area, the work presented in this
dissertation is unique in several aspects.
To the best of this author’s knowledge, the numerical model developed in this
work is the first to present a detailed theoretical approach to power scaling of single-
frequency RFAs [49]; both SRS and SBS were considered. Notably, in this numerical
work, trade studies that considered SBS mitigation techniques, available pump and seed
powers, and fiber length optimization were conducted. Furthermore, the effect of FWM
when considering two wavelengths seeding was investigated both analytically and
numerically. The latter work was performed to address the feasibility of utilizing a single

39
RFA in order to provide a pump source for nonlinear conversion to wavelengths
corresponding to the sodium D2a and D2b.
This numerical work was the impetus for the experimental work presented in this
dissertation. Optimal configurations were identified and implemented in order to achieve
multi-watt power scaling. The 18 W result presented here, and which first appeared in a
paper published in Optics Letters [50], still represents, to date, the highest output
obtained from a single-stage single-frequency polarization-maintaining RFA regardless
of operating wavelength. The fiber used to demonstrate this record output power was
unique in its design; allowing for both acoustic tailoring to suppress SBS and increased
germanium content to facilitate the Raman process. Furthermore, the fiber was designed
to accommodate thermal gradients to further mitigate SBS.
This work also presents experimental verification of the linear dependence of
signal output as a function of available pump power for optimized fiber lengths and is in
agreement with the theoretical prediction. Furthermore, it is shown both numerically and
experimentally that the output power can be scaled by constructing a two-stage RFA;
thus increasing the seed power. For the experimental configurations described in this
work, significant benefit is obtained by increasing the seed power to ~1 W with
diminished returns as the seed power is scaled beyond this level. Finally, very limited
information has been previously provided on the problem of linewidth broadening in a
RFA configuration seeded with a single-frequency source. This work compares the
linewidth broadening in co- and counter-pumped configurations; showing the former to
be susceptible to it. Although this work does not fully provide a complete explanation for

40
this process, four-wave mixing (FWM) sidebands are shown to be present in the spectra
of the output signal in the co-pumped case. It is also shown that this effect cannot be
effectively mitigated through higher seed power levels. The work described in this
paragraph was published in Optics Express [51].

41
Chapter 2
Theoretical Analysis of Raman Fiber Amplifier
In order to investigate the trade space within the RFA approach and to provide a
design tool for the experimental work, we developed a model using Raman power
equations. Since SBS is an important consideration in single-frequency RFAs, the
Brillouin gain was incorporated within the power equations and additional equations
describing the evolution of the Stokes light due to the SBS process were added within the
coupled system.
RFA Power Equations
Extensive references exist in the literature detailing the evolution of the Raman
signal and pump in an optical fiber. Here, a heuristic derivation of the power equations in
a core-pumped Raman amplifier is presented; starting with the nonlinear wave equation
for the Raman signal:
∇2!ER −
nR2
c2∂2!ER
∂t2= µo
∂2!P NL( )
∂t2 (2.1)
where !ER is the electric field of the Raman signal, and
!P NL( ) is the nonlinear polarization
oscillating at the signal angular frequency due to the Raman process, and Rn is the ω R

42
index of refraction. Since pump and signal are typically separated by only 60 nm, the
approximation R Pn n n= = is henceforth used. In the analysis that follows, a weakly
guiding, polarization-maintaining (PM) fiber with the light launched into the step-index
fiber polarized along one of the transverse axes (e.g. the slow axis) is considered. In
addition, the pump and signal are polarized in the same direction within the core of the
fiber. As stated in Chapter 1, maximum Raman gain is obtained when pump and signal
are co-polarized. The Raman gain is a small perturbation, and thus the solution for the
nonlinear wave equation as a superposition of the modes of an ideal fiber (i.e. fiber with a
uniform index of refraction and a vanishing nonlinear polarization) can be constructed:
!ER,x
!r ,t( ) = 12 Ak ,R z,t( )ϕk ,R x, y( )ei βk ,Rz−ω Rt( ) + c.c.
k∑ (2.2)
where ,k RA and are the field amplitude and the transverse mode profile for the
signal, respectively, is the propagation constant, and where is chosen to be the
transverse direction of the electric field of the signal (and also pump) . The summation
symbol indicates summation over guided modes and integration over the continuum of
radiation modes of the fiber. It can be shown that the polarization in the x-direction due
to Raman gain is given by:
PxNL( ) ≈ −
igr ,0c2
2ωR
εε01
2 Al ,Pl∑
k∑
2ϕ l ,P
2Ak ,Rϕk ,Re
i βk ,Rz−ωRt( ) + c.c. (2.3)
ϕk ,R
,k Rβ x
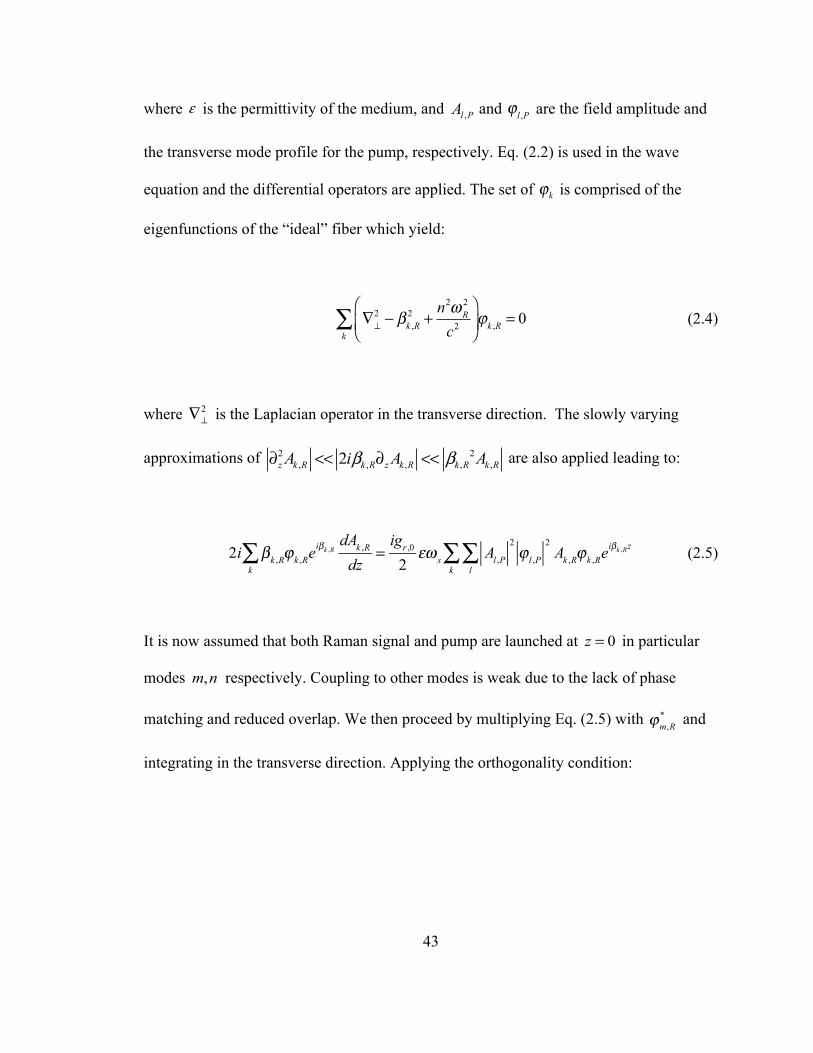
43
where is the permittivity of the medium, and ,l PA and are the field amplitude and
the transverse mode profile for the pump, respectively. Eq. (2.2) is used in the wave
equation and the differential operators are applied. The set of is comprised of the
eigenfunctions of the “ideal” fiber which yield:
∇⊥2 − βk ,R
2 +n2ωR
2
c2⎛
⎝⎜⎞
⎠⎟k∑ ϕk ,R = 0 (2.4)
where is the Laplacian operator in the transverse direction. The slowly varying
approximations of 2 2, , , , ,2z k R k R z k R k R k RA i A Aβ β∂ << ∂ << are also applied leading to:
(2.5)
It is now assumed that both Raman signal and pump are launched at in particular
modes respectively. Coupling to other modes is weak due to the lack of phase
matching and reduced overlap. We then proceed by multiplying Eq. (2.5) with and
integrating in the transverse direction. Applying the orthogonality condition:
ε ϕ l ,P
ϕk
∇⊥2
2i βk ,Rϕk ,R
k∑ eiβk ,R
dAk ,R
dz=
igr ,0
2εω s Al ,P
l∑
k∑
2ϕ l ,P
2Ak ,Rϕk ,Reiβk ,Rz
z = 0
m,n
ϕm,R
*
44
ϕi ,R*
−∞
∞
∫−∞
∞
∫ ϕ j ,Rdxdy ∝δ i , j (2.6)
The following equation for the evolution of signal mode in the direction is obtained:
(2.7)
A similar equation can be written for the complex conjugate of the amplitude *,m RA :
(2.8)
By multiplying Eq. (2.7) by and Eq. (2.8) by and
recognizing the pump power is given by:
2
2 ,,
20,
2n P
n P
n P
Pn Ac
dxdyµ ϕ
∞ ∞
−∞ −∞
=
∫ ∫ (2.9)
a power equation for the evolution of the signal can be derived as
m z
dAm,R
dz=
gr ,0
2n2
2µ0cAn,P
2Am,R
ϕm,R
2ϕn,P
2
∫∫ dxdy
ϕm,R
2
∫∫ dxdy
dAm,R*
dz=
gr ,0
2n2
2µ0cAn,P
2Am,R
*ϕm,R
2ϕn,P
2
∫∫ dxdy
ϕm,R
2
∫∫ dxdy
Am,R
* ⋅ ϕm,R∫∫2dxdy
Am,R ⋅ ϕm,R∫∫
2dxdy

45
(2.10)
Using the aforementioned approach, the evolution of the pump signal can be shown to
have the following form:
(2.11)
Derivation with SBS and background loss follows a similar approach. As such, the index
of refraction will be complex in Eq. (2.1), and we can include the loss term, while SBS
can be included in the nonlinear polarization term (see Eq. (2.3)). The treatment of SBS is
similar to what was presented in Chapter 1 except now the modal profiles of the optical
fields in the fiber are taken into account.
For a single-frequency Raman amplifier we need to consider the evolution of the
pump, signal, and the Stokes light generated through the interaction of the Raman signal
with the acoustic phonons [25]. The Raman signal interacts with the pump wave through
Raman gain and also with the Stokes light through the SBS process. The counter
propagating Stokes light experiences both Raman and Brillouin gain while the pump
wave interacts with both the Raman signal and Stokes light through SRS. It is assumed
dPm,Rdz
= gr ,0Pn,PPm,R ⋅ϕR(x, y)
2 dxdy ϕP (x, y)2 dxdy∫∫∫∫
ϕR(x, y)2 ϕP (x, y)
2 dxdy∫∫⎛
⎝⎜⎜
⎞
⎠⎟⎟
−1
dPn,Pdz
= −ω P
ω R
gr ,0Pm,RPn,P ⋅ϕR(x, y)
2 dxdy ϕP (x, y)2 dxdy∫∫∫∫
ϕR(x, y)2 ϕP (x, y)
2 dxdy∫∫⎛
⎝⎜⎜
⎞
⎠⎟⎟
−1

46
here that all waves propagate in the lowest-order transverse mode. For brevity, the mode
subscripts will be dropped in the equations presented below. Furthermore, we considered
only the case in which the pump and signal are co-polarized, which provides maximum
gain. The Raman gain for orthogonally polarized pump and signal is much smaller as
shown in Figure 7.
The Stokes light is considered by dividing the Brillouin gain bandwidth into
several channels. The coupled set of equations describing the evolution of the Raman
signal power, , the Stokes light power contained in a particular channel, , and the
pump light power, , along the longitudinal axis of the fiber, , is expressed by the
following equations [25]:
(2.12)
(2.13)
dPP
dz= ∓γ gR PR + PS ,i
i∑⎛
⎝⎜⎞⎠⎟
PP ∓α P PP (2.14)
where and are the angular frequencies of the signal and pump, and
and are the fiber loss for the signal and pump, respectively. The ∓ signs
represent co and counter propagating pump waves, respectively. The normalized Raman
PR PS , i
PP z
dPRdz
= gRPP − gB, i PS , i −α Ri∑⎛
⎝⎜⎞⎠⎟PR
dPS , i
dz= − gRPP + gB, iPR −α R( )PS , i
ω R ω P γ =ω P ω R
α R αP

47
gain coefficient is given by where is the intrinsic Raman gain
coefficient and the effective area is given by:
(2.15)
where and are the lowest-order transverse profiles for the signal and
pump, respectively. Similarly, the normalized Brillouin gain coefficient is
, where is the intrinsic Brillouin gain coefficient. Since the Brillouin
frequency is much smaller than the optical frequencies, the effective area here is given
by:
(2.16)
Initiation of SBS from Brillouin and Raman Noise
The SBS process is initiated predominantly by the spontaneous Brillouin
scattering that occurs throughout the fiber. A precise formalism entails the solution of the
time-dependent field amplitude equations of the optical and phonon fields, wherein a
distributed noise described by a Markovian stochastic process subject to Gaussian
gR = gr0 Aeff , R gr0
Aeff , R =ϕR(x, y) 2 dxdy ϕP (x, y) 2 dxdy∫∫∫∫
ϕR(x, y) 2 ϕP (x, y) 2 dxdy∫∫
ϕR x, y( ) ϕP x, y( )
gB = gb0 Aeff , B gb0
Aeff , B =ϕR(x, y) 2 dxdy∫∫( )2
ϕR(x, y) 4 dxdy∫∫

48
statistics is used [52]. An approximate treatment of this problem was presented by R.G.
Smith using a time-independent treatment of the intensity (power) equations [26]. It was
shown that SBS initiation from a distributed source can be approximated by injecting,
near the output end of the fiber, one Stokes photon per mode multiplied by the thermal
average of phonons in the orbital as described by the Bose-Einstein distribution function.
Since we considered Raman gain as well as Brillouin gain with multiple peak frequencies
along the length of the fiber, we used here a distributed source term to account for the
initiation of the SBS process. As such, there is no need to determine the location of the
injected Stokes photons a priori for each Stokes frequency under consideration. This
noise term can be incorporated by adding a term of the form on the right
hand side (RHS) of Eq. (2.13)with given by:
(2.17)
where is the frequency bin size, and is the temperature of the fiber.
The SBS process can also be initiated through Raman noise characterized by the
interaction of the pump light with background optical phonons. It is well-known that
gR ≪ gB and the relevant number of background optical phonons is smaller than that of
the acoustic phonons. However, unlike the spontaneous Brillouin process, the
spontaneous Raman process for a given Stokes frequency occurs throughout a
−gB, iPRδ S , i
δ S , i
δ S , i =!ω S , iΔω
2π exp! ω R −ω S , i( )
kT⎡
⎣⎢⎢
⎤
⎦⎥⎥−1
⎛
⎝⎜
⎞
⎠⎟
Δω T

49
temperature segmented fiber. Therefore, for the sake of accuracy or to be more precise in
the formalism, we included the spontaneous Raman noise of the form on the
RHS of Eq. (2.13). Here is given by:
(2.18)
Uniform Temperature Profile Simulations
Equations (2.12) ‒ (2.14) represent a nonlinear two point boundary problem. In a
co-pumped configuration, the signal and pump are known at the input end of the fiber
while the noise-initiated Stokes fields are set to zero at the output end. The counter-
pumped configuration has similar boundary conditions except that the pump is known at
the output end of the fiber. A numerical model was developed wherein the coupled
differential equations were solved using a shooting and root finding algorithm, and
verified with the boundary conditions for accuracy. The numerical results were also
verified using simplified configurations where analytical solutions for Raman signal or
Stokes evolution can be obtained. Additionally, we checked for numerical accuracy by
accounting for the number of photons in the system. Since loss in a passive fiber is
typically < 0.3 dB/km and we considered relatively short fibers, we neglected this effect
in the simulations. It can be readily shown that in the absence of loss, the conservation
equation for the number of photons is given by:
−gRPPδ S , R
δ S , R
δ S , R =
!ω S , iΔω2π

50
(2.19)
where refers to a co-pumped and counter pumped, respectively. In all our simulations
the conservation relation described by Eq. (2.19) was satisfied to better than 0.001%.
An important consideration is to compare the efficiency and the SBS process in a single-
frequency Raman amplifier for co-pumped and counter-pumped configurations. Notably,
the effective Raman gain is higher in the co-pumped configuration than the counter-
pumped configuration as can be inferred from Eqs. (2.22) and (2.23) presented below. A
related manifestation of this effect is that the threshold for noise-initiated forward
propagating SRS is lower than that of backward propagating SRS [26]. However, since
the SBS process depends on the spatial evolution of the Raman signal along the length of
the fiber and also the interaction of the Stokes light with the Raman pump, it is not clear
which pumping configuration will lead to higher SBS thresholds for a given fiber
geometry. Regardless, due to the exponential rise in Raman signal at the output end of the
fiber in either pumping configuration, it can generally be argued that a lower seed power
would lead to a higher SBS threshold (amplifier noise notwithstanding). We initially
conducted a simulation using a fiber mode field diameter (MFD) of 7.5 µm which is
roughly equal to that used in the experiments described in Ref. [43]. We used a Raman
gain coefficient of m/W and an SBS gain coefficient of m/W. The
value for the Raman gain is typical of silica fibers [53]. Based on the experimental results
ddz
PRω R
−PS , i
ω R
± PPω Pi
∑⎛⎝⎜
⎞⎠⎟= 0
±
8 ×10⁻¹⁴ 1.5 ×10⁻¹¹

51
reported by the European Science Observatory (ESO), a Nufern 1060XP has
approximately twice the Brillouin threshold of a Corning HI1060 fiber [43]. The
difference in gain coefficients between the two fibers can be attributed to the effect of the
dopant types and concentrations. Recent measurements by Mermelstein on aluminum-
doped fibers indicate a Brillouin gain coefficient of approximately m/W [54].
The concentration of aluminum in the Nufern 1060XP was reported to be high [49]. It
thus appears that a value of m/W was a reasonable value for use in our
simulations.
A pump power of 200 W was considered. This value exceeds by 50 W the 1120
nm Raman pump laser reported in Ref. [55] and thus allows for investigation of state-of-
the-art systems. For each pumping configuration, the fiber length was optimized to allow
for maximum signal output at SBS threshold. We used the standard definition of SBS
threshold i.e. the Raman output power at the point where the reflectivity is approximately
1% [52]. The minimum fiber length was determined to be 16.7 m for the core co-pumped
and 17.5 m for the core counter-pumped configurations. Therefore, fibers with lengths
below the aforementioned values would be pump limited. Figure 19 shows a plot of the
spatial evolution of the signals at SBS threshold. Note there is little difference in output
power as both configurations exhibit a steep rise in signal power at the output end of the
fiber. Alternatively, one can fix the fiber length and allow for sufficient pump to get to
the SBS threshold. In this case, the counter-pump configuration will have slightly higher
output due to the slightly steeper rise in the signal at the output end. Regardless, the
results of the SBS process in a Raman amplifier are in stark contrast to the process in a
1×10⁻¹¹
1.5 ×10⁻¹¹

52
rare-earth doped gain fiber. For the latter, counter-pumping provides a SBS threshold that
is typically twice as high as that of co-pumping even without the inclusion of the thermal
gradient obtained through quantum defect heating.
Figure 19: Raman signal evolution at SBS threshold for co- and counter-pumped cases with optimized length and a pump power of 200 W.
Fiber Length and Seed Power Simulations
In order to understand the output power as a function of fiber length and seed
power, we conducted a series of simulations. Six fiber lengths were chosen: 25 m, 50 m,
75 m, 100 m, 125 m, and 150 m. Also, a set of seed powers were selected starting at
1 mW and ending as high as 1 W. In these simulations, we allowed for sufficient pump
power to be available for the amplifier to reach SBS threshold. Figure 20 shows the
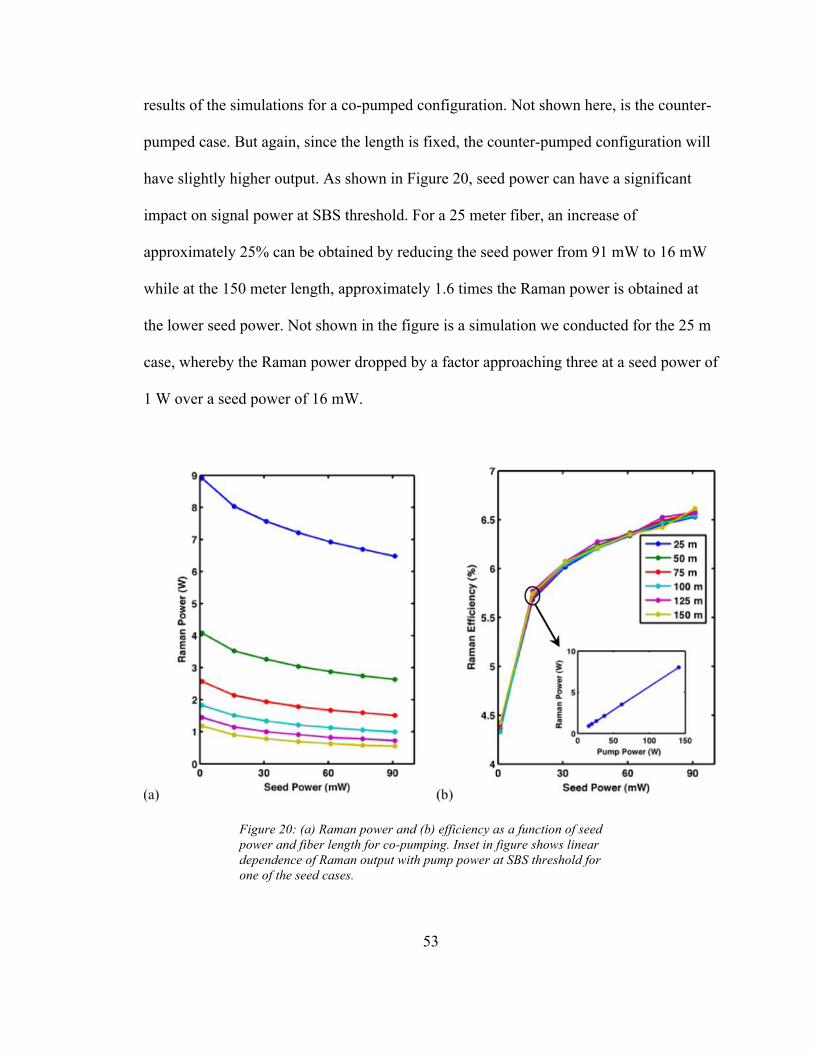
53
results of the simulations for a co-pumped configuration. Not shown here, is the counter-
pumped case. But again, since the length is fixed, the counter-pumped configuration will
have slightly higher output. As shown in Figure 20, seed power can have a significant
impact on signal power at SBS threshold. For a 25 meter fiber, an increase of
approximately 25% can be obtained by reducing the seed power from 91 mW to 16 mW
while at the 150 meter length, approximately 1.6 times the Raman power is obtained at
the lower seed power. Not shown in the figure is a simulation we conducted for the 25 m
case, whereby the Raman power dropped by a factor approaching three at a seed power of
1 W over a seed power of 16 mW.
Figure 20: (a) Raman power and (b) efficiency as a function of seed power and fiber length for co-pumping. Inset in figure shows linear dependence of Raman output with pump power at SBS threshold for one of the seed cases.

54
The enhancement in Raman power output due to lower seed power comes at a
price of reduced amplifier efficiency as shown in Figure 20. Note that the amplifier
efficiency is approximately the same for all fiber lengths for a given seed power. That is,
when optimizing fiber length, the Raman output at SBS threshold scales linearly with
pump power (the inset in the Figure 20(b) illustrates this for the case of a 16 mW seed
power). Consequently, substantial power scaling can be achieved by building more
powerful pumps. For example, with a 16 mW seed, approximately 8 W of output power
at a length of 25 m (corresponding pump power at SBS threshold of 141 W) is obtained,
while approximately 0.9 W was obtained at a length of 150 m (corresponding pump
power at SBS threshold of 15.4 W). If fiber lengths of 10 m and 5 m are considered, the
pump power required to reach SBS threshold for a seed power of 16 mW would be
approximately 418 W and 923 W, respectively. The efficiencies in these two cases are in
agreement with the results presented in Figure 20.
To explain the significant improvement in output Raman power with pump power
and the linear dependence, we started by first examining the Raman amplification only.
Using an undepleted pump treatment for the 1120 nm light, the small signal gain is
and thus it would appear that a reduction of length from, for example, 150 m to
25 m will require 6 times more pump power to achieve the same Raman output. That is,
based on this analysis, as long as is held constant, the same power is obtained.
However, accounting for pump depletion through the Raman process, the solution for the
co-pumped configuration can be readily obtained from Eqs. (2.12) and (2.19) where we
gRPPL
PPL

55
neglected the Brillouin process. Multiplying Eq. (2.12) by and adding Eq. (2.19) will
provide the following relation:
0P RdP dP
dz dzγ+ = (2.20)
Integrating the above and solving for , one obtains ( ) ( ) 1P RP z P z Cγ= − + . Substituting
this result into Eq. (2.12) leads to:
( )1RR R R
dP g P P Cdz
γ= − + (2.21)
Integrating Eq. (2.21), one obtains:
(2.22)
where is the seed power, is the input pump power. The constant 1C can be
determined from the boundary condition at 0z = ; leading to .
For the counter-pumped configuration, a similar procedure is employed and the
following equation is obtained:
γ
PP
PR z( ) = C1PR 0( )egRC1zPP 0( ) + γ PR 0( )egRC1z
PR 0( ) PP 0( )
C1 = PP 0( ) + γ PR 0( )

56
(2.23)
where . Note that is determined by solving Eq. (2.23) with
which results in a transcendental equation. Irrespective of the pumping
configuration, these equations indicate that in the regime where pump depletion starts to
become significant, an increase in pump power will lead to an increase in the Raman
signal as is held constant. This effect is small for the range of simulations we ran.
Much more significantly, when the SBS process is considered, a significant reduction in
the reflectivity is obtained at higher pump powers (shorter fiber lengths) due to the
relatively more rapid rise of the signal; thus allowing for further pumping and
consequently even higher Raman signal.
To illustrate this, we considered the case of the 150 m and 25 m fibers in a co-
pumped configuration seeded with 16 mW. For the former, the pump power at SBS
threshold is 15.4 W, while for the latter the pump power at SBS threshold is 141 W.
Figure 21, shows plots of the Stokes gain per unit length for each case. The total Stokes
gain is the sum of the Brillouin gain, , and Raman gain, . A good measure of
the reflectivity at SBS threshold is the exponential of the area underneath the total gain
curve normalized to the Raman output power. This is approximately the same for both
gain plots.
PR z( ) = C2PR 0( )egRC2zC2 + γ PR 0( ) 1− egRC2z( )
C2 = PP L( )−γ PR L( ) PR L( )
z = L
PPL
gBPR gRPP

57
Figure 21: Stokes gain per unit length at SBS threshold for (a) 25 m fiber and (b) 150 m fiber. The total gain is the sum of the Brillouin and Raman gain.
To mathematically validate these observations, Eq. (2.22) or (2.23) can be used to
obtain an approximate solution for the Stokes power at reflectivities on the order of 1%
[52] or less in co-pumped or counter-pumped configurations. For simplicity, we treated
here the co-pumped case and also assume one Stokes channel and negligible loss. The
counter-pumped case does not have a closed form solution, but the conclusions drawn for
the co-pumped case holds true. Eq. (2.22) can be used in Eq. (2.13) along with the
distributed noise terms to obtain a solution for the evolution of the Stokes light. While
this solution is more exact and was used to validate the numerical simulations, a more
instructive but less exact solution can be obtained by considering a localized noise source
injected at z L= . By using Eq. (2.22) in Eq. (2.13), and assuming the noise term is
localized, the reflectivity, , is given by:
R

58
(2.24)
where is the injected Stokes power. Since PR 0( )≪ PP 0( ) and the Raman output
scales approximately as exp gRC1L⎡⎣ ⎤⎦ , Eq. (2.24) indicates a linear dependence in Raman
power with pump power and in agreement with the results shown in the inset of Figure
20b.
SBS Mitigation Techniques
To provide a point of discussion to SBS mitigation, one can begin with the well-
known power threshold equation in a passive fiber (i.e. there is no gain through ionic
transitions or the Raman process) derived by R.G. Smith [26]:
Pth ∼21Aeff ,Bgb0,maxLeff
(2.25)
Clearly, if the effective area is increased, a higher threshold power can be achieved in a
passive fiber; however, this approach is not possible for a core pumped RFA due to the
reduced Raman gain. This point will be discussed further below. Another term in
Eq. (2.25) is the intrinsic maximum Brillouin gain coefficient. In silica, it possesses a
R =PS 0( )PR L( ) ∝PS L( ) PP 0( ) + γ PR 0( )egRC1L
PP 0( ) + γ PR 0( )⎛⎝⎜
⎞⎠⎟
gBγ gR
−1
PS L( )

59
value of ∼ 5×10⁻¹¹ m/W. However, in a fiber, due to the presence of dopants such as
aluminum, it can be significantly lower. Obviously, a shorter fiber length leads to a
higher SBS threshold. Yet, in a RFA, the Raman gain is small; thus using short fiber
lengths (<10 m) is not practical due to very high pump powers required. Another point to
consider is the differences between pumping schemes and subsequent effect on fiber
length. For example, within an YDFA, the signal power grows quite different for the co-
pumped case vs. the counter-pumped case (see Figure 22).
Figure 22: Power evolution of a typical Yb-doped amplifier in a co- and counter-pumped configuration.
Evidently, there is added benefit in an YDFA counter-pumped configuration. On
the other hand, the evolution of the amplified signal in a RFA (considering both pumping
schemes) was shown in Figure 19 to have a negligible benefit if the fiber length was
optimized. Nevertheless, it should be noted that both pumping schemes provide a fast rise

60
in the signal power at the output end of the fiber, which is beneficial to suppress SBS in
an RFA.
Despite some of the above limitations, there are other methods to power scale an
RFA. To this end, the Brillouin frequency shift can be influenced through manipulation
of the acoustic velocity υA( ) in the longitudinal or transverse direction of the fiber core to
provide SBS suppression; thus increased power threshold. This effect can be recognized
through the Brillouin frequency shift ΩB = 4πnυA λ( ) and the Brillouin gain bandwidth.
Several methods that shift or adjust the acoustic velocity are: temperature
gradients [56], stress gradients [57], and acoustically tailored fibers [58]. Fused silica
possesses an intrinsic temperature-dependent acoustic velocity [59] whereby a thermal
gradient introduced along the fiber tends to broaden the Brillouin gain spectrum (or
create multi Brillouin gain peaks, if applied as discrete steps). Thus, the effective
Brillouin gain is lower [60]. A typical value for the Brillouin gain bandwidth is 50 MHz
and is based on the empirical estimate of a shift in the peak Brillouin frequency of
2 MHz/°C [61], approximately 30 °C difference between the temperatures of adjacent
fiber sections is required. One consideration is the maximum operating temperature of the
fiber polymer, which is typically in the range of 100-150 °C. Therefore, from a practical
viewpoint, up to 3 temperature steps can be applied. Modeling and experimental
demonstrations have shown thermal gradients can increase the SBS threshold by a factor
of 3-5 [62].

61
Analogous to thermal gradients, applying tensile strain longitudinally along the
fiber can broaden the Brillouin gain spectrum [63]. By this means, modification of the
acoustic velocity via density variations due to stress or strain will tend to broaden the
Brillouin gain spectrum, thus reducing the effective Brillouin gain. In 2012, the work by
Zhang et al. generated 44 W of 1178 nm emission by Raman amplification [45] where
longitudianl strain steps were introduced in the fiber as shown in Figure 23.
Figure 23: Calculated signal power evolution (dotted), the designed strain distribution (solid, green), and the applied strain distribution (solid, blue) along the fiber [45].
In this work, a 20x reduction in the SBS gain coefficient was realized by applying
strain along the Raman gain fiber in 30 steps. This method took into account an SBS
62
spectral separation between each step of 60 MHz, which provided minimal overlap
between SBS peaks within the fiber core.
Although these methods work well, another approach to consider is modification
of the acoustic velocity transversely within the fiber core, which broadens the Brillouin
gain spectrum. Subsequently, this will reduce the effective Brillouin gain through an
increase in the nonlinear effective area [64]. Despite the recent interest in manipulating
the acoustic velocity inside a fiber core, Roger Stolen postulated it in 1979 [27] where an
inhomogeneous transverse acoustic velocity profile could provide an explanation for
increased SBS threshold measurements. Developing a fiber with optical homogeneity
whilst creating acoustic velocity gradients is not trivial. There are several dopants inside
the fiber to adjust. Notably, there is a similar effect from GeO2 and Al2O5 on the optical
refractive index, however an opposite effect on the acoustic refractive index. If these
dopants were used in tandem, an acoustic grating is possible while maintaining the
optical index.
Mode-Field Diameter
A larger core diameter was considered to increase the SBS threshold. Since the
SBS threshold scales linearly with the effective area [26], it would appear that using a
larger MFD fiber will lead to an increase in Raman signal. This is true if the fiber length
was predetermined and sufficient pump power was available such that the amplifier is not
pump limited. However, considering the 200 W pump limit set previously and optimizing
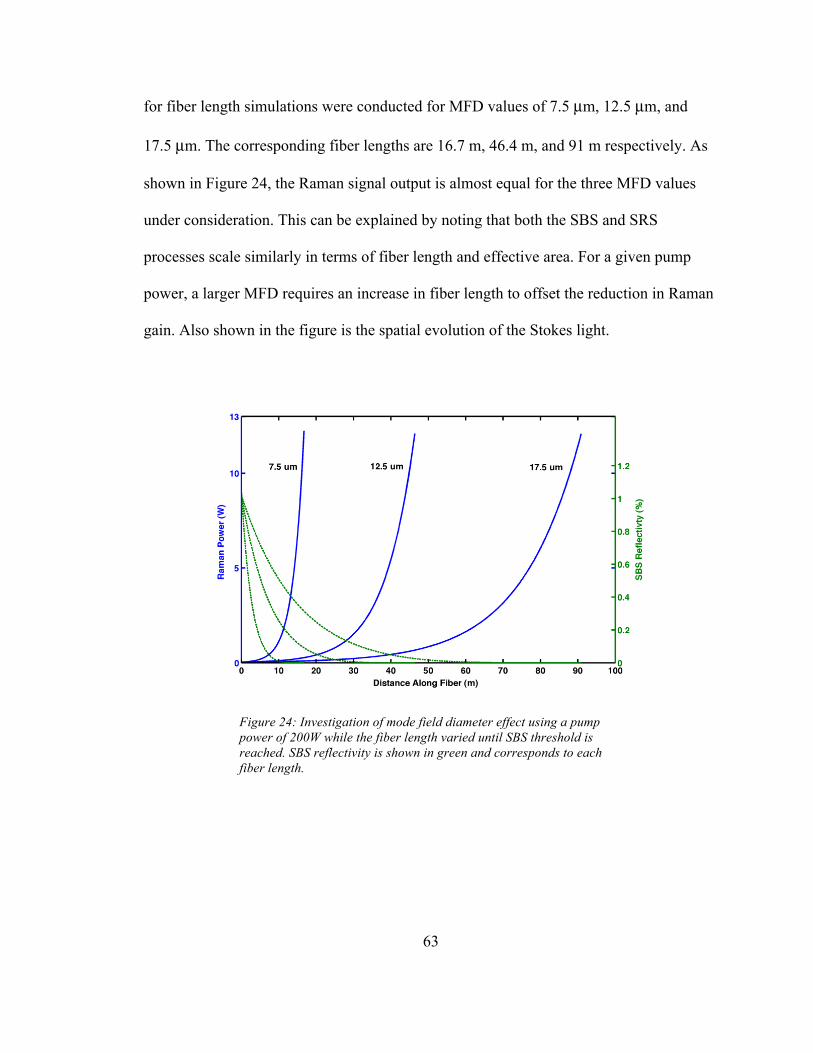
63
for fiber length simulations were conducted for MFD values of 7.5 µm, 12.5 µm, and
17.5 µm. The corresponding fiber lengths are 16.7 m, 46.4 m, and 91 m respectively. As
shown in Figure 24, the Raman signal output is almost equal for the three MFD values
under consideration. This can be explained by noting that both the SBS and SRS
processes scale similarly in terms of fiber length and effective area. For a given pump
power, a larger MFD requires an increase in fiber length to offset the reduction in Raman
gain. Also shown in the figure is the spatial evolution of the Stokes light.
Figure 24: Investigation of mode field diameter effect using a pump power of 200W while the fiber length varied until SBS threshold is reached. SBS reflectivity is shown in green and corresponds to each fiber length.

64
Multi-Step Temperature Profile Power Equations
As discussed previously, the SBS process can be mitigated by applying a
temperature gradient along the fiber. In order to investigate the external application of a
multi-step temperature profile, Eqs. (2.12) - (2.14) need to be generalized to account for
multiple center Stokes frequencies. Provided that there is minimal overlap among the
Brillouin gain bandwidths corresponding to each temperature segment, the system of
equations becomes:
(2.26)
(2.27)
dPPdz
= ∓γ gR PR + PS , i , ji , j∑
⎛
⎝⎜⎞
⎠⎟PP ∓α PPP (2.28)
where the subscript corresponds to the fiber section, and is zero everywhere
except for the pertinent fiber segment. As shown previously, there is no need to
determine the location of the injected Stokes photons a priori for each Stokes frequency
under consideration. This noise term can be incorporated by adding a term of the form
on the right hand side (RHS) of Eq. (2.27) with given by:
dPRdz
= gRPP − gB, i, j PS , i, j −α Ri, j∑⎛
⎝⎜⎞
⎠⎟PR
dPS , i, j
dz= − gRPP + gB, i, jPR −α R( )PS , i, j
j gB, i, j
−gB, iPRδ S , i, j δ S , i, j

65
δ S , i , j =!ω S , i , jΔω
2π exp! ωR −ω S , i , j( )
kTj
⎡
⎣⎢⎢
⎤
⎦⎥⎥−1
⎛
⎝⎜⎜
⎞
⎠⎟⎟
(2.29)
where is the frequency bin size, and is the temperature of the fiber section. The
SBS process can also be initiated through Raman noise characterized by the interaction of
the pump light with background optical phonons. As shown previously, the spontaneous
Raman noise is of the form on the RHS of Eq. (2.27). Here is given by:
(2.30)
Employing the above equations to examine further power scaling, we investigated
the application of multiple temperature steps along the length of the fiber. Markedly, a
similar analysis would apply for SBS mitigation using a multiple stress profile as was
utilized in the work of Zhang et al. [45]. If the temperature difference is such that little
overlap occurs between the Brillouin gain bandwidths corresponding to the various
segments of the fiber, considerable SBS suppression can be obtained with the proper
selection of the length of these segments.
To determine the optimal length of each segment, we require that the Stokes
power generated in each segment is approximately the same. Consequently, no peak
Stokes frequency is allowed to run away with the reflected power. Optimization of the
Δω Tj
−gRPPδ S , R δ S , R
δ S , R =
!ω S , i, jΔω2π

66
segment lengths can be determined numerically. However, this can be tedious or
computationally exhaustive. Instead, we developed a procedure to get an accurate
estimate of the length of each segment based on calculating the integrated Brillouin gain
for each segment. Consider segments with one end of each segment located at
, where . The optimal lengths are determined by the following set
of equations:
(2.31)
(2.32)
(2.33)
.
.
.
(2.34)
While the equations above worked very well for the co-pumped configuration, we found
that for the counter-pumped case better accuracy is obtained when the effective Raman
gain per unit length of the system is used.
L1,L2,L3,...LN LN = L
egRPP z
0
L1
∫ dz = 1N −1
egRPP z
L1
L
∫ dz
egRPP z
L1
L2
∫ dz = 1N − 2
egRPP z
L2
L
∫ dz
egRPP z
L2
L3
∫ dz = 1N − 3
egRPP z
L3
L
∫ dz
egRPP z
LN−2
LN−1
∫ dz = egRPP z
LN−1
LN
∫ dz

67
Multi-Step Temperature Profile Simulations
A set of simulations similar to those presented in Figure 20 was carried out for a
three-step temperature profile (i.e. four temperature regions) along the fiber. Again, the
fiber lengths chosen were 25 m, 50 m, 75 m, 100 m, 125 m, and 150 m. The results for
both co-pumped and counter-pumped configurations are shown in Figure 25. Note that
counter-pumping provides higher Raman signal in accordance with the findings for the
uniform temperature profile.
Figure 25: (a) Raman power and (b) efficiency achieved for both co-pumping and counter-pumping as a function of seed power and length of fiber using a three-step temperature profile (i.e. four temperature regions).

68
Furthermore, for both pumping configurations, considerably higher Raman power
is obtained when a multi-step thermal gradient is used. For example, at a pump power of
214.5 W, fiber length of 25 m and seed power of 16 mW, the output signal is 41.5 W.
Additionally, due to the increase in pump power at SBS threshold, the efficiency of the
system is considerably higher for the multi-step temperature simulations. Furthermore,
the co- and counter-pumped configuration linear dependence was recovered numerically
with the multi-step configuration and shown in Figure 26.
Figure 26: Linear dependence simulation of amplifier output with pump power at SBS threshold at optimized length for a three-step temperature profile (i.e. four temperature regions) seeded with 16 mW.
Figure 27 shows the evolution of the four Stokes signals for a co-pumped 150 m
fiber, seeded with 16 mW and pumped to provide at SBS threshold 4.1 W of Raman
power. These Stokes signals correspond to the peak Brillouin frequencies in each

69
segment. The length of each fiber segment was chosen using the optimization routine
described above. Note that all four Stokes signals provide almost equal reflectivities.
Figure 27: (a) The evolution of each Stokes signal in a 150 m fiber until SBS threshold was reached. (b) The characteristic evolution of each Stokes channel at the respective calculated length.
The fiber lengths corresponding to the four segments were 114.8 m, 17.6 m, 10.3 m, and
7.3 m; as expected decreasing in length in the direction of the signal propagation. Figure
27(b) shows a “zoom in” for the region of the fiber identified in Figure 27(a). The change
of slope in three of the Stokes signals can be traced to the traverse of the corresponding
Stokes light into a region where it encounters Raman gain but no Brillouin gain.
Figure 28 is a drawing of the fiber showing a relative representation of the optimized
segment lengths.

70
Figure 28: Three-step temperature profile (i.e. four different temperature regions) applied to a 150 m fiber seeded with 16 mW showing the relative lengths of the fiber segments.
Consequently, simulations were carried out for a three-step temperature profile
(i.e. four temperature regions) with an optimized fiber length to compare co- and counter-
pumped configurations. We used a Raman gain coefficient of 8×10-14 m/W and a SBS
gain coefficient of 1.2×10⁻¹¹ m/W. The latter value was based on our pump probe
measurements conducted on a Nufern PM980-XP fiber described in Chapter 3. The mode
field diameter (MFD) was set to 7.5 µm. The MFD value is roughly equal to that used in
the experiments described in Ref. [55] and in our experiments. In one set of simulations,
we considered a pump power of 200 W, which exceeds the 1120 nm Raman pump laser
by 50 W as reported in Ref. [55] and allows for investigation of future systems. The seed
power at 1178 nm was set at 16 mW. Each pumping configuration was analyzed and the
fiber lengths were adjusted until SBS threshold defined at 1% reflectivity was reached,
i.e. smaller lengths would be pump limited while greater lengths would be SBS limited.
For the co-pumped configuration, this procedure yielded a fiber length of 23.2 m while
for the counter-pumped configuration a fiber length of 28.7 m was obtained. Each
segment was calculated using the optimization procedure described above and was
determined to be 19.4 m, 1.9 m, 1.1 m and 0.8 m for the co-pumped configuration and
24.3 m, 2.2 m, 1.3 m and 0.9 m for the counter-pumped case. Figure 29 shows plots of

71
the spatial evolution of the signals at SBS threshold. For comparison, a plot of the signal
evolution in both pumping configurations for a fiber with uniform temperature is shown
in Figure 29. Note that due to the lower SBS threshold for the uniform temperature case,
the fiber lengths were shorter at 19.2 m and 20.4 m for the co- and counter-pumped
configurations; respectively; leading to considerably lower output power.
Figure 29: Raman signal evolution at SBS threshold for co- and counter-pumped cases with optimized fiber length for both three-step temperature profile (i.e. four temperature regions) and uniform temperature profile.
In comparing the co- and counter-pumping configurations for the multi-step (four
Stokes channels) temperature profile (or for that matter the uniform temperature profile),

72
we discovered that there is little difference in output power as both configurations exhibit
a steep rise in signal power at the output end of the fiber. Alternatively, one can fix the
fiber length and allow for sufficient pump to get to the SBS threshold. In this case, the
counter-pump configuration will have moderately higher output due to the steeper rise in
the signal at the output end. Regardless, the results of the SBS process in a Raman
amplifier are in stark contrast to the process in a gain fiber (see Figure 22). For the latter,
counter-pumping provides an SBS threshold that is typically twice as high as that of co-
pumping, even without the inclusion of the thermal gradient obtained through quantum
defect heating.
Two-Stage RFA Simulations
The numerical simulations above indicated that for a given fiber length, the output
power at SBS threshold actually decreases with increased seed power (see Figure 20 and
Figure 25). On the other hand, the efficiency, defined as the ratio of the signal power to
the pump power, increases. We conducted a numerical study to examine the scalability of
single-frequency RFAs in relation to seed power. The system of equations used in the
study was previously described and entails solving the evolution of the pump, signal, and
Stokes light as functions of position in the fiber with the SBS process being initiated from
thermal noise.
We proceeded by choosing different seed powers and optimizing the fiber length
such that all available pump power is utilized at SBS threshold. The results from a

73
counter-pumped RFA without the benefit of a thermal gradient are shown in Figure 30.
Not considering spectral broadening, one would expect the results for a co-pumped RFA
to behave similarly [49]. The fiber simulated is based on the Raman gain enhanced
acoustically tailored fiber described in Ref. [50]. This type of fiber was utilized in the
two-stage RFA experimental work presented in Chapter 4. This fiber allowed us to
conduct the study of dependence of output power on seed power more readily while
allowing for power scaling to >20 W (see Chapter 4) without the added complexity of
utilizing different temperature regions. The maximum available pump power in the
simulations is 80 W to match with the pump power used in the two-stage experiments.
For this fiber, was estimated to be m/W [50]. We estimated to be
m/W based on the acoustically tailored RFA results presented in Ref. [50]. As
a comparison, a similar estimate for the COTS fiber provided 111 10Bg−= × m/W. This
value is lower than the m/W estimate obtained from the pump-probe
experiment that was performed at 1064 nm (see Chapter 3). As shown in Figure 30, the
output power at SBS threshold increases with seed power. A relatively sharp increase in
the output power is obtained as the seed power is varied from 5 mW to 500 mW. Beyond
1 W, the output scales approximately linearly with seed power. The figure also provides
the corresponding optimal fiber length. Therefore, in order to achieve further power
scaling, there is a need to build a two-stage RFA. The first stage is used to generate
1178 nm optical power at a level >500 mW in order to seed the second stage.
Accordingly, the experimental effort to achieve this is described in Chapter 4.
gR 8 ×10⁻¹⁴ gB
3.4 ×10⁻¹²
1.2 ×10⁻¹¹

74
Figure 30: Simulation results of output power at SBS threshold vs. seed power for the acoustically tailored fiber described in [50]. Also, shown is the corresponding optimal fiber length.
Two-Signal RFA
Power Equations
Based on simulations of the photon returns from the mesosphere as well as
experimental results, improved performance of the guide star system can be obtained by
simultaneously illuminating the two sodium lines. We investigated the possibility of
generating the D2a and D2b lines by utilizing the same Raman amplifier. Since the
separation of the two lines is approximately 1.7 GHz, there is no overlap between the
corresponding Brillouin gain bandwidths even when a multi-step temperature profile is
75
considered. Consequently, the two signals should reach their respective SBS thresholds
independently. However, since linear dispersion is small for such a separation, FWM
must be considered. Theoretical analysis suggests that the ratio of the power at the D2a
line should be approximately 10 times that at D2b. The second harmonic power is
proportional to the square of the pump wavelength power, which indicates that the output
power of the two signals in the 1178 nm Raman amplifier should be slightly higher than
3:1.
Without consideration of FWM, SBS and fiber loss, the equations describing the
“two-color” Raman amplifier take the following form:
(2.35)
(2.36)
(2.37)
where , and are the powers of signal 1 and signal 2, respectively. The signs
represent co- and counter-propagating pump waves, respectively. Based on these
equations, it can be readily deduced that regardless of the pumping configuration:
(2.38)
dP1dz
= gRP1PP
dP2dz
= gRP2PP
dPPdz
= ∓γ gR P1 + P2( )PP
P1 P2 ∓
P2 z( ) = P2 0( )P1 0( ) P1 z( )

76
Using a conservation equation similar to Eq. (2.19) and Eqs. (2.35) and (2.36), one can
readily show that for the co-pumping configuration:
(2.39)
where . Similarly, it can be shown that for the counter-
pumped configuration an equation of the following form is obtained:
(2.40)
where , and . Note that is determined
by solving Eq. (2.40) with which results in a transcendental equation.
These solutions were used to check the numerical accuracy of the full system of
coupled nonlinear differential equations describing the evolution of the field amplitudes
of the pump, the two Raman signals, and two FWM sidebands. Here, we were interested
in amplifier operation below the SBS threshold, and hence the investigation of the FWM
process would be accurate without including the Brillouin process.
P1 z( ) = C3P1 0( )eC3gRzPP 0( ) + γ P1 0( ) + P2 0( )( )eC3gRz
C3 = PP 0( ) + γ P1 0( ) + P2 0( )( )
P1 z( ) = C4P1 0( )eC4gRzC4 + γ P1 0( ) 1+θ( ) 1− eC4gRz( )
θ = P2 0( ) P1 0( ) C4 = PP L( )−γ 1+θ( )P1 L( ) P1 L( )
z = L

77
Amplitude Equations
The field amplitude equations are used to capture the full FWM interactions
including the effects of self- and cross-phase modulations. The derivation of the coupled
system follows that provided in Ref. [65] except that we have here Raman gain instead of
laser gain. Considering two input frequencies oscillating at and the interaction
of the waves is mediated through the third-order susceptibility of the medium with
two sidebands located at:
(2.41)
(2.42)
where . Since the frequency separation is on the order of 1.7 GHz,
which is smaller than the optical wavelength, the modal profiles are set to be equal. The
wave equation is then reduced through couple-mode theory for the wave oscillating at
. The nonlinear index of refraction is related to by
( )( )3
21
1
38R
R
nnχ= (2.43)
The linear phase mismatch terms and , which characterize the energy
transfer among the various waves by:
ω R1 ω R2
χ 3( )
ω 3 =ω R1 − Δω
ω 4 =ω R1 + 2Δω
Δω =ω R2 −ω R1
ω R1 χ 3( )
Δβ1,Δβ2 Δβ3

78
Δβ1 = β2 + β3 − 2β1 = β 2( ) Δω( )2 (2.44)
(2.45)
(2.46)
where a Taylor expansion was used to relate these terms to the group-velocity
dispersion (GVD) parameter. Dispersion effects in the nonlinear index of refraction are
negligible for all waves, therefore (2) 203 10In −= × m2/W where (2) In is related to the
nonlinear index of refraction (2)n by:
( )( )2
2 2I ocnnn
µ= (2.47)
Since there is little variation among the frequencies of the Raman signals and FWM
sidebands, the spatial evolution of the pump field amplitude, , is given by:
dAPdz
= −γ groεocnRκ14
A12 + A2
2 + A32 + A4
2( )AP (2.48)
Δβ2 = β3 + β4 − β1 − β2 = 2β2( ) Δω( )2
Δβ3 = 2β2 − β1 − β4 = −β 2( ) Δω( )2
β 2( )
AP

79
where and are the field amplitudes for the two Raman signals and two
sidebands, respectively. Where nR is the linear index of refraction at the Raman
wavelength. The overlap integral, is given by:
(2.49)
For the sake of brevity, we wrote the spatial evolution of either of the Raman signals as:
dAidz
= groεocnPκ 2
4AP
2 Ai +iωRn
2( )κ 3
c
Ai2 + 2 Aj
2
j≠i∑
⎛
⎝⎜⎞
⎠⎟Ai
+ 2Ai*AkAi+2 exp iβ 2( ) Δ ′ω( )2 z⎡⎣ ⎤⎦
+ 2Ak*A3A4 exp 2iβ 2( ) Δ ′ω( )2 z⎡⎣ ⎤⎦
+ Ak2Ak+2 exp −iβ 2( ) Δ ′ω( )2 z⎡⎣ ⎤⎦
⎛
⎝
⎜⎜⎜⎜⎜⎜⎜⎜
⎞
⎠
⎟⎟⎟⎟⎟⎟⎟⎟
(2.50)
where here , and . The value of the index is 2 for , and 1 for
, Pn is the index of refraction at the pump wavelength, ( )2n is the nonlinear index of
refraction, is the frequency separation between the two signals, and is the
group velocity dispersion parameter. The second and third terms on the right hand side of
the equation above are FWM terms and represent self (SPM) and cross-phase modulation
A1,A2,A3 A4
κ1
κ1 =ϕR x, y( ) 2 ϕP x, y( ) 2 dxdy∫∫
ϕP x, y( ) 2 dxdy∫∫
i = 1,2 j = 1,2,3,4 k i = 1
i = 2
Δ ′ω β 2( )

80
(XPM), respectively, and terms (4-6) are FWM terms representing energy transfer to the
sidebands. The overlap integrals, and are given by:
(2.51)
(2.52)
The spatial evolution of the FWM sidebands is given by:
dAi+2dz
=groεoc nPκ 2
4AP
2Ai+2 +
iωRn2( )κ 3c
Ai+22+ 2 Aj
2
j≠i+2∑
⎛
⎝⎜⎞
⎠⎟Ai+2
+ Ai2Ak
*Exp −iβ 2( ) Δ ′ω( )2 z⎡⎣⎢
⎤⎦⎥
+2A1*A2Ak+2
* Exp −2iβ 2( ) Δ ′ω( )2 z⎡⎣⎢
⎤⎦⎥
⎛
⎝
⎜⎜⎜⎜⎜⎜⎜
⎞
⎠
⎟⎟⎟⎟⎟⎟⎟
(2.53)
Simulations and Analysis
We examined FWM for the case of a three-step temperature applied along the
length of fiber. Signal 1 was seeded at 45 mW while signal 2 was seeded at 15 mW. This
ensured a Raman output power ratio of approximately 3:1. The pump power for the co-
pumped case was chosen to be 15% below the pump level at SBS threshold; thus
κ 2 κ 3
κ 2 =ϕR x, y( ) 2 ϕP x, y( ) 2 dxdy∫∫
ϕR x, y( ) 2 dxdy∫∫
κ 3 =ϕR x, y( ) 4 dxdy∫∫ϕR x, y( ) 2 dxdy∫∫
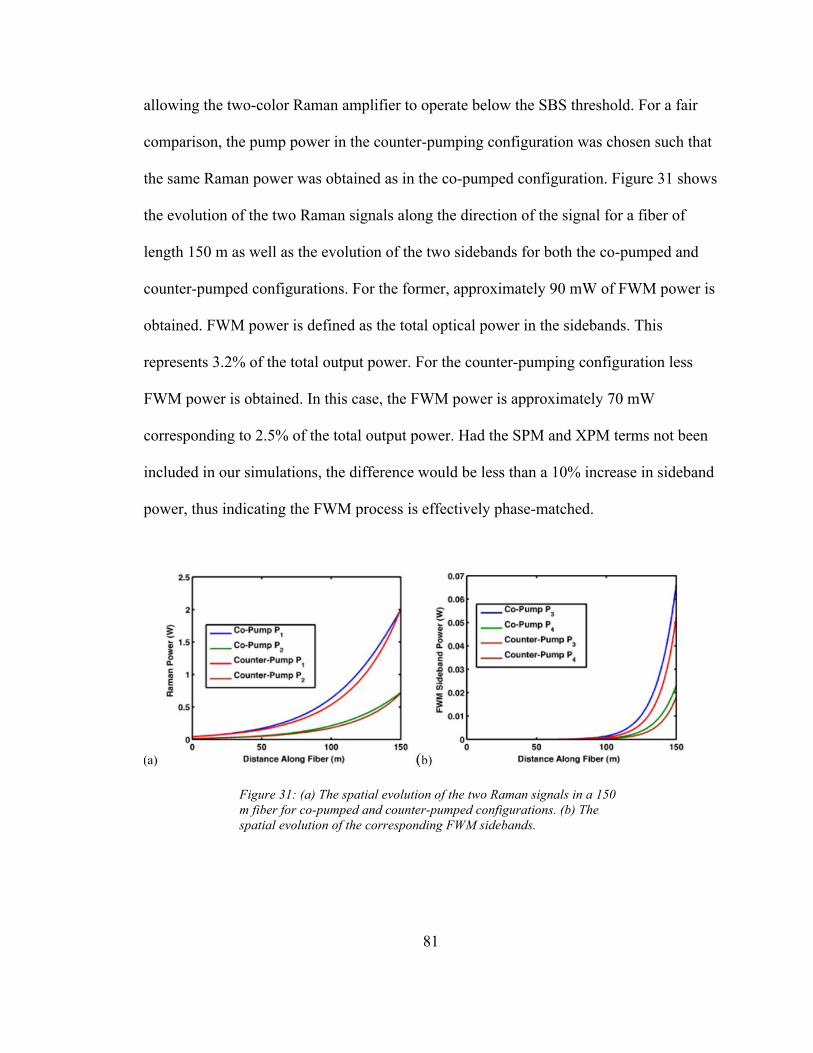
81
allowing the two-color Raman amplifier to operate below the SBS threshold. For a fair
comparison, the pump power in the counter-pumping configuration was chosen such that
the same Raman power was obtained as in the co-pumped configuration. Figure 31 shows
the evolution of the two Raman signals along the direction of the signal for a fiber of
length 150 m as well as the evolution of the two sidebands for both the co-pumped and
counter-pumped configurations. For the former, approximately 90 mW of FWM power is
obtained. FWM power is defined as the total optical power in the sidebands. This
represents 3.2% of the total output power. For the counter-pumping configuration less
FWM power is obtained. In this case, the FWM power is approximately 70 mW
corresponding to 2.5% of the total output power. Had the SPM and XPM terms not been
included in our simulations, the difference would be less than a 10% increase in sideband
power, thus indicating the FWM process is effectively phase-matched.
Figure 31: (a) The spatial evolution of the two Raman signals in a 150 m fiber for co-pumped and counter-pumped configurations. (b) The spatial evolution of the corresponding FWM sidebands.
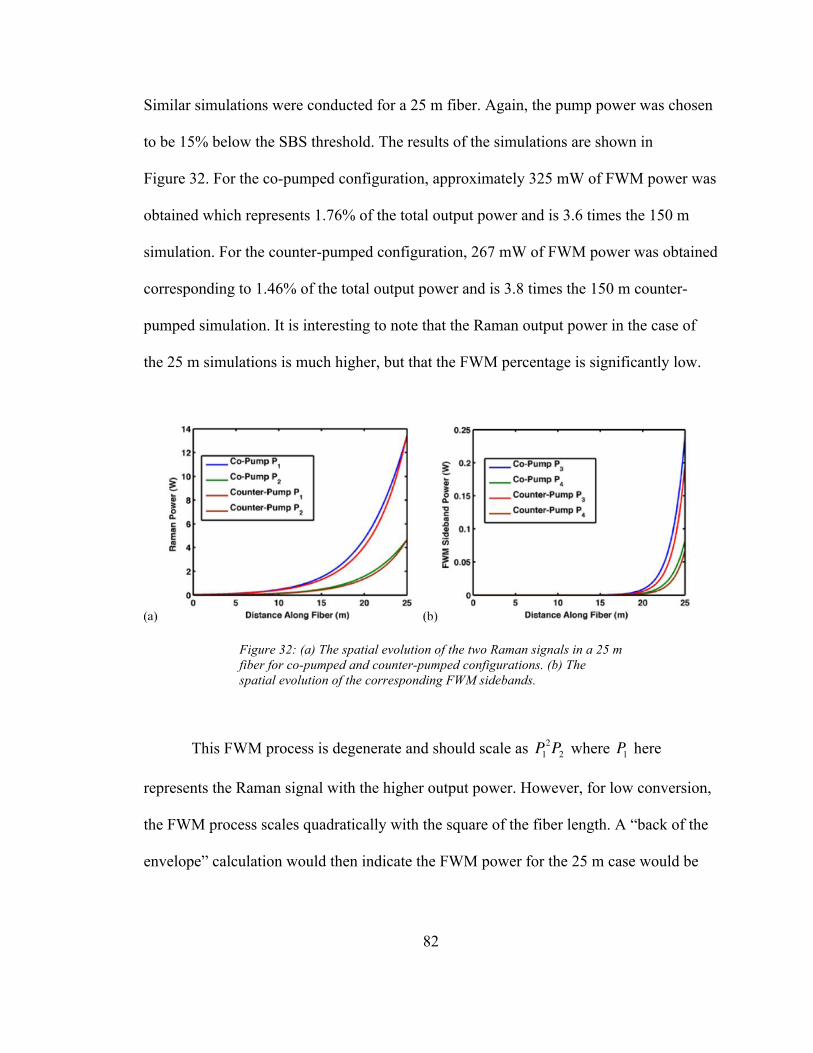
82
Similar simulations were conducted for a 25 m fiber. Again, the pump power was chosen
to be 15% below the SBS threshold. The results of the simulations are shown in
Figure 32. For the co-pumped configuration, approximately 325 mW of FWM power was
obtained which represents 1.76% of the total output power and is 3.6 times the 150 m
simulation. For the counter-pumped configuration, 267 mW of FWM power was obtained
corresponding to 1.46% of the total output power and is 3.8 times the 150 m counter-
pumped simulation. It is interesting to note that the Raman output power in the case of
the 25 m simulations is much higher, but that the FWM percentage is significantly low.
Figure 32: (a) The spatial evolution of the two Raman signals in a 25 m fiber for co-pumped and counter-pumped configurations. (b) The spatial evolution of the corresponding FWM sidebands.
This FWM process is degenerate and should scale as where here
represents the Raman signal with the higher output power. However, for low conversion,
the FWM process scales quadratically with the square of the fiber length. A “back of the
envelope” calculation would then indicate the FWM power for the 25 m case would be
P12P2 P1

83
approximately 8 times that of the 150 m case. We attributed the difference between this
calculation and the numerical simulations, to the spatial profiles of the Raman signals,
which exhibit more of a rapid rise in the case of the 25 m fiber.
Due to the presence of FWM, this approach is not as desirable as an approach that
uses phase modulation to excite the two lines of interest. With the latter approach, no
FWM occurs between the sidebands. In chapter 4, we will present a demonstration of a
two line counter-pumped RFA using sinusoidal modulation.

84
Chapter 3
Single-Stage RFA Experiment and Results
The model developed above was critical in guiding the experimental work
presented henceforth. The numerical simulations were utilized to provide, based on
available pump power, experimental estimates of the intrinsic Brillouin gain and Raman
gain coefficients, reasonable estimates of seed power and fiber length (including length
of fiber segments in a multi-step thermal gradient implementation) needed to achieve
relatively high Raman output power at SBS threshold. On the other hand, the
experimental work was used to validate the predictions of the numerical model. Notably,
the cutback experiment presented below recovers the linear dependence of output power
at SBS threshold on pump power.
We begin our discussions of the experimental work by presenting measurements
of the Brillouin gain bandwidth and peak value.
Brillouin Gain Spectrum Measurements of COTS Fiber
A key consideration in constructing a relatively high power RFA from a COTS
fiber is to identify fibers with relatively low Brillouin gain coefficient . Dopants
contained in the fiber core can radically affect the . Mermelstein compared the SBS
process in aluminum-doped and germanium-doped fibers [54]. For the former, he
measured to be ~1.0 × 10⁻¹¹ m/W. This relatively low value was attributed to the
gB
gB
gB
85
acoustic anti-guiding properties of the fiber core due to the presence of aluminum.
Towards that end, several different fibers were investigated.
The work in Ref. [43] tested various fibers in a single-frequency Raman fiber
amplifier configuration, and discovered the Nufern 1060XP fiber led to a higher SBS
threshold than the Corning HI1060. The figure of merit used here was the ratio of the
Raman and SBS gain coefficient, , which turned out to be 0.00333 for the Nufern
1060XP and 0.00179 for the Corning HI1060. Despite the fiber being non-polarization
maintaining, this work indicated a COTS fiber that could be used in this research. Since
the focus of this work was to utilize a polarization maintaining fiber, we ordered 300 m
of Nufern PM980-XP fiber. This fiber is the polarization maintaining version of the
Nufern 1060XP fiber design. The COTS PM980-XP from Nufern contains high
aluminum content [51]. This single-mode passive fiber possesses core and cladding
diameters of 6 µm and 125 µm, respectively.
We examined the Brillouin gain spectrum (BGS) of this type of fiber using a
pump-probe technique. The experimental set-up is shown in Figure 33. Two nonplanar
ring oscillators (NPRO) sources operating at approximately 1064 nm and with nominal
linewidths on the order of KHz were used in the setup as the pump and probe (Stokes)
laser sources. Frequency tuning of the probe NPRO was achieved by slowly modulating
the temperature of the Nd:YAG crystal. The pump signal was amplified by utilizing a
single mode Yb-doped fiber amplifier and propagated through a polarizing beam splitter
(PBS) in order to separate the Stokes light. The polarizations of the input beams were
oriented along the slow axis of the PM980-XP fiber using half-wave plates. The fiber
gR gB
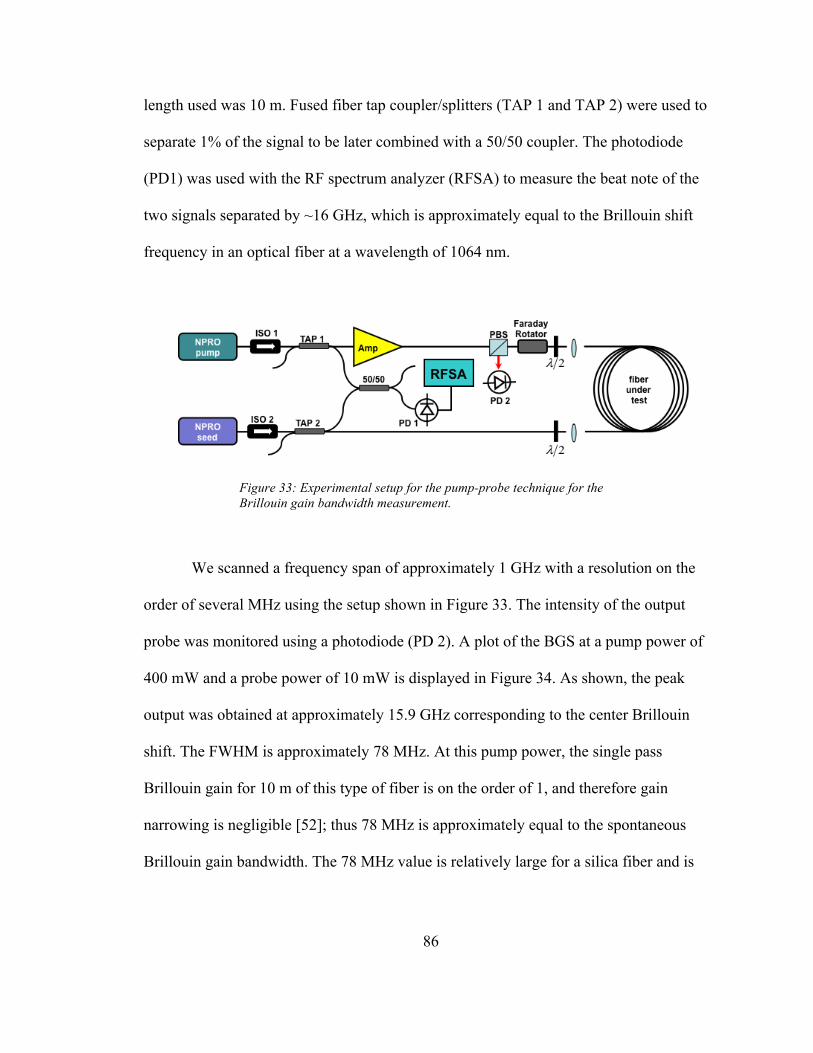
86
length used was 10 m. Fused fiber tap coupler/splitters (TAP 1 and TAP 2) were used to
separate 1% of the signal to be later combined with a 50/50 coupler. The photodiode
(PD1) was used with the RF spectrum analyzer (RFSA) to measure the beat note of the
two signals separated by ~16 GHz, which is approximately equal to the Brillouin shift
frequency in an optical fiber at a wavelength of 1064 nm.
Figure 33: Experimental setup for the pump-probe technique for the Brillouin gain bandwidth measurement.
We scanned a frequency span of approximately 1 GHz with a resolution on the
order of several MHz using the setup shown in Figure 33. The intensity of the output
probe was monitored using a photodiode (PD 2). A plot of the BGS at a pump power of
400 mW and a probe power of 10 mW is displayed in Figure 34. As shown, the peak
output was obtained at approximately 15.9 GHz corresponding to the center Brillouin
shift. The FWHM is approximately 78 MHz. At this pump power, the single pass
Brillouin gain for 10 m of this type of fiber is on the order of 1, and therefore gain
narrowing is negligible [52]; thus 78 MHz is approximately equal to the spontaneous
Brillouin gain bandwidth. The 78 MHz value is relatively large for a silica fiber and is

87
indicative of a lower Brillouin gain, as the acoustic phonon lifetime is proportional to the
reciprocal of this value [52].
Figure 34: Experimental data of the Brillouin gain spectrum in the PM980-XP fiber obtained by conducting a pump-probe experiment. The peak gain occurs at a Brillouin shift of approximately 15.9 GHz and the bandwidth is 78 MHz.
In order to obtain an estimate of , we conducted a set of experiments whereby
the input probe power was kept at 1 mW throughout the measurements. We varied the
pump power and recorded the output Stokes at peak gain (PD2) to generate the plot in
Figure 35. The peak gain for each pump power was determined by scanning through the
frequency range. This data was fitted to the numerical solutions obtained by solving the
coupled system of equations describing the evolution of the signal and Stokes (see
Chapter 2). This fit yielded a value for of 1.2 × 10⁻¹¹ m/W. Notably, this value is
gB
gB

88
approximately equal to that reported by Mermelstein for the aluminum-doped fiber and in
line with the value used in the simulations above.
Figure 35: Experimental data and the numerical fit corresponding to the pump-probe study of the Brillouin gain in the PM980-XP fiber. The fit yielded a value for the Brillouin gain coefficient of 1.2 × 10⁻¹¹
m/W.
Characterization of Seed, Pump, and Wavelength Division Multiplexer (WDM)s
To construct an RFA, several components were needed: seed at 1178 nm, pump
power at 1120 nm, and WDMs to separate and combine signals. Prior to building the
RFA, each component was characterized to confirm the manufactures specifications and
performance in the experiments.

89
Seed Laser
In all experiments, a Toptica DFB diode laser operating at 1178 nm as the seed
source was used. This fiber coupled diode laser has a nominal linewidth of 2 MHz
according to the manufacturers’ specifications. The Toptica seed spectral output was
investigated using a Yokogawa optical spectrum analyzer; thus confirming no significant
spectral components outside of the narrow 1178 nm region existed (see Figure 36).
Figure 36: Characterization of the Toptica seed laser using an optical spectrum analyzer.
Since the Raman gain is polarization dependent, it is critical the seed and pump
laser maintain a linear polarization state. For the seed laser, the azimuth and ellipticity
drift (see Figure 37) was measured as well as the degree of polarization (see Figure 38)
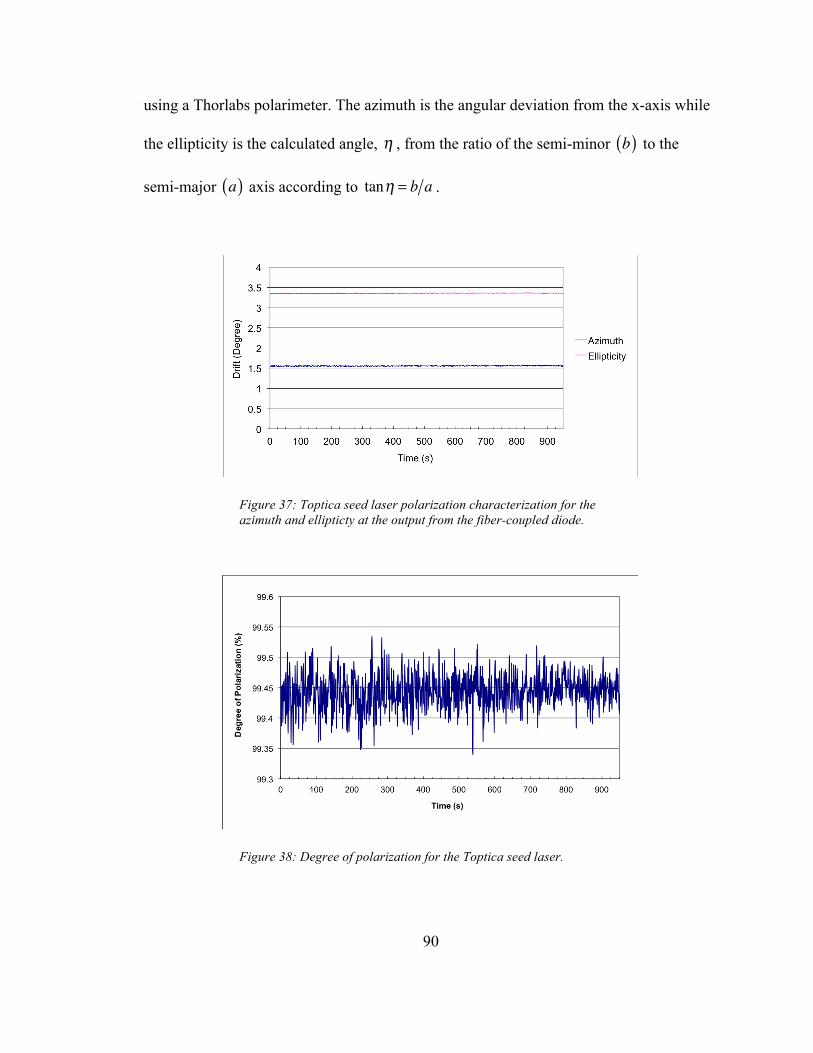
90
using a Thorlabs polarimeter. The azimuth is the angular deviation from the x-axis while
the ellipticity is the calculated angle, , from the ratio of the semi-minor to the
semi-major axis according to .
Figure 37: Toptica seed laser polarization characterization for the azimuth and ellipticty at the output from the fiber-coupled diode.
Figure 38: Degree of polarization for the Toptica seed laser.
η b( )
a( ) tanη = b a

91
The degree of polarization can range from 0% to 100% with an accuracy of
±0.5%. In this case, the Toptica seed is linearly polarized at the output of the fiber
connector and suitable for single-frequency RFAs.
50 W Pump Laser and WDMs
One pump source used in the experiments was an IPG air-cooled Raman fiber
laser operating at 1120 nm with a maximum output approaching 55 W. This laser is a
linearly polarized oscillator comprised of a passive fiber pumped with an Yb-doped fiber
laser operating at approximately 1064 nm. The laser light at 1120 nm is generated
through a first-order Raman shift.
As discussed previously for the seed laser, it is also critical that the pump laser is
linearly polarized. To confirm the linear polarized output of the pump laser, a
polarization cross-talk measurement using Eq. (3.1) was conducted [66].
(3.1)
where indicates the amount of light coupled into the fast axis of the polarization
maintaining fiber, and indicates the amount of light the slow axis. The IPG laser was
brought up to 80% full power and a polarization cross-talk measurement was employed.
A beam wedge provided a means to measure low power components for this
Polarization cross-talk = 10 log Pmin
Pmax
⎛⎝⎜
⎞⎠⎟
Pmin
Pmax

92
measurement. Towards this end, a polarizer and power meters 1 and 2 were used to
capture the polarization in each (fast and slow axis) direction. The polarizer was rotated
after 15 and 23 minutes of run time to capture the polarization cross-talk at the output
(see Figure 39). This measurement yielded a value of ~28.7 dB, which corresponds to a
well linearly polarized pump source.
Figure 39: Power data for the 50 W IPG laser. The duration was 30 minutes and indicates there is negligible polarization drift over time. The measurements at power meter 1 and power meter 2 compare the polarization cross talk.
WDM
In this work, we used several polarization-maintaining WDMs to separate and
combine the signals in the amplifier. The power handling capability of commercially
available PM WDMs is typically <10 W. Gooch and Housego manufactured a specialty
high-power WDM rated for 50 W for this work. In order to drive the component to

93
powers, in some cases exceeding the manufacturer’s recommendations, we mounted and
thermally cooled the WDMs to prevent damage.
The 50 W IPG pump laser was used to characterize the WDMs. This was
performed by splicing the WDM directly to the delivery fiber of the pump laser where the
output ends of the WDM provided one path for 1178 nm light and the other 1120 nm
light. Power meters were used to capture the light on each port (available pump power
and WDM loss power) as shown in Figure 40.
Figure 40: Characterization of the 50 W IPG pump laser indicating initial pump power, available pump power, and WDM loss power.
Figure 40 shows the initial characterization of the output power from the IPG
50 W laser, available pump power, and WDM loss power. The WDM loss power is the
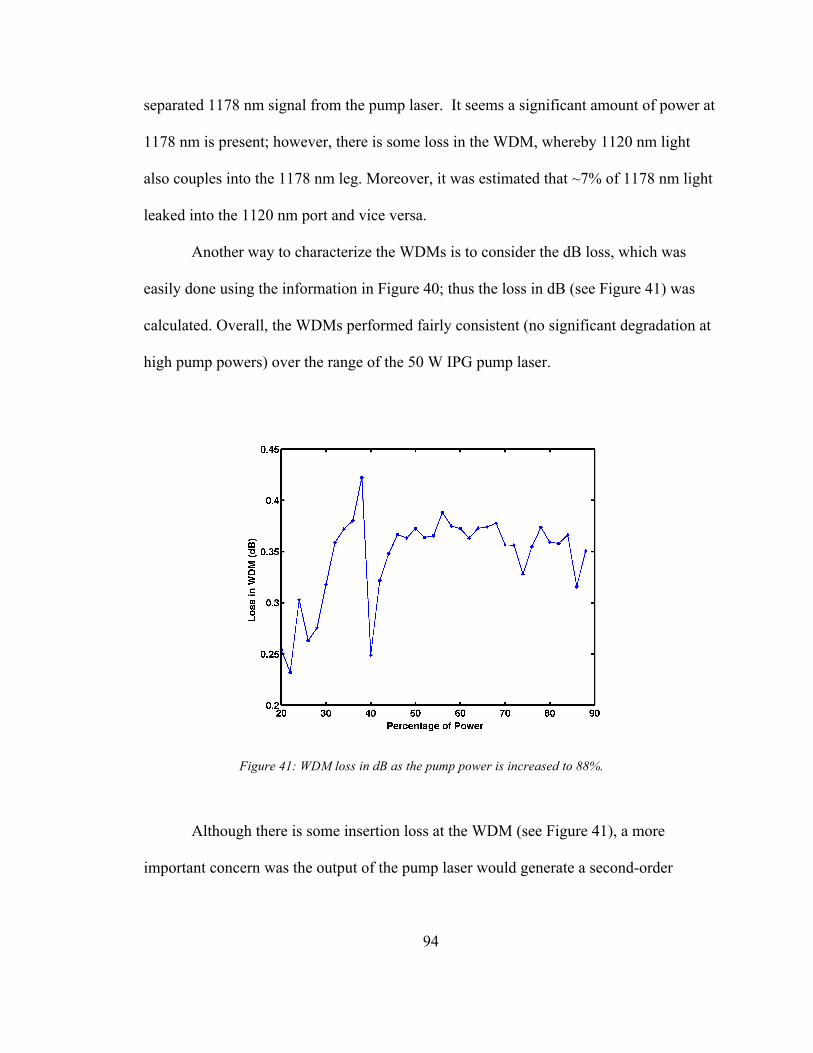
94
separated 1178 nm signal from the pump laser. It seems a significant amount of power at
1178 nm is present; however, there is some loss in the WDM, whereby 1120 nm light
also couples into the 1178 nm leg. Moreover, it was estimated that ~7% of 1178 nm light
leaked into the 1120 nm port and vice versa.
Another way to characterize the WDMs is to consider the dB loss, which was
easily done using the information in Figure 40; thus the loss in dB (see Figure 41) was
calculated. Overall, the WDMs performed fairly consistent (no significant degradation at
high pump powers) over the range of the 50 W IPG pump laser.
Figure 41: WDM loss in dB as the pump power is increased to 88%.
Although there is some insertion loss at the WDM (see Figure 41), a more
important concern was the output of the pump laser would generate a second-order

95
Raman shift thereby introducing light at 1178 nm into the predominantly 1120 nm output.
As such, significant consideration was given to the amount of noise in the vicinity of
1178 nm that was introduced into the amplifier from the Raman fiber pump laser due to
the second-order Stokes process. To be certain, the WDM suppressed some of that noise
as evidenced by our studies of the spectral content shown in Figure 42. However, we
conducted simulations that indicated at low seed powers, significant amplification of the
noise could still occur.
Figure 42: 50 W IPG spectral content indicating there is second-order Stokes present (green line). The second-order Stokes was suppressed (blue line) using a wavelength division multiplexer (WDM).
This noise can compete with the seed for Raman gain (co-pumped configuration)
as well as act as a seed for the growth of SBS (counter-pumped configuration). To be

96
certain, WDMs were used to filter out a significant amount of this noise. However, even
then, we could clearly observe the second order Stokes (~1180 nm signal) on the OSA as
we pumped the RFA without the seed laser.
100 W Pump Laser
The second pump laser used in the experiments was an IPG water-cooled
broadband Raman fiber laser centered at approximately 1120 nm with a maximum output
of 100 W (similar design to the 50 W IPG laser described above). As discussed
previously, a second-order Raman shift would introduce light at 1178 nm into the
predominantly 1120 nm output; thus we used a high-resolution optical spectrum analyzer
(OSA) to examine the spectral content of this pump source. The spectral content
(resolution of 0.1 nm) at 50% and 90% of the maximum output power is shown in
Figure 43. The primary peak occurs near 1120 nm. Furthermore, a broadband secondary
peak is present near 1178 nm. As expected from a second-order Stokes effect, the relative
spectral content near 1178 nm rises with increased output power.

97
Figure 43: Spectral content of the IPG 1120 nm output at 50% and 90% of total output power indicating relative rise in 1178 nm light as the output power is increased. The 1178 nm light is due to the second-order
The characterization of the seed laser, pump laser and WDMs provided crucial
information in the experimental design. As an initial study, a co-propagating RFA was
constructed.
Co-Pumped Single-Stage RFA
A co-pumped single-stage RFA was initially built. The experimental setup is
presented in Figure 44. The coupled seed power at the input of the fiber (after the WDM)
was measured at 12.5 mW. The pump source was the 50 W IPG laser described above,
and the maximum coupled power from the 1120 nm pump laser was measured at
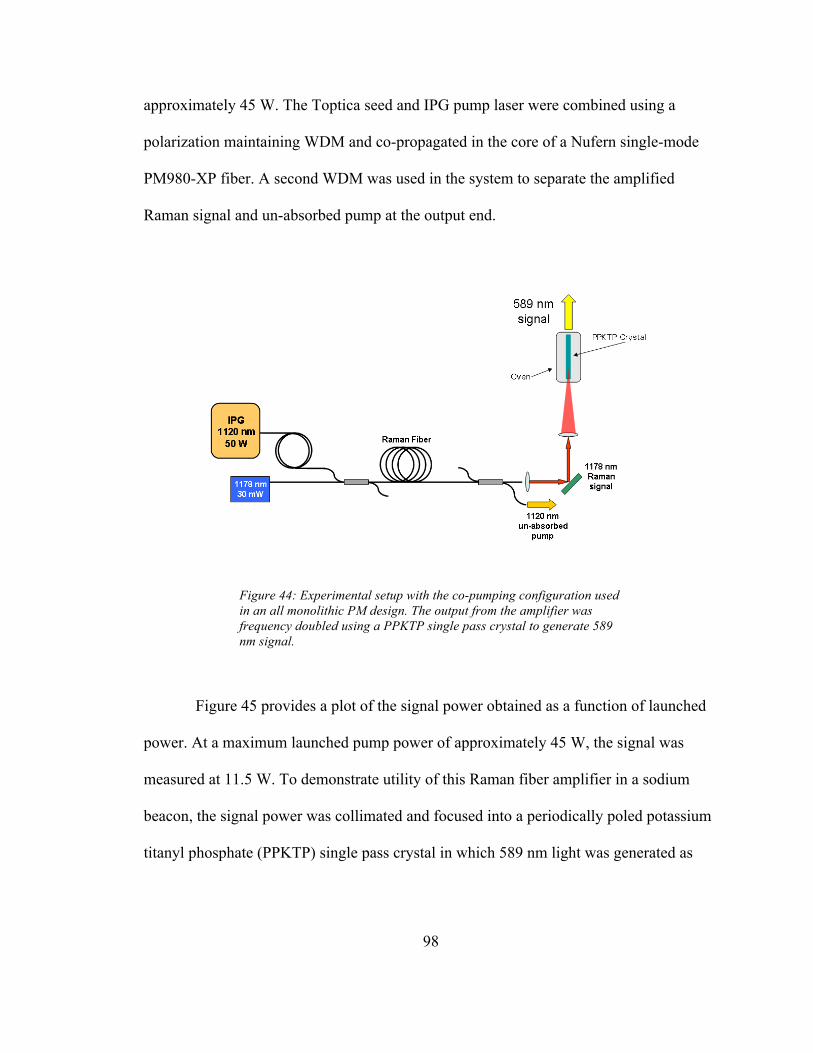
98
approximately 45 W. The Toptica seed and IPG pump laser were combined using a
polarization maintaining WDM and co-propagated in the core of a Nufern single-mode
PM980-XP fiber. A second WDM was used in the system to separate the amplified
Raman signal and un-absorbed pump at the output end.
Figure 44: Experimental setup with the co-pumping configuration used in an all monolithic PM design. The output from the amplifier was frequency doubled using a PPKTP single pass crystal to generate 589 nm signal.
Figure 45 provides a plot of the signal power obtained as a function of launched
power. At a maximum launched pump power of approximately 45 W, the signal was
measured at 11.5 W. To demonstrate utility of this Raman fiber amplifier in a sodium
beacon, the signal power was collimated and focused into a periodically poled potassium
titanyl phosphate (PPKTP) single pass crystal in which 589 nm light was generated as
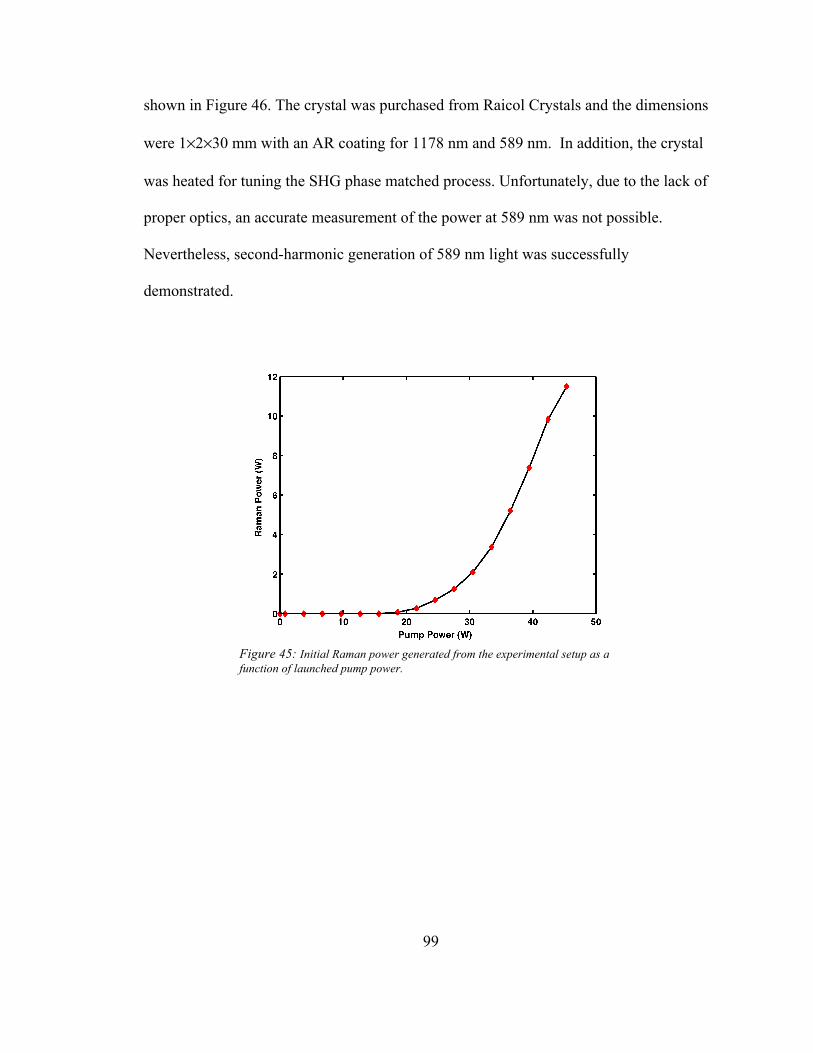
99
shown in Figure 46. The crystal was purchased from Raicol Crystals and the dimensions
were 1×2×30 mm with an AR coating for 1178 nm and 589 nm. In addition, the crystal
was heated for tuning the SHG phase matched process. Unfortunately, due to the lack of
proper optics, an accurate measurement of the power at 589 nm was not possible.
Nevertheless, second-harmonic generation of 589 nm light was successfully
demonstrated.
Figure 45: Initial Raman power generated from the experimental setup as a function of launched pump power.

100
Figure 46: Picture showing output light from a single pass PPKTP crystal to demonstrate frequency conversion to 589 nm signal.
Despite these initial results, measurements of the signal linewidth indicated
broadening; thus rendering the output unsuitable for frequency doubling in a resonant
cavity for guide star systems. More details of the spectral broadening in a co-pumped
RFA can be found in Chapter 4. Consequently, an alternative setup was considered to
suppress the linewidth broadening issue.
Counter-Pumped Single-Stage RFA
A counter-pumped configuration was used to address the linewidth broadening
noted above. In this experimental set-up (see Figure 47) the same seed laser was used.
The pump source was the 1120 nm IPG Raman fiber laser with a maximum output of
100 W. Both lasers were aligned to the slow axis of the fiber and a system of WDMs was
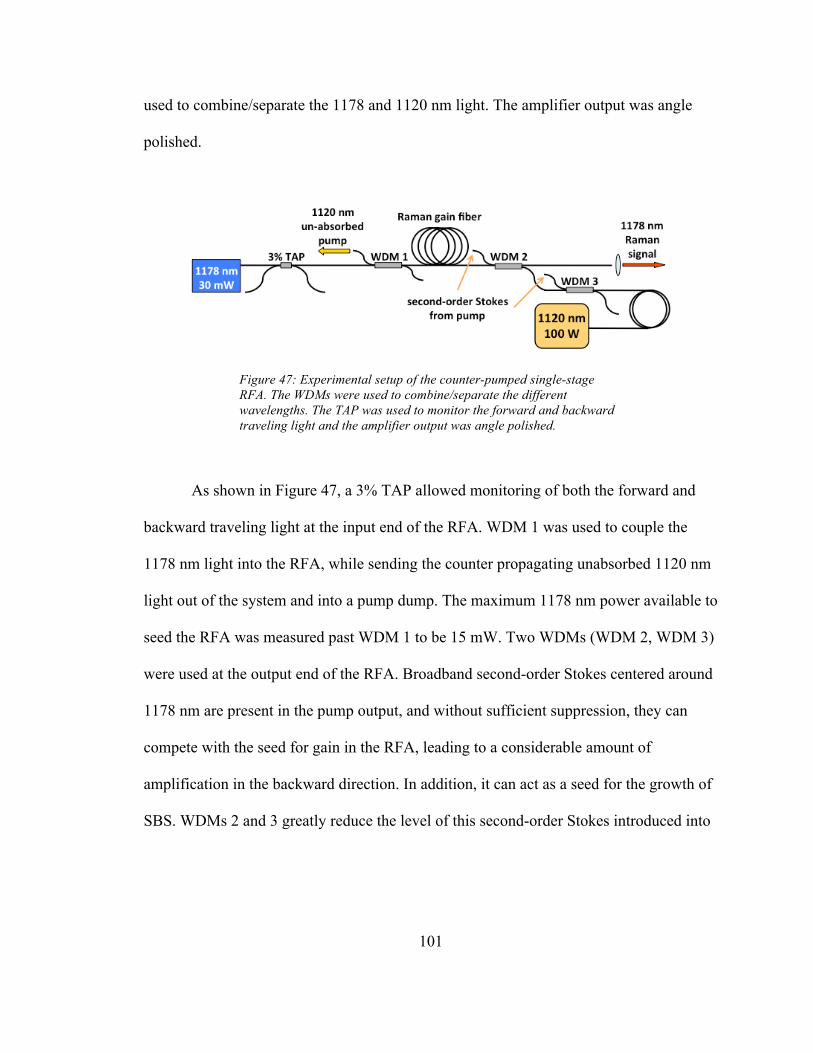
101
used to combine/separate the 1178 and 1120 nm light. The amplifier output was angle
polished.
Figure 47: Experimental setup of the counter-pumped single-stage RFA. The WDMs were used to combine/separate the different wavelengths. The TAP was used to monitor the forward and backward traveling light and the amplifier output was angle polished.
As shown in Figure 47, a 3% TAP allowed monitoring of both the forward and
backward traveling light at the input end of the RFA. WDM 1 was used to couple the
1178 nm light into the RFA, while sending the counter propagating unabsorbed 1120 nm
light out of the system and into a pump dump. The maximum 1178 nm power available to
seed the RFA was measured past WDM 1 to be 15 mW. Two WDMs (WDM 2, WDM 3)
were used at the output end of the RFA. Broadband second-order Stokes centered around
1178 nm are present in the pump output, and without sufficient suppression, they can
compete with the seed for gain in the RFA, leading to a considerable amount of
amplification in the backward direction. In addition, it can act as a seed for the growth of
SBS. WDMs 2 and 3 greatly reduce the level of this second-order Stokes introduced into
102
the RFA. The maximum pump power after WDM 2 was measured to be approximately
75 W.
The maximum power that can be obtained from a single-frequency RFA in the
vicinity of the SBS threshold depends on several factors. These factors include the
Brillouin and Raman gain coefficients of the fiber, the available pump and seed powers,
the length of fiber, and mitigation techniques used to suppress SBS. As previously
discussed, one technique to suppress SBS is to create different temperature zones along
the fiber as the Brillouin resonance frequency is temperature dependent [56].
We subjected three longitudinal segments of a 63 m long fiber to three different
temperatures (i.e. a two-step temperature profile). The temperature difference between
adjacent segments was ~40 °C. This allowed for sufficient separation among the Stokes
frequencies so that there was little overlap among the Brillouin gain bandwidths. Since
the signal rises rapidly at the output end of an RFA, the lengths were chosen such that the
longest segment was at the input end followed by the segment adjacent to it. The process
of optimizing the lengths of the fiber segments for maximum SBS suppression could
have been tedious. However, it was made easier by following the relationship described
in Eq. (2.34). We estimated for the PM980-XP fiber to be 6 × 10-14 m/W based on
our measurement of the signal output as a function of pump power. Using this estimate
and the equations provided above, we selected the ratio of lengths to be approximately
10:2:1. Further optimization was achieved by adjusting the ratio of the fiber lengths
slightly.
gR
103
Figure 48 provides plots of the 1178 nm Raman power and the backward power
as a function of launched pump power for the two-step temperature case. For comparison,
the corresponding plots when a uniform temperature was applied throughout the fiber
length are also shown in the figure. The SBS threshold definition is somewhat arbitrary
and in the literature there are multiple definitions [67]. Nevertheless, the SBS threshold is
characterized by a rapid increase in the backward power. In the comparison of thresholds
presented herein, we define the SBS threshold as occurring at the point corresponding to
minimal increase in the forward power (<5%) due to any further increase in the pump
power. This point corresponded in our experiments to a reflectivity of ~5%. For the two-
step temperature case, 10.1 W of 1178 nm was obtained at SBS threshold when pumped
with approximately 70 W of 1120 nm light. For the uniform temperature case, the pump
power was approximately 58 W, which provided an 1178 nm output of ~3.8 W at SBS
threshold.

104
Figure 48: 1178 nm signal and backward power vs. 1120 nm pump power for the Nufern PM980-XP fiber for the cases of a two-step and uniform temperature profiles. The application of thermal gradients led to 2.6x the output power of the uniform temperature case.
The application of a two-step temperature profile provided approximately 2.6
times more power, which is reasonably close to our calculated theoretical limit of 3 from
the model in Chapter 2. Still, additional power can be attained through further
optimization of the temperature separation and more precise selection of the lengths of
the fiber segments. Moreover, further power scaling can be achieved by applying
additional temperature steps. However, from a practical point of a view, a maximum of
four temperature regions is recommended as the temperature of the fiber used in the
experiments should not exceed 120 °C for long term reliability.
A Toptica FPI-100 Fabry-Perot Interferometer (FPI) captured the spectral
linewidth of the Stokes light for this case. The etalon is a piezoelectrically scanned
confocal Fabry-Perot Interferometer, with finesse >500 and a free spectral range of

105
1 GHz. The 2 MHz resolution of the FPI is sufficient to characterize the bandwidth of the
Brillouin gain spectrum. Due to SBS gain narrowing [52], the measured linewidth was
considerably smaller than the spontaneous Brillouin bandwidth measured using the
pump-probe experiment. Furthermore, as shown in Figure 49, the measured bandwidth of
the Stokes light decreased from 30.8 MHz to 26.2 MHz as the output power increased
from ~3 W to ~3.8 W.
Figure 49: Stokes light spectrum as captured by a Fabry-Perot interferometer for two different reflectivities. Due to gain narrowing, the bandwidth is much smaller than the spontaneous Brillouin gain bandwidth. The plot in green is the captured spectrum below SBS threshold at an output power of ~3 W, while that in blue was obtained at ~3.8 W.

106
We also examined the forward power with the FPI. The spectral linewidth of the
1178 nm signal was monitored from initial low power to the highest power at 10.1 W.
Unlike the co-pumped configuration, there were no indications of any spectral
broadening for the counter-pumped RFA. The spectrum of the signal is shown in
Figure 50.
Figure 50: Spectral linewidth of the 1178 nm light at 10 W output showing it to be within the resolution limit of the interferometer. No spectral broadening was observed for a counter-pumped RFA.
RFA Scalability with Pump Power
To further examine the power scalability of this amplifier, we conducted a set of
experiments to study the dependence of the output power on the pump power. Both the
Brillouin and Raman processes are nonlinear in nature and thus the scalability of single-
frequency RFAs in relation to pump power warrants some consideration. It was shown

107
theoretically that when the fiber length is optimized, the amplifier output scales linearly
with available pump power. Optimization of fiber length in this context refers to selecting
the fiber length, , such that all available pump power is utilized at SBS threshold.
Thus, for fiber lengths < , the output power will be pump limited and consequently
the signal power will be less than that obtained at . For fiber lengths
> , the output power is limited by SBS and is also less than that obtained by using a
fiber length of .
We conducted the study by starting with a fiber of length 80 m. The pump power
was then increased until the SBS threshold was encountered. Both pump and signal
powers were recorded at SBS threshold. We then performed a cutback experiment where
the same procedure was repeated for fiber lengths of 75 m, 70 m, 65 m, 60 m, and 55 m.
The entire study was conducted without the benefit of a thermal gradient. The simulations
and theoretical analysis presented above assumed a seed power that is much smaller than
the pump power, which is similar to the experiments since we were seeding with 15 mW
throughout the study. The results are shown in Figure 51 where the output signal
(1178 nm) power is normalized to the output signal power at a length of 55 m while the
pump (1120 nm) power is normalized to the corresponding pump power at 55 m. Also,
shown in the figure is the linear fit with a coefficient of determination, , of ~0.997. It
can therefore be inferred that the experimental results are in good agreement with the
theoretical prediction discussed in Chapter 2.
Loptm
Loptm
Loptm
Loptm
Loptm
R2

108
Figure 51: Normalized signal power vs. normalized pump power at SBS threshold for counter-pumped RFA. The fiber lengths used in the studies were varied from a length of 55 m to 80 m in increments of 5 m. The data indicates a linear dependence.
In summary to Chapter 3, it was shown above that power scaling a single-stage
RFA in a co-pumped configuration broadened the amplified signal linewidth, while the
counter-pumped scheme maintained single-frequency operation. In addition, a proof of
principle experiment successfully demonstrated a frequency doubled signal output that
generated 589 nm light. In the counter-pumped RFA, a two-step temperature gradient
was used to increase the output power to 10.1 W of single-frequency output. As shown in
the simulations presented in Chapter 2, an increase in output power can be achieved by
seeding at a higher power; thus providing a motivation for building a two-stage system.
Further power scaling can be achieved by utilizing a fiber with a lower Brillouin gain

109
such as an acoustically tailored fiber. The experimental implementation of a two-stage
RFA utilizing an acoustically tailored fiber is discussed in Chapter 4.

110
Chapter 4
Acoustically Tailored Fiber and Two-Stage RFA
Acoustically Tailored Fiber Design
In addition to investigating the scalability of a COTS fiber, this research explored
the scalability of a RFA that utilized an acoustically tailored fiber. As discussed in
Chapter 2, the Brillouin gain can be manipulated through the creation of different regions
within the core with different acoustic velocities. This can be accomplished through the
application of thermal gradients, which was demonstrated to be an effective technique in
Chapter 3, or through the application of stress gradients that was demonstrated in the
work described in Ref. [45]. Both of these techniques introduce longitudinal acoustic
gradients. Alternatively, transverse gradients can be introduced through the
manipulations of the dopant concentrations within the fiber core along the transverse
direction.
As provided earlier, the Brillouin shift is given by ΩB = 4πnυA λ( ) . Both the
optical index of refraction and the acoustic velocity can be adjusted through the variation
of dopants. However, practical implementation allows only for the variation of the latter.
Changes in the optical index are undesirable, as that would change the guiding properties
of the fiber.
In addition to the acoustic tailoring to suppress SBS, the fiber was designed for
enhanced Raman gain. It is worthwhile to note that the increased Raman gain contributes

111
to the power scaling of a single-frequency output by allowing for shorter fibers and thus
higher SBS thresholds.
The absolute dopant concentrations of this fiber design are proprietary. However,
to gain an appreciation of the effect of different dopants, one can begin with the Raman
gain. It is known that Raman gain increases with germanium concentration [68], and as
such the fiber preform which was fabricated using modified chemical vapor deposition
(MCVD), had an elevated level of Ge. The intrinsic Raman gain of GeO2 doped glass
follows a linear relationship with germania concentration [69] [70] [71]:
( ) ( )2 20 0 21r GeO GeO rg x C x g SiO⎡ ⎤′= + ⋅ ⋅⎣ ⎦ (4.1)
where C′ is a linear interpolation factor between SiO2 and GeO2 ,.and 2GeOx represents
the concentration of germania.
By varying the concentrations of fluorine and aluminum in the preform core, a
non-uniform acoustic index of refraction can be achieved along the transverse direction.
This has the effect of mitigating SBS as it reduces the acousto-optical interaction
responsible for this process. Aluminum increases the optical index and decreases the
acoustic index, while fluorine has the reverse effect. Fluorine has a larger effect on the
acoustic velocity, leading to an estimated decrease of 214 m/s/wt.%. The optical index is
much less sensitive to the dopant concentrations than the acoustic index; making
implementation of this approach (of varying the acoustic velocity while maintaining the

112
optical index homogeneity) practical. Table 1 shows the effect of different dopants on the
acoustic and optical indices of silica glass.
Refractive Index GeO2 P2O5 TiO2 B2O3 F2 Al2O3
Optical ↑ ↑ ↑ ↓ ↓ ↑
Acoustic ↑ ↑ ↑ ↑ ↑ ↓
Table 1: Common fused silica fiber dopants and the qualitative effect on the acoustic and optical indices of refraction
The design called for the generation of three distinct Brillouin gain peaks
corresponding to three concentric regions of the core with different acoustic indices. The
target dimensions of these regions where chosen such that they provided equal nonlinear
effective areas. The acoustic indices in the three regions were separated such that further
SBS mitigation through thermal gradients could be accommodated. The dopant
concentrations and exact target dimensions are proprietary but Figure 52 provides a
notional representation of this design.

113
Figure 52: Notional design of SBS mitigating fiber showing the radial profiles of the acoustic velocity and optical index of refraction.
In the figure, the orange line shows that the optical index does not vary within the
core, however there must be a step index change at the core clad interface to maintain the
guiding properties of the fiber. An SBS suppression factor of three could be obtained if
the nonlinear effective areas of these regions were approximately equal. In order to
accommodate step thermal gradients along the fiber, the target design called for an
acoustic step index difference between adjacent regions of ∼0.015. Consequently, both
the manipulation of dopants and the application of thermal gradients could be used in
tandem to increase the SBS threshold [72]. After the preform was fabricated, it was
drawn into a fiber with nominal core and cladding diameters of approximately 6 µm and
125 µm, respectively, which are similar to the corresponding dimensions of the
PM980-XP.

114
Brillouin Gain Spectrum Measurements of Acoustically Tailored Fiber
The Brillouin gain spectrum (BGS) of the acoustically tailored fiber was
investigated at 1064 nm using a slightly modified pump probe technique. The
experimental setup is shown in Figure 53. In the previous BGS setup, the fiber was free-
space coupled, whereas this setup provided a simple means to splice the fiber under test
directly into the setup to remove the requirement of coupling optics. As such, the output
of the amplifier was spliced onto the input end of the fiber-optic circulator (FOC), which
was subsequently spliced onto the acoustically tailored fiber. The FOC allowed the
amplified pump signal to pass while separating the counter-propagating Stokes light to be
measured at photodiode 2 (PD 2). Fused fiber tap coupler/splitters (TAP 1 and TAP 2)
were used to separate 1% of the signals to be later combined with a 50⁄50 coupler.
Photodiode 1 (PD 1) was used with the RF spectrum analyzer (RFSA) to measure the
beat note of the two signals.
Figure 53: Experimental setup of pump probe experiment. The pump power was amplified up to 1 W by using an amplifier (Amp).
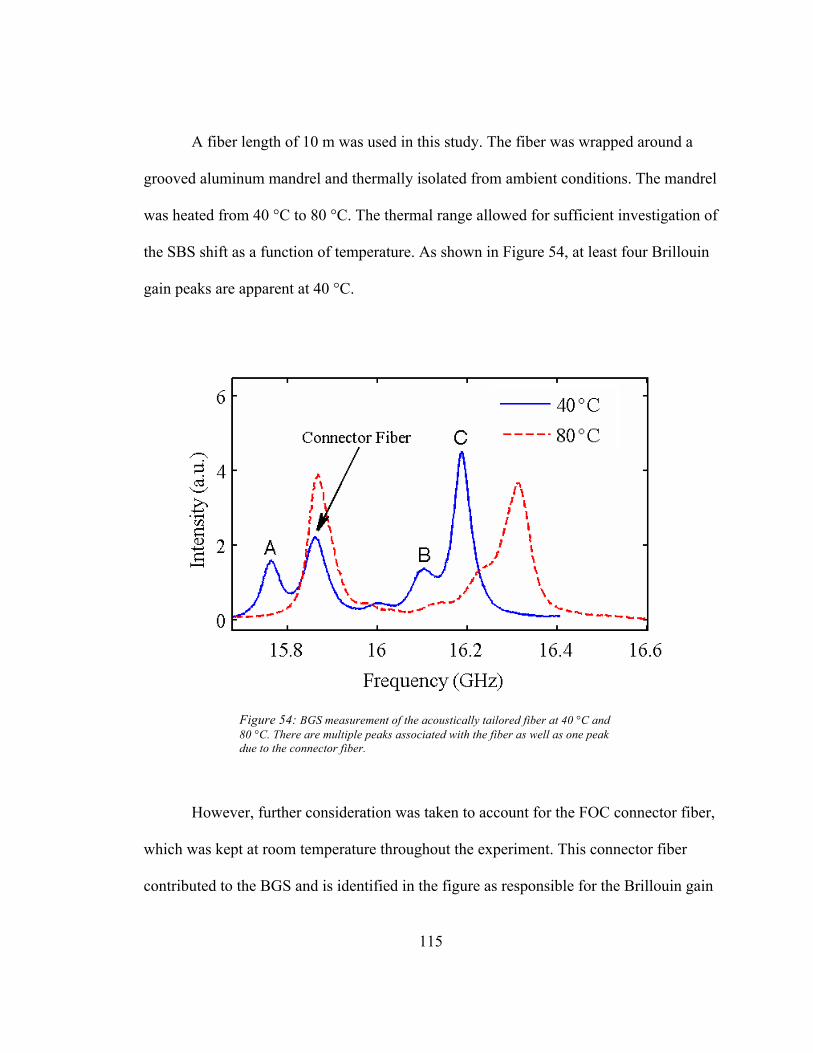
115
A fiber length of 10 m was used in this study. The fiber was wrapped around a
grooved aluminum mandrel and thermally isolated from ambient conditions. The mandrel
was heated from 40 °C to 80 °C. The thermal range allowed for sufficient investigation of
the SBS shift as a function of temperature. As shown in Figure 54, at least four Brillouin
gain peaks are apparent at 40 °C.
Figure 54: BGS measurement of the acoustically tailored fiber at 40 °C and 80 °C. There are multiple peaks associated with the fiber as well as one peak due to the connector fiber.
However, further consideration was taken to account for the FOC connector fiber,
which was kept at room temperature throughout the experiment. This connector fiber
contributed to the BGS and is identified in the figure as responsible for the Brillouin gain

116
peak occurring at approximately 15.9 GHz. This can be confirmed by examining the BGS
at 80 °C. Peaks A, B, and C are due to the acoustically tailored fiber and shift to the right
due to the elevated mandrel temperature. Yet the peak identified with the connector fiber
remains at the same Brillouin shift position. The increase in the relative height of the
connector fiber peak for the measurements conducted at 80 °C is attributed to the shift of
peak A into it. A separate pump probe experiment conducted at room temperature that
used the same type of connector fiber throughout the setup further confirmed these
conclusions.
As stated above, peaks A, B, and C correspond to the acoustically tailored fiber.
Ideally, it is desired that these peaks be of equal height and sufficiently separated in
frequency space to accommodate temperature gradients for further SBS suppression.
However, due to the small size of the core (∼6 µm diameter), this ideal design was not
achieved. Furthermore, at the elevated temperature, peak B, which is in close proximity
to peak C, is washed out, leading to a broadened single peak. The Brillouin frequency as
a function of temperature depends on the dopant concentrations, which may offer an
explanation for the observation [73]. In spite of all of this, the pump probe experiment
indicated that the acoustically tailored fiber possessed SBS suppressing characteristics.
This was further validated by building a single-frequency RFA and comparing the results
to those obtained using a non-acoustically tailored fiber of similar dimensions drawn by
the same fiber manufacturer.
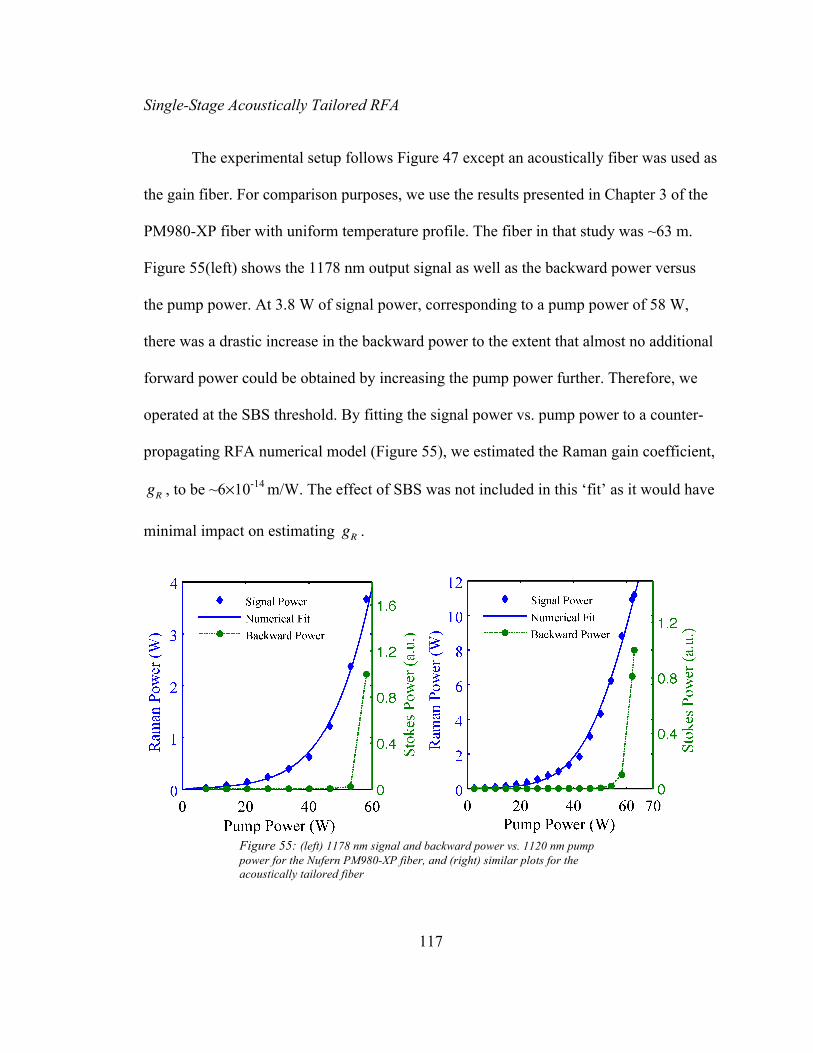
117
Single-Stage Acoustically Tailored RFA
The experimental setup follows Figure 47 except an acoustically fiber was used as
the gain fiber. For comparison purposes, we use the results presented in Chapter 3 of the
PM980-XP fiber with uniform temperature profile. The fiber in that study was ~63 m.
Figure 55(left) shows the 1178 nm output signal as well as the backward power versus
the pump power. At 3.8 W of signal power, corresponding to a pump power of 58 W,
there was a drastic increase in the backward power to the extent that almost no additional
forward power could be obtained by increasing the pump power further. Therefore, we
operated at the SBS threshold. By fitting the signal power vs. pump power to a counter-
propagating RFA numerical model (Figure 55), we estimated the Raman gain coefficient,
, to be ~6×10-14 m/W. The effect of SBS was not included in this ‘fit’ as it would have
minimal impact on estimating .
Figure 55: (left) 1178 nm signal and backward power vs. 1120 nm pump power for the Nufern PM980-XP fiber, and (right) similar plots for the acoustically tailored fiber
gR
gR
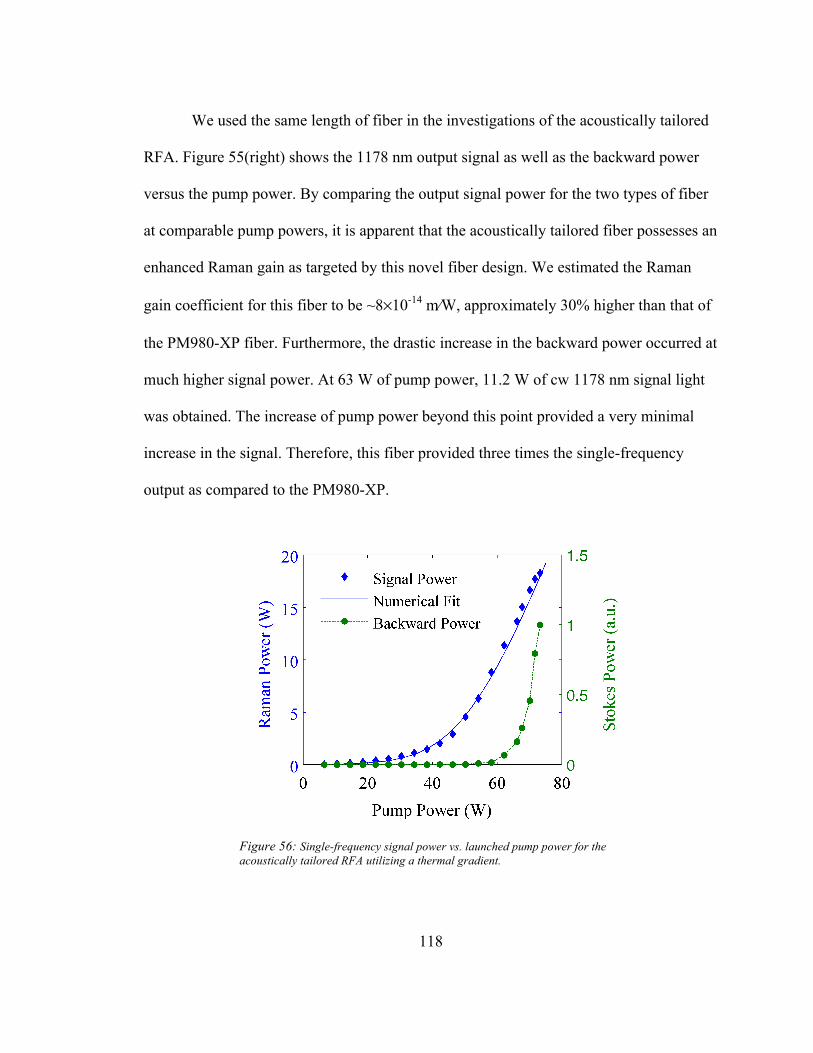
118
We used the same length of fiber in the investigations of the acoustically tailored
RFA. Figure 55(right) shows the 1178 nm output signal as well as the backward power
versus the pump power. By comparing the output signal power for the two types of fiber
at comparable pump powers, it is apparent that the acoustically tailored fiber possesses an
enhanced Raman gain as targeted by this novel fiber design. We estimated the Raman
gain coefficient for this fiber to be ~8×10-14 m⁄W, approximately 30% higher than that of
the PM980-XP fiber. Furthermore, the drastic increase in the backward power occurred at
much higher signal power. At 63 W of pump power, 11.2 W of cw 1178 nm signal light
was obtained. The increase of pump power beyond this point provided a very minimal
increase in the signal. Therefore, this fiber provided three times the single-frequency
output as compared to the PM980-XP.
Figure 56: Single-frequency signal power vs. launched pump power for the acoustically tailored RFA utilizing a thermal gradient.

119
For each RFA, decreasing the fiber length can reduce the effective SBS gain. This
would allow for an increased pump power at SBS threshold. The overall effect of
decreasing the fiber length and increasing the pump power allows for further power
scaling as discussed in Chapter 2. At SBS threshold, the output signal scales linearly with
pump power. Based on this, we projected the maximum achievable power at 75 W of
pump power to be 4.9 W and 13.3 W for the PM980-XP fiber and the acoustically
tailored fiber, respectively. Alternatively, to push the limits of the power scaling, we kept
the length of the acoustically tailored RFA the same and applied a temperature step
increase of at least 45 °C to the segment of the fiber lying at the output end of the
1178 nm signal. As discussed in Chapter 2, due to the fast rise of the signal at the output
end, effective SBS suppression was achieved when the length of the fiber segment at the
input end was chosen to be considerably longer (∼6×) than that at the output end. As
shown in Figure 56, the power output was 18.3 W, which was obtained at the maximum
available pump power of 75 W.
A measurement of the amplifier output beam quality was accomplished using a
Spiricon M2–200s instrument. Since the acoustically tailored fiber is a specialty fiber,
confirmation of beam quality is important for efficient second harmonic generation into
near diffraction-limited 589 nm light for sodium guide star applications. The output of the
amplifier was sampled using a 4% uncoated glass wedge and two aluminum mirrors for
beam alignment into the M2 instrument. The beam quality was measured to be near the
diffraction limit with a beam waist of 7 µm, which was similar to that of the PM980-XP
fiber. The beam profile is shown in Figure 57(left).
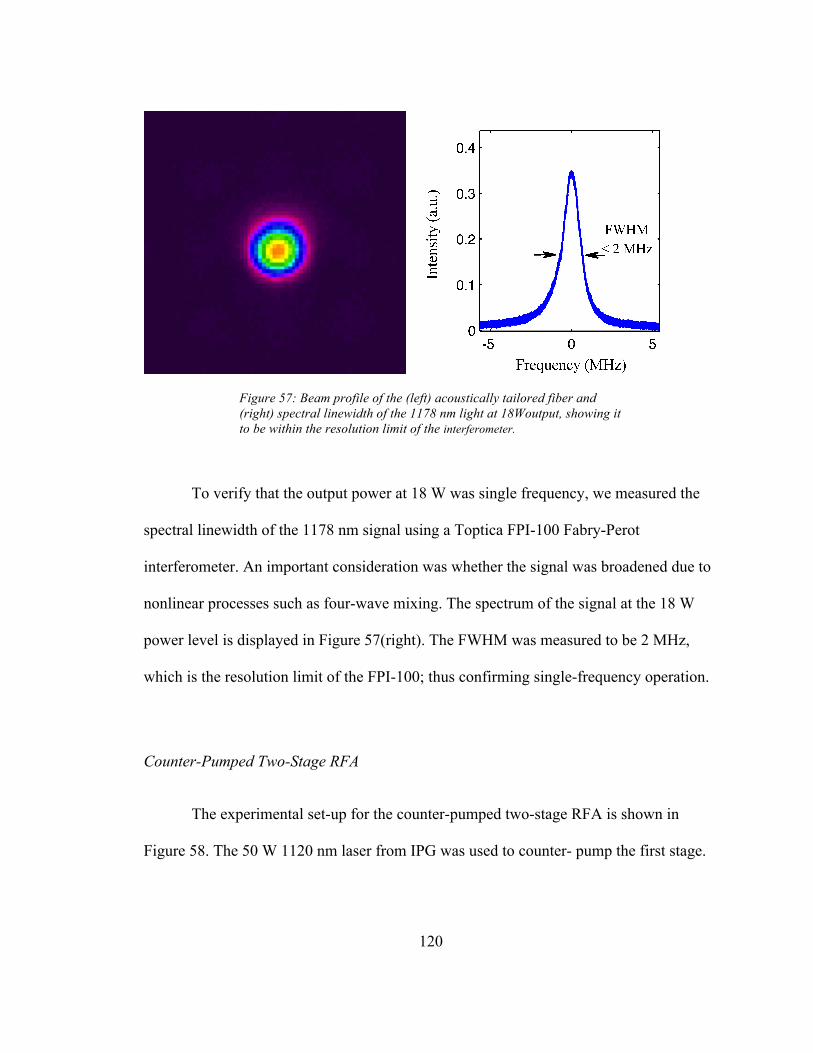
120
Figure 57: Beam profile of the (left) acoustically tailored fiber and (right) spectral linewidth of the 1178 nm light at 18Woutput, showing it to be within the resolution limit of the interferometer.
To verify that the output power at 18 W was single frequency, we measured the
spectral linewidth of the 1178 nm signal using a Toptica FPI-100 Fabry-Perot
interferometer. An important consideration was whether the signal was broadened due to
nonlinear processes such as four-wave mixing. The spectrum of the signal at the 18 W
power level is displayed in Figure 57(right). The FWHM was measured to be 2 MHz,
which is the resolution limit of the FPI-100; thus confirming single-frequency operation.
Counter-Pumped Two-Stage RFA
The experimental set-up for the counter-pumped two-stage RFA is shown in
Figure 58. The 50 W 1120 nm laser from IPG was used to counter- pump the first stage.
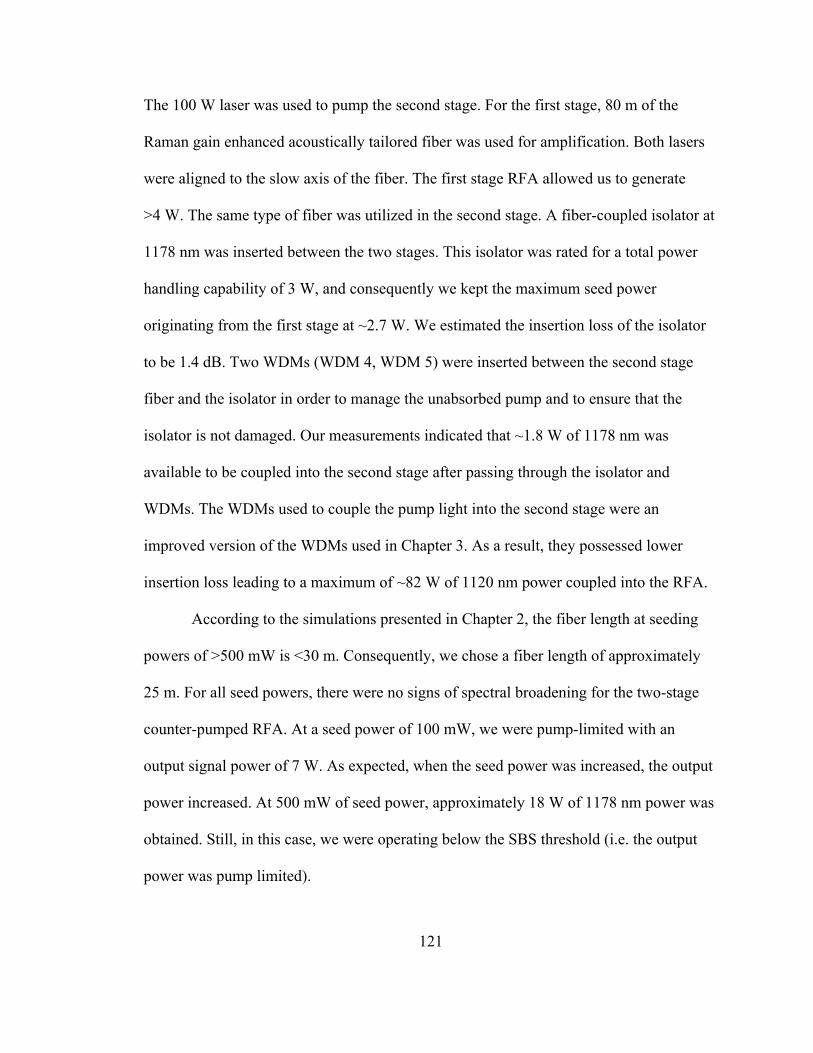
121
The 100 W laser was used to pump the second stage. For the first stage, 80 m of the
Raman gain enhanced acoustically tailored fiber was used for amplification. Both lasers
were aligned to the slow axis of the fiber. The first stage RFA allowed us to generate
>4 W. The same type of fiber was utilized in the second stage. A fiber-coupled isolator at
1178 nm was inserted between the two stages. This isolator was rated for a total power
handling capability of 3 W, and consequently we kept the maximum seed power
originating from the first stage at ~2.7 W. We estimated the insertion loss of the isolator
to be 1.4 dB. Two WDMs (WDM 4, WDM 5) were inserted between the second stage
fiber and the isolator in order to manage the unabsorbed pump and to ensure that the
isolator is not damaged. Our measurements indicated that ~1.8 W of 1178 nm was
available to be coupled into the second stage after passing through the isolator and
WDMs. The WDMs used to couple the pump light into the second stage were an
improved version of the WDMs used in Chapter 3. As a result, they possessed lower
insertion loss leading to a maximum of ~82 W of 1120 nm power coupled into the RFA.
According to the simulations presented in Chapter 2, the fiber length at seeding
powers of >500 mW is <30 m. Consequently, we chose a fiber length of approximately
25 m. For all seed powers, there were no signs of spectral broadening for the two-stage
counter-pumped RFA. At a seed power of 100 mW, we were pump-limited with an
output signal power of 7 W. As expected, when the seed power was increased, the output
power increased. At 500 mW of seed power, approximately 18 W of 1178 nm power was
obtained. Still, in this case, we were operating below the SBS threshold (i.e. the output
power was pump limited).

122
Figure 58: Experimental setup of two-stage counter-pumped RFA. The first stage and second stage are comprised of acoustically tailored fiber. A 3 W isolator (ISO) is inserted between the amplifier stages to protect against backward travelling light.
We found that the output power was near maximum when the second stage
amplifier was seeded with 900 mW; which was slightly higher seed power than what the
simulations indicate for a fiber of length 25 m. At this seed power, we operated at SBS
threshold while utilizing a little less than the maximum available pump power. The
measured 1178 nm output power was 22.2 W. This output power was also slightly higher
than what was obtained from the simulations, but well within margins of experimental
error and estimates of the Brillouin and Raman gain coefficients. Increasing the seed
power beyond this point actually led to a decrease in the output power as the SBS
threshold was encountered at lower pump powers. At a seed power of 1200 mW, the

123
output power was 18.5 W and was SBS limited. The plots for signal power vs. pump
power for the different seed levels discussed above are shown in Figure 59.
Further power scaling can be achieved by reducing the length of the second-stage
amplifier to an optimal value. This optimal length would provide for utilization of the
maximum available seed power (~1.8 W) at the maximum available pump power. The
simulations presented previously in Figure 30 indicate at this seed power, we would gain
a small enhancement of ~2 W over the 22.2 W obtained in the experiment. The 22.2 W
output power represents approximately a 2x improvement over the 11.2 W power
obtained from a single-stage acoustically tailored RFA. Both results were obtained
without the benefit of the thermal gradient. As shown above, the power for the single-
stage amplifier was increased to 18.3 W by the application of a one-step thermal gradient.

124
Figure 59: 1178 nm output power vs. 1120 nm pump power for several seed powers. The length of the RFA was ~25 m. For seed powers of 100 mW and 500 mW, the output is pump limited; however, the output for 900 mW and 1200 mW was SBS limited.
Co-Pumped Two-Stage RFA
As discussed in Chapter 3, the co-pumped single-stage RFA was ill suited for
providing a single-frequency output. It is worthwhile investigating if this problem persists
when the seed power is increased. Towards this end, we built a two-stage experimental
set-up for the co-pumped RFA (see Figure 60). The first stage is identical to the counter-
pumped configuration. However, the second stage is co-pumped with the 100 W 1120 nm
laser. Two WDMs (WDM 4, WDM 5) were inserted after the pump to reduce the
1178 nm noise introduced by the pump as shown in Figure 43. Similar to the counter-
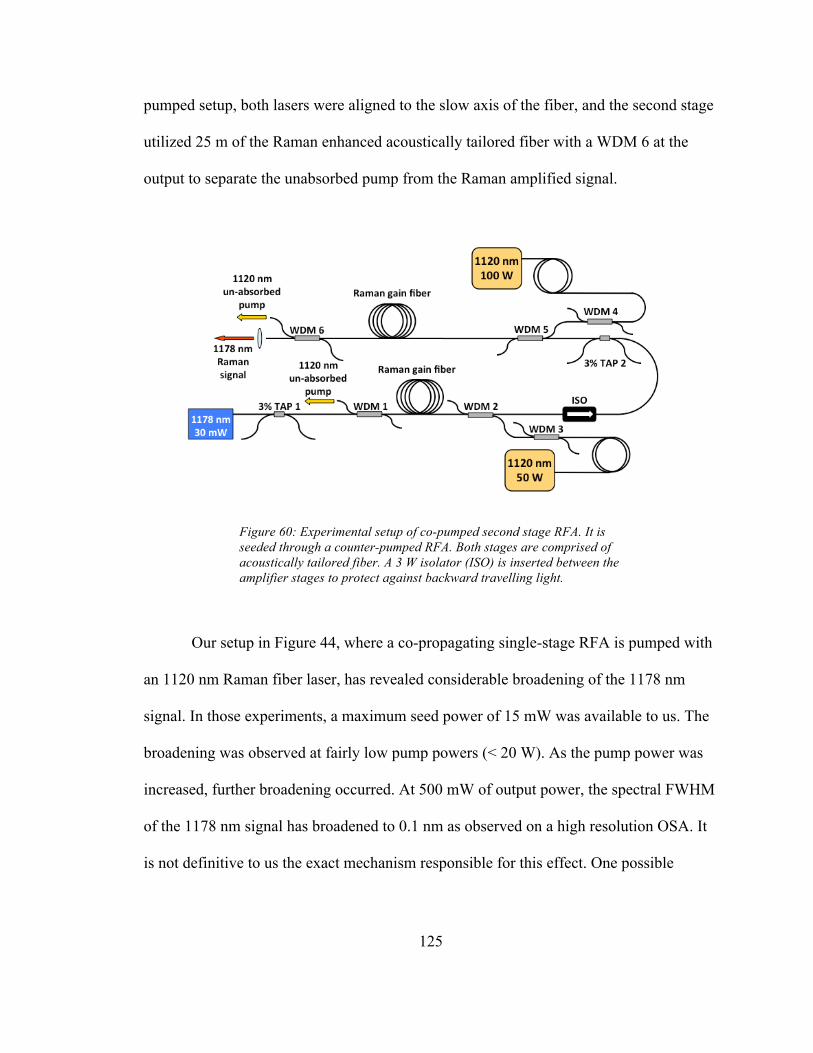
125
pumped setup, both lasers were aligned to the slow axis of the fiber, and the second stage
utilized 25 m of the Raman enhanced acoustically tailored fiber with a WDM 6 at the
output to separate the unabsorbed pump from the Raman amplified signal.
Figure 60: Experimental setup of co-pumped second stage RFA. It is seeded through a counter-pumped RFA. Both stages are comprised of acoustically tailored fiber. A 3 W isolator (ISO) is inserted between the amplifier stages to protect against backward travelling light.
Our setup in Figure 44, where a co-propagating single-stage RFA is pumped with
an 1120 nm Raman fiber laser, has revealed considerable broadening of the 1178 nm
signal. In those experiments, a maximum seed power of 15 mW was available to us. The
broadening was observed at fairly low pump powers (< 20 W). As the pump power was
increased, further broadening occurred. At 500 mW of output power, the spectral FWHM
of the 1178 nm signal has broadened to 0.1 nm as observed on a high resolution OSA. It
is not definitive to us the exact mechanism responsible for this effect. One possible

126
source for this effect is the broadband 1178 nm noise introduced by the 1120 nm pump.
The characterization of the spectral content of the pump, which is presented above,
revealed parasitic lasing in the proximity of 1178 nm due to second-order Stokes process
(see Figure 43). This broadband noise can potentially interact through four-wave mixing
(FWM) with the amplified 1178 nm seed signal; leading to further spectral broadening.
Even in a counter-pumped configuration, this parasitic noise is undesirable as it can
potentially seed the SBS process. Exploring this point further in a co-pumped RFA, we
investigated the spectral content of the signal using higher seed powers and shorter fiber
lengths to suppress the spectral broadening.
A shorter fiber may lead to a reduction in FWM. However, our studies revealed
that spectral broadening still occurred. Figure 61 shows the results for a case in which the
second stage RFA was seeded with 360 mW. The various spectra correspond to different
output powers at 1178 nm and clearly indicate spectral broadening with increased pump
power. Based on the secondary spectral peaks, one may infer a FWM process is occurring
in the RFA. Further increase in the seed power had a marginal effect on mitigating the
spectral broadening; in all cases the FWHM approached 0.1 nm when the signal output
was of the order of a few watts. Therefore, at least for our experiments, this rendered co-
pumping as unsuitable for generating 1178 nm for a guide star application.

127
Figure 61: Spectral content near 1178 nm as captured on a high-resolution optical spectrum analyzer indicating spectral broadening as the pump power was increased in a co-pumped second stage RFA.
To conclude this topic, further investigations of the spectral broadening in a co-
pumped RFA are warranted. While FWM has been investigated extensively in Raman
fiber lasers [53], to the best of our knowledge limited information has been reported
when considering RFAs seeded with single-frequency sources. Finally, there are several
techniques that can potentially alleviate the problem of introducing into the system
unwanted 1178 nm light from the pump end. These techniques include the use of various
fiber designs to filter out the unwanted light or the use of Yb-doped 1120 nm fiber lasers
as pump sources.

128
Two-line RFA via Phase Modulation
In Chapter 2, we theoretically investigated the feasibly of generating a two-line
RFA within a single fiber using two seeds; however, FWM effects proved this concept a
challenge. Alternatively, a phase modulator could be used to generate the required
wavelengths of interest.
In terms of guide star systems, improved performance has been demonstrated by
simultaneously illuminating the two sodium lines, D2a and D2b. These lines are the result
of the 1.772 GHz hyperfine splitting of the 3S1/2 ground state of sodium. Consequently,
we investigated the possibility of generating the D2a and D2b lines via phase modulation of
the Raman amplifier. Through theoretical and experimental studies, we explored SBS in
optical fibers seeded with phase-modulated light [74]. Here, by phase modulating the
1178 nm RFA at the appropriate frequency and modulation depth, we can obtain two-line
performance.
As a preliminary demonstration, we used the counter-pumped two-stage amplifier
(see Figure 58). A phase modulator was placed before the second stage in between
WDM2 and the isolator. Due to the power handling capability of the modulator, we
seeded with 60 mW of power. Theoretical analysis suggests that the ratio of the power at
the D2a line should be approximately 10 times that of the D2b line [75]. Since the second
harmonic power is proportional to the square of the fundamental wavelength power, the
output power of the two signals in the 1178 nm Raman amplifier should be
approximately 3:1. The desired power ratio and separation between the two lines at

129
589 nm (1.772 GHz) can be attained through sinusoidal phase modulation at a frequency
of 886 MHz and modulation depth of 1 in the RFA. Notably, a sinusoidal modulation
depth of 1 generates a carrier to first harmonic sideband ratio of approximately 3:1, with
negligible higher order harmonics (<1%). A plot of the phase modulated 1178 nm output
signal at ~5.2 W is shown in Figure 62. The spectral lines exhibit the desired 886 MHz
separation with approximate 3:1 ratio and no spectral broadening or FWM observed. We
note here that sinusoidal phase modulation produces double sidebands at +/- the
modulation frequency as shown by the three lines in Figure 62. However, direct two-line
modulation can be obtained through a single sideband (SSB) modulator or frequency
shifter, which suppresses the double sideband [76]. Although at the time of this
experiment we were limited to double sideband modulators, electro-optic SSB modulators
are commercially available. After generating the two lines in the RFA, one can efficiently
generate the D2a and D2b lines in a SHG cavity by designing it to have a length such that its
free spectral length corresponds to the separation between the two lines.

130
Figure 62: Amplified signal at ~5.2 W of 1178 nm output demonstrating generation of multiple spectral lines through phase modulation. The separation between adjacent sidebands is 886 MHz, which corresponds after frequency doubling to the separation between the D2a and D2b energy levels for sodium (Na).
In summary, we have utilized an acoustically tailored single-stage RFA to
demonstrate 11.2 W of single-frequency output, which was increased to 18.3 W through
the application of a thermal gradient. Both co-pumped and counter-pumped
configurations were considered in a two-stage RFA system. For the former, spectral
broadening was observed; rendering the output unsuitable for frequency doubling in a
resonant SHG cavity. No spectral broadening was observed for the latter configuration,
which provided as much as 22.2 W of single-frequency output.

131
Chapter 5
Conclusion
Summary of Results
A detailed core-pumped single-frequency Raman amplifier model was developed
and used to study the scalability of generating 1178 nm for use in 589 nm sodium guide
star applications through frequency doubling. The model entails the numerical solution of
a system of nonlinear differential equations with boundary conditions imposed on the
input and output ends of the RFA. The SBS process is initiated from distributed
spontaneous Brillouin and Raman processes. The model allowed for the investigation of
the trade space involving pump and seed powers, pumping configurations, fiber length
and area as well as implementation of SBS mitigation through longitudinal manipulation
of the acoustic velocity. For the simulations, thermal gradients were considered to create
the longitudinally varying acoustic velocity, although the model is also applicable to
stress gradients. It was shown for the uniform temperature profile and the multi-step
temperature profile that when the fiber length is optimized, the amplifier output scales
linearly with available pump power. In order to mitigate the SBS process for further
power scaling, an optimized multi-step temperature distribution was utilized. Finally, in
the model, the feasibility of generating a two-line Raman amplifier system for use in a
sodium guide star beacon from a single Raman amplifier by examining four-wave mixing
(FWM) was considered.

132
An investigation of core-pumped single-stage and two-stage polarization
maintaining Raman fiber amplifiers was conducted. Both co-pumped and counter-
pumped configurations were considered. For the former, spectral broadening was
observed thus rendering the output unsuitable for frequency doubling in a resonant SHG
cavity. No spectral broadening was observed for the latter configuration. For a counter-
pumped single-stage Raman fiber amplifier, COTS fiber was used to generate ~10 W
through the use of externally applied temperature steps to suppress SBS. In addition, a
fiber cutback experiment revealed a linear dependence at SBS threshold on pump power
in accordance with the theoretical predictions in Chapter 2.
Utilizing a specialty fiber, a demonstration of a single-stage PM RFA with an
18.3 W output power and a linewidth ≤ 2 MHz was achieved. For the 15 mW seed power
used in these experiments, this represented a net amplifier gain exceeding 30 dB. The
power scaling was achieved by employing an acoustically tailored single-mode fiber with
enhanced Raman gain. Numerical simulations using the single-frequency Raman fiber
amplifier model (Chapter 2) indicate further power scaling can be achieved by
constructing a pre-amplifier stage capable of generating seed power at the 1W level.
Thus, further power scaling to 22.2 W was achieved by using acoustically tailored fiber
in a two-stage RFA system (Chapter 4). Finally, preliminary results were shown on
generating multiple spectral lines in the RFA through phase modulation in order to
explore the feasibility of generating (after frequency doubling) the sodium D2a and D2b
lines [77].

133
Suggested Future Work
Certainly the linewidth broadening in the co-pumped configuration warrants
further investigation. Optimized application of thermal gradients in a two-stage
acoustically tailored amplifier with increased pump power can lead to further power
scaling. The acoustically tailored fiber has room for improvement in design and
fabrication. If successful, this approach could remove the reliability concerns and
difficulty of implementation with the application of many stress steps. It is worthwhile to
extend this work to other wavelengths to provide compact pump sources for nonlinear
cavities leading to multi-watt tunable outputs in the 575–725 nm region.

134
References
[1] E. Snitzer, “Proposed Fiber Cavities for Optical Masers,” J. Appl. Phys., vol. 32, no.
1, pp. 36-39, 1961.
[2] K. C. Kao and G. A. Hockham, "Dielectric-fibre surface waveguides for optical
frequencies," Proceedings of the Institution of Electrical Engineers, vol. 113, no. 7,
pp. 1151-1158, 1966.
[3] F. P. Kapron, D. B. Keck and R. D. Maurer, "Radiation losses in glass optical
waveguides," Applied Physics Letters, vol. 17, pp. 423-425, 1970.
[4] H. Kanamori, H. Yokota, G. Tanaka, M. Watanabe, Y. Ishiguro, I. Yoshida, T.
Kakii, S. Itoh, Y. Asano and S. Tanaka, "Transmission characteristics and reliability
of pure silica-core single mode fibers," IEEE Journal of Lightwave Technologies,
vol. 4, pp. 1144-1150, 1986.
[5] J. Hegarty, M. M. Broer, B. Golding, J. R. Simpson and J. B. MacChesney, "Photon
Echoes below 1 K in a Nd3+ Doped Glass Fiber," Physical Review Letters, vol. 51,
no. 22, p. 2033, 1983.
[6] R. J. Mears, L. Reekie, I. M. Jauncey and D. N. Payne, "Low-noise erbium-doped
fibre amplifier operating at 1.54 um," Electronics Letters, vol. 23, no. 19, pp. 1026-
1028, 1987.
[7] E. Desurvire, J. R. Simpson and P. C. Becker, "High-gain erbium-doped travelling-

135
wave fiber amplifer," Optics Letters, vol. 12, no. 11, pp. 888-890, 1987.
[8] M. Nakazawa, Y. Kimura and K. Suzuki, "Efficient Er3+-‐doped optical fiber
amplifier pumped by a 1.48 µm InGaAsP laser diode," Applied Physics Letters, vol.
54, p. 295, 1989.
[9] G. Overton, A. Nogee, D. Belforte and C. Holton, "Laser Marketplace 2013: Laser
markets rise above global headwinds," Laser Focus World, 2013.
[10] E. Snitzer, H. Po, F. Hakimi, R. Tumminelli and B. C. McCollum, "Double clad,
offset core Nd fiber laser," in Optical Sensors Conference, 1988.
[11] D. J. Richardson, J. Nilsson and W. A. Clarkson, “High power fiber lasers: current
status and future perspectives,” J. Opt. Soc. Am. B, vol. 27, no. 11, pp. B63-B92,
2010.
[12] P. Myslinski, D. Nguyen and J. Chrostowski, "Effects of concentration on the
performance of erbium-doped fiber amplifiers," Journal of Lightwave Technology,
vol. 15, no. 1, pp. 112-120, 1997.
[13] C. B. Olausson, A. Shirakawa, H. Maruyama, K.-i. Ueda and J. K. Lyngso, "High
power ytterbium fiber lasers at extremely long wavelengths by photonic bandgap
fiber technology," Optical Fiber Technology, vol. 16, pp. 449-457, 2010.
[14] T. Ehrenreich, R. Leveille, I. Majid, K. Tankala, G. Rines and P. Moulton, "1-kW,
all-glass Tm:fiber laser," in Proceedings of SPIE, 2010.
[15] E. Stiles, "New developments in IPG fiber laser technology," in 5th International
136
Workshop on Fiber Lasers, 2009.
[16] O. H. Heckl, C. E. Baer, C. Kränkel, S. V. Marchese, F. Schapper, M. Holler, T.
Südmeyer, J. S. Robinson, J. G. Tisch, F. Couny, P. Light, F. Benabid and U. Keller,
"High harmonic generation in a gas-filled hollow-core photonic crystal fiber,"
Appled Physics B, vol. 97, no. 2, pp. 369-373.
[17] "NKT Photonics," [Online]. Available: http://www.nktphotonics.com.
[18] R. Paschotta, "RP Photonics," 2014. [Online]. Available: http://www.rp-
photonics.com.
[19] C. V. Raman, "A new radiation," in Proceedings of the Indian Academy of Sciences
- Section A , 1928.
[20] E. J. Woodbury and W. K. Ng, "Ruby laser operation in the near IR," in Proceedings
of the Institute of Radio Engineers, 1962.
[21] E. P. Ippen, "Low-Power Quasi-cw Raman Oscillator," Applied Physics Letters, vol.
16, no. 8, pp. 303-305, 1970.
[22] R. H. Stolen, E. P. Ippen and A. R. Tynes, "Raman Oscillation in Glass Optical
Waveguide," Applied Physics Letters, vol. 20, p. 62, 1972.
[23] M. Ikeda, "Stimulated Raman Amplification Characteristics in Long Span Single-
Mode Silica Fibers," Optics Communications, vol. 39, no. 3, p. 148, 1981.
[24] J. Bromage, "Raman Amplification for Fiber Communications Systems," Journal of
Lightwave Technology, vol. 22, no. 1, pp. 79-93, 2004.

137
[25] G. P. Agrawal, Nonlinear Fiber Optics, 2007.
[26] R. G. Smith, "Optical power handling capacity of low loss optical fibers as
determined by stimulated Raman and Brillouin scattering," Applied Optics, vol. 11,
no. 11, pp. 2489-2494, 1972.
[27] R. H. Stolen, "Polarization Effects in Fiber Raman and Brillouin Lasers," IEEE
Journal of Quantum Electronics, vol. 15, no. 10, p. 1157, October 1979.
[28] V. R. Supradeepa and J. W. Nicholson, "Power Scaling of high-efficiency 1.5 um
cascaded Raman fiber lasers," Optics Letters, vol. 38, no. 14, p. 2538, July 2013.
[29] H. W. Babcock, "The Possibility of Compensating Astronomical Seeing,"
Publications of the Astronomical Society of the Pacific, vol. 65, no. 386, p. 229,
October 1953.
[30] M. Duering, V. Kolev and L. Luther-Davies, "Generation of tuneable 589nm
radiation as a Na guide star source using an optical parametric amplifier," vol. 17,
no. 2, p. 437, Janurary 2009.
[31] J. Telle, J. Drummond, C. Denman, P. Hillman, G. Morre, S. Novotny and R.
Fugate, "Studies of a mesospheric sodium guidestar pumped by continuous-wave
sum frequency mixing of two Nd:YAG laser lines in lithium triborate," in
Proceedings of SPIE, 2006.
[32] "Nikon," [Online]. Available:
http://www.nikon.com/about/technology/field/focas/index3.htm.

138
[33] N. Moussaoui, R. Holzlöhner, W. Hackenberg and D. Bonaccini Calia, "Dependence
of sodium laser guide star photon return," Astronomy and Astrophysics, vol. 501, pp.
793-799, 2009.
[34] P. D. Hillman, J. D. Drummond, C. A. Denman and R. Q. Fugate, "Simple Model,
including Recoil, for the Brightest of Sodium Guide Stars created from CW Single
Frequency Fasors and Comparison Measurements," in Proceedings of SPIE, 2008.
[35] C. E. Max, K. Avicola, J. M. Brase, H. W. Friedman, H. D. Bissinger, J. Duff, D. T.
Gavel, J. A. Horton, R. Keifer, J. R. Morris, S. S. Olivier, R. W. Presta, D. A. Rapp,
J. T. Salmon and K. E. Waltjen, "Design, layout, and early results of a feasibility
experiment for sodium-layer laser-guide-star adaptive optics," Journal of the Optical
Society of America A, vol. 11, no. 2, pp. 813-824, 1994.
[36] T. J. Bronder, H. Miller, J. Stohs, J. Baker, A. Lucero and D. Gallant, "AFRL
Advanced Electric Lasers Branch: construction and upgrade of a 50-watt facility-
class sodium guidestar pump laser," in 2009 Advanced Maui Optical and Space
Surveillance Technologies Conference, Maui, 2009.
[37] R. G. Smith, "Theory of Intracavity Optical Second-Harmonic Generation," IEEE
Journal of Quantum Electronics, vol. 6, no. 4, p. 215, 1970.
[38] R. W. Boyd, Nonlinear Optics, 3rd Edition ed., Academic Press.
[39] A. Isomäki and O. G. Okhotnikov, "Femtosecond soliton mode-locked laser based
on ytterbium-doped photonic bandgap fiber," Optics Express, vol. 14, no. 20, pp.
9238-9243, 2006.
139
[40] V. Pureue, L. Bigot, G. Bouwmans, Y. Quiquempois, M. Douay and Y. Jaouen,
"Ytterbium-doped solid core photonic bandgap fiber for laser operation around
980 nm," Applied Physics Letters, vol. 92, no. 6, pp. 061113-3, 2008.
[41] M. Chen, A. Shirakawa, X. Fan, K.-i. Ueda, C. B. Olausson, J. K. Lyngso and J.
Broeng, "Single-frequency ytterbium doped photonic bandgap fiber amplifier at
1178 nm," Optics Express, vol. 20, no. 19, p. 21044, September 2012.
[42] Y. Feng, S. Huang, A. Shirakawa and K.-I. Ueda, "589 nm Light Source Based on
Raman Fiber Laser," Japanese Journal of Applied Physics, vol. 43, no. 6A, pp. 722-
724, 2004.
[43] Y. Feng, L. Taylor and D. B. Calia, "Multiwatts narrow linewidth fiber Raman
amplifiers," Optics Express, vol. 16, no. 15, pp. 10927-10932, 2008.
[44] Y. Feng, L. Taylor and D. B. Calia, "25 W Raman-fiber-amplifier-based 589 nm
laser for laser guide star," Optics Express, vol. 17, no. 21, pp. 19021-19026, 2009.
[45] L. Zhang, J. Hu, J. Wang and Y. Feng, "Stimulated-Brillouin-scattering-suppressed
high-power single-frequency polarization-maintaining Raman fiber amplifier with
longitudinally varied strain for laser guide star," Optics Letters, vol. 37, no. 22, pp.
4796-4798, 2012.
[46] L. Zhang, H. Jiang, S. Cui, J. Hu and Y. Feng, "Versatile Raman fiber laser for
sodium laser guide star," Laser & Photonics Reviews, 2014.
[47] L. Zhang, H. Jiang, S. Cui and Y. Feng, "Integrated ytterbium-Raman fiber

140
amplifier," Optics Letters, vol. 39, no. 7, pp. 1933-1936, 2014.
[48] A. B. Ruffin, "Stimulated Brillouin Scattering: An Overview of Measurements,
System Impairments, and Applications," NIST-SOFM, 2004.
[49] C. L. Vergien, I. Dajani and C. Zeringue, "Theoretical analysis of single-frequency
Raman fiber amplifier system operating at 1178nm," Optics Express, vol. 18, no. 25,
p. 26214, 2010.
[50] C. Vergien, I. Dajani and C. Robin, "18 W single-stage single-frequency
acoustically," Optics Letters, vol. 37, no. 10, p. 1766, 2012.
[51] I. Dajani, C. Vergien, C. Robin and B. Ward, "Investigations of single-frequency
Raman fiber," Optics Express, vol. 21, no. 10, p. 12038, 2013.
[52] R. Boyd, K. Rzaewski and P. Narum, "Noise initiation of stimulated Brillouin
scattering," Physical Review A, vol. 42, no. 9, pp. 5514-5521, 1990.
[53] C. Headley and G. P. Agrawal, Raman Amplification in Fiber Optical
Communication Systems, Elsevier Academic Press, 2005.
[54] M. D. Mermelstein, "SBS threshold measurements and acoustic beam propagation
modeling in guiding and anti-guiding single mode optical fibers," Optics Express,
vol. 17, no. 18, pp. 16225-16237, 2009.
[55] Y. Feng, L. R. Taylor and D. B. Calia, "150 W highly-efficient Raman fiber laser,"
Optics Express, vol. 17, no. 26, pp. 23678-23683, 2009.
[56] Y. Jeong, J. Nilsson, J. K. Sahu, D. N. Payne, R. Horley, L. M. B. Hickey and P. W.

141
Turner, "Power scaling of single frequency ytterbium-doped fiber master-oscillator
power-amplifier sources up to 500 W," vol. 13, no. 3, pp. 546-551, 2007.
[57] A. Wada, T. Nozawa, D. Tanaka and R. Yamauchi, "Suppression of SBS by
intentionally induced periodic residual-strain in single-mode optical fibers," Proc. of
17th ECOC , vol. B1.1, 1991.
[58] M. J. Li, X. Chen, J. Wang, S. Gray, A. Liu, J. A. Demeritt, A. B. Ruffin, A. M.
Crowley, D. T. Walton and L. A. Zenteno, "Al/Ge co-doped large mode area fiber
with high SBS threshold," Optics Express, vol. 15, no. 13, pp. 8290-8299, 2007.
[59] J. Pelous and R. Vacher, "Thermal brillouin scattering measurements of the
attenuation of longitudinal hypersounds in fused quartz from 77 to 300 K," Solid
State Communications, vol. 16, no. 3, pp. 279-283, 1975.
[60] V. I. Kovalev and R. G. Harrison, "Suppression of stimulated Brillouin scattering in
high-power single-frequency fiber amplifiers," Optics Letters, vol. 31, no. 2, pp.
161-163, 2006.
[61] Y. Imai and N. Shimada, "Two-frequency Brillouin fiber laser controlled by
temperature difference in fiber ring resonator," Optical Review, vol. 1, no. 1, pp. 85-
87, 1994.
[62] C. Robin, I. Dajani, C. Vergien, C. Zeringue and T. M. Shay, "Experimental and
theoretical studies of single frequency PCF amplifier with output of 400 W," in
Proceedings of SPIE LASE, 2010.

142
[63] T. Horiguchi, T. Kurashima and M. Tateda, "Tensile strain dependence of Brillouin
frequency shift in silica optical fibers," 1989.
[64] B. Ward and J. Spring, "Finite element analysis of Brillouin gain in SBS-suppressing
optical fibers with non- uniform acoustic velocity profiles," Optics Express, vol. 17,
pp. 15685-15699, 2009.
[65] I. Dajani, C. Zeringue, T. J. Bronder, T. Shay, A. Gavrielides and C. Robin, "A
theoretical treatment of two approaches to SBS mitigation with two-tone
amplification," Optics Express, vol. 16, no. 18, pp. 14233-14247, 2008.
[66] D. Derickson, Fiber Optic Test and Measurement, Prentice Hall, 1998.
[67] A. Kobyakov, M. Sauer and D. Chowdhury, "Stimulated Brillouin scattering in
optical fibers," Advances in optics and photonics, vol. 2, no. 1, pp. 1-59, 2010.
[68] E. M. Dianov, "Advances in Raman Fibers," Journal of Lightwave Technology, vol.
20, no. 8, pp. 1457-1462, 2002.
[69] F. L. Galeender, J. C. Mikkelsen, R. H. Geils and W. J. Mosby, "The relative Raman
cross sections of vitreous SiO2, GeO2, B2O3 and P2O5," Applied Physics Letters,
vol. 32, no. 1, pp. 34-36, 1978.
[70] N. Shibada, M. Horigudhi and T. Edahiro, "Raman spectra of binary high-silica
glasses and fibers containing GeO2, P2O5 and B2O3," Journal of Non-Crystalline
Solids, vol. 45, pp. 115-126, 1981.
[71] S. T. Davey, D. L. Williams, B. J. Ainslie, W. M. Rothwell and B. Wakefield,

143
"Optical Gain Spectrum of GeO2-SiO2 Raman Fiber Amplifiers," in IEEE
Proceedings, 1989.
[72] C. Robin and I. Dajani, "Acoustically segmented photonic crystal fiber for single-
frequency high-power laser applications," Optics Letters, vol. 36, no. 14, pp. 2641-
2643, 2011.
[73] T. C. Wei, "Acoustic properties of silica glass doped with fluorine," Journal of non-
crystalline solids, vol. 321, no. 1, pp. 126-133, 2003.
[74] C. Zeringue, I. Dajani, S. Naderi, G. T. Moore and C. Robin, "A theoretical study of
transient stimulated Brillouin scattering in optical fibers seeded with phase-
modulated light," Optics Express, vol. 20, no. 19, pp. 21196-21213, 2012.
[75] R. Holzlohner, S. M. Rochester, D. B. Calia, D. Budker, J. M. Higbie and W.
Hackenberg, "Optimization of cw sodium laser guide star efficiency," Astronomy
and Astrophysics, vol. 510, no. A20, 2010.
[76] M. Izutsu, S. Shikama and T. Sueta, "Integrated optical SSB modulator/frequency
shifter," IEEE Journal of Quantum Electronics, vol. 17, no. 11, pp. 2225-2227,
1981.
[77] I. Dajani, C. Vergien, B. Ward, C. Robin, S. Nadri, A. Flores and J.-C. Diels,
"Experimental and theoretical investigations of single-frequency," in Proceedings of
SPIE LASE, 2013.