Investigation of near-infrared fluorescence and ...
68
Syracuse University Syracuse University SURFACE SURFACE Syracuse University Honors Program Capstone Projects Syracuse University Honors Program Capstone Projects Spring 5-1-2010 Investigation of near-infrared fluorescence and photobleaching of Investigation of near-infrared fluorescence and photobleaching of human volar side fingertips in vivo: antioxidants and melanin human volar side fingertips in vivo: antioxidants and melanin Colin Wright Follow this and additional works at: https://surface.syr.edu/honors_capstone Part of the Biochemistry Commons Recommended Citation Recommended Citation Wright, Colin, "Investigation of near-infrared fluorescence and photobleaching of human volar side fingertips in vivo: antioxidants and melanin" (2010). Syracuse University Honors Program Capstone Projects. 346. https://surface.syr.edu/honors_capstone/346 This Honors Capstone Project is brought to you for free and open access by the Syracuse University Honors Program Capstone Projects at SURFACE. It has been accepted for inclusion in Syracuse University Honors Program Capstone Projects by an authorized administrator of SURFACE. For more information, please contact [email protected].
Transcript of Investigation of near-infrared fluorescence and ...

Syracuse University Syracuse University
SURFACE SURFACE
Syracuse University Honors Program Capstone Projects
Syracuse University Honors Program Capstone Projects
Spring 5-1-2010
Investigation of near-infrared fluorescence and photobleaching of Investigation of near-infrared fluorescence and photobleaching of
human volar side fingertips in vivo: antioxidants and melanin human volar side fingertips in vivo: antioxidants and melanin
Colin Wright
Follow this and additional works at: https://surface.syr.edu/honors_capstone
Part of the Biochemistry Commons
Recommended Citation Recommended Citation Wright, Colin, "Investigation of near-infrared fluorescence and photobleaching of human volar side fingertips in vivo: antioxidants and melanin" (2010). Syracuse University Honors Program Capstone Projects. 346. https://surface.syr.edu/honors_capstone/346
This Honors Capstone Project is brought to you for free and open access by the Syracuse University Honors Program Capstone Projects at SURFACE. It has been accepted for inclusion in Syracuse University Honors Program Capstone Projects by an authorized administrator of SURFACE. For more information, please contact [email protected].

Investigation of near-infrared fluorescence and photobleaching of human volar side
fingertips in vivo: antioxidants and melanin
A Capstone Project Submitted in Partial Fulfillment of the Requirements of the Renée Crown University Honors Program at
Syracuse University
Colin Wright
Candidate for B.S. Degree
and Renée Crown University Honors
May 2010
Honors Capstone Project in _______Biochemistry__ ___ Capstone Project Advisor: __________________________
Joseph Chaiken
Honors Reader: __________________________________ James Dabrowiak
Honors Director: __________________________________ Samuel Gorovitz
Date:___________________________________________
April 28, 2010

Abstract Noninvasive in vivo blood glucose determination in the skin of volar side of human fingertips by near-infrared (NIR) Raman spectroscopy relies on fluorescence to quantify blood volume. Fluorescence does not only come from blood, which is composed of plasma and red blood cells; in fact, most fluorescence produced by human fingertips originates in the static tissues, e.g. skin, interstitial fluid, etc.. It will soon be possible to quantify the precise contributions of red blood cells, plasma, and static tissue to the overall fluorescence emission. Observations reveal a systematic decay in fluorescence, which, if not caused by blood movement, challenges our ability to accurately determine blood glucose. In this work, it was found that the fluorescence decay was, in fact, not a result of a blood movement, but instead a chemical change of the static tissues decreasing their fluorescent properties. To identify possible photobleachable material, a series of in vitro experiments were performed on various antioxidants and the skin pigment melanin. While none of the antioxidants were found to fluoresce, it was observed that melanin fluoresces, photobleaches, and does not significantly recover its photobleaching. This allows for a deeper understanding as to the chemistry underlying the effect of photobleaching and how it may be accounted for in regards to this technique for glucose measurement.

Table of Contents Acknowledgements…………………………………………………….. i Introduction ..................................................................................... 1
Literature Review ............................................................................ 5
Raman spectroscopy theory ........................................................ 5
Noninvasive in vivo Raman spectroscopy of human tissues ....... 8
Problem of photobleaching ........................................................ 12
Pentosidine................................................................................ 14
In vivo investigation....................................................................... 15
Experimental.............................................................................. 15
In vivo Raman instrument ...................................................... 15
In vivo experiment protocol .................................................... 19
Results....................................................................................... 21
In vitro investigation....................................................................... 25
Experimental.............................................................................. 25
In vitro Raman instrument ...................................................... 25
In vitro experiment protocol .................................................... 27
Results....................................................................................... 34
Antioxidants............................................................................ 34
Melanin .................................................................................. 39
Discussion..................................................................................... 43
Conclusion .................................................................................... 49
References.................................................................................... 50
Appendices ................................................................................... 53
Capstone Summary....................................................................... 58

Acknowledgments I would first like to thank Professor Joe Chaiken for his mentorship and constructive feedback during the research and writing processes. I am grateful to Bin Deng for all of her patience and coaching in lab, and to Dr. George Shaheen for his confidence and our discussions at LighTouch. I am very appreciative of the Renée Crown Honors Program for presenting me the opportunity to deeply explore my scientific interests, and for helping me fund my project through the Crown Award. To my parents, Karen and Stephen, thank you for your support in all things that have led me to where I am now.
i

1
Introduction
Diabetes mellitus is a disease, characterized by an inability to
maintain a healthy glucose concentration because the body either does
not produce the hormone insulin (type I) or becomes resistant to it (type
II), that affects millions of Americans. Both type I and type II diabetes can
cause cardiovascular disease neuropathy, retinopathy (resulting in
blindness), end-stage renal disease, foot ulcerations requiring amputation,
and death, among other complications. In addition to managing insulin
levels, maintaining healthy blood glucose concentration is an essential
and often difficult task for every diabetic. The hemoglobin A1C test is
performed by physicians to to measure patients’ glucose level over long
periods of time, but it is also necessary for these patients to self-monitor
their glucose concentration, often over a dozen times each day[1].
Most blood glucose meters produce an automatic reading by
obtaining a sample of blood, applying it to a reagent strip which is inserted
into a reflectance photometer. There are well over twenty meters
commercially available, varying in size, weight, and volume of blood
drawn; some even allow for blood to be obtained from different parts of the
body, such as a finger or forearm[2]. Nevertheless, all of these products
require the invasive procedure of piercing the skin to obtain a sample of
blood. Given the frequency at which these patients must undergo this
painful process to measure their blood glucose concentration, diabetics
suffer from scarred and sore fingers, making this chronic disease

2
extremely unpleasant.
Our system to achieve noninvasive in vivo blood and tissue
analysis is a key development that has a chance to free diabetics from the
pain of managing their disease, as well as to revolutionize many other
facets of medicine. A variety of spectroscopic techniques have been
investigated including fluorescence spectroscopy, optical rotation, and
those using the ultraviolet (UV), near-infrared (NIR) and mid-infrared
regions of the spectrum[3]. We rely on the use of near-infrared Raman
vibrational spectroscopy to reveal various characteristics of blood,
including glucose concentration and hematocrit[4]. The concentration, an
amount-per-unit volume of a particular substance, such as glucose, can be
readily determined by the analysis of key features of the spectra, namely
elastic scattering, inelastic scattering, and fluorescence. While the Raman
features (inelastic scattering), which are narrow, are used to determine the
relative presence of glucose, and elastic scattering used to monitor red
blood cell content, fluorescence, which is relatively broad band, is used to
quantify blood volume[5].
We have previously observed that the laser-induced fluorescence of
fingertips is associated with blood, and so it is this signal that we used to
determine blood volume (BV)[5]. However, in vivo experiments revealed a
systematic decay of the BV measurement due to the laser itself. This
effect was observed to be even stronger for diabetic patients[4]. Since
blood volume is calculated by the integration of the fluorescence, this

3
observation indicates that, over a period of tens of seconds, there was a
significant decrease in fluorescence produced by the exposed tissue. It is
believed that this is a result of a light-induced chemical change, a process
referred to as “photobleaching.”
Through further experimentation, it was discovered that static
tissue, as opposed to blood, is the main photobleachable material. The
purpose of this work is to identify, from the thousands of substances in
static tissue, potential candidates which could be responsible for this
“autofluorescence” (fluorescence by substances other than the one of
interest, in this case, blood). We seek to observe their photobleaching
properties that they may be appropriately accounted for to improve the
accuracy of the blood volume reading and, concurrently, the blood glucose
concentration determination.
Identifying a series of endogenous and exogenous substances is a
difficult task. Given the nearly countless number of carbohydrates,
proteins and smaller polypeptides, lipids, vitamins, antioxidants, and other
biological molecules, it would require a massive effort to describe the
photodynamic properties regarding the NIR and Raman spectroscopy of
each of these substances to comprehensively isolate those which account
for the autofluorescence and photobleaching events that have been
observed. It is important to note that historically, due to technological
limitations, spectroscopic investigations of such substances were
performed using the ultraviolet-visible (UV-Vis) region of the spectrum, of

4
which there is already wealth of knowledge. However, since UV light in
particular can damage and burn an exposed individual, UV-Vis
spectroscopy cannot be utilized for in vivo experiments. Instead, near-
infrared light is safe for vibrational Raman spectroscopy in vivo, and so is
ideal for this technology. Due to the fact that there is far less literature
pertaining to NIR spectroscopy than that of the UV-Vis range regarding
specific substances of interest, the need for such investigation became
apparent.
Therefore, based on structure and functionality, a series of vitamins,
antioxidants, and the major skin pigment, melanin, were selected to
ascertain their spectroscopic properties to identify potential fluorophores in
vivo as well as to narrow down the list of skin-borne candidates.
Antioxidants serve to protect essential cellular molecules from rapid
oxidation by reactive oxygen species by themselves undergoing
oxidation[6]. Since antioxidants contain loosely held electrons, which are
essential to their function as reducing agents of reactive oxygen species, it
was hypothesized that these molecules, as a class, might have excited
electronic states low enough in energy such that long wavelengths, such
as those in the NIR, could electronically excite them and cause
subsequent fluorescence. Melanin has high absorptive properties,
rendering it ideal as a skin pigment. With such high absorptivity, melanin
became a candidate of interest as to its fluorescent and photobleaching
properties[7]. Given its intricate macromolecular structure, which is yet to
5
be elucidated and under active investigation by other groups, melanin
remains a compound which could provide great insight into the chemistry
of photobleaching.
The literature demonstrates that advanced glycation end products
(AGEs), namely pentosidine (the glycation product between ribose and the
amino acids lysine and arginine), are highly fluorescent in the UV-visible[8].
The relatively high concentration of these ubiquitous substances in
humans, the various biochemical pathways for their formation, and their
association with diabetes patients who experience regular hyperglycemia
attracted an interest into their NIR fluorescent and photobleaching
properties. Since the present study began, we learned that pentosidine,
AGEs in general, and hemoglobin do fluoresce and photobleach in the
NIR. Since we now know at least three skin-borne substances that
produce NIR fluorescence, this thesis is limited to all substances other
than pentosidine and hemoglobin.
Literature Review
Raman spectroscopy theory
The theory of Raman spectroscopy derives from specific
interactions between molecules and photons. When photons from nearly
monochromatic light, such as from a laser, interact with matter, one of
three events can occur. The light may pass through the molecule
unaffected, it can be scattered, or it can be absorbed. Under in vivo

6
conditions, all molecules may exist in the ground electronic and vibrational
states, which are of the lowest energy for a molecule. In the presence of
light and other forms of excitation, the molecules can exist in various types
of virtual states and vibrational states. During a molecule-photon
scattering event, an incident photon of a given energy briefly distorts the
electron distribution of a molecule, promoting the molecule from the
ground state to a higher energy virtual state, and is then reflected in a
different direction. If no energy is absorbed by the molecule, the molecule
returns to its original energy level, and the photon is emitted at the same
energy as prior to incidence, a process known as Raleigh or elastic
scattering. If there is a transfer of energy between the light and the
molecule, the photon is emitted at a different energy (and wavelength),
leaving the molecule in a different vibrational state, a process known as
Raman or inelastic scattering. The difference in energy between the
incident and scattered light is equal to the energy of the vibrational
transition[9,10].
Spontaneous Raman scattering is a fairly weak phenomenon,
affecting only one in 106 to 108 photon/molecule interactions, and involves
two types of processes: Stokes scattering and anti-Stokes scattering.
Stokes scattering occurs when a molecule in the ground state absorbs
some energy of the photon and is promoted to a higher energy vibrational
state, while the photon emitted is of a lower energy and longer
wavelength. Anti-Stokes scattering occurs when a molecule, already in an
7
excited state due to thermal energy, returns to the ground state and
transfers energy to the photon, which is emitted at a higher energy and
shorter wavelength. Stokes scattering is most commonly used for
spectroscopic analysis; however, there are applications for anti-Stokes
scattering. These shifts in wavelength are indicative of the structural
features of the molecule, and therefore, the structures of compounds can
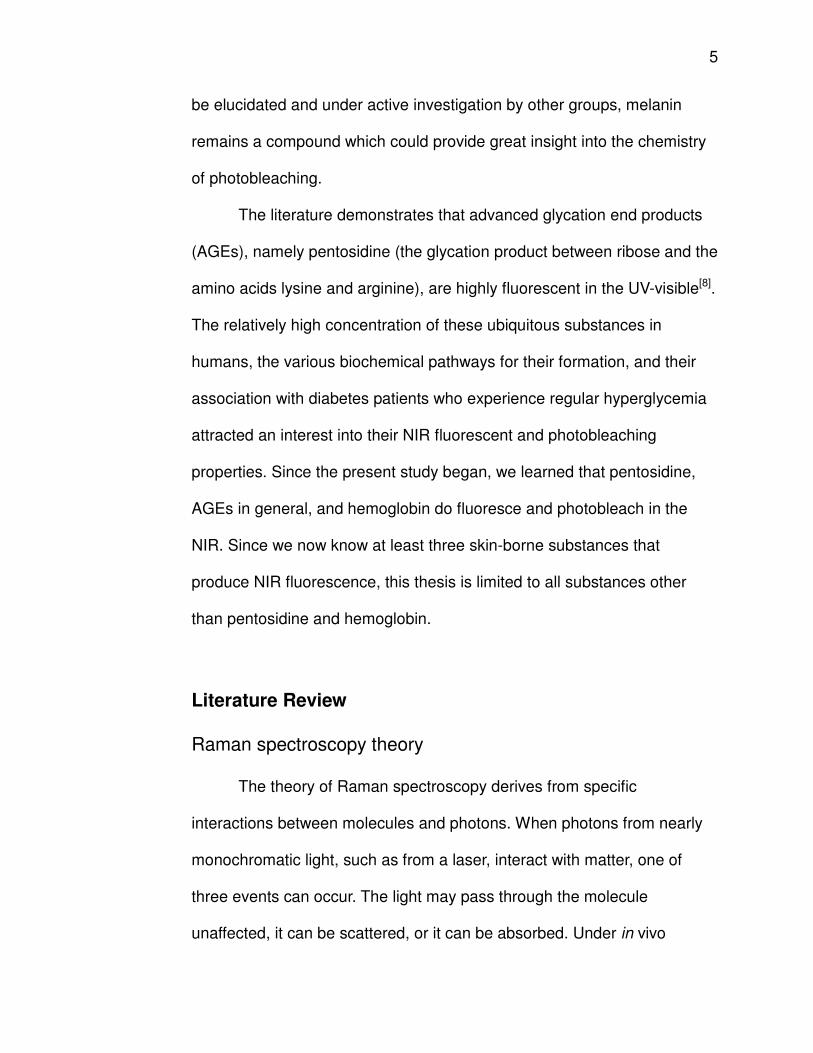
be revealed by the investigation of their Raman spectra[9,10].
Figure 1: Graphical representation of Raleigh and Raman scattering processes. Source: Modern Raman spectroscopy: a practical approach by
Ewen Smith, Geoffrey Dent[10].
Molecules may exist in different real quantum electronic states,
either in the ground state or in more highly excited energy states. A
molecule may be promoted from the ground state to the first excited state
(or from one excited state to the next) if it absorbs an incident photon of an
energy greater or equal to the energy difference between the electronic
states. The excited molecule then will spontaneously relax from its excited
electronic state to its ground state along with the emission of a photon
through a process known as fluorescence. Beyond promotion to an

8
excited electronic quantum state, a molecule can be excited to higher
energy vibrational states within the excited electronic energy level. Then,
in a nonradiative process known as internal conversion, the molecule
returns to a lower electronic state, but now containing substantial energy
in the form of heat, i.e. vibrations[11].
As seen above, there are two distinct types of emission from such
interactions: elastic and inelastic. The difference between them always
pertains to the degree to which energy is transferred during the
interaction[9]. Elastic emission results from no energy transfer, in which the
reflected photon has the same wavelength and energy as the incident
photon (Raleigh scattering). Inelastic emission involves energy transfer by
inelastic scattering (Stokes and anti-Stokes) and fluorescence, in which
the reflected photon has a different wavelength and energy from the
incident photon.
Noninvasive in vivo Raman spectroscopy of human tissues
There is substantial evidence to link fluorescence with blood
volume. Previous studies have shown that fluorescence fluctuates in
coordination with cold-induced vasodilation, indicating an associated with
blood volume[12]. Results of additional experiments on fluorescence
changes and blood movement involving mechanical and thermal tissue
modulation strongly imply the same conclusion[13]. Hemoglobin, the major
oxygen-binding protein in blood, has been found be highly fluorescent in
the NIR, and has also been proven to be a major component of blood
9
fluorescence[14]. For these reasons, the integration of overall fluorescence
over time is used to monitor blood volume (BV). Through similar
experiments, it has been found that elastic (Raleigh) scattering is strongly
related to the volume fraction of red blood cells (RBCs). Likewise, the
integration of the Raleigh line is used to monitor RBC volume; however, it
has been observed that the elastic emission decreases as the RBC
concentration increases, due to the dominant scattering coefficient in the
tissues of the RBCs[15].
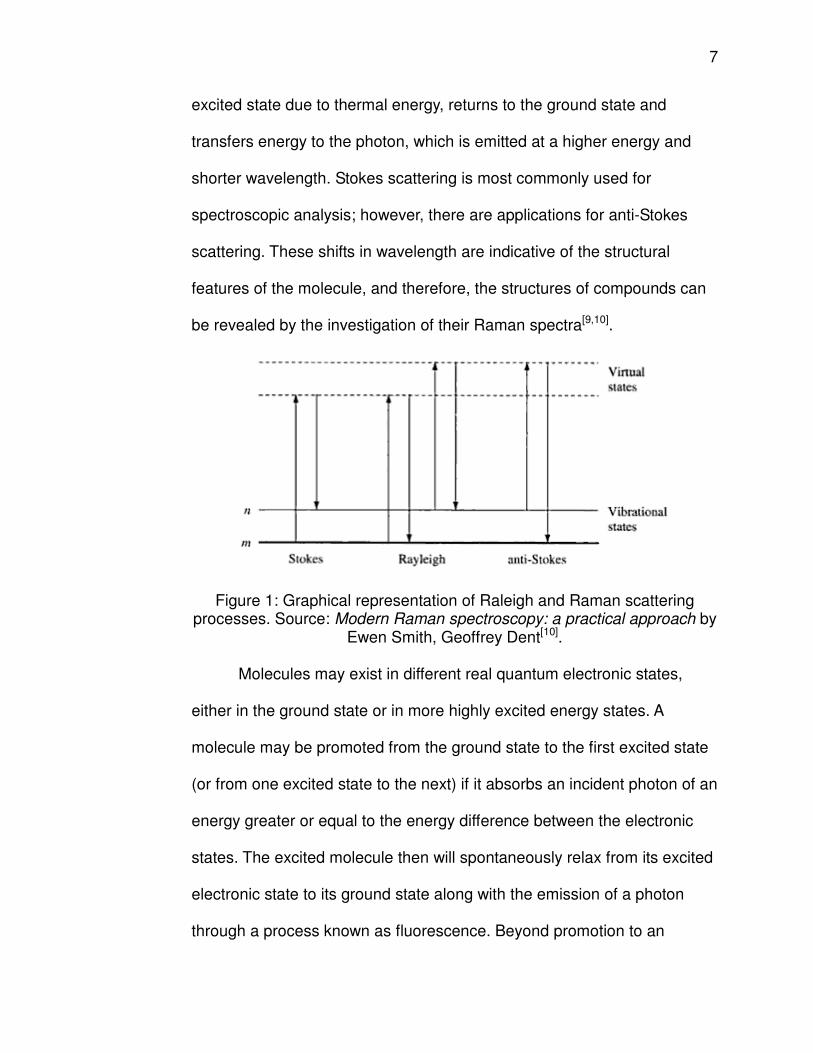
Figure 2: Intensity vs. frequency of a 20 ms CCD frame of a LighTouch® device using 830 nm excitation at 200 mW. Regions used to quantify
inelastic scattering (500 cm-1 – 1750 cm-1) and elastic scattering (-30 cm-1 – 10 cm-1) are shown.
Displayed in Figure 2 is a typical emission spectrum of the volar
side of a fingertip containing Raleigh, Raman, and fluorescence emission

10
during a 20 ms frame obtained using a LighTouch® device. The Raleigh
line accounts for the elastic scattering that extends to above 50,000
counts. The sharp, variable Raman features due to inelastic scattering
span the entire region of interest of the spectrum, and three particularly
prevalent signals, the amide I, CH2 deformation, and amide III, are visible
at ≈ 1660 cm-1, ≈ 1450 cm-1, and ≈ 1270 cm-1, respectively. Fluorescence
is marked by the large broadband feature extending from ≈ 500 cm-1 -1750
cm-1.
Fluorescence can be integrated and plotted as a function of time,
the region of which is marked in Figure 2. Blood volume for a particular
frame is calculated as the integration of the fluorescence band, which can
be plotted as a single point on a BV vs. time curve. For a 200-second
experiment, 10,000 such frames were recorded, yielding a graph such as
that displayed in Figure 3. This curve represents tissue modulation used to
obtain a spectrum of blood to determinate glucose concentration. During a
mechanical tissue modulation event, there is an “unpressed” phase and a
“pressed” phase. When tissue becomes pressed from a previously
unpressed state, an external force presses against the dorsal side of the
finger, modulating the skin of the volar side and forcing some interstitial
fluids (i.e. blood) out of the region while static tissue and some fluids
remain. If the difference between the spectra of the pressed and
unpressed states is due to an efflux of blood as a result of applied
pressure, the pressed phase can be subtracted from the unpressed phase

11
to yield a spectrum of blood (excluding static tissues). It is by this
technique that blood glucose concentration is commonly determined[5].
Figure 3: Typical BV vs. time curve of an experiment employing tissue modulation. The inset displays the same data between frames 2000-2200 to 9000-9200, from which pulses can be identified. A slight distortion due perhaps to movement of finger or additional pressure upon the aperture resulting in increased blood flow is noted at approximately 4200 cm-1.
It is evident from Figure 3 that over time, excluding the transition
between unpressed and pressed states, there is a significant decay
through frame 4000 to approximately frame 8000, where it appears to
level off. This decline has been evident in nearly every experiment that
has taken place at LighTouch®. There is a significant change in
fluorescence which is suspected to not be accompanied by a proportional
change in blood volume. This regularly occurring phenomenon has
recently been the target of inquiry, and the experimentation to identify the

12
cause of this decay is the purpose of the current study.
Problem of photobleaching
While it is certain that fluorescence is associated with blood
volume, the relative contribution of blood to overall fluorescence is still yet
to be determined. In fact, it is believed that most of the total fluorescence
derives from substances other than blood, which are present in the
surrounding static tissues. In order to see how one might approach this
question quantitatively, we note that in these types of experiments, light
penetrates the finger hundreds of microns below the surface of the skin,
and engages in interactions within a defined volume of tissue. Of this
defined volume of the volar side of a fingertip prior to systole, 97% is
composed of static tissue, and 3% is composed of blood residing in blood
vessels such as capillaries. It has also been reported that within these
vessels, the hematocrit (the volume fraction of blood occupied by red
blood cells) is approximately 0.10, so in the resting state, 2.7% of the total
volume is composed of plasma, while 0.3% is composed of red blood
cells. Therefore, given that each component has a different fluorescence
per unit volume, the contribution of each component to the total
fluorescence can be described by the following equation, where a, b, and
c are the fluorescence per unit volume coefficients of static tissue, plasma,
and red blood cells, respectively:
0.97(a) + 0.27(b) + 0.03(c) = Total Fluorescence = BV(diastole).
During a pulse, there is an influx of blood in the blood vessels, and,

13
assuming there are no voids, this additional blood volume displaces the
same amount of static tissue volume from the irradiated region. Also,
assuming that the hematocrit remains constant, the peak of systole, during
which blood volume is doubled and the static tissue volume decreased by
the same amount, can be described by the following equation:
0.94(a) + 0.54(b) + 0.06(c) = Total Fluorescence = BV(systole). While the precise amount of increase in blood volume during a pulse is
uncertain, this situation, with its assumptions, provides a useful model to
account for the contribution of the different components to the observed
fluorescence over time. Since we routinely collect 103–104 BV vs. time
measurements and an equal number of RBC vs. time measurements, we
have a large, overdetermined system of two equations, two unknowns,
which can be used to obtain relative tissue volume fractions in the NIR-
probed volume. The model indicates that when the volume fraction of one
component increases, that of at least one other must decrease, because
the sum of all volume fractions must equal unity, so long as there are no
voids.
However, one of the most important assumptions about blood
volume and fluorescence is challenged by the phenomenon of
photobleaching. If it is assumed that the fluorescence per unit volume for
each component remains constant, then changes in fluorescence can be
only caused by the movement of these components, namely blood. The
fact that during experiments there is regularly a decay of 15-20% in

14
fluorescence can be explained only by one of two possibilities. If the
assumption is true, the decline in fluorescence results from a substantial
efflux of fluorescent material out of the irradiated zone. Studies of
hydrostatic blood movement due to gravity decreases make such blood
movement seem unlikely[20]. The more plausible explanation is that there
is a chemical change in one of the components, most likely in the static
tissue, where certain substances are transformed into less fluorescent
products (i.e. they are photobleached). Therefore, the phenomenon of
photobleaching poses a significant obstacle to accurately determining
blood glucose concentration. Further understanding of the substances that
undergo this process and the products that are formed is essential to
improving upon in vivo noninvasive analysis by Raman spectroscopy[4].
Pentosidine
High levels of pentosidine in diabetics can be explained by the fact
that pentoses can be formed from hexoses by means of a series of
metabolic reactions known as the pentose phosphate pathway (also called
the hexose monophosphate shunt). Glucose-6-phosphate undergoes a
dehydrogenation step to form a lactone, followed by hydrolysis, and then
oxidative decarboxylation to form ribulose-5-phosphate, while two
equivalents of NADP+ are reduced to NADPH and carbon dioxide
released to drive the reaction forward. Ribulose-5-phosphate and other
pentose phosphates such as ribose-5-phosphate and xylulose-5-
phosphate can be interconverted by action of isomerase and epimerase

15
enzymes[16].
It is this pentose pool, of which its biological intention is to
synthesize macromolecules that incorporate pentoses such as RNA and
DNA or to continue through the non-oxidative stage of pentose phosphate
pathway to form glycolytic intermediates, which provides the basis for the
formation of the highly fluorescent pentosidine[16]. Formed by Maillard
chemistry, pentosidine is used to indicate the relative presence of
advanced glycation end products (AGEs) which can result from oxidative
stress and, notably, hyperglycemia by means of the described pentose
phosphate pathway[17]. If an individual has a high level of glucose leading
to high levels of pentose and therefore pentosidine, it can be suggested
that this mechanism explains why the tissue of diabetics seems to
fluoresce much more than those who have not experienced regular long-
term hyperglycemia. Due to the fact that its potential as a photobleachable
material was only realized after these experiments were performed, the
study of pentosidine is not included in this text. However, the investigation
as to the chemistry underlying the photobleaching of pentosidine is
currently taking place.
In vivo investigation
Experimental
In vivo Raman instrument
While a complete description of the instrument known as a
LighTouch® device, used for in vivo experiments, is beyond the scope of

16
this thesis, a diagram of the system utilizing Raman spectroscopy to
obtain information from human tissue, such as blood glucose
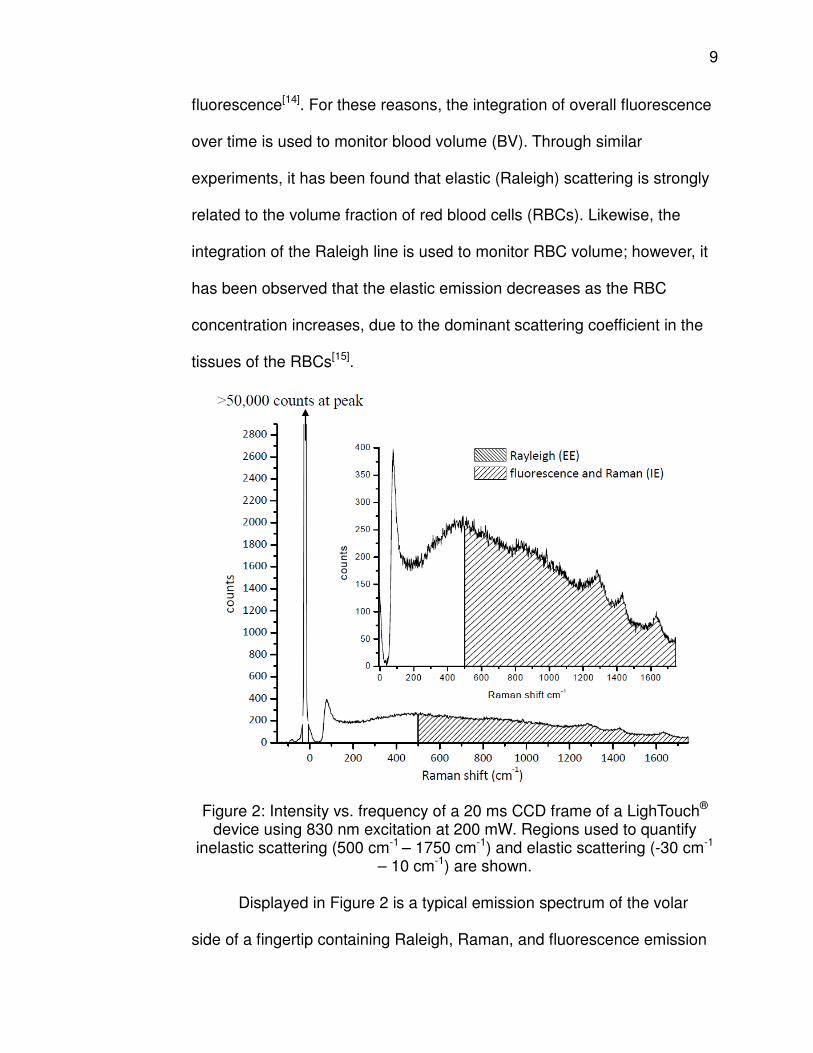
concentration and hematocrit, is displayed in Figure 4. A CW external
cavity diode laser is used to produce a 45 mW excitation of 805 nm,
though other lasers can be substituted to perform experiments using 785
nm or 830 nm light. The light passes through a Semrock clean-up filter
and then through a focusing lens, so that the light focuses precisely at the
aperture, at which a fingertip is placed[4]. The 2 mm aperture is in a spring
steel plate providing the surface against which an individual presses his
finger. The laser spot at the finger is approximately 100 x 230 µm, and is
elliptical in shape. The angle of incidence of the light to the finger is about
53°. The emission is collimated as it passes through a pair of lenses to
reorient the light parallel and through a “Razor Edge” filter to reduce the
signal due to Raleigh scattering, and is then refocused onto a 60 fiber x
100µm bundle of fused silica fibers[14]. The fibers introduce a line image to
the Process Instruments f/2.1 spectrograph that is detected by a Critical
Link CCD camera, cooled to -80 °C. Not shown are two electronic shutters
between the clean-up filter and the coupling lens that allow for pulse
sequences of the laser to the fingertip. The entire optical apparatus is
enclosed within a black casing to prevent outside light from entering the
system[4].
17
Figure 4: Schematic diagram of in vivo LighTouch® device optical layout. A variety of “human error” can influence the data. Pushing one’s
finger against the aperture can cause the tissue to excessively extrude
through the hole, an effect called “doming”, changing the path length of the
laser through the tissue, which alters the scattering processes necessary
for an accurate measurement. Moving one’s finger during the
measurement process can change the types and amounts of tissues
interacting with the light and producing emission. In order to establish a
protocol that can be replicated by non-experts to reliably reproduce data
and minimize errors, a force measurement and placement system has
been added to the apparatus containing the aperture to control pressure
and position[18].
The position detector-pressure monitor (PDPM) involves a series of
small gold-plated dots built into a circuit board, above, below, and to the
left and right of the hole. The resistance is lower when tissue is in contact

18
with the gold dot than when there is no contact. If a finger is or is not in
contact with a gold dot, the appropriate electronic signal is transmitted by
the circuit board to the computer. Therefore, position and contact area can
be monitored at all times prior to and during the experiment. A force
transducer, coupled with a lever system, is used to detect the force
applied by one’s fingertip at the aperture. Force and pressure can,
therefore, also be monitored throughout the experiment. These features
are coordinated with a graphical user interface (GUI) which allows
individuals to easily center their finger on the aperture and to recognize if
they are pushing too hard against the aperture[18].
An automated force actuator is used to achieve tissue modulation.
This servo-driven device applies a uniform pressure by applying force
according to the contact area detected by the PDPM. This pressure
causes skin and underlying tissues to extrude through the aperture, and
also causes some movement of fluids, such as blood, out of the irradiated
area[18]. The pressure can be adjusted by the experimenter, and to collect
data using tissue modulation involving a “pressed” state and an
“unpressed” state, an experiment is set up such that, during the first half, a
relatively low pressure is applied, and is then raised during the second
half. Pulse modulation is another technique used to obtain a spectrum of
blood that does not utilize differences in pressure[19]. For the purposes of
studying fluorescence and the photobleaching of static tissues, neither
technique was applied. However, the force actuator was necessary to

19
maintain consistency in all experiments.
For a typical experiment, the test subjects were asked to insert their
right-hand middle finger into the apparatus and, using the GUI as a guide
displaying the gold dots on the circuit board, center it over the aperture.
During the set-up phase, the test subjects press gently on the aperture
and are given time to ensure both that the finger is properly placed and
that they are comfortable enough to remain in position for the duration of
the experiment. The subjects are asked to remain passive while the
actuator is brought in contact with the dorsal side of the finger and brings
the finger to ≈ 15 g/cm2 pressure against the aperture. Once the collection
is started, the actuator increases the pressure to, for example, ≈ 60 g/cm2,
and the shutters open to allow exposure of the finger to the laser. The
pressure is held constant for each experiment and is designed to be
approximately halfway between diastole and systole. This device can do
this with much greater accuracy and measure than the human hand[18].
In vivo experiment protocol
Two major experiments were performed to establish the contribution
of blood and static tissue to the commonly observed decay in
fluorescence. The first was aimed at determining the effect of inducing
hydrostatic relaxation. Hydrostatics is an integral part of understanding the
circulatory system and is complicated by a number of factors. Hydrostatic
pressure is the force exerted by a fluid as a result of gravity, and it has
been found that the hydrostatic pressure in blood can be affected by body

20
position as well as muscle contraction. The process of performing
exercises involving these factors to achieve a state of equilibrium is known
as hydrostatic relaxation[20]. For each of three different trials, data were
collected following a protocol associated with the LighTouch® device, and
the integrals of the elastic emission and the inelastic emission were
recorded over time. Since RBC volume is associated with elastic
emission, and blood volume with fluorescence, the integrals of the EE and
IE of frames recorded by the CCD as a function of time are used to
monitor RBCs and BV, respectively.
Each test subject was first asked to equilibrate the blood in his or
her hand (flexion of muscles as well as stretching and overall body
movement) and then insert a middle finger into the apparatus for set up,
while a pressure of ≈ 15 g/cm2 was applied. The pressure was increased
to ≈ 60 g/cm2, and a 100 second measurement (A) was then recorded with
laser exposure. Immediately after, the finger was left motionless while the
pressure was reduced to ≈ 15 g/cm2 for about 10 seconds. The pressure
was again raised to ≈ 60 g/cm2 and another 100-second measurement (B)
was recorded without cessation of laser exposure. Upon completion, each
subject was asked to re-equilibrate his or her arm and hand and the finger
was inserted at a slightly different position. The pressure was applied and
then raised while the finger was left motionless, as if for the previous
measurement, except that no laser exposure occurred during this period.
Then, as in B, the finger was set up with the appropriate pressure

21
changes, laser exposure was resumed, and another 100-second
measurement (C) was recorded.
The second experiment focused on the effect of the laser on
fluorescence recovery. First, the fingertip was set up in registration with
the aperture, and the pressure was brought to ≈ 60 g/cm2 with the laser
blocked, marking t=0 s. At t=2 seconds the laser was unblocked, exposing
the finger. The measurement was allowed to continue, and at t=27 s, the
laser was once again blocked for 8 seconds, until t=35 s, to allow over a
dozen cardiac pulses to displace the previously exposed blood with
unexposed blood in the irradiated volume. At this point, the laser was
again unblocked, and the experiment was allowed to proceed until t= 41 s,
when again the laser was blocked and remained so until the end of the 50-
second period. The BV vs. time plot from the collected CCD frames was
then analyzed.
Results
Figure 5 shows the RBC vs. time and BV vs. time plots acquired
from the hydrostatic relaxation experiment. The BV curve of A exhibits the
decay in fluorescence, with a sharp drop off in the first 3 seconds, a
continuing steep decline through 20 seconds, and a steady decline until
t=80 seconds, when it appears to have leveled off at just about 80,000
integrated counts. The BV curve for B, a result of the trial about 10
seconds after A to allow fresh blood to circulate into the region, does not
undergo the decline that is evident for A; there is a steep drop off in the

22
first 2 seconds, but the fluorescence appears to be stable between
76,000-78,000 counts throughout the duration of the measurement. It is
noted that the fluorescence recorded throughout B is approximately the
same as that which was observed at the end of A, when it seemed to
stabilize after undergoing the decay. Also, the RBC curves representing
the integrated elastic emission for A and B appear nearly identical and
remain stable throughout the course of each measurement. The BV data
of measurement C following hydrostatic relaxation reveals a pattern similar
to that observed for A.
Figure 5: BV vs. time and RBC vs. time curves of the hydrostatic
relaxation experiment. Condition A) initial 100 s with exposure and hydrostatic relaxation; condition B) second 100 s with exposure and
hydrostatic relaxation after remaining motionless 10 s after A; condition C) 100 s with exposure remaining motionless following 100 s with hydrostatic
relaxation, but not exposure.
Fluorescence decayed in a homologous fashion and then seemed to

23
reach a stable level at t=80 s. It was observed, however, that overall
fluorescence and decay in trial C was greater than in A, and that the RBC
count was lower than in trials A and B. It was shown that the changes in
fluorescence were not a result of blood movement.
The results of the experiment focusing on the effect of the laser on
fluorescence recovery are displayed in Figure 6. The integrated
fluorescence BV curve shown represents data obtained using the typical
isobaric experimental procedure, and the only variable modified at
different points in the experiment was whether or not the laser was
blocked, allowing or preventing exposure. It is obvious that, because the
experiment began with the laser blocked, fluorescence was at zero until it
spikes at t=2 s, when the laser was unblocked. From this point until t=27 s,
the fluorescence decays in the manner that has been previously
described. There is a sharp decrease in the first 7 s of exposure, and then
the decay becomes slightly more moderate from t=10 s to t=20 s, at which
point it appears to level off until t=27 s. Note that the apparent
fluorescence never falls completely to zero because of the dark current
detected by the CCD camera, regardless of whether or not the laser is
blocked.

24
Figure 6: Integrated fluorescence BV vs. time curve from the study to
observe fluorescence recovery. Laser exposure of finger was allowed by unblocking the laser from t=2 s to t=27 s and from t=35 s to t=41 s. The
fluorescence decayed 33.7% over the course of the experiment.
At this point, when the laser was blocked, the fluorescence dropped
to its minimum and remained so until the laser was unblocked at t=35 s,
permitting exposure to the finger. At this time, the fluorescence recovered
to a point nearly identical to that immediately before t=27 s when the laser
was turned off; no significant increase was observed. The fluorescence
then decayed in a rather slow fashion until t=41 s, when the laser was
again blocked until the end of the 50 s period. Because the initial
fluorescence at t=2 s is roughly 47,500 counts and the fluorescence
seems to equilibrate at around 31,500 counts, the overall decay in
fluorescence is 33.7% of the original value.

25
In vitro investigation
Experimental
In vitro Raman instrument
The device used to collect Raman spectra of samples in vitro
(schematic shown in Figure 7) employs a gallium arsenide external cavity
diode laser to produce an excitation of 785 nm at 450 mV. The laser
primarily produces a wavelength of 785 nm, but because the Raman
signal is so weak, a filter is used to ensure that no additional light even
near 785 nm reaches the detector[4]. The light then passes through a lens
used to narrow the diameter of the laser spot to 200 µm, and is reflected
by a mirror angled at 45º to normal. After passing through a small hole in
the mirror, the light reaches the sample at normal incidence. Solid and
liquid samples can both be accommodated using the apparatus. Solid
samples such as powders were placed in wells within the plate, which
were then placed under the laser, whereas liquid samples were placed in
a 2 mL glass cuvette, which was then positioned under the laser by use of
a customized holder. Occasionally, small bubbles arose to the top of the
cuvette, and in this event, the cuvette was tapped to let the bubbles
escape, to ensure that the spectrum was not affected.

26
Figure 7: Schematic diagram of in vitro Raman spectroscopy device optical layout.
Any light from scattering or fluorescence emitted upward is
reflected by a mirror facing downward in the direction of the spectrograph.
A focusing lens is used to reorient the direction of the broad emission,
such that the light beams parallel. The light then passes through a notch
filter, which blocks the higher energy component of the signal including the
Raleigh line, so that it does not affect the Raman features[4]. A refocusing
lens then narrows the broad parallel signal into a small spot, so it can pass
through a small slit to reach the Kaiser f/1.4 Holospec spectrograph. The
spectrograph disperses the light to the Roper Scientific/PAR CCD camera,
where it is quantified and converted into a data form that is sent to a
computer for processing[21]. The CCD camera is cooled using liquid
nitrogen to maintain a temperature of -196 ºC to improve the signal-to-
noise ratio.
WinSpec32 is the software used to operate the Raman device, set
up experiments, and visualize the raw spectra that are produced. Various
27
aspects of each experiment can be controlled, including the number of
spectra collected, the number of exposures, and the length of exposure.
Typically, longer experiments yield a higher signal-to-noise ratio[18]. While
generally it would be ideal to perform long experiments on all samples,
because some substances have been observed to photobleach and
recover, in many experiments several successive spectra, each obtained
over a short period of time, were collected. The changes in fluorescence
between short intervals can be observed over a long period of time as a
result of exposure, rather than collecting one spectrum providing
information regarding the length of time as a whole, revealing nothing
about incremental changes. Further data analysis was performing using
the software OriginPro 8.
In vitro experiment protocol
Experiments were performed to ascertain the spectroscopic
properties of L-glutathione, uric acid, β-carotene (the precursor to vitamin
A), cholecalciferol (a form of vitamin D), L-ascorbic acid (vitamin C), and ±-
α-tocopherol (a form of vitamin E). To understand the contribution of these
substances to the emission from human tissue resulting from NIR
exposure, these experiments were designed to simulate physiological
conditions by studying the Raman and fluorescence features of these
compounds at different concentrations, relative to their respective normal
concentrations in blood, interstitial fluid, or skin.
Different concentrations of each sample were made by creating a

28
stock solution, either saturated or of a high enough concentration that the
solution itself could be accurately made, followed by a series of dilutions. It
was important to obtain spectra at different concentrations, because not
only is it essential to determine whether or not a sample fluoresces, but
also, if a particular substance does fluoresce, to establish a means to
quantify its contribution to the overall fluorescence. Moreover, many other
variables (such as turbidity) must be taken into account, which are best
identified by obtaining spectra of compounds at different concentrations.
The cuvette in which the solutions are held also fluoresces, and there are
often losses of emission due to self-absorption, as well as scattering,
which can lead to ambiguous spectroscopic observations.
While an attempt was made to include data on all compounds at
their physiological concentration, it was believed that some concentrations
were too low to be detected by the CCD, so greater concentrations were
used. At each concentration for each compound, ten-minute experiments
to produce a single spectrum were performed. From the spectra, the
features of different substances were compared, along with differences
due to concentration of a single compound. The concentrations of the
antioxidants and vitamins used are displayed in Table 1.

29
Table 1: Experimental concentrations and physiological concentrations (in blood, interstitial fluid, or skin) of antioxidants studied.
Name Solvent Physiological
Concentration[2
2]
Experimental Concentrations (mM)
L-Ascorbic Acid Deionized water
50-60 µM 187.5, 7.5, 0.3, 0.06
Reduced Glutathione
Deionized water
≈1.09 mM 81.25, 3.25, 0.65
Uric Acid Deionized water*
234-456 µM Saturated, 0.8, 0.4
Cholecalciferol Cyclohexane 40-80 nM 6.25, 0.25, 1.0×10⁻², 4×10⁻⁴, 8×10⁻⁵
β-carotene Cyclohexane 1.23-1.75 µM 3.13, 1.56, 0.78, 0.13 ±-α-tocopherol Cyclohexane ≈24 µM 1.25, 0.16, 0.05 Due to solubility difficulties encountered, only a close approximation of the concentrations of β-carotene solutions were made. A saturated solution of
uric acid of unknown concentration was analyzed. *Uric acid was dissolved in NaOH in deionized water solution at pH≈ 8.
Solubility was a recurring obstacle throughout these experiments.
Vitamins are generally divided into two categories: water-soluble and fat-
soluble. Therefore, as expected, only two substances analyzed (ascorbic
acid and reduced glutathione) were soluble in deionized water at room
temperature. The organic solvent cyclohexane (ACS spectrophotometric
grade, ≥99%, Sigma-Aldrich) was chosen for the experiments for the fat-
soluble vitamins. While ±-α-tocopherol and cholecalciferol did successfully
dissolve in cyclohexane, β-carotene and uric acid presented solubility
issues. Therefore, saturated solutions of these compounds were prepared
(β-carotene in cyclohexane and uric acid in NaOH in water solution pH≈8),
of which the concentrations could only be estimated, as some solid
particles were still visible. A saturated solution of β-carotene was decanted
from the insoluble particles, and dilutions were then subsequently
30
performed. For uric acid, a saturated solution was first prepared in addition
to 0.8 mM and 0.4 mM solutions.
Similar experiments were performed with the pigment melanin,
which presented an even more complex solubility dilemma. Melanin is
reported to be slightly soluble in water, but this varies due to its complex
structure[4]. Therefore, various dissolution and filtration steps were taken.
Synthesized eumelanin, a dark brown powder (Sigma-Aldrich), was added
to water to form a very dark, opaque, grey-brown solution, with solid
particles resting at the bottom of the beaker; these were broken into
smaller particles using a glass rod. Using a 100 nm Whatman syringe-
filter, the solution was filtered to yield a clear solution. However, after this
mixture was allowed to rest in the refrigerator for four months, a great deal
of what appeared to be solid insoluble melanin had settled to the bottom of
the beaker, while a clear yellow solution remained as the supernatant. This
supernatant was extracted from the insoluble particles. When this solution
was filtered, some of the color was lost, but the solution retained its yellow
tint. It was believed that, over time, some of the melanin had broken down
into smaller, soluble units that would not present any loss of signal due to
elastic scattering, i.e. turbidity (the cloudiness caused by large insoluble
particles). This final melanin solution, labeled the “stock” solution, was
then diluted to various concentrations (10%, 20%, 50%, 60%, and 80% of
stock solution) and each solution was then analyzed. Because of the initial
filtration of melanin, neither the molar concentration nor the concentration
31
by mass could be estimated. For each concentration sample, thirty-minute
measurements were performed to obtain Raman spectra.
By studying the spectra of various substances in vitro, several key
determinants of interest were measured. Whether or not a substance
fluoresces as a result of NIR excitation was identified by a spectrally broad
emission apparent on its spectrum. Should the species not fluoresce, it is
important to note that, while they may have distinctive Raman features,
these substances likely do not contribute to fluorescence and
photobleaching in human fingertips. Based on the fluorescence results,
melanin was the only substance which was studied in terms of the
dependence of fluorescence on concentration, as well as on the
processes of photobleaching and recovery.
The dependence of fluorescence on the concentration of melanin
was determined by plotting the integral of the fluorescence as a function of
concentration. This can be useful for quantifying the contribution of a
particular substance to the total fluorescence in vivo. The integrated
fluorescence of the four different concentrations of melanin was plotted
The next goal was to determine whether or not melanin
photobleached, and if it did, to gain an idea of the kinetics of the process.
If a substance photobleaches, the total fluorescence of the sample
decreases over time as a result of prolonged laser exposure. Using the
filtered saturated solution of melanin, over the course of an hour, thirty
two-minute spectra were collected. The integral of the fluorescence of

32
each measurement was then included as a single point on an integrated
fluorescence vs. time plot, and any decay in fluorescence was apparent.
Finally, once melanin was found to fluoresce and photobleach, the
next task was to find if the substance recovers its fluorescent properties
following photobleaching. This was ascertained by first performing an
experiment identical to the one previously described above to monitor the
photobleaching of a substance over a period of time. Then, while leaving
the sample in place and keeping the room lights off, the laser was blocked,
and the sample was left in the dark for varying amounts of time, two hours
or twelve hours. The experiment of collecting thirty two-minute spectra
over short intervals was then repeated. By comparing the two
experiments, it was apparent if the substance had recovered after it had
been photobleached, and by how much after a given length of time.
It is important to note that any solvent, including water and
cyclohexane, can produce emission[10]. The spectra of pure cyclohexane
and deionized water are displayed in Figure 8. While water has a fairly
weak emission (allowing Raman spectroscopy to be ideal for in vivo
studies) the signal for cyclohexane is quite strong, the baseline being over
double the overall signal of water, with several strong features, due to C–C
and C–H vibrational modes[9]. There is also signal that is detected by the
camera even there is no laser excitation, known as dark current, which
affects the spectra in a similar way, though dark current was not
subtracted from the spectra in Figure 8. Water, cyclohexane, and the

33
cuvette all have not been observed to photobleach.
200 400 600 800 1000 1200 1400 1600 1800
0.0
5.0x10⁶
1.0x10⁷
1.5x10⁷
2.0x10⁷
2.5x10⁷
3.0x10⁷
Ph
oto
n C
ou
nts
Raman shift (cm-1)
Water
Cyclohexane
Figure 8: Emission spectra of pure cyclohexane and deionized water.
Due to the fact that each of the species of interest are present in
relatively low concentrations, the emission due to water can cause the
data to be misleading, since prominent features can be the result of the
solvent instead of the solutes, which can also mask their key features. For
this reason, when possible, the raw data are paired with those from which
the corresponding solvent spectrum has been subtracted, a technique
called “baseline subtraction”, so that signal due to the solute can be
isolated and characterized. However, when a clean subtraction was not
possible (commonly encountered with cyclohexane as the solvent) only
the raw data are shown.

34
Results
Antioxidants
The emission spectra of L-ascorbic acid depicted in Figure 9 show
a pattern that was often observed during these experiments. From the raw
spectrum, it appears that each emission follows the general trend set by
the background combined emission of the cuvette and water solvent,
involving a greater signal sloping downwards from 300 to 1000 cm-1, with
broad gentle peaks at 430, 605, 790 and 1640 cm-1. However, it is clear,
most evidently from the baseline subtracted spectra, that L-ascorbic acid
produces emission in addition to that of water. The L-ascorbic acid
spectrum at a concentration of 187.50 mM displays many sharp vibrational
modes of the molecule, but no fluorescence. However, if the concentration
is decreased by a factor of 25 or more, most of these features all but
disappear. While they do all produce a steady emission that is greater
than water, it appears that solutions of the three lower concentrations do
not exhibit strong Raman features. Given that overall emission from the
data increases in the order, by sample, of 0.06 mM, 7.50 mM, and 0.03
mM, it is believed that L-ascorbic acid does not produce significant signal
at such low concentrations, and any differences in the spectra could be a
result of differences in the placement of the cuvette. It is concluded that, at
its physiological concentration, L-ascorbic acid is not a significant
contributor to the fluorescence of human tissue.

35
400 600 800 1000 1200 1400 1600 1800
0.0
2.0x10⁵
4.0x10⁵
6.0x10⁵
400 600 800 1000 1200 1400 1600 1800
1.5x10⁶
2.0x10⁶
2.5x10⁶
3.0x10⁶
Ph
oto
n c
ou
nts
Raman shift (cm-1)
0.06 mM
0.30 mM
7.50 mM
187.50 mM
Ph
oto
n c
oun
ts
Raman shift (cm-1)
0.06 mM
0.30 mM
7.50 mM
187.50 mM
Water
Figure 9: Subtracted (top) and raw non-subtracted (bottom) spectra of L-ascorbic acid at varying concentrations from 300-1800 cm-1. It is noted
that while the spectra at the highest concentration exhibit many noticeable vibrational features, at concentrations of 7.50 mM and less, most are
hardly distinguishable. It has been previously documented that β-carotene has a strong
resonance Raman spectrum, and is also known to be highly absorptive in
the visible spectrum, hence its function as a pigment[23]. However, it
appears, from these experiments performed, that β-carotene does not
fluoresce as a result of NIR excitation. The spectra displayed in Figure 10
reveal that β-carotene produces very strong Raman emission centered at
1010, 1155, and 1520 cm-1, smaller peaks at 950 and 1180 cm-1, and
weak emission underlying from 800 to 1620 cm-1. As shown in Appendix A,
the integral of the peak centered at 1520 cm-1 was plotted as a function of

36
concentration, and it was found that there does appear to be a linear
dependence (slope = 1.234×10⁸, R2 = 0.935, and standard error =
1.853×10⁷). This pattern holds true for the additional Raman signals. While
it is shown that the Raman emission of the substance increases linearly
with concentration, it is apparent that β-carotene does not fluoresce as a
result of NIR excitation, and therefore must also not be a contributor to
human tissue fluorescence.
400 600 800 1000 1200 1400 1600 1800
0
1x10⁷
2x10⁷
3x10⁷
4x10⁷
400 600 800 1000 1200 1400 1600 1800
2.0x10⁷
4.0x10⁷
6.0x10⁷
8.0x10⁷
Ph
oto
n c
ou
nts
Raman shift (cm-1)
3.125 mM 1.562 mM 0.781 mM 0.125 mM
Ph
oto
n c
oun
ts
Raman shift (cm-1)
3.125 mM
1.562 mM
0.781 mM
0.125 mM
Cyclohexane
Figure 10: Subtracted (top) and raw non-subtracted (bottom) spectra of β-carotene in cyclohexane at varying concentrations. The peak at 1040 cm-1
extends to nearly 1×10⁸ counts, while the peak at 800 cm-1 extends to nearly 1.6×10⁸ counts.
The remaining spectra of antioxidants are included in the
appendices. Reduced glutathione (spectra shown in Appendix B) follows a
37
trend similar to that of L-ascorbic acid, but to a lesser extent. Most of the
Raman emission from the glutathione solutions follows the water baseline,
but it is apparent that there is additional emission due to the solute. There
appears to be no fluorescence emission. At the highest concentration
(81.25 mM), there is a steady Raman emission throughout the 300-1500
cm-1 range, with several peaks. The spectra of the two lowest
concentration solutions show very little difference both from water and
from each other. However, it can be noted on the subtracted spectrum of
the 3.25 mM solution that there are some peaks (500, 610, 800, 1040, and
1430 cm-1) corresponding to those on the spectrum of the 81.25 mM
solution; these have been significantly broadened as a result of the low
concentration. As expected, it appears that the signal increases as the
glutathione concentration increases, but the signal is so weak at
physiological concentration that it is nearly impossible to distinguish it from
water. Glutathione, despite being at the highest physiological
concentration of all the antioxidants studied, is also not a likely contributor
to tissue fluorescence.
Uric acid produces only minimal emission in addition to the
background signal and does not seem to fluoresce, but the spectra
produced (displayed in Appendix C) present a somewhat interesting
pattern. The overall signal appears to decrease rather than increase as
the concentration of uric acid increases. This phenomenon indicates that
there must have been a signal loss whose effect strengthened as the

38
concentration of uric acid particles increased. While loss of signal is often
a result of absorption, it appears that this scattering loss may have been
caused by the turbidity of the solution.
Turbidity involves the suspension of undissolved particles, and
because uric acid is relatively insoluble in water, which was somewhat
resolved by increasing the pH of the solution, it is possible that the uric
acid solid did not fully dissolve. These relatively large particles scatter light
more effectively than the small dissolved particles, and resulting in a
decrease in emitted light. Because there were likely more of these large
particles at the higher concentrations, because the solution was not
filtered, it is believed that the increased turbidity at high concentrations
reduced the signal. Different placements of the cuvette may have also
affected the spectra of uric acid at low concentrations. Nonetheless, the
signal at physiological concentration is so weak that it is not likely that uric
acid contributes to NIR tissue fluorescence.
Just as for uric acid, it was observed from the spectra of ±-α-
tocopherol (a viscous yellow oil), which is displayed in Appendix D, that
the overall signal increased as the concentration decreased. While it is
possible that turbidity and a loss by scattering could have affected the
signal, this is believed to be unlikely, because ±-α-tocopherol did not seem
to present any solubility difficulties. The trend may have been the result of
a loss by absorption; or, because the difference appears to be so minute,
a difference in the placement of the cuvette, which also fluoresces

39
significantly, could have affected the spectra. There appears to be very
little Raman signal beyond the cyclohexane emission, and there is no
apparent fluorescence.
The spectra of cholecalciferol, displayed in Appendix E, reveal
Raman emission characteristic of the molecule. While the signals of the
four lowest concentrations appear to overlap, the spectrum of the highest
concentration (6.250 mM) of cholecalciferol solution throughout the region
of interest shows a constant 1×10⁵ counts higher than the others. This is
possibly due to a difference in the position of the cuvette. Independent of
this, there do appear to be regions in which cholecalciferol produced
Raman emission, such as near 333 and 1100 cm-1, but most notably at
1650 cm-1. Cholecalciferol clearly possesses vibrational modes that
produce Raman emission, but, once again, no fluorescence is apparent.
Melanin
Melanin was found to be the first of the selected samples to exert
significant fluorescence as a result of NIR excitation. The spectra of
melanin at various concentrations relative to the stock solution are
depicted in Figure 11. From the raw data, it can be seen that each melanin
sample follows the general trend and shape of the signal produced by
water, much as was observed for the other water-soluble antioxidants.
However, unlike the water soluble antioxidants, there is significant signal
in addition to that of water, which is most apparent in the baseline
subtracted spectra. Rather than displaying peaks of energies of limited

40
range, which is the case for emission by Raman scattering, this emission
is across the entire 300-1900 cm-1 region of the spectrum. The strongest
fluorescence emission is located in the middle of the region (600-1000
cm-1) and slopes downward towards both higher and lower energies. This
broad feature, consistently produced, can be a result only of melanin
fluorescence.
400 600 800 1000 1200 1400 1600 1800
4x10⁶
5x10⁶
6x10⁶
7x10⁶
400 600 800 1000 1200 1400 1600 1800
0.0
4.0x10⁵
8.0x10⁵
1.2x10⁶
1.6x10⁶
Ph
oto
n c
ou
nts
Raman shift (cm-1)
DI Water
10% Stock
20% Stock
50% Stock
60% Stock
80% Stock
Stock
Ph
oto
n c
oun
ts
Raman shift (cm-1)
10% Stock
20% Stock
50% Stock
60% Stock
80% Stock
Stock
Figure 11: Raw non-subtracted (top) and subtracted (bottom) spectra of
melanin in deionized water at varying concentrations. Because significant mass did not dissolve, absolute concentrations could not be determined, and relative concentrations are instead shown. Strong fluorescence that increases with concentration is evident across nearly the entire region.
Not only is it evident from these spectra that melanin fluoresces, but
also it is apparent that there is a direct relationship between the overall
fluorescence and the concentration of melanin, with striking linearity. The

41
integral of the region across which the melanin fluoresces was set as a
function of concentration, yielding the plot displayed in Figure 12. The
linear regression (R2=0.998) serves as an effective model for the
relationship between fluorescence and the concentration of melanin.
0.0 0.2 0.4 0.6 0.8 1.0
0.0
2.0x10⁸
4.0x10⁸
6.0x10⁸
8.0x10⁸
1.0x10⁹
B
Linear Fit of B
Inte
gra
ted c
oun
ts
Concentration
Equation y = a + b*x
Weight No Weightin
Residual Sum of Squares
9.59231E14
Adj. R-Square 0.99784
Value Standard Error
B Intercept 3.4866E7 1.24472E7
B Slope 9.67455E 2.0104E7
Figure 12: Integral of fluorescence as a function of relative concentration. Integration of melanin spectra was performed across the region 220-1928
cm-1, the region displayed in Figure 11. Linear fit was applied, and statistics on fit are displayed.
Once it was identified that melanin does in fact fluoresce (the
magnitude of which depends on its concentration in solution), the
subsequent experiments assessing photobleaching and recovery were
performed yielding the plot shown in Figure 13. From the fluorescence vs.
time curve labeled “bleaching process,” it is clear that the fluorescence of
melanin decreases over time. There was a sharp decrease in fluorescence
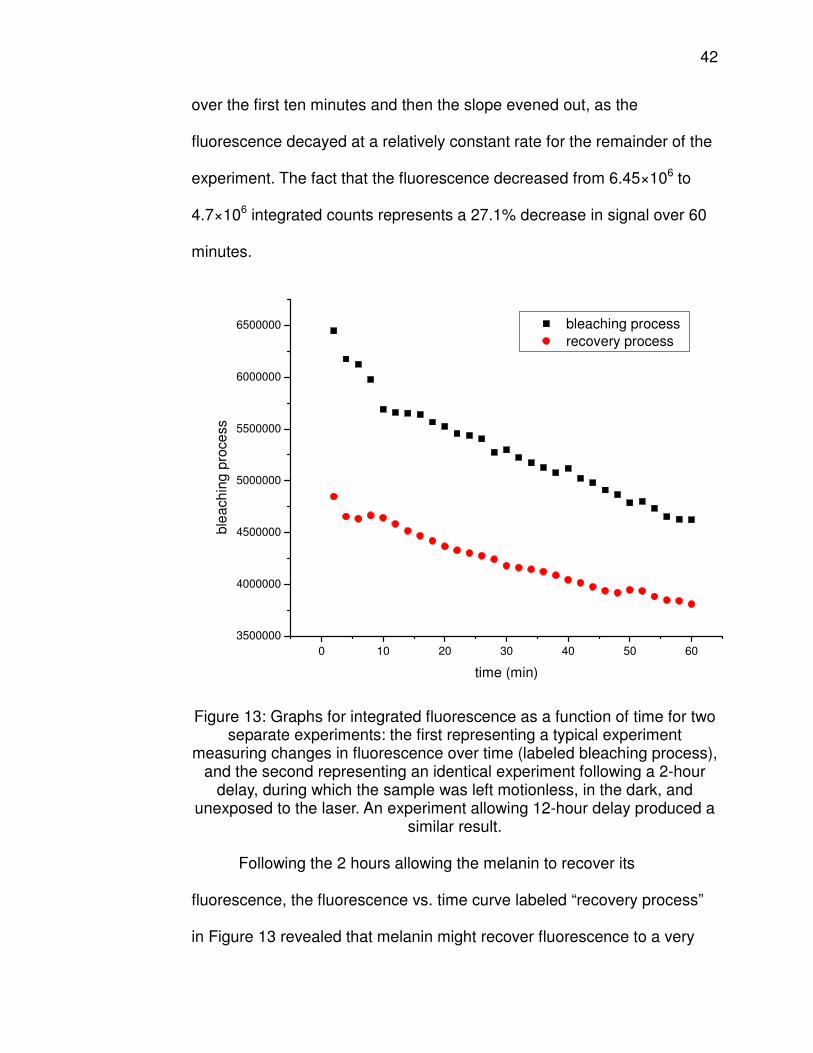
42
over the first ten minutes and then the slope evened out, as the
fluorescence decayed at a relatively constant rate for the remainder of the
experiment. The fact that the fluorescence decreased from 6.45×10⁶ to
4.7×10⁶ integrated counts represents a 27.1% decrease in signal over 60
minutes.
0 10 20 30 40 50 60
3500000
4000000
4500000
5000000
5500000
6000000
6500000 bleaching process
recovery process
ble
ach
ing
pro
ce
ss
time (min)
Figure 13: Graphs for integrated fluorescence as a function of time for two separate experiments: the first representing a typical experiment
measuring changes in fluorescence over time (labeled bleaching process), and the second representing an identical experiment following a 2-hour
delay, during which the sample was left motionless, in the dark, and unexposed to the laser. An experiment allowing 12-hour delay produced a
similar result.
Following the 2 hours allowing the melanin to recover its
fluorescence, the fluorescence vs. time curve labeled “recovery process”
in Figure 13 revealed that melanin might recover fluorescence to a very

43
small degree. It appears there might have been a slight recovery, as the
fluorescence of the point at t=2 min was approximately 4.85×10⁶
integrated counts, an increase of 3.2% from the final value of 4.7×10⁶
integrated counts from the bleaching process curve. This short, sharp
decrease in fluorescence was followed by a steady decay that continued
for the duration of the experiment. Also, from this curve it is clear that
using the laser excitation of 785 nm at 450 mW, a fresh melanin solution
does not fully photobleach after 60 minutes, for there is an additional
decrease of 13.9% in fluorescence from the original fluorescence of
6.45×10⁶ counts. With two hours of laser exposure, combined with no
significant recovery during the 2 hour gap, it is possible that melanin may
continue to decrease in fluorescence beyond this time span.
Discussion
All tissues in an organism are under oncotic pressure, a type of
osmotic pressure that exists across physiological compartments as a
result of electrostatic gradients, the pressure exerted within the circulatory
system, and hydrostatic pressure as a result of gravity[20]. Given these
conditions, this study sought to determine the timescale of possible fluid
equilibration due to changing body posture, defined as hydrostatic
relaxation, while in contact with the LighTouch® device.
Using the red blood cell data plotted by an integration of the
Raleigh line, it is clear that the volume fraction of RBCs remained
relatively constant during each of the three trials. Also, it appears that the

44
RBC volume fraction was nearly identical for trials A and B, but was
significantly higher for trial C. Given that the overall integrated
fluorescence (BV) of C is higher than that of both A and B, this would
corroborate with the notion that elastic emission decreases as RBC
concentration increases. Therefore, it appears likely that there was more
blood present in the irradiated volume for measurement C than for
measurements A and B, which likely was a result of the hydrostatic
relaxation exercises which were intended to re-equilibrate and redistribute
fluids.
According to Figure 5, while the volume fraction of RBCs remained
were nearly the same and remained constant throughout A and B, the
same blood did not remain in the irradiated area throughout the course of
the two trials. Blood circulates, and oxygenated blood replaces
deoxygenated blood to maintain the oxygen supply to all cells. Therefore,
over the course of A and B, there was no net change in blood volume.
Both the RBC and BV data show evidence of pulsing throughout each of
trials A, B and C. It appears that, since B immediately succeeded A, any
photobleaching of tissue occurred over the course of A, for any decrease
in fluorescence during B was insignificant compared to the decay
observed in A.
This evidence is complemented by the results obtained from the BV
data from the fluorescence recovery experiment, depicted in Figure 6.
Once it became clear that the laser had an effect on the tissue within the

45
irradiated volume, this experiment was designed to probe how long and to
what degree the tissue could recover its fluorescent properties after being
exposed to NIR light for a period of time. It became evident that, because
fresh blood had certainly been circulated through the irradiated volume,
the chemical changes induced by the laser are not appreciably reversed
when laser exposure is terminated over the period of time that blood is
replenished.
If blood were the species that was being photobleached, the
photobleached blood would be replaced by fresh non-photobleached
blood, and the overall fluorescence would have remained high over the
course of any typical experiment, instead of exhibiting a continuous
decrease. Given the time to fully ensure the blood had circulated for
measurement B, the lack of significant recovery of fluorescence, after
blocking the laser, supports the idea that a substance other than blood
must photobleach. It is clear that the presence of the laser upon the
exposed tissue is solely responsible for the photobleaching effect, and
differences in hydrostatic pressure seem to have little impact. Since the
decay is still quite evident even when fresh blood is always being
circulated, it is apparent that the species responsible for the
photobleaching effect is not contained within blood, but within the static
tissues.
From these experiments, it has been shown that a substantial
fraction of the decay in fluorescence is not a result of blood movement, but

46
instead is the result of a change in the fluorescent properties of the static
tissues. Fluorescence regularly decays from 15-20%, and even up to 33%,
depending on the individual. This change in fluorescence, which is not a
result of blood movement, severely challenges the accuracy of the
noninvasive in vivo determination of blood glucose concentration, because
the model for achieving this depends on the assumption that a change in
fluorescence represents a change in blood volume. These data suggest
that a “pre-bleaching” phase is advisable, in which time is allowed for the
finger to be exposed to the laser so that any photobleaching of the static
tissues may occur. This seems to be a relatively effective technique that
has been experimentally shown to reduce the effect of photobleaching and
to improve blood glucose measurements. These results also prompted the
in vitro experiments to ascertain which substances in static tissue undergo
a chemical change into products that are less fluorescent.
While it was originally hypothesized that several of the most
common antioxidants might fluoresce as a result of NIR excitation, it
became clear that this is not the case. In summary, not one of the six
antioxidants studied fluoresce as a result of near-infrared excitation.
Antioxidants do possess loosely held electrons that are essential to their
function to sequester reactive oxygen species[6], but it appears that an
excitation by a photon in the NIR region does not provide enough energy
to promote them to an excited quantum state such that the molecule could
exhibit subsequent fluorescence. While it does seem that each of these

47
substances do undergo Raman scattering, producing emission
characteristic of their structures, the emission of these compounds at their
physiological concentrations both individually and collectively is far too
weak to be responsible for the photobleaching that causes a decay of up
to 33.7% of the original fluorescence signal.
Since there is very little literature regarding Raman spectroscopy
and these substances, these findings serve an important purpose. There
are innumerable substances in blood and in static tissue, so it is extremely
difficult to isolate those which contribute to the fluorescence observed from
the tissue of the volar side of fingertips. As previously stated, it is vital to
the use of Raman spectroscopy to determine blood glucose concentration
that the assumption that fluorescence is associated with blood volume,
and specifically that any changes in fluorescence are a result of
movement of blood, remains true. Since the photobleaching of static
tissue weakens the merit of this premise, it is clearly necessary to
determine which substances do, in fact, contribute to the regular decay of
at least 15-20% of the total fluorescence signal. It is also useful, however,
to identify the substances that do not fluoresce nor photobleach.
Narrowing down the list of potential candidates, and learning more about
specific Raman characteristics of certain compounds, are important to the
overall effort to recognize the contribution of substances to tissue
fluorescence.
The in vitro studies of melanin reveal that it fluoresces as a result of

48
NIR excitation and does so linearly as a function of concentration. The fact
that the fluorescence of melanin decreases as exposure is prolonged
strongly suggests that it undergoes a laser-induced chemical change to a
less fluorescent form. It has been observed that the oxidation state of
melanin affects its UV-Vis emission[24]. While it is believed that these are
the first reports of NIR-excited emission spectra of melanin, the oxidation
state may also be a factor in its fluorescence as a result of NIR excitation.
The relatively small recovery by melanin, which is similar to what is
observed in vivo, means that melanin, as it exists in skin, could possibly
contribute to the photobleaching of tissues and interfere with the ability to
accurately determine blood glucose concentration.
It must be noted that the synthesized eumelanin studied using
spectroscopy in vitro is very different from melanin in vivo. Melanin, which
functions as a skin pigment, is located throughout cells called
melanocytes. In these cells, the structure of melanin is of a very complex
nature, and can vary among individuals. These differences in structure are
compounded by mechanisms that ultimately result in varying skin tones.
There are many proposed models that predict a possible structure of
melanin as it exists in vivo, but these are yet to be verified[7]. To reproduce
melanin as it exists in the tissue of the volar side of human fingertips is a
very difficult task. It was originally found that melanin was virtually
insoluble in water, but in this study, as time progressed, observations of
the solution one week, one month, and four months after the creation of
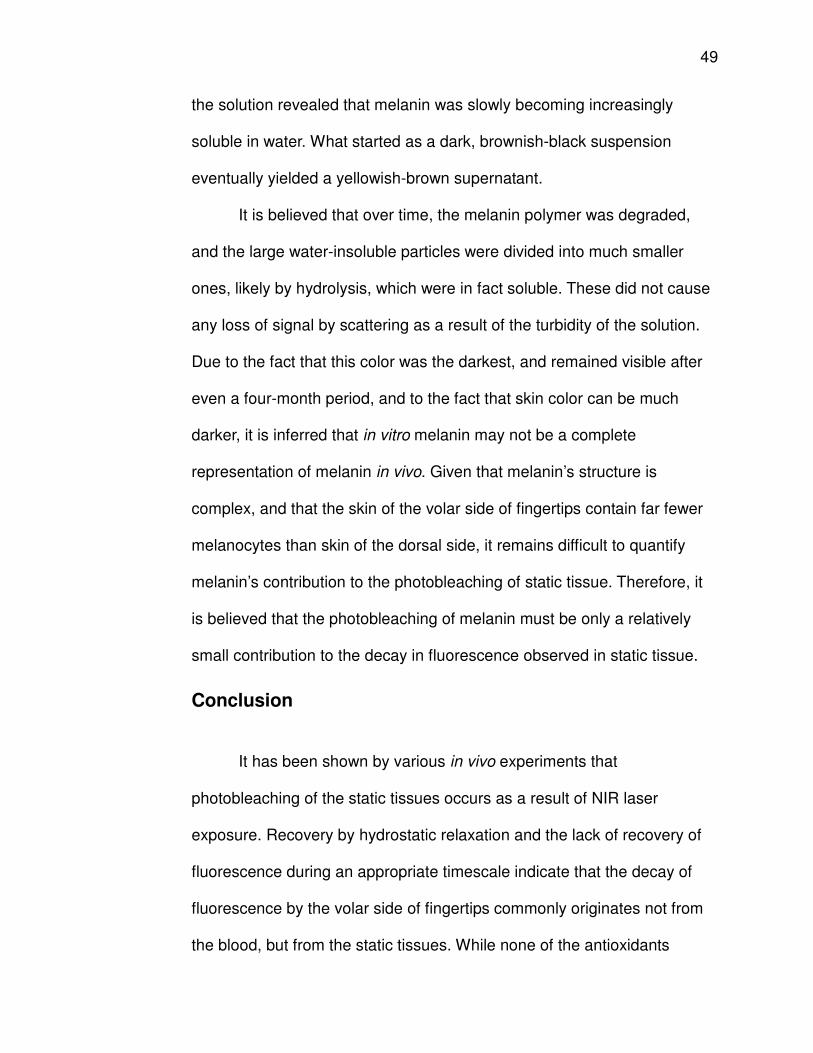
49
the solution revealed that melanin was slowly becoming increasingly
soluble in water. What started as a dark, brownish-black suspension
eventually yielded a yellowish-brown supernatant.
It is believed that over time, the melanin polymer was degraded,
and the large water-insoluble particles were divided into much smaller
ones, likely by hydrolysis, which were in fact soluble. These did not cause
any loss of signal by scattering as a result of the turbidity of the solution.
Due to the fact that this color was the darkest, and remained visible after
even a four-month period, and to the fact that skin color can be much
darker, it is inferred that in vitro melanin may not be a complete
representation of melanin in vivo. Given that melanin’s structure is
complex, and that the skin of the volar side of fingertips contain far fewer
melanocytes than skin of the dorsal side, it remains difficult to quantify
melanin’s contribution to the photobleaching of static tissue. Therefore, it
is believed that the photobleaching of melanin must be only a relatively
small contribution to the decay in fluorescence observed in static tissue.
Conclusion
It has been shown by various in vivo experiments that
photobleaching of the static tissues occurs as a result of NIR laser
exposure. Recovery by hydrostatic relaxation and the lack of recovery of
fluorescence during an appropriate timescale indicate that the decay of
fluorescence by the volar side of fingertips commonly originates not from
the blood, but from the static tissues. While none of the antioxidants

50
studied were observed to fluoresce and photobleach as a result of NIR
excitation, melanin was shown to exhibit these effects, indicating it could
be a possible contributor to the overall photobleaching, and providing
insight into the light-induced chemistry that occurs as a substance is
photobleached.
References
[1] American Diabetes Association. Standards of medical care in diabetes. Diabetes Care, 2008. Vol. 31. Suppl 1:S12–S54
[2] Benjamin, Evan M. Self-Monitoring of Blood Glucose: The Basics.
Clinical Diabetes, 2002. Vol. 20(1): p. 45-47. [3] Khalil, O.S., Non-invasive glucose measurement technologies: an
update from 1999 to the dawn of the new millennium. Diabetes Technol Ther, 2004. Vol. 6(5): p. 660-97.
[4] Deng, B., Wright, C., Lewis-Clark, E., Shaheen, G., Geier R. and Chaiken, J.. Direct noninvasive observation of near infrared photobleaching of autofluorescence in human volar side fingertips in vivo. Proc. SPIE, 2010, Vol. 7560-24.
[5] Chaiken, J., et al. Noninvasive in-vivo tissue-modulated near-infrared
vibrational spectroscopic study of mobile and static tissues: blood chemistry. Proc. SPIE, 2000, Vol. 3918: p. 135-143.
[6] Masaki, H. Role of antioxidants in the skin: Anti-aging effects. J.
Dermatol. Sci, 2010. Vol. 58(2): p. 85-90. PMID: 20399614. [7] Watt, A., J. Bothma, and P. Meredith. The supramolecular structure of
melanin. Soft Matter. 2009. Vol. 5: 3754–3760.
[8] Blackwell, J., et al., In vivo time-resolved autofluorescence measurements to test for glycation of human skin. J Biomed Opt, 2008. Vol. 13(1): p. 014004.
[9] McCreery, R.L.. Raman Spectroscopy for Chemical Analysis. Volume
157 in Chemical Analysis: A Series of Monographs on Analytical Chemistry and Its Applications. Ed. Wineforderner, J.D. New York: John Wiley & Sons Inc., 2000, p. 2-20.

51
[10] Smith, Ewen, and Geoffrey Dent. Modern Raman spectroscopy: a practical approach. 1st Ed. Chichester, England: John Wiley & Sons Ltd., 2005. p. 1-20.
[11] Tinoco, I., et al. Phyiscal Chemistry: Principles and Applications in Biological Sciences. 4th ed. Upper Saddle River, New Jersey: Prentice Hall, 2002. 554-579.
[12] Chaiken, J., et al. Noninvasive blood analysis by tissue modulated
NIR Raman spectroscopy. Proc. SPIE, 2001, Vol. 4368, 134-145. [13] Chaiken, J., et al. Noninvasive, in-vivo, near infrared vibrational
spectroscopic study of lipid and aqueous phases of skin and near surface tissues. Proc. SPIE, 2000, Vol. 3907, 89-97.
[14] Chaiken, J., et al., Effect of hemoglobin concentration variation on the accuracy and precision of glucose analysis using tissue modulated, noninvasive, in vivo Raman spectroscopy of human blood: a small clinical study. J. Biomed. Opt., 2005. Vol. 10(3): p. 031111.
[15] Chaiken, J., et al., Simultaneous, noninvasive observation of elastic scattering, fluorescence and inelastic scattering as a monitor of blood flow and hematocrit in human fingertip capillary beds. J. Biomed. Opt., 2009. Vol. 14(5): p. 050505.
[16] Berg, Jeremy M., John L. Tymoczko, and Lubert Stryer. Biochemistry.
6th ed. New York: W.H. Freeman and Company, 2007. 577-585. [17] Dyer, D.G, Blackledge, J.A., Thorpe, S.R., and Baynes, J.W.
Formation of Pentosidine during Nonenzymatic Browning of Proteins by Glucose. Journal of Biological Chemistry, 1991. Vol. 256(18). p. 11654-11660.
[18] Chaiken, J., et al. Instrument for near infrared emission spectroscopic probing of human fingertips in vivo. Review of Scientific Instruments 81, 034301, 2010.
[19] Chaiken, J., et al. Noninvasive in vivo tissue and pulse modulated
Raman spectroscopy of human capillary blood and plasma. Proc. SPIE, 2006, Vol 6093, 609305-1.
[20] Leyk, D., Eßfeld, D., Baum, K., & Stegemann, J. Influence of the
gravity vector on early time courses of leg blood flow during calf exercise. Proceedings 5th Eur. Symp. on 'Life Sciences Research in Space'. 1994. ESA SP-366: 275-279.

52
[21] Saxena, T., Chaiken, J., et al. Near Infrared Raman Spectroscopic
Study of Reactive Gliosis and the Glial Scar in Injured Rat Spinal Cords. Proc. SPIE, 2009, Vol. 7560-23.
[22] Lentner, C., Geigy Scientific Tables Vol. 3: Physical Chemistry,
Composition of Blood, Hematology, Somatometric Data. 8th ed. Geigy Scientific Tables. Vol. 3. 1984, West Caldwell, NJ: CIBA-GEIGY.
[23] Tschirner N., Schenderlein M., Brose K., Schlodder E., Mroginski M.A., Thomsen C., Hildebrandt P.. Resonance Raman spectra of beta-carotene in solution and in photosystems revisited: an experimental and theoretical study. Physical chemistry chemical physics, 2009. Vol. 11(48):11471-8 PMID: 20024418.
[24] Kayatz, P., et al., Oxidation causes melanin fluorescence. Invest
Ophthalmol Vis Sci, 2001. Vol. 42(1): p. 241-6.

53
Appendices
Appendix A: Plot of integrated signal from 1475-1650 cm-1 of beta carotene, and linear fit applied indicating dependence of signal strength on
concentration.
0.0 0.5 1.0 1.5 2.0 2.5 3.0 3.5
0.0
8.0x10⁷
1.6x10⁸
2.4x10⁸
3.2x10⁸
4.0x10⁸
B
Linear Fit of B
Inte
gra
ted c
oun
ts
Concentration (mM)
Equation y = a + b*x
Weight No Weighting
Residual Sum of Squares
3.44296E15
Adj. R-Square 0.93523
Value Standard Error
B Intercept 4.81766E7 3.31975E7
B Slope 1.23392E8 1.85355E7
54
Appendix B: Subtracted (top) and raw non-subtracted (bottom) spectra of reduced glutathione in cyclohexane at varying concentrations.
400 600 800 1000 1200 1400 1600
-1x10⁵
0
1x10⁵
2x10⁵
400 600 800 1000 1200 1400 1600
1.4x10⁶
1.6x10⁶
1.8x10⁶
2.0x10⁶
2.2x10⁶
Pho
ton c
ou
nts
Raman shift (cm-1)
0.65 mM
3.25 mM
81.25 mMP
hoto
n c
ounts
Raman shift (cm-1)
Water
0.65 mM
3.25 mM
81.25 mM

55
Appendix C: Subtracted (top) and raw non-subtracted (bottom) spectra of uric acid in cyclohexane at varying concentrations.
400 600 800 1000 1200 1400 1600 1800
0.00
2.50x10⁴
5.00x10⁴
7.50x10⁴
1.00x10⁵
400 600 800 1000 1200 1400 1600 1800
1.35x10⁶
1.50x10⁶
1.65x10⁶
1.80x10⁶
Ph
oto
n c
ou
nts
Raman shift (cm-1)
0.4 mM
0.8 mM
SaturatedP
hoto
n c
oun
ts
Raman shift (cm-1)
DI water
0.4 mM
0.8 mM
Saturated

56
Appendix D: Raw non-subtracted (bottom) spectra of ±-α-tocopherol at varying concentrations. Cyclohexane baseline subtraction did not occur
cleanly, and therefore, only raw data is shown.
400 600 800 1000 1200 1400 1600
0.0
2.0x10⁷
4.0x10⁷
6.0x10⁷
8.0x10⁷
1.0x10⁸
Ph
oto
n C
ou
nts
Raman shift (cm-1)
Cyclohexane
1.25 mM
0.16 mM
0.05 mM

57
Appendix E: Raw non-subtracted (bottom) spectra of cholecalciferol at varying concentrations. Cyclohexane baseline subtraction did not occur cleanly, and therefore only raw data are shown. The tops of the major
peaks (due to cyclohexane) extend to nearly 4×10⁷ counts.
200 400 600 800 1000 1200 1400 1600 1800
1.5x10⁶
2.0x10⁶
2.5x10⁶
3.0x10⁶
3.5x10⁶
4.0x10⁶
Ph
oto
n c
oun
ts
Raman shift (cm-1)
6.250 mM
0.250 mM 1×10⁻² mM 4×10⁻⁴ mM 8×10⁻⁵ mM
Cyclohexane
58
Capstone Summary
Diabetes mellitus affects millions of Americans and is one of the
most difficult conditions to manage. Characterized an inability maintain a
healthy blood glucose concentration, diabetes, if not properly handled, can
be potentially be fatal, as well as cause blindness, cardiovascular disease,
and foot ulceration. To ensure their blood sugar is at a healthy balance,
diabetes patients must monitor their blood glucose concentration several
times each day. The current commercial technology requires the invasive
procedure of extracting a sample of blood to determine their blood sugar
level, and diabetics must suffer from scarred and tender fingers. Our
technology at LighTouch Medical implementing Raman spectroscopy to
noninvasively determine blood glucose concentration in vivo may
someday relieve the pain of diabetes management, as well as provide
additional information about blood such as hematocrit.
The concentration of a particular substance is defined as an amount
per unit volume of that substance. Blood volume and the relative glucose
content of that blood volume can both be associated with certain features
of an emission spectrum of the volar (palmar) side of human fingertips,
allowing for the determination of blood glucose. When a monochromatic
laser in the near-infrared region of the spectrum 785 nm is shined onto a
sample, molecule-light interactions occur. The photons of different
wavelengths are quantified by a detector and processed by a computer to
yield an emission spectrum. There are two devices that are available for

59
experimentation consisting of virtually the same optical layout, involving a
laser, a detector, and various filters and lenses. The first allows for the
study of solid and liquid samples, and the second, the LighTouch® device,
is customized for the analysis of human fingertips.
The emission produced reflects upon specific interactions between
molecules and photons. Light can be scattered, in which a photon briefly
perturbs the electron cloud surrounding the molecule and is then reflected
into a different direction. In most cases, the photon is reflected at the same
energy upon incidence, called Raleigh scattering, but based on structural
features and vibrational modes of the molecule, the photon may be
reflected at a different energy (higher or lower) than then the incident
photon, a weaker process known as Raman scattering. Light can also be
absorbed by molecules, promoting the molecule to an excited electronic
state, if so, upon relaxation to the ground state, there will be an emission
of a photon, a process called fluorescence. Raman scattering is typified on
an emission spectrum by sharp narrow peaks, while fluorescence is
observed as a broad feature spanning over a wide range of energies. It
has been previously discovered that red blood cell volume can be
associated with Raleigh scattering, presence of glucose with a specific
Raman feature, and blood volume with fluorescence.
The integration of fluorescence is used to monitor blood volume
(BV) over the course of experiments, and the integration of the Raleigh
line for red blood cell content (RBC). For virtually all experiments, a
60
decline has been observed over the course of experiments until a steady
state is reached. One of the most important assumptions in our theory
behind the association of blood volume with fluorescence is that changes
in fluorescence are the result of blood movement. It was hypothesized that
blood volume was not the cause of the decay in fluorescence. To
investigate further, a series of experiments were performed.
First, because circulation of blood is so complex and depends on a
number of factors, three scans, measuring BV and RBCs, were performed
to ascertain the effect of hydrostatic relaxation (the process of achieving
fluid equilibration by stretching, muscle contraction/relaxation, etc.) on the
effect of fluorescence. The first scan was taken place after hydrostatic
relaxation exercises (A), the second was taken ten seconds after the first
experiment while the hand remained motionless to allow fresh blood to
circulate (B), and the third was taken following additional hydrostatic
relaxation and the finger placed in a slightly different position (C).
The BV curve for A demonstrated the decay in fluorescence until
the steady state was reached. The BV curve for B maintained
approximately the same steady state that was reached in A, and the curve
for C resembled that of A. The RBC measure of A and B were nearly
identical. Due to the fact that the BV curve of B was at the same level
reached at the end of A, even though blood had circulated, it is determined
that the decay in fluorescence must not be a result of movement of or
change in fluorescent properties of blood. An additional experiment which

61
demonstrated that there is little recovery of fluorescence over a dozen
cardiac pulses after photobleaching corroborated these results. It was
ultimately concluded that the source of the decay in fluorescence was
laser-induced chemistry, a process known as photobleaching, within static
tissue.
Antioxidants serve to protect essential cellular molecules from rapid
oxidation by reactive oxygen species by themselves undergoing
oxidation[6]. Since antioxidants contain loosely held electrons, which are
essential to their function as reducing agents of reactive oxygen species, it
was hypothesized might fluoresce and photobleach. Melanin has high
absorptive properties, rendering it ideal as a skin pigment. With such high
absorptivity, melanin became a candidate of interest as to its fluorescent
and photobleaching properties as well.
Solutions were made at different concentrations of melanin and the
following six antioxidants: L-glutathione, uric acid, β-carotene,
cholecalciferol, L-ascorbic acid and ±-α-tocopherol. To overcome
differences in solubility, some antioxidants were dissolved in cyclohexane,
and the others in deionized water. Melanin was allowed to rest in
deionized water for four months so that the polymer would break down
into smaller soluble particles. These solutions were scanned using the in
vitro Raman instrument. Ultimately, it was determined that none of the
antioxidants exhibited any fluorescence. Melanin, however, did fluoresce
in a manner than increased directly and linearly with concentration.

62
Given that melanin appeared to fluoresce, additional experiments
were performed to determine whether or not it photobleaches, and if so,
recovers its fluorescent properties over time. While melanin was exposed
to the laser, overall fluorescence was measured over short intervals. It
was observed that melanin did photobleach, and after leaving the melanin
motionless in the dark for two hours, by the same process, it was
determined that it did not substantially recover its fluorescent properties.
While the hypothesis that these antioxidants might fluoresce was
disproven, there was much learned by ruling out the possibility that
several substances are involved in the photobleaching of skin tissue.
There are innumerable substances in blood and in static tissue, and since
there is very little literature regarding the NIR Raman emission of these
substances, it is extremely difficult to isolate those which contribute to the
fluorescence observed from the tissue of the volar side of fingertips. It was
an essential first step towards sorting out which compounds do and do not
fluoresce, so that the problem of photobleaching can be properly
addressed.
The revelation of melanin’s fluorescence and photobleaching
provides an insight into the processes that account for photobleaching of
static tissue. Since melanin (contained in specialized pigment cells called
melanocytes) is relatively scarce on the volar side of fingertips, it is not
likely the prominent source of fluorescence and photobleaching. These
results, however, along with its complex structure which has yet to be

63
elucidated, arise many interesting questions.
Many factors, including the macromolecular structure, the oxidation
state, and its interaction with other biological molecules, are likely involved
with the fluorescence and photobleaching processes. These results
prompt further investigation as to the chemistry of melanin’s
photobleaching. Should this become clear, a greater understanding as to
the photobleaching of more prominent substances in the volar side of
human fingertips may be achieved, so that they may be appropriately
accounted for (such as by a pre-bleaching phase) to improve the accuracy
of the noninvasive in vivo blood glucose monitor.