Investigation of DSR Test Methods to Determine Binder Low ...
79
University of Nebraska - Lincoln DigitalCommons@University of Nebraska - Lincoln Nebraska Department of Transportation Research Reports Nebraska LTAP 8-2019 Investigation of DSR Test Methods to Determine Binder Low Temperature Properties Kommidi Santosh University of Nebraska-Lincoln, [email protected] Yong-Rak Kim University of Nebraska-Lincoln, [email protected] Follow this and additional works at: hps://digitalcommons.unl.edu/ndor Part of the Transportation Engineering Commons is Article is brought to you for free and open access by the Nebraska LTAP at DigitalCommons@University of Nebraska - Lincoln. It has been accepted for inclusion in Nebraska Department of Transportation Research Reports by an authorized administrator of DigitalCommons@University of Nebraska - Lincoln. Santosh, Kommidi and Kim, Yong-Rak, "Investigation of DSR Test Methods to Determine Binder Low Temperature Properties" (2019). Nebraska Department of Transportation Research Reports. 218. hps://digitalcommons.unl.edu/ndor/218
Transcript of Investigation of DSR Test Methods to Determine Binder Low ...
University of Nebraska - LincolnDigitalCommons@University of Nebraska - LincolnNebraska Department of Transportation ResearchReports Nebraska LTAP
8-2019
Investigation of DSR Test Methods to DetermineBinder Low Temperature PropertiesKommidi SantoshUniversity of Nebraska-Lincoln, [email protected]
Yong-Rak KimUniversity of Nebraska-Lincoln, [email protected]
Follow this and additional works at: https://digitalcommons.unl.edu/ndorPart of the Transportation Engineering Commons
This Article is brought to you for free and open access by the Nebraska LTAP at DigitalCommons@University of Nebraska - Lincoln. It has beenaccepted for inclusion in Nebraska Department of Transportation Research Reports by an authorized administrator of DigitalCommons@University ofNebraska - Lincoln.
Santosh, Kommidi and Kim, Yong-Rak, "Investigation of DSR Test Methods to Determine Binder Low Temperature Properties"(2019). Nebraska Department of Transportation Research Reports. 218.https://digitalcommons.unl.edu/ndor/218
Santosh Reddy Kommidi, M.S.Graduate Research AssistantDepartment of Civil EngineeringUniversity of Nebraska-Lincoln
“The contents of this report reflect the views of the authors, who are responsible for the facts and the accuracy of the information presented herein. This document is disseminated in the interest of information exchange.”
Nebraska Transportation Center262 Prem S. Paul Research Center at Whittier School2200 Vine StreetLincoln, NE 68583-0851(402) 472-1993
Yong-Rak Kim, Ph.D.Professor
Investigation of DSR Test Methods to Determine Binder Low Temperature Properties
2019
Final Report26-1121-4041-001Report SPR-1 (18) M073

Investigation of DSR Test Methods to Determine Binder Low
Temperature Properties
Santosh Reddy Kommidi, M.S.
Graduate Research Assistant
Department of Civil Engineering
University of Nebraska-Lincoln
Yong-Rak Kim, Ph.D.
Professor
Department of Civil Engineering
University of Nebraska-Lincoln
A Report on Research Sponsored by
Nebraska Department of Transportation
August 2019
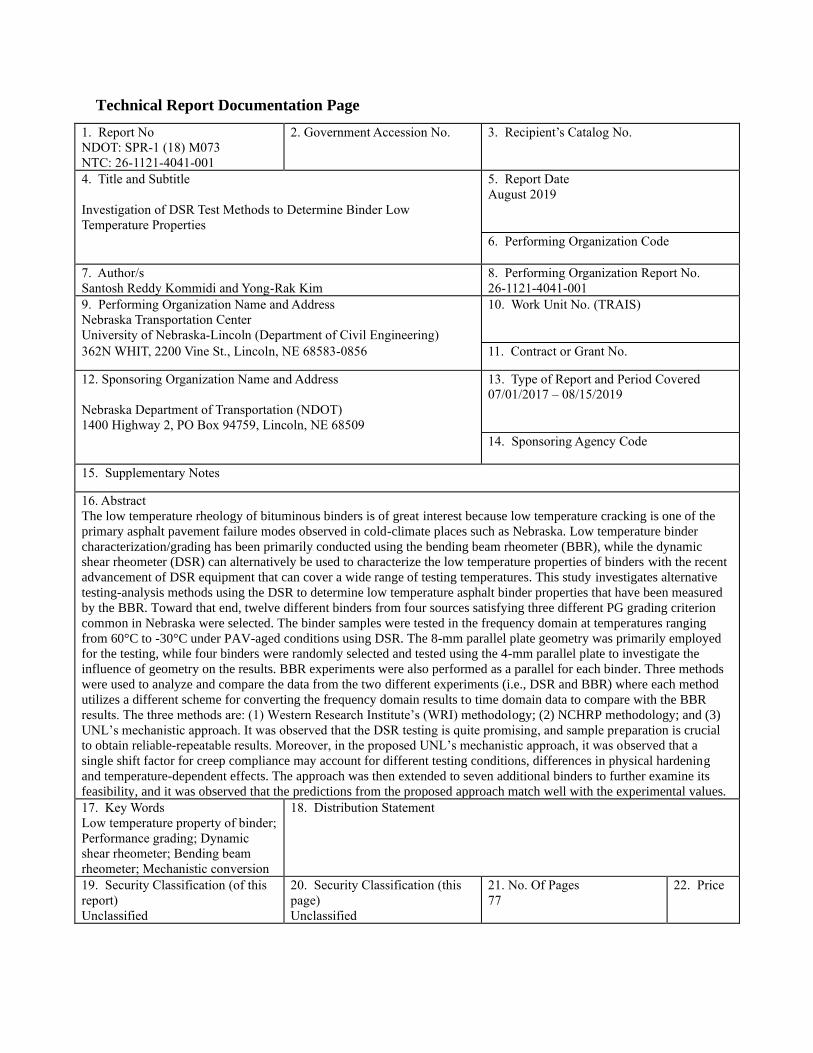
Technical Report Documentation Page
1. Report No
NDOT: SPR-1 (18) M073
NTC: 26-1121-4041-001
2. Government Accession No. 3. Recipient’s Catalog No.
4. Title and Subtitle
Investigation of DSR Test Methods to Determine Binder Low
Temperature Properties
5. Report Date
August 2019
6. Performing Organization Code
7. Author/s
Santosh Reddy Kommidi and Yong-Rak Kim
8. Performing Organization Report No.
26-1121-4041-001 9. Performing Organization Name and Address
Nebraska Transportation Center
University of Nebraska-Lincoln (Department of Civil Engineering)
10. Work Unit No. (TRAIS)
362N WHIT, 2200 Vine St., Lincoln, NE 68583-0856 11. Contract or Grant No.
12. Sponsoring Organization Name and Address
Nebraska Department of Transportation (NDOT)
1400 Highway 2, PO Box 94759, Lincoln, NE 68509
13. Type of Report and Period Covered
07/01/2017 – 08/15/2019
14. Sponsoring Agency Code
15. Supplementary Notes
16. Abstract
The low temperature rheology of bituminous binders is of great interest because low temperature cracking is one of the
primary asphalt pavement failure modes observed in cold-climate places such as Nebraska. Low temperature binder
characterization/grading has been primarily conducted using the bending beam rheometer (BBR), while the dynamic
shear rheometer (DSR) can alternatively be used to characterize the low temperature properties of binders with the recent
advancement of DSR equipment that can cover a wide range of testing temperatures. This study investigates alternative
testing-analysis methods using the DSR to determine low temperature asphalt binder properties that have been measured
by the BBR. Toward that end, twelve different binders from four sources satisfying three different PG grading criterion
common in Nebraska were selected. The binder samples were tested in the frequency domain at temperatures ranging
from 60°C to -30°C under PAV-aged conditions using DSR. The 8-mm parallel plate geometry was primarily employed
for the testing, while four binders were randomly selected and tested using the 4-mm parallel plate to investigate the
influence of geometry on the results. BBR experiments were also performed as a parallel for each binder. Three methods
were used to analyze and compare the data from the two different experiments (i.e., DSR and BBR) where each method
utilizes a different scheme for converting the frequency domain results to time domain data to compare with the BBR
results. The three methods are: (1) Western Research Institute’s (WRI) methodology; (2) NCHRP methodology; and (3)
UNL’s mechanistic approach. It was observed that the DSR testing is quite promising, and sample preparation is crucial
to obtain reliable-repeatable results. Moreover, in the proposed UNL’s mechanistic approach, it was observed that a
single shift factor for creep compliance may account for different testing conditions, differences in physical hardening
and temperature-dependent effects. The approach was then extended to seven additional binders to further examine its
feasibility, and it was observed that the predictions from the proposed approach match well with the experimental values.
17. Key Words
Low temperature property of binder;
Performance grading; Dynamic
shear rheometer; Bending beam
rheometer; Mechanistic conversion
18. Distribution Statement
19. Security Classification (of this
report)
Unclassified
20. Security Classification (this
page)
Unclassified
21. No. Of Pages
77
22. Price

i
Table of Contents
Table of Contents ............................................................................................................................. i
List of Figures ................................................................................................................................ iii
List of Tables .................................................................................................................................. v
Acknowledgements ........................................................................................................................ vi
Disclaimer ..................................................................................................................................... vii
Abstract ........................................................................................................................................ viii
Chapter 1. Introduction ............................................................................................................... 1
1.1 Research Objective ................................................................................................ 2
1.2 Research Methodology .......................................................................................... 3
1.3 Organization of Report .......................................................................................... 4
Chapter 2. Literature Review...................................................................................................... 5
2.1 Drawback of Performance Grading (PG) .............................................................. 6
2.2 Binder Fracture Based Tests ................................................................................. 6
2.3 Physical Hardening of Binder al Low Temperatures ............................................ 7
2.4 Low Temperature Characterization of Binder Based on Rheology ...................... 8
Chapter 3. Materials, Sample Fabrication and Testing ............................................................ 10
3.1 Sample Fabrication .............................................................................................. 10
3.1.1 Bending Beam Rheometer (BBR) ................................................................. 10
3.1.2 Dynamic Shear Rheometer (DSR) ................................................................ 11
3.2 Testing Scheme ................................................................................................... 12
3.2.1 Three-point Bending Beam Test (BBR) ........................................................ 12
3.2.2 Frequency Sweep (DSR) ............................................................................... 14
Chapter 4. Results and Discussion ........................................................................................... 19
4.1 BBR Test Results ................................................................................................ 19
4.2 DSR Test Results ................................................................................................ 23
4.3 WRI Methodology............................................................................................... 27
4.4 NCHRP Methodology ......................................................................................... 31
4.5 UNL’s Mechanistic Approach ............................................................................ 40
4.5.1 Comparing BBR deflection results to DSR predictions ................................ 42
4.5.2 Deflection predictions using DSR at different temperatures......................... 51

ii
4.5.3 Repeatability analysis .................................................................................... 56
4.5.4 Application of UNL’s mechanistic approach to another set of binders ........ 59
Chapter 5. Summary and Conclusions ..................................................................................... 62
References ..................................................................................................................................... 64
iii
List of Figures
Figure 1.1 Research methodology for binder low temperature characterization. ........................... 4 Figure 3.1 BBR Sample preparation scheme. ............................................................................... 11 Figure 3.2 (a) 8-mm DSR mold (b) 4-mm DSR mold. ................................................................. 11
Figure 3.3 4-mm sample placement and trimming for testing using the DSR. ............................ 12 Figure 3.4 (a) Bending Beam Rheometer with cooling unit (b) BBR beam sample loaded on the
testing frame surrounded by the cooling media 50 % by volume propanol and 50 %
volume ethanol. ................................................................................................................. 13 Figure 3.5 (a) |G*| data at different temperatures and master curve for |G*|, (b) master curves for
G’,G’’ and δ for sample J64-28. ....................................................................................... 15
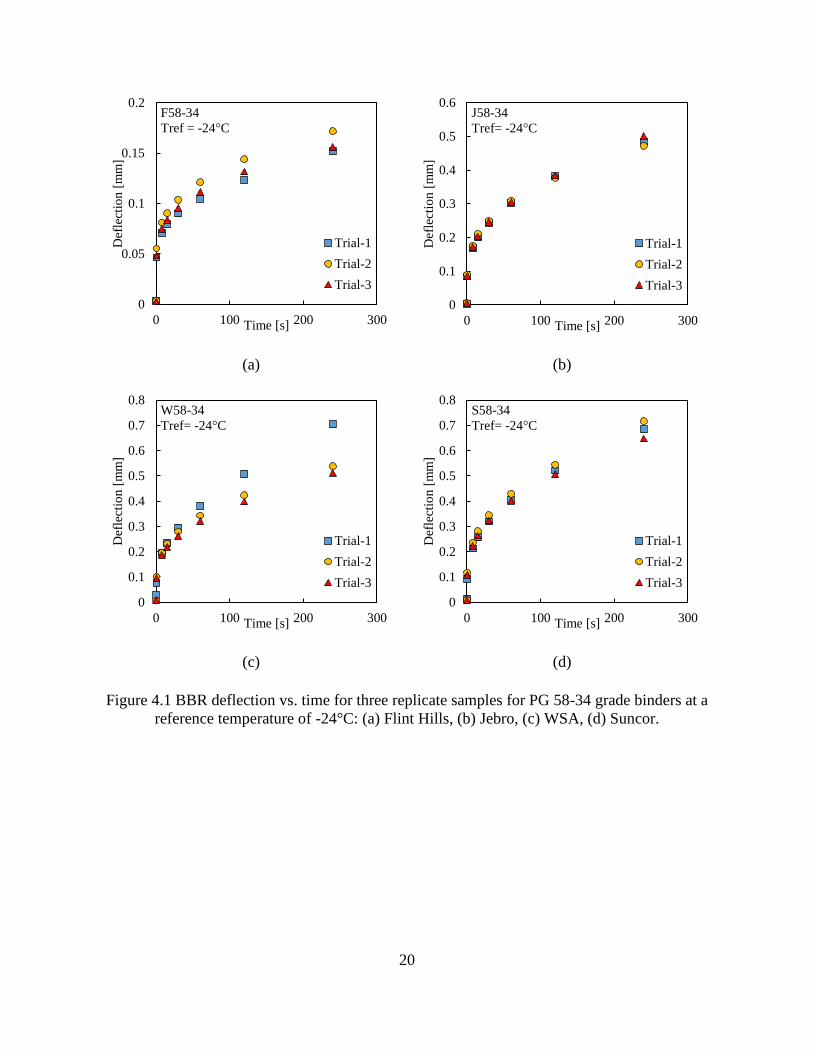
Figure 4.1 BBR deflection vs. time for three replicate samples for PG 58-34 grade binders at a
reference temperature of -24°C: (a) Flint Hills, (b) Jebro, (c) WSA, (d) Suncor. ............ 20 Figure 4.2 BBR deflection vs. time for three replicate samples for PG 64-28 grade binders at a
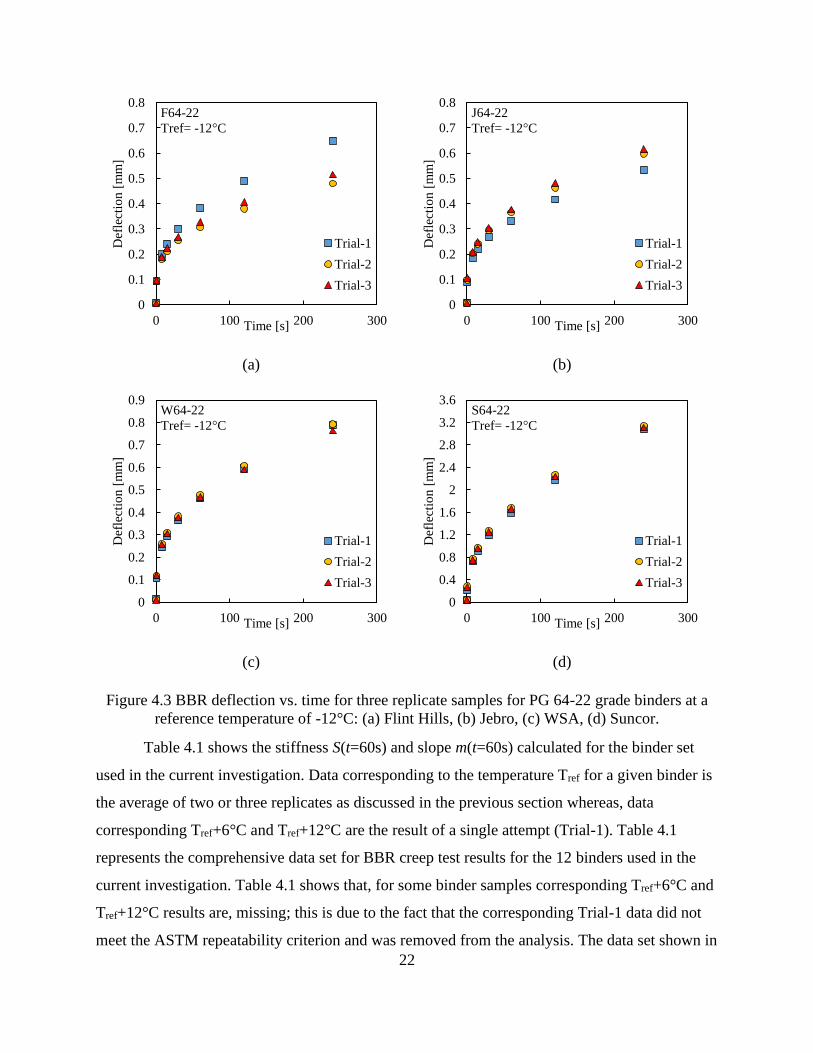
reference temperature of -18°C: (a) Flint Hills, (b) Jebro, (c) WSA, (d) Suncor. ............ 21 Figure 4.3 BBR deflection vs. time for three replicate samples for PG 64-22 grade binders at a
reference temperature of -12°C: (a) Flint Hills, (b) Jebro, (c) WSA, (d) Suncor. ............ 22 Figure 4.4 Master curve of |G*| values using trial-1 data: (a) PG 58-34, (b) PG 64-28, and (c) PG
64-22 grade binders performed by 8-mm parallel plate. ................................................... 25
Figure 4.5 Master curve of |G*| using 4-mm and 8-mm parallel plate geometry: (a) S58-34, (b)
J64-28, (c) W64-22, (d) J58-34. ........................................................................................ 27
Figure 4.6 Example of WRI methodology for sample S58-34: (a) storage modulus at different
temperatures, (b) master curve of the storage modulus at Tref= -24°C, (c) method for
obtaining G(t=60s) and m(t=60s). ..................................................................................... 29 Figure 4.7 (a) Correlation between SBBR(t=60s) and GDSR(t=60s), (b) correlation between
mBBR(t=60s) and mDSR(t=60s). .......................................................................................... 31 Figure 4.8 Application of NCHRP methodology on F58-34 binder: (a) frequency sweep
performed at T= -12°C, (b) converted S(t) using Equation 4.2 at T= -12°C, (c) shifted
S(t)-DSR and the experimental S(t)-BBR. ........................................................................ 34 Figure 4.9 NCHRP methodology applied to all PG 58-34 grade binders: (a) F58-34, (b) J58-34,
(c) W58-34, (d) S58-34. .................................................................................................... 35 Figure 4.10 NCHRP methodology applied to all PG 64-28 grade binders: (a) F64-28, (b) J64-28,
(c) W64-28, (d) S64-28. .................................................................................................... 36 Figure 4.11 NCHRP methodology applied to all PG 64-22 grade binders: (a) F64-22, (b) J64-22,
(c) W64-22, (d) S64-22. .................................................................................................... 37 Figure 4.12 Correlation between (a) stiffness S(t=60s), (b) slope m(t=60s) obtained using
NCHRP method and experimental BBR data. .................................................................. 39 Figure 4.13 Prony fit to the experimental data: (a) G’(ω) and G’’(ω) data, (b) |G*| data for J64-
28 at Tref = -18°C. ............................................................................................................. 41 Figure 4.14 DSR data of J58-34 binder where (a) |G*| Master curves for different trials. DSR
deflection results at (b) Tref = -24°C (c) Tref = -18°C and (d) Tref = -12°C. ...................... 43
Figure 4.15 (a) Comparison of the DSR predicted S(t=60s) with the BBR S(t=60s), (b)
comparison of the DSR predicted m(t=60s) with the BBR m(t=60s) for PG 58-34, PG 64-
28 and PG 64-22 binders................................................................................................... 44

iv
Figure 4.16 The influence of shift factor aβ for predicting BBR results for J58-34: (a) aβ =1, (d)
aβ = 2.0 at Tref = -24°C (b) aβ = 1, (e) aβ = 1.429 at Tref = -18°C and (c) aβ = 1,(e) aβ =
1.667 at Tref = -12°C. ........................................................................................................ 46 Figure 4.17 Comparison of the experimental BBR deflection results with DSR deflection
prediction for PG 58-34 binders at reference temperature Tref=-24°C and aβ =1.736 where
(a) Flint Hills, (b) Jebro, (c) Western State Asphalt, (d) Suncor. ..................................... 48
Figure 4.18 Comparison of the experimental BBR deflection results with DSR deflection
prediction for PG 64-28 binders at reference temperature Tref=-18°C and aβ =1.736 where
(a) Flint Hills, (b) Jebro, (c) Western State Asphalt, (d) Suncor. ..................................... 49 Figure 4.19 Comparison of the experimental BBR deflection results with DSR deflection
prediction for PG 64-22 binders at reference temperature Tref=-12°C and aβ = 1.736
where (a) Flint Hills, (b) Jebro, (c) Western State Asphalt, (d) Suncor. .......................... 50
Figure 4.20 DSR beam deflection prediction at different temperatures with aβ = 1.736 for
binders: J58-34 at (a) Tref = -24°C (b) Tref = -18°C (c) Tref = -24°C and J64-28 (d) Tref = -
18°C (e) Tref = -12°C (f) Tref = -6°C. ................................................................................ 52 Figure 4.21 DSR beam deflection prediction at different temperatures with aβ = 1.736 for
binders: W64-22 at (a) Tref = -12°C (b) Tref = -6°C (c) Tref = 0°C and S58-34 (d) Tref = -
24°C (e) Tref = -18°C (f) Tref = -12°C. .............................................................................. 53 Figure 4.22 (a) Comparison of the DSR predicted results with experimental BBR results: (a)
stiffness S(t=60s), (b) slope m(t=60s), (c) additional shifting for m-value. ...................... 55 Figure 4.23 (a) Master curve of |G*| for J58-34 for trial-1 to trial-9, (b) |G*| average values of all
data with a 95% confidence interval with |G*| average of set-1 and set-3. ...................... 57
Figure 4.24 Deflection predictions of all nine trials with binder J58-34. ..................................... 58 Figure 4.25 BBR and DSR of binder J58-34: (a) average creep stiffness and corresponding COV,
(b) average slope and corresponding COV. ...................................................................... 58 Figure 4.26 Comparison of beam deflections over loading time between the BBR measurements
and DSR predictions using the UNL’s mechanistic approach: (a) V1, (b) V2, (c) V3, (d)
V4. ..................................................................................................................................... 59
Figure 4.27 Comparison of beam deflections over loading time between the BBR measurements
and DSR predictions using the UNL’s mechanistic approach: (a) V5, (b) V6, (c) V7. ... 60
v
List of Tables
Table 3.1 Source and PG Grade of the Binders Selected ............................................................. 10 Table 3.2 Strain Chosen for Corresponding Temperature for Linear Viscoelastic Behavior ....... 14 Table 3.3 Samples Tested to Obtain Frequency Sweep Results Using 8-mm Parallel Plate........ 17
Table 3.4 Samples Tested to Obtain Frequency Sweep Results Using 4-mm Parallel Plate........ 18 Table 4.1 BBR Test Average Stiffness and Slope Values at t=60s for All Binders Tested at Tref.
...................................................................................................................................... 23 Table 4.2 Comparison of WRI Criterion Using Nebraska Binders. ............................................. 31 Table 4.3 Target Frequency for DSR Test to Represent t=60 s Loading Time of the BBR Test. 33
Table 4.4 Shift Factor aβ Identified for Each Binder. ................................................................... 47
Table 4.5 Average Shift Factor aβ of Each Different Group of Binder ........................................ 47
Table 4.6 Comparison of PG grading for seven binders using Equation 4.9 and aβ = 1.736. ...... 61

vi
Acknowledgements
The authors would like to thank the Nebraska Department of Transportation (NDOT) for the
financial support needed to complete this study. In particular, the authors thank the NDOT
Technical Advisory Committee (TAC) for their technical support and their invaluable discussion
and comments.

vii
Disclaimer
The contents of this report reflect the views of the authors, who are responsible for the facts and
the accuracy of the information presented herein. This document is disseminated under the
sponsorship of the U.S. Department of Transportation's University Transportation Centers
Program, in the interest of information exchange. The U.S. Government assumes no liability for
the contents or use thereof.
viii
Abstract
The low temperature rheology of bituminous binders is of great interest because low temperature
cracking is one of the primary asphalt pavement failure modes observed in cold-climate places
such as Nebraska. Low temperature binder characterization/grading has been primarily
conducted using the bending beam rheometer (BBR), while the dynamic shear rheometer (DSR)
can alternatively be used to characterize the low temperature properties of binders with the recent
advancement of DSR equipment that can cover a wide range of testing temperatures. This study
investigates alternative testing-analysis methods using the DSR to determine low temperature
asphalt binder properties that have been measured by the BBR. Toward that end, twelve different
binders from four sources satisfying three different PG grading criterion common in Nebraska
were selected. The binder samples were tested in the frequency domain at temperatures ranging
from 60°C to -30°C under PAV-aged conditions using DSR. The 8-mm parallel plate geometry
was primarily employed for the testing, while four binders were randomly selected and tested
using the 4-mm parallel plate to investigate the influence of geometry on the results. BBR
experiments were also performed as a parallel for each binder. Three methods were used to
analyze and compare the data from the two different experiments (i.e., DSR and BBR) where
each method utilizes a different scheme for converting the frequency domain results to time
domain data to compare with the BBR results. The three methods are: (1) Western Research
Institute’s (WRI) methodology; (2) NCHRP methodology; and (3) UNL’s mechanistic approach.
It was observed that the DSR testing is quite promising, and sample preparation is crucial to
obtain reliable-repeatable results. Moreover, in the proposed UNL’s mechanistic approach, it was
observed that a single shift factor for creep compliance may account for different testing
conditions, differences in physical hardening and temperature-dependent effects. The approach
was then extended to seven additional binders to further examine its feasibility, and it was
observed that the predictions from the proposed approach match well with the experimental
values.

1
Chapter 1. Introduction
The low-temperature rheology of bituminous binders is of great interest because low-temperature
cracking is one of the primary asphalt pavement failure modes observed in cold-climate regions
such as Nebraska. Moreover, binder properties have been found to mainly determine the thermal
cracking performance of asphalt pavements, other asphalt mixture properties being of secondary
importance (1). Low-temperature cracking typically occurs during extreme low-temperature
weather, usually within a few years after pavement construction. This failure mode is visible in
the asphalt pavement as transverse cracks that are caused by the binder’s inability to deform to
reduce stress. When the stresses exceed the asphalt binder’s strength, transverse cracks appear.
To reduce the frequency of low-temperature cracking failure, the strength or stress relaxation
ability of the binder must be increased.
The dynamic shear rheometer (DSR) is the critical apparatus used in the Superpave
performance-graded (PG) binder system for high and intermediate temperature, while the
bending beam rheometer (BBR) is a core equipment for low temperature. During the Strategic
Highway Research Program (SHRP) (2), DSR with parallel plate geometry was considered for
the low temperature PG system, but it was not selected because it was recognized that DSR
measurements at temperatures below about 5°C produced instrument compliance errors in the
dynamic responses when the typical thin film binder geometry was used. Thus, SHRP developed
the BBR to measure the low temperature rheological properties of asphalt binder (AASHTO T
313). A literature review reveals that in the 1990s and 2000s numerous articles were published
concerning the low-temperature rheology of bitumen (3-11). However, the results of the studies
where DSR has been employed to measure bitumen’s low temperature characteristics are subject
to criticism. This is because in these investigations, the data measured with 8 mm parallel plate
geometry have been reported without accurate instrument compliance correction. Consequently,
the reliability of these test results is rather questionable. The limiting temperature of about 5°C
for DSR parallel plate measurements due to instrument compliance has been resolved by
measuring the instrument compliance and performing appropriate corrections to the data.
According to the studies (12-15) performed by Western Research Institute’s researchers, DSR
measurements can now be made to as low as -40°C.

2
Although the BBR method has been an official approach to measure low temperature
properties, it has several operational drawbacks. The BBR requires a long time (approximately 3
hours) to fabricate specimens and conduct testing, and it requires large amounts of binder
(approximately 15 grams) to fabricate each testing specimen which clearly limits testing of
binders obtained from field sections. Field studies to monitor pavement performance over time
are becoming ever more important. However, it is very labor-intensive and time-consuming to
extract large amounts of binder from an existing asphalt pavement for BBR testing. To minimize
this effort, a binder test that uses only small amounts of material would be great. Another
drawback of the BBR method is that it is not fundamentally sound to evaluate low temperature
cracking potential of binders because it only measures binder stiffness (i.e., creep stiffness and
the rate of relaxation) not binder fracture. A clear benefit is expected if the current BBR method
for low temperature evaluation of binders can be supplemented (or replaced) by an alternative
method to advance efficiency, accuracy of binder grading-evaluation program. In particular, if
the method is based on the DSR testing, single equipment would be necessary to examine
binders for an entire temperature range, which can reduce testing time and costs significantly.
1.1 Research Objective
The objective of this research is to seek an alternative testing or analysis method using the DSR
to determine low temperature asphalt binder properties that is currently being measured by the
BBR. More specifically the goal is to develop a DSR testing and/or analysis method and
resulting material parameters to supplement (or potentially replace) the BBR approach, which
will be based on scientific comparison/correlation of test results between the two methods.
Multiple binders used in Nebraska were tested to reach general conclusions. It is expected that
the alternative testing or analysis method can serve as a useful tool for screening binders before
performing entire BBR tests, or possibly replace the current BBR testing protocol for low
temperature examination of binders. It is expected that one equipment (i.e., DSR) would
characterize entire binder properties in all temperatures, which will clearly save costs and time to
conduct quality assurance testing of binders. Ultimately, this research will contribute to a more
engineered and economical implementation of paving materials in Nebraska by providing crucial
information and scientific insights.

3
1.2 Research Methodology
Figure 1.1 shows a schematic of the methodology adopted in this study. First, the low
temperature rheological behavior for each binder was obtained using the DSR with 8mm and
4mm parallel plates. For each binder, material responses that are dependent on temperature and
loading frequency are identified by developing linear viscoelastic master curves of oscillatory
responses such as dynamic modulus (|G*|), storage modulus (G’), loss modulus (G’’) and phase
angle (δ). Later, the theory of linear viscoelasticity was used to represent the binder response and
to obtain viscoelastic material parameters by fitting the model response to the master curves.
This study attempts to seek alternative testing-analysis methods using the DSR to
determine low temperature asphalt binder properties that have been measured by the BBR.
Toward that end, twelve different binders from four sources satisfying three different PG grading
criterion common in Nebraska were selected. The binder samples were tested in the frequency
domain at temperatures ranging from 60°C to -30°C under PAV-aged conditions using DSR.
BBR experiments were also performed as a parallel for each binder. Three methods were used to
analyze and compare the data from the two different experiments (i.e., DSR and BBR) where
each method utilizes a different scheme for converting the frequency domain results to time
domain data to compare with the BBR results. The three methods are: (1) Western Research
Institute’s (WRI) methodology; (2) NCHRP methodology; and (3) UNL’s mechanistic approach.

4
Figure 1.1 Research methodology for binder low temperature characterization.
1.3 Organization of Report
This report is organized into five chapters. After this introduction, chapter 2 describes a brief
literature review that summarizes relevant studies. Chapter 3 presents materials (i.e., binders)
used in this study and sample fabrication of the binders for laboratory testing (i.e., BBR and
DSR). Test results and analyses of results are presented in Chapter 4. Significant findings and
conclusive outcomes including future studies recommended are summarized in Chapter 5:
Summary and Conclusions.
5
Chapter 2. Literature Review
In cold places such as Nebraska that experience very low temperature over prolonged periods of
time and experience multiple freeze-thaw cycles, the primary form of pavement distress is low
temperature transverse cracks. Such cracks can appear over a certain period of years after
pavement construction. The development of such cracks can be mainly attributed to factors such
as pavement material properties, structure of the pavement, and the environment (1). There are
several other factors that can trigger such cracks as well (16, 17), but from the perspective of the
material, the main cause of low temperature cracks can be attributed to development of critical
thermal stresses within the binder phase. Over the last few years, the use of reclaimed asphalt
pavements has increased considerably, which has thereby increased the pavement’s susceptibility
to early low temperature cracks (18). Over the last three decades, considerable insight into the
low temperature behavior of asphalt binder has been gained (19). Low temperature binder
characterization can be broadly classified into two categories based on the type of type of
investigation and approach:
• Stiffness-based approach: this relies on methods or experiments designed to capture the
linear viscoelastic material properties of the binder.
• Fracture-based approach: this relies on methods or experiments designed to capture the
linear elastic/plastic/viscoelastic/viscoelastic-viscoplastic fracture properties of asphalt
binder.
One of the earliest and most comprehensive characterizations of the asphalt binder
rheological properties was conducted during the 1900’s as part of the Strategic Highway
Research Program (SHRP) (2). This program developed a testing protocol based on a three-point
bending test on a binder beam sample using the bending beam rheometer (BBR) to assess the
low temperature response of a given binder. Based on subsequent research efforts, limits were
placed on the creep stiffness S(t) and slope of log (S(t)) when plotted against log (t) measured at
time t = 60 s. The critical low temperature was identified to be 10°C lower than the temperature
where these limits (S(t) ≤ 300 MPa and m(t) ≥ 0.3) were reached. A supplementary fracture-
based test, the Direct Tension Test (DTT) (20) was introduced as part of the original PG grading
but it was soon considered to be optional and finally stopped being used due to issues with poor

6
repeatability. As is the case with most fracture related tests performed on pure asphalt binders, it
was observed that repeatability issues with the DTT test were specific to the selected binder and
sample preparation technique.
2.1 Drawback of Performance Grading (PG)
The applicability of the Time Temperature Superposition Principle (TTSP) to evaluate the
stiffness- S(t=60s) and slope-m(t=60s) parameters is questionable (21, 22). There are several
parameters that the current PG grading criterion does not account for; some of these factors are
the source of the binder and influence of modification (polymer, nano-filler, reclaimed asphalt
binder, effect of rejuvenators, warm-mix additives). Current PG grading is not specific to a given
binder nor does it include temperature and time-dependent behavior over a wide range of low
temperatures. Use of high Reclaimed Asphalt Pavement (RAP) increases the aged asphalt
content within the pavement and hence warrants a new technique/methodology for analyzing the
low temperature performance of the modified binders. The current PG grading requires at least
15 to 30 grams of binder to obtain the critical low temperature grade of the binder that prohibits
its use as a monitoring tool for evaluating the performance of pavement in terms of binder
properties.
Nonetheless, the NCHRP program has been successful in terms of its application, since
PG grading has been in use for nearly four decades. The NCHRP program has also identified
several key research areas such physical hardening effects that were more severe in certain
binders as compared to other binders, revealing a need for a fracture-based approach for
evaluating the fracture properties of a binder.
2.2 Binder Fracture Based Tests
The motivation for researchers to consider fracture-based characterization of the binder is mainly
due to the fact that current PG grading is based on the principles of linear viscoelastic properties
of the binder. The belief is that PG grading cannot account for the complex cracking
phenomenon that occurs in pavements (23). Listed below are some of the fracture-based testing
methods used for asphalt binders. A detailed description of each test method is not presented, as
the current scope of the study does not include fracture of binder.
• Direct Tensile Test (DTT)

7
• Single-Edged Notched Beam (SENB) (24-27) or the BBR-SENB Test (28)
• Double-Edged Notched Tension Test (DENT) (29-33)
• Asphalt Binder Cracking Device (ABCD) Test (34-36)
• Evaluation of Cracking using Acoustic Emission (16, 37)
The major limitations that can be associated with the fracture-based tests for use as a
specification type for binder is listed below:
• The loads applied in such experiments are small in the range of 5-20 N for unmodified
and modified binders and 15-30 N for RAP modified binders. Although, this may not be
a great challenge with current technological advancements in capturing low levels of
load, precise control of sample preparation (e.g., notch size and sample thickness) and
testing necessary to generate repeatable results.
• Repeatability is often an issue with fracture-based experiments, which further depends on
the type and source of binder and sample fabrication methods.
• Selection of the temperature for fracture testing can be quite tricky when using an
ungraded binder due to ductile to the brittle behavior of binder at temperatures closer to
the glass transition temperature (Tg) which requires multiple experiments to be conducted
at several temperatures.
• Post peak behavior in certain fracture tests such as the BBR-SENB is too short for a
comprehensive analysis of fracture resistance properties of binder due to uncontrolled
crack opening displacements.
• Single event tests such as the Fraas Breaking Point and ABCD cannot capture thermal
history dependent behavior of the asphalt binder more comprehensively.
2.3 Physical Hardening of Binder al Low Temperatures
Two important phenomenon that can significantly affect the low temperature behavior of binders
is the glass transition temperature (Tg) and significant physical hardening of binder at
temperatures closer to Tg (2, 38). Several researchers have investigated the influence of physical
hardening on the PG grading criterion (17, 29, 38, 39). Physical hardening effects can be critical
to certain binders with high wax content and is related to the free volume changes that occur at
temperatures close to the Tg. When the binder temperature is close to Tg, there is a transition
region where the effects of physical hardening can be critical. This transition region is due to the

8
presence of different molecular fractions within the asphalt binder. This transition region can be
broad for binders (40) and can be an important factor that needs to be considered, since the
binder can encounter these temperatures during the service of the pavement. Measurable effects
of physical hardening occur in the vicinity of the glass transition temperature. Since the objective
of the current investigation is to develop a robust and fast methodology for low temperature
characterization using DSR, the physical hardening effects have been considered a different
approach detailed in later chapters. Interested readers are directed to the work by Laukkanen et
al. (41) who investigated the physical aging in binders using the small diameter plate rheology
with the DSR. Their method for characterizing the physical hardening, although quite
comprehensive can take days for a single binder and was hence avoided for the current study.
2.4 Low Temperature Characterization of Binder Based on Rheology
Due to increased usage of reclaimed asphalt binder (RAB) and various other additives (e.g.,
warm-mix additives, emulsions, crack sealants, nano-fillers) it can be difficult to conduct a
forensic analysis or performance evaluation of the binder at low temperatures. Such an
investigation would require extraction of a large amount of binder for conducting the current
BBR low temperature PG grading. Considering the difficulty associated with the current PG
grading system for field monitoring purposes, Sui et al. (12, 13) developed a new technique for
low temperature characterization of binder using the dynamic shear rheometer (DSR) 4-mm
parallel plate geometry. After evaluating several key factors such as instrument compliance
correction, different plate geometries and repeatability, Sui et al. concluded that evaluation of
low temperature performance of the binder using DSR is more reliable and faster than the current
low temperature PG grading. In an extension of the above study, Farrar et al. (14) developed a
probable specification test for low temperature grading using the DSR. They observed linear
correlations between the DSR obtained relaxation modulus G(t=60s), its slope mG(t)(t = 60s) and
the corresponding BBR stiffness S(t = 60s) and its slope mS(t)(t = 60s) at low PG+10°C
temperature. Based on the correlations they established limiting relaxation modulus G(t = 60s)
and slope mG(t)(t = 60s) criterion. A similar investigation was carried out by Xiaohu et al. (42)
using the DSR and 4-mm parallel plate geometry, in which they compared the dynamic modulus
(|G*|) and phase angle (δ) at certain frequencies to the BBR creep stiffness S(t = 60s) and m(t =
60s) measured at the binder low temperature PG+10°C. They concluded that critical low

9
temperature grades predicted by the DSR were lower than those predicted by the BBR tests,
which was attributed to wax content within the binder system. In another study, Laukkanen et al.
(43, 44) investigated the use of small diameter parallel plate (SDPP) rheometer and necessary
compliance correction to evaluate the low temperature behavior of binder. They observed that
binder belongs to the class of complex glass forming liquids and that by using small diameter
plates, DSR tests can be used to effectively characterize the low temperature behavior of the
binder. Laukkanen et al. (45) examined the influence of SBS polymer on the low temperature
rheological behavior of two binders using 4-mm DSR. They observed linear correlations
between DSR dynamic modulus (|G*|) and BBR stiffness S(t) for a continuous SBS rich
network. Deviations from linearity were attributed to poor compatibility between the polymer
and base binder. They concluded that the rheological response of SBS polymer-modified binders
at low temperatures can be thermo-rheologically complex.
In another study Carret et al. (46) investigated two sets of binder samples using DSR at
low temperatures. The first set of four binder samples were tested using solid bars in torsion and
the second set of two binder samples were tested using 4-mm parallel plate geometry. The same
binder samples were tested using the BBR at different temperatures (-30°C to -6°C at every 6°C
increment). Linear viscoelastic models were utilized to represent the material response measured
using DSR and obtained the creep stiffness at the corresponding BBR test temperatures. They
compared the DSR stiffness to the BBR stiffness and it was concluded that horizontal and
vertical shift factors were needed to match the two results. The shift factors were necessary to
account for differences in conditioning times, physical hardening and cooling media used for the
DSR and BBR experiments. Recently, Riccardi et al. (47) investigated the effects of different
cooling media (air and ethanol) on the mechanical response of three binders tested using the
BBR. It was observed that use of air as the cooling medium resulted in higher stiffness and lower
relaxation capabilities as compared to the test response in ethanol for the same binder.
Based on the above literature review it can be concluded that there is a quite appealing
need to explore a DSR-based method for characterizing the low temperature properties of
binders. Development of such a method will produce cost savings, enhance work efficiency and
wider application of the technique to field materials using a single equipment.
10
Chapter 3. Materials, Sample Fabrication and Testing
For the current investigation, 12 binders from four different sources that satisfied different low
temperature PG specification were selected. The selected binders were common to the state of
Nebraska. In order to include variation in the analysis, binders satisfying three different low
temperature grades (i.e., PG 58-34, PG 64-28 and PG 64-22) were selected from each binder
source as shown in Table 3.1.
All the binders were aged using RTFOT and PAV aging tests to simulate short-term and
long-term aging. In the current investigation, all the experiments (BBR and DSR) were
performed on the PAV-aged material.
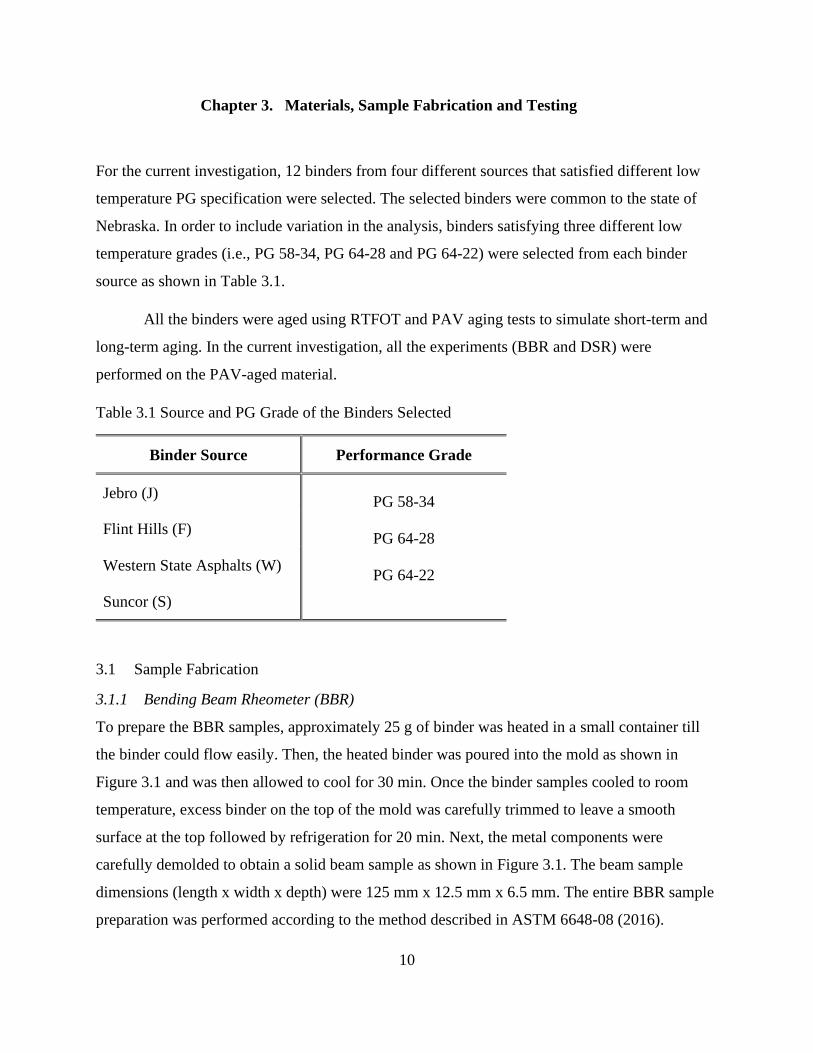
Table 3.1 Source and PG Grade of the Binders Selected
Binder Source Performance Grade
Jebro (J) PG 58-34
PG 64-28
PG 64-22
Flint Hills (F)
Western State Asphalts (W)
Suncor (S)
3.1 Sample Fabrication
3.1.1 Bending Beam Rheometer (BBR)
To prepare the BBR samples, approximately 25 g of binder was heated in a small container till
the binder could flow easily. Then, the heated binder was poured into the mold as shown in
Figure 3.1 and was then allowed to cool for 30 min. Once the binder samples cooled to room
temperature, excess binder on the top of the mold was carefully trimmed to leave a smooth
surface at the top followed by refrigeration for 20 min. Next, the metal components were
carefully demolded to obtain a solid beam sample as shown in Figure 3.1. The beam sample
dimensions (length x width x depth) were 125 mm x 12.5 mm x 6.5 mm. The entire BBR sample
preparation was performed according to the method described in ASTM 6648-08 (2016).

11
Figure 3.1 BBR Sample preparation scheme.
3.1.2 Dynamic Shear Rheometer (DSR)
Sample preparation for the DSR tests using either the 8-mm or the 4-mm parallel plate is
relatively much easier, simpler and less time consuming as compared to the BBR sample
preparation. This is one of the major reasons why the low temperature characterization of binder
using the DSR has received more attention in recent years as compared to BBR. For the DSR
binder samples, the binder was heated until the sample was soft enough to flow and was then
poured into the corresponding molds as shown in Figure 3.2.
(a) (b)
Figure 3.2 (a) 8-mm DSR mold (b) 4-mm DSR mold.
Precise preparation of the DSR samples is critical for obtaining representative and
repeatable results. Since the DSR tests were also conducted at temperatures below freezing,
significantly large error in estimating the material properties can occur if the sample is
incorrectly placed or trimmed. Figure 3.3 exemplifies sample placement and trimming process
for a 4-mm parallel plate sample. Analysis on the effects of improper DSR sample preparation
between the plates is discussed in detail in chapter 4.

12
Figure 3.3 4-mm sample placement and trimming for testing using the DSR.
Since the current investigation mainly focused on the low temperature properties of
binder, two specific tests were performed on each of the binder samples to obtain their material
properties; namely, BBR and DSR. The section below describes the BBR test methodology and
then DSR testing scheme utilized for obtaining the low temperature rheological response over a
wide range of temperatures.
3.2 Testing Scheme
3.2.1 Three-point Bending Beam Test (BBR)
Testing of the 12 BBR samples was conducted using the ATS Bending Beam Rheometer, as
shown in Figure 3.4. The beam samples were subjected to a three-point bending test with the
load applied at the mid-span of the beam. The temperature control was exerted by an external
temperature control unit and a uniform temperature field was achieved using a cooling medium
within the chamber. The current investigation used a cooling medium consisting of a blend of 50
% by volume ethanol and 50% by volume 2-propanol. Several concerns have been raised (46,
47) regarding the influence of cooling medium such as using only ethanol, on the properties
obtained using the BBR tests. It was observed that the chemical influence of this blend (50 % by
volume ethanol + 50% by volume 2-propanol) on the binder properties was negligible.
In the three-point bending test, a contact load of 35 ± 10 mN followed by a constant test
load of 980 ± 50 mN was applied at the mid span of the beam. The time dependent deflection at
the bottom mid-span was measured during the application of the test load. The beam stiffness,
S(t) as a function of time was estimated using the Equation 3.1.

13
𝑆(𝑡) = 𝑃𝐿3
4𝑏ℎ3∆(𝑡) (3.1)
where P is the test load, L is the span length, b and h are the beam width and depth, respectively
and (t) is the time-dependent deflection measured using BBR. The NCHRP PG low
temperature criterion measured at a temperature T+10 °C are, stiffness, S(t=60s) ≤ 300 MPa and
slope, m(t=60s) ≥ 0.3, where m(t) is the slope of log(S(t)) vs log(t) curve.
(a)
(b)
Figure 3.4 (a) Bending Beam Rheometer with cooling unit (b) BBR beam sample loaded on the
testing frame surrounded by the cooling media 50 % by volume propanol and 50 % volume
ethanol.
14
3.2.2 Frequency Sweep (DSR)
The low temperature material response of each binder was evaluated by performing frequency
sweep tests to obtain the non-destructive material dependent linear viscoelastic properties. The
frequency sweep data were later used to obtain the master curve at a specific reference
temperature using time-temperature superposition principle. Selection of the reference
temperature was based on the low temperature PG grade of the binder sample. For instance, if
the binder was graded as PG 64-34, then the reference temperature (Tref) was selected as 10°C
higher than the graded low temperature, which in this case was -24 °C. Each of the 12 binder
samples were subjected to frequency sweep tests at temperatures ranging from 64 °C to -30 °C.
At each temperature, the frequency was increased from 0.628 rad/s to 80 rad/s; the strain
amplitude selected for the frequency sweep test at the individual temperature is shown in Table
3.2. As the temperature decreased the strain amplitude was reduced, which maintained the
sample response to be within the linear viscoelastic regime.
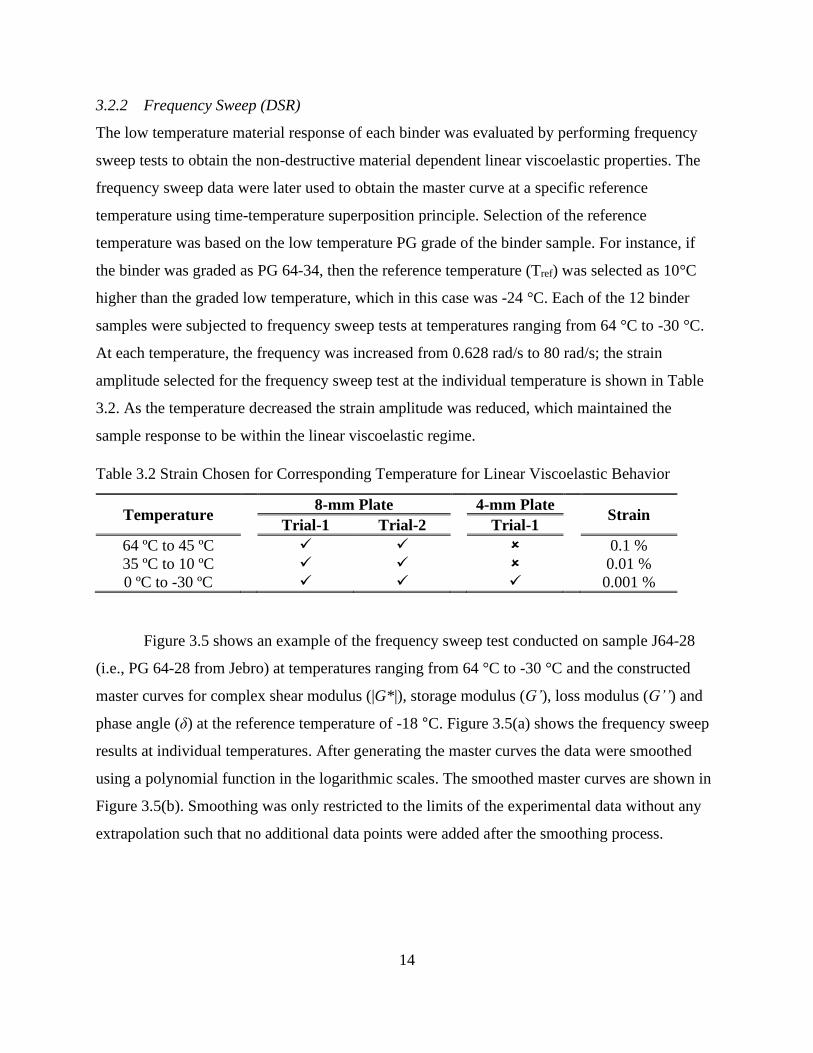
Table 3.2 Strain Chosen for Corresponding Temperature for Linear Viscoelastic Behavior
Temperature 8-mm Plate 4-mm Plate
Strain Trial-1 Trial-2 Trial-1
64 ºC to 45 ºC ✓ ✓ 0.1 %
35 ºC to 10 ºC ✓ ✓ 0.01 %
0 ºC to -30 ºC ✓ ✓ ✓ 0.001 %
Figure 3.5 shows an example of the frequency sweep test conducted on sample J64-28
(i.e., PG 64-28 from Jebro) at temperatures ranging from 64 °C to -30 °C and the constructed
master curves for complex shear modulus (|G*|), storage modulus (G’), loss modulus (G’’) and
phase angle (δ) at the reference temperature of -18 °C. Figure 3.5(a) shows the frequency sweep
results at individual temperatures. After generating the master curves the data were smoothed
using a polynomial function in the logarithmic scales. The smoothed master curves are shown in
Figure 3.5(b). Smoothing was only restricted to the limits of the experimental data without any
extrapolation such that no additional data points were added after the smoothing process.

15
(a)
(b)
Figure 3.5 (a) |G*| data at different temperatures and master curve for |G*|, (b) master curves for
G’,G’’ and δ for sample J64-28.
1.E+03
1.E+04
1.E+05
1.E+06
1.E+07
1.E+08
1.E+09
1.E-11 1.E-06 1.E-01 1.E+04
|G*|[
Pa]
Frequency [rad/s]
J64-28
Tref= -18 C
64 Deg
55 Deg
45 Deg
35 Deg
25 Deg
10 Deg
0 Deg
-6 Deg
-12 Deg
-18 Deg
-24 Deg
-30 Deg
Master Curve
0
10
20
30
40
50
60
70
80
90
1.E+02
1.E+03
1.E+04
1.E+05
1.E+06
1.E+07
1.E+08
1.E+09
1.E-11 1.E-07 1.E-03 1.E+01 1.E+05
δ[
]
G' a
nd G
'' [P
a]
Reduced Frequency [rad/s]
J64-28
Tref= -18 C
G'
G''
Delta
16
While performing the frequency sweep experiments using the DSR there are several key
factors that need to be considered when performing the tests at temperatures below 0 °C. These
factors play a critical role in obtaining the material properties or response at freezing
temperatures. The factors are described below:
1. Sample Preparation and Test Geometry
Precise control over the sample preparation and test geometry after trimming the sample
is necessary in order to obtain repeatable results. Since the testing conditions and
temperature for the DSR can be below 0°C, significant differences from the actual
response is possible if there is excess or less sample between the plates.
2. Normal Force/Gap Control When Testing Below 0 °C:
During torsion testing at low temperatures, the binder can shrink due to increase in
thermal contraction which cause substantial negative normal force on the upper parallel
plate. In order to avoid such additional thermal stresses a normal-force controlled gap
variation between the parallel plates must be allowed during testing at temperatures
below 0 °C. Normally the gap between the plates is fixed to 2 mm and 1.75 mm for 8-
mm and 4-mm parallel plates. Hence, this sample thickness can vary during the gap-
controlled experiments to keep the normal force on the top plate at minimal levels that
allow the thermal stresses to relax completely while testing.
3. Compliance Correction:
When a given binder sample is tested at temperatures close to the Tg, the binder stiffness
increases considerably and is comparable to that of the plates and motor, which results in
distortion of parallel plates and the instrument motor (48-50). In such situations, the
expected material response to loading is not from the binder sample alone due to the
contribution of deformation from the plates and motor. Hence suitable compliance
corrections to the data are necessary when testing a low temperature. Sui et al. (13) and
Laukkanen et al. (43) demonstrated how to manually correct the data by considering the
instrument correction for different plate diameter and materials. Since considerable
research has been devoted to this issue, most of the current DSR have incorporated for

17
automatic data correction through the software that is used to control the device during
testing at low temperatures.
4. Cooling Media:
The effect of cooling media on the rheological properties of the binder using the DSR is
not well documented and needs to be further investigated. In the current investigation air
was used as the cooling medium for both the 8-mm and 4-mm parallel plate geometries.
Use of an inert gas environment, such as nitrogen can be used to avoid buildup of ice
near and around the binder sample.
All 12 binder samples were tested using the 8-mm parallel plate geometry and only a few
selected samples were tested using the 4 mm parallel plate geometry to check for the influence of
instrument compliance at low temperature, the results of which are discussed in detail in Chapter
4. The sample thickness for the 8-mm and 4-mm parallel plates were maintained at 2 mm and
1.75 mm, respectively. Table 3.3 shows the list of binder samples tested using the 8-mm parallel
plate and the Table 3.4 shows the samples tested using 4-mm parallel plate geometry.
Table 3.3 Samples Tested to Obtain Frequency Sweep Results Using 8-mm Parallel Plate
Source
Grade 8-mm Plate
Trial-1 Trial-2
Suncor
PG 58-34 ✓ ✓
PG 64-28 ✓ ✓
PG 64-22 ✓
Western State
Asphalt
PG 58-34 ✓ ✓
PG 64-28 ✓
PG 64-22 ✓ ✓
Flint Hills
PG 58-34 ✓ ✓
PG 64-28 ✓
PG 64-22 ✓ ✓
Jebro
PG 58-34 ✓ ✓
PG 64-28 ✓ ✓
PG 64-22 ✓ ✓

18
Table 3.4 Samples Tested to Obtain Frequency Sweep Results Using 4-mm Parallel Plate
Source Grade
Suncor PG 58-34
Western State Asphalt PG 64-22
Jebro PG 64-28,
PG 58-34
19
Chapter 4. Results and Discussion
To investigate the influence of low freezing temperatures on the mechanical response of the
binder, two types of tests were performed on the three PG grade binder samples selected in the
current investigation. The low temperature tests on the binder were performed using the BBR
and DSR.
4.1 BBR Test Results
Bending beam tests were performed on each of the 12 PAV-aged binder samples described in
Table 3.1. The tests were performed in accordance to the ASTM 6648-08 (2016) standard to
maintain consistency. Details of the sample preparation method and experimental data collection
is described in Chapter 3. Since the binder samples were already assigned a PG grade from the
manufacturer, low temperature grading of the binder samples was not performed in our study
instead, BBR tests were conducted at a reference temperature based on the manufacturer’s
grading. For example, if the binder J58-34 was selected, the reference temperature for the BBR
test was low PG +10 °C, in this case it would be Tref = -24°C. For each binder, three replicates
were performed at the reference temperature to check for repeatability and consistency of the
results. Figure 4.1, Figure 4.2 and Figure 4.3 show the results of the BBR creep experiments
performed on binders satisfying PG 58-34, PG 64-28 and PG 64-22 grades respectively.
Only in the first trial (Trial-1) of the BBR tests, creep experiments were performed on
each of the 12 beam samples at three different temperatures Tref, Tref + 6°C and Tref + 12°C, this
was not done for the Trial-2 and Trial-3 experiments. The same beam was used for testing at
multiple temperatures during the Trial-1 experiments and different beams were used for Trial-2
and Trial-3 experiments. If a particular trial did not meet the ASTM 6648-08 (2016) criterion for
repeatability the entire test data corresponding to the Trial-1 were removed from further analysis.
20
(a) (b)
(c) (d)
Figure 4.1 BBR deflection vs. time for three replicate samples for PG 58-34 grade binders at a
reference temperature of -24°C: (a) Flint Hills, (b) Jebro, (c) WSA, (d) Suncor.
0
0.05
0.1
0.15
0.2
0 100 200 300
Def
lect
ion [
mm
]
Time [s]
F58-34
Tref = -24 C
Trial-1
Trial-2
Trial-3
0
0.1
0.2
0.3
0.4
0.5
0.6
0 100 200 300
Def
lect
ion [
mm
]
Time [s]
J58-34
Tref= -24 C
Trial-1
Trial-2
Trial-3
0
0.1
0.2
0.3
0.4
0.5
0.6
0.7
0.8
0 100 200 300
Def
lect
ion [
mm
]
Time [s]
W58-34
Tref= -24 C
Trial-1
Trial-2
Trial-3
0
0.1
0.2
0.3
0.4
0.5
0.6
0.7
0.8
0 100 200 300
Def
lect
ion [
mm
]
Time [s]
S58-34
Tref= -24 C
Trial-1
Trial-2
Trial-3

21
(a) (b)
(c) (d)
Figure 4.2 BBR deflection vs. time for three replicate samples for PG 64-28 grade binders at a
reference temperature of -18°C: (a) Flint Hills, (b) Jebro, (c) WSA, (d) Suncor.
0
0.1
0.2
0.3
0.4
0.5
0.6
0.7
0 100 200 300
Def
lect
ion [
mm
]
Time [s]
F64-28
Tref= -18 C
Trial-1
Trial-2
Trial-3
0
0.1
0.2
0.3
0.4
0.5
0.6
0.7
0 100 200 300
Def
lect
ion [
mm
]
Time [s]
J64-28
Tref= -18 C
Trial-1
Trial-2
Trial-3
0
0.1
0.2
0.3
0.4
0.5
0.6
0.7
0.8
0.9
0 100 200 300
Def
lect
ion [
mm
]
Time [s]
W64-28
Tref= -18 C
Trial-1
Trial-2
Trial-3
0
0.2
0.4
0.6
0.8
1
1.2
1.4
0 100 200 300
Def
lect
ion [
mm
]
Time [s]
S64-28
Tref= -18 C
Trial-1
Trial-2
Trial-3
22
(a) (b)
(c) (d)
Figure 4.3 BBR deflection vs. time for three replicate samples for PG 64-22 grade binders at a
reference temperature of -12°C: (a) Flint Hills, (b) Jebro, (c) WSA, (d) Suncor.
Table 4.1 shows the stiffness S(t=60s) and slope m(t=60s) calculated for the binder set
used in the current investigation. Data corresponding to the temperature Tref for a given binder is
the average of two or three replicates as discussed in the previous section whereas, data
corresponding Tref+6°C and Tref+12°C are the result of a single attempt (Trial-1). Table 4.1
represents the comprehensive data set for BBR creep test results for the 12 binders used in the
current investigation. Table 4.1 shows that, for some binder samples corresponding Tref+6°C and
Tref+12°C results are, missing; this is due to the fact that the corresponding Trial-1 data did not
meet the ASTM repeatability criterion and was removed from the analysis. The data set shown in
0
0.1
0.2
0.3
0.4
0.5
0.6
0.7
0.8
0 100 200 300
Def
lect
ion [
mm
]
Time [s]
F64-22
Tref= -12 C
Trial-1
Trial-2
Trial-3
0
0.1
0.2
0.3
0.4
0.5
0.6
0.7
0.8
0 100 200 300
Def
lect
ion [
mm
]
Time [s]
J64-22
Tref= -12 C
Trial-1
Trial-2
Trial-3
0
0.1
0.2
0.3
0.4
0.5
0.6
0.7
0.8
0.9
0 100 200 300
Def
lect
ion [
mm
]
Time [s]
W64-22
Tref= -12 C
Trial-1
Trial-2
Trial-3
0
0.4
0.8
1.2
1.6
2
2.4
2.8
3.2
3.6
0 100 200 300
Def
lect
ion [
mm
]
Time [s]
S64-22
Tref= -12 C
Trial-1
Trial-2
Trial-3
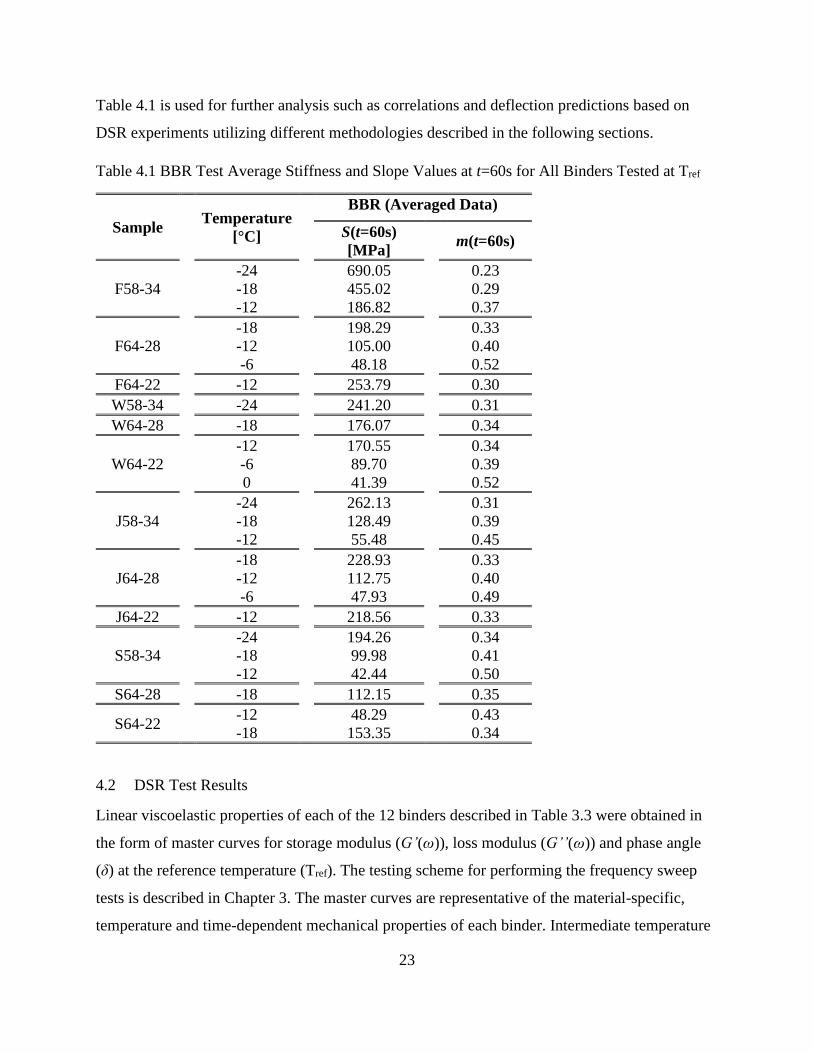
23
Table 4.1 is used for further analysis such as correlations and deflection predictions based on
DSR experiments utilizing different methodologies described in the following sections.
Table 4.1 BBR Test Average Stiffness and Slope Values at t=60s for All Binders Tested at Tref
Sample
Temperature
[°C]
BBR (Averaged Data)
S(t=60s)
[MPa]
m(t=60s)
F58-34
-24 690.05 0.23
-18 455.02 0.29
-12 186.82 0.37
F64-28
-18 198.29 0.33
-12 105.00 0.40
-6 48.18 0.52
F64-22 -12 253.79 0.30
W58-34 -24 241.20 0.31
W64-28 -18 176.07 0.34
W64-22
-12 170.55 0.34
-6 89.70 0.39
0 41.39 0.52
J58-34
-24 262.13 0.31
-18 128.49 0.39
-12 55.48 0.45
J64-28
-18 228.93 0.33
-12 112.75 0.40
-6 47.93 0.49
J64-22 -12 218.56 0.33
S58-34
-24 194.26 0.34
-18 99.98 0.41
-12 42.44 0.50
S64-28 -18 112.15 0.35
S64-22 -12 48.29 0.43
-18 153.35 0.34
4.2 DSR Test Results
Linear viscoelastic properties of each of the 12 binders described in Table 3.3 were obtained in
the form of master curves for storage modulus (G’(ω)), loss modulus (G’’(ω)) and phase angle
(δ) at the reference temperature (Tref). The testing scheme for performing the frequency sweep
tests is described in Chapter 3. The master curves are representative of the material-specific,
temperature and time-dependent mechanical properties of each binder. Intermediate temperature
24
(65 °C to 0 °C) testing of the binder using DSR are usually performed using the 8-mm parallel
plate geometry and tests using this geometry are usually avoided at temperatures below 0 °C due
to increased stress levels and necessary compliance correction. Recently Sui et al. (12, 13)
explored the use of 4-mm parallel plate as a suitable geometry for binder rheological
characterization at very low temperatures. With necessary compliance correction (12, 13, 43)
either of the two geometries can be used for binder rheological tests at freezing temperatures in
the range of 0 °C to -40 °C. Hence in the current investigation 8-mm parallel plate was employed
for most of the DSR frequency sweep experiments, additionally; 4-mm plate experiments were
also conducted on a set of randomly selected samples. The 4-mm experiments were performed
for determining the plate/geometry independence between the 4-mm and 8-mm plates when
obtaining the rheological properties below 0 °C.
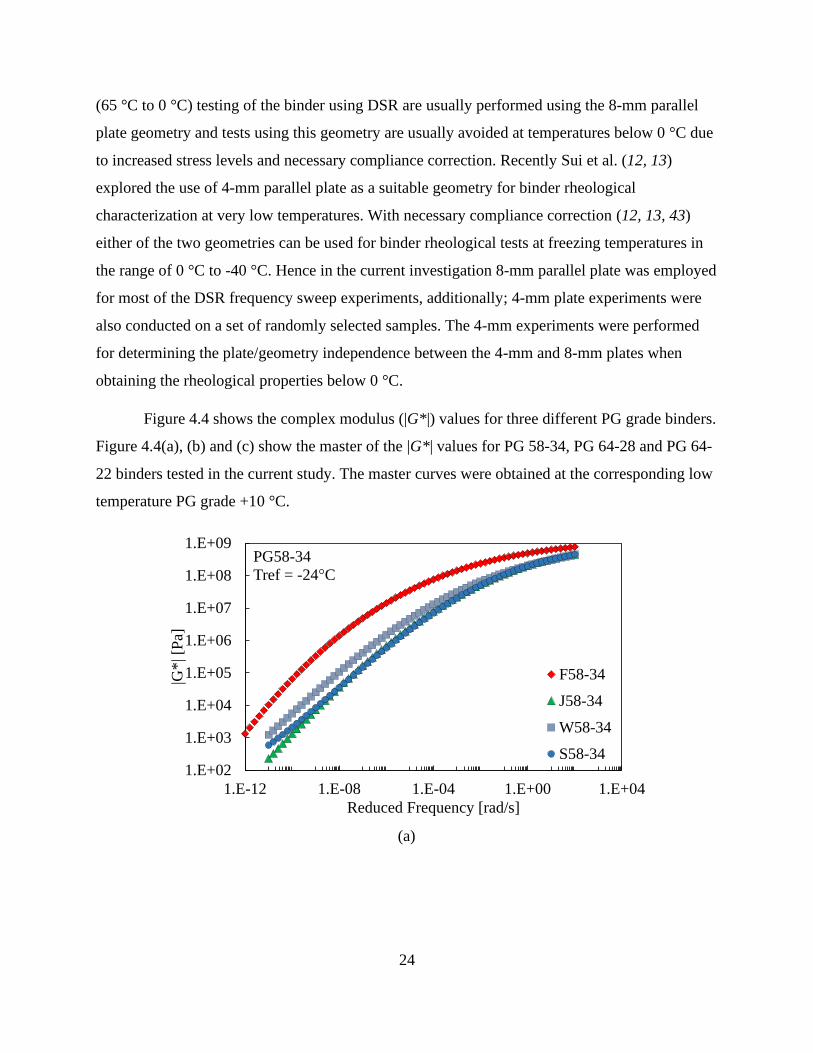
Figure 4.4 shows the complex modulus (|G*|) values for three different PG grade binders.
Figure 4.4(a), (b) and (c) show the master of the |G*| values for PG 58-34, PG 64-28 and PG 64-
22 binders tested in the current study. The master curves were obtained at the corresponding low
temperature PG grade +10 °C.
(a)
1.E+02
1.E+03
1.E+04
1.E+05
1.E+06
1.E+07
1.E+08
1.E+09
1.E-12 1.E-08 1.E-04 1.E+00 1.E+04
|G*
| [P
a]
Reduced Frequency [rad/s]
PG58-34
Tref = -24 C
F58-34
J58-34
W58-34
S58-34

25
(b)
(c)
Figure 4.4 Master curve of |G*| values using trial-1 data: (a) PG 58-34, (b) PG 64-28, and (c) PG
64-22 grade binders performed by 8-mm parallel plate.
Additionally, to investigate the influence of plate geometry on the rheological properties
of the binder at low temperatures, frequency sweep tests were performed on several samples
using the 4-mm parallel plate geometry. Four binders shown in Table 3.4 were randomly selected
from the sample group and tested using the 4-mm parallel plate. The testing scheme and
methodology adopted for the 4-mm geometry were similar to those used for 8-mm geometry
such that similar testing conditions were maintained. Also, necessary compliance correction was
1.E+02
1.E+03
1.E+04
1.E+05
1.E+06
1.E+07
1.E+08
1.E+09
1.E-12 1.E-08 1.E-04 1.E+00 1.E+04
|G*
| [P
a]
Reduced Frequency [rad/s]
PG64-28
Tref= -18 C
F64-28
J64-28
W64-28
S64-28
1.E+02
1.E+03
1.E+04
1.E+05
1.E+06
1.E+07
1.E+08
1.E+09
1.E-12 1.E-08 1.E-04 1.E+00 1.E+04
|G*
| [P
a]
Reduced Frequency [rad/s]
PG64-22
Tref = -12 C
F64-22
J64-22
W64-22
S64-22

26
automatically performed using the rSpace software of Malvern Kinexus DSR that was used to
control the experiments. Figure 4.5 shows the |G*| master curves of the four binders. As shown,
the master curve results were quite similar and does not depend on the type of geometry used for
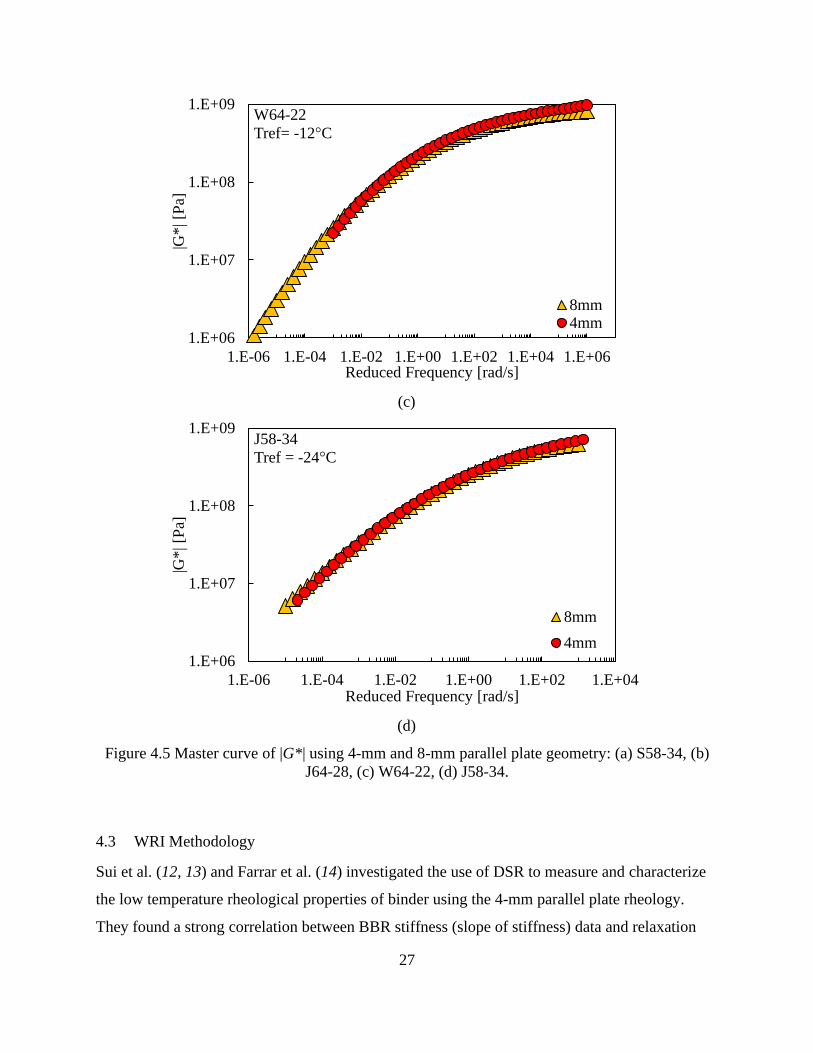
performing the oscillatory tests at temperatures below 0 °C. With necessary steps such as
compliance correction and normal force control for variable gap are considered with precise
sample trimming conditions when performing the experiments, a good match between the 8-mm
and 4-mm parallel plate geometry were achieved.
(a)
(b)
1.E+06
1.E+07
1.E+08
1.E+09
1.E-06 1.E-04 1.E-02 1.E+00 1.E+02 1.E+04
|G*| [P
a]
Reduced Frequency [rad/s]
S58-34
Tref = -24 C
8mm4mm
1.E+06
1.E+07
1.E+08
1.E+09
1.E-06 1.E-04 1.E-02 1.E+00 1.E+02 1.E+04
|G*| [P
a]
Redcued Frequency [rad/s]
J64-28
Tref= -18 C
8mm
4mm
27
(c)
(d)
Figure 4.5 Master curve of |G*| using 4-mm and 8-mm parallel plate geometry: (a) S58-34, (b)
J64-28, (c) W64-22, (d) J58-34.
4.3 WRI Methodology
Sui et al. (12, 13) and Farrar et al. (14) investigated the use of DSR to measure and characterize
the low temperature rheological properties of binder using the 4-mm parallel plate rheology.
They found a strong correlation between BBR stiffness (slope of stiffness) data and relaxation
1.E+06
1.E+07
1.E+08
1.E+09
1.E-06 1.E-04 1.E-02 1.E+00 1.E+02 1.E+04 1.E+06
|G*| [P
a]
Reduced Frequency [rad/s]
W64-22
Tref= -12 C
8mm4mm
1.E+06
1.E+07
1.E+08
1.E+09
1.E-06 1.E-04 1.E-02 1.E+00 1.E+02 1.E+04
|G*| [P
a]
Reduced Frequency [rad/s]
J58-34
Tref = -24 C
8mm
4mm

28
modulus (slope of relaxation modulus) of binders measured at time t = 60s and temperature
PG+10 °C. Based on these correlations Farrar et al. (14) developed an alternative low
temperature grading criterion at Western Research Institute (WRI). The fundamental idea in the
WRI methodology is to obtain cutoff parameters similar to the BBR stiffness (S(t)) and slope
(mBBR(t)) criterion through measurements made using the 4-mm parallel plate DSR. In this
method an equivalent cutoff relaxation modulus (G(t)) and slope (mDSR) parameters were
established through linear correlation between data obtained using the DSR and BBR. The shear
relaxation modulus G(t) as a function of time was obtained by converting the master curve of the
frequency dependent storage modulus (G’(ω)) test data at the reference temperature (Tref) of
PG+10 °C. The interconversion from frequency domain to time domain was then conducted
using the approximated equation given by Christensen (51) as shown in Equation 4.1.
𝐺(𝑡) ≈ 𝐺′(𝜔)|𝜔=2 𝜋𝑡⁄ (4.1)
The procedure adopted for implementing the WRI methodology to the binders selected in
the current investigation is described next. Based on the low temperature PG grade of the
selected binder, frequency sweep data of four temperatures close to the low PG grade were
selected for WRI analysis. As an example, if a binder that satisfies PG 58-34 was selected,
frequency sweep data at temperatures of -24 °C, -18 °C, -12 °C and -6 °C were selected and a
master of the G’(ω) was constructed. Figure 4.6 (a) and (b) show the storage modulus (G’(ω)) at
different temperatures and the master curve of G’(ω) respectively at a reference temperature of
Tref = -24°C for sample S58-34. Figure 4.6 (c) shows the interconverted frequency domain G’(ω)
to shear relaxation modulus G(t). A second order polynomial is fitted to the log(G(t)) vs. log(t)
data and the corresponding value of G(t=60s) and slope (mDSR(t=60s)) is calculated using the
fitted equation. Similarly, G(t=60s) and mDSR(t=60s) is obtained for all the binders investigated
in the current study for correlating or comparing with the corresponding BBR stiffness S(t=60s)
and mBBR(t=60s).

29
(a) (b)
(C)
Figure 4.6 Example of WRI methodology for sample S58-34: (a) storage modulus at different
temperatures, (b) master curve of the storage modulus at Tref= -24°C, (c) method for obtaining
G(t=60s) and m(t=60s).
In order to fully utilize this methodology, it is necessary to have a good data base that
covers a range of binder grade specifications such that, the relaxation modulus and slope
criterion can be calibrated according to the binders used in a specific region or State, in this
study, the state of Nebraska.
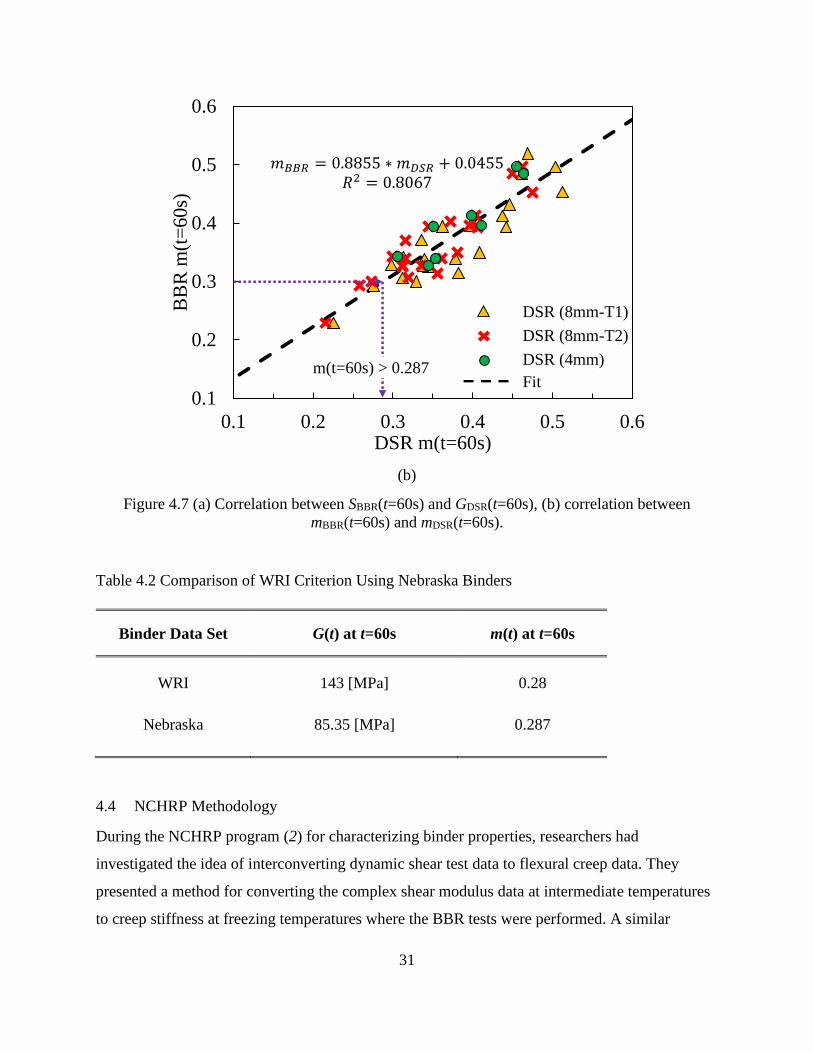
Figure 4.7 shows the result of applying the WRI methodology to the binders selected in
this study. Generally, good linear correlations were observed when comparing the DSR
relaxation modulus G(t=60s) and slope mDSR results with the corresponding creep stiffness
S(t=60s) values and slope mBBR(t=60s) of the BBR tests. For the binder data base selected in the
current study the low temperature grading criterion was established to limiting the shear modulus
G(t=60s) < 85.35 MPa and absolute slope of the G(t) vs. t curve at t=60s to be mDSR(t=60s) >
1.0E+07
1.0E+08
1.0E+09
0.5 5 50 500
G’(ω
) [P
a]
Frequency [rad/s]
-6 DegC
-12 DegC
-18 DegC
-24 DegC
S58-34
1.0E+07
1.0E+08
1.0E+09
0.0001 0.01 1 100
G’(ω
) [P
a]
Frequency [rad/s]
-6 DegC
-12 DegC
-18 DegC
-24 DegC
S58-34
Tref = -24 C
6.5
7
7.5
8
8.5
9
-4 -2 0 2 4
log
[G(t
)]
Log[Time]
S58-34, Tref = -24 CLog[G(t)]
Poly Fit
Log(60s)=1.78
Log[G(t=60s)]
m=slope of tangent

30
0.287, as shown in Table 4.2. It can be observed that the limiting criterion are different for the
relaxation modulus as compared to the WRI estimation. This demonstrates that the methodology
is strongly dependent on the binder data base selected and it is necessary to calibrate the method
more often to meet the state DOT’s current practice. Nonetheless, the slope limiting value
obtained from the Nebraska binder data set is close to the value proposed by WRI as shown in
Table 4.2. The binders often tend to fail at the slope criterion earlier than the relaxation modulus
criterion, either of the limiting values can be considered. Alternatively, for more strict grading
criterion, the calibrated values from the Nebraska binder dataset can be used and updated-
recalibrated as new binders are introduced into the dataset.
(a)
0
150
300
450
600
750
900
0 50 100 150 200 250
BB
R S
(t=
60
s) [
MP
a]
DSR G(t=60s) [MPa]
G(t=60s) < 85.35 MPa
𝑆(𝑡) = 𝐺(𝑡) 2= 4
DSR (8mm-T1)
DSR (8mm-T2)
DSR (4mm)
Fit
31
(b)
Figure 4.7 (a) Correlation between SBBR(t=60s) and GDSR(t=60s), (b) correlation between
mBBR(t=60s) and mDSR(t=60s).
Table 4.2 Comparison of WRI Criterion Using Nebraska Binders
Binder Data Set G(t) at t=60s m(t) at t=60s
WRI 143 [MPa] 0.28
Nebraska 85.35 [MPa] 0.287
4.4 NCHRP Methodology
During the NCHRP program (2) for characterizing binder properties, researchers had
investigated the idea of interconverting dynamic shear test data to flexural creep data. They
presented a method for converting the complex shear modulus data at intermediate temperatures
to creep stiffness at freezing temperatures where the BBR tests were performed. A similar
0.1
0.2
0.3
0.4
0.5
0.6
0.1 0.2 0.3 0.4 0.5 0.6
BB
R m
(t=
60
s)
DSR m(t=60s)
m(t=60s) > 0.287
= 4 2 =
DSR (8mm-T1)
DSR (8mm-T2)
DSR (4mm)
Fit
32
approach termed as the NCHRP methodology was thus investigated here for the binder data set
used in this study. The advantage of this methodology lies in the fact that DSR tests can be
performed at relatively much higher temperatures compared to the BBR test temperature and
then shifted to the corresponding low temperature using simple shift factors.
The range of the intermediate temperature for performing the DSR frequency sweep tests
depends on the low temperature grade of the binder selected. Relevant frequency sweep tests
performed using DSR within this temperature range can be converted to the corresponding
stiffness S(t) data using Equation 4.2.
𝑆(𝑡) ≈ 𝐺 (𝜔)
[ sin( 𝛿)] , 𝑡 → 𝜔⁄ (4.2)
where S(t) [Pa] is the creep stiffness as a function of time t [s], G*(ω) [Pa] is the complex
modulus as a function of frequency ω [rad/s] and δ is the phase angle at the corresponding
frequency.
Since BBR tests are performed at relatively low temperatures close to PG+10°C and
measurements are made at time t=60s, the stiffness data obtained from DSR tests need to be
shifted to the BBR test temperature. The shift factor applied to the DSR stiffness data is based on
the Arrhenius equation as shown in Equation 4.3.
log (𝑡𝑟𝑒𝑓
𝑡) =
𝐸𝑎
[
𝑇𝑟𝑒𝑓 −
𝑇 ] (4.3)
where 𝑡𝑟𝑒𝑓 and 𝑇𝑟𝑒𝑓 are the reference time [s] and temperature [°C] (related to BBR test
conditions) respectively, 𝑡 and 𝑇 are the testing time [s] and temperature [°C] (related to the
intermediate DSR tests), respectively, and 𝐸𝑎 is activation energy and is ideal gas constant
8.31 [J/°K-mol]. The value of 𝑡𝑟𝑒𝑓
𝑡 is termed as the shift factor ( 𝑎𝑇
𝑡𝑖𝑚𝑒 ) in the time domain.
Usually the activation energy parameter is dependent on the binder rheological response
as a function of temperature that is unique to a given binder, whereas in the NCHRP
methodology, this parameter was fixed at 250,000 [J/mol]. Table 4.3 shows the target frequency
needed for the DSR frequency sweep at different intermediate temperatures to represent the
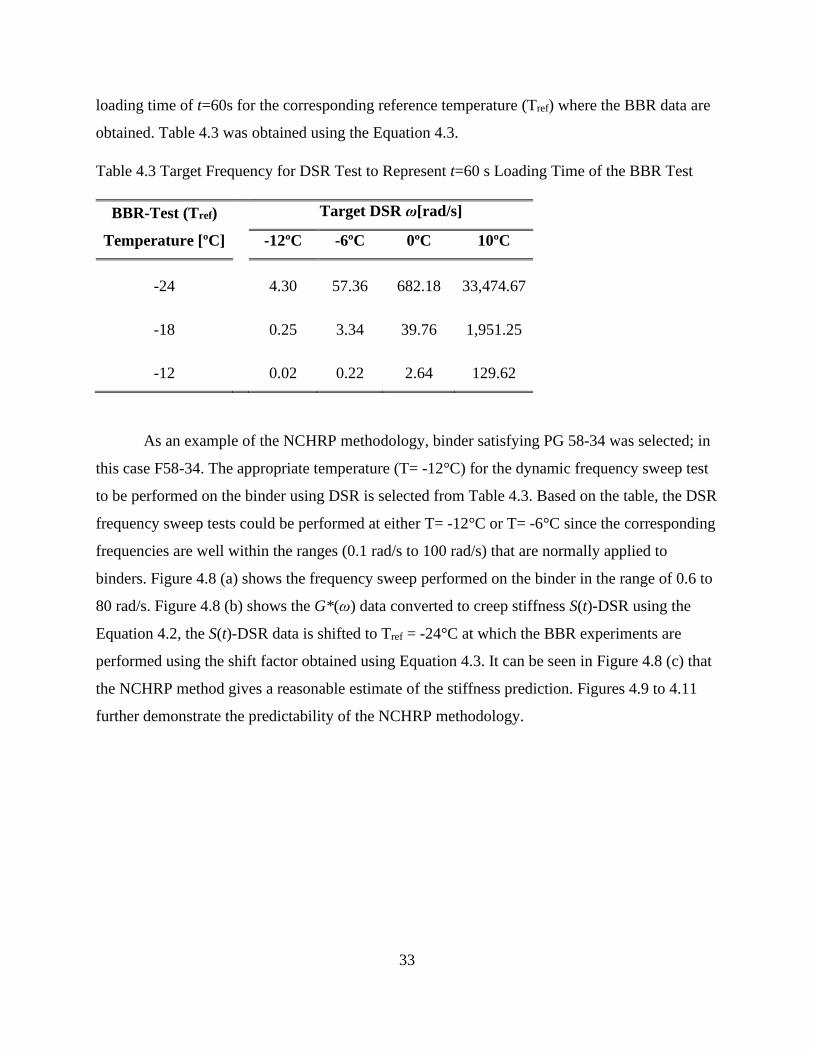
33
loading time of t=60s for the corresponding reference temperature (Tref) where the BBR data are
obtained. Table 4.3 was obtained using the Equation 4.3.
Table 4.3 Target Frequency for DSR Test to Represent t=60 s Loading Time of the BBR Test
BBR-Test (Tref)
Temperature [ºC]
Target DSR ω[rad/s]
-12ºC -6ºC 0ºC 10ºC
-24 4.30 57.36 682.18 33,474.67
-18 0.25 3.34 39.76 1,951.25
-12 0.02 0.22 2.64 129.62
As an example of the NCHRP methodology, binder satisfying PG 58-34 was selected; in
this case F58-34. The appropriate temperature (T= -12°C) for the dynamic frequency sweep test
to be performed on the binder using DSR is selected from Table 4.3. Based on the table, the DSR
frequency sweep tests could be performed at either T= -12°C or T= -6°C since the corresponding
frequencies are well within the ranges (0.1 rad/s to 100 rad/s) that are normally applied to
binders. Figure 4.8 (a) shows the frequency sweep performed on the binder in the range of 0.6 to
80 rad/s. Figure 4.8 (b) shows the G*(ω) data converted to creep stiffness S(t)-DSR using the
Equation 4.2, the S(t)-DSR data is shifted to Tref = -24°C at which the BBR experiments are
performed using the shift factor obtained using Equation 4.3. It can be seen in Figure 4.8 (c) that
the NCHRP method gives a reasonable estimate of the stiffness prediction. Figures 4.9 to 4.11
further demonstrate the predictability of the NCHRP methodology.
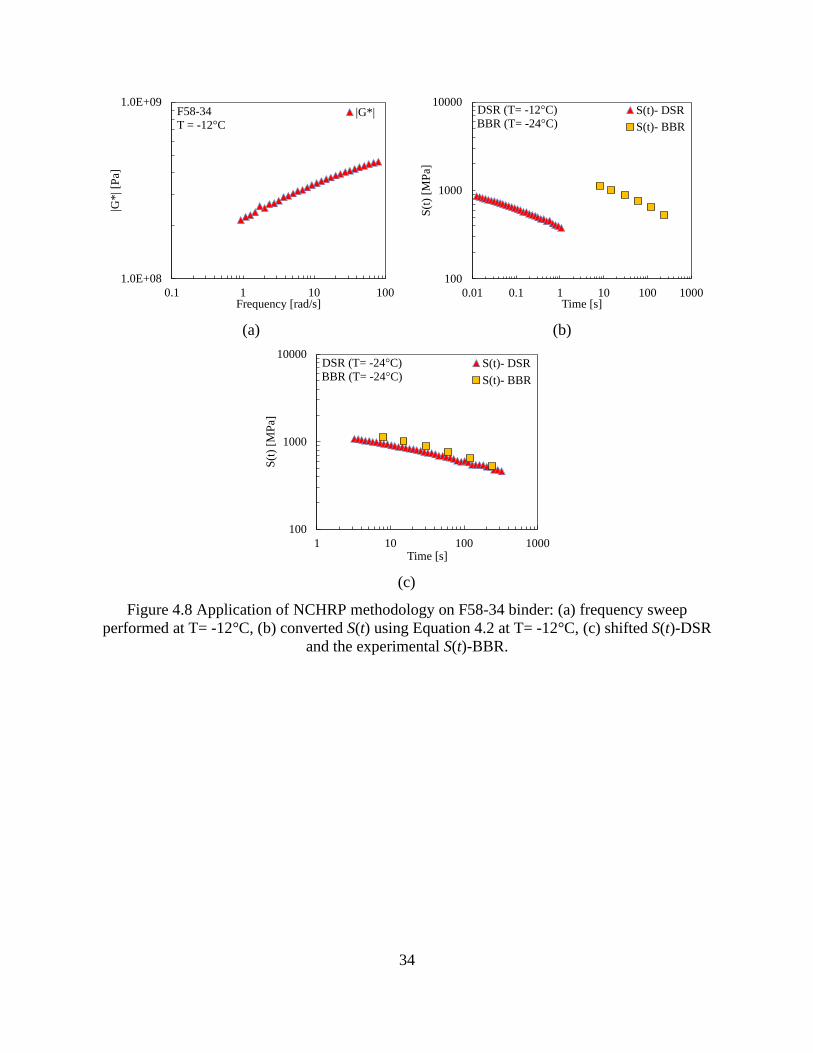
34
(a) (b)
(c)
Figure 4.8 Application of NCHRP methodology on F58-34 binder: (a) frequency sweep
performed at T= -12°C, (b) converted S(t) using Equation 4.2 at T= -12°C, (c) shifted S(t)-DSR
and the experimental S(t)-BBR.
1.0E+08
1.0E+09
0.1 1 10 100
|G*
| [P
a]
Frequency [rad/s]
F58-34
T = -12 C|G*|
100
1000
10000
0.01 0.1 1 10 100 1000
S(t
) [M
Pa]
Time [s]
DSR (T= -12 C)
BBR (T= -24 C)S(t)- DSR
S(t)- BBR
100
1000
10000
1 10 100 1000
S(t
) [M
Pa]
Time [s]
DSR (T= -24 C)
BBR (T= -24 C)S(t)- DSR
S(t)- BBR
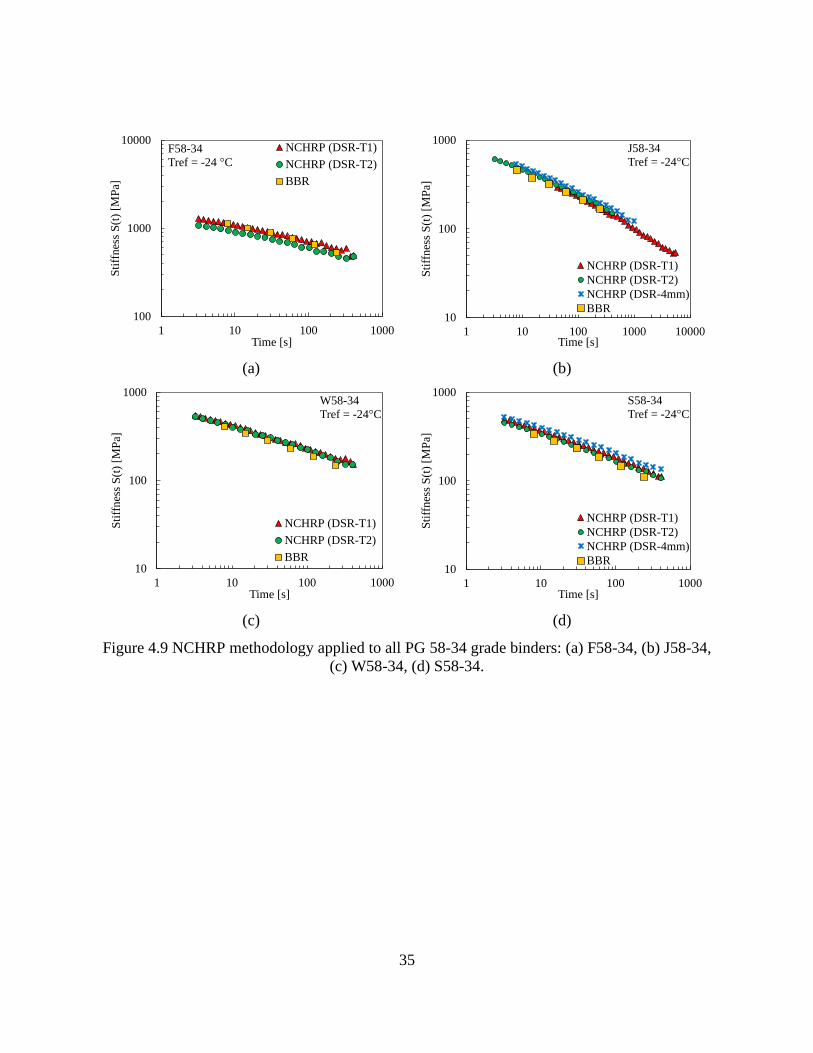
35
(a) (b)
(c) (d)
Figure 4.9 NCHRP methodology applied to all PG 58-34 grade binders: (a) F58-34, (b) J58-34,
(c) W58-34, (d) S58-34.
100
1000
10000
1 10 100 1000
Sti
ffn
ess
S(t
) [M
Pa]
Time [s]
F58-34
Tref = -24 C
NCHRP (DSR-T1)
NCHRP (DSR-T2)
BBR
10
100
1000
1 10 100 1000 10000
Sti
ffn
ess
S(t
) [M
Pa]
Time [s]
J58-34
Tref = -24 C
NCHRP (DSR-T1)
NCHRP (DSR-T2)
NCHRP (DSR-4mm)
BBR
10
100
1000
1 10 100 1000
Sti
ffn
ess
S(t
) [M
Pa]
Time [s]
W58-34
Tref = -24 C
NCHRP (DSR-T1)
NCHRP (DSR-T2)
BBR10
100
1000
1 10 100 1000
Sti
ffn
ess
S(t
) [M
Pa]
Time [s]
S58-34
Tref = -24 C
NCHRP (DSR-T1)
NCHRP (DSR-T2)
NCHRP (DSR-4mm)
BBR

36
(a) (b)
(c) (d)
Figure 4.10 NCHRP methodology applied to all PG 64-28 grade binders: (a) F64-28, (b) J64-28,
(c) W64-28, (d) S64-28.
10
100
1000
1 10 100 1000
Sti
ffn
ess
S(t
) [M
Pa]
Time [s]
F64-28
Tref = -18 C
NCHRP (DSR-T1)
NCHRP (DSR-T2)
BBR10
100
1000
1 10 100 1000
Sti
ffn
ess
S(t
) [M
Pa]
Time [s]
J64-28
Tref = -18 C
NCHRP (DSR-T1)
NCHRP (DSR-T2)
NCHRP (DSR-4mm)
BBR
10
100
1000
1 10 100 1000
Sti
ffn
ess
S(t
) [M
Pa]
Time [s]
W64-28
Tref = -18 C
NCHRP (DSR-T1)
NCHRP (DSR-T2)
BBR10
100
1000
1 10 100 1000
Sti
ffn
ess
S(t
) [M
Pa]
Time [s]
S64-28
Tref = -18 C
NCHRP (DSR-T1)
NCHRP (DSR-T2)
BBR

37
(a) (b)
(c) (d)
Figure 4.11 NCHRP methodology applied to all PG 64-22 grade binders: (a) F64-22, (b) J64-22,
(c) W64-22, (d) S64-22.
10
100
1000
1 10 100 1000
Sti
ffn
ess
S(t
) [M
Pa]
Time [s]
F64-22
Tref = -12 C
NCHRP (DSR-T1)
NCHRP (DSR-T2)
BBR10
100
1000
1 10 100 1000
Sti
ffn
ess
S(t
) [M
Pa]
Time [s]
J64-22
Tref = -12 C
NCHRP (DSR-T1)
NCHRP (DSR-T2)
BBR
10
100
1000
1 10 100 1000
Sti
ffn
ess
S(t
) [M
Pa]
Time [s]
W64-22
Tref = -12 C
NCHRP (DSR-T1)
NCHRP (DSR-T2)
NCHRP (DSR-4mm)
BBR10
100
1000
1 10 100 1000
Sti
ffn
ess
S(t
) [M
Pa]
Time [s]
S64-22
Tref = -12 C
NCHRP (DSR-T1)
BBR

38
Similarly, the NCHRP method described in Figure 4.8 was applied to all the binders
represented in Table 3.3 and Table 3.4. Figure 4.12 shows the linear correlation for the stiffness
S(t=60s) and m(t=60s) obtained using the NCHRP method and experimental BBR data. In Figure
4.12 (a) it can be observed that stiffness predictions using the NCHRP method are reasonably
accurate as shown by the closeness of the linear fit to the line of equality. In Figure 4.12 (b) it
can be observed that slope predictions using the NCHRP method deviate from the line of
equality and mostly underpredict the BBR experimental values. This can be attributed to the use
of single activation energy (Ea) used for shifting the DSR-S(t) data for different binders, usually
this parameter is specific and unique to a given binder.

39
(a)
(b)
Figure 4.12 Correlation between (a) stiffness S(t=60s), (b) slope m(t=60s) obtained using
NCHRP method and experimental BBR data.
0
100
200
300
400
500
600
700
800
0 100 200 300 400 500 600 700 800
BB
R S
(t=
60)
[MP
a]
NCHRP S(t=60s) [MPa]
Line of Equality
Linear Fit
DSR-T1
DSR-T2
DSR-4mm
𝐿 𝑎 𝑡 𝑆 = 4 𝑆 4,
2 =
0
100
200
300
400
500
600
700
800
0 100 200 300 400 500 600 700 800
BB
R S
(t=
60)
[MP
a]
NCHRP S(t=60s) [MPa]
Line of Equality
Linear Fit
DSR-T1
DSR-T2
DSR-4mm
𝐿 𝑎 𝑡 𝑆 = 4 𝑆 4,
2 =
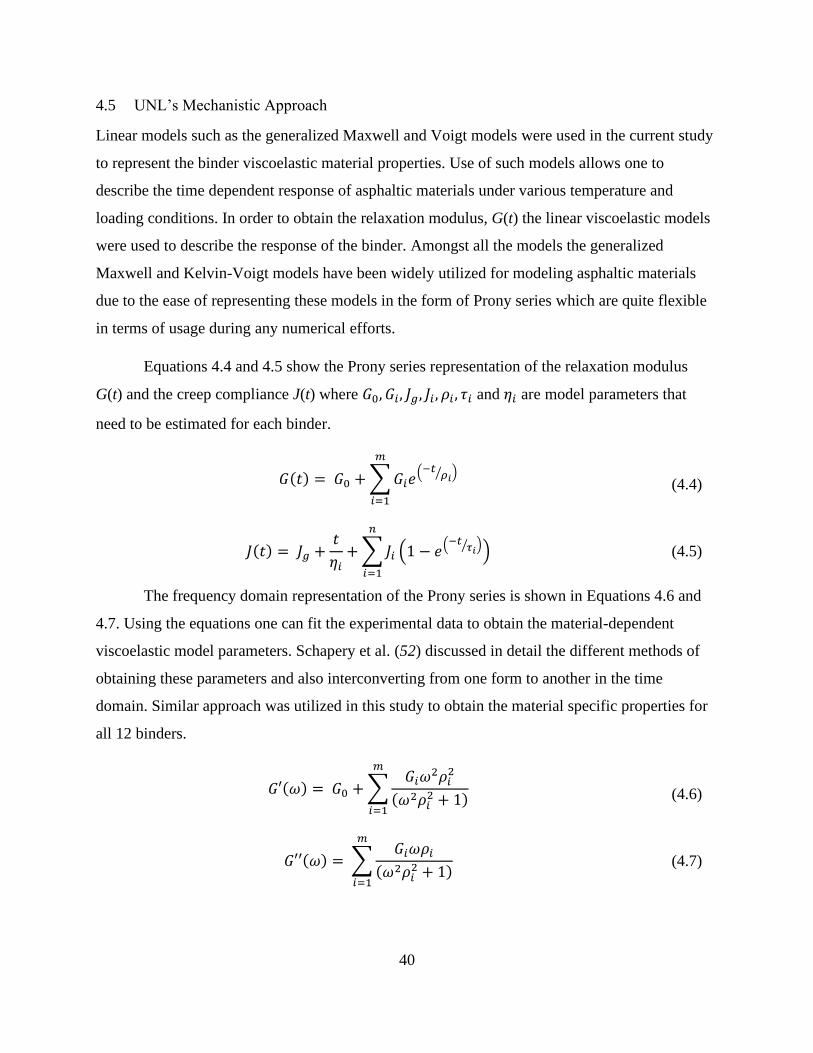
40
4.5 UNL’s Mechanistic Approach
Linear models such as the generalized Maxwell and Voigt models were used in the current study
to represent the binder viscoelastic material properties. Use of such models allows one to
describe the time dependent response of asphaltic materials under various temperature and
loading conditions. In order to obtain the relaxation modulus, G(t) the linear viscoelastic models
were used to describe the response of the binder. Amongst all the models the generalized
Maxwell and Kelvin-Voigt models have been widely utilized for modeling asphaltic materials
due to the ease of representing these models in the form of Prony series which are quite flexible
in terms of usage during any numerical efforts.
Equations 4.4 and 4.5 show the Prony series representation of the relaxation modulus
G(t) and the creep compliance J(t) where 𝐺0, 𝐺𝑖, 𝐽𝑔, 𝐽𝑖 , 𝜌𝑖 , 𝜏𝑖 and 𝜂𝑖 are model parameters that
need to be estimated for each binder.
𝐺(𝑡) = 𝐺0 ∑𝐺𝑖 (−𝑡 𝜌𝑖⁄ )
𝑚
𝑖=1
(4.4)
𝐽(𝑡) = 𝐽𝑔 𝑡
𝜂𝑖 ∑𝐽𝑖 ( −
(−𝑡 𝜏𝑖⁄ ))
𝑛
𝑖=1
(4.5)
The frequency domain representation of the Prony series is shown in Equations 4.6 and
4.7. Using the equations one can fit the experimental data to obtain the material-dependent
viscoelastic model parameters. Schapery et al. (52) discussed in detail the different methods of
obtaining these parameters and also interconverting from one form to another in the time
domain. Similar approach was utilized in this study to obtain the material specific properties for
all 12 binders.
𝐺′(𝜔) = 𝐺0 ∑𝐺𝑖𝜔
2𝜌𝑖2
(𝜔2𝜌𝑖2 )
𝑚
𝑖=1
(4.6)
𝐺′′(𝜔) = ∑𝐺𝑖𝜔𝜌𝑖
(𝜔2𝜌𝑖2 )
𝑚
𝑖=1
(4.7)

41
As an example, Figure 4.13 shows the Prony fit for the G’ and G’’ that were used to
obtain the material parameters of the binder J64-28 using the method described by Schapery et
al. (52). Similarly, the binder specific material parameters were obtained for each binder.
(a)
(b)
Figure 4.13 Prony fit to the experimental data: (a) G’(ω) and G’’(ω) data, (b) |G*| data for J64-
28 at Tref = -18°C.
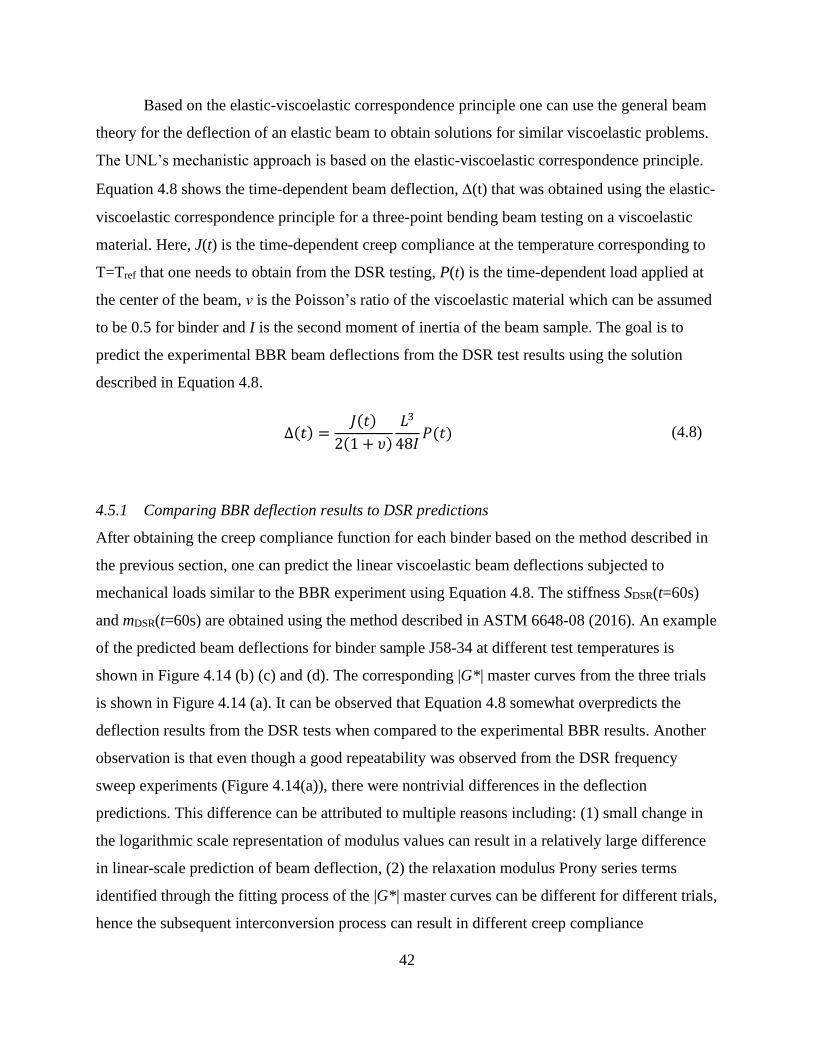
42
Based on the elastic-viscoelastic correspondence principle one can use the general beam
theory for the deflection of an elastic beam to obtain solutions for similar viscoelastic problems.
The UNL’s mechanistic approach is based on the elastic-viscoelastic correspondence principle.
Equation 4.8 shows the time-dependent beam deflection, (t) that was obtained using the elastic-
viscoelastic correspondence principle for a three-point bending beam testing on a viscoelastic
material. Here, J(t) is the time-dependent creep compliance at the temperature corresponding to
T=Tref that one needs to obtain from the DSR testing, P(t) is the time-dependent load applied at
the center of the beam, ν is the Poisson’s ratio of the viscoelastic material which can be assumed
to be 0.5 for binder and I is the second moment of inertia of the beam sample. The goal is to
predict the experimental BBR beam deflections from the DSR test results using the solution
described in Equation 4.8.
∆(𝑡) =𝐽(𝑡)
( 𝜐)
𝐿3
4 𝐼𝑃(𝑡) (4.8)
4.5.1 Comparing BBR deflection results to DSR predictions
After obtaining the creep compliance function for each binder based on the method described in
the previous section, one can predict the linear viscoelastic beam deflections subjected to
mechanical loads similar to the BBR experiment using Equation 4.8. The stiffness SDSR(t=60s)
and mDSR(t=60s) are obtained using the method described in ASTM 6648-08 (2016). An example
of the predicted beam deflections for binder sample J58-34 at different test temperatures is
shown in Figure 4.14 (b) (c) and (d). The corresponding |G*| master curves from the three trials
is shown in Figure 4.14 (a). It can be observed that Equation 4.8 somewhat overpredicts the
deflection results from the DSR tests when compared to the experimental BBR results. Another
observation is that even though a good repeatability was observed from the DSR frequency
sweep experiments (Figure 4.14(a)), there were nontrivial differences in the deflection
predictions. This difference can be attributed to multiple reasons including: (1) small change in
the logarithmic scale representation of modulus values can result in a relatively large difference
in linear-scale prediction of beam deflection, (2) the relaxation modulus Prony series terms
identified through the fitting process of the |G*| master curves can be different for different trials,
hence the subsequent interconversion process can result in different creep compliance

43
parameters, and (3) different cooling media and equilibration time used for the two tests (DSR
and BBR) can result in unequal physical hardening effects.
(a) (b)
(c) (d)
Figure 4.14 DSR data of J58-34 binder where (a) |G*| Master curves for different trials. DSR
deflection results at (b) Tref = -24°C (c) Tref = -18°C and (d) Tref = -12°C.
Equation 4.8 was utilized to predict the BBR results for all the binders. Figure 4.15 (a)
and (b) compare the DSR prediction with BBR results for creep stiffness (S(t)) and slope m-
value, respectively. It can be observed that the UNL mechanistic method (using the linear
viscoelastic correspondence principle) generally underpredicts the stiffness and slope values for
most of binders.
1.0E+02
1.0E+03
1.0E+04
1.0E+05
1.0E+06
1.0E+07
1.0E+08
1.0E+09
1.0E-11 1.0E-07 1.0E-03 1.0E+01 1.0E+05
|G*
| [P
a]
Reduced Frequency [rad/s]
J58-34
Tref = -24 C
J58-34(T1)
J58-34(T2)
J58-34(T3)0
0.1
0.2
0.3
0.4
0.5
0.6
0.7
0.8
0 100 200 300 400
Def
lect
ion
[m
m]
Time [s]
J58-34
Tref = -24 C
Experimental (BBR)
Prediction (DSR-T1)
Prediction (DSR-T2)
Prediction (DSR-4mm)
0
0.2
0.4
0.6
0.8
1
1.2
1.4
1.6
1.8
0 100 200 300 400
Def
lect
ion
[m
m]
Time [s]
J58-34
Tref = -18 C
Experimental (BBR)
Prediction (DSR-T1)
Prediction (DSR-T2)
Prediction (DSR-4mm)0
0.5
1
1.5
2
2.5
3
3.5
4
4.5
5
0 100 200 300 400
Def
lect
ion
[m
m]
Time [s]
J58-34
Tref = -12 C
Experimental (BBR)
Prediction (DSR-T1)
Prediction (DSR-T2)
Prediction (DSR-4mm)

44
(a)
(b)
Figure 4.15 (a) Comparison of the DSR predicted S(t=60s) with the BBR S(t=60s), (b)
comparison of the DSR predicted m(t=60s) with the BBR m(t=60s) for PG 58-34, PG 64-28 and
PG 64-22 binders.
0
50
100
150
200
250
300
0 50 100 150 200 250 300
BB
R S
(t=
60
s) [
MP
a]
DSR S(t=60s) [MPa]
Line of Equality
PG58-34
PG64-28
PG64-22
0.20
0.30
0.40
0.50
0.60
0.20 0.30 0.40 0.50 0.60
BB
R m
(t=
60
s)
DSR m(t=60s)
Line of Equality
PG58-34
PG64-28
PG64-22
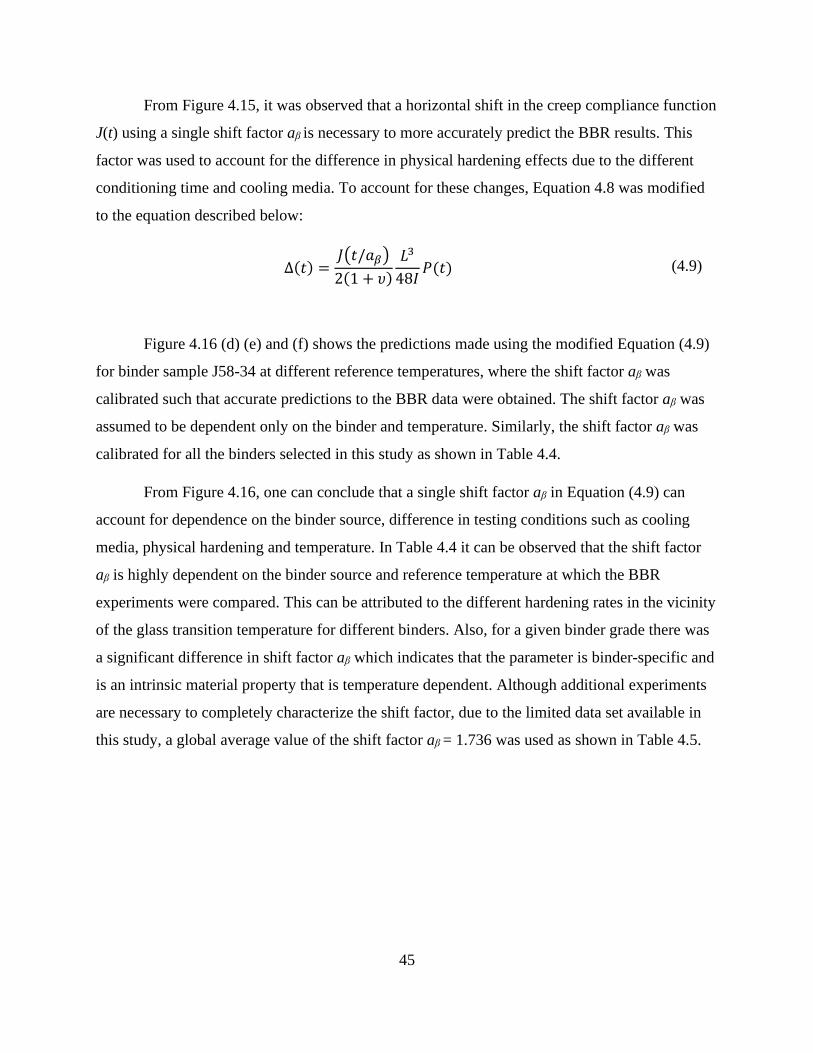
45
From Figure 4.15, it was observed that a horizontal shift in the creep compliance function
J(t) using a single shift factor aβ is necessary to more accurately predict the BBR results. This
factor was used to account for the difference in physical hardening effects due to the different
conditioning time and cooling media. To account for these changes, Equation 4.8 was modified
to the equation described below:
∆(𝑡) =𝐽(𝑡/𝑎𝛽)
( 𝜐)
𝐿3
4 𝐼𝑃(𝑡) (4.9)
Figure 4.16 (d) (e) and (f) shows the predictions made using the modified Equation (4.9)
for binder sample J58-34 at different reference temperatures, where the shift factor aβ was
calibrated such that accurate predictions to the BBR data were obtained. The shift factor aβ was
assumed to be dependent only on the binder and temperature. Similarly, the shift factor aβ was
calibrated for all the binders selected in this study as shown in Table 4.4.
From Figure 4.16, one can conclude that a single shift factor aβ in Equation (4.9) can
account for dependence on the binder source, difference in testing conditions such as cooling
media, physical hardening and temperature. In Table 4.4 it can be observed that the shift factor
aβ is highly dependent on the binder source and reference temperature at which the BBR
experiments were compared. This can be attributed to the different hardening rates in the vicinity
of the glass transition temperature for different binders. Also, for a given binder grade there was
a significant difference in shift factor aβ which indicates that the parameter is binder-specific and
is an intrinsic material property that is temperature dependent. Although additional experiments
are necessary to completely characterize the shift factor, due to the limited data set available in
this study, a global average value of the shift factor aβ = 1.736 was used as shown in Table 4.5.

46
(a) (d)
(b) (e)
(c) (f)
Figure 4.16 The influence of shift factor aβ for predicting BBR results for J58-34: (a) aβ =1, (d)
aβ = 2.0 at Tref = -24°C (b) aβ = 1, (e) aβ = 1.429 at Tref = -18°C and (c) aβ = 1,(e) aβ = 1.667 at
Tref = -12°C.
0
0.1
0.2
0.3
0.4
0.5
0.6
0.7
0.8
0 100 200 300 400
Def
lect
ion
[m
m]
Time [s]
J58-34
Tref = -24 C
Experimental (BBR)
Prediction (DSR-T1)
Prediction (DSR-T2)
Prediction (DSR-4mm)
𝑎𝛽 =
0
0.1
0.2
0.3
0.4
0.5
0.6
0 100 200 300 400
Def
lect
ion
[m
m]
Time [s]
J58-34
Tref = -24 C
Experimental (BBR)
Prediction (DSR-T1)
Prediction (DSR-T2)
Prediction (DSR-4mm)
𝑎𝛽 =
0
0.2
0.4
0.6
0.8
1
1.2
1.4
1.6
0 100 200 300 400
Def
lect
ion
[m
m]
Time [s]
J58-34
Tref = -18 C
Experimental (BBR)
Prediction (DSR-T1)
Prediction (DSR-T2)
Prediction (DSR-4mm)
𝑎𝛽 =
0
0.2
0.4
0.6
0.8
1
1.2
1.4
0 100 200 300 400
Def
lect
ion
[m
m]
Time [s]
J58-34
Tref = -18 C
Experimental (BBR)
Prediction (DSR-T1)
Prediction (DSR-T2)
Prediction (DSR-4mm)
𝑎𝛽 = 4
0
0.5
1
1.5
2
2.5
3
3.5
4
4.5
5
0 100 200 300 400
Def
lect
ion
[m
m]
Time [s]
J58-34
Tref = -12 C
Experimental (BBR)
Prediction (DSR-T1)
Prediction (DSR-T2)
Prediction (DSR-4mm)
𝑎𝛽 =
0
0.5
1
1.5
2
2.5
3
3.5
4
0 100 200 300 400
Def
lect
ion
[m
m]
Time [s]
J58-34
Tref = -12 C
Experimental (BBR)
Prediction (DSR-T1)
Prediction (DSR-T2)
Prediction (DSR-4mm)
𝑎𝛽 =

47
Table 4.4 Shift Factor aβ Identified for Each Binder
Table 4.5 Average Shift Factor aβ of Each Different Group of Binder
PG 58-34 PG 64-28 PG 64-22 Global
1.814 1.893 1.462 1.736
Sample Temperature Factor
F58-34
-24 0.83 -18 1.25 -12 0.67
F64-28
-18 1.43 -12 2.22 -6 4.00
F64-22 -22 1.82
W58-34 -24 2.00
W64-28 -18 0.77
W64-22
-12 0.91 -6 1.43 0 2.50
J58-34
-24 2.00 -18 1.43 -12 1.67
J64-28
-18 1.43 -12 2.00 -6 2.86
J64-22 -12 1.25
S58-34
-24 2.00 -18 2.00 -12 1.67
S64-28 -18 1.82
S64-22 -12 0.67
-18 1.72
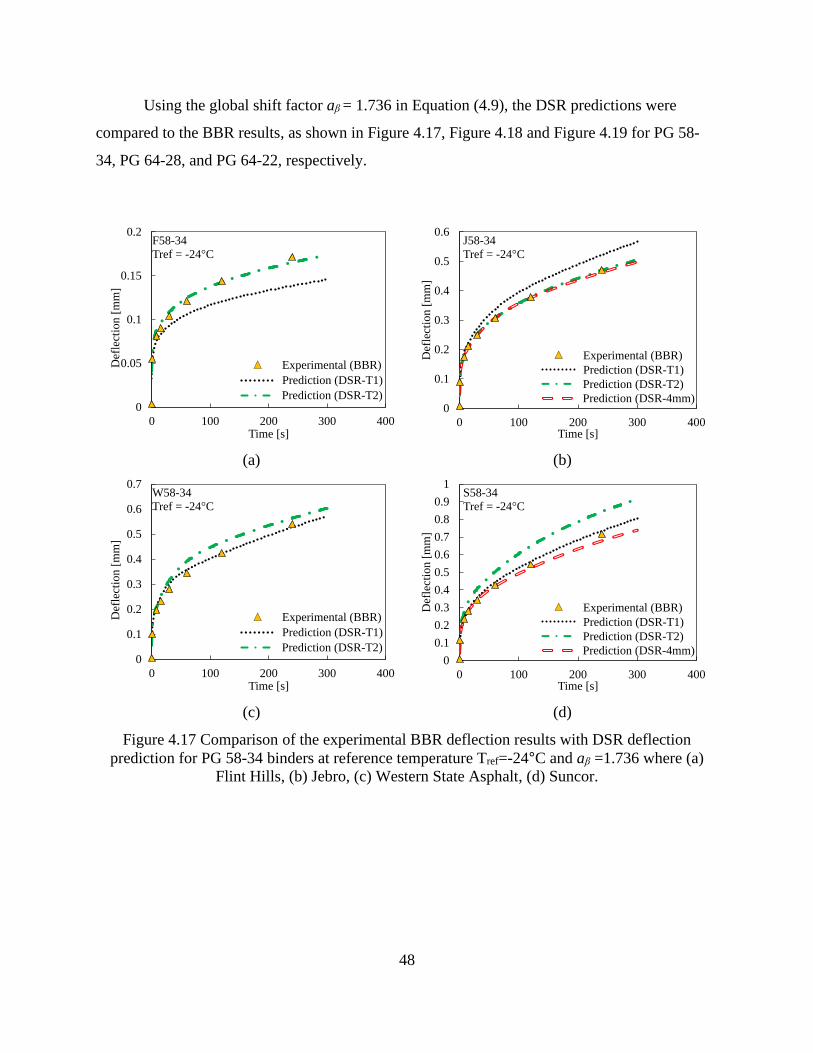
48
Using the global shift factor aβ = 1.736 in Equation (4.9), the DSR predictions were
compared to the BBR results, as shown in Figure 4.17, Figure 4.18 and Figure 4.19 for PG 58-
34, PG 64-28, and PG 64-22, respectively.
(a) (b)
(c) (d)
Figure 4.17 Comparison of the experimental BBR deflection results with DSR deflection
prediction for PG 58-34 binders at reference temperature Tref=-24°C and aβ =1.736 where (a)
Flint Hills, (b) Jebro, (c) Western State Asphalt, (d) Suncor.
0
0.05
0.1
0.15
0.2
0 100 200 300 400
Def
lect
ion
[m
m]
Time [s]
F58-34
Tref = -24 C
Experimental (BBR)
Prediction (DSR-T1)
Prediction (DSR-T2)0
0.1
0.2
0.3
0.4
0.5
0.6
0 100 200 300 400D
efle
ctio
n [
mm
]Time [s]
J58-34
Tref = -24 C
Experimental (BBR)
Prediction (DSR-T1)
Prediction (DSR-T2)
Prediction (DSR-4mm)
0
0.1
0.2
0.3
0.4
0.5
0.6
0.7
0 100 200 300 400
Def
lect
ion
[m
m]
Time [s]
W58-34
Tref = -24 C
Experimental (BBR)
Prediction (DSR-T1)
Prediction (DSR-T2)0
0.1
0.2
0.3
0.4
0.5
0.6
0.7
0.8
0.9
1
0 100 200 300 400
Def
lect
ion
[m
m]
Time [s]
S58-34
Tref = -24 C
Experimental (BBR)
Prediction (DSR-T1)
Prediction (DSR-T2)
Prediction (DSR-4mm)

49
(a) (b)
(c) (d)
Figure 4.18 Comparison of the experimental BBR deflection results with DSR deflection
prediction for PG 64-28 binders at reference temperature Tref=-18°C and aβ =1.736 where (a)
Flint Hills, (b) Jebro, (c) Western State Asphalt, (d) Suncor.
0
0.1
0.2
0.3
0.4
0.5
0.6
0.7
0.8
0 100 200 300 400
Def
lect
ion
[m
m]
Time [s]
F64-28
Tref = -18 C
Experimental (BBR)
Prediction (DSR-T1)
0
0.1
0.2
0.3
0.4
0.5
0.6
0.7
0 100 200 300 400
Def
lect
ion
[m
m]
Time [s]
J64-28
Tref = -18 C
Experimental (BBR)
Prediction (DSR-T1)
Prediction (DSR-T2)
Prediction (DSR-4mm)
0
0.1
0.2
0.3
0.4
0.5
0.6
0.7
0.8
0.9
0 100 200 300 400
Def
lect
ion
[m
m]
Time [s]
W64-28
Tref = -18 C
Experimental (BBR)
Prediction (DSR-T1)
Prediction (DSR-T2)0
0.2
0.4
0.6
0.8
1
1.2
1.4
1.6
0 100 200 300 400
Def
lect
ion
[m
m]
Time [s]
S64-28
Tref = -18 C
Experimental (BBR)
Prediction (DSR-T1)
Prediction (DSR-T2)

50
(a) (b)
(c) (d)
Figure 4.19 Comparison of the experimental BBR deflection results with DSR deflection
prediction for PG 64-22 binders at reference temperature Tref=-12°C and aβ = 1.736 where (a)
Flint Hills, (b) Jebro, (c) Western State Asphalt, (d) Suncor.
0
0.1
0.2
0.3
0.4
0.5
0.6
0 100 200 300 400
Def
lect
ion
[m
m]
Time [s]
F64-22
Tref = -12 C
Experimental (BBR)
Prediction (DSR-T1)
Prediction (DSR-T2)0
0.1
0.2
0.3
0.4
0.5
0.6
0.7
0 100 200 300 400
Def
lect
ion
[m
m]
Time [s]
J64-22
Tref = -12 C
Experimental (BBR)
Prediction (DSR-T1)
Prediction (DSR-T2)
0
0.3
0.6
0.9
0 100 200 300 400
Def
lect
ion
[m
m]
Time [s]
W64-22
Tref = -12 C
Experimental (BBR)
Prediction (DSR-T1)
Prediction (DSR-T2)
Prediction (DSR-4mm)0
0.5
1
1.5
2
2.5
3
3.5
0 100 200 300 400
Def
lect
ion
[m
m]
Time [s]
S64-22
Tref = -12 C
Experimental (BBR)
Prediction (DSR-T1)

51
4.5.2 Deflection predictions using DSR at different temperatures
One important advantage of testing with the DSR is that the testing scheme utilized for
performing the frequency sweep experiment allows one to continuously asses the binder
properties at any target temperature over a wide range of temperatures using the same set of data
obtained without further conducting tests. This allows one to predict the BBR results at different
temperatures using a single master curve.
Figure 4.20 and Figure 4.21 show the deflection predictions using the DSR results and a
global average shift factor aβ = 1.736 at different target temperatures for samples J58-34, J64-28,
W64-22 and S58-34. It can be observed that the global shift factor can satisfactorily predict BBR
experimental results.

52
(a) (d)
(b) (e)
(c) (f)
Figure 4.20 DSR beam deflection prediction at different temperatures with aβ = 1.736 for
binders: J58-34 at (a) Tref = -24°C (b) Tref = -18°C (c) Tref = -24°C and J64-28 (d) Tref = -18°C
(e) Tref = -12°C (f) Tref = -6°C.
0
0.1
0.2
0.3
0.4
0.5
0.6
0 100 200 300 400
Def
lect
ion
[m
m]
Time [s]
J58-34
Tref = -24 C
Experimental (BBR)
Prediction (DSR-T1)
Prediction (DSR-T2)
Prediction (DSR-4mm)0
0.1
0.2
0.3
0.4
0.5
0.6
0.7
0 100 200 300 400
Def
lect
ion
[m
m]
Time [s]
J64-28
Tref = -18 C
Experimental (BBR)
Prediction (DSR-T1)
Prediction (DSR-T2)
Prediction (DSR-4mm)
0
0.2
0.4
0.6
0.8
1
1.2
1.4
0 100 200 300 400
Def
lect
ion
[m
m]
Time [s]
J58-34
Tref = -18 C
Experimental (BBR)
Prediction (DSR-T1)
Prediction (DSR-T2)
Prediction (DSR-4mm)0
0.2
0.4
0.6
0.8
1
1.2
1.4
1.6
1.8
0 100 200 300 400
Def
lect
ion
[m
m]
Time [s]
J64-28
Tref = -12 C
Experimental (BBR)
Prediction (DSR-T1)
Prediction (DSR-T2)
Prediction (DSR-4mm)
0
0.5
1
1.5
2
2.5
3
3.5
4
0 100 200 300 400
Def
lect
ion
[m
m]
Time [s]
J58-34
Tref = -12 C
Experimental (BBR)
Prediction (DSR-T1)
Prediction (DSR-T2)
Prediction (DSR-4mm)0
0.5
1
1.5
2
2.5
3
3.5
4
4.5
5
0 100 200 300 400
Def
lect
ion
[m
m]
Time [s]
J64-28
Tref = -6 C
Experimental (BBR)
Prediction (DSR-T1)
Prediction (DSR-T2)
Prediction (DSR-4mm)

53
(a) (d)
(b) (e)
(c) (f)
Figure 4.21 DSR beam deflection prediction at different temperatures with aβ = 1.736 for
binders: W64-22 at (a) Tref = -12°C (b) Tref = -6°C (c) Tref = 0°C and S58-34 (d) Tref = -24°C (e)
Tref = -18°C (f) Tref = -12°C.
0
0.3
0.6
0.9
0 100 200 300 400
Def
lect
ion
[m
m]
Time [s]
W64-22
Tref = -12 C
Experimental (BBR)
Prediction (DSR-T1)
Prediction (DSR-T2)
Prediction (DSR-4mm)0
0.1
0.2
0.3
0.4
0.5
0.6
0.7
0.8
0.9
1
0 100 200 300 400
Def
lect
ion
[m
m]
Time [s]
S58-34
Tref = -24 C
Experimental (BBR)
Prediction (DSR-T1)
Prediction (DSR-T2)
Prediction (DSR-4mm)
0
0.2
0.4
0.6
0.8
1
1.2
1.4
1.6
1.8
2
0 100 200 300 400
Def
lect
ion
[m
m]
Time [s]
W64-22
Tref = -6 C
Experimental (BBR)
Prediction (DSR-T1)
Prediction (DSR-T2)
Prediction (DSR-4mm)0
0.2
0.4
0.6
0.8
1
1.2
1.4
1.6
1.8
2
0 100 200 300 400
Def
lect
ion
[m
m]
Time [s]
S58-34
Tref = -18 C
Experimental (BBR)
Prediction (DSR-T1)
Prediction (DSR-T2)
Prediction (DSR-4mm)
0
1
2
3
4
5
6
0 100 200 300 400
Def
lect
ion
[m
m]
Time [s]
W64-22
Tref = 0 C
Experimental (BBR)
Prediction (DSR-T1)
Prediction (DSR-T2)
Prediction (DSR-4mm)0
1
2
3
4
5
6
7
0 100 200 300 400
Def
lect
ion
[m
m]
Time [s]
S58-34
Tref = -12 C
Experimental (BBR)
Prediction (DSR-T1)
Prediction (DSR-T2)
Prediction (DSR-4mm)

54
Figure 4.22 (a) and (b) compare the DSR predictions with the BBR test results for the
creep stiffness S(t=60s) and the slope m(t=60s), respectively. It can be observed that the shift
factor aβ = 1.736 can provide better results for stiffness predictions for all binders compared to
the predictions without any hardening adjustment factor (i.e., aβ = 1.0). Figure 4.22 (a) shows
that most predictions using the shift factor of 1.736 are close to the line of equality with some
binders that still tend to overpredict the stiffness values, which is due to the use of a global
adjustment value rather than using binder-case-specific shift factors. Regarding the slope
predictions, there was no significant improvement in the predictions by using the adjustment
factor. An additional horizontal shifting in the slope values by 0.04 was still necessary for
providing the best match with the experimental values as demonstrated in Figure 4.22 (c).
Based on the observed results from the binder dataset included in this study, two steps of
shifting are recommended for the prediction: one for the creep compliance, J(t/aβ) for predicting
the deflection values using aβ = 1.736 in Equation 4.9 and another horizontal shifting particularly
for the m-value by 0.04.
(a)
0
50
100
150
200
250
300
0 50 100 150 200 250 300
BB
R S
(t=
60
s)
DSR S(t=60s)
𝑎𝛽 = 𝑎𝛽 =
Regression Fit (𝑎𝛽 = )
Regression Fit (𝑎𝛽 = )Line of Equality
𝑆 = 𝑆 − , 2 =
𝑆 = 𝑆 , 2 =
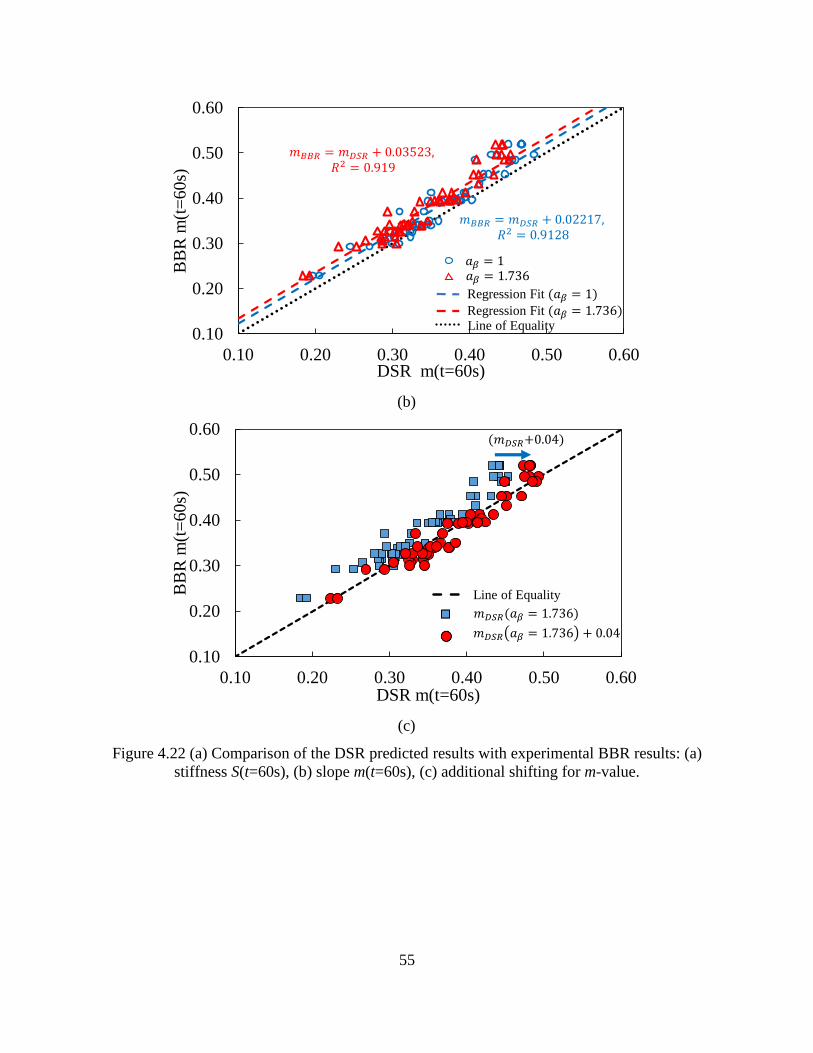
55
(b)
(c)
Figure 4.22 (a) Comparison of the DSR predicted results with experimental BBR results: (a)
stiffness S(t=60s), (b) slope m(t=60s), (c) additional shifting for m-value.
0.10
0.20
0.30
0.40
0.50
0.60
0.10 0.20 0.30 0.40 0.50 0.60
BB
R m
(t=
60
s)
DSR m(t=60s)
𝑎𝛽 = 𝑎𝛽 =
Regression Fit (𝑎𝛽 = )
Regression Fit (𝑎𝛽 = )Line of Equality
= , 2 =
= , 2 =
0.10
0.20
0.30
0.40
0.50
0.60
0.10 0.20 0.30 0.40 0.50 0.60
BB
R m
(t=
60
s)
DSR m(t=60s)
Line of Equality
(𝑎𝛽 = )
𝑎𝛽 = 4
( 4)
56
4.5.3 Repeatability analysis
In the previous section, it was shown that differences in measured |G*| values at low
temperatures (between 0°C to -30°C) in various trials resulted in variation of the deflection
predictions using Equation (4.9). In order to assess the level of influence how such variations can
cause on the predicted values, a repeatability analysis was conducted on sample J58-34 using
Equation (4.9) with 𝑎𝛽= 1.736. The choice of the selected binder was random and is assumed
that similar results can be obtained with other binders.
For the repeatability analysis, the same DSR testing was conducted a total nine times on a
single binder, J58-34. The nine trials were divided into three sets, set-1 consisted of trials T1 and
T2 where deliberately more amount of binder was trimmed between the parallel plates, in set-2
consisting of trials T3 to T7, where precise trimming of binder was attempted and set-3 which
consists of trials T8 and T9, where less amount of binder was intentionally trimmed. Figure 4.23
(a) shows the |G*| master curves for each of the trials at a reference temperature Tref = -24°C. It
can be observed that difference in sample trimming process can result in a band width of |G*|
values. Using the results, an average and its 95% confidence interval at each reduced frequency
was obtained for each set, and results are shown in Figure 4.23(b). It can be seen that the mean of
set-1 and set-3 lie outside the 95% confidence interval, which indicate significantly different
master curves which are expected due to the less (or more) amount of binder placed between the
plates. Figure 4.24 compare the deflection predictions for each set. It presents that the trimming
process clearly influences results. Set-1 resulted in 25% under-prediction and set-3 resulted in
40% over-prediction of the stiffness parameter. In case of slope parameter, set-1 resulted in 7%
under prediction and set-3 resulted in 2.6% over prediction. Figure 4.25 plots COV values of
each DSR set and the corresponding BBR. In general, the variability was greater with DSR
compared to BBR. The repeatability of DSR, although it shows a generally satisfactory level, is
influenced by trimming and sample preparation process. In particular, the creep stiffness is
sensitive because it can be directly affected by the amount of materials between the plates, and
the sensitivity will be more pronounced at lower testing temperatures.

57
(a)
(b)
Figure 4.23 (a) Master curve of |G*| for J58-34 for trial-1 to trial-9, (b) |G*| average values of all
data with a 95% confidence interval with |G*| average of set-1 and set-3.
1.E+07
1.E+08
1.E+09
1.E-05 1.E-03 1.E-01 1.E+01 1.E+03
|G*| [P
a]
Reduced Frequency [rad/s]
Tref=-24 C
Trial-1
Trial-2
Trial-3
Trial-4
Trial-5
Trial-6
Trial-7
Trial-8
Trial-9
1.E+06
1.E+07
1.E+08
1.E+09
1.E-05 1.E-03 1.E-01 1.E+01 1.E+03
|G*| [P
a]
Reduced Frequency [rad/s]
Tref = -24 C
Mean_All Data
Mean-Set1
Mean-Set3
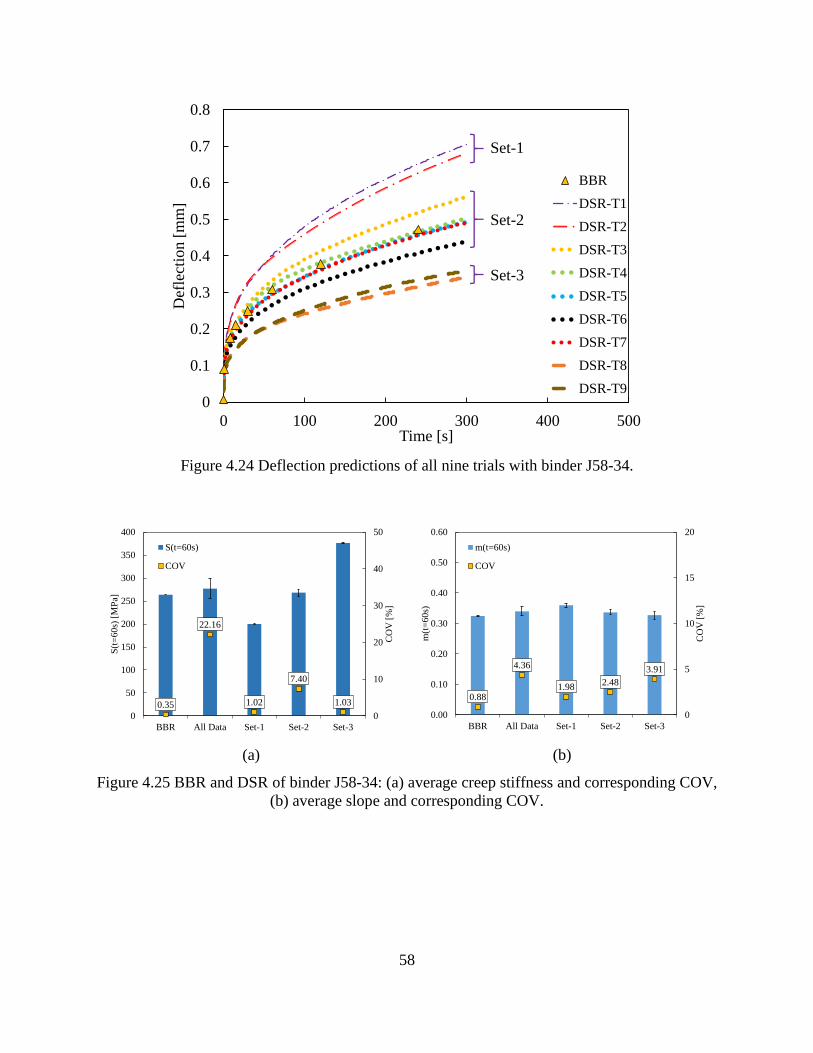
58
Figure 4.24 Deflection predictions of all nine trials with binder J58-34.
(a) (b)
Figure 4.25 BBR and DSR of binder J58-34: (a) average creep stiffness and corresponding COV,
(b) average slope and corresponding COV.
0
0.1
0.2
0.3
0.4
0.5
0.6
0.7
0.8
0 100 200 300 400 500
Def
lect
ion
[m
m]
Time [s]
BBR
DSR-T1
DSR-T2
DSR-T3
DSR-T4
DSR-T5
DSR-T6
DSR-T7
DSR-T8
DSR-T9
Set-1
Set-2
Set-3
0.35
22.16
1.02
7.40
1.03
0
10
20
30
40
50
0
50
100
150
200
250
300
350
400
BBR All Data Set-1 Set-2 Set-3
CO
V [
%]
S(t
=6
0s)
[M
Pa]
S(t=60s)
COV
0.88
4.36
1.982.48
3.91
0
5
10
15
20
0.00
0.10
0.20
0.30
0.40
0.50
0.60
BBR All Data Set-1 Set-2 Set-3
CO
V [
%]
m(t
=6
0s)
m(t=60s)
COV
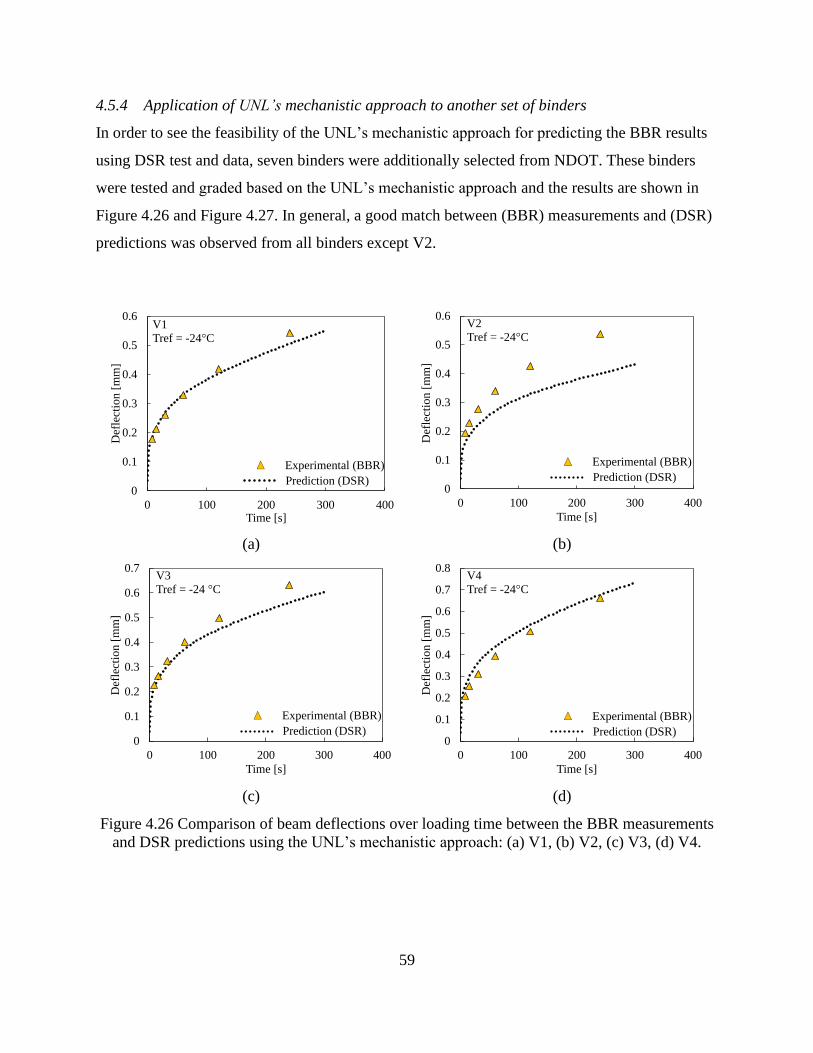
59
4.5.4 Application of UNL’s mechanistic approach to another set of binders
In order to see the feasibility of the UNL’s mechanistic approach for predicting the BBR results
using DSR test and data, seven binders were additionally selected from NDOT. These binders
were tested and graded based on the UNL’s mechanistic approach and the results are shown in
Figure 4.26 and Figure 4.27. In general, a good match between (BBR) measurements and (DSR)
predictions was observed from all binders except V2.
(a) (b)
(c) (d)
Figure 4.26 Comparison of beam deflections over loading time between the BBR measurements
and DSR predictions using the UNL’s mechanistic approach: (a) V1, (b) V2, (c) V3, (d) V4.
0
0.1
0.2
0.3
0.4
0.5
0.6
0 100 200 300 400
Def
lect
ion
[m
m]
Time [s]
V1
Tref = -24 C
Experimental (BBR)
Prediction (DSR)0
0.1
0.2
0.3
0.4
0.5
0.6
0 100 200 300 400
Def
lect
ion
[m
m]
Time [s]
V2
Tref = -24 C
Experimental (BBR)
Prediction (DSR)
0
0.1
0.2
0.3
0.4
0.5
0.6
0.7
0 100 200 300 400
Def
lect
ion
[m
m]
Time [s]
V3
Tref = -24 C
Experimental (BBR)
Prediction (DSR)0
0.1
0.2
0.3
0.4
0.5
0.6
0.7
0.8
0 100 200 300 400
Def
lect
ion
[m
m]
Time [s]
V4
Tref = -24 C
Experimental (BBR)
Prediction (DSR)

60
(a) (b)
(c)
Figure 4.27 Comparison of beam deflections over loading time between the BBR measurements
and DSR predictions using the UNL’s mechanistic approach: (a) V5, (b) V6, (c) V7.
Table 4.6 shows the two low temperature PG-grading parameters (i.e., S(t=60s) and
m(t=60s)) comparing the BBR data with the predicted values using the UNL’s methodology
from the seven binders. It can be seen that the slope predictions were quite promising moreover,
for most of the binders the predicted parameters showed an absolute error less than 15% and 6%
for stiffness and slope, respectively. The stiffness prediction for the binder V2 was more than
300 MPa and over predicted by at least 33% which resulted in different low PG grading
compared to the corresponding BBR grading. It is expected to improve the accuracy with a more
precisely identified adjustment factor through a more comprehensive characterization of binders
and testing conditions.
0
0.1
0.2
0.3
0.4
0.5
0.6
0.7
0 100 200 300 400
Def
lect
ion
[m
m]
Time [s]
V5
Tref = -24 C
Experimental (BBR)
Prediction (DSR)0
0.1
0.2
0.3
0.4
0.5
0.6
0 100 200 300 400
Def
lect
ion
[m
m]
Time [s]
V6
Tref = -24 C
Experimental (BBR)
Prediction (DSR)
0
0.1
0.2
0.3
0.4
0.5
0.6
0 100 200 300 400
Def
lect
ion
[m
m]
Time [s]
V7
Tref = -24 C
Experimental (BBR)
Prediction (DSR)
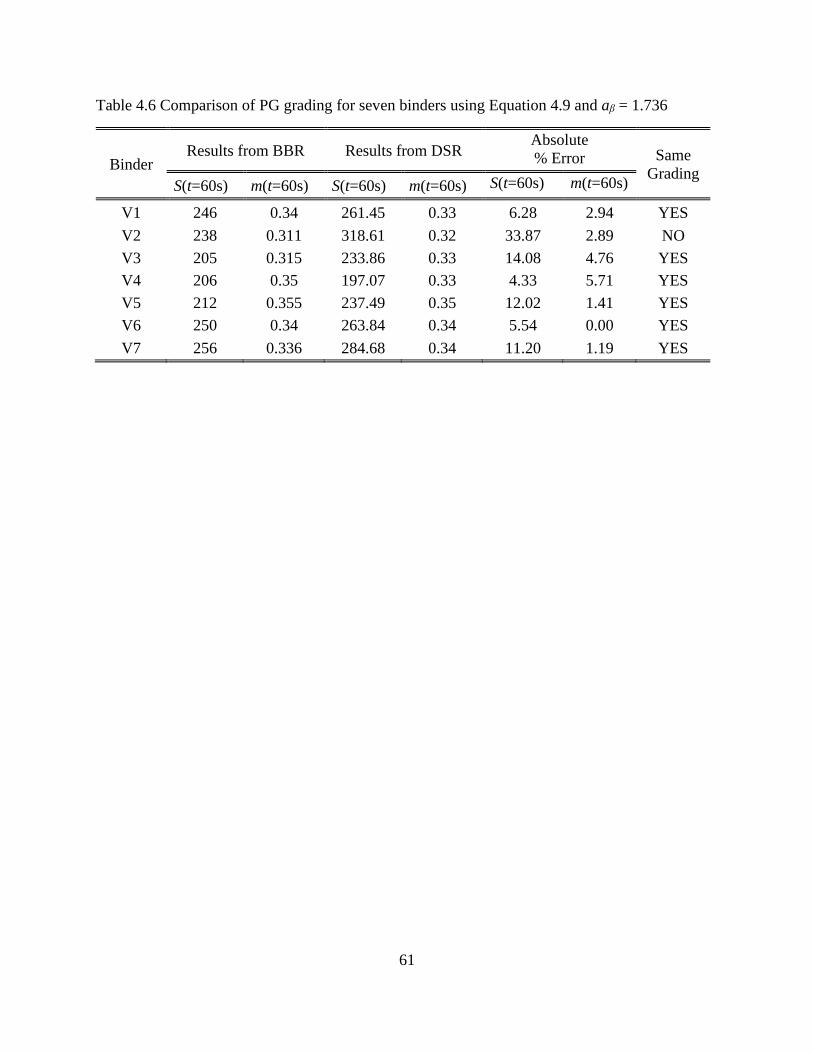
61
Table 4.6 Comparison of PG grading for seven binders using Equation 4.9 and aβ = 1.736
Binder Results from BBR Results from DSR
Absolute
% Error Same
Grading S(t=60s) m(t=60s) S(t=60s) m(t=60s) S(t=60s) m(t=60s)
V1 246 0.34 261.45 0.33 6.28 2.94 YES
V2 238 0.311 318.61 0.32 33.87 2.89 NO
V3 205 0.315 233.86 0.33 14.08 4.76 YES
V4 206 0.35 197.07 0.33 4.33 5.71 YES
V5 212 0.355 237.49 0.35 12.02 1.41 YES
V6 250 0.34 263.84 0.34 5.54 0.00 YES
V7 256 0.336 284.68 0.34 11.20 1.19 YES
62
Chapter 5. Summary and Conclusions
This study investigated alternative testing-analysis methods using the DSR to determine low
temperature asphalt binder properties that have conventionally been measured by the BBR.
Toward that end, twelve different binders from four sources satisfying three different PG grading
criterion common in Nebraska were selected. The binder samples were tested in the frequency
domain in a wide range of temperatures under PAV-aged conditions using DSR. The 8-mm
parallel plate geometry was primarily employed for the testing, while four binders were
randomly selected and tested using the 4-mm parallel plate to investigate the influence of
geometry on the results. BBR experiments were also performed as a parallel for each binder.
Three methods were used to analyze and compare the data from the two different experiments
(i.e., DSR and BBR) where each method utilized a different scheme for converting the frequency
domain results to time domain data to compare with the BBR results. The three methods were:
(1) Western Research Institute’s (WRI) methodology; (2) NCHRP methodology; and (3) UNL’s
mechanistic approach. The following conclusions can be drawn based on the test and analysis
results:
• It was observed that the WRI methodology works well but is dependent on the binder
dataset used. With the current binder set in this study, the cutoff values were G(t=60s) <
85.5 MPa and m(t=60s) > 0.287 which are different from values reported in the literature.
• The NCHRP method is promising and provided a good linear correlation between the
DSR predicted stiffness/slope values and the corresponding experimental BBR values.
Good prediction was observed for the creep stiffness, whereas the slope values were
always underpredicted. Also, the NCHRP method is considered efficient when grading
PG 64-22 or higher-graded binders because one can easily use the method at
temperatures above 0°C to obtain a reasonable estimate of stiffness and slope without
performing any further experiments below freezing temperature.
• In the UNL’s mechanistic approach, it was observed that the Prony series representation
of the binder properties is mechanically sound and rigorous. It can be used effectively to
predict the BBR results. It was also observed that the sample preparation was very
important to produce a repeatable and reliable test results and corresponding predictions.

63
• In the UNL’s mechanistic approach, several intrinsic aspects such as the effects of
cooling media and physical hardening of binder at different temperature can be
potentially addressed by introducing an adjustment factor. The adjustment factor was
observed to be binder specific and temperature dependent, however a global adjustment
factor of 𝑎𝛽 = 1.736 obtained from the binder data set in this study could provide a
satisfactory level of prediction for creep stiffness. An additional horizontal shifting of
0.04 was necessary to match the slope (m-value) predictions.
• Overall, the use of DSR as an alternative testing-analysis method to characterize binder
low temperature properties looks quite feasible; however, its actual implementation into
practice requires a more careful investigation. More binders in different types and test
results obtained from various testing conditions are necessary to make more definite
conclusions. Nonetheless, the DSR method can be used as (at least) a screening tool to
judge whether a binder given requires the entire process of BBR testing or not, which will
clearly improve testing efficiency of many state Departments of Transportation including
the NDOT.

64
References
1. Isacsson U, Zeng H. Cracking of asphalt at low temperature as related to bitumen
rheology. Journal of materials science. 1998;33(8):2165-70.
2. Anderson DA, Christensen DW, Bahia HU, Dongre R, Sharma M, Antle CE, et al.
Binder characterization and evaluation, volume 3: Physical characterization. Strategic
Highway Research Program, National Research Council, Report No SHRP-A-369. 1994.
3. Fabb T, editor The influence of mix composition, binder properties and cooling rate on
asphalt cracking at low temperatures. Association of Asphalt Paving Technologists Proc;
1974.
4. Lesueur D, Gerard JF, Claudy P, Letoffe JM, Planche JP, Martin D. A structure‐related
model to describe asphalt linear viscoelasticity. Journal of Rheology. 1996;40(5):813-36.
5. Edwards Y, Tasdemir Y, Isacsson U. Rheological effects of commercial waxes and
polyphosphoric acid in bitumen 160/220—low temperature performance. Fuel.
2006;85(7-8):989-97.
6. Lu X, Isacsson U. Rheological characterization of styrene-butadiene-styrene copolymer
modified bitumens. Construction and Building Materials. 1997;11(1):23-32.
7. Lu X, Isacsson U. Chemical and rheological evaluation of ageing properties of SBS
polymer modified bitumens. Fuel. 1998;77(9-10):961-72.
8. Lu X, Isacsson U, Ekblad J. Low-temperature properties of styrene–butadiene–styrene
polymer modified bitumens. Construction and Building Materials. 1998;12(8):405-14.
9. Lu X, Isacsson U. Artificial aging of polymer modified bitumens. Journal of applied
polymer science. 2000;76(12):1811-24.
10. Lu X, Isacsson U. Modification of road bitumens with thermoplastic polymers. Polymer
testing. 2000;20(1):77-86.
11. Lu X, Isacsson U. Effect of binder rheology on the low-temperature cracking of asphalt
mixtures. Road Materials and Pavement Design. 2001;2(1):29-47.
12. Sui C, Farrar M, Tuminello W, Turner T. New technique for measuring low-temperature
properties of asphalt binders with small amounts of material. Transportation Research
Record: Journal of the Transportation Research Board. 2010(2179):23-8.
13. Sui C, Farrar M, Harnsberger P, Tuminello W, Turner T. New low-temperature
performance-grading method: Using 4-mm parallel plates on a dynamic shear rheometer.
Transportation Research Record: Journal of the Transportation Research Board.
2011(2207):43-8.
14. Farrar M, Sui C, Salmans S, Qin Q. Determining the low temperature rheological
properties of asphalt binder using a dynamic shear rheometer (DSR). Technical White
Paper FP08 Prepared by Western Research Institute for the Federal Highway
Administration. Contract No DTFH61-07-D-00005, Fundamental Properties of Asphalts
and Modified Asphalts, III. 2015.
15. Farrar M, Grimes RW, Sui C, Planche J-P, Huang S-C, Turner TF, et al., editors. Thin
film oxidative aging and low temperature performance grading using small plate dynamic
shear rheometry: an alternative to standard rtfo, pav, and bbr. Proceedings of the 5th
Eurasphalt and Eurobitumen Congress; 2012 June 13-15; Istanbul, Turkey.
16. Behnia B, Buttlar W, Reis H. Evaluation of Low-Temperature Cracking Performance of
Asphalt Pavements Using Acoustic Emission: A Review. Applied Sciences.
2018;8(2):306.
65
17. Velasquez R, Bahia H. Critical factors affecting thermal cracking of asphalt pavements:
towards a comprehensive specification. Road Materials and Pavement Design.
2013;14(sup1):187-200.
18. Stimilli A, Virgili A, Canestrari F, Bahia HU. Estimation of low-temperature
performance of recycled asphalt mixtures through relaxation modulus analysis. Cold
Regions Science and Technology. 2017;133:36-45.
19. Marasteanu MO, Cannone Falchetto A. Review of experimental characterisation and
modelling of asphalt binders at low temperature. International Journal of Pavement
Engineering. 2018;19(3):279-91.
20. Dongré R, D'Angelo J, McMahon S. Development of superpave direct tension test
device. Transportation Research Record: Journal of the Transportation Research Board.
1997(1586):32-9.
21. Basu A, Marasteanu M, Hesp S. Time-temperature superposition and physical hardening
effects in low-temperature asphalt binder grading. Transportation Research Record:
Journal of the Transportation Research Board. 2003(1829):1-7.
22. Premkumar L, Chehab G, Solaimanian M. Evaluation of Low-Temperature Properties of
Asphalt Binders and Mixtures. Transportation Research Record: Journal of the
Transportation Research Board. 2013(2370):102-8.
23. Velasquez R, Tabatabaee H, Puchalski S, Bahia H, editors. The role of asphalt binder
fracture properties in thermal cracking performance of mixtures and pavements.
Proceedings of the 57th Annual Conference of the Canadian Technical Asphalt
Association (CTAA), Vancouver, British Columbia; 2012.
24. Lee NK, Hesp SA. Low-temperature fracture toughness of polyethylene-modified asphalt
binders. Transportation Research Record. 1994(1436).
25. Hoare T, Hesp S. Low-temperature fracture testing of asphalt binders: regular and
modified systems. Transportation Research Record: Journal of the Transportation
Research Board. 2000(1728):36-42.
26. Hesp S. An improved low-temperature asphalt binder specification method. Final Report,
Queen’s University, Ontario. 2004.
27. Chailleux E, Hamon D, Mouillet V, editors. Determination of the low temperature
bitumen cracking properties: fracture mechanics principle applied to a three points
bending test using a non homogeneous geometry. 10TH INTERNATIONAL
CONFERENCE ON ASPHALT PAVEMENTS-AUGUST 12 TO 17, 2006, QUEBEC
CITY, CANADA; 2006.
28. Velasquez R, Tabatabaee H, Bahia H. Low temperature cracking characterization of
asphalt binders by means of the single-edge notch bending (SENB) test. Asphalt Paving
Technology-Proceedings Association of Asphalt Technologists. 2011;80:583.
29. Marasteanu M, Zofka A, Turos M, Li X, Velasquez R, Li X, et al. Investigation of low
temperature cracking in asphalt pavements national pooled fund study 776. 2007.
30. Andriescu A, Hesp SA, Youtcheff JS. Essential and plastic works of ductile fracture in
asphalt binders. Transportation Research Record. 2004;1875(1):1-7.
31. Dongre R, Sharma M, Anderson D. Development of fracture criterion for asphalt mixes
at low temperatures. Transportation Research Record. 1989;1228:94-105.
32. Zofka A, Marasteanu M. Development of double edge notched tension (DENT) test for
asphalt binders. Journal of Testing and Evaluation. 2006;35(3):259-65.

66
33. Hou Y, Wang L, Yue P, Sun W. Fracture failure in crack interaction of asphalt binder by
using a phase field approach. Materials and Structures. 2015;48(9):2997-3008.
34. Kim S-S, Wysong Z, Kovach J. Low-temperature thermal cracking of asphalt binder by
asphalt binder cracking device. Transportation Research Record: Journal of the
Transportation Research Board. 2006(1962):28-35.
35. Kim S-S. Direct measurement of asphalt binder thermal cracking. Journal of Materials in
Civil Engineering. 2005;17(6):632-9.
36. Kim S-S. Development of an Asphalt Binder Cracking Device. 2007.
37. Jiao Y, Fu L, Shan W, Liu S. Damage fracture characterization of pervious asphalt
considering temperature effect based on acoustic emission parameters. Engineering
Fracture Mechanics. 2018.
38. Tabatabaee HA, Velasquez R, Bahia HU. Predicting low temperature physical hardening
in asphalt binders. Construction and Building Materials. 2012;34:162-9.
39. Baglieri O, Dalmazzo D, Barazia M, Tabatabaee HA, Bahia HU. Influence of physical
hardening on the low-temperature properties of bitumen and asphalt mixtures. Procedia-
Social and Behavioral Sciences. 2012;53:504-13.
40. Laukkanen O-V, Winter HH, Soenen H, Seppälä J. Systematic broadening of the
viscoelastic and calorimetric glass transitions in complex glass-forming liquids. Journal
of Non-Crystalline Solids. 2018;483:10-7.
41. Laukkanen O-V, Winter HH, Seppälä J. Characterization of physical aging by time-
resolved rheometry: fundamentals and application to bituminous binders. Rheologica
Acta. 2018;57(11):745-56.
42. Lu X, Uhlback P, Soenen H. Investigation of bitumen low temperature properties using a
dynamic shear rheometer with 4 mm parallel plates. International Journal of Pavement
Research and Technology. 2017;10(1):15-22.
43. Laukkanen O-V. Small-diameter parallel plate rheometry: a simple technique for
measuring rheological properties of glass-forming liquids in shear. Rheologica Acta.
2017;56(7-8):661-71.
44. Laukkanen O-V. Low-temperature rheology of bitumen and its relationship with
chemical and thermal properties [Master's Thesis]. Espoo, Finland: Aalto University; 2015.
45. Laukkanen O-V, Soenen H, Winter HH, Seppälä J. Low-temperature rheological and
morphological characterization of SBS modified bitumen. Construction and Building
Materials. 2018;179:348-59.
46. Carret J-C, Falchetto AC, Marasteanu MO, Di Benedetto H, Wistuba MP, Sauzeat C.
Comparison of rheological parameters of asphalt binders obtained from bending beam
rheometer and dynamic shear rheometer at low temperatures. Road Materials and
Pavement Design. 2015;16(sup1):211-27.
47. Riccardi C, Cannone Falchetto A, Wang D, Wistuba MP. Effect of cooling medium on
low-temperature properties of asphalt binder. Road Materials and Pavement Design.
2017;18(sup4):234-55.
48. Hutcheson S, McKenna G. The measurement of mechanical properties of glycerol, m-
toluidine, and sucrose benzoate under consideration of corrected rheometer compliance:
an in-depth study and review. The Journal of chemical physics. 2008;129(7):074502.
49. Liu C-Y, Yao M, Garritano RG, Franck AJ, Bailly C. Instrument compliance effects
revisited: linear viscoelastic measurements. Rheologica acta. 2011;50(5-6):537.
67
50. Schröter K, Hutcheson S, Shi X, Mandanici A, McKenna G. Dynamic shear modulus of
glycerol: Corrections due to instrument compliance. The Journal of chemical physics.
2006;125(21):214507.
51. Christensen R. Theory of viscoelasticity: an introduction: Elsevier; 2012.
52. Park S, Schapery R. Methods of interconversion between linear viscoelastic material
functions. Part I—A numerical method based on Prony series. International Journal of
Solids and Structures. 1999;36(11):1653-75.
53. Ghorban Ebrahimi M, Saleh M, Gonzalez MAM. Interconversion between viscoelastic
functions using the Tikhonov regularisation method and its comparison with approximate
techniques. Road Materials and Pavement Design. 2014;15(4):820-40.