INVESTIGATION OF CORRUGATED CARDBOARD FOR VIBRATION …
137
INVESTIGATION OF CORRUGATED CARDBOARD FOR VIBRATION ISOLATION A Thesis Submitted to the College of Graduate Studies and Research in Partial Fulfillment of the Requirements for the Degree of Master of Science in the Department of Mechanical Engineering University of Saskatchewan Saskatoon, Saskatchewan Canada By Jialei Huang Copyright Jialei Huang, April 2013. All rights reserved.
Transcript of INVESTIGATION OF CORRUGATED CARDBOARD FOR VIBRATION …

INVESTIGATION OF CORRUGATED CARDBOARD
FOR VIBRATION ISOLATION
A Thesis
Submitted to the College of Graduate Studies and Research
in Partial Fulfillment of the Requirements
for the Degree of
Master of Science
in the
Department of Mechanical Engineering
University of Saskatchewan
Saskatoon, Saskatchewan
Canada
By
Jialei Huang
Copyright Jialei Huang, April 2013. All rights reserved.

i
PERMISSION TO USE
In presenting this thesis in partial fulfilment of the requirements for a Master of Science degree
from the University of Saskatchewan, the author agrees that the Libraries of this University may
make it freely available for inspection. The author further agrees that permission for copying of
this thesis in any manner, in whole or in part, for scholarly purposes may be granted by the
professor or professors who supervised the thesis work or, in their absence, by the Head of the
Department or the Dean of the College in which the thesis work was done. It is understood that
any copying or publication or use of this thesis or parts thereof for financial gain shall not be
allowed without the author’s written permission. It is also understood that due recognition shall
be given to the author and to the University of Saskatchewan in any scholarly use which may be
made of any material in this thesis.
Requests for permission to copy or to make other use of material in this thesis in whole or part
should be addressed to:
Head of the Department of Mechanical Engineering
University of Saskatchewan
Saskatoon, Saskatchewan S7N 5A9 CANADA

ii
ABSTRACT
Vibration isolation is a common approach to reduce the undesired vibration of a dynamic system
from its surrounding. The common material used for the vibration isolator is rubber (for
example) which is known to be environmentally unfriendly. This thesis presents a study on the
use of corrugated cardboard for the vibration isolator, which is known to be a highly
environment-friendly material. The focus of the study is on understanding and modeling of
stiffness and damping of cardboard when it or its system (several cardboards) is used for
isolating the vibration coming from the vertical direction of cardboard.
In this thesis, a study is presented of finite element modeling of stiffness of corrugated cardboard
in its vertical direction with the aim of overcoming two major shortcomings in modeling in the
current literature: (1) the width effect is neglected even for cardboard with its width greater than
length and (2) the non-linear constitutive relation is not accurately determined. Indeed, it is likely
that these shortcomings are responsible for inaccuracy with the models in the current literature to
predict the stiffness and peak load. Further, a test bed was set up for the measurement of
damping of cardboards in this study. This thesis also presents an application of the theoretic
development in the stiffness and damping of corrugated cardboard to design an isolator for the
vacuum pump at Canadian Light Source.
Several conclusions are drawn from this study: (1) modeling with consideration of the width
effect and non-linear constitutive relation is necessary to improve the accuracy of prediction of
stiffness of cardboard; (2) set up for the measurement of damping of cardboard is accurate; and
(3) cardboard systems are feasible for vibration isolation in terms of the reduction of amplitude
of vibration.

iii
The contribution of this thesis includes: (1) providing a finite element method for modeling of
corrugated cardboards which have a complex non-linear constitutive relation, variable contact
configuration, and 3D geometrical effect and (2) providing the feasibility of proving that
corrugated cardboard can be used for vibration isolation.

iv
ACKNOWLEDGEMENTS
I would like to express my sincere gratitude to my supervisor Professor W.J. (Chris) Zhang, who
provided me with dedicated guidance, broad knowledge, and continuous encouragement through
my master study. His enthusiasm and dedication on his work has impressed and influenced me
greatly. I would also like to acknowledge his moral and financial support. I appreciate all what
he has provided me during my whole life.
I would also like to acknowledge the Department of Mechanical Engineering through the
graduate scholarship for my second year, from which I have got an opportunity to gain more
financial support, which is always good to graduate students.
I would like to thank the members of my Advisory committee (Professor Allan Dolovich and
Professor Akindele Odeshi, Professor Lal Kushwaha) for their advices and examination during
the process. I would like to thank J.W. (Mark) Li for initiating this project. I would like to thank
Hans-Jurgen Steinmetz and Louis Roth for helping me set up the measurement test-bed for
measuring the stiffness of corrugated cardboard and fulfilling the measurement described in
Chapter 3. I would like to thank Doug Bitner, who helped me set up the measurement test-bed
for measuring the damping and vibration and fulfilling the measurement described in Chapter 4.
I would like to thank Tim May from the Canadian Light Source for providing me the vacuum
pump to fulfill the measurement described in Chapter 4. I would like to thank the cleaning staff
of the University for providing me cardboards for my research, which does give a lovely
example of how wasted materials can be recycled without any penny.
Many thanks also go to my peers and friends in the AEDL. Thanks to Xiaohua Hu, Zhiming
Zhang, Yu Zhao, Fan Zhang, Sampath Mudduda, and Fang He to support my research and to
care my life during the study. I would also like to thank Wubin Cheng, Paul Miao, Bin Zhang

v
and Lin Cao, for sharing their experience on using the ANSYS software. Special thanks to Tan
Zhang and Zhengzhou Yang, who provide me the room for keeping the stuff related to my
research.
The last but definitely not the least, I would like to thank my family for their love and support, in
particular, Yiwen Lu (mom), and Yihong Lu (auntie).

vi
DEDICATION
To my parents:
Yiwen Lu and Hua Huang

vii
TABLE OF CONTENTS
PERMISSION TO USE ................................................................................................................... i
ABSTRACT .................................................................................................................................... ii
ACKNOWLEDGEMENTS ........................................................................................................... iv
DEDICATION ............................................................................................................................... vi
TABLE OF CONTENTS .............................................................................................................. vii
LIST OF FIGURES ........................................................................................................................ x
LIST OF TABLES ........................................................................................................................ xv
LIST OF ABBREVIATIONS ...................................................................................................... xvi
CHAPTER 1 INTRODUCTION .................................................................................................... 1
1.1 Research Background and Motivation ...................................................................................... 1
1.2 Research Question .................................................................................................................... 2
1.3 A Brief Review of the Related Studies ..................................................................................... 6
1.4 Research Objective and Scope .................................................................................................. 6
1.5 Outline of the Thesis ................................................................................................................. 7
CHAPTER 2 LITERATURE REVIEW ......................................................................................... 8
2.1 Introduction ............................................................................................................................... 8
2.2 Corrugated Cardboard and its Application ............................................................................... 8
2.3 Finite Element Modeling of Corrugated Cardboard ................................................................. 9
2.3.1 Top-to-bottom compression strength .............................................................................. 9
2.3.2 Edge compression strength ........................................................................................... 15

viii
2.3.3 Bending stiffness ........................................................................................................... 20
2.3.4 Creasing behavior ......................................................................................................... 22
2.3.5 Flat compression stiffness ............................................................................................. 25
2.4 Measurement of Stiffness ....................................................................................................... 28
2.5 Measurement of Damping....................................................................................................... 34
2.6 Conclusions ............................................................................................................................. 38
CHAPTER 3 FE MODELING FOR STIFFNESS OF CARDBOARD ....................................... 40
3.1 Introduction ............................................................................................................................. 40
3.2 Cardboard System ................................................................................................................... 40
3.3 FE Modeling for Stiffness of Cardboard ................................................................................ 41
3.3.1 Element assignment ...................................................................................................... 42
3.3.2 Element real constants .................................................................................................. 42
3.3.3 Material property .......................................................................................................... 43
3.3.4 Element mesh ................................................................................................................ 48
3.3.5 Contact behavior ........................................................................................................... 51
3.3.6 Boundary condition and loads ...................................................................................... 54
3.3.7 Nonlinear analysis ......................................................................................................... 55
3.3.8 Load specification and algorithm selection .................................................................. 55
3.3.9 Results ........................................................................................................................... 56
3.4 Model Validation .................................................................................................................... 58
3.4.1 Measurement Test-bed .................................................................................................. 58
3.4.2 Results and validation ................................................................................................... 59
3.4.3 Discussion ..................................................................................................................... 66
3.5 Conclusions ............................................................................................................................. 67
CHAPTER 4 APPLICATION – VIBRATION ISOLATION SYSTEM USING CARDBOARDS
...................................................................................................................................................... 68
4.1 Introduction ............................................................................................................................. 68

ix
4.2 Measurement of the Damping of Cardboard .......................................................................... 68
4.3 Lumped Model ........................................................................................................................ 71
4.4 Examples and Illustrations ...................................................................................................... 74
4.4.1 Example 1 ..................................................................................................................... 74
4.4.2 Example 2 ..................................................................................................................... 80
4.5 Results and discussion ............................................................................................................ 81
4.5.1 Measurement Test-bed .................................................................................................. 81
4.5.2 Results and validation ................................................................................................... 84
4.5.3 Discussion ..................................................................................................................... 89
4.6 Conclusions ............................................................................................................................. 90
CHAPTER 5 CONCLUSIONS AND FUTURE WORK ............................................................. 91
5.1 Overview ................................................................................................................................. 91
5.2 Conclusions ............................................................................................................................. 93
5.3 Contributions........................................................................................................................... 93
5.4 Future Work ............................................................................................................................ 94
REFERENCES ............................................................................................................................. 95
APPENDIX A ............................................................................................................................. 102
APPENDIX B ............................................................................................................................. 116

x
LIST OF FIGURES
Figure .................Page
Fig. 1.1 Example of vibration isolator system (http://files.b2b.cn/product/ProductImages
/2010_05/07/07101602230_b.jpg) .......................................................................1
Fig. 1.2 A corrugated cardboard as an isolator under dynamic system: (a) far view;
(b) near view; (c) Structure ..................................................................................3
Fig. 1.3 Different flutes of corrugated cardboard (http://commons.wikimedia.org/wiki
/File: Cardboard_Main_Flutes_Labeled.jpg) .......................................................4
Fig. 1.4 Six degrees of freedom in the generalized coordinate system (http://www.
newport.com/ servicesupport/Tutorials/default.aspx?id=143) ............................4
Fig. 1.5 Corrugated cardboard under the compressive loading in its vertical direction ........5
Fig. 2.1 Three main directions that characterize cardboard (http://www.kitepackaging.
co.uk/ images/singlewall.jpg) ..............................................................................9
Fig. 2.2 Cardboard box from (a) front view (http://filmenglish.files.wordpress.com/2011/
10/ cardboard-box.jpg); (b) top view (http://www.alliedpackaginguk.co.uk/
images/1.jpg) ........................................................................................................10
Fig. 2.3 Box stacking (http://image.shutterstock.com/display_pic_with_logo/739267/
105698087/stock-photo-stacking-cardboard-boxes-in-a-tidy-stack-on-a-white-
background-105698087.jpg) ................................................................................10
Fig. 2.4 BCT test set-up (http://upload.wikimedia.org/wikipedia/commons/6/6b/
Packaging_ Compression_tester.jpeg) .................................................................11
Fig. 2.5 (a) Full size (b) one quarter size (Adapted from Pommier et al., 1991) ...................13
Fig. 2.6 Boundary conditions on cardboard subject to the vertical loading from top view
(Adapted from Pommier et al., 1991) ..................................................................13
Fig. 2.7 Schematics of the edge crush test (http://www.klingele.com/uploads/pics/
ect_labor_ 01.jpg) ................................................................................................15

xi
Fig. 2.8 Illustration of the finite element model with plate element ......................................17
Fig. 2.9 Illustration of the finite element model structure with shell element .......................17
Fig. 2.10 Edge loading of corrugated cardboard (Adapted from Nordstrand, 1995) .............18
Fig. 2.11 Quarter of cardboard with symmetry lines (Adapted from Allansson and
Svard, 2001) .........................................................................................................18
Fig. 2.12 Degrees of freedom of the shell element (Adapted from Allansson and Svard ,
2001) ....................................................................................................................19
Fig. 2.13 Connection between the tips of core and the liner (Adapted from Haj-Ali et al.,
2009) ....................................................................................................................19
Fig. 2.14 (a) three point bending test (b) four point bending test ..........................................20
Fig. 2.15 Creasing experiment set-up (Adapted from Gooren, 2006) ...................................23
Fig. 2.16 Loading and boundary condition imposed on the FE model (Adapted from
Gooren, 2006) ......................................................................................................24
Fig. 2.17 Bending of cardboard during the crease test (Adapted from Gooren, 2006) .........24
Fig. 2.18 Refined creasing experiment set-up (Adapted from Romans 2008) ......................25
Fig. 2.19 Illustration of the FCT test......................................................................................26
Fig. 2.20 Contact change during compression (Adapted from Lu et al., 2001) .....................27
Fig. 2.21 Apparatus of the static stiffness test (Adapted from Richards and Singh, 2001) ...29
Fig. 2.22 Schematics of the measurement set-up for dynamic stiffness (Adapted from
Nadeau and Champoux, 2000) .............................................................................30
Fig. 2.23 Schematics of the measurement set-up for dynamic stiffness (Adapted from
Lapcik et al., 2001) ..............................................................................................31
Fig. 2.24 (a) Schematics of the measurement set-up using indirect method (Adapted from
Thompson et al., 1998); (b) Model of the measurement system (Adapted from
Thompson et al., 1998) ........................................................................................32
Fig. 2.25 Schematics of the measurement set-up of impact test (Adapted from Lin et al.,
2005) ....................................................................................................................33
Fig. 2.26 Schematics of the measurement set-up for dynamic stiffness (Adapted from
Mallik, 1999)........................................................................................................34

xii
Fig. 2.27 Response of Logarithmic decrement method (http://www.mfg.mtu.edu/
cyberman/ machtool/machtool/vibration/damping.html) ....................................35
Fig. 2.28 Response of Half-power bandwidth method (http://www.mfg.mtu.edu/
cyberman/ machtool/machtool/vibration/damping.html) ....................................36
Fig. 2.29 Hysteresis phenomenon ..........................................................................................38
Fig. 3.1 The cardboard system ...............................................................................................41
Fig. 3.2 Schematic diagram of cardboard (http://www.kitepackaging.co.uk/images/
singlewall.jpg) ......................................................................................................41
Fig. 3.3 Shell 181 4-Node Structure Shell Element (Adapted from ANSYS, 2004) .............42
Fig. 3.4 Actual shape and sine shape (Adapted from Biancolini and Brurri, 2003) ..............49
Fig. 3.5 Geometry of corrugated cardboard with the actual shape in FE model ...................49
Fig. 3.6 Meshing schemes with (a) 8 elements for liner and 12 elements for core; (b) 13
elements for liner and 20 elements for core; (c) 20 elements for liner and 30
elements for core; (4) 40 elements for liner and 60 elements for core. ...............50
Fig. 3.7 Contact behavior during different phase of compression (A, B, C, D, E)
(Adapted from Lu et al., 2001) ............................................................................51
Fig. 3.8 Contact model of (a) the top liner and core; (b) the bottom liner and core ..............53
Fig. 3.9 Contact behavior of corrugated cardboard at displacement level of (a) 0.1mm;
(b) 0.3mm; (d) 0.7mm; (e) 1.1mm .......................................................................54
Fig. 3.10 Boundary condition and loads on corrugated cardboard ........................................55
Fig. 3.11 Typical FE model result (30.4 mm × 30.4 mm) .....................................................57
Fig. 3.12 Result of symmetry model and full size model (30.4 mm × 30.4 mm) ..................57
Fig. 3.13 Measurement test-bed for the compressive stiffness of corrugated cardboard
in its vertical direction .........................................................................................58
Fig. 3.14 Geometry of FE model for 30.4 mm × 38 mm specimen .......................................59
Fig. 3.15 Typical Force VS displacement results (30.4 mm × 38 mm) .................................60
Fig. 3.16 Measurement results of all specimens (30.4 mm × 38 mm) ...................................60
Fig. 3.17 Comparison of the FE results and measurement results (30.4 mm × 38 mm) .......61

xiii
Fig. 3.18 Experiment results for all specimens by removing the initial stage results
(30.4 mm × 38 mm) .............................................................................................62
Fig. 3.19 Measurement results with error bars (30.4 mm × 38 mm) .....................................62
Fig. 3.20 Comparison of measurement results (with error bars) and finite element results
(30.4 mm × 38 mm) .............................................................................................63
Fig. 3.21 Geometry of FE model for 60.8 mm × 38 mm specimen .......................................64
Fig. 3.22 Comparison of the measurement results and FEM results (60.8 mm × 38 mm) ....64
Fig. 3.23 FE model with the sine shape .................................................................................65
Fig. 3.24 Comparison of the results between sine shape and actual shape (30.4 mm
× 38mm) ...............................................................................................................65
Fig. 3.25 Comparison of results with sine shape and actual shape (60.8 mm × 38 mm) ......66
Fig. 4.1 Measurement test-bed in the laboratory for corrugated cardboard: (a) the
instruments and (b) detailed schematic of the vibration exciter ..........................69
Fig. 4.2 Typical result of displacement ratio VS the frequency ............................................71
Fig. 4.3 The vibration isolator system: (a) set-up; (b) schematics .........................................72
Fig. 4.4 Single-degree-of-freedom lumped model .................................................................72
Fig. 4.5 Size of corrugated cardboard for the design .............................................................75
Fig. 4.6 The platform and corrugated cardboard ...................................................................75
Fig. 4.7 Finite element result (158 mm × 210 mm) ...............................................................76
Fig. 4.8 Cardboard system - cardboards in a serial connection .............................................77
Fig. 4.9 Model of the cardboard system (without damping) ..................................................77
Fig. 4.10 Model of the cardboard system (with damping) .....................................................78
Fig. 4.11 The measured transmissibility ratio VS frequency relation for corrugated
cardboard (60.4 mm × 38 mm) ............................................................................79
Fig. 4.12 Measurement test-bed for the application ..............................................................81
Fig. 4.13 Measurement (a) with cardboard and (b) without cardboard .................................82
Fig. 4.14 Measurements on (a) front and back; (b) left and right ..........................................83

xiv
Fig. 4.15 Locations at 50 cm away from the pump (a) front and back (b); left and right .....83
Fig. 4.16 Locations at 1 m away from the pump (a) front and back; (b) left and right .........84
Fig. 4.17 locations at 1.5 m away from the pump (a) front and back; (b) left and right ........84
Fig. 4.18 Measurement results at location 1 (a) without cardboards; (b) with cardboards ....85
Fig. 4.19 Measurement results at location 2 (a) without cardboards; (b) with cardboards ....86
Fig. 4.20 Measurement results at location 3 (a) without cardboards; (b) with cardboards ....87
Fig. 4.21 Measurement results at location 4 (a) without cardboards; (b) with cardboards ....88
Fig. A.1 The measurement test-bed for the tensile test ..........................................................103
Fig. A.2 (a) liner specimen in x direction; (b) liner specimen in y direction; (c) core
specimen in x direction; (d) core specimen in y direction ...................................104
Fig. A.3 Typical stress VS strain relation of the liner in x direction .....................................105
Fig. A.4 Typical stress VS strain relation of the liner in y direction .....................................106
Fig. A.5 Stress VS strain relation of the liner in x direction for all specimens .....................107
Fig. A.6 Stress VS strain relation of the liner in y direction for all specimens .....................107
Fig. A.7 Typical stress VS strain relation of the core in x direction......................................110
Fig. A.8 Typical stress VS strain relation of the core in y direction......................................111
Fig. A.9 Stress VS strain relation of the core in x direction for all specimens ......................112
Fig. A.10 Stress VS strain relation of the core in y direction for all specimens ....................112
Fig. B.1 Measurement results for Example 2 at location 1 (a) without cardboards; (b) with
cardboards ............................................................................................................117
Fig. B.2 Measurement results for Example 2 at location 2 (a) without cardboards; (b) with
cardboards ............................................................................................................118
Fig. B.3 Measurement results for Example 2 at location 3 (a) without cardboards; (b) with
cardboards ............................................................................................................119
Fig. B.4 Measurement results for Example 2 at location 4 (a) without cardboards; (b) with
cardboards ............................................................................................................120

xv
LIST OF TABLES
Table Page
Table 3.1 Elastic material parameters of the liner and core of corrugated cardboard ...........45
Table 3.2 Plastic material parameters of the liner and core of corrugated cardboard ...........48
Table 4.1 Measured results at 29Hz for Example 1 ...............................................................89
Table 4.2 Measured results at 29Hz for Example 2 ...............................................................89
Table A.1 Average value of the measured material parameters from four liner specimens ..108
Table A.2 Material parameters for the liner...........................................................................109
Table A.3 Average value of the measured material parameters from four core specimens ..113
Table A.4 Material parameters for the core ...........................................................................114
Table A.5 Refined material parameters for the core ..............................................................115

xvi
LIST OF ABBREVIATIONS
AEDL Advanced Engineering Design Laboratory
FE Finite element
MD Machine direction
CD Cross direction
ZD Vertical direction
VS versus
BCT Box compression test
ECT Edge crush test
FCT Flat crush test
MCT Concorra Medium Test

1
CHAPTER 1 INTRODUCTION
1.1 Research Background and Motivation
There are numerous unwanted vibration sources in our living and work places, such as rotating
or reciprocating machinery, earthquake, and so on. The presence of these vibrations could lead to
system failures, extra costs of the maintenance of machine, and threats to human health (Rao,
2003). Therefore, how to reduce these undesired vibrations has been a common engineering
problem.
One of the common means to reduce unwanted vibration is the use of vibration isolator.
The vibration isolator system or isolator is a device to hinder transmission of vibrations from
vibration sources to the ground or protected machines, in which an isolator is placed between the
vibration source and the protected device (Housner and Bergman, 1997). Fig. 1.1 illustrates an
example of the vibration isolator or isolation system. In this figure, vibration isolators are placed
between the large operating machine and the ground to stop transmission of the vibration from
the machine to the ground.
Fig. 1.1 Example of vibration isolator system (http://files.b2b.cn/product/ProductImages
/2010_05/07/07101602230_b.jpg)
Several well-known concepts regarding vibration isolation are adapted from Rao (2003). A
Vibration isolator
Operating machine
Ground
2
vibration isolation system can be active or passive depending on whether or not an external
power and/or resource is required for the isolator to perform its function. A passive vibration
isolator consists of an elastic or deformable member (related to stiffness) and energy dissipater
(related to damping). An active vibration isolator also includes an actuator which may affect an
elastic member, energy dissipater, a machine, and/or the ground. An active isolator may operate
with a servomechanism, for which the isolator also includes sensors and computing processors.
It is noted that the terms such as resilient member, energy damper, machine and ground all make
sense at the logical level, which implies that physically they (or parts of them) may be integrated
into one object. This is true especially for an elastic member and an energy dissipater with a
piece of rubber (for example), commonly the former referring to the stiffness property and the
latter to the damping property.
For whatever passive or active isolators are, the common things in all isolation systems are such
that there is a body of materials, e.g., rubber, iron, etc., to serve as a physical entity of the
isolator. In the existing isolator system, the issue of using environment-friendly materials has
never been addressed to the best of author’s knowledge. In this thesis, a material system of
“corrugated cardboard” was studied for vibration isolation in particular as an isolator. The focus
of this thesis was on understanding and modeling of the material properties of corrugated
cardboard, which are stiffness and damping in this case.
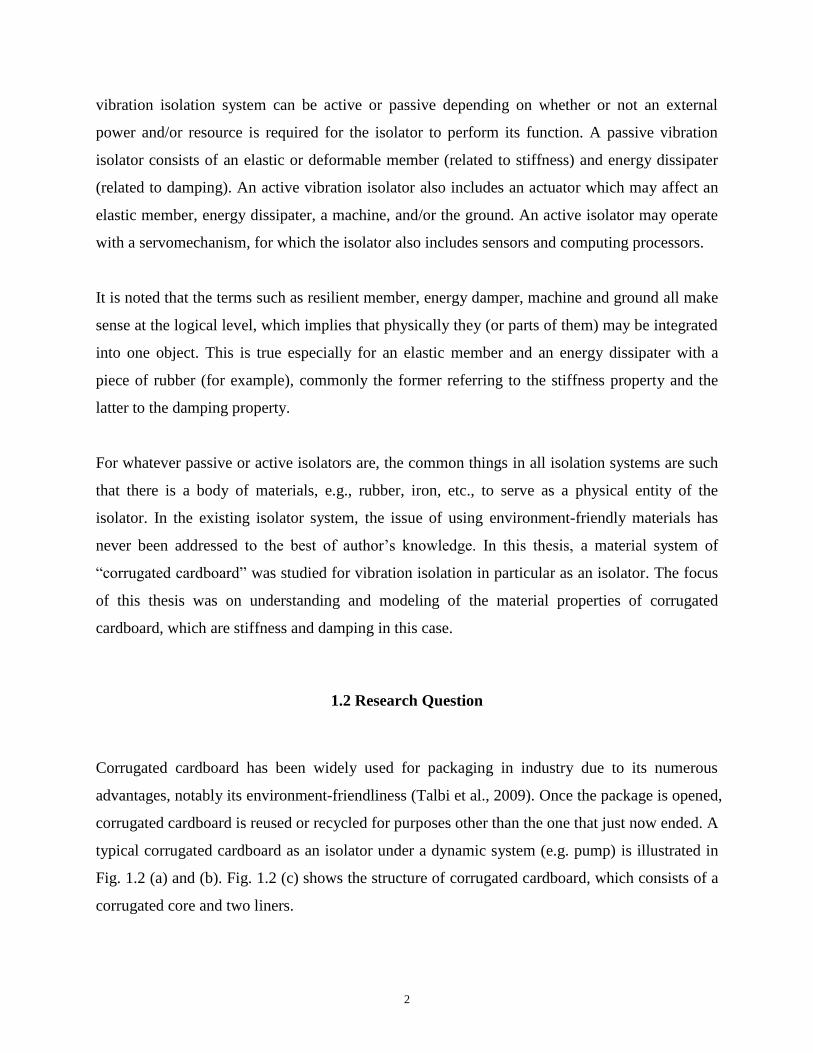
1.2 Research Question
Corrugated cardboard has been widely used for packaging in industry due to its numerous
advantages, notably its environment-friendliness (Talbi et al., 2009). Once the package is opened,
corrugated cardboard is reused or recycled for purposes other than the one that just now ended. A
typical corrugated cardboard as an isolator under a dynamic system (e.g. pump) is illustrated in
Fig. 1.2 (a) and (b). Fig. 1.2 (c) shows the structure of corrugated cardboard, which consists of a
corrugated core and two liners.

3
(a) (b)
(c)
Fig. 1.2 A corrugated cardboard as an isolator under dynamic system: (a) far view; (b) near view;
(c) Structure
The geometry of corrugated cardboard can be found in Fig. 1.2 (b) and (c). From Fig. 1.2 (b), it
can be seen that the length and width of cardboard is defined referring to its location under the
pump. Specifically, the length is along the direction of the core of cardboard while the width is
perpendicular to the direction of the core. From Fig. 1.2 (c), it can be seen that the thickness is
the thickness of the core and liner; the height is the distance between the upper liner and the
lower liner; and the Flute length is the distance between two peaks of the corrugated core.
Further, Flute length is the parameter that characterizes corrugated cardboard commercially
available (Fig. 1.3). The common flute lengths are the standard A-flute (4.67 mm), B-Flute (2.46
mm), C-flute (3.6 mm), E-flute (1.19 mm); as shown in Fig. 1.3.
Cardboard
Pump
Length Width
Upper Liner
Core
Lower Liner
Flute length
Height
Thickness

4
Fig. 1.3 Different flutes of corrugated cardboard (http://commons.wikimedia.org/wiki/File:
Cardboard_Main_Flutes_Labeled.jpg)
It is well known that the effectiveness of vibration isolation is related to the mass (or inertia),
stiffness, and damping of a vibration isolator. In a vibration isolation system, mass is an inherent
property. Stiffness and damping are behavioural properties of the system (Zhang, 2012), which
describe the relationship between the excitation and response. Particularly, stiffness represents a
system’s ability to resist by deformation in response to an external force applied along a
direction of the displacement in space (Huang et al., 2012). It is known that in space, there are
six directions of displacements (three translations and three rotations); Fig. 1.4. Therefore, the
stiffness of a system can be represented in general as a 6×6 matrix to any point on the system. In
this thesis, the author only considered the stiffness along the vertical direction of cardboard
system because the vibration in this direction is a concern (Fig. 1.5). Damping represents the
resistance to motion (velocity) that the body exhibits subject to an external force applied along a
direction of motion in space, and it thus plays a major role as dissipation of energy. Damping
follows the same structure; i.e., it is in general a 6×6 matrix. However, this thesis only
considered the damping in the vertical direction.
Fig. 1.4 Six degrees of freedom in the generalized coordinate system (http://www.newport.com/
servicesupport/Tutorials/default.aspx?id=143)

5
The effectiveness of corrugated cardboard as an isolator depends on its stiffness and damping
properties. Furthermore, to “optimize” the design of a corrugated cardboard isolator, there is a
need to understand the relationship between its stiffness and damping properties and the
parameters. Finally, to facilitate the design of a system that consists of several corrugated
cardboards, a so-called lumped schematic model of corrugated cardboard is very helpful. This
thesis took a vacuum pump in the synchrotron facility of Canada as a case to facilitate the
research. Further, corrugated cardboards were assumed to be installed under the compressive
loading in its vertical direction only (Fig. 1.5).
+
Fig. 1.5 Corrugated cardboard under the compressive loading in its vertical direction
The research questions of this thesis are described as follows:
Question (1): What are the stiffness and damping of cardboard in the vertical direction? The
answer to this question is important to evaluate the suitability of cardboard for the purpose of
vibration isolation.
Question (2): How can the stiffness of cardboard in the vertical direction be actually modelled?
The answer to this question is important to design a cardboard isolator which may contain
several cardboards in different assembly configurations. The answer to this question is also
useful to optimize the structure of cardboard for the purpose of vibration isolation.
This thesis research was motivated to generate the answers to the above questions.
Compressive loading
6
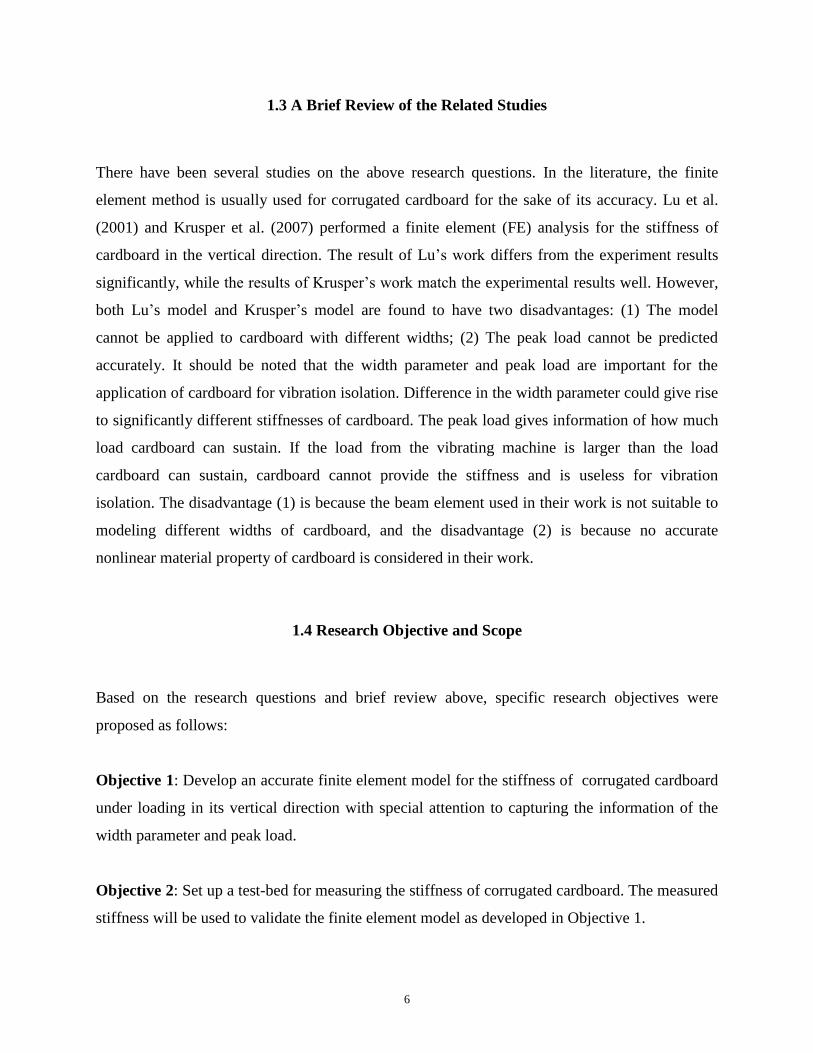
1.3 A Brief Review of the Related Studies
There have been several studies on the above research questions. In the literature, the finite
element method is usually used for corrugated cardboard for the sake of its accuracy. Lu et al.
(2001) and Krusper et al. (2007) performed a finite element (FE) analysis for the stiffness of
cardboard in the vertical direction. The result of Lu’s work differs from the experiment results
significantly, while the results of Krusper’s work match the experimental results well. However,
both Lu’s model and Krusper’s model are found to have two disadvantages: (1) The model
cannot be applied to cardboard with different widths; (2) The peak load cannot be predicted
accurately. It should be noted that the width parameter and peak load are important for the
application of cardboard for vibration isolation. Difference in the width parameter could give rise
to significantly different stiffnesses of cardboard. The peak load gives information of how much
load cardboard can sustain. If the load from the vibrating machine is larger than the load
cardboard can sustain, cardboard cannot provide the stiffness and is useless for vibration
isolation. The disadvantage (1) is because the beam element used in their work is not suitable to
modeling different widths of cardboard, and the disadvantage (2) is because no accurate
nonlinear material property of cardboard is considered in their work.
1.4 Research Objective and Scope
Based on the research questions and brief review above, specific research objectives were
proposed as follows:
Objective 1: Develop an accurate finite element model for the stiffness of corrugated cardboard
under loading in its vertical direction with special attention to capturing the information of the
width parameter and peak load.
Objective 2: Set up a test-bed for measuring the stiffness of corrugated cardboard. The measured
stiffness will be used to validate the finite element model as developed in Objective 1.

7
Objective 3: Set up a test-bed for measuring the damping of corrugated cardboard.
Objective 4: Demonstrate the effectiveness of the model of stiffness and measurement of
damping by designing a vibration isolation system using corrugated cardboard for reduction of
the vibration of a vacuum pump system.
This research was focused on the vibration in the vertical direction only and with no
consideration of the humidity and thermal effects on cardboard from the environment.
1.5 Outline of the Thesis
This thesis consists of five chapters. The remaining four chapters are outlined as follows:
Chapter 2 provides a literature review to further confirm the need and significance of the
research objectives as described before. The literature review is focused on the finite element
modelling and measurement of stiffness and damping of corrugated cardboard.
Chapter 3 presents a finite element model for the stiffness of corrugated cardboard and a test-
bed for the measurement of stiffness of corrugated cardboard under the loading in its vertical
direction. The validation of the finite element model through the test-bed will be described.
Chapter 4 presents the application of the developments in stiffness and damping of corrugated
board to design an isolator for the vacuum pump. This includes both the design and experimental
validation.
Chapter 5 concludes the thesis with discussion of the research results, contributions, and future
wor

8
CHAPTER 2 LITERATURE REVIEW
2.1 Introduction
This chapter provides a literature review necessary to facilitate understanding of this thesis, in
particular its proposed research objectives and scope discussed in Chapter 1. Section 2.2
introduces corrugated cardboard and its application. Section 2.3 presents the relevant research to
finite element analysis of corrugated cardboard. Section 2.4 discusses the relevant research on
measurement methods for stiffness. Section 2.5 discusses the measurement of damping. Section
2.6 gives a summary of the literature and revisits the proposed research objectives.
2.2 Corrugated Cardboard and its Application
Corrugated cardboard was first patented by Albert Jones (Jones, 1971) and was used for
protecting fragile products such as bottles and glass. Later, Oliver Long (Long, 1974) improved
Jones' design by strengthening corrugated board with liner sheets added on both sides, thereby
inventing corrugated cardboard as it is known now; as shown in Fig 1.2(a). It is known that the
initial use of corrugated cardboard was for the purpose of the packaging of fruits in the farm.
Nowadays, corrugated cardboard is widely used in the packaging industry to protect and
transport goods due to its lightness, recyclability and low cost (Talbi et al., 2009). The use of this
material continuously increases every year. The common structure of corrugated cardboard has
been illustrated in Fig. 1.2(a) and (b) before, which consists of a corrugated core and two liners.
The liner boards provide a high bending stiffness of the composite board, while the corrugated
core provides shear stiffness to prevent cardboard from sliding relative to each other and
prohibiting the localized buckling (Gilchrist et al., 1999). As shown in Fig. 2.1, there are three

9
main directions that characterise the cardboard, where MD is the machine direction, CD is the
cross direction, and ZD is the vertical direction (Fig. 2.1). Further, throughout this thesis, it is
noted that (1) MD: x-axis, CD: y-axis, and ZD: z-axis; (2) the length of cardboard is along the x-
axis or MD, the width is along the y-axis or CD, and the height is long the z-axis or ZD; (3) the
vertical direction corresponds to the z-axis or ZD; (4) the whole piece of cardboard is called plate.
Fig. 2.1 Three main directions that characterize cardboard (http://www.kitepackaging.co.uk/
images/singlewall.jpg)
2.3 Finite Element Modeling of Corrugated Cardboard
Finite element (FE) modeling of corrugated cardboard has been studied, including the top-to-
bottom compression strength, edge-compression strength, bending stiffness, creasing behavior,
and flat-compression stiffness, and they are briefly discussed in the following.
2.3.1 Top-to-bottom compression strength
One of the common applications for corrugated cardboard is cardboard box for storing and
transporting goods. A cardboard box is box made of corrugated cardboards, as shown in Fig.
2.2(a) and (b). The most important loading case for cardboard box is top-to-bottom compressive
loading from stacking; as shown in Fig. 2.3. Thus, the strength of cardboard under top-to-bottom
compressive loading needs to be known. The standard method to determine the strength is the
box compression test (BCT), in which buckling behavior can be observed; (Fig. 2.4). In the BCT
test, compression loading is applied on the top surface of a box and the bottom surface is fixed.
The vertical deformation of the box is recorded, and the compressive strength is then calculated
based on the load VS deformation plot from the measurements.
z, ZD y, CD
x, MD

10
(a) (b)
Fig. 2.2 Cardboard box from (a) front view (http://filmenglish.files.wordpress.com/2011/10/
cardboard-box.jpg); (b) top view (http://www.alliedpackaginguk.co.uk/images/1.jpg)
Fig. 2.3 Box stacking (http://image.shutterstock.com/display_pic_with_logo/739267/
105698087/stock-photo-stacking-cardboard-boxes-in-a-tidy-stack-on-a-white-background-
105698087.jpg)
Corrugated cardboard

11
Fig. 2.4 BCT test set-up (http://upload.wikimedia.org/wikipedia/commons/6/6b/Packaging_
Compression_tester.jpeg)
The experimental study was first conducted on the cardboard box under top-to-bottom
compression loading by McKee et al. (1963), in which the compression strength of the cardboard
box was derived. McKee et al. (1963) developed a critical compression load equation for the
cardboard box. McKee et al. (1963) proposed a semi-empirical equation to predict strength of the
cardboard box under compression. The strength from the box compression test (BCT) is given by
McKee's equation as follows (McKee, 1963):
121
bb
CDMD
b ZDDECTaBCT (2.1)
where
a, b : constants determined experimentally,
ECT : strength from Edge Crush Test,
Z : perimeter of the cardboard box, and
D : bending stiffness of corrugated cardboard.
From Eqn. (2.1), it can be found that the strength is related to the strength of corrugated
cardboard from the edge crush test (ECT), the MD and CD flexural stiffness, cardboard box
perimeter, and cardboard box depth. The ECT is a test to derive the stiffness of corrugated
cardboard under compressive loading on its edge. Further, Eqn. (2.1) is simplified as a product of
the board ECT, board thickness, and box perimeter and it is as follows (http://en.wikipedia.org/
wiki/Edge_crush_test):
dZECTBCT 876.5 (2.2)
Buckling
behaviour

12
where Z is the box perimeter, and d is the thickness of corrugated board.
The compression strength is mainly determined by the ECT strength of cardboard. In other
words, the buckling behavior of the cardboard box can be predicted by the ECT strength of
corrugated cardboard. Urbanik (1996) stated: “the accuracy of the McKee formula (McKee,
1963) was found within 6.1% on average. The McKee formula is limited to regular slotted-style
cardboard boxes. Regular slotted-style cardboard box is the box with the length does not exceed
three times the width and the perimeter does not exceed seven times the depth. Thus, the
relevance of the McKee formula to the cardboard boxes other than the regular ones needs to be
studied.” Urbanik (1996) further stated: “Statistical formulas (Maltenfort, 1956) demonstrated a
greater sensitivity to the cardboard box length and width effects than predicted by the McKee
formula. Elastic boundary conditions examined by Bulson (1969) introduced a more significant
length sensitivity for the buckled plates than that allowed by the McKee formula.”
Finite element methods have also been studied to analyze the cardboard box other than the
regular slotted-style cardboard boxes. A finite element model (Pommier and Poustis, 1989) was
proposed as an alternative to the McKee formula to predict the top-to-bottom strength of the
cardboard box. In their model, the linear material property was considered, including bending
stiffness and shear stiffness of corrugated cardboard, which were measured through an anticlastic
bending test. According to Gilchrist et al. (1999), the free rotational boundary of the folding
ridges of the cardboard sleeve was modeled since all four sides the corrugated board expands
outward under the top-to-bottom compression. The finite element methods provided results in
agreement with their experimental results. Pommier et al. (1991) further refined the finite
element model to optimize the components of the cardboard box under top-to-bottom
compression loading. The linear material property was first determined from the bending
stiffness experiment. Each corrugated cardboard was then taken as an effective homogeneous
plate and its structure was obtained by assembling four vertical plates. The equivalent material
properties of each plate were calculated by means of a homogenization process. The shell
quadratic interpolation rectangular element was used to discretize the structure as these can
model the membrane and bending stiffness of the board. Only the quarter of the structure was
analyzed, which is shown in Fig. 2.5. Four different boundary conditions were imposed on the

13
model as shown in Fig. 2.6, according to Pommier et al. (1991): (a) the side edge can rotate
freely around z-axis and can move freely in the x-y plane; (b) the side edge cannot rotate freely
around z-axis but can move freely in the x-y plane ; (c) the side edge can rotate freely around z-
axis but cannot move freely in the x-y plane; (d) the side edge can neither rotate freely around z-
axis nor move freely in the x-y plane. In Fig. 2.6, the solid curve is the shape of the plate before
deformation, while the dashed curve is the shape of the plate after deformation. The results have
shown that the first boundary condition (Fig. 2.6a) most fit the real tested condition and the BCT
results of the finite element model are consistent with the experimental results.
(a) (b)
Fig. 2.5 (a) Full size (b) one quarter size (Adapted from Pommier et al., 1991)
(a) (b) (c) (d)
Fig. 2.6 Boundary conditions on cardboard subject to the vertical loading from top view
(Adapted from Pommier et al., 1991)
Biancolini and Brutti (2003) also used FE models for the buckling analysis of cardboard boxes.
Linear elastic material properties were first derived from the experimental results. Further, each
corrugated cardboard of the cardboard box was taken as an effective homogeneous plate and its
equivalent material properties were calculated by means of a dedicated homogenization process,
y x
z
y x
z
Side edge Side edge

14
as described by Biancolini and Brutti (2003). Shell elements were used to discretize corrugated
cardboard. Further according to Biancolini and Brutti (2003), for the boundary conditions, the
nodes on the bottom edges were constrained in the vertical displacement, and the node on the
vertical displacements of the node on upper edges were connected to a master node, loaded with
the compression load. The reliability of the proposed model was checked by comparing the finite
element results with the experimental ones. The results have shown that the proposed model can
accurately predict the strength and buckling behavior of the cardboard box under a compression
test. However, the above studies were not able to predict the inelastic buckling response of the
cardboard box as a nonlinear material model was not considered.
The nonlinear material finite element model was further implemented to predict both elastic and
inelastic behaviors of the cardboard box subjected to top-to-bottom compressive loads. Beldie et
al. (2001) used Hill’s orthotropic yield criterion to characterize the nonlinear material property.
The same boundary condition was used, where the nodes on the bottom edges were constrained
in vertical displacement, and loaded on the top edge. The study represented three sets of
experiments and analysis models: compression of corrugated cardboard, cardboard box segments,
and a cardboard box. Their experimental results showed that the middle segment of the
cardboard box exhibits a higher stiffness than that of corrugated cardboard and that of the
cardboard box, which led to the conclusion that the low initial stiffness of the cardboard box was
caused by the low stiffness of the upper and lower corners. Besides, the stiffness of the cardboard
box from the FE model was found to be inconsistent with the experimental results This was
because the FE model did not consider the behavior of creases of the cardboard box. Urbanik and
Saliklis (2002) conducted a parametric study of the material characteristics that affect the critical
buckling stress of cardboard box based on finite element model with the consideration of both
the material nonlinearities and initial geometric imperfections. Their finite element model was
subjected to a uniform displacement on the top edge and the other edges were taken as simply
supported. The results from the proposed model were consistent with the experimental results
and a simplified failure formula for the corrugated box was developed based on the parameter
study.
15
2.3.2 Edge compression strength
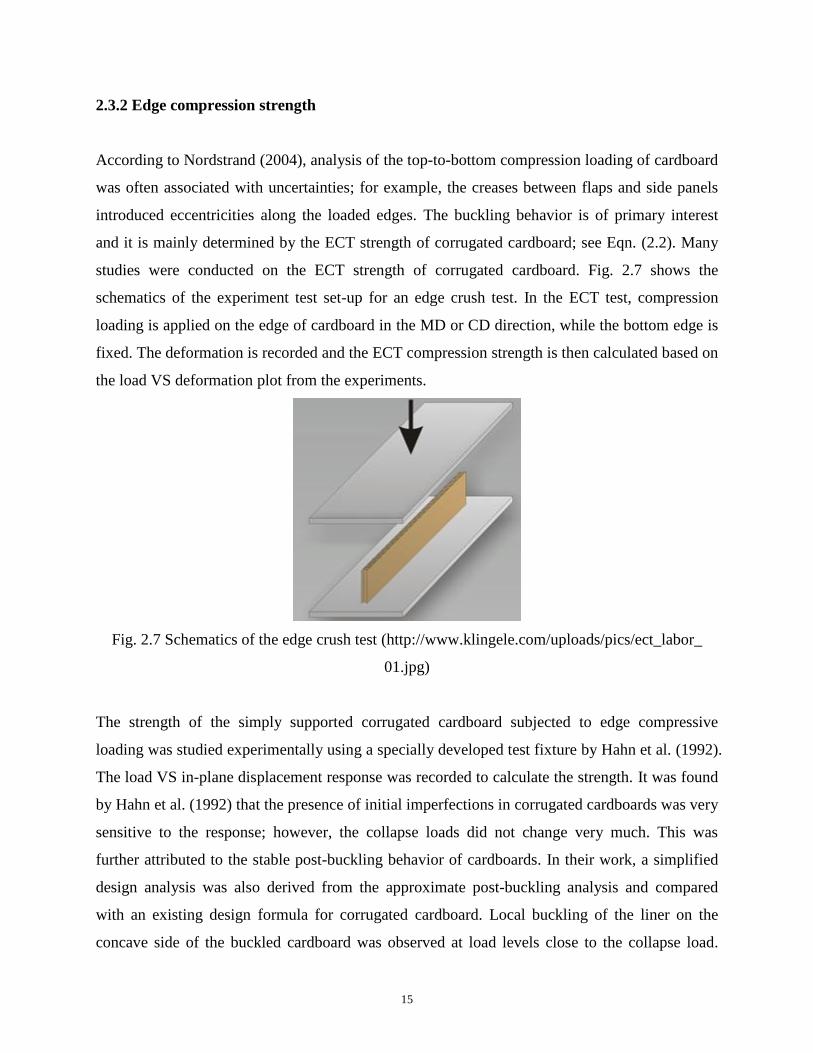
According to Nordstrand (2004), analysis of the top-to-bottom compression loading of cardboard
was often associated with uncertainties; for example, the creases between flaps and side panels
introduced eccentricities along the loaded edges. The buckling behavior is of primary interest
and it is mainly determined by the ECT strength of corrugated cardboard; see Eqn. (2.2). Many
studies were conducted on the ECT strength of corrugated cardboard. Fig. 2.7 shows the
schematics of the experiment test set-up for an edge crush test. In the ECT test, compression
loading is applied on the edge of cardboard in the MD or CD direction, while the bottom edge is
fixed. The deformation is recorded and the ECT compression strength is then calculated based on
the load VS deformation plot from the experiments.
Fig. 2.7 Schematics of the edge crush test (http://www.klingele.com/uploads/pics/ect_labor_
01.jpg)
The strength of the simply supported corrugated cardboard subjected to edge compressive
loading was studied experimentally using a specially developed test fixture by Hahn et al. (1992).
The load VS in-plane displacement response was recorded to calculate the strength. It was found
by Hahn et al. (1992) that the presence of initial imperfections in corrugated cardboards was very
sensitive to the response; however, the collapse loads did not change very much. This was
further attributed to the stable post-buckling behavior of cardboards. In their work, a simplified
design analysis was also derived from the approximate post-buckling analysis and compared
with an existing design formula for corrugated cardboard. Local buckling of the liner on the
concave side of the buckled cardboard was observed at load levels close to the collapse load.

16
Cardboard collapse was triggered by a compressive failure of the liners initiated at the unloaded
edges. According to Hahn et al. (1992), the non-linear property was very important to render an
accurate model for corrugated cardboard as cardboard may undergo large out-of-plane
displacement, i.e. deflections many times the thickness of corrugated cardboard.
Analysis of the strength and buckling behavior of corrugated cardboard under edge compressive
load requires consideration of geometrical non-linearity due to large deflection. Several
analytical studies that considered large deflection (Coan, 1951; Yamaki, 1959) were conducted
on the edge compression strength of corrugated cardboard. According to Folie (1971), there were
few analytical solutions available due to the complexity of the structure of corrugated cardboard.
In order to solve this difficulty, the finite element method was used. Finite element analysis
(Johnson and Urbanik, 1989) was employed to analyze the elastic buckling and strength of the
corrugated board under the edge compressive loading. Geometrical nonlinearity was considered
and the nonlinear material model was applied by using an orthotropic elastic-plastic stress-strain
relation. The model considered the actual structure of corrugated cardboard, and the plate
element was used to model the structure in a two dimensional (2D) domain. Fig. 2.8 is an
illustration of the finite element model with plate elements. Good agreements were shown
between the model predicted and experimental results on the strength and buckling load of
corrugated cardboard and the model was applied to optimal design of a wide variety of structures.
Biancolini and Brutti (2003) also studied the strength of corrugated cardboard under the edge
compressive load by means of experimental and finite element analysis with commercial code
MSC/Natran. Linear material properties were used and derived from experiments. Shell elements
were used, which were properly orientated to reproduce the actual structure of corrugated
cardboards of liners and flutings in a three dimensional (3D) domain. Fig. 2.9 is an illustration of
the finite element model with shell elements. In the model of Bianolini and Brutti (2003), the
upper side node was subjected to load and shared with the lower side node. The lower side node
was constrained to have the vertical displacement only. The linearized eigenvalue buckling
analysis in the finite element method was used to evaluate the model with the experimental
results on the strength and buckling load of corrugated cardboard, in which good agreement was
achieved. However, the collapse load of corrugated cardboard was not considered in their studies.

17
Fig. 2.8 Illustration of the finite element model with plate element
Fig. 2.9 Illustration of the finite element model structure with shell element
Nordstrand (1995) refined the model and performed parametric studies on the strength of
corrugated cardboard subjected to edge compressive loading based on the geometrically
nonlinear finite element analysis. The corrugated core was simplified as a homogeneous linear-
elastic layer in the finite element model. A shell element based on an iso-parametric approach
was selected, which accounts for the bending and shear deformation. Loading and boundary
conditions for the model are shown in Fig. 2.10 (Nordstrand, 1995), where w: the lateral
displacement in the Z-direction; Px: load applied on both edges, and a and b: the length and
width of cardboard, respectively. All the edges can only deform only in the x-y plane and can
rotate freely. Both buckling load and collapse load of corrugated cardboard were analyzed. The
collapse load was calculated based on material failure of the facings predicted from the Tsai-Wu
failure theory. The model was validated with the analytical solution of a previous work (Reddy,
1994). Parametric studies were then performed to investigate the sensitivity of the collapse load
with respect to changes in the transverse shear stiffnesses of the core, initial out-of plane
imperfections, asymmetry in board construction, slenderness ratio and eccentric loading of the
plate. Nordstrand (1995) found that a reduction of the transverse shear stiffnesses of the core
below a certain limit produced a significant reduction in the collapse load, and the collapse load
was insensitive to small imperfections but sensitive to large imperfections.

18
Fig. 2.10 Edge loading of corrugated cardboard (Adapted from Nordstrand, 1995)
Allansson and Svard (2001) performed a finite element analysis on corrugated cardboard with
both detailed model and simplified model. Allansson and Svard (2001) only considered the
anisotropic linear material behavior. Only the quarter of the structure were considered due to the
symmetrical structure as well as loading; Fig. 2.11. The boundary conditions are as follows: u1,
u5 and u6 were set to zero (Fig. 2.12), u2, u4 and u6 were set to zero, u3 and u4 were set to zero
(Fig. 2.12). A load was introduced on a master node on the upper side, slaving the vertical
displacements of the nodes on the upper face. A good agreement of the load–displacement
curves between experiments and finite element simulation was achieved. However, the above
models cannot predict the accurate inelastic buckling behavior of corrugated cardboard, as
nonlinear material properties were not considered.
Fig. 2.11 Quarter of cardboard with symmetry lines (Adapted from Allansson and Svard, 2001)
y
a
b
x
Px
w=0
X
Quarter
size
Y
Symmetry
19
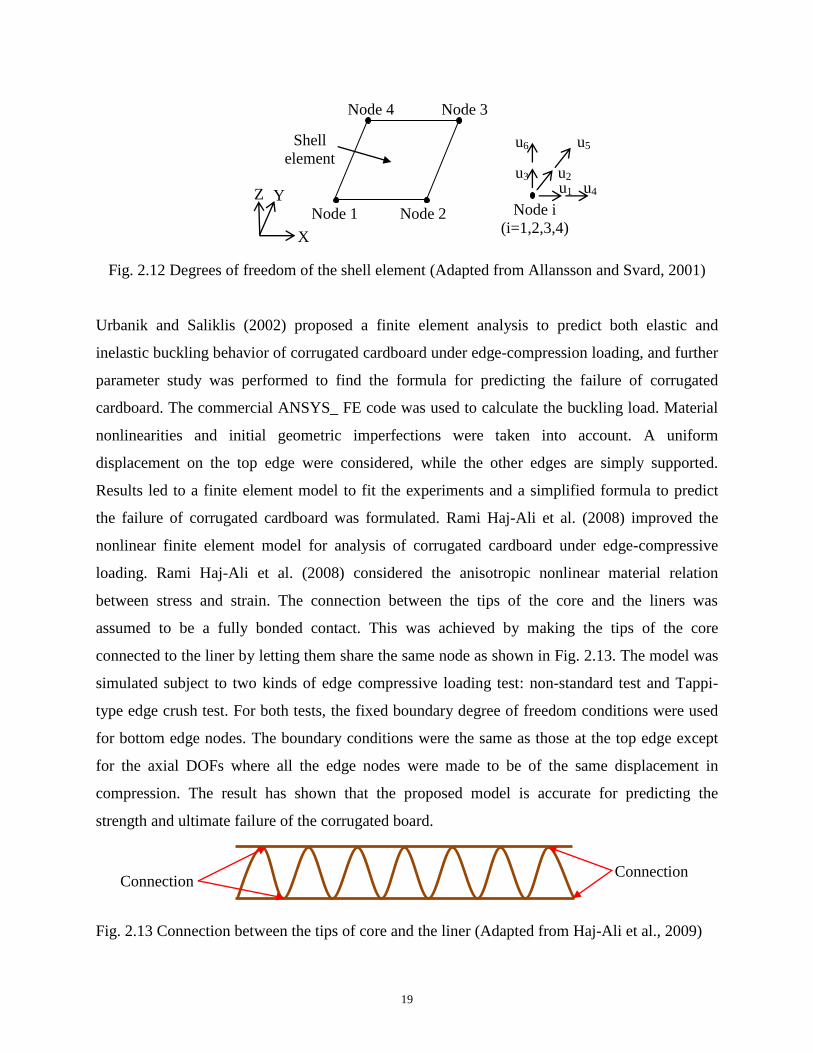
Fig. 2.12 Degrees of freedom of the shell element (Adapted from Allansson and Svard, 2001)
Urbanik and Saliklis (2002) proposed a finite element analysis to predict both elastic and
inelastic buckling behavior of corrugated cardboard under edge-compression loading, and further
parameter study was performed to find the formula for predicting the failure of corrugated
cardboard. The commercial ANSYS_ FE code was used to calculate the buckling load. Material
nonlinearities and initial geometric imperfections were taken into account. A uniform
displacement on the top edge were considered, while the other edges are simply supported.
Results led to a finite element model to fit the experiments and a simplified formula to predict
the failure of corrugated cardboard was formulated. Rami Haj-Ali et al. (2008) improved the
nonlinear finite element model for analysis of corrugated cardboard under edge-compressive
loading. Rami Haj-Ali et al. (2008) considered the anisotropic nonlinear material relation
between stress and strain. The connection between the tips of the core and the liners was
assumed to be a fully bonded contact. This was achieved by making the tips of the core
connected to the liner by letting them share the same node as shown in Fig. 2.13. The model was
simulated subject to two kinds of edge compressive loading test: non-standard test and Tappi-
type edge crush test. For both tests, the fixed boundary degree of freedom conditions were used
for bottom edge nodes. The boundary conditions were the same as those at the top edge except
for the axial DOFs where all the edge nodes were made to be of the same displacement in
compression. The result has shown that the proposed model is accurate for predicting the
strength and ultimate failure of the corrugated board.
Fig. 2.13 Connection between the tips of core and the liner (Adapted from Haj-Ali et al., 2009)
u1
u2
u4
u3
u6 u5
Node i
(i=1,2,3,4)
Z Y
X
Node 1 Node 2
Node 3 Node 4
Shell
element
Connection
Connection

20
2.3.3 Bending stiffness
Bending stiffness is another important factor for designing the strength of corrugated cardboard
box under the top-to-bottom compression loading. Numerous studies have been conducted on the
bending stiffness of corrugated cardboard using analytical and experimental approaches. In these
studies, the bending stiffness was determined based on beam formulations. Specifically, the
bending stiffness is equivalent to the product of elastic modulus and a moment of the inertia.
Review of previous analytical and experimental work on bending stiffness of corrugated
cardboard can be found in the work of Luo et al. (1995). There are two typical tests for
measuring the bending stiffness of corrugated cardboard: (1) three point bending test; (2) four
point bending test. Fig. 2.14(a) shows the principle of the three-point bending test. Cardboard is
subjected to bending by the lateral force F on the top surface, while the two ends of the bottom
surface is fixed. Fig. 2.14(b) shows the principle of the four point bending test. Cardboard is
subjected to bending by the lateral forces on both end of the top surface, while the bottom is
fixed.
(a) (b)
Fig. 2.14 (a) three point bending test (b) four point bending test
Finite element modeling (Peterson, 1983) was first applied to study the stress fields in corrugated
cardboard under the three-point bending load. The linear-elastic and symmetrical material
properties were used. The liner and the core were discretized into beam elements, and the core
was treated as a sine geometry. Loading was applied on the middle of the top surface of
corrugated cardboard, while the two ends of the lower surface were fixed. Stress was predicted
from the model and validated with the experiment results. The result indicated that the critical
location in terms of the stress was at the core.
Further, Pommier and Poustis (1990) performed finite element analysis on the bending stiffness
F F/2 F/2

21
of corrugated cardboard under a three-point loading. Linear material property was used and the
corrugated core was treated as a trapezoidal mesh structure. Assumption were that the bonding
between the fluting and liners was permanent. Similarly, loading was applied on the middle of
the top surface of corrugated cardboard, while the two ends of the lower surface were fixed. The
results were compared with the measured results for the bending stiffness, and it was found that
the model was insufficient to predict the bending stiffness. Nordstrand and Carlsson (1997)
investigated both the bending and transverse shear stiffness of corrugated cardboard under three-
point bend test using a finite element approach. Linear material properties were used and the
finite element model was discretized as a sine meshed structure using the shell element. The
model included the following features: (1) the connection between the liner and core was
constrained; (2) only a part of cardboard was considered; and (3) loading was uniform lateral
displacements over the nodes on the cross-section at the left end of the bottom surface. The
calculated bending stiffness from the finite element model was found to be consistent with the
measured result, while the calculated shear stiffness was found to be significantly larger than the
measured result. The explanation for this was that the finite element model was based on the
material properties measured before corrugation, which is inconsistent with the measurement set-
up.
Investigation on the bending stiffness of corrugated cardboard has also been performed using a
finite element approach under the four-point bending test (Gilchrist et al., 1999). Both geometric
and material nonlinearities were included in the model. The parameters in the model were
determined through tests. The shell elements were used to model cardboard. In the model, the
connection between the linear and core was modeled in two different ways: (1) the extreme
position of the core was connected to the liner by sharing the same node; (2) the multi-point
constraint (MPC) was utilized using a beam element. The results from both ways were found
approximately the same. The load vs deformation relation from the finite element model was
plotted and the model result was compared with the experimental result. The result
underestimated the bending stiffness of cardboard; the explanation for this error was that this was
due to neglecting the stiffness added by the glue which bonds the liners to the core.
The finite element model for bending was also studied by homogenizing corrugated cardboard as

22
an equivalent orthotropic plate for the purpose of computational efficiency (Aboura et al., 2004).
In this model, two situations were considered: thin shell element and the plate elements. For the
3D model, linear orthotropic material property was considered and obtained through their
experiments. The connection between the liner and core was modeled as a perfect bonding. The
tips of the core were connected directly to the liner by letting them share the same nodes. For the
2D model, the linear elastic property was used and calculated from a homogenized analytical
model proposed in their paper. A good correlation between the experimental result and the two
FE results was achieved. The results have shown that the simplified homogenized procedure is
adequately accurate and 10 times faster than the 3D approach. Talbi et al. (2008) refined the
homogenized analytical model by considering the behaviors under the transversal shear efforts
and torsion moments. The model is discretized by the shell element. Different loadings were
applied to the model including tensile loading, shear loading, and bending loading. The results
obtained by the present model were compared with those given by the 3D shell simulations and
experiments. The comparison had shown a satisfactory efficiency and accuracy with the
homogenization model.
2.3.4 Creasing behavior
According to Gooren (2006), creasing of corrugated cardboard is an important technique to
reduce the necessary moment in the fold . The creasing behavior of corrugated cardboard has
been studied by a combined experimental-numerical approach (Gooren, 2006). An experiment
set-up was designed to perform creasing on small samples of cardboard (Fig. 2.15), where
cardboard was put on an anvil and a creaser applies a force on a certain point of the top surface
of cardboard. Only the case in which the creasing force was applied in the cross direction was
considered, as this orientation is the most critical.

23
Fig. 2.15 Creasing experiment set-up (Adapted from Gooren, 2006)
A numerical approach was used to provide insight into the stress and strain distribution (Gooren,
2006). In this work, an orthotropic elastic-plastic material model was employed. The elastic
model was determined by the orthotropic Hooke’s Law, while the plastic model was based on the
Hill yield criterion. The material properties were partially determined by a tensile test and
partially determined by empirical estimation due to some measurement difficulty. The core of
corrugated cardboard was assumed to be a sine shape. The so called washboard effect, i.e. non-
flatness of the inner liner, was included in the model. For the boundary and loading condition
(Fig. 2.16), the creaser tip is modeled as a rigid circular body and undergoes a negative linear
displacement: w. Three positions of the creaser in the experiments were analyzed in the FE
model. The FE result was compared with the experimental result, but no good agreement wass
achieved. The author’s explanation was that the disagreement was caused by the limitation of the
experiment set-up. The anvil cannot constrain cardboard fully, which causes cardboard to bend
during the crease test (Fig. 2.17). This is not expected in the crease test.
Cardboard
Anvil
Creaser

24
Fig. 2.16 Loading and boundary condition imposed on the FE model (Adapted from Gooren,
2006)
Fig. 2.17 Bending of cardboard during the crease test (Adapted from Gooren, 2006)
Limits found in the work (Gooren, 2006) were solved by proposing a refined experiment set-up
(Romans 2008). In Fig 2.18, a refined creasing experiment set-up is shown, in which the
specimen is attached between four rubber clamps to constrain the board ends, and loaded by the
creaser. The FE model followed the same approach of Gooren (2006) except that the so called
washboard effect was not considered as it was marginal for the creasing behavior. A good
agreement was achieved between the finite element results and experiment results.
Position 2 Position 3 Position 1
w
Creaser
Anvil bent
Cardboard
bent

25
Fig. 2.18 Refined creasing experiment set-up (Adapted from Romans 2008)
Finite element methods have been discussed above on corrugated cardboard under a top-to-
bottom compressive loading, edge-compressive loading, bend loading, creasing loading.
However, these methods are not found adequate to modeling the behavior of corrugated
cardboard under vertical compressive loading due to no consideration of the contact behavior,
which will be discussed in detail in Section 2.3.5.
2.3.5 Flat compression stiffness
The stiffness of corrugated cardboard under compressive loading in its vertical direction is
essential to know for both manufacturing process and vibration isolation. For the vibration
isolation, as mentioned previously, it is governed by the stiffness of the corrugated board in its
vertical direction. The standard test for measuring the stiffness is called the flat crush test (FCT).
Thus, the stiffness in its vertical direction can be called the flat compression stiffness. Fig. 2.19
is an illustration of the FCT test, in which the corrugated board is placed between two plane-
parallel plates and is subjected to a compressive loading, and during the test, the load vs
displacement relation is recorded. The stiffness is then calculated based on the load vs
displacement relation plot.
Cardboard
Rubber clamp
Creaser
Rubber clamp
Rubber clamp Rubber clamp

26
Fig. 2.19 Illustration of the FCT test
There have been studies on the stiffness of corrugated cardboard under compressive loading in
its vertical direction. Lu et al. (2000) proposed a finite element model to predict the compressive
behaviour of corrugated cardboard under uniform flat compressive loading. Lu et al. (2000) used
2D curved beam elements and the elasto-plastic material which were represented by a bi-linear
constitutive model satisfying the J2-flow theory (Lu et al., 2000). Surface contact elements were
employed to model the change in the contact behaviour of corrugated cardboard during the
compression as shown in Fig. 2.20 shown. This is because the area of the contact between the
core and the liner is changing significantly in different phases of the compression (A,B,C,D,E in
Fig. 2.20).
The C flute cardboard with the same length and width was analyzed It can be found that their
FEM result differs from the experimental results quite significantly, with an error of about 30%
estimated by the author of this thesis. This is due to two factors: (1) the model used an
approximate sine shape; (2) the nonlinear material property was not accurately given.
Compressive
loading
Plate
Plate

27
Fig. 2.20 Contact change during compression (Adapted from Lu et al., 2001)
Krusper et al. (2007) has refined the finite element model of Lu’s work with a more accurate
core shape. In this model, corrugated cardboard was modelled by 2D beam elements, and linear
elastic material property was considered. Cardboard was analyzed with the same length and
width as the one studied by Lu et al. (2001). The FEM result and experimental result matched
until the peak load (where displacement is 0.2 mm) was reached. It was found that the peak load
was caused by the buckling behaviour, which was determined by the nonlinear material
properties of corrugated board (Krusper et al., 2007). However, the first peak of the load-
displacement relation could not be predicted by their model because the model has not
considered nonlinear material properties.
Overall, both Lu’s model and Krusper’s model are found to have two disadvantages: (1) The
model cannot be applied to cardboard with different widths; (2) The peak load and the its
(A)
(B)
(C)
(D)
(E)

28
subsequent response cannot be predicted accurately. It should be noted that the width parameter
and peak load are two important variables for the application of cardboard for vibration isolation.
Difference in the width parameter could give rise to significantly different stiffnesses of
cardboard. The peak load gives information of how much load cardboard can sustain. If the load
from the vibrating machine is larger than the load cardboard can sustain, cardboard is useless for
vibration isolation. The disadvantage (1) is because the element used in their work was a beam
element. The beam element models the geometry such that the length is considerably longer than
the width and the vertical. The beam element is not suitable to modeling cardboard with the
width longer than the length. The disadvantage (2) is because no accurate nonlinear material
property of cardboard is included in their models. Thus, a refined model with consideration of
the width parameter and accurate nonlinear material property should be developed.
2.4 Measurement of Stiffness
By definition, stiffness represents the resistance of an elastic body to deform in response to a
force applied along a direction of displacement in space. Stiffness can be identified as static and
dynamic due to the imposed forces. Specifically, static stiffness is the property of a structure
under loads including no inertia effects, while dynamic stiffness is the property of a structure
subjected to forces including inertia and damping effects (Chen, 2009). Usually, the dynamic
stiffness was found to be different from that measured from static tests (Dekker, 1999).
For a vibration isolator, stiffness under flat-compressive loading is the main concern. There have
been many studies on the measurement of both the static and dynamic stiffness under flat-
compressive loading. Mallik et al. (1999) studied the static stiffness of rubber isolators by
conducting a compression test in a Universal Testing Machine. A load was applied by the
machine and corresponding deformation was recorded. The static stiffness was then calculated as
the slope of the load VS deformation relation. Richards and Singh (2001) also performed a test to
measure the static stiffness of a rubber isolator. Fig. 2.21 shows the apparatus of the test, where
static loads can be applied by adding mass block. The static deformation of the isolator was
recorded from the displacement dial indicator. The static stiffness was then calculated based on

29
the load VS deformation relation. From the perspective of accuracy of measurement, the
approach (Mallik et al., 1999) is more accurate than the one of (Richards and Singh, 2001). This
is because there are more errors in the latter work (e.g. reading errors due to some misalignment
in the dial indicator; the misalignment between the weights and the rubber isolator, etc).
Fig. 2.21 Apparatus of the static stiffness test (Adapted from Richards and Singh, 2001)
Many different techniques have been developed to estimate dynamic stiffness experimentally, in
which damping is also estimated. Estimation of damping will be further illustrated in Section 2.5.
The direct method was used to measure dynamic stiffness of engine mounts (Nadeau and
Champoux, 2000). Fig. 2.22 shows the schematics of the measurement set-up. The mount was
fixed at one end, while the other end was subject to a sinusoidal excitation produced by a shaker.
The force resulting from the imposed displacement was recorded by the force transducer. The
dynamic stiffness was then defined as (Nadeau and Champoux, 2000)
jeX
FK (2.3)
where F: the amplitude of the reaction force on the blocked terminal of the rubber; X: the
amplitude of displacement on the rubber free end; : the phase angle between the displacement
and force.
Dial
indicator
Rubber
isolator
Mass
block

30
Fig. 2.22 Schematics of the measurement set-up for dynamic stiffness (Adapted from Nadeau
and Champoux, 2000)
A direct stiffness method was also applied to study dynamic stiffness of rubber at discrete
frequencies (Lapcik et al., 2001), in which servo-hydraulic systems were used. Fig. 2.23 shows
the schematic diagram of the experiment set-up, in which the hydraulic actuator was used to
apply the dynamic loading. The test specimen was subjected to both a static pre-load and a
dynamic load with controlled displacement amplitude. The displacement sensor and force
transducer were used to measure the displacement and reaction force, respectively. In this work,
the dynamic stiffness was defined as (Lapcik et al., 2001):
X
FK (2.4)
where the phase shift in the work (Nadeau and Champoux, 2000) was not considered. F here is
the amplitude of the dynamic force applied to the specimen, and X is the displacement amplitude.
Shaker
Mass
Rubber
Plate
Force
transducer
X
F

31
Fig. 2.23 Schematics of the measurement set-up for dynamic stiffness (Adapted from Lapcik et
al., 2001)
However, both works on the direct method are limited to a low frequency range due to sensitivity
of the shaker/actuator to the excitation signal. The other limitation is that the direct method is
often limited to the axial direction, whereas other directions are also important. An indirect
method (Thompson et al., 1998) has been developed an indirect method as an alternative, which
extends the possibility of measuring at higher frequency or other degrees of freedom. The
measurement apparatus is shown schematically in Fig. 2.24(a). It consisted of two blocks of
known mass and the specimen was mounted between the two blocks. Here, the reaction force
was the product of acceleration of the lower block and mass of the lower block. Governing
equations of the system were established based on the model of the system in Fig. 2.24(b), and
dynamic stiffness can be derived. The measurement method was applied to a resilient rail pad for
use in railway track and good accuracy was achieved. However, the disadvantage of the method
is that bulky seismic masses and elaborate laboratory setting are required.
X
F
Plate
Rubber
Plate
Force
Transducer
Hydraulic
actuator
Servo system
Displacement sensor

32
(a) (b)
Fig. 2.24 (a) Schematics of the measurement set-up using indirect method (Adapted from
Thompson et al., 1998); (b) Model of the measurement system (Adapted from Thompson et al.,
1998)
Lin et al. (2005) further proposed a simple experimental method to measure the dynamic rubber
mount stiffness characteristics; (Fig. 2.25). A rubber was mounted with an end steel cap. The
loading was added by steel mass. An impact hammer was used to apply force along the center of
the mass while the displacement of the mass was measured by two accelerometers attached to the
mass. The impact force and displacement were recorded and dynamic stiffness was calculated
based on the equation derived by Lin et al. (2005):
)1(
)Re(22
rR
RK
(2.5)
])1[(
12 jrKF
XR
(2.6)
Imposed
displacement
Acceleration
Upper block
Lower block
Specimen
Soft
spring
Soft
spring
Soft
spring
M1
M2
u1
u2
k1
k2
k3

33
where the variable nw
wr is the frequency ratio,
m
Kwn is the natural frequency of the
system, is the loss factor and R is ratio of displacement to force, which were all determined by
measured impact force and displacement response. The proposed method was validated by
comparing its results with those obtained by using mechanical shaker excitations and those of a
conventional direct stiffness method (Nadeau and Champoux, 2000) using blocked transfer
frequency response functions.
Fig. 2.25 Schematics of the measurement set-up of impact test (Adapted from Lin et al., 2005)
An alternative experiment test bed (Mallik, 1999) was established to obtain the dynamic stiffness
of a rubber isolator. Fig. 2.26 shows the experiment apparatus, in which the specimen is fixed at
one end in a base, and loaded under a mass in the other end. Two accelerometers are attached to
measure the acceleration and displacement of the base and the mass. When the shaker moved,
the excitation force and deformation of the specimen can be derived. The excitation force is the
product of the acceleration of the mass times mass, and the deformation is the displacement at
the mass minus the displacement at the vibration shaker. The resulting force and the deformation
can be plotted and the dynamic stiffness can be calculated
Force
Impact hammer
Displacement
Accelerometer Accelerometer
Rubber
Steel clamp
Steel mass

34
Fig. 2.26 Schematics of the measurement set-up for dynamic stiffness (Adapted from Mallik,
1999)
It is well known that the effectiveness of a vibration isolator is related to its inertia, stiffness, and
damping. Here this stiffness refers to static stiffness, but not dynamic stiffness. Thus, knowing
the static stiffness is enough for the design of a vibration isolator.
2.5 Measurement of Damping
By definition, damping is the dissipation of energy from different elements of a vibrating
structure (Zhang, 2012). In spite of many studies, understanding of damping mechanisms is quite
primitive. A commonly used mechanism regarding the damping is the so-called “viscous
damping” and it is expressed by the damping force dF assumed to be proportional to the
instantaneous velocity x , (Rao, 2003):
xcFd (2.7)
where dF : the damping force; x : velocity; c: the viscous damping constant. Further, damping
ratio is widely accepted as a basic measure of the damping, which is related to the viscous
damping constant. The damping ratio is defined as the ratio of viscous damping constant c to
the critical damping constant cc , which is given by (Rao, 2003);
Accelerometer
Accelerometer
Specimen
base
Shaker
Mass

35
ccc / (2.8)
The critical damping constant cc is defined as the damping constant c when the vibration system
converges to zero as fast as possible without oscillating, and it is defined as (Rao, 2003)
kmcc 2 (2.9)
There are three typical ways to estimate the viscous damping (Nashif, 1985, Rao, 2003):
Logarithmic decrement method, bandwidth method, and transmissibility ratio method.
Logarithmic decrement method (Rao, 2003) is used to measure the damping in time domain as
Fig 2.27 shown. In this method, the history of vibration decay (Fig. 2.27) is recorded. The
following equation (Rao, 2003) is applied:
2)(log1
i
ie
x
x (2.10)
Fig. 2.27 Response of Logarithmic decrement method (http://www.mfg.mtu.edu/cyberman/
machtool/machtool/vibration/damping.html)
The half-power bandwidth method was developed to estimate damping from frequency domain
(Rao, 2003). In this method, the frequency response function (FRF) amplitude of the system
under forced vibration (Fig. 2.28) was obtained. Corresponding to each natural frequency, there
is a peak in FRF amplitude, and there are two points corresponding to half power point, 3 dB
down from the peak. It is well-known that half-power bandwidth BD is defined as the ratio of the
frequency range between the two half power points to the natural frequency at this mode. Based
on the observed bandwidth, the damping ratio is calculated (Rao, 2003):
212
n
(2.11)

36
Fig. 2.28 Response of Half-power bandwidth method (http://www.mfg.mtu.edu/cyberman/
machtool/machtool/vibration/damping.html)
The transmissibility ratio method was proposed to estimate damping from the transmissibility
ratio VS frequency plots. The displacement ratio (rT ) is ratio of the vibration force or motion
from the vibration source to the vibration force or source transmitted, which describes the
percentage of reduction of vibration by means of the isolator. rT can be found by (Rao, 2003)
21
2222
222
)(
cmk
ck
X
X
F
FT
dtransmitte
source
dtransmitte
sourcer
(2.12)
where
forceF : vibration force from vibration source,
dtransmitteF : vibration force transmitted,
sourceX : vibration displacement from vibration source,
dtransmitteX : vibration displacement transmitted,
k : the stiffness of corrugated cardboard,
m : the mass of the steel block,
: the frequency from the vibration exciter (unit: rad/s), and
c : the damping of corrugated cardboard.
When the resonance (m
kn , where the n is the natural frequency of the whole system)
takes place, the damping can be found by (Rao, 2003)
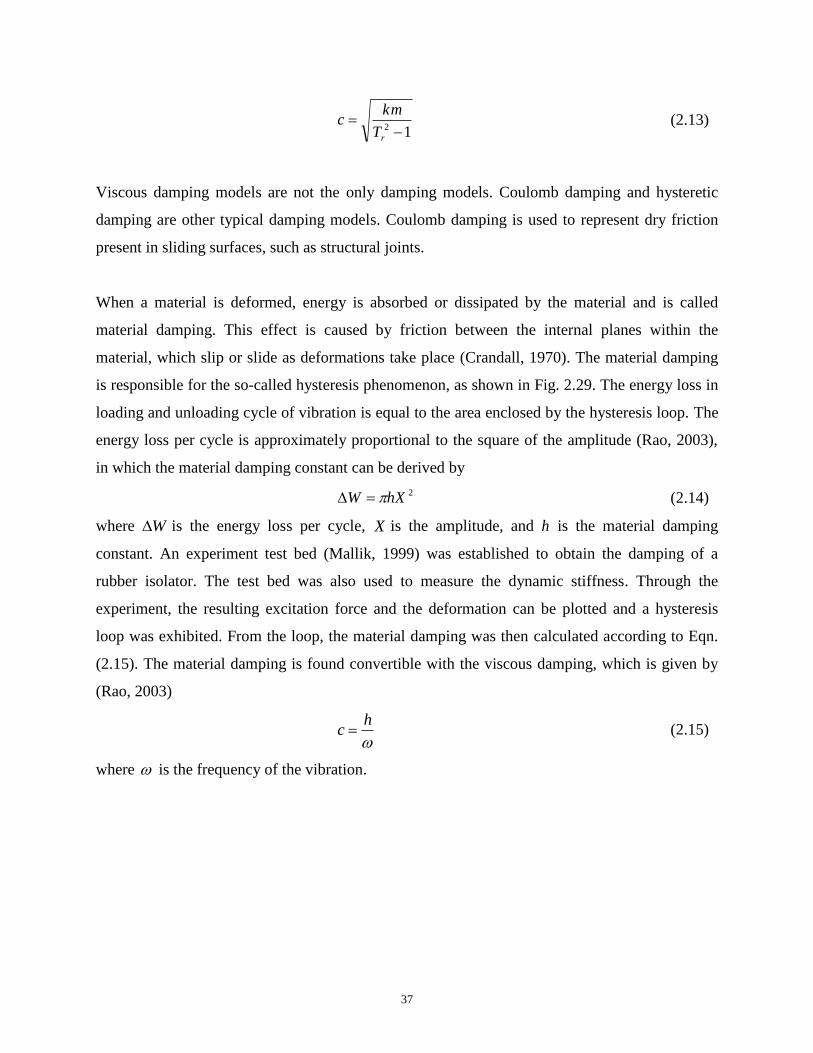
37
12
rT
kmc (2.13)
Viscous damping models are not the only damping models. Coulomb damping and hysteretic
damping are other typical damping models. Coulomb damping is used to represent dry friction
present in sliding surfaces, such as structural joints.
When a material is deformed, energy is absorbed or dissipated by the material and is called
material damping. This effect is caused by friction between the internal planes within the
material, which slip or slide as deformations take place (Crandall, 1970). The material damping
is responsible for the so-called hysteresis phenomenon, as shown in Fig. 2.29. The energy loss in
loading and unloading cycle of vibration is equal to the area enclosed by the hysteresis loop. The
energy loss per cycle is approximately proportional to the square of the amplitude (Rao, 2003),
in which the material damping constant can be derived by
2hXW (2.14)
where W is the energy loss per cycle, X is the amplitude, and h is the material damping
constant. An experiment test bed (Mallik, 1999) was established to obtain the damping of a
rubber isolator. The test bed was also used to measure the dynamic stiffness. Through the
experiment, the resulting excitation force and the deformation can be plotted and a hysteresis
loop was exhibited. From the loop, the material damping was then calculated according to Eqn.
(2.15). The material damping is found convertible with the viscous damping, which is given by
(Rao, 2003)
hc (2.15)
where is the frequency of the vibration.

38
Fig. 2.29 Hysteresis phenomenon
For the vibration isolator, the methods for both material damping and viscous damping can be
readily applied. However, it is noted that for cardboard, no test bed for measuring cardboard
damping is available in the literature.
2.6 Conclusions
A literature review on the vibration-related properties of cardboard along with how to acquire
them was presented in this chapter. These properties are stiffness and damping. Acquisition
methods for them include both modeling and experiment or measurement. It has been found that
there was no accurate model available in the literature for predicting the stiffness and buckling
behaviour of corrugated cardboard with the width longer than length under compressive loading
in its vertical direction, to the best knowledge of the author. This is further attributed to no
consideration of its nonlinear material property and width parameter in modelling. Further, no
test bed for measuring damping of cardboard is available in the literature. Thus, an improved
finite element model for stiffness of cardboard and a test bed for measuring damping of
cardboard needs to be developed to design and construct a better cardboard system for the
purpose of vibration isolation. Revisiting Section 1.4, the proposed objectives 1-3 were defined
0
X(m)
F(N)
Hysteresis loop

39
for meeting the aformentioned need. Finally, objective 4 provide a proof of the significance of
the research developed.
40
CHAPTER 3 FE MODELING FOR STIFFNESS OF CARDBOARD
3.1 Introduction
This chapter presents a study of finite element modeling and analysis for stiffness of corrugated
cardboard under a compressive loading in its vertical direction in the context of using the
commercial software ANSYS. Lu et al. (2001) and Krusper et al. (2007) previously performed
finite element analysis for cardboard with some limitations. The work presented here is expected
to overcome these limitations. The organization of this chapter is as follows: Section 3.2 will
describe details of cardboard that is considered for this study. Section 3.3 will present the finite
element model. Section 3.4 will present the result and discussion. Section 3.5 will present the
conclusions.
3.2 Cardboard System
Cardboard is a real-world system to be modeled. Further, cardboard will be used in the situation
where it is put underneath a dynamic system (e.g., vacuum pump); shown in Fig. 3.1. The
dynamic system will generate inertial force while it is in operation. The inertial force changes
periodically and creates force to the ground. This force is usually called shaking force. The effect
of shaking force is vibrations of the ground. The role of cardboard is then to reduce vibrations of
the ground in particular in the vertical direction. Cardboard is much like an "isolator", namely
making isolation of the dynamic system and the ground.

41
Fig. 3.1 The cardboard system
Fig. 3.2 is a schematic diagram of cardboard and its application situation. In this figure, the
information of cardboard (as an example) is given as follows: the thickness of the liner and core
is 0.23 mm; the height is 3.6 mm; the length is 32 mm; the width is 38 mm. The FE model is
supposed to represent the stiffness of cardboard in the vertical direction (Fig. 3.2).
Fig. 3.2 Schematic diagram of cardboard (http://www.kitepackaging.co.uk/images/
singlewall.jpg)
3.3 FE Modeling for Stiffness of Cardboard
In this section, a finite element modeling and analysis for stiffness of corrugated cardboard under
a compression loading in its vertical direction is performed. Based on the well known general
procedure of FE analysis in particular recommended by ANSYS (ANSYS, 2004), the finite
element model which describes stiffness of cardboard system is described in the following
sections.
length width
Thickness
Cardboard
Vacuum
pump
Ground

42
3.3.1 Element assignment
The shell element is used to represent corrugated cardboard. By definition, a shell is a geometric
form where the thickness of the element is much smaller than the length and the width of the
element. Apparently, the shell element has an excellent fit to both the liner and core of
corrugated cardboard as shown in Fig. 3.1. Specifically, the shell 181 element (see Fig. 3.3) in
ANSYS software is selected, as it includes reduced integration schemes and thus more
computationally efficient.
The shell 181 element has 4 nodes (I, J, K, L in Fig. 3.3) and six degrees of freedom at each node
(translations in the nodal x, y, and z directions and rotations about the nodal x, y, and z axes).
The element enables to model plasticity, stress stiffening, large deflection, and large strain.
Fig. 3.3 Shell 181 4-Node Structure Shell Element (Adapted from ANSYS, 2004)
3.3.2 Element real constants
There are three real number constants available for the shell 181 element, and they are (1)
thickness, (2) element coordinate system orientation, and (3) mass per unit area. According to
ANSYS (2004), the shell 181 element assumes that the thickness changes (if not constant)
smoothly over the area of the element. The element allows for description of varying thickness in
the region which is covered by the element, and this is achieved by having different thickness at
each of the four corner nodes I, J, K, L (in Fig. 3.3), respectively. If the element has a constant
thickness, only the thickness of the corner node I is specified; otherwise, the thicknesses at all
I
L
K
J
Y
X
Z
O
43
four nodes need to be specified. For cardboard as shown in Fig. 3.2, the thickness is a constant,
0.28 mm in particular.
The orientation of the element coordinate system is named as THETA in ANSYS software.
Unless otherwise stated, the orientation of the element coordinate system is the default
orientation for that element type, that is, 0 degrees. It is noted that the origin of the element
coordinate system is at the node I (see Fig. 3.3). The element coordinate system is called local
coordinate system. The mass per unit area is named as ADMSUA in ANSYS software, and it is 0
as default for cardboard system, as shown in Fig. 3.2.
3.3.3 Material property
Corrugated cardboard is made of oriented wood fibers, and its material properties are thus
anisotropic. Commonly, the fiber orientation is approximately symmetric. This means that the
material property can be assumed to be orthotropic. Generally, the material property is described
by the material constitutive relationship or model. In this thesis, an orthotropic material
constitutive model was employed for the two liners and core of corrugated cardboard. The
orthotropic constitutive model consists of two parts: the linear elastic and the nonlinear plastic
portion. The linear elastic portion is governed by orthotropic Hooke’s Law, while the plastic
portion is governed by a quadratic Hill yield criterion. The linear elastic orthotropic constitutive
model, in terms of relation between stresses and strains for the paper, is assumed to be one as
follows (Allasson and Svard, 2001):

44
yz
xz
xy
z
y
x
yz
xz
xy
zy
yz
x
xz
z
zy
yx
xy
z
zx
y
yx
x
yz
xz
xy
z
y
x
G
G
G
EEE
EEE
EEE
100000
01
0000
001
000
0001
0001
0001
(3.1)
where
x , y , z : Strain in x, y, z direction,
xy , xz , yz : Strain in xy, xz, yz plane,
xE , yE , zE : Young’s modulus in x, y, z direction,
xy , xz , yz : Poisson ratio in xy, xz, yz plane, and
xyG , xzG , yzG : Shear modulus in xy, xz, yz plane.
The symmetrical geometry of cardboard leads to (Allasson and Svard, 2001):
y
yx
x
xy
EE
,
z
zx
x
xz
EE
,
z
zy
y
yz
EE
(3.2)
Thus, there are nine unknown parameters to be determined, and they are: xE , yE , zE , xy , xz ,
yz , xyG , xzG , yzG . Generally, all these parameters have to be measured. However, it is
impossible to measure some of the parameters due to the small dimension in the vertical
direction of the liner and core. For cardboard system as shown in Fig. 3.2, the in-plane material
parameters ( xE and yE ) are measured by the standard tensile test (see Appendix A). While the
other parameters are derived empirically as follows.
For the Young’s modulus in the vertical direction, it is approximated according to Persson
(1997), which is given by

45
200/xz EE (3.3)
The shear modulus are approximated according to (Mann et al., 1980; Baum et al., 1981) with
yxxy EEG 387.0 (3.4)
55/xxz EG (3.5)
35/yyz EG (3.6)
The value of xy , xz and yz are set according to (Nordstand, 1995). A trial and error procedure
has also been performed, in which different values of the material parameters have been tested in
order to get the results as close as possible to that of the experiments. Based on the trial and error,
the elastic material parameters used for the model are listed in Table 3.1. The detailed
identification of these material parameters can be found in Appendix A.
Table 3.1 Elastic material parameters of the liner and core of corrugated cardboard
Elastic material property liner Core
xE (GPa) 3.2 5
yE (GPa) 2 1.3
zE (GPa) 0.016 0.025
xy 0.34 0.34
yz 0.01 0.01
xz 0.01 0.01
xyG (GPa) 1 1
yzG (GPa) 0.058 0.05
xzG (GPa) 0.057 0.005
The nonlinear plastic orthotropic constitutive model is governed by the Quadratic Hill yield
criterion (Hill, 1983). Yield criterions have been developed for orthotropic plastic deformations.
The most widely used version was the Quadratic Hill yield criterion (Hill, 1983), and it is
commonly applied in sheet metal applications. However, this yield criterion has not considered
different in yield strength in tension and compression, which was however considered by Shin
and Lee (1978) and known as generalized Hill potential theory. Both yield criterions above were
designed for material that do not have pressure-dependent yield surfaces to model foams and
polymers. An extension that allows for pressure dependence was proposed in (Caddell et al.,
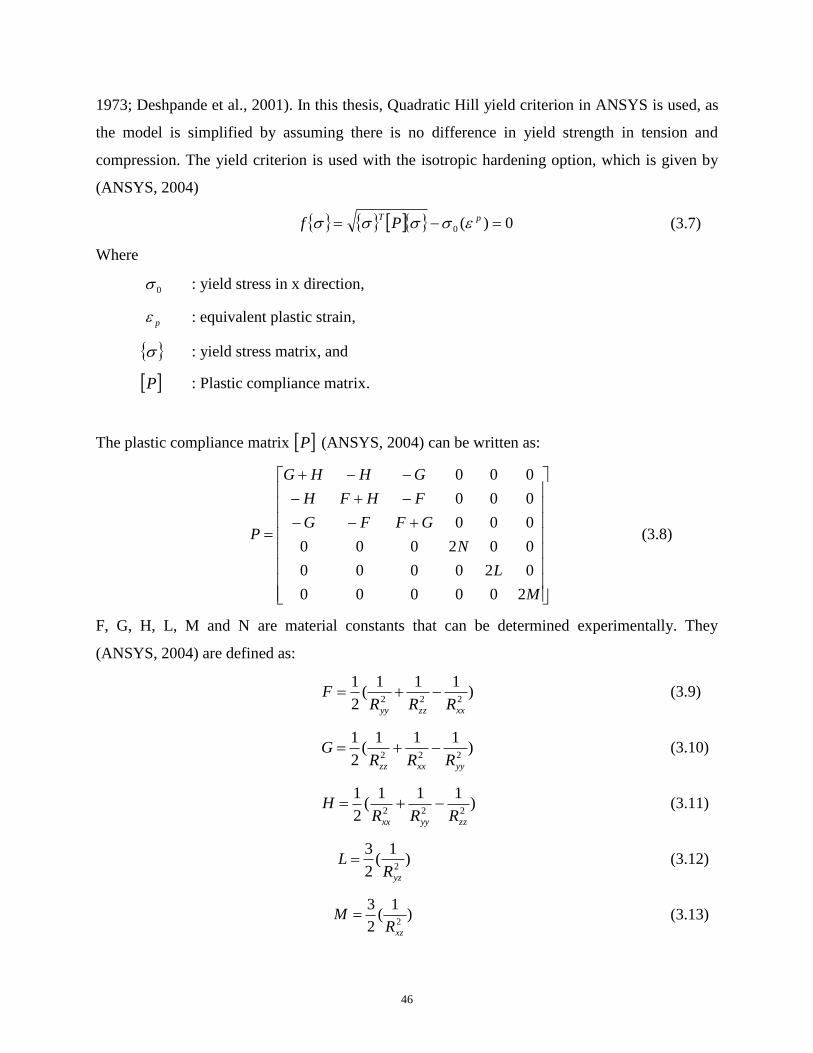
46
1973; Deshpande et al., 2001). In this thesis, Quadratic Hill yield criterion in ANSYS is used, as
the model is simplified by assuming there is no difference in yield strength in tension and
compression. The yield criterion is used with the isotropic hardening option, which is given by
(ANSYS, 2004)
0)(0 pTPf (3.7)
Where
0 : yield stress in x direction,
p : equivalent plastic strain,
: yield stress matrix, and
P : Plastic compliance matrix.
The plastic compliance matrix P (ANSYS, 2004) can be written as:
M
L
N
GFFG
FHFH
GHHG
P
200000
020000
002000
000
000
000
(3.8)
F, G, H, L, M and N are material constants that can be determined experimentally. They
(ANSYS, 2004) are defined as:
)111
(2
1222
xxzzyy RRRF (3.9)
)111
(2
1222
yyxxzz RRRG (3.10)
)111
(2
1222
zzyyxx RRRH (3.11)
)1
(2
32
yzRL (3.12)
)1
(2
32
xzRM (3.13)

47
)1
(2
32
xyRN (3.14)
Here, the yield stress ratios yzxyzzyyxx RRRRR ,,,, and xzR (ANSYS, 2004) are calculated as:
0
y
xxxxR (3.15)
0
y
yy
yyR (3.16)
0
y
zzzzR (3.17)
0
3
y
xy
xyR (3.18)
0
3
y
yz
yzR (3.19)
0
3
y
xzxzR (3.20)
where y
ij is the yield stress in x, y, z direction and xy, yz and xz plane.
Further, the plastic slope of the material after yield point (ANSYS, 2004) is:
tx
txpl
EE
EEE
(3.21)
where
xE : Elastic modulus in x direction
tE : Tangent modulus after the yield point
Thus, in order to fulfill the yield criterion, 0 , tE , xxR , yyR , zzR , xyR , yzR and xzR need to be
determined. Specifically, the in-plane material parameters 0 , tE , xxR , yyR were derived from
the results of tensile test mentioned above, while the other parameters were set according to
Gooren (2006). A trial and error procedure has also been performed, in which different values of
the material parameters have been tested in order to get the results as close as possible to that of
the experiments. Based on the trial and error, the plastic material parameters used for the model

48
are listed in Table 3.1. The detail identification of these material parameters can be found in
Appendix A.
Table 3.2 Plastic material parameters of the liner and core of corrugated cardboard
Plastic material property Liner Core
0 (GPa) 0.03 0.011
tE (GPa) 2.5 0.01
xxR 1 1
yyR 0.35 0.3
zzR 0.23 0.3
xyR 0.635 0.63
yzR 0.635 0.63
xzR 0.635 0.63
3.3.4 Element mesh
The indirect generation approach is applied to create the finite element model, as it is more
effective for the complicated geometry of model, e.g., the core of corrugated cardboard. In this
approach, the geometric shape of the model is first created, and then the ANSYS program is
instructed to automatically mesh the geometry with nodes and elements. Thus, the modeling
procedure has two steps as below: (a) Geometrical model; (b) Finite element mesh.
a. Geometrical model
The geometry of cardboard is modeled for a C flute corrugated cardboard. The geometry of the
core is usually approximately as a sine shape. Fig. 3.4 shows a diagram comparing the actual
shape and the sine shape (Biancolini and Brurri, 2003). The actual shape is preferred for the sake
of accuracy. In this FE model, the actual shape is estimated according to Fig. 3.4 (Biancolini and
Brurri, 2003) and it is shown in Fig. 3.5. Referring to Fig. 3.5, the dimensions of cardboard for a
single core are: the thickness of the liner and core is 0.23 mm; the height is 3.6 mm; the flute
length is 7.6 mm; the width is 7.6 mm.

49
Fig. 3.4 Actual shape and sine shape (Adapted from Biancolini and Brurri, 2003)
In the finite element model, it is noted that the connected nodes between the tip of the core and
the liner are modeled (Fig. 3.5) by making them share the same node.
Fig. 3.5 Geometry of corrugated cardboard with the actual shape in FE model
b. Finite element mesh
thickness
thickness
Height
Core length
Connected
nodes
Connected
nodes Connected
nodes
0.2 0.4 0.6 0.8 1 0 -1
-0.8 -0.6 -0.4
-0.2 0
0.2 0.4
0.6
Actual
sine 0.8
1

50
Shell 181 elements were used to mesh the structure of cardboard. To identify the number of
elements that are needed for a mesh in the finite element model to give satisfactory prediction, a
mesh sensitivity study was performed for the stiffness of a corrugated cardboard under a
compressive loading in its vertical direction. The specimen studied is a cardboard with a single
core with the same geometry parameters as described above. Fig. 3.6 shows several mesh
schemes for the same corrugated cardboard. It is noted that the core has more elements than the
liner with the same mesh density due to the difference in their geometry. This work investigated
ten meshing densities. The results indicated that the stiffness derived from 20 elements for the
liner and 30 elements for core has no difference from the system with more elements. Thus, 20
elements for the liner and 30 elements for a cardboard with a single core are adequate to model
the compressive stiffness of the corrugated board.
(a) (b)
(c) (d)
Fig. 3.6 Meshing schemes with (a) 8 elements for liner and 12 elements for core; (b) 13 elements
for liner and 20 elements for core; (c) 20 elements for liner and 30 elements for core; (4) 40
elements for liner and 60 elements for core.

51
3.3.5 Contact behavior
It has been observed that during the loading process, the contact between the core and liners
changes (Lu et al., 2001). There are 5 phases of contact as shown in Fig. 3.7 (A, B, C, D, E). The
common phenomenon in all these phases is that during a compressive loading, the core and two
liners share the same force and deformation in the vertical direction while have slipping between
them in the contact tangential direction or horizontal direction if the perfect motion is assumed;
as shown in Fig. 3.7.
Fig. 3.7 Contact behavior during different phase of compression (A, B, C, D, E) (Adapted from
Lu et al., 2001)
The contact was then modeled by the surface to surface contact elements. In ANSYS, for such
problems involving contact between two surfaces, one of the surfaces is conventionally taken as
the “target” surface, and the other as the “contact” surface (ANSYS 2004). For the rigid-to-
flexible contact, the target surface is always the rigid surface, and the contact surface is the
(A)
(B)
(C)
(D)
(E)

52
deformable surface. For the flexible to flexible contact, it follows the rules below (ANSYS,
2004):
a) If a convex surface is expected to come into contact with a flat or concave surface, the
flat/concave surface should be taken as the target surface.
b) If one surface has a fine mesh, while the other has a coarse mesh, the fine meshed surface is
taken as the contact surface and the coarse mesh as the target surface.
c) If one surface is stiffer than the other, the softer surface is taken as the contact surface and
the stiffer surface as the target surface.
d) If a high-order element underlies one of the two surfaces and a lower order element underlies
the other surface, the former is taken as the contact surface and the latter as the target surface.
e) If one surface is marked larger than the other surface, where particularly in one surface
surrounds the other surface, the larger surface is taken as the target surface.
For cardboard, a flexible-to-flexible situation was considered, because both the core and the
liners are deformable. Following the rule (c), the liner is taken as the target surface, while the
core is as the contact surface.
Further one needs to examine the sliding behaviour between two contact surfaces. In ANSYS,
several sliding behaviours can be modeled (ANSYS, 2004):
i. Standard contact. Once in contact, the surfaces slide.
ii. Rough contact. Once in contact, the surfaces are not able to slide.
iii. No separation contact. Once in contact, the surfaces slide but permanently tie together
iv. Bonded contact. Once in contact, the surfaces are not able to slide but permanently tie
together.
v. No separation always contact. Once in contact, the surfaces slide but permanently tie
together. It differs from (iii) as contact only happens in the contacted area where
designated.
vi. Bonded always contact. Once in contact, the surfaces are not able to slide but
permanently tie together. It differs from (iv) as contact only happens in the contacted
area where designated.

53
vii. Bonded initial contact. Once in contact, the surfaces are not able to slide but permanently
tie together. It differs from (iv), (vi) as contact only happens in the initial contacted area.
For corrugated cardboard, the (i) standard sliding behaviour is most appropriate based on the
observation of the real operation of cardboard. Fig. 3.8 illustrates the contact model of
corrugated cardboard, where two pairs of the target element and contact element are set for the
top liner and core, and the bottom liner and core, respectively. The contact behaviour was
performed by ANSYS and recorded for different phases of loading (see Fig. 3.9), which is the
same as what was observed in the experiment.
(a) (b)
Fig. 3.8 Contact model of (a) the top liner and core; (b) the bottom liner and core
(a) (b)

54
(c) (d)
Fig. 3.9 Contact behavior of corrugated cardboard at displacement level of (a) 0.1mm; (b) 0.3mm;
(d) 0.7mm; (e) 1.1mm
3.3.6 Boundary condition and loads
The boundary condition and loads were defined for the FE model above. To make the model as
simple as possible, the following assumption of the boundary condition and loads is made: the
friction between the machine and cardboard (Fig. 3.1) is so large that any horizontal movement
of the upper and lower liners can be prevented. This assumption is supported by what is actually
observed during the tests. Loads are applied on the finite element model as shown in Fig. 3.10.
To apply uniform compressive loads, vertical displacement loads are applied on the top liner of
the corrugated board. It is noted that this displacement will be divided into a series of
displacement load increments for performing the geometric, material and changing-status
nonlinearity analysis in this model. To apply the boundary condition, the top liner is constrained
in all direction except the vertical directions, while the bottom liner of corrugated cardboard is
constrained in all directions. Besides, the symmetry boundary condition is used to model only a
quarter of the full size model. Specifically, the two edges of corrugated cardboard are
constrained in the horizontal direction due to the symmetry.
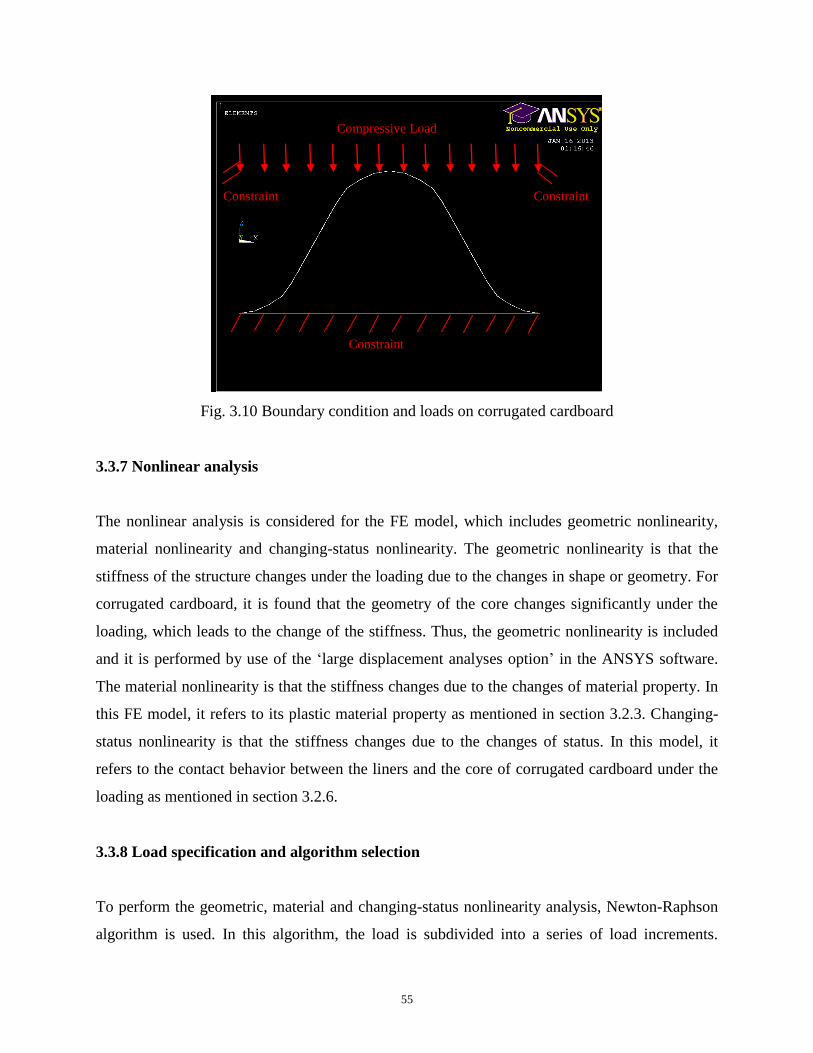
55
Fig. 3.10 Boundary condition and loads on corrugated cardboard
3.3.7 Nonlinear analysis
The nonlinear analysis is considered for the FE model, which includes geometric nonlinearity,
material nonlinearity and changing-status nonlinearity. The geometric nonlinearity is that the
stiffness of the structure changes under the loading due to the changes in shape or geometry. For
corrugated cardboard, it is found that the geometry of the core changes significantly under the
loading, which leads to the change of the stiffness. Thus, the geometric nonlinearity is included
and it is performed by use of the ‘large displacement analyses option’ in the ANSYS software.
The material nonlinearity is that the stiffness changes due to the changes of material property. In
this FE model, it refers to its plastic material property as mentioned in section 3.2.3. Changing-
status nonlinearity is that the stiffness changes due to the changes of status. In this model, it
refers to the contact behavior between the liners and the core of corrugated cardboard under the
loading as mentioned in section 3.2.6.
3.3.8 Load specification and algorithm selection
To perform the geometric, material and changing-status nonlinearity analysis, Newton-Raphson
algorithm is used. In this algorithm, the load is subdivided into a series of load increments.
Compressive Load
Constraint
Constraint Constraint

56
According to ANSYS (2004), before solution of each load increments, the Newton-Raphson
algorithm evaluates the out-of-balance load vector, which is the difference between the restoring
forces (the loads corresponding to the element stresses) and the applied loads. It is noted that
restoring force is related to the stiffness matrix of the structure, and it is updated according to the
change of geometry, material and status for each load increments. The program then performs
the solution and checks for convergence. If the convergence criteria are not satisfied, the out-of-
balance load vector is re-evaluated, followed by an update of the stiffness matrix to obtain a new
solution. This iterative procedure continues until the problem converges. In this finite element
model, 100 load increments are found adequate for the accuracy of the analysis. After the above
procedure, the solution is initiated and the ANSYS program takes model and load information
from the database defined and calculates the results.
3.3.9 Results
The result of the finite element analysis is presented in the format of force VS displacement
relation, and the stiffness is calculated based on the relation. Specifically, the displacement refers
to the vertical displacement of points at the top liner of the corrugated board, and the force is the
sum of the reaction force on the top liner board. The displacement and force were recorded for
all displacement loading increments. It is noted that the symmetry model (one quarter of the full
size model) is used for the FE analysis in this thesis, thus its force should be multiplied by four to
represent the force of the full size model. A typical FE result for a C flute corrugated cardboard
with length 30.4 mm and width 30.4 mm is shown in Fig. 3.11, where the horizontal axis is the
prescribed displacement and the vertical axis is the force. Upon loading, the specimen responds
linearly response up to the first peak load (at 0.8 mm). After the peak load, a decrease of force
can be observed from the figure. The slope of the linear part of the force VS displacement
relation is calculated as the stiffness.

57
Typical FE results of the corrugated cardboard
05
10
15202530
3540
0 0.2 0.4 0.6 0.8 1 1.2
Displacement (mm)
Fo
rce
(N)
Fig. 3.11 Typical FE model result (30.4 mm × 30.4 mm)
Further, the result of symmetry model of this cardboard was compared with that from the full
size model, and good correlation was found between the two results (see Fig. 3.12).
Typical FE results of the corrugated cardboard
0
5
10
15
20
25
30
35
40
0 0.5 1 1.5Displacement (mm)
Fo
rce (
N)
Symmetry
Full size
Fig. 3.12 Result of symmetry model and full size model (30.4 mm × 30.4 mm)
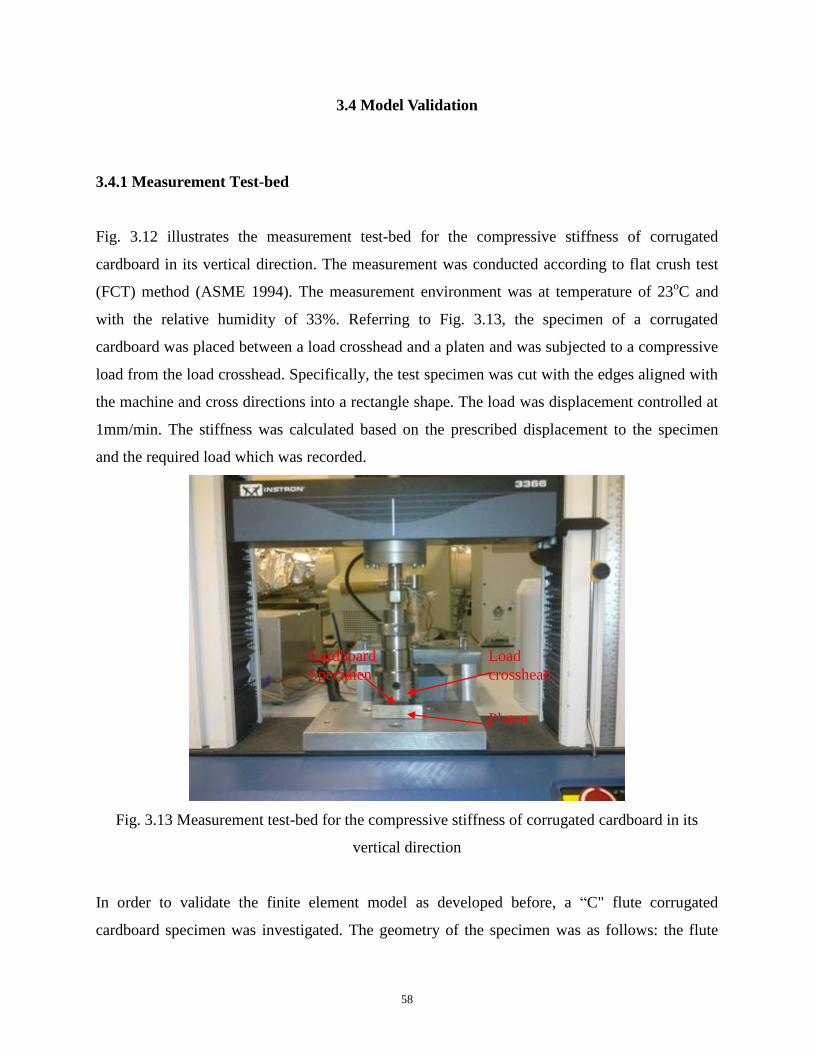
58
3.4 Model Validation
3.4.1 Measurement Test-bed
Fig. 3.12 illustrates the measurement test-bed for the compressive stiffness of corrugated
cardboard in its vertical direction. The measurement was conducted according to flat crush test
(FCT) method (ASME 1994). The measurement environment was at temperature of 23oC and
with the relative humidity of 33%. Referring to Fig. 3.13, the specimen of a corrugated
cardboard was placed between a load crosshead and a platen and was subjected to a compressive
load from the load crosshead. Specifically, the test specimen was cut with the edges aligned with
the machine and cross directions into a rectangle shape. The load was displacement controlled at
1mm/min. The stiffness was calculated based on the prescribed displacement to the specimen
and the required load which was recorded.
Fig. 3.13 Measurement test-bed for the compressive stiffness of corrugated cardboard in its
vertical direction
In order to validate the finite element model as developed before, a “C" flute corrugated
cardboard specimen was investigated. The geometry of the specimen was as follows: the flute
Load
crosshead
Platen
Cardboard
Specimen

59
length 7.6 mm; length 30.4 mm (4 flute length); width 38 mm; height 3.6 mm and thickness of
the liner and core 0.28 mm. Seven new specimens were repeated for the measurement. However,
for the FE model, as the symmetry model (one quarter of the full size model) used, its length will
change to 15.2 mm (2 flute length) and the width will change to 19 mm, which is shown in Fig.
3.14. It is noted that the force obtained from the symmetry FE model needs to be multiplied by
four to be compared with that from the measurement result for the validation.
Fig. 3.14 Geometry of FE model for 30.4 mm × 38 mm specimen
3.4.2 Results and validation
A typical force VS displacement curve through the aforementioned measurement is shown in
Fig. 3.15. Upon loading, the specimen first shows a nonlinear response until a displacement level
(0.2 mm) is reached. This may be attributed to the fact that the liner of cardboard is not flat
enough but a bit wavy. Specifically, the initial nonlinear response is largely due to the flattening
of these wavy liners. After the initial response, the specimen then responded linearly up to the
first peak load at about 185N. Following the peak load, the load required to deform the specimen
gradually decreases. This is found to be attributed to the nonlinear plastic material behaviour of
corrugated cardboard (Krusper et al., 2007). Seven new specimens were repeated and those
results can be found in Fig. 3.16. It can be seen from this figure that the seven specimens
responded with a slight variation, which was expected.
Flute length
19 mm
15.6 mm
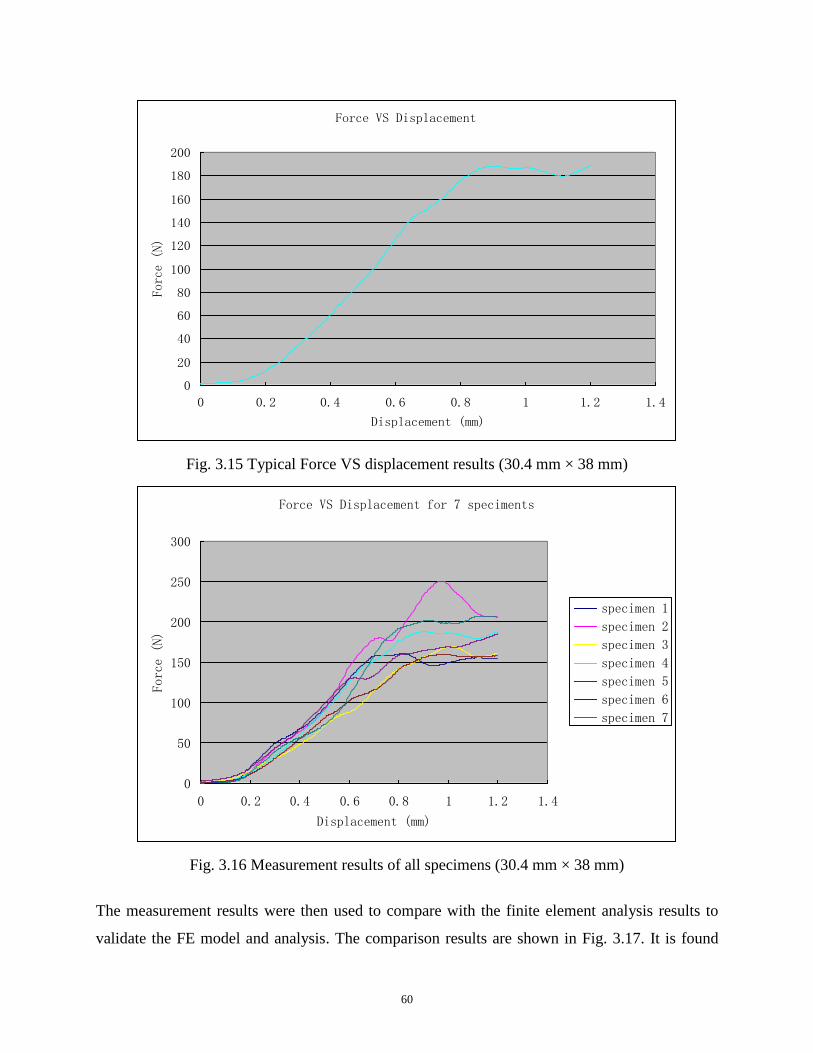
60
Force VS Displacement
0
20
40
60
80
100
120
140
160
180
200
0 0.2 0.4 0.6 0.8 1 1.2 1.4
Displacement (mm)
Force (N)
Fig. 3.15 Typical Force VS displacement results (30.4 mm × 38 mm)
Force VS Displacement for 7 speciments
0
50
100
150
200
250
300
0 0.2 0.4 0.6 0.8 1 1.2 1.4
Displacement (mm)
Force (N)
specimen 1
specimen 2
specimen 3
specimen 4
specimen 5
specimen 6
specimen 7
Fig. 3.16 Measurement results of all specimens (30.4 mm × 38 mm)
The measurement results were then used to compare with the finite element analysis results to
validate the FE model and analysis. The comparison results are shown in Fig. 3.17. It is found

61
that the finite element result differs significantly from the measurement result in the initial
loading stage, while it is close to the measurement result afterwards. This situation is not
surprising because the measured specimen has the wavy liner and it needs to be flattened at the
initial stage, while the finite element model assumes that the liner is flat all the time. Thus, the
two results are only comparable after the initial stage. The results of the initial stage (up to 30N)
are removed from Fig. 3.18.
Experiment results (32mm*38mm)
0
100
200
300
400
500
600
700
800
0 1 2 3 4
Displacement (mm)
Force (N)
specimen 1
specimen 2
specimen 3
specimen 4
specimen 5
specimen 6
specimen 7
Finite element result
Fig. 3.17 Comparison of the FE results and measurement results (30.4 mm × 38 mm)
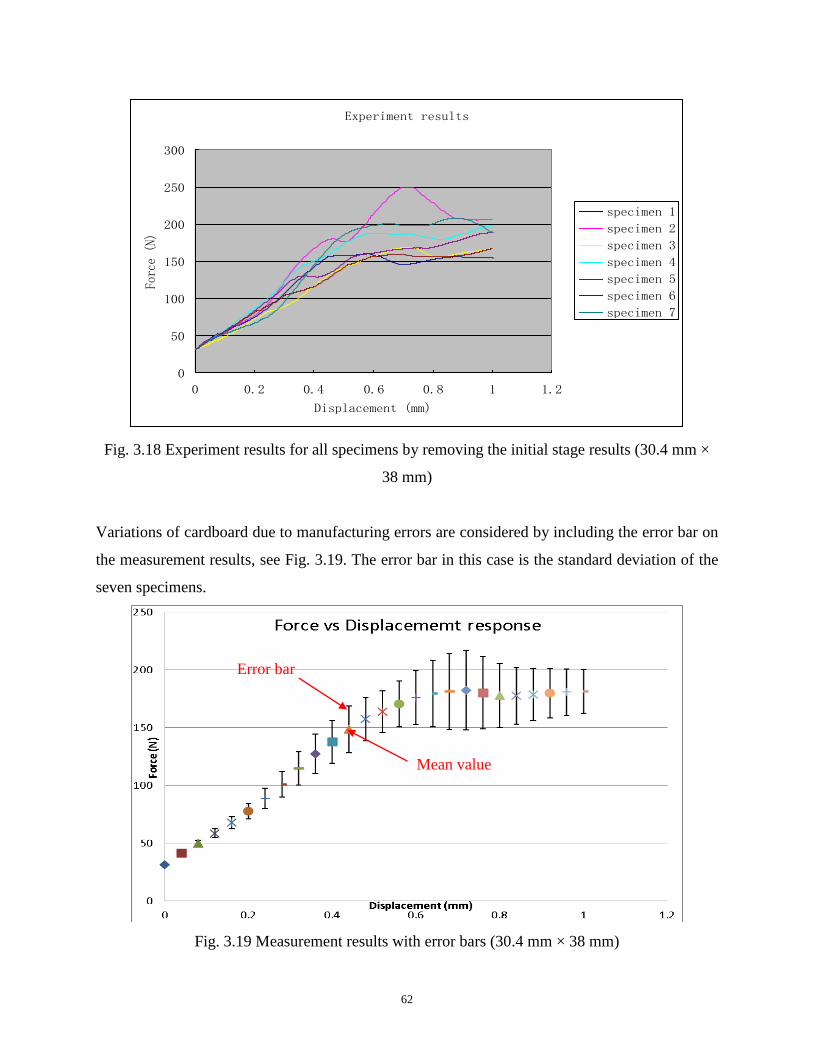
62
Experiment results
0
50
100
150
200
250
300
0 0.2 0.4 0.6 0.8 1 1.2
Displacement (mm)
Force (N)
specimen 1
specimen 2
specimen 3
specimen 4
specimen 5
specimen 6
specimen 7
Fig. 3.18 Experiment results for all specimens by removing the initial stage results (30.4 mm ×
38 mm)
Variations of cardboard due to manufacturing errors are considered by including the error bar on
the measurement results, see Fig. 3.19. The error bar in this case is the standard deviation of the
seven specimens.
Fig. 3.19 Measurement results with error bars (30.4 mm × 38 mm)
Mean value
Error bar

63
Fig. 3.20 plots the measurement results with error bar and the FEM result. From the figure, it can
be seen that the FEM result correlates well with the measurements result. Especially, for both the
FEM result and measurement result, the force responds linearly up to a peak value (about 200
N), followed by a decrease of force.
Fig. 3.20 Comparison of measurement results (with error bars) and finite element results (30.4
mm × 38 mm)
Cardboard with another size of length 60.8 mm (8 flute length) and width 38 mm was also
studied. However, for the FE model, as the symmetry model (one quarter of the full size model)
is used, its length will be 30.4 mm (4 flute length) and width will be 19 mm, which is shown in
Fig. 3.21. Fig. 3.22 plots both FEM and measurement results. It can be seen from the figure that
the FEM result correlates well with the measurement result up to the displacement of 0.76 mm,
followed by a lower value in comparison with the measurement result. This situation may be
because the plastic model property was not accurately available. As mentioned before, not all
parameters in the model can be readily determined, which is a challenge to modelling.

64
Fig. 3.21 Geometry of FE model for 60.8 mm × 38 mm specimen
Fig. 3.22 Comparison of the measurement results and FEM results (60.8 mm × 38 mm)
The finite element model by considering the geometry of cardboard as a sine shape has also been
investigated, as shown in Fig. 3.23. The results for both cardboards (30.4 mm 38 mm and 60.8
mm 38 mm) are shown in Fig. 3.24 and Fig. 3.25, respectively. It can be found from the figure
that the results of the sine shape correlates well with both actual shape and the measurement
results to the displacement level of 0.4 mm, followed by a lower value in comparison with the
19 mm
30.4 mm
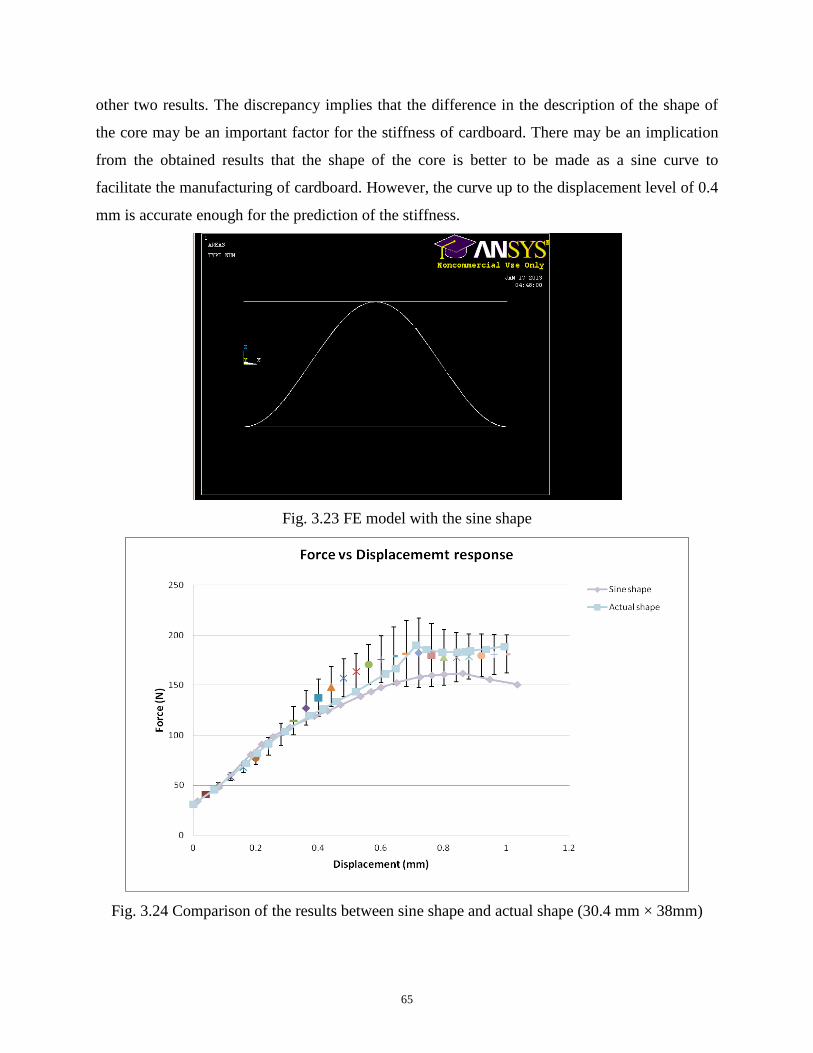
65
other two results. The discrepancy implies that the difference in the description of the shape of
the core may be an important factor for the stiffness of cardboard. There may be an implication
from the obtained results that the shape of the core is better to be made as a sine curve to
facilitate the manufacturing of cardboard. However, the curve up to the displacement level of 0.4
mm is accurate enough for the prediction of the stiffness.
Fig. 3.23 FE model with the sine shape
Fig. 3.24 Comparison of the results between sine shape and actual shape (30.4 mm × 38mm)

66
Fig. 3.25 Comparison of results with sine shape and actual shape (60.8 mm × 38 mm)
3.4.3 Discussion
In the literature, Lu et al. (2001) and Krusper et al. (2007) performed a finite element analysis of
cardboard. Both Lu’s model and Krusper’s model are found to be with two disadvantages: (1)
The model cannot be applied to cardboard with different widths; (2) The peak load and its
following response cannot be predicted. The disadvantage (1) is because the element used in
their work is the beam element. The beam element models the geometry such that the length is
considerably longer than the width and the thickness. Thus, the beam element is not suitable to
model cardboard with the width longer than the length. The disadvantage (2) is due to no
consideration of the nonlinear material property of cardboard. It should be noted that the width
parameter and peak load are two important variables for the application of cardboard for the
vibration isolation. Difference in the width parameter could give rise to significantly different
stiffnesses of cardboard. The peak load gives information of how much load cardboard can
sustain. If the load from the vibrating machine is larger than the load cardboard can sustain,
cardboard cannot provide any stiffness and is useless for vibration isolation. In the finite element

67
model of this work, a refined FE model with special attention to capture the width parameters
and peak load is presented and good validation with the measurement results is achieved.
3.5 Conclusions
The finite element modeling of corrugated cardboard was described in this chapter. This model
was used for predicting the stiffness of corrugated cardboard in its vertical direction. When the
displacement under compressive loading on corrugated cardboard is prescribed, the associated
reaction force can be obtained. The stiffness can then be calculated from the displacement vs
reaction force relation. From the comprehensive literature review presented in Chapter 2, it is
believed that this model is the most accurate one to predict the stiffness of corrugated cardboard
(especially with different width and peak load).
The experiment test bed was established and described in this chapter. The measurement results
were compared with the finite element results, and a good correlation between them was
achieved for the part of the force-displacement relation up to the peak load, but not in the part
after the peak load. The accuracy of this part may be improved with a more accurate acquisition
of the nonlinear plastic material property. The finite element model included both an
approximated sine shape and an actual shape. The finite element models with both the actual
core shape and the approximated sine core shape were effective to predict the stiffness, though
the one with actual shape was more accurate than the one with a sine shape especially in
predicting the peak load.
68
CHAPTER 4 APPLICATION – VIBRATION ISOLATION SYSTEM USING CARDBOARDS
4.1 Introduction
This chapter describes the application of the theoretic development in the stiffness and damping
of corrugated cardboard to design an isolator for a vacuum pump at the Canadian Light Source
(CLS) facility of the University of Saskatchewan. Section 4.2 presents measurement of the
damping of cardboard. Section 4.3 presents a lumped model for cardboard system, which is
necessary to design a cardboard system. A cardboard system refers to a system that consists of
several cardboards in connection. Section 4.4 presents two examples with their designs. Section
4.5 presents validation of the example designs with further discussions. Section 4.6 gives a
conclusion.
4.2 Measurement of the Damping of Cardboard
Stiffness and damping of corrugated cardboard are two important properties for a vibration
isolator. In Chapter 3, determination of the stiffness was described. In this section, determination
of the damping through measurement will be described. Measurement of the damping follows
the methods used for that of rubber (Mallik, 1999). The measurement test-bed is shown in Fig.
4.1(a). A vibration exciter, a Brüel & Kjær dynamic signal analyzer, a computer, two
accelerometers and three amplifiers were included in the experiment set-up. The analyzer
software in the computer first sent a command to the dynamic signal analyzer and it generated a
signal to the vibration exciter through amplification from an amplifier. Then, the vibration
exciter generated a harmonic excitation on cardboard. Two accelerometers were put on the
vibration exciter and the top surface of a steel block; see Fig. 4.2(b), respectively. The

69
displacements measured from the two accelerometers were recorded in the computer. As
illustrated in Fig. 4.2(b), one side of cardboard sticks to the vibration exciter and the other side
sticks to the steel block. It is noted that the size of the specimen was selected with the same size
as that of the steel block to ensure the load distribution from the block on cardboard is uniform.
(a)
(b)
Fig. 4.1 Measurement test-bed in the laboratory for corrugated cardboard: (a) the instruments and
(b) detailed schematic of the vibration exciter
The ratio of the displacement on the top surface of the mass ( massX ) to that on the exciter
( exciterX ) is defined as the displacement transmissibility ratio (rT ). This displacement ratio
describes the percentage of reduction of vibration by means of cardboard. rT , which can be
found by (Rao, 2003)
21
2222
222
0 )(
cmk
ck
F
FT T
r
(4.1)
Accelerometer
Vibration
Exciter
Cardboard
Computer
Dynamic
Signal
Analyser
Amplifiers
Vibration
Exciter
Steel
block
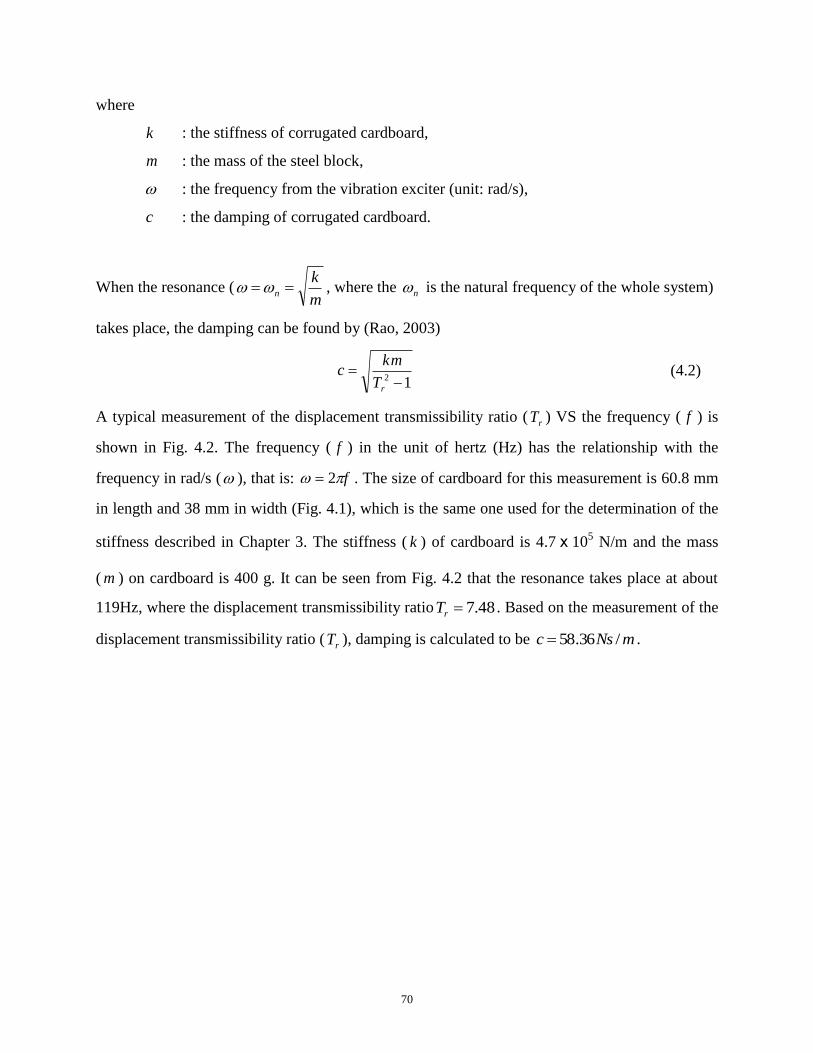
70
where
k : the stiffness of corrugated cardboard,
m : the mass of the steel block,
: the frequency from the vibration exciter (unit: rad/s),
c : the damping of corrugated cardboard.
When the resonance (m
kn , where the n is the natural frequency of the whole system)
takes place, the damping can be found by (Rao, 2003)
12
rT
kmc (4.2)
A typical measurement of the displacement transmissibility ratio (rT ) VS the frequency ( f ) is
shown in Fig. 4.2. The frequency ( f ) in the unit of hertz (Hz) has the relationship with the
frequency in rad/s ( ), that is: f 2 . The size of cardboard for this measurement is 60.8 mm
in length and 38 mm in width (Fig. 4.1), which is the same one used for the determination of the
stiffness described in Chapter 3. The stiffness ( k ) of cardboard is 4.7x10⁵ N/m and the mass
( m ) on cardboard is 400 g. It can be seen from Fig. 4.2 that the resonance takes place at about
119Hz, where the displacement transmissibility ratio 48.7rT . Based on the measurement of the
displacement transmissibility ratio (rT ), damping is calculated to be mNsc /36.58 .

71
Displacement ratio VS frequency response
0123456789
0.00 20.00 40.00 60.00 80.00 100.00 120.00 140.00 160.00
Frequency (Hz)
Displacement ratio
Fig. 4.2 Typical result of displacement ratio VS the frequency
4.3 Lumped Model
At the Canadian Light Source (CLS) Ltd., the vacuum pump is found to be a main vibration
source (Li et al., 2010). The pumps transmit vibrations to the ground, causing the ground to
vibrate. The ground vibration can then affect other instruments on the ground. In the work
presented below, corrugated cardboard is used to reduce the transmission of vibrations generated
from the vacuum pump to the ground as shown in Fig. 4.3(a). Fig. 4.3(b) shows a schematic of
the system. From Fig. 4.3, it can be seen that the vacuum pump produces a vibrating force which
is transmitted to the ground, while corrugated cardboard is put between the pump and ground to
reduce this transmission. Corrugated cardboard is thus much like a vibration isolator. It is noted
that there may be several cardboards in connection called cardboard system used instead of one
cardboard only.

72
(a) (b)
Fig. 4.3 The vibration isolator system: (a) set-up; (b) schematics
The cardboard system can be represented as a lumped mode, as shown in Fig. 4.4. The lumped
model consists of a mass (m), a spring (k) and a damper (c). The mass (m) represents the mass of
the pump, while the spring (k) and the damper (c) represent the stiffness and damping of
corrugated cardboard, respectively. It is assumed that the vibrating force generated by the
vacuum pump is a harmonically varying force, which can be represented by Rao (2003)
tFtF cos)( 0 .
Fig. 4.4 Single-degree-of-freedom lumped model
The equation of motion of the model is (Rao, 2003):
tFtkxtxctxm cos)()()( 0 (4.3)
Vacuum Pump
Corrugated
cardboard
Ground
Vibrating
Force
Cardboard
Vacuum
pump
m x(t)
F(t)=F0coswt
k c

73
where )(tx is the displacement of the pump and it is further (Rao, 2003):
)cos()( tXtx (4.4)
where X is the amplitude of the vibrating displacement, is the frequency of the vibrating
pump, and is the phase angle between the vibrating force and vibrating displacement.
Substituting Eqn. (4.4) into Eqn. (4.3) leads to the equation which describes the relation of
amplitude X and phase angle ; (Rao, 2003):
21
2222
0
])[( cmk
FX
(4.5)
and
)(tan2
1
mk
c
(4.6)
Further, the force transmitted to the ground via the spring and the damper, )(tFt , is (Rao, 2003):
)sin()cos()()()( tXctkXtxctkxtFt (4.7)
The magnitude of the transmitted force (TF ) is (Rao, 2003):
21
2222
21
222
022221
22
])[(
)(])()[(
cmk
ckFckXxckxFT
(4.8)
The transmission ratio ( fT ) of the isolator (i.e. cardboard) is defined as the ratio of the
magnitude of the force transmitted to ground (TF ) to that of the vibrating force acting on it
( 0F ),and it serves as a requirement index for design of vibration isolators, which is given by
(Rao, 2003)
21
2222
222
0 )(
cmk
ck
F
FT T
f
(4.9)
In order to achieve isolation, the force transmitted to ground (TF ) needs to be less than the
vibrating force acting on it ( 0F ), which is equivalent to 1fT .

74
4.4 Examples and Illustrations
Two design examples are described below to illustrate the design process for corrugated
cardboard system as a vibration isolator for the vacuum pump in the context of CLS.
4.4.1 Example 1
The procedure to conduct the design is as follows:
Step 1: Define design requirement
The design requirement for the vibration isolator is the transmission ratio fT <0.8. The
requirement can be further represented through Eqn. (4.9) to determine the stiffness and damping
for the design, which is given by
8.069.183)69.18334(
69.183
)(
21
2222
22221
2222
222
0
ck
ck
cmk
ck
F
FT T
f
(4.10)
where kgm 34 and srad /69.183 (Pump manual, 2010), while the k and c are variables
to be determined. Thus, it can be seen from Eqn. (4.10) that with a given transmission ratio, there
are two variables to be determined. This results in many possible combinations of the two
variables k and c . In this thesis study, a simplified equation with no consideration of damping
c was used for the design, which is given by (Rao, 2003)
km
k
F
FT T
f
2
0 (4.11)
Eqn. (4.10) was used for two reasons: (1) For 1fT , the damping has a very small effect (Rao,
2003) and (2) The simplified equation is more conservative for the design. For the reason (2), the
real system with damping can reduce more vibration. From Eqn. (4.11), the requirement for
reduction in vibration in terms of amplitude can be represented by
8.069.18334 22
0
k
k
km
k
F
FT T
f
(4.12)

75
The stiffness is then calculated to be: k <5.10x10⁵ N/m.
Step 2: Design the cardboard system
A number of corrugated cardboards were designed to meet the requirement of stiffness k <5.1x
105
N/m. A “C flute” cardboard with the size (length 158 mm and width 210 mm) was used in
this case, which is shown in Fig. 4.5. The size of cardboard is close to that of the platform of the
vacuum pump (Fig. 4.6). Note that the size of cardboard is determined for having a good stability
of the vacuum pump (i.e. avoiding rotation).
Fig. 4.5 Size of corrugated cardboard for the design
Fig. 4.6 The platform and corrugated cardboard
158 mm
210 mm
Cardboard
Platform

76
The stiffness of cardboard employed in cardboard system was then calculated by the finite
element model described in Chapter 3. Fig. 4.7 shows the relation between force and
displacement found from the finite element model.
Fig. 4.7 Finite element result (158 mm × 210 mm)
From Fig. 4.7, the stiffness of cardboard is calculated to be 7.11x10⁶ N/m, which is much
higher than the requirement: k <5.10x10⁵
N/m. In order to meet the requirement, a cardboard
system was designed, where several cardboards were taken in a serial connection, as shown in
Fig. 4.8. The cardboard system was modelled as shown in Fig. 4.9, where m is the mass of the
pump, k1 to kn is the stiffness of the first cardboard to the stiffness of the n-th cardboard in the
cardboard system. The design was then to determine the number of cardboards (n).

77
Fig. 4.8 Cardboard system - cardboards in a serial connection
Fig. 4.9 Model of the cardboard system (without damping)
The equivalent stiffness ( eqvk ) of the cardboard system is calculated by (Rao, 2003)
neqv kkkk
1.
111
21
(4.13)
where
eqvk : The equivalent stiffness of the cardboard system, and
1k : The stiffness of cardboard for the first cardboard.
nk : The stiffness of cardboard for the nth cardboard.
m
k1
kn

78
In the case here, as the stiffness of each cardboard is the same ( nkkk 21 ), the equivalent
stiffness ( eqvk ) of the multi-layer cardboards is further given by (Rao, 2003)
n
kkeqv
1 (4.14)
With the equivalent stiffness (the same as the required stiffness) eqvk < 5.10x10⁵
N/m and the
stiffness of each cardboard 1k = 7.11x10
6 N/m, the n is calculated to be larger than 13.9. Thus,
14 cardboards were used in this cardboard system as a vibration isolator. The equivalent stiffness
of the 14 cardboards is 1kkeqv /14= 5.08x10⁵
N/m which is less than the required stiffness, so
it meets the requirement for the isolator in this case.
Step 3: Calculate the actual response
The actual response (transmissibility ratio) from the designed cardboard system (14 cardboards
in a serial connection) is shown below. It is noted that the design process above is simplified
with no consideration of the damping, while the damping should play a role in vibration isolation.
Fig. 4.10 shows the lumped model including the stiffness and damping.
Fig. 4.10 Model of the cardboard system (with damping)
Similar to the stiffness, the damping is also connected in a serial connection. The equivalent
damping of the cardboard system can be found by (Rao, 2003)
ncceqv /1 (4.15)
The determination of the damping of each cardboard follows the approach described in Section
4.1. The size of cardboard was supposed to be with the length 158 mm, width 210 mm, and the
mass 34 kg, which are the same as described for the pump test. However, the size and the mass
m
k1
kn
c1
cn

79
are larger than those the measurement test-bed (see Fig. 4.1) can sustain. In order to take the
measurement, an assumption was made that the damping of cardboard changed proportionally to
the change of its size and mass load on it. Thus, a proportionally reduced cardboard with the
length 60.8 mm, width 38 mm and mass load 1.94 kg were used. The stiffness ( k ) of cardboard
is 4.74x10⁵ N/m. The measured displacement transmissibility is shown in Fig. 4.11. It can be
seen from Fig. 4.11 that the resonance takes place at about 94 Hz, where the displacement
transmissibility ratio 72.4rT . From the value of the displacement transmissibility ratio (rT ),
the damping was calculated to be 55.4 N.s/m. Thus, the damping of the full size cardboard (158
mm and width 210 mm) was msNc /.861 . Further, the equivalent damping of all the 14
cardboard in series was msNcceqv /.5.6114/ .
Measured transmissiblity ratio VS frequency
-1
0
1
2
3
4
5
0.00 20.00 40.00 60.00 80.00 100.00 120.00
Frequency (Hz)
Tranmissibilty ratio
Fig. 4.11 The measured transmissibility ratio VS frequency relation for corrugated cardboard
(60.4 mm × 38 mm)
With the equivalent stiffness eqvk =5.08x10⁵ N/m and equivalent damping eqvc = 61.5 N.s/m.
The actual transmissibility ratio ( fT ) was calculated to be 0.794 from Eqn. (4.10); see below
794.05.6169.183)69.18334507857(
5.6169.183507857
)(
21
2222
22221
2222
222
cmk
ckT f
(4.16)

80
Thus, in the following experimental validation, the experimental result was expected to meet the
design requirement ( fT < 0.8), and the actual response was fT =0.794 in this case.
4.4.2 Example 2
Example 2 follows the same procedure as applied for Example 1.
Step 1: Define design requirement
The design requirement for the vibration isolator was: fT <0.5. With fT <0.5, the stiffness
required was k<3.82x10⁵
N/m from Eqn. (4.12). Corrugated cardboards were then designed to
meet the requirement of stiffness k<3.82x10⁵ N/m.
Step 2: Design the cardboard system
The same size of cardboard (length 158 mm and width 210 mm) for Example 1 was used. The
stiffness of cardboard was calculated to be 7.11x10⁶ N/m, which is much larger than the
required stiffness at 3.82x10⁵N/m. Similarly, cardboard was designed with multilayers. With
the equivalent stiffness the same as the required stiffness eqvk <3.82x10⁵
N/m and the stiffness
of each cardboard 1k = 7.11x10
6 N/m, the n was calculated from Eqn. (4.11) to be larger than
18.6. Thus, 19 cardboards were used as the cardboard system to meet the requirement. The
equivalent stiffness of the 19 cardboards is eqvk =3.74x10⁵ N/m.
Step 3: Calculate the actual response
The actual response is based on the stiffness and damping of the cardboard system. The
cardboard system consists of 19 cardboards in a serial connection. As the damping of one

81
cardboard (158 mm and width 210 mm) was c=861 N.s/m, the damping of all the 19 cardboard
was c=45.3 N.s/m. The actual transmissibility ratio ( fT ) was calculated to be 0.484 from Eqn.
(4.10); see below
484.03.4569.183)69.18334374210(
3.4569.183374210
)(
21
2222
22221
2222
222
cmk
ckT f
(4.17)
Thus, in the following experimental validation, the experimental result was expected to meet the
requirement ( fT < 0.5), and the actual response was fT =0.484 in this case.
4.5 Results and discussion
4.5.1 Measurement Test-bed
Fig. 4.12 illustrates the measurement test-bed. From the figure, it can be seen that cardboards are
put in series under the vacuum pump. Two accelerometers are attached to the ground to measure
the acceleration of the vibration on the ground. The measured accelerations are sent to the
computer through a Brüel & Kjær dynamic signal analyzer. Both acceleration with cardboards
( witha ) and acceleration without cardboards ( withouta ) are measured (Fig. 4.13).
Fig. 4.12 Measurement test-bed for the application
Cardboards Vacuum
pump
Accelerometer
Accelerometer
Signal
analyzer
Computer
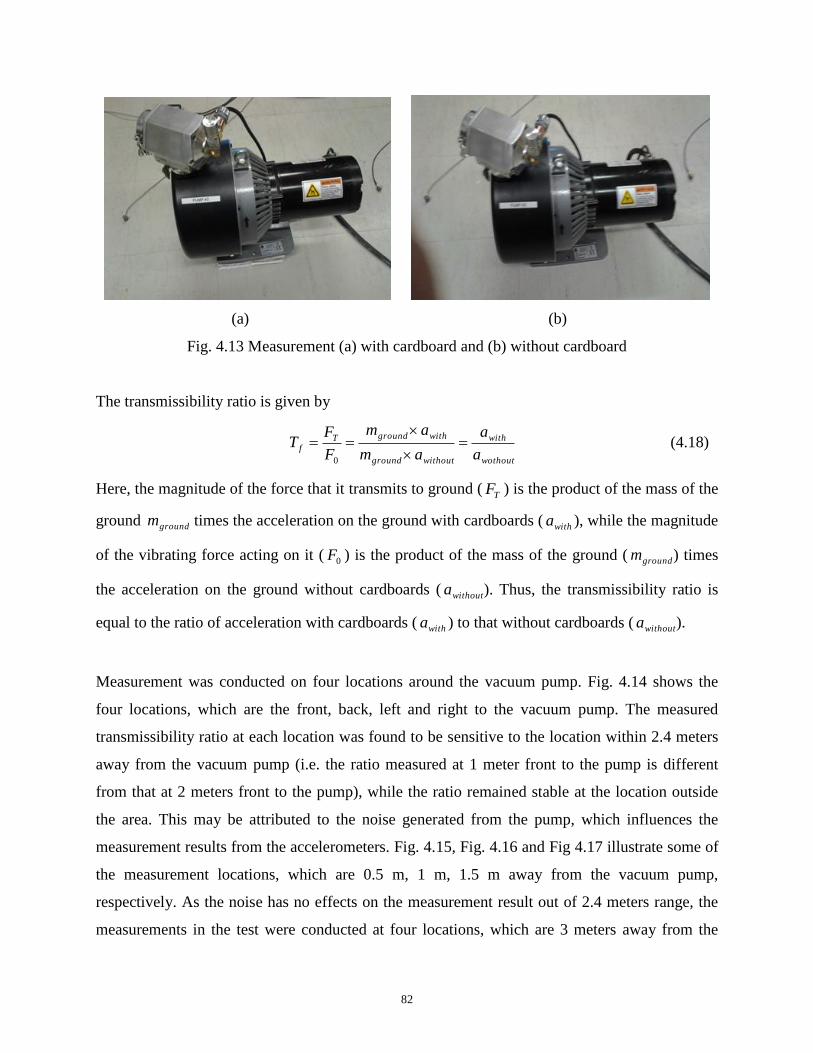
82
(a) (b)
Fig. 4.13 Measurement (a) with cardboard and (b) without cardboard
The transmissibility ratio is given by
wothout
with
withoutground
withgroundTf
a
a
am
am
F
FT
0
(4.18)
Here, the magnitude of the force that it transmits to ground (TF ) is the product of the mass of the
ground groundm times the acceleration on the ground with cardboards ( witha ), while the magnitude
of the vibrating force acting on it ( 0F ) is the product of the mass of the ground ( groundm ) times
the acceleration on the ground without cardboards ( withouta ). Thus, the transmissibility ratio is
equal to the ratio of acceleration with cardboards ( witha ) to that without cardboards ( withouta ).
Measurement was conducted on four locations around the vacuum pump. Fig. 4.14 shows the
four locations, which are the front, back, left and right to the vacuum pump. The measured
transmissibility ratio at each location was found to be sensitive to the location within 2.4 meters
away from the vacuum pump (i.e. the ratio measured at 1 meter front to the pump is different
from that at 2 meters front to the pump), while the ratio remained stable at the location outside
the area. This may be attributed to the noise generated from the pump, which influences the
measurement results from the accelerometers. Fig. 4.15, Fig. 4.16 and Fig 4.17 illustrate some of
the measurement locations, which are 0.5 m, 1 m, 1.5 m away from the vacuum pump,
respectively. As the noise has no effects on the measurement result out of 2.4 meters range, the
measurements in the test were conducted at four locations, which are 3 meters away from the

83
vacuum pump. These four locations are called location 1 (front), location 2 (back), location 3
(left) and location 4 (right).
(a) (b)
Fig. 4.14 Measurements on (a) front and back; (b) left and right
(a) (b)
Fig. 4.15 Locations at 50 cm away from the pump (a) front and back (b); left and right
Front Back Left Right

84
(a) (b)
Fig. 4.16 Locations at 1 m away from the pump (a) front and back; (b) left and right
(a) (b)
Fig. 4.17 locations at 1.5 m away from the pump (a) front and back; (b) left and right
4.5.2 Results and validation
For Example 1, the measured results with and without cardboards (14 cardboards in series) at
location 1, location 2, location 3 and location 4 are shown in Fig. 4.18, Fig. 4.19, Fig. 4.20 and
Fig. 4.21, respectively. In these figures, the horizontal axis is the frequency and the vertical axis
is the acceleration. It is noted that only the acceleration at 29.25 Hz (183.69 rad/s) was recorded
as it is the frequency where the pump was operating.

85
Measurement result (Without cardboards)
0.00E+00
5.00E-09
1.00E-08
1.50E-08
2.00E-08
2.50E-08
3.00E-08
0.00 10.00 20.00 30.00 40.00
Frequency (Hz)
Acceleration (m/s2)
Location 1
(a)
Measurement result (With cardboards)
0.00E+00
5.00E-09
1.00E-08
1.50E-08
2.00E-08
2.50E-08
3.00E-08
0.00 10.00 20.00 30.00 40.00
Frequency (Hz)
Acceleration (m/s2)
Location 1
(b)
Fig. 4.18 Measurement results at location 1 (a) without cardboards; (b) with cardboards

86
Measurement result (Without cardboards)
0.00E+00
2.00E-08
4.00E-08
6.00E-08
8.00E-08
1.00E-07
1.20E-07
1.40E-07
1.60E-07
0.00 10.00 20.00 30.00 40.00
Frequency (Hz)
Acceleration (m/s2)
Location 2
(a)
Measurement result (With cardboards)
0.00E+00
2.00E-08
4.00E-08
6.00E-08
8.00E-08
1.00E-07
1.20E-07
1.40E-07
1.60E-07
0.00 10.00 20.00 30.00 40.00
Frequency (Hz)
Acceleration (m/s2)
Location 2
(b)
Fig. 4.19 Measurement results at location 2 (a) without cardboards; (b) with cardboards

87
Measurement result (Without cardboards)
0.00E+00
5.00E-09
1.00E-08
1.50E-08
2.00E-08
2.50E-08
3.00E-08
0.00 10.00 20.00 30.00 40.00
Frequency (Hz)
Acceleration (m/s2)
Location 3
(a)
Measurement result (With cardboards)
0.00E+00
5.00E-09
1.00E-08
1.50E-08
2.00E-08
2.50E-08
3.00E-08
0.00 10.00 20.00 30.00 40.00
Frequency (Hz)
Acceleration (m/s2)
Location 3
(b)
Fig. 4.20 Measurement results at location 3 (a) without cardboards; (b) with cardboards

88
Measurement result (Without cardboards)
0.00E+00
2.00E-08
4.00E-08
6.00E-08
8.00E-08
1.00E-07
1.20E-07
0.00 10.00 20.00 30.00 40.00
Frequency (Hz)
Acceleration (m/s2)
Location 4
(a)
Measurement result (With cardboards)
0.00E+00
2.00E-08
4.00E-08
6.00E-08
8.00E-08
1.00E-07
1.20E-07
0.00 10.00 20.00 30.00 40.00
Frequency (Hz)
Acceleration (m/s2)
Location 4
(b)
Fig. 4.21 Measurement results at location 4 (a) without cardboards; (b) with cardboards
The measured results at 29.25 Hz are listed in Table 4.1. The transmissibility ratio is calculated
to be 0.739, 0.712, 0.756 and 0.715 for location 1, location 2, location 3 and location 4,
respectively. The average of transmissibility ratio is 0.72275.

89
Table 4.1 Measured results at 29Hz for Example 1
Location
1
Location
2
Location
3
Location
4
Acceleration without cardboards
( withouta ) 2.65e-008 1.46e-007 2.44e-008 9.83e-008
Acceleration with cardboards ( witha ) 1.96e-008 1.04e-007 1.77e-008 7.03e-008
Displacement ratio (without
withf
a
aT ) 0.739 0.712 0.725 0.715
Thus, it can be seen that the measured transmissibility ( fT =0.72275) meets the requirement
( fT <0.8), while it differs from the actual response ( fT =0.794) with an error of 9.1%.
For Example 2, the measurement results at 29.25Hz with and without cardboards (19 cardboards
in series) are listed in Table 4.2. The detailed results over all the frequency range can be found in
Appendix B. The transmissibility ratio was calculated to be 0.403, 0.422, 0.431 and 0.414 for
location 1, location 2, location 3 and location 4, respectively. The average of transmissibility
ratio is 0.4175. Thus, it can be seen that the measured transmissibility ( fT =0.4175) meets the
requirement fT <0.5, while it differs from the actual response ( fT =0.484) with an error of
13.73%.
Table 4.2 Measured results at 29Hz for Example 2
Location
1
Location
2
Location
3
Location
4
Acceleration without cardboards
( withouta ) 2.65e-008 1.46e-007 2.44e-008 9.83e-008
Acceleration with cardboards ( witha ) 1.07e-008 6.16e-008 1.05e-008 4.07e-008
Displacement ratio (without
withf
a
aT ) 0.404 0.422 0.43 0.414
4.5.3 Discussion
The measured transmissibility ratios of 0.72275 and 0.4175 for the example 1 and example 2
(respectively) meet the design requirements of fT <0.8 and fT <0.5, respectively. Further, the

90
measured transmissibility ratio is compared with the actual response for the validation. Errors of
9.1% and 13.73% are found for example 1 and example 2, respectively. The errors may be
attributed to three factors: (1) the horizontal movement of the pump was presented in
measurement, while the lumped model assumed no horizontal movement; (2) the difference of
stiffness of cardboards in the cardboard system was present due to cardboard manufacturing
errors; (3) the error was present in alignment of the cardboards in the cardboard system. Further,
the difference in error between the two cases (9.1% to 13.73%) is mainly caused by the factor (2)
and factor (3). As with more layers in example 2 than example 1, there are more errors in the
stiffness of the cardboard, factor (2), and alignments of cardboards, factor (3), in example 2 than
example 1.
4.6 Conclusions
Two examples were used to illustrate the application of the developments in stiffness and
damping of corrugated cardboard to design an isolator for a vacuum pump. Both design and
experimental validation were conducted. The design was based on the lumped model of the
system and the finite element model described in Chapter 3. Specifically, the required stiffness of
the cardboard system for the design requirement was first calculated from the lumped model, and
then the cardboard system was designed with cardboards in a serial connection to meet the
required stiffness. Here, the stiffness of cardboard was calculated from the finite element model
described in Chapter 3. The actual response from the designed cardboard system was also
presented. The experiments were conducted on four locations, which are 3 meters front, back,
left and right to the vacuum pump. The measured results of both examples meet the design
requirements, while they differ from the actual response with errors of 9.1% and 13.4% for
example 1 and example 2, respectively. The errors may be reduced if the horizontal movement
can be taken into account in the lumped model. Overall, the case studies have shown that the
stiffness and damping of cardboard determined in this study are adequate for designing
corrugated cardboard and its system for vibration isolation.

91
CHAPTER 5 CONCLUSIONS AND FUTURE WORK
5.1 Overview
This thesis presented a study toward a material system made from corrugated cardboards for
vibration isolation. The focus of the study was on understanding and modeling of the mechanical
properties of corrugated cardboard under a compressive loading in its vertical direction, and they
are stiffness and damping, and they are essentially related to vibration control in general.
In the current literature, finite element methods have been proposed for the stiffness under a
compressive loading in its vertical direction. However, these methods are found inaccurate
(especially in predicting peak load) for two reasons: (1) no consideration of accurate non-linear
properties as well as behaviors, and (2) no consideration of the width of cardboard. It should be
noted that the width parameter and peak load are important for the application of the stiffness of
cardboard for vibration isolation. Difference in the width parameter could give rise to
significantly different stiffnesses of cardboard. The peak load gives information of how much
load cardboard can sustain. If the load on cardboard is larger than the peak load, cardboard
cannot provide any stiffness for vibration isolation. In the current literature, damping is usually
obtained by experiments. However, the experimental approach has not been applied on the
damping of corrugated cardboard, to the best of the author’s knowledge.
This study was motivated by overcoming these limitations and tailoring the application of
cardboard to vibration isolation, which is indeed a new application area. The overall objective of
this study was to develop design technologies for cardboard vibration isolator system. The
specific objectives were defined for this study.

92
Objective 1: Develop an accurate finite element model for the stiffness of corrugated cardboard
under compressive loading in its vertical direction with special attention to capturing the
information of the width parameter and peak load.
Objective 2: Set up a test-bed for measuring the stiffness of cardboard. The measured stiffness
will be used to validate the finite element model as developed in Objective 1.
Objective 3: Set up a test-bed and measure the damping of cardboard.
Objective 4: Demonstrate the effectiveness of the stiffness and damping models by designing a
vibration isolation system with corrugated cardboards for reduction of vibration of a vacuum
pump system.
These objectives have been achieved. The following are the details. A literature review (Chapter
2) was presented to confirm the validity of the proposed objectives. Specifically, it was
concluded that the finite element model of corrugated cardboard that can predict stiffness with
the width larger than the length and peak load, has not been previously reported in literature,
which justifies objective 1 and 2. Measurement on damping of corrugated cardboard has not
been reported in the literature, which justifies objective 3. There has never been any design
technology for a cardboard system as a vibration isolator in the literature, which justifies the
motivation of the whole study as well as objective 4.
In Chapter 3, a finite element model for the stiffness of corrugated cardboard with consideration
of the width parameters and peak load was presented. The model was implemented in the
ANSYS environment; in particular, a shell element was employed to include different width
parameters and nonlinear orthotropic material property was employed to predict the peak load. A
test-bed for measuring the stiffness of cardboard was also presented. The measured stiffness was
used to validate the stiffness from the finite element model. Finite element model with both an
actual core shape and approximated sine core were used to validate the theoretical model with
the experiments. Both models were found effective to predict stiffness, though the model with
the actual core shape was more accurate.

93
In Chapter 4, a test bed for measuring the damping of cardboard and two case studies for
illustrating the application of the developments in stiffness and damping of the corrugated board
to design the isolator for a vacuum pump were presented. The application includes both the
design and experimental validation. The validation results have shown that the stiffness and
damping of cardboard in this study are adequate, as they are effective in reducing vibrations to
the requirement.
5.2 Conclusions
The study presented in this thesis concludes:
(1) The finite element model for corrugated cardboard should take the shell element and
consider the nonlinear orthotropic material property for stiffness prediction.
(2) The finite element models with both actual core shape and approximated sine core shape are
effective to predict the stiffness, though the one with the actual core shape is more accurate
than the one with the sine core shape especially in predicting peak load.
(3) The proposed design procedure for a cardboard system based on the proposed lumped model
(in which the stiffness of a single cardboard is computed while the damping of a single
cardboard is measured) is effective.
5.3 Contributions
The main contributions of this thesis are described below:
(1) An accurate model of corrugated cardboard for predicting the stiffness of corrugated
cardboard (with different widths) and peak load is available to the field of paper-based
systems. The way to model the contact behavior between two objects which deform on their
own in the model for corrugated cardboard is also useful to similar problems such as gear
engagement and follower contact in transmission devices.

94
(2) A test-bed to measure the damping of cardboard is available for application to vibration
isolation. The test-bed is useful to other applications as well.
(3) A complete system for extending the stiffness and damping of a single cardboard to a
cardboard system which is composed of a number of cardboards in connection is available
for industrial applications in vibration isolation. There is a significant benefit to environment
protection and sustainable development. The current study has suggested that rubber isolators
can be replaced by cardboard isolators.
5.4 Future Work
Several future endeavors could potentially improve upon this thesis work.
First, the finite element model for corrugated cardboard in this thesis is found inaccurate in
predicting the nonlinear force VS deformation relation. This can be improved with a more
accurate acquisition of the nonlinear plastic material properties.
Second, the stiffness and damping models developed in this study still have some error for
predicting the vibration reduction of the vacuum pump. This error may be reduced if the
horizontal movement of the vacuum pump can be taken into account in the stiffness and damping
models. That is, a whole cardboard may need to be considered as a multi-degree of freedom
system instead of a single degree of freedom system as it was done now.
Finally, fatigue design with consideration of humidity needs to be studied, as the main concern
for the paper material is its fatigue failure. Understanding of the fatigue behaviour of cardboard
is very important to ensure a reliable industrial system.

95
REFERENCES
Aboura, Z., Talbi, N., Allaoui, S., 2004, Benzeggagh, M.L., Elastic behaviour of corrugated
cardboard: experiments and modelling, Composite Structure, vol. 63, pp. 53-62.
Allansson, A., and Svard, B., 2001, Stability and collapse of corrugated board; numerical and
experimental analysis, Master’s Thesis, Sweden: Division of Structural Mechanics, LTH, Lund
University.
ANSYS, 2004. ANSYS Release 8.1 Documentation Preview, Swanson Analysis System, Inc.,
Houston.
Bandstra, J. P., 1983, Comparison of equivalent viscous damping in discrete and continuous
vibrating system, Transaction of ASME, Journal of Vibration, Acoustics, Stress and Reliability in
Design, vol. 105, pp. 382–392.
Biancolini, M.E., and Brutti, C., 2003, Numerical and experimental investigation of the strength
of the corrugated board packages, Packaging Technology and Science, vol. 16, no. 2, pp. 47-60.
Beards, C. F. and Williams, J. L., 1977, The damping of structural vibration by rotational slip in
structural joint, Journal of Sound and Vibration, vol. 53, no. 3, pp. 333–340.
Beldie, L., Sandberg, G., Sandberg, L., 2001, Paperboard packages exposed to static loads -
finite element modeling and experiments, Packaging Technology and Science, vol. 14, pp. 171-
178.

96
Bert, C.W., 1973, Material damping: an introductory review of mathematical models, measure
and experimental techniques, Journal of Sound and Vibration, vol. 29, no. 2, pp. 129–153.
Bulson, P.S., 1969, The Stability of Flat Plates, American Elsevier Publishing Company, Inc.,
NY.
Caddell, R. M., Raghava, R. S. and Atkins, A. G., 1973, Yield criterion for anisotropic and
pressure dependent solids such as oriented polymers, Journal of Materials Science, vol. 8, no.
11, pp. 1641-1646.
Campell, A. C., 2010, The use of A-flute, B-flute, AC flute and BC flute corrugated paperboard
as a cushion material, Master’s thesis, Clemson University.
Chen, K., 2009, Mechanical dynamics: fundamentals, applications and practices, Springer.
Coan, J.M., 1951, Large-Deflection Theory for Plates with Small Initial Curvature Loaded in
Edge Compression, Journal of Applied Mechanics, vol. 18, pp. 143-151.
Crandall, S. H., 1970, The role of damping in vibration theory, Journal of Sound and Vibration,
vol. 11, no. 1, pp. 3–18.
Dekker, M., 1999, Stiffness and damping in mechanical design, Technology & Engineering.
Deshpande, V. S., Fleck, N. A. and Ashby, M. F., 2001, Effective properties of the octet-truss
lattice material, Journal of the Mechanics and Physics of Solids, vol. 49, no. 8, pp. 1747-1769.
Earls, S. W. E., 1966, Theoretical estimation of frictional energy dissipation in a simple lap joint,
Journal of Mechanical Engineering Science, vol. 8, no. 2, pp. 207–214.
Folie, G.M., 1971, The behaviour and analysis of orthotropic sandwich plates, Building Science,
vol. 6, pp. 57-67.

97
Gilchrist, A.C., Suhling, J.C., Urbanik, T.J., 1999, Nonlinear finite element modeling of
corrugated board, Mechanics of Cellulosic Materials, AMD – vol. 231/MD-vol. 85.
Gooren, L.G.J., 2006, Creasing Behaviour of Corrugated Board – An Experimental and
Numerical Approach, Department Mechanical Engineering, Report MT06.06, Eindhoven/The
Netherlands.
Hahn, E. K., de Ruvo, A., Westerlind, B. S. & Carlsson, L. A., 1992, Compressive strength of
edge-loaded Corrugated Board Panels, Experimental Mechanics, vol. 32, pp. 259-58.
Haj-Ali, R., Choi, J., Wei, B.S., Popil, R., Schaepe, M., 2009, Refined nonlinear finite element
models of corrugated fiberboards, Composite structures, vol. 87, no. 4, pp. 321-333.
Hill, R., 1983, The Mathematical Theory of Plasticity. Oxford University Press. New York.
Housner, G. W., Bergman, L. A., 1997, Structural control: past, present and future, Journal of
Engineering Mechanics, vol. 123, pp. 897-971.
Huang, J.L., Ranier Clement, Sun, Z.H., Wang, J., Zhang, W.J., 2012, Global Stiffness and
Natural Frequency Analysis of Compliant Mechanisms with Embedded Actuators with a
General-Purpose Finite Element System. International Journal of Advanced Manufacturing
Technology. DOI 10.1007/s00170-012-4243-8
Johnson, M.W., Jr. and Urbanik, T.J., Analysis of the localized buckling in composite plates
structures with application to determining the strength of corrugated fiberboard, Journal of
Composites Technology and Research, vol. 11, no. 4, pp. 121-127.
Jones, A.L., 1871, Improvement In Paper For Packing, US patent
98
Krusper, A., Isaksson, P., and Gradin, P., 2007, Modeling of Out-of-Plane Compression Loading
of Corrugated Paper Board Structures, J. Eng. Mech., vol. 133, no.11, pp. 1171–1177.
Lapcik, Jr. L., Augustin, P., Pistek, A., Bujnoch, L., 2001, Measurement of the dynamic stiffness
of recycled rubber based railway track mats according to the DB-TL 918.071 standard. Applied
Acoustics, vol. 62, no. 1123-1128.
Li, J.W., Matias, E., Chen, N., Kin, C.-Y., Wang, J., Gorin, J., He, F., Thorpe, P., Lu, Y., Chen,
W.F., Grochuski, P., Chen, X.B., and Zhang, W.J., 2011, Investigations of mechanical vibrations
for beamlines at the Canadian Light Source, Journal of Synchrotron Radiation, vol. 18, pp. 109-
116.
Lin, T.R., Farag, N.H., Pan, J., 2004, Evaluation of frequency dependent rubber mount stiffness
and damping by impact test, Applied Acoustics, vol. 66, pp. 829-844.
Long, O., 1874, Packings For Bottles, Jars, & C., US patent.
Lu, T. J., and Chen, C., 2001, Compressive behaviour of corrugated board panels, Journal of
Composite Materials, vol. 35, no. 23, pp. 2098–2126.
Luo, S., Suhling, J.C., Laufenberg, T.L., 1995, Bending and twisting tests for measurement of
the stiffness of corrugated board, ASME-Mechanics of Cellulosic Materials, AMD-vol. 209/MD-
vol. 60.
Mallik, A. K., Kher, V., Puri, M., Hatwal, H., 1999, On the modelling of non-linear elastomeric
vibration isolators, Journal of Sound and Vibration, vol. 219, no. 2, pp. 239-253.
Maltenfort, G.G., 1956, Compression Strength of Corrugated Containers, Fibre Containers, vol.
41, no. 7, July.
99
Mckee, R.C., Gander, J.W., and Wachuta, J.R., 1963, Compression Strength Formula for
Corrugated Boxes, Paperboard packaging, vol. 48, no. 8, pp. 149-153.
Nadeau, S., Champoux, Y., 2000, Application of the direct complex stiffness method to engine
mounts. Experimental Techniques, vol. 24, no. 3, pp.21-25.
Nashif, A. D., Jones, D. I. G., and Henderson, J. P., 1985, Vibration Damping, John Wiley, New
York.
Nordstrand, T., Carlsson, L. A., 1997, Evaluation of transverse shear stiffness of structural core
sandwich plates, Composite Structure, vol. 37, pp. 145-153.
Nordstrand, T., Carlsson, L.A., and Allen, H.G., 1994, Transverse shear stiffness of structural
core sandwich, Composite Structures, vol. 27, pp. 317-329.
Peterson, W.S., 1983, Flute/Liner interaction for bending of combined board beams, Paperboard
packaging, vol. 68, pp. 37-41.
Pommier, J.C., and Poustis, J., 1989, New approach for predicting box stacking strength, Revue
ATIP., vol. 43, no. 4, pp. 179-181.
Pommier, J.C., and Poustis, J., 1990, Bending stiffness of corrugated board prediction using the
finite element method, Mechanics of Wood and Paper Materials, ASME AMD, vol. 112, pp. 67-
70.
Pommier, J.C., Poustis, J., Fourcade, E., and Morlier, P., 1991, Determination of the Critical
Load of a Corrugated Cardboard Box Submitted to Vertical Compression by Finite Elements
Methods, Proceddings, International Paper Physics Conference, TAPPI. Atlanta, GA, pp. 437-
447.

100
Rahman, A.A., and Abubakr, S. A., Finite element investigation of the role of adhesive in the
buckling failure of corrugated fiberboard, Wood Fiber Science, vol. 36, pp. 260-268.
Rao, S. S., 2003, Mechanical Vibration, Prentice Hall, fourth edition.
Reddy, J.N., 1994, Energy and variational methods in applied mechanics, John Wiley.
Richard, C.M., and Singh, R., 2001, Characterization of rubber isolator nonlinearities in the
context of single- and multi-degree-of-freedom experimental systems, Journal of Sound and
Vibration, vol. 247, no. 5, pp. 807-834.
Romans, T.T.H.J., 2008, Humidity influences on creasing behaviour of corrugated board-an
analytical, experimental and numerical approach, Department Mechanical Engineering, Report
MT08.29, Eindhoven/The Netherlands.
Shih, C.F., Lee, D., 1978, Further Developments in Anisotropic Plasticity. Journal of
Engineering Materials and Technology, vol. 100, pp. 294-302.
Talbi, N., Batti, A., Ayad, R., Guo, Y.Q. , 2009, An analytical homogenization model for finite
element modeling of corrugated cardboard, Composite Structure, vol. 88, no. 2, pp. 280-9.
Thomson, D.J., Van Vliet, W.J., Verheij, J.W., 1998, Developments of the indirect method for
measuring the high frequency dynamic stiffness of resilient elements. Journal of Sound and
vibration, vol. 213, no. 1, pp. 169-188.
Ungar, E. E. and Kerwin, E. M., 1962, Loss factors of viscoelastic systems in terms of energy
concepts, The Journal of the Acoustical Society of America, vol. 34, no. 7, pp. 954–957.
Urbanik, T.J., 1996, Review of buckling mode and geometry effects on postbuckling strength of
corrugated containers, ASME-PUBLICATIONS-PVP, vol. 343.

101
Urbanik, T.J., 1997, Linear and nonlinear material effects on post buckling strength of
corrugated containers, Mech Cellulosic Mater AMD-vol. 221/MD, vol. 77, pp. 93–99.
Urbanik T.J., and Saliklis, E.P., 2002, Finite element corroboration of buckling phenomena
observed in corrugated boxes, Wood and Fiber Science, vol. 35, pp. 322-333.
Yamaki, N., Post-buckling behaviour of rectangular plates with small initial curvature loaded in
edge compression, Journal of Applied Mechanics, vol. 26, pp. 407-414.

102
APPENDIX A
EXPERIMENTAL INDENTIFICATION OF THE MATERIAL CONSTANTS
A.1 Introduction
This Appendix will describe the identification of the material parameters for the liner and core of
corrugated cardboard through tensile test. This Appendix is comprised of:
1. Measurement test-bed for tensile test,
2. Identification of material parameters for the liner, and
3. Identification of material parameters for the core.
A.2 Measurement test-bed for tensile test
A tensile test is conducted to obtain the in-plane material constants ( xE , yE , 0 , tE , xxR , yyR ) of
cardboard according to ASTM D828-97 standard. The measurement test-bed of the tensile test is
shown in Fig. A.1.

103
Fig. A.1 The measurement test-bed for the tensile test
The tested specimens were the liner and core of cardboard in both x direction and y direction,
which is shown in Fig. A.2. The length, width and thickness of the four types of specimens were
all measured to be 270 mm, 24.5 mm, and 2 mm. From Fig. A.1, it can be seen that the specimen
is clamped by two jaws and tensile force is applied in the vertical direction by using a crosshead
with a sensitive load cell of 500 N. The tensile loading was applied gradually on the specimen
with a control of the increment of the resulting displacement at 25.4 mm/min. Both tensile
loading and the displacement caused by the tensile loading were recorded. Further, the stress was
determined as the tensile load divided by the initial area of the cross section, and strain was
determined as the displacement divided by the specimen length. The material property was
calculated based on the stress VS strain relation. It is noted that for each type of specimen, four
new specimens were repeated.
Jaws
Specimen
Crosshead

104
(a) (b) (c) (d)
Fig. A.2 (a) liner specimen in x direction; (b) liner specimen in y direction; (c) core specimen in
x direction; (d) core specimen in y direction
A.2 Identification of material parameters for the liner
Fig. A.3 shows the typical measured stress VS strain response of the liner specimen under the
tension in x direction. In the initial loading stage, the specimen shows nonlinear response until an
strain level of 0.002 is reached. This is attributed to the fact that the specimen is not flat enough
but a bit of wavy. Specifically, the initial nonlinear response was largely due to the flattening of
these wavy parts. After the initial stage, all fibers are loaded and the specimen then became flat.
However, the response becomes flat until a strain level of 0.003 was reached. This is because
that the glue parts of the specimen collapse. The glue parts are the ones which were used to
connect the liner and core of cardboard, and the collapse results in the decrease of the strength of
the specimen. In other words, the stress required to further deform the specimen decreases. In
this case, it decreased to the same stress where the collapse happened and remained until the glue

105
part had no effect on the strength of the specimen (strain level of 0.003).
After the glue part has no effect, the specimen responded linearly up to yield point at strain level
of 0.01. After the yield point, the material responded into the plastic deformation until the failure
happens at strain level of 0.014. Referring to Fig. A.3, the elastic modulus xE is the slope of the
linear response, which was calculated to be 3.167 GPa; The reference stress 0 was the same as
the yield stress in x direction, which is 0.028 GPa; The plastic modulus tE is the slope of the
plastic response, which was calculated to be 2.392 GPa. The xxR is the ratio of the yield stress
(0.028Gpa) in x direction to the reference stress (0.028 GPa), which was calculated to be 1.
Typical stress VS strain relation of the liner (x direction)
0
5
10
15
20
25
30
35
40
45
0 0.002 0.004 0.006 0.008 0.01 0.012 0.014 0.016
Strain (mm/mm)
Stress (Mpa)
Fig. A.3 Typical stress VS strain relation of the liner in x direction
Fig. A.4 shows the typical measured stress VS strain response of the liner specimen under the
tension in y direction. Similarly, in the initial loading stage, the specimen shows nonlinear
response due to flattening until a strain level of 0.0025 is reached. Following that, the response
becomes flat due to glue effect until a strain level of 0.004 is reached. After that, the specimen
responds linearly up to yield point at strain level of 0.008. After the yield point, the material
responds into the plastic deformation until the failure happens at strain level of 0.033. Referring
Linear slope
Plastic slope

106
to Fig. A.6, the elastic modulus yE is calculated to be 1.8 GPa; The yield stress in y direction is
found to be 0.011GPa; The yyR is the ratio of the yield stress in y direction (0.011GPa) to the
reference stress (0.028GPa), which is 0.4.
Typical stress VS strain relation of the liner (y direction)
0
5
10
15
20
25
30
0 0.005 0.01 0.015 0.02 0.025 0.03 0.035 0.04
Strain (mm/mm)
Stress (Mpa)
Fig. A.4 Typical stress VS strain relation of the liner in y direction
For both types of specimens, four new specimens were repeated and the results were shown in
Fig. A.5. and Fig. A.6, respectively.
Linear slope
Plastic slope

107
Stress VS strain relation of the liner (x direction)
0
5
10
15
20
25
30
35
40
45
50
0 0.005 0.01 0.015 0.02
Strain (mm/mm)
Stress (Mpa)
Specimen 1
Specimen 2
Specimen 3
Specimen 4
Fig. A.5 Stress VS strain relation of the liner in x direction for all specimens
Stress VS strain relation of the liner (y direction)
0
5
10
15
20
25
30
0 0.01 0.02 0.03 0.04
Strain (mm/mm)
Stress (Mpa) Specimen 1
Specimen 2
Specimen 3
Specimen 4
Fig. A.6 Stress VS strain relation of the liner in y direction for all specimens
The average value of the material parameters of the four specimens in both x and y direction are
then calculated and listed in table A.1.
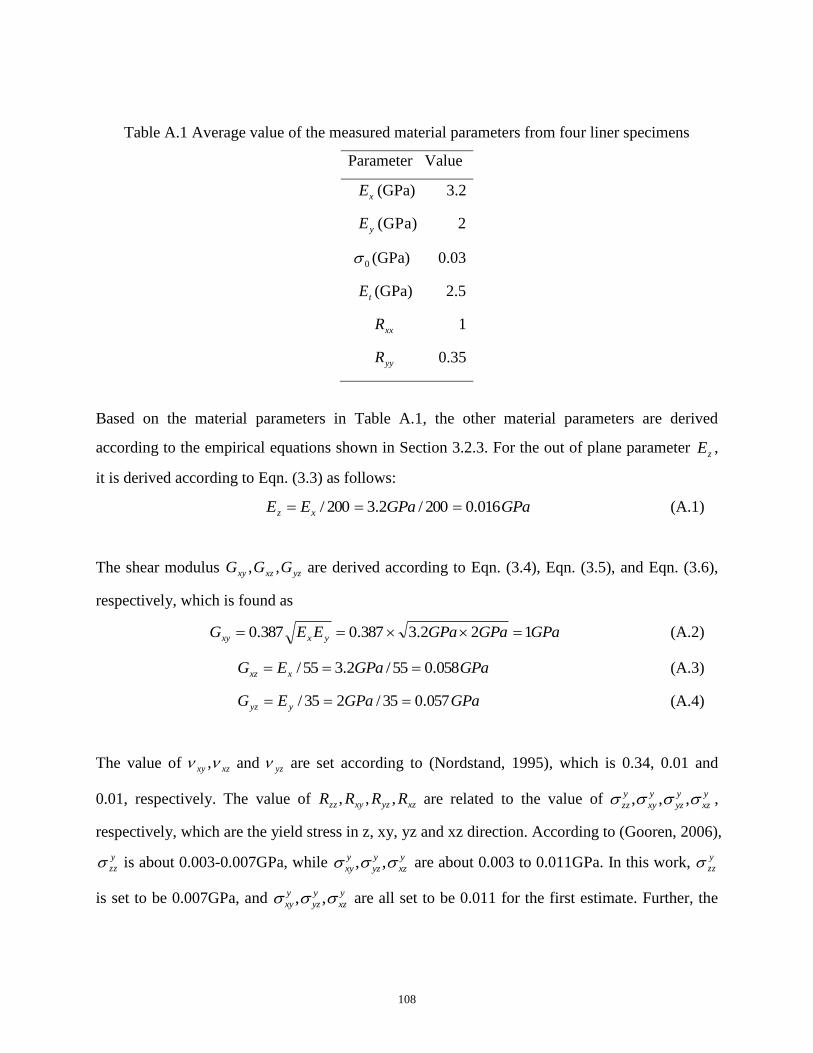
108
Table A.1 Average value of the measured material parameters from four liner specimens
Parameter Value
xE (GPa) 3.2
yE (GPa) 2
0 (GPa) 0.03
tE (GPa) 2.5
xxR 1
yyR 0.35
Based on the material parameters in Table A.1, the other material parameters are derived
according to the empirical equations shown in Section 3.2.3. For the out of plane parameter zE ,
it is derived according to Eqn. (3.3) as follows:
GPaGPaEE xz 016.0200/2.3200/ (A.1)
The shear modulus yzxzxy GGG ,, are derived according to Eqn. (3.4), Eqn. (3.5), and Eqn. (3.6),
respectively, which is found as
GPaGPaGPaEEG yxxy 122.3387.0387.0 (A.2)
GPaGPaEG xxz 058.055/2.355/ (A.3)
GPaGPaEG yyz 057.035/235/ (A.4)
The value of xzxy , and yz are set according to (Nordstand, 1995), which is 0.34, 0.01 and
0.01, respectively. The value of xzyzxyzz RRRR ,,, are related to the value of y
xz
y
yz
y
xy
y
zz ,,, ,
respectively, which are the yield stress in z, xy, yz and xz direction. According to (Gooren, 2006),
y
zz is about 0.003-0.007GPa, while y
xz
y
yz
y
xy ,, are about 0.003 to 0.011GPa. In this work, y
zz
is set to be 0.007GPa, and y
xz
y
yz
y
xy ,, are all set to be 0.011 for the first estimate. Further, the

109
xzyzxyzz RRRR ,,, are determined according to Eqn. (3.18), Eqn. (3.19), Eqn. (3.20), and eqn.
(3.21), respectively, which are found as below:
23.003.0
007.0
0
GPa
GPaR
y
zzzz
(A.5)
635.003.0
011.033
0
GPa
GPaR
y
xy
xy
(A.6)
635.003.0
011.033
0
GPa
GPaR
y
yz
yz
(A.7)
635.003.0
011.033
0
GPa
GPaR
y
xzxz
(A.8)
Thus, all the material parameters are identified and are listed in Table A.2. A trial and error
procedure is performed and the parameters in table A.2 are found accurate for the model.
Table A.2 Material parameters for the liner
Parameter Value Parameter Value
Ex (GPa) 3.2 Ϭ0 (GPa) 0.03
Ey (GPa) 2 Et (GPa) 2.5
E z ( GP a ) 0 . 0 16 R x x 1
vx y 0.34 Ry y 0.35
vy z 0.01 R z z 0.23
vy z 0.01 Rxy 0.635
Gxy (GPa) 1 Ryz 0.635
Gyz (GPa) 0.057 Rxz 0.635
Gxz (GPa) 0.058
A.3 Identification of material parameters for the core
Fig. A.7 shows the typical measured stress VS strain response of the core specimen under the

110
tension in x direction. Similarly, in the initial loading stage, the specimen shows nonlinear
response due to flattening until a strain level of 0.0067 is reached. After that, the specimen
responds linearly up to yield point at strain level of 0.0077. After the yield point, the material
responds into the plastic deformation until the failure happens at strain level of 0.008. Referring
to Fig. A.6, the elastic modulus xE is calculated to be 0.62 GPa; The reference stress 0 is the
same as the yield stress in x direction, which is 0.011 MPa; The plastic modulus tE is the slope
of the plastic response, which is 0.56 GPa. The xxR is the ratio of the yield stress in x direction
(0.011 GPa) to the reference stress (0.011 GPa), which is 1.
Typical stress VS strain relation of the core (x direction)
0
2
4
6
8
10
12
14
0 0.01 0.02 0.03 0.04 0.05 0.06 0.07 0.08 0.09
Strain (mm/mm)
Stress (Mpa)
Fig. A.7 Typical stress VS strain relation of the core in x direction
Fig. A.8 shows the typical measured stress VS strain response of the core specimen under the
tension in y direction. Similarly, in the initial loading stage, the specimen shows nonlinear
response due to flattening until a strain level of 0.00285 is reached. Following that, the response
becomes flat due to glue effect until a strain level of 0.0035 is reached. After that, the specimen
responds linearly up to yield point at strain level of 0.0088. After the yield point, the material
responds into the plastic deformation until the failure happens at strain level of 0.011. Referring
to Fig. A.6, the elastic modulus yE is calculated to be 1.125 GPa; The yield stress in y direction,
Linear slope
Plastic slope

111
is 0.009 GPa; The yyR is the ratio of the yield stress in y direction (0.009 GPa) to the reference
stress (0.011 GPa), which is calculated to be 0.8.
Typical stress VS strain relation of the core (y direction)
0
2
4
6
8
10
12
0 0.005 0.01 0.015 0.02Strain (mm/mm)
Stress (Mpa)
Fig. A.8 Typical stress VS strain relation of the core in y direction
For both types of specimens, four new specimens were repeated and the results were shown in
Fig. A.9 and Fig. A.10, respectively.
Linear slope
Plastic slope

112
Stress VS strain relation of the core (x direction)
0
2
4
6
8
10
12
14
16
0 0.02 0.04 0.06 0.08 0.1
Strain (mm/mm)
Stress (Mpa) Specimen 1
Specimen 2
Specimen 3
Specimen 4
Fig. A.9 Stress VS strain relation of the core in x direction for all specimens
Stress VS strain relation of the core (y direction)
0
2
4
6
8
10
12
14
16
0 0.005 0.01 0.015 0.02
Strain (mm/mm)
Stress (Mpa)
Specimen 1
Specimen 2
Specimen 3
Specimen 4
Fig. A.10 Stress VS strain relation of the core in y direction for all specimens
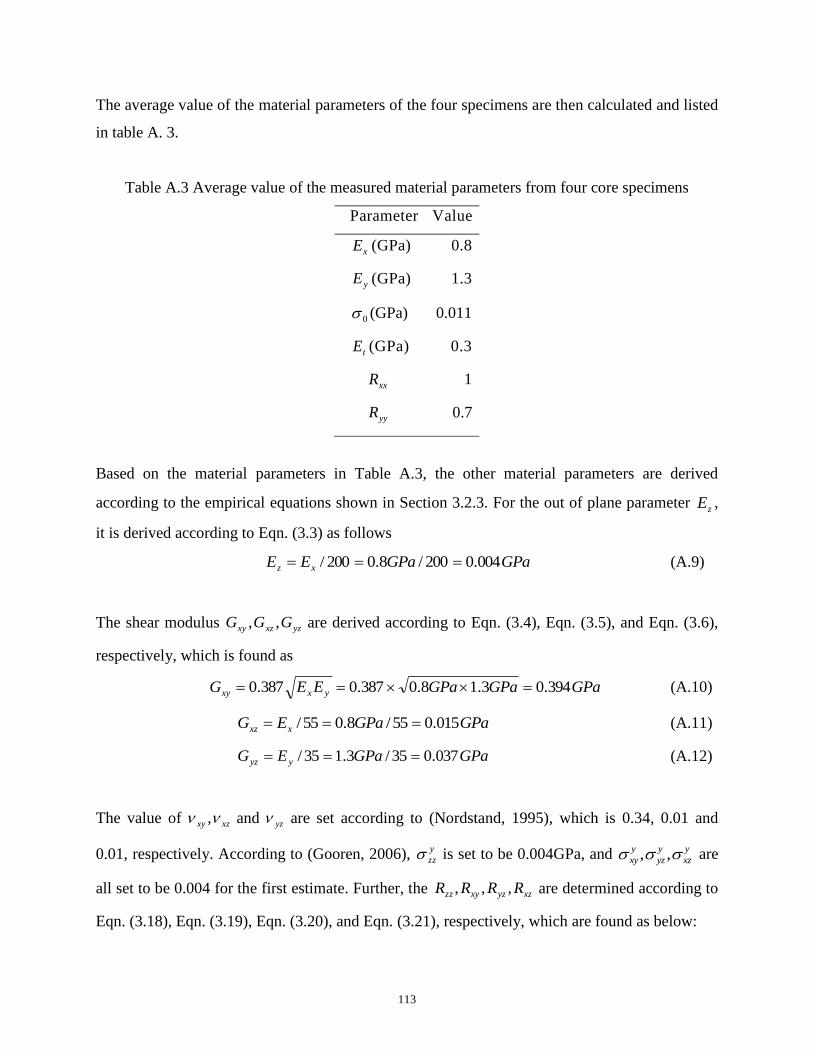
113
The average value of the material parameters of the four specimens are then calculated and listed
in table A. 3.
Table A.3 Average value of the measured material parameters from four core specimens
Parameter Value
xE (GPa) 0.8
yE (GPa) 1.3
0 (GPa) 0.011
tE (GPa) 0.3
xxR 1
yyR 0.7
Based on the material parameters in Table A.3, the other material parameters are derived
according to the empirical equations shown in Section 3.2.3. For the out of plane parameter zE ,
it is derived according to Eqn. (3.3) as follows
GPaGPaEE xz 004.0200/8.0200/ (A.9)
The shear modulus yzxzxy GGG ,, are derived according to Eqn. (3.4), Eqn. (3.5), and Eqn. (3.6),
respectively, which is found as
GPaGPaGPaEEG yxxy 394.03.18.0387.0387.0 (A.10)
GPaGPaEG xxz 015.055/8.055/ (A.11)
GPaGPaEG yyz 037.035/3.135/ (A.12)
The value of xzxy , and yz are set according to (Nordstand, 1995), which is 0.34, 0.01 and
0.01, respectively. According to (Gooren, 2006), y
zz is set to be 0.004GPa, and y
xz
y
yz
y
xy ,, are
all set to be 0.004 for the first estimate. Further, the xzyzxyzz RRRR ,,, are determined according to
Eqn. (3.18), Eqn. (3.19), Eqn. (3.20), and Eqn. (3.21), respectively, which are found as below:

114
36.0011.0
004.0
0
GPa
GPaR
y
zzzz
(A.13)
63.0011.0
04.033
0
GPa
GPaR
y
xy
xy
(A.14)
63.0011.0
004.033
0
GPa
GPaR
y
yz
yz
(A.15)
63.0011.0
004.033
0
GPa
GPaR
y
xzxz
(A.16)
Thus, all the material parameters are identified and are listed in Table A.4. A trial and error
procedure is performed and the parameters are found not accurate for the model. The parameters
are then refined to get the results as close as possible to that of the experiments. The refined
parameters are listed in Table A.5.
Table A.4 Material parameters for the core
Parameter Value Parameter Value
Ex (GPa) 0.8 0 (GPa) 0.011
Ey (GPa) 1.3 Et (GPa) 0.3
E z (GPa) 0 .004 R x x 1
v x y 0 . 3 4 R y y 0 . 7
vy z 0.01 R z z 0.36
vy z 0.01 Rx y 0.63
Gxy (GPa) 0.394 Ryz 0.63
Gyz (GPa) 0.037 Rxz 0.63
Gxz (GPa) 0.015

115
Table A.5 Refined material parameters for the core
Parameter Value Parameter Value
Ex (GPa) 5 0 (GPa) 0.011
Ey (GPa) 1.3 Et (GPa) 0.01
E z (GPa) 0 .025 R x x 1
v x y 0 .34 R y y 0 .3
v y z 0 . 01 R z z 0 .3
vyz 0.01 Rxy 0.63
G x y (GPa) 1 Ry z 0.63
G y z (GPa) 0.05 Rx z 0.63
Gxz (GPa) 0.005
116
APPENDIX B
MEASUREMENT RESULTS FOR EXAMPLE 2
B.1 Introduction
This Appendix will show the measurement results for Example 2.
B.2 Measurement results
For Example 2, the measured results with and without cardboards (19 cardboards in series) at
location 1, location 2, location 3 and location 4 are shown in Fig. B.1, Fig. B.2, Fig. B.3 and Fig.
B.4, respectively. In these figures, the horizontal axis is the frequency and the vertical axis is the
acceleration. It is noted that only the acceleration at 29.25 Hz (183.69 rad/s) was recorded as it is
the frequency where the pump is operating.

117
Measurement result (Without cardboards)
0.00E+00
5.00E-09
1.00E-08
1.50E-08
2.00E-08
2.50E-08
3.00E-08
0.00 10.00 20.00 30.00 40.00
Frequency (Hz)
Acceleration (m/s2)
Location 1
(a)
Measurement result (With cardboards)
0.00E+00
5.00E-09
1.00E-08
1.50E-08
2.00E-08
2.50E-08
3.00E-08
0.00 10.00 20.00 30.00 40.00
Frequency (Hz)
Acceleration (m/s2)
Location 1
(b)
Fig. B.1 Measurement results for Example 2 at location 1 (a) without cardboards; (b) with
cardboards

118
Measurement result (Without cardboards)
0.00E+00
2.00E-08
4.00E-08
6.00E-08
8.00E-08
1.00E-07
1.20E-07
1.40E-07
1.60E-07
0.00 10.00 20.00 30.00 40.00
Frequency (Hz)
Acceleration (m/s2)
Location 2
(a)
Measurement result (With cardboards)
0.00E+00
2.00E-08
4.00E-08
6.00E-08
8.00E-08
1.00E-07
1.20E-07
1.40E-07
1.60E-07
0.00 10.00 20.00 30.00 40.00
Frequency (Hz)
Acceleration (m/s2)
Location 2
(b)
Fig. B.2 Measurement results for Example 2 at location 2 (a) without cardboards; (b) with
cardboards

119
Measurement result (Without cardboards)
0.00E+00
5.00E-09
1.00E-08
1.50E-08
2.00E-08
2.50E-08
3.00E-08
0.00 10.00 20.00 30.00 40.00
Frequency (Hz)
Acceleration (m/s2)
Location 3
(a)
Measurement result (With cardboards)
0.00E+00
5.00E-09
1.00E-08
1.50E-08
2.00E-08
2.50E-08
3.00E-08
0.00 10.00 20.00 30.00 40.00
Frequency (Hz)
Acceleration (m/s2)
Location 3
(b)
Fig. B.3 Measurement results for Example 2 at location 3 (a) without cardboards; (b) with
cardboards

120
Measurement result (Without cardboards)
0.00E+00
2.00E-08
4.00E-08
6.00E-08
8.00E-08
1.00E-07
1.20E-07
0.00 10.00 20.00 30.00 40.00
Frequency (Hz)
Acceleration (m/s2)
Location 4
(a)
Measurement result (With cardboards)
0.00E+00
2.00E-08
4.00E-08
6.00E-08
8.00E-08
1.00E-07
1.20E-07
0.00 10.00 20.00 30.00 40.00
Frequency (Hz)
Acceleration (m/s2)
Location 4
(b)
Fig. B.4 Measurement results for Example 2 at location 4 (a) without cardboards; (b) with
cardboards