Investigation of Ballast Degradation and Fouling Trends...
15
1 Abstract Ballast fouling, often associated with deteriorating railroad track performance, refers to the condition when the ballast layer changes its composition and becomes much finer in grain size distribution. This paper describes an image analysis approach to characterize different stages of railroad ballast degradation studied using Los Angeles abrasion testing in the laboratory. An aggregate image analysis approach is utilized to investigate ballast particle abrasion and breakage trends at every stage through detailed quantifications of individual ballast particle size and shape properties. Aggregate image processing or segmentation techniques have been also developed and used in this study to analyze the two-dimensional images of ballast aggregate samples captured by a commonly used DSLR camera in the field for extraction and analyses of individual aggregate particle size and shape properties. The segmented individual particle images were fed into the validated University of Illinois Aggregate Image Analyzer (UIAIA) processing algorithms to compute particle size and shape properties using the imaging based indices of flat and elongated ratio (FER), angularity index (AI), and surface texture index (STI). The performance of the field imaging and segmentation methodology was evaluated by means of a case study involving field images of railroad aggregate samples collected from various ballast depths in a mainline freight railroad track. Image analysis results of ballast particles larger than 9.5 mm (3/8 in.) scanned after a different number of turns of the LA abrasion drum showed good correlations between percent changes in aggregate shape properties, i.e., imaging based flatness and elongation, angularity and surface texture indices, and the fouling index (FI). Such relationships to be established between in-service track fouling levels and ballast size and shape properties using similar field imaging techniques would help to better understand field degradation trends and as a result, improve ballast serviceability and life cycle performance. Keywords: ballast degradation, aggregate, fouling, image segmentation, angularity index. Paper 0123456789 Investigation of Ballast Degradation and Fouling Trends using Image Analysis M. Moaveni, Y. Qian, H. Boler, D. Mishra and E. Tutumluer Department of Civil and Environmental Engineering University of Illinois Urbana-Champaign, USA Civil-Comp Press, 2014 Proceedings of the Second International Conference on Railway Technology: Research, Development and Maintenance, J. Pombo, (Editor), Civil-Comp Press, Stirlingshire, Scotland.
Transcript of Investigation of Ballast Degradation and Fouling Trends...

1
Abstract Ballast fouling, often associated with deteriorating railroad track performance, refers to the condition when the ballast layer changes its composition and becomes much finer in grain size distribution. This paper describes an image analysis approach to characterize different stages of railroad ballast degradation studied using Los Angeles abrasion testing in the laboratory. An aggregate image analysis approach is utilized to investigate ballast particle abrasion and breakage trends at every stage through detailed quantifications of individual ballast particle size and shape properties. Aggregate image processing or segmentation techniques have been also developed and used in this study to analyze the two-dimensional images of ballast aggregate samples captured by a commonly used DSLR camera in the field for extraction and analyses of individual aggregate particle size and shape properties. The segmented individual particle images were fed into the validated University of Illinois Aggregate Image Analyzer (UIAIA) processing algorithms to compute particle size and shape properties using the imaging based indices of flat and elongated ratio (FER), angularity index (AI), and surface texture index (STI). The performance of the field imaging and segmentation methodology was evaluated by means of a case study involving field images of railroad aggregate samples collected from various ballast depths in a mainline freight railroad track. Image analysis results of ballast particles larger than 9.5 mm (3/8 in.) scanned after a different number of turns of the LA abrasion drum showed good correlations between percent changes in aggregate shape properties, i.e., imaging based flatness and elongation, angularity and surface texture indices, and the fouling index (FI). Such relationships to be established between in-service track fouling levels and ballast size and shape properties using similar field imaging techniques would help to better understand field degradation trends and as a result, improve ballast serviceability and life cycle performance. Keywords: ballast degradation, aggregate, fouling, image segmentation, angularity index.
Paper 0123456789 Investigation of Ballast Degradation and Fouling Trends using Image Analysis M. Moaveni, Y. Qian, H. Boler, D. Mishra and E. Tutumluer Department of Civil and Environmental Engineering University of Illinois Urbana-Champaign, USA
Civil-Comp Press, 2014 Proceedings of the Second International Conference on Railway Technology: Research, Development and Maintenance, J. Pombo, (Editor), Civil-Comp Press, Stirlingshire, Scotland.

2
1 Introduction Each year a large portion of the US freight railroad-operating budget is dedicated to maintenance and renewal of mineral aggregates used as track ballast. These large sized aggregates are used as the ballast layer in the track substructure, which distributes the train load to the subgrade soil and provides drainage. Fouling refers to the condition of railroad ballast layer when voids in unbound aggregate layer are filled with relatively finer materials or fouling agents commonly generated by ballast aggregate breakage, outside contamination such as coal dust from coal trains, or from subgrade soil intrusion. Often associated with railroad track performance concerns, such as poor drainage, rapid and excessive settlement and reduced lateral stability, ballast fouling or degradation is considered unfavorable and routinely dealt with ballast cleaning and undercutting type track maintenance activities. According to Tolppanen [1], the most important factors which cause coarse aggregate degradation include a) material properties, b) shape of aggregate particles, c) initial size distribution and arrangement of particles, d) force concentration on particle surfaces, e) aggregate layer maintenance operations and environmental conditions. Selig and Waters [2] proposed the Fouling Index (FI) as the summation of percentage by weight of ballast material passing the 4.75 mm (No. 4) and the 0.075 mm (No. 200) sieves. This index is generally used in US to measure the magnitude and rate of ballast degradation.
Currently, there are several standards and testing procedures to evaluate the
resistance of aggregates to degradation. Los Angeles Abrasion (LAA) and Micro-Deval (MD) are two of the most common devices that are used to study the degradation patterns of mineral aggregates. According to Lim [3] and McDowell et al. [4], LAA test results correlated very well with ballast box test results particularly if tamping activity was included in their experimental program.
During the last decade, machine vision technology and image segmentation has been utilized as an objective and accurate tool for quantifying aggregate particle size and shape properties in a rapid, reliable and automated fashion when compared to traditional manual methods [5,6]. This methodology holds the potential to measure the extent of change in aggregate shape properties during the degradation and breakage process under service train loading. Each available imaging system uses a specific mathematical procedure in calculating a validated index to evaluate form, angularity, and texture properties of aggregates. Among the most widely used techniques in aggregate shape characterization, the Flat and Elongated Ratio (FER), Angularity Index (AI), and Surface Texture Index (STI) were recognized as key indices from national studies. These indices were determined using the University of Illinois Aggregate Image Analyzer (UIAIA) [7,8,9]. This paper presents preliminary results of an ongoing research study at the University of Illinois with the goal to characterize ballast degradation through LAA testing and aggregate image analysis. Additionally, field imaging procedure including capturing multiple aggregate particles in single 2-D images using a high-resolution DSLR camera is also described as part of this study. A case study involving collected field images of

3
railroad ballast aggregate samples is also included to demonstrate the effectiveness of the field imaging and segmentation approach in producing single aggregate particle images, which are subsequently analyzed for size and shape properties through the use of image processing algorithms of an enhanced, second generation UIAIA.
2 Sample preparation and ballast degradation simulation The ballast material used in the laboratory was a 100% crushed limestone, which followed AREMA No. 24 gradation requirements as illustrated in Figure 1. Ten kilograms of virgin ballast material were placed in the LAA test drum together with 12 steel balls. The drum was set to rotate on the average 50 turns per minute and for each run the drum rotated 125 times. After finishing every 125 turns, the drum was allowed to stand still for about 10 minutes to let dust settle before the tested material was poured out. All particles above 25.4 mm or 1.0 in. sieve size were also brushed to collect dust and fine material before sieving. The rest of the materials (passing 25.4 mm or 1.0 in. sieve) were carefully sieved using a DuraShake™ type rotation aggregate sifter so that loss of fine materials was minimized. Materials passing each sieve size were then collected and placed on a blue background placed on the floor to take photos. The outlined procedure was repeated until the specimen reached FI of 40, which corresponds to a heavily fouled ballast condition certainly requiring maintenance activities in the track. Note that the same specimen was always used in LAA test drum, which required 12 individual turns at 125-turn intervals.
Figure 1: Gradation of limestone ballast material

4
3 E-UIAIA and digital image segmentation Recently, an enhanced, second generation UIAIA has been designed and manufactured at the University of Illinois with many improvements over the old system. Figure 2 illustrates this new system showing an aggregate particle with three orthogonal views captured using high resolution progressive scan digital color cameras. These views are used to quantify imaging based FER, AI, and STI morphological indices. Unlike the old version of UIAIA, which was limited to taking black and white images, the new system is equipped with three high resolution (1,292 x 964 pixels) Charge Coupled Device (CCD) progressive scan cameras to capture digital color images of aggregate particles. An advanced color thresholding scheme is utilized in Enhanced-UIAIA (E-UIAIA) to scan and process color images of different types of mineral aggregate. Four LED illumination lights with dimmer controls assist the operator to achieve the best contrast and sharpest possible aggregate images by optimizing camera light gains as well as minimizing shadows. An enhanced calibration adjustment interface also makes it possible to change the spatial resolution corresponding to the size of aggregate particle scanned by using the variable focal length of the camera lenses. After the calibration process, “saved configurations files” are used to determine accurate sizes and shape property indices for each batch of aggregate particles.
Figure 2: Enhanced-University of Illinois Aggregate Image Analyzer (E-UIAIA)
During the LAA tests, aggregate particles larger than 9.5 mm or passing 3/8-in.
sieve were hand picked to perform image analyses using the E-UIAIA. This step was conducted to determine imaging based quantifications of particle size and shape indices as well as recording the change in shapes after each step of the 125-turns.

5
Image segmentation is the process of partitioning a digital image into multiple sets/classes of pixels (“superpixels”). Each segmented set/class should correspond to a well-defined object or a coherent region in the image [10]. In the current research study, aggregate image analysis and segmentation techniques are used to combine a Markov Random Field (MRF) approach for modeling, graph cut for optimization and user interaction for enforcing hard constraints [11,12,13]. The ultimate objective is segmenting the images into foreground and background regions, while the connected components of the foreground need to be determined. Each such connected component is a single particle or a small cluster of particles. The segmentation algorithm examines each row in the image and finds the intervals of foreground pixels and cluster intervals from adjacent rows. Each cluster is hence a connected component thus corresponds to a single particle. An illustration of the process is shown in Figure 3 for different color coarse aggregate particles segmented into smaller single-particle images.
Aggregate
Image Capturing
Background Particle
Detection
Gray Scale Image
Thresholding
Particle Segmentation
Extraction
Figure 3: Description of image segmentation algorithm using MRF approach

6
4 Discussion and results 4.1 Ballast degradation – Effects on particle size distribution Sieve analysis results and the determined degradation patterns in terms of change in particle size distributions during LAA test are presented in Figure 4, which clearly shows how the ballast gradation changed from a uniform to a well-graded gradation in time. Additionally, Fouling Index (FI) values associated with each 125 revolutions has been reported. Figure 3 therefore confirms how the FI values increased gradually for each set of 125-turns. Since virgin ballast materials are more susceptible to abrading sharp corners and edges of the crushed particles, breakage of the large sized particles mostly happened in the early stages of the experiment. With the number of turns increasing in LAA runs, those particles that did not break due to the impact loads gradually became much more rounded due to loosing their sharp corners as well as possessing smoother textures due to abrasion of surfaces and edges.
Figure 4: Degradation of limestone ballast during LAA test

7
Visual illustration of limestone ballast degradation is shown in Figure 5. This figure shows how those particles retained on the 37.5 mm sieve became smoother and rounded during LA-Abrasion process. More detailed analyses of the degradation trends including particle shape indices recorded from the image analysis approach will further confirm such changes in shape properties which will be described in the next section of this paper.
Figure 5: Visual description of limestone degradation during LAA test
To investigate particle contact and particle packing characteristics, the test
specimen collected after each set of 125-turns of LAA test drum was placed into a cylindrical Plexiglas with dimensions of 25.4 cm (10.0 in.) in diameter and 25.4 cm (10.0 in.) in height. Figure 6 presents the side and top views of aggregate packing photos taken at different number of LAA drum turns. It should be noted that for each stage of the LAA test, there are two sets of images presented for “with” and “without” the particles smaller than 9.5- mm size.
The fine materials accumulated from the bottom to fill all the voids are created by fewer large particles all the way to the top when FI value of 40 are finally reached at 1500 turns. This observation confirms what Selig and Waters [2] found as the limit of heavily fouled ballast that should no longer be used in the field. Furthermore, a comparison of the height of the virgin ballast sample to that of the sample at 1500 LAA turns clearly shows how the ballast layer starts to settle down as the number of revolutions increases.

8
Figure 6: Visual description of limestone degradation during LAA test 4.2 Ballast degradation – Effects on particle shape properties Ballast degradation during the LAA test not only changes the particle size distributions but also influences the shapes of individual aggregate particles. Figure 7 presents the AI distributions of particles measured in the scale of 0 to 720 using E-UIAIA. Similar to the grain size distribution concept, the overall degradation trends of AI changes in time with the increasing number of LA Abrasion turns (see Figure 7). The AI values of limestone ballast decreases as the number of LAA turns increases gradually. The gap between any two curves illustrates how much the AI has changed.
Figure 8 shows STI distributions in the scale of 0 to 4 in which each point represents the ballast surface texture value for a particle and each curve captures STI distribution for all the particles after a certain number of drum turns. The gap between any two curves illustrates how much the STI has changed.
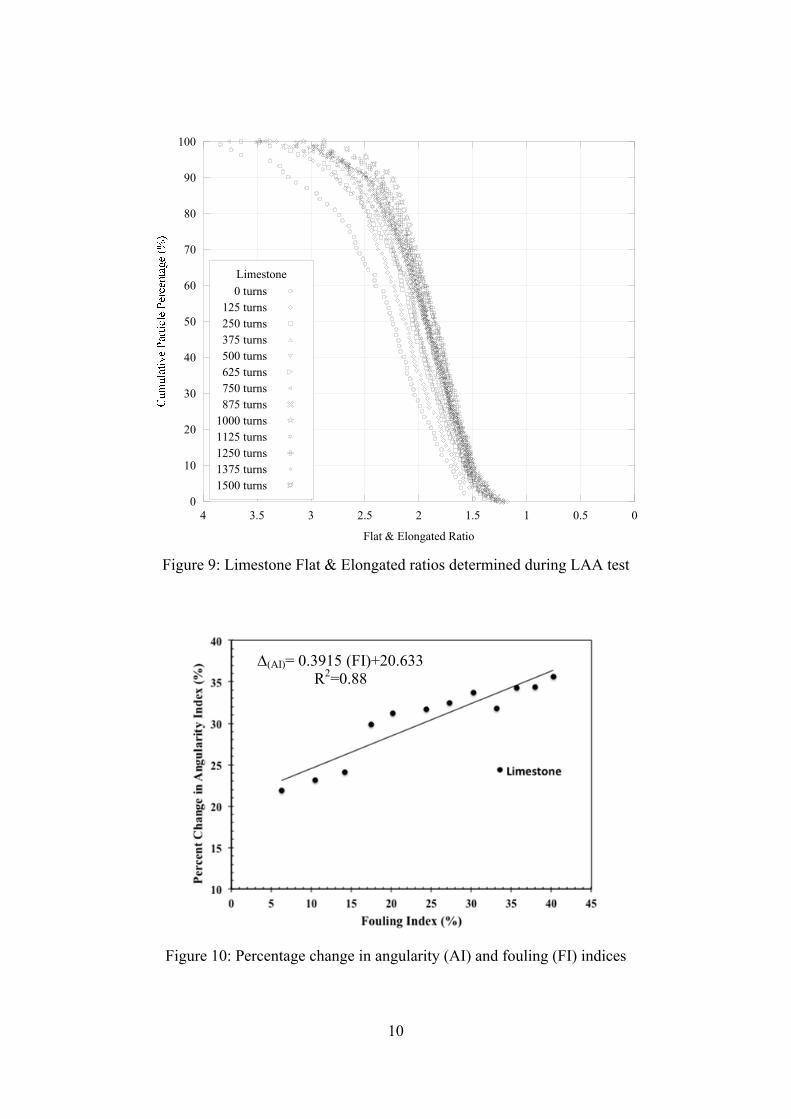
Figure 9 presents the changes in the Flat & Elongated (F&E) ratio distributions. Different from the AI and STI index trends, F&E ratio distributions changed from the initial wider range values to much narrower range values, which means that particles tended to become a certain uniform shaped towards more cubical by eliminating some of the more flat and elongated particles after exposed to abrasion and breakage.
Because both ballast fouling and shape property changes are due to particle
abrasion and breakage from the LAA test, the next step was to investigate how the change in FI values would correlate to changes in aggregate particle shape indices quantified by the E-UIAIA. Indeed, Figure 10 shows a strong correlation between the percentage change in average AI values and FI with a coefficient of determination R2 of 88%.

9
Figure 7: Limestone Angularity Index (AI) values determined during LAA test
4 3.5 3 2.5 2 1.5 1 0.5 0
Surface Texture Index
0
10
20
30
40
50
60
70
80
90
100
Limestone
0 turns125 turns250 turns375 turns500 turns625 turns750 turns875 turns
1000 turns1125 turns1250 turns1375 turns1500 turns
Figure 8: Limestone Surface Texture Indices (STI) determined during LAA test
10
4 3.5 3 2.5 2 1.5 1 0.5 0
Flat & Elongated Ratio
0
10
20
30
40
50
60
70
80
90
100
Limestone
0 turns125 turns250 turns375 turns500 turns625 turns750 turns875 turns
1000 turns1125 turns1250 turns1375 turns1500 turns
Figure 9: Limestone Flat & Elongated ratios determined during LAA test
(AI)= 0.3915 (FI)+20.633 R2=0.88
Figure 10: Percentage change in angularity (AI) and fouling (FI) indices

11
Similarly, Figure 11 presents a strong correlation between the percentage change in average STI values and FI this time with a coefficient of determination R2 of 81%. Such trends confirm that there is a definite connection between ballast fouling and the overall reduced angularity and surface texture of the aggregate particles found in old used ballast in the field.
(ST)= 0.41 (FI)+23.772 R2=0.81
Figure 11: Percentage change in surface texture (STI) and fouling (FI) indices
4.2 Field imaging application and case study findings To evaluate the performance of the field imaging and segmentation methods developed in this study, aggregate samples were collected at different ballast depths from a mainline freight railroad in Mississippi. Figure 12(a) shows the aggregate samples collected at the surface as well as 8-in. (20.3 cm) and 16-in. (40.6 cm) ballast depths. Figure 12(b) is a photo of the sampling track location showing clean ballast on top and gradually fouling ballast with depth. The shape properties of the ballast aggregate particles were measured using the field imaging/segmentation and the laboratory E-UIAIA methods described in this paper to investigate the effects of train loading and the resulting ballast deterioration levels with depth.
Table 1 summarizes the results of the morphological analyses with imaging based shape indices determined using both the E-UIAIA and the field segmentation techniques. A comparison of the maximum aggregate dimensions and Flat & Elongated ratios shows that both the field segmentation and the laboratory E-UIAIA methods match in determining aggregate particle sizes obtained from different ballast depths.

12
Figure 12(a): Aggregate samples collected at the surface (left), 8-in. (20.3-cm) (middle), and 16-in. (40.6-cm) (right) ballast depths
Figure 12(b): Aggregate sampling track location along a mainline freight railroad in Mississippi (2-in. or 5.1-cm white calibration ball)
Note that the AI values determined by the field imaging are consistently lower
than those computed in the laboratory from the E-UIAIA image scanning and processing method. This can be due to the camera sensor technologies as well as the natural lighting conditions vary considerably between two methods. Therefore, it is conceivable that the pixel intensities of the captured aggregate images are not quite similar although the pixel calibrations are the same. Digitization error can be considered as a factor for not achieving identical binary images by the two methods. However, the results from the two methods are closely matching enough and quite acceptable for practical field applications.
It should be noted that both methods could successfully detect the gradual demise
in the aggregate size with ballast depth due to degradation and particle breakdown under repeated train loading. The particles sampled from the 8-in. (20.3-cm) depth have slightly higher F&E ratios as determined by the two methods. The measured AI

13
and STI values indicate somewhat increasing trends with ballast depth, which can be explained with the size reduction and breakage of older ballast under train loading. Interestingly, as the aggregate size gets smaller with depth, these more recently crushed particles at greater depths possess higher angularities and rougher surfaces. This observation confirms the findings from LAA testing in the lab to simulate the ballast degradation.
Table 1: Ballast aggregate shape indices computed from E-UIAIA in the laboratory and field imaging/segmentation (1 in. = 2.54 cm)
E-UIAIA
Trial 1
AI (degrees) Max dimension (in.) F&E Ratio STI
Depth (in.)
No. of Particles
Average Std. Dev.
Average Std. Dev.
Average Std. Dev.
Average Std. Dev.
0 34 420 112 2.19 0.55 1.37 0.16 1.44 0.63
8 54 438 116 1.29 0.37 1.42 0.2 1.8 0.64
16 42 432 108 0.96 0.33 1.38 0.24 1.91 0.56
E-UIAIA
Trial 2
AI (degrees) Max dimension (in.) F&E Ratio STI
Depth (in.)
No. of Particles
Average Std. Dev.
Average Std. Dev.
Average Std. Dev.
Average Std. Dev.
0 34 421 125 2.2 0.54 1.3 0.15 1.43 0.55
8 54 459 120 1.28 0.35 1.43 0.18 1.79 0.66
16 42 468 114 0.97 0.32 1.39 0.25 2.05 0.68
DSLR Camera and Segmentation
Trial 1
AI (degrees) Max dimension (in.) F&E Ratio STI
Depth (in.)
No. of Particles
Average Std. Dev.
Average Std. Dev.
Average Std. Dev.
Average Std. Dev.
0 34 385 77 2.22 0.6 1.32 0.16 2.03 0.39
8 54 417 108 1.41 0.38 1.4 0.27 2.88 0.82
16 42 435 119 1.07 0.39 1.35 0.19 3.54 1.06
DSLR Camera and Segmentation
Trial 2
AI (degrees) Max dimension (in.) F&E Ratio STI
Depth (in.)
No. of Particles
Average Std. Dev.
Average Std. Dev.
Average Std. Dev.
Average Std. Dev.
0 34 379 81.4 2.21 0.56 1.31 0.13 2.06 0.4
8 54 402 105 1.4 0.39 1.44 0.3 2.9 0.9
16 42 441 97 1.03 0.36 1.32 0.19 3.63 1.09

14
5 Conclusions and recommendations The research presented in this paper focused on assessing ballast degradation properties using Los Angeles Abrasion (LAA) testing and imaging techniques applied in the laboratory and field. The effects of particle breakage on change in size distribution as well as shape properties were systematically monitored using the Enhanced-University of Illinois Aggregate Image Analyzer (E-UIAIA) and laboratory sieve analysis. The LAA tests provided an effective means to generate fine particles in the laboratory. The Fouling Index (FI) of 40 established heavily fouled ballast with all voids between the coarse particles filled with fine material.
The results of shape property measurement using E-UIAIA showed that this technology could successfully detect the change in shape and size of particles during the LAA tests. It was observed that as FI increased, particles became smoother and more rounded thus more resistant to abrasion and breakage. Moreover, strong correlations were found between the magnitude of change in angularity and surface texture indices (AI and STI) and the level of fouling in the ballast, which clearly confirm the relationship between degradation from loss of weight perspective as opposed to change in shape properties.
The application of field imaging and segmentation methodology was also evaluated in a case study where field images of railroad aggregate samples were collected from different ballast depths in a mainline freight railroad track. The results of ballast aggregate size and shape analyses, recorded with both the E-UIAIA in the laboratory and the field imaging/segmentation methods matched quite closely. Further, both methods could successfully detect the gradual decrease in the aggregate size due to higher degradation and particle breakdown with ballast depth as evidenced by higher AI and STI values measured at greater depths. Relationships to be established between in-service track fouling levels and ballast size and shape properties using field imaging techniques would help to better understand field degradation trends and as a result, improve ballast serviceability and life cycle performance.
Acknowledgements The findings presented in this paper were obtained in railroad research projects supported by the Federal Railroad Administration (FRA), Association of American Railroads (AAR) and the BNSF Railway. The opinions expressed in this article are solely those of the authors and do not represent the opinions of the funding agency. This paper does not constitute a standard, specification, or regulation.

15
References [1] P. Tolppanen, “3D Characterization and Degradation Analysis of Rock
Aggregates”, Doctoral Thesis, Department of Civil and Environmental Engineering, Royal Institute of Technology, Stockholm, Sweden, 2001.
[2] E. T. Selig, J. M. Waters, “Track Geotechnology and Substructure Management”, Thomas Telford Publications, London, 1994.
[3] W. Lim, “Mechanics of Railway Ballast Behavior”. Ph. D. Thesis, University of Nottingham, Nottingham, UK, 2004.
[4] G. McDowell, W. Lim, A. Collop, R. Armitage, N. Thom, “Laboratory simulation of train loading and tamping on ballast”, Proceedings of the Institution of Civil Engineers - Transport 158(2), pp. 89–95, 2005.
[5] E. Tutumluer, T. Pan, S. H. Carpenter, “Investigation of Aggregate Shape Effects on Hot Mix Asphalt Performance Using an Image Analysis Approach”, Transportation Pooled Fund Study TPF-5 (023), Federal Highway Administration, University of Illinois, Urbana, Illinois, February 2005.
[6] T. Al-Rousan, E. Masad, E. Tutumluer, T. Pan, “Evaluation of Image Analysis Techniques for Quantifying Aggregate Shape Characteristics”, Journal of Construction and Building Materials, Vol. 21, pp. 978-990, 2007.
[7] E. Tutumluer, C. Rao, J. A. Stefanski, “Video Image Analysis of Aggregates”, Final Project Report, FHWA-IL-UI-278, Civil Engineering Studies UILU-ENG-2000-2015, University of Illinois Urbana-Champaign, Urbana, Illinois, 2000.
[8] C. Rao, E. Tutumluer, I. T. Kim, “Quantification of Coarse Aggregate Angularity based on Image Analysis”, Transportation Research Record 1787, TRB, National Research Council, Washington, D.C., pp. 117-124, 2002.
[9] T. Pan, E. Tutumluer, J. Anochie-Boateng, “Aggregate Morphology Affecting Resilient Behavior of Unbound Granular Materials”, Transportation Research Record 1952, TRB, National Research Council, Washington, D.C., pp. 12-20, 2006.
[10] P. K. Sahoo, S. Soltani, A. K. C. Wong, “A Survey of Thresholding Techniques”, Computer Vision, Graphics, and Image Processing, Vol. 41, pp 233-260, 1988.
[11] S. Z. Li, “Markov Random Field Models in Computer Vision”, In Proceedings of the European Conference on Computer Vision, Vol. B, pp. 361-370, Stockholm, Sweden, May, 1994.
[12] Y. Y. Boykov, M. P. Jolly, “Interactive Graph Cuts for Optimal Boundary & Region Segmentation of Objects in N-D Images”, Proceedings of International Conference on Computer Vision, Vancouver, Canada, July, 2001.
[13] M. Moaveni, S. Wang, J. M. Hart, E. Tutumluer, and N. Ahuja, “Evaluation of Aggregate Size and Shape by Means of Segmentation Techniques and Aggregate Image Processing Algorithms”, Transportation Research Record: Journal of the Transportation Research Board, No. 2335, Transportation Research Board, Washington, D.C., 2013.