Investigation of Alternative Colouration Processing Medium ...
305
Investigation of Alternative Colouration Processing Medium for Textiles and Novel Filtration Media for Recycling of Textile Effluent A dissertation submitted to the University of Manchester for the degree of Doctor of Philosophy in the Faculty of Engineering and Physical Sciences 2014 Mohammad Abbas Uddin School of Materials
Transcript of Investigation of Alternative Colouration Processing Medium ...

Investigation of Alternative Colouration Processing
Medium for Textiles and Novel Filtration Media for
Recycling of Textile Effluent
A dissertation submitted to the University of
Manchester for the degree of Doctor of Philosophy in
the Faculty of Engineering and Physical Sciences
2014
Mohammad Abbas Uddin
School of Materials

2
TABLE OF CONTENTS
TABLE OF CONTENTS .................................................................................................. 2
LIST OF TABLES ............................................................................................................ 8
LIST OF FIGURES ........................................................................................................ 12
LIST OF SCHEMES ...................................................................................................... 18
LIST OF EQUATIONS .................................................................................................. 19
LIST OF NOTATIONS .................................................................................................. 21
ABBREVIATIONS ......................................................................................................... 23
ABSTRACT ..................................................................................................................... 25
DECLARATION AND COPYRIGHT ......................................................................... 28
THE AUTHOR ................................................................................................................ 29
ACKNOWLEDGEMENT .............................................................................................. 32
THESIS OVERVIEW ..................................................................................................... 34
1. Literature Review.................................................................................................... 36
1.1 Introduction to the Water Resource ................................................................................................ 36
1.1.1 Water Reserves on Earth ....................................................................................................... 36 1.1.2 Water Reserves for Bangladesh ............................................................................................. 39 1.1.3 Water Consumption in Textiles ............................................................................................. 39 1.1.4 Sources of Water ................................................................................................................... 41 1.1.5 Effect of seawater on industrial processing ........................................................................... 43 1.1.6 Water Quality for Textile Processing .................................................................................... 45
1.2 Textile Wastewater ........................................................................................................................ 46
1.2.1 Textile Wastewater in Bangladesh ........................................................................................ 48 1.2.2 Effluent Treatment Methods.................................................................................................. 50
1.2.2.1 Coagulation, Flocculation and Precipitation ................................................................ 51 1.2.2.2 Oxidation Methods ...................................................................................................... 52 1.2.2.3 Adsorption Methods .................................................................................................... 52 1.2.2.4 Biological Treatments .................................................................................................. 52 1.2.2.5 Membrane Processing .................................................................................................. 53
1.3 Textile Fibres .................................................................................................................................. 53 1.4 Textile Dyes .................................................................................................................................... 55
1.4.1 Characteristics of Dyes .......................................................................................................... 55 1.4.2 Classification of Dyes ........................................................................................................... 56

3
1.4.2.1 Based on Chemical Constitution .................................................................................. 57 1.4.2.2 Based on Application Method ..................................................................................... 57
1.5 Textile Dyeing ................................................................................................................................ 59
1.5.1 Theory of Dyeing .................................................................................................................. 59 1.5.2 Absorbance ............................................................................................................................ 61 1.5.3 Colour Fastness ..................................................................................................................... 61 1.5.4 Degree of Dye Fixation and Dye Loss .................................................................................. 62
1.6 Introduction to Filtration ................................................................................................................. 64
1.6.1 Filtration Process ................................................................................................................... 64 1.6.2 Process Fundamentals ........................................................................................................... 65
1.6.2.1 Filter Permeability ....................................................................................................... 65 1.6.2.2 Flux .............................................................................................................................. 66 1.6.2.3 Pressure Drop ............................................................................................................... 66
1.6.3 Filtration Mechanism ............................................................................................................ 66
1.6.3.1 Conventional Filtration ............................................................................................... 68 1.6.3.2 Cross-flow Filtration .................................................................................................... 71
1.7 Filter Media..................................................................................................................................... 72
1.7.1 Woven fabric ......................................................................................................................... 74 1.7.2 Nonwoven ............................................................................................................................. 75
1.7.2.1 Composite Structures ................................................................................................... 76
1.7.3 Woven Wire and Screen ........................................................................................................ 76
1.8 Membranes...................................................................................................................................... 77
1.8.1 Membrane separation types ................................................................................................... 79
1.8.1.1 Microfiltration (MF) ................................................................................................... 79 1.8.1.2 Ultrafiltration (UF) ..................................................................................................... 79 1.8.1.3 Nanofiltration (NF) ..................................................................................................... 79 1.8.1.4 Reverse osmosis (RO) ................................................................................................ 80 1.8.1.5 Electrodialysis (ED) ..................................................................................................... 80
1.8.2 Membrane Fouling ................................................................................................................ 80
1.8.2.1 Membrane Fouling due to Dyes ................................................................................... 82
1.8.3 Cost of Membrane System for Wastewater Treatment .......................................................... 82
1.9 Surface Modification of Filter Media ............................................................................................. 83
1.9.1 Fluorination ........................................................................................................................... 84
1.9.1.1 Barrier Properties. ........................................................................................................ 85 1.9.1.2 Membrane Technology ................................................................................................ 85 1.9.1.3 Chemical Resistance .................................................................................................... 85 1.9.1.4 Adhesion and Printability Properties ........................................................................... 85 1.9.1.5 Frictional Coefficient ................................................................................................... 86 1.9.1.6 Anti-reflecting Coating and Reduction of UV radiation .............................................. 86
1.9.2 Fluorocarbon (FC) Finishes ................................................................................................... 86 1.9.3 Plasma Technology ............................................................................................................... 87
1.10 Coagulation/Flocculation ................................................................................................................ 88
1.10.1 Types of coagulants/flocculants ....................................................................................... 90
1.10.1.1 Metal Coagulants ......................................................................................................... 90 1.10.1.2 Organic Polymers as Coagulants/Flocculants .............................................................. 91 1.10.1.3 Synthetic Cationic Polyelectrolyte Polymers ............................................................... 92

4
1.10.2 Mechanism of Coagulation/Flocculation .......................................................................... 93
1.10.2.1 Coagulation by Charge Neutralization ......................................................................... 93 1.10.2.2 Coagulation by Double Layer Compression ................................................................ 93 1.10.2.3 Flocculation via Polymer Bridging .............................................................................. 95
1.10.3 Dual Component System .................................................................................................. 97
1.11 References ....................................................................................................................................... 99
2. Experimental ......................................................................................................... 116
2.1 Simulated Seawater (SSW) ........................................................................................................... 116 2.2 Textile Fibres and Dyes used in this Research .............................................................................. 117 2.3 Filter Media................................................................................................................................... 118 2.4 Slurry ............................................................................................................................................ 118 2.5 Coagulants and Flocculants .......................................................................................................... 119 2.6 Filtration ....................................................................................................................................... 120 2.7 Experimental Methods .................................................................................................................. 121
2.7.1 Dye Exhaustion ................................................................................................................... 121 2.7.2 Dye Fixation ........................................................................................................................ 122 2.7.3 Colour Measurement ........................................................................................................... 123 2.7.4 Dye Removal ....................................................................................................................... 124 2.7.5 Fastness ............................................................................................................................... 124 2.7.6 Wettability Test ................................................................................................................... 125 2.7.7 Oil and Water Repellency ................................................................................................... 125 2.7.8 Tensile Strength ................................................................................................................... 125 2.7.9 Abrasion Resistance ............................................................................................................ 126 2.7.10 Turbidity Test ................................................................................................................. 126 2.7.11 Flow Rate and Solution Recovery % .............................................................................. 126 2.7.12 Filtrate Properties ........................................................................................................... 127 2.7.13 Properties of Filter cake .................................................................................................. 127 2.7.14 Kawabata Evaluation System (KES) .............................................................................. 128
2.8 Microscopic and Spectroscopic Analysis...................................................................................... 130
2.8.1 X-ray Photoelectron Spectroscopy (XPS) ........................................................................... 130 2.8.2 Attenuated Total Reflectance Fourier Transform Infrared (ATR FTIR) ............................. 130 2.8.3 Surface Morphology Analysis by Scanning Electron Microscopy ...................................... 131 2.8.4 Contact Angle Measurements.............................................................................................. 131
2.9 References ..................................................................................................................................... 133
3. Dyeing of Wool with Acid dyes ............................................................................ 138
3.1 Introduction ................................................................................................................................... 138 3.2 Experimental ................................................................................................................................. 139
3.2.1 Materials .............................................................................................................................. 139 3.2.2 Dyeing ................................................................................................................................. 142 3.2.3 Wash-off .............................................................................................................................. 143
3.3 Results and Discussion ................................................................................................................. 143
3.3.1 Effect of Simulated Seawater on Dye λmax Absorption and Dye Concentration Linearity .. 143 3.3.2 Effect of Wash-off on Fibre Topography ............................................................................ 146 3.3.3 Effect of Saline Environment on Wool ............................................................................... 147 3.3.4 Effects of Salts on Wool/Acid Dye System ......................................................................... 148 3.3.5 Colour Characteristics ......................................................................................................... 152 3.3.6 Fastness Properties .............................................................................................................. 155 3.3.7 Kawabata Evaluation System (KES) Analysis .................................................................... 158
3.4 Conclusions ................................................................................................................................... 160 3.5 References ..................................................................................................................................... 162
4. Dyeing of wool with Reactive dyes ....................................................................... 165

5
4.1 Introduction ................................................................................................................................... 165 4.2 Experimental ................................................................................................................................. 166
4.2.1 Materials .............................................................................................................................. 166 4.2.2 Dyeing ................................................................................................................................. 167 4.2.3 After-treatment and Wash-off ............................................................................................. 168 4.2.4 Dye Exhaustion and Fixation .............................................................................................. 168
4.3 Results and Discussion ................................................................................................................. 168
4.3.1 Effect of SSW on Dye Solution........................................................................................... 168 4.3.2 Exhaustion and Fixation of Dye .......................................................................................... 175 4.3.3 Colour Characteristics ......................................................................................................... 176 4.3.4 Colour Fastness Performance .............................................................................................. 179 4.3.5 Tensile Strength ................................................................................................................... 180 4.3.6 Abrasion Resistance ............................................................................................................ 182
4.4 Conclusions ................................................................................................................................... 184 4.5 References ..................................................................................................................................... 185
5. Dyeing of Polyester with Disperse Dyes .............................................................. 190
5.1 Introduction ................................................................................................................................... 190 5.2 Experimental ................................................................................................................................. 191
5.2.1 Materials .............................................................................................................................. 191 5.2.2 Dyeing ................................................................................................................................. 193 5.2.3 Alkaline Reduction Clearing ............................................................................................... 193
5.3 Results and Discussion ................................................................................................................. 194
5.3.1 Effect of Simulated Seawater on Dye Dispersion ............................................................... 194 5.3.2 Colour Characteristics ......................................................................................................... 194 5.3.3 Fastness Properties .............................................................................................................. 197 5.3.4 Surface Morphology ............................................................................................................ 203
5.4 Conclusions ................................................................................................................................... 205 5.5 References ..................................................................................................................................... 206
6. Dyeing of Nylon with Acid dyes ........................................................................... 209
6.1 Introduction ................................................................................................................................... 209 6.2 Experimental ................................................................................................................................. 209
6.2.1 Materials .............................................................................................................................. 209 6.2.2 Dyeing ................................................................................................................................. 209
6.3 Results and Discussion ................................................................................................................. 210
6.3.1 Initial studies: Effect of Simulated Seawater on Dye λmax Absorption and Dye Concentration
linearity 210 6.3.2 Effect of Salts on Nylon/Acid Dye System ......................................................................... 211 6.3.3 Exhaustion of Dye ............................................................................................................... 211 6.3.4 Colour Characteristics ......................................................................................................... 212 6.3.5 Colour Fastness Properties .................................................................................................. 214
6.4 Conclusions ................................................................................................................................... 216 6.5 References ..................................................................................................................................... 217
7. Dyeing of Acrylic with Cationic Dyes .................................................................. 219
7.1 Introduction ................................................................................................................................... 219 7.2 Experimental ................................................................................................................................. 219
7.2.1 Materials .............................................................................................................................. 219 7.2.2 Dyeing ................................................................................................................................. 220
7.3 Results and Discussions ................................................................................................................ 221

6
7.3.1 Effect of Simulated Seawater on dye λmax Absorption and Dye Concentration Linearity ... 221 7.3.2 Effect of Salts on Exhaustion of Dye .................................................................................. 222 7.3.3 Fastness Properties .............................................................................................................. 225
7.4 Conclusions ................................................................................................................................... 226 7.5 References ..................................................................................................................................... 227
8. Surface Characterisation of Filter Media ........................................................... 230
8.1 Introduction ................................................................................................................................... 230 8.2 Experimental ................................................................................................................................. 231
8.2.1 Materials .............................................................................................................................. 231 8.2.2 Fluorination ......................................................................................................................... 232 8.2.3 Fluorocarbon (FC) Finish Application ................................................................................ 233 8.2.4 Plasma Treatment ................................................................................................................ 234
8.3 Results and Discussion ................................................................................................................. 235
8.3.1 SEM Analysis ...................................................................................................................... 235 8.3.2 ATR FTIR Analysis of Filter Media ................................................................................... 237 8.3.3 XPS ..................................................................................................................................... 240 8.3.4 Wettability ........................................................................................................................... 247
8.4 Conclusions ................................................................................................................................... 250 8.5 References ..................................................................................................................................... 251
9. Performance of coagulation/ flocculation with selected filter media ................ 255
9.1 Introduction ................................................................................................................................... 255 9.2 Filter Media Benchmarking Study ................................................................................................ 255
9.2.1 Experimental ....................................................................................................................... 255 9.2.2 Results and Discussion ........................................................................................................ 256
9.2.2.1 Average Flow Rate and Filtrate Properties ................................................................ 256 9.2.2.2 Cake Properties .......................................................................................................... 258
9.3 Filtration Performance Comparison Test ...................................................................................... 258
9.3.1 Results and Discussion ........................................................................................................ 258
9.3.1.1 Average Flow Rate and Filtrate Properties ................................................................ 258 9.3.1.2 Cake properties .......................................................................................................... 260
9.3.2 Conclusions ......................................................................................................................... 261
9.4 Coagulation/flocculation ............................................................................................................... 262
9.4.1 Experimental ....................................................................................................................... 262
9.4.1.1 Materials .................................................................................................................... 262 9.4.1.2 Model Dye Effluents .................................................................................................. 263 9.4.1.3 Coagulation/Flocculation and Filtration .................................................................... 263
9.4.2 Results and Discussion ........................................................................................................ 264
9.4.2.1 Optimisation of Flocculation Parameters ................................................................... 264 9.4.2.2 Effect of pH ............................................................................................................... 264 9.4.2.3 Effect of Pluspac 2000 and HPSS Concentration ...................................................... 265
9.4.3 Discussion ........................................................................................................................... 269
9.4.3.1 Effect of Dye Structure in Coagulation/flocculation Process .................................... 269 9.4.3.2 Effect of SSW in Coagulation/flocculation Process .................................................. 271 9.4.3.3 Effect of Dual Component System in Coagulation/flocculation Process ................... 272
9.4.4 Conclusions ......................................................................................................................... 273
9.5 References ..................................................................................................................................... 275

7
10. Recycling of Textile Wastewater and Re-use of Exhausted Dyebaths ......... 280
10.1 Introduction ................................................................................................................................... 280 10.2 Experimental ................................................................................................................................. 280
10.2.1 Materials ......................................................................................................................... 280 10.2.2 Coagulation/Flocculation and Filtration ......................................................................... 281 10.2.3 Acid Dyeing of Wool ..................................................................................................... 281 10.2.4 Dyebath Reuse and Recycling Procedure ....................................................................... 281
10.3 Results and Discussion ................................................................................................................. 282
10.3.1 Dyebath Exhaustion ........................................................................................................ 283 10.3.2 Colour Characteristics .................................................................................................... 284 10.3.3 Fastness........................................................................................................................... 291 10.3.4 Abrasion Resistance ....................................................................................................... 294 10.3.5 Tensile Strength .............................................................................................................. 295
10.4 Conclusions ................................................................................................................................... 295 10.5 References ..................................................................................................................................... 297
11. Conclusions and Future Work ......................................................................... 299
11.1 Overall conclusions ....................................................................................................................... 299
11.1.1 Simulated Seawater Dyeing ............................................................................................ 299 11.1.2 Filtration and Reuse of Dyebath ..................................................................................... 301
11.2 Further Research ........................................................................................................................... 304
Word count: 78793

8
LIST OF TABLES
Table 1.1 Typical water usage, Lkg-1
of product, in woven fabric wet processing ................ 40
Table 1.2 Water consumption in typical textile wet processing and machines ...................... 41
Table 1.3 Comparison of surface water and groundwater characteristics .............................. 42
Table 1.4 Survey of water sources used by selected European dyers and finishers in 2000 .. 42
Table 1.5 Common impurities found in freshwater and seawater .......................................... 44
Table 1.6 Dyehouse water standard ........................................................................................ 46
Table 1.7 Colour indicators in wastewater effluent ................................................................ 47
Table 1.8 Characteristics of dyeing effluents .......................................................................... 48
Table 1.9 Characteristics of textile wastewater and standard in Bangladesh ......................... 49
Table 1.10 Suggested quality requirements to achieve colourless water from recycled
textile effluent ......................................................................................................................... 50
Table 1.11 Wastewater treatment levels and processes .......................................................... 51
Table 1.12 Chromophores typically present in colorants ....................................................... 56
Table 1.13 Chemical classes of dyes ....................................................................................... 57
Table 1.14 Dye characteristics, associated fibres and method of application ......................... 58
Table 1.15 Percentage of unfixed dye that may be discharged in the effluent along with
benchmark fixation................................................................................................................... 63
Table 1.16 Particle size range for various filtration technologies ............................................ 65
Table 1.17 Effect of Weave pattern on fabric performance .................................................... 74
Table 1.18 Membrane separation process and influencing factors ......................................... 78
Table 1.19 Comparison of effluent treatment in the UK ........................................................ 83
Table 1.20 Classification of polymeric flocculants by molecular weight and size ................. 92
Table 2.1 Composition of 3.50% salinity simulated seawater .............................................. 116
Table 2.2 Composition of SSW used in this research ........................................................... 117

9
Table 2.3 Slurry used in the filtration tests ........................................................................... 119
Table 2.4 Cake rating scale used in this research................................................................... 127
Table 2.5 KES parameters for woven fabrics ........................................................................ 129
Table 3.1 Sandolan E acid dyes used in this study and their characteristics ......................... 139
Table 3.2 Lanasan CF acid dyes used in this study and their characteristics......................... 140
Table 3.3 Sandolan MF acid dyes used in this study and their characteristics ...................... 140
Table 3.4 Lanasyn S acid dyes used in this study and their characteristics ........................... 141
Table 3.5 Lanaset acid dyes used in this study and their characteristics ............................... 141
Table 3.6 Other Acid Black dyes used and their characteristics ............................................ 141
Table 3.7 Washing conditions for dyed fabrics ..................................................................... 143
Table 3.8 λmax for wool dyes in distilled and simulated saltwater solutions .......................... 144
Table 3.9 Exhaustion levels of Acid Red dyes at 0.05, 1.0 and 3.0% o.m.f. on wool ........... 150
Table 3.10 Exhaustion levels of Acid Blue dyes at 0.05, 1.0 and 3.0% o.m.f. on wool ........ 150
Table 3.11 Exhaustion levels of Acid Yellow dyes at 0.05, 1.0 and 3.0% o.m.f. on wool .... 150
Table 3.12 Exhaustion levels of Acid Black dyes at 1.0, 2.0 and 4.0% o.m.f. on wool ........ 151
Table 3.13 K/Sλmax, of Acid Red dyes at 0.05, 1.0 and 3.0% o.m.f. on wool fabric ............... 152
Table 3.14 K/Sλmax, of Acid Blue dyes at 0.05, 1.0 and 3.0% o.m.f. wool fabric .................. 153
Table 3.15 K/Sλmax, of Acid Yellow dyes at 0.05, 1.0 and 3.0% o.m.f. on wool fabric ......... 153
Table 3.16 K/Sλmax, of Acid Black dyes at 1.0, 2.0 and 4.0% o.m.f. on wool fabric ............. 153
Table 3.17 Colour difference, ΔE*94, between Acid Red, Yellow and Blue dyed wool
fabrics dyed in SSW aqueous media with DSW is being the standard. ................................. 154
Table 3.18 Colour difference, ΔE*94, between Black dyed wool fabrics dyed in SSW
aqueous media with DSW is being the standard. ................................................................... 154
Table 3.19 Fastness performance of Lanasan, Lanaset and Lanasyn dyed wool fabrics. ..... 156
Table 3.20 Fastness performance of Sandolan E and Sandolan MF dyed wool fabrics ....... 157
Table 3.21 Fastness performance of Acid Black dyed wool fabrics. ..................................... 158

10
Table 3.22 Mechanical and surface properties of wool fabrics dyed in DSW and SSW ....... 159
Table 3.23 Primary Hand Values of fabrics dyed in DSW and SSW .................................... 159
Table 4.1 Absorbance of 1.0% dye solution: before and after (without fabric) .................... 171
Table 4.2 Exhaustion (%E), Fixation quotient (%F) and Total Fixation (%T) of Lanasol
dyes at 0.05, 1.0, 3.0% and 5.0% o.m.f. on wool fabric ........................................................ 175
Table 4.3 Colour difference of comparable Lanasol dyed wool fabrics in DSW and SSW
at three stages: after dyeing; after ammonia treatment; and after wash-off. .......................... 178
Table 4.4 Comparison of fastness properties of Lanasol dyed wool fabrics ......................... 179
Table 5.1 Disperse dyes used in this research and their characteristics ................................. 192
Table 5.2 Colour strength, K/Sλmax, of Red, Yellow and Blue dyed polyester fabric at 0.05,
1.0 and 2.0% o.m.f. application levels ................................................................................... 195
Table 5.3 Colour strength, K/Sλmax, of Black dyed polyester fabric at 0.05, 1.0 and 2.0%
o.m.f. application levels ......................................................................................................... 195
Table 5.4 Colour difference, ΔECMC(2:1), between Red, Yellow and Blue dyed polyester
fabrics dyed in DSW and SSW aqueous media. .................................................................... 196
Table 5.5 Colour difference, ΔECMC(2:1), between Black dyed polyester fabrics dyed in
DSW and SSW aqueous media. ............................................................................................. 197
Table 5.6 Wash fastness and staining, dry rub fastness performance of Disperse Red and
Yellow dyes at 0.05, 1.0 and 2.0% o.m.f. depth on polyester ................................................ 199
Table 5.7 Wash fastness and staining, dry rub fastness performance of Disperse Blue and
Black dyes at 0.05, 1.0 and 2.0% o.m.f. depth on polyester .................................................. 200
Table 5.8 Alkaline perspiration fastness and staining, sublimation fastness and staining,
and light fastness performance of Disperse Red and Yellow dyes at 0.05, 1.0 and 2.0%
o.m.f. on polyester fabrics ...................................................................................................... 201
Table 5.9 Alkaline perspiration fastness and staining, sublimation fastness and staining,
and light fastness performance of Disperse Blue and Black dyes at 0.05, 1.0 and 2.0%
o.m.f. depths on polyester fabrics .......................................................................................... 202
Table 6.1 Colour strength, K/Sλmax and colour difference of dyed nylon fabrics at 0.05, 1.0
and 2.0% o.m.f. of applied metal complex dyes .................................................................... 213
Table 6.2 Fastness performance of Lanasan, and Acidol dyed nylon 6,6 fabrics .................. 215
Table 7.1 K/Sλmax and ΔE*94 of cationic dyes at 0.05, 1.0 and 3.0% o.m.f. ............................ 225

11
Table 7.2 Comparison of fastness properties of cationic dyes ............................................... 225
Table 8.1 Modification of Azurtex media and its modification details ................................. 232
Table 8.2 Average wet pick-up % of original and fluorinated Azurtex media ...................... 234
Table 8.3 XPS surface analysis of fluorinated and plasma treated Azurtex media ............... 243
Table 8.4 Oil/Water repellency and wetting times for treated Azurtex media. 4800s has
been the upper measurable limit ............................................................................................ 249
Table 9.1 Properties of the filter media used in the benchmarking study .............................. 256
Table 9.2 Properties of permeate for benchmarking testing .................................................. 257
Table 9.3 Performance properties of cake for benchmarking test ........................................ 258
Table 9.4 Properties of permeate after filtration process, a value of 1000 NTU was the
upper measurable limit ........................................................................................................... 260
Table 9.5 Properties of cake after filtration ........................................................................... 261
Table 10.1 Colour strength, K/Sλmax, of Lanaset Blue 2R, λmax at 610nm, and Sandolan
Red MF-GRLN, λmax at 510nm, dyed wool fabric. ................................................................ 285
Table 10.2 Fastness properties of Lanaset Blue 2R dyed wool at different stages of dyeing
(Bold indicates dyeing stage after filtration) .......................................................................... 291
Table 10.3 Fastness properties of Sandolan Red MF-GRLN dyed wool at different stages
of dyeing................................................................................................................................. 292
Table 10.4 Turbidity at different stages of filtration for Sandolan Red MF-GRLN dye,
Tap water 0.59 NTU, DSW 0.21 NTU, SSW 1.63 NTU, a value of 1000 NTU was the
upper measurable limit. .......................................................................................................... 293
Table 10.5 Average abrasion resistance of wool dyed fabric in reused dyebath ................... 294

12
LIST OF FIGURES
Figure 1.1 Distribution of freshwater in the world in 2007 .................................................... 37
Figure 1.2 Available freshwater for use on earth .................................................................... 38
Figure 1.3 Water withdrawal a) by source and b) sector in Bangladesh.................................. 39
Figure 1.4 Consumption of water in a) textile industry; b) wet processing industry ............. 40
Figure 1.5 Regions of corrosion with metals and alloys in seawater ....................................... 43
Figure 1.6 Potential chemical releases in textile dyeing and finishing, redrawn from ........... 47
Figure 1.7 Discharge of textile wastewater in Bangladesh a) direct discharge to water
flow b) stream of wastewater towards the river ...................................................................... 49
Figure 1.8 Evolution of world apparel fibre consumption, in million tons ............................ 54
Figure 1.9 Global share of textile fibre in 2009 ...................................................................... 54
Figure 1.10 Chemical structures of some chromophores ......................................................... 56
Figure 1.11 Example of chemical structure of dyes ................................................................. 57
Figure 1.12 Particle collection mechanisms ............................................................................ 67
Figure 1.13 Conventional cake filtration, a) typical process; b) flow over time ..................... 68
Figure 1.14 Cross-flow filtration, a) typical process; b) flow over time ................................. 72
Figure 1.15 Classification based on the structure of filters ..................................................... 73
Figure 1.16 Mechanisms of membrane fouling, a) concentration polarisation; b)
adsorption; c) gel layer formation d) complete blocking; e) standard blocking; f)
intermediate blocking .............................................................................................................. 81
Figure 1.17 FC repellent finish on fibre surface. ..................................................................... 87
Figure 1.18 Structures of the cationic polyelectrolytes: PDADMAC, polymers from
epichlorohydrin and dimethylamine (ECH/DMA), CPAM, chitosan and Anionic PAM. ...... 92
Figure 1.19 Visualisation of the double layer .......................................................................... 94
Figure 1.20 Net interaction curve according to the DVLO theory . ........................................ 95
Figure 1.21 The bridging flocculation model ......................................................................... 96

13
Figure 1.22 The charge patch agglomeration model ............................................................... 97
Figure 2.1 SEM micrograph of a cross-section of Primapor Blue filter, showing the upper
layer of microporous polyurethane coating combined with the polypropylene woven
support (x 400 magnification) ................................................................................................ 118
Figure 2.2 Structures of PDADMAC (polydiallyldimethylammonium chloride) and
cationic aluminium polymer - the active components of Pluspac 2000................................. 119
Figure 2.3 Hydrosolanum PSS-copolymer of hydrolysed vegetable protein and
polystyrene sulphonate ........................................................................................................... 120
Figure 2.4 Schematic diagram of a filtration apparatus used in this study ............................ 121
Figure 2.5 Associated image for cake disposal rating used in this research. Since rating 5
is an unbroken flat cake it is not included here. ..................................................................... 128
Figure 2.6 Water droplet on a surface .................................................................................... 131
Figure 3.1 Classification of wool dyestuffs in relation to migration and fastness ................ 138
Figure 3.2 Structure of acid dyes used in this study a) Everacid Black LD CI Acid Black
172; b) Sandolan Yellow E-2GL CI Acid Yellow 17; c) Lanaset Blue 2R- CI Acid Blue
225; d) Lanaset Yellow 2R CI Acid Yellow 220. .................................................................. 142
Figure 3.3 Graph of Sandolan Rubylon E-3GSL dye absorbance versus concentration in
water, λmax 512nm . ................................................................................................................. 145
Figure 3.4 Graph of Lanaset Black B dye absorbance versus concentration in water with
dyebath auxiliaries, λmax 583nm ........................................................................................... 145
Figure 3.5 SEM micrographs of dyed wool fabric washed in a) 2 gL-1
detergent at room
temperature for 10 minutes in SSW, magnification x 1.0 K; b) 2 gL-1
detergent at 70°C
for 10 min in SSW, magnification x4.0 K. ............................................................................ 146
Figure 3.6 SEM X-ray microanalysis of dyed wool that had been washed in 2 gL-1
detergent at room temperature for 10 minutes in DSW. ........................................................ 147
Figure 3.7 Wool Fabrics Dyed with Lanasyn Black S dye: left dyeing in DSW and right
dyeing in SSW a) 1.0% o.m.f.; b) 4.0% o.m.f. ...................................................................... 151
Figure 4.1 Chemical structure of (a) C.I. Reactive Red 84; (b) C.I. Reactive Blue 69; (c)
C.I. Reactive Yellow 39 . ....................................................................................................... 166
Figure 4.2 Chemical structure of Albegal B ......................................................................... 167
Figure 4.3 Reactive dyeing profile for wool and post-washing process ................................ 167

14
Figure 4.4 Graph of Lanasol Red 6G dye absorbance versus concentration in distilled
water, λmax 499nm and in simulated seawater λmax 496nm ..................................................... 169
Figure 4.5 Graph of Lanasol Red 6G dye absorbance versus concentration ......................... 170
Figure 4.6 Blank dyeing of wool (with no dyes), (a) DSW, before dyeing; (b) SSW,
before dyeing; (c) DSW, after dyeing, λmax, 300nm, A, 0.4; (d) SSW, after dyeing, λmax,
300nm, A, 0.3. ........................................................................................................................ 171
Figure 4.7 Dye solutions of DSW and SSW at 3.0% o.m.f., before dyeing and exhausted
dyebath after full dyeing cycle, a) DSW before dyeing; b) DSW after dyeing; c) SSW
before dyeing; and d) SSW before dyeing. ............................................................................ 172
Figure 4.8 Dye solutions of DSW and SSW at 5.0% o.m.f., before dyeing and exhausted
dyebath after full dyeing cycle, a) DSW before dyeing; b) DSW after dyeing; c) SSW
before dyeing; and d) SSW before dyeing. ............................................................................ 173
Figure 4.9 Dye solutions of SSW after full dyeing cycle without fabric, a) at 3.0% o.m.f.;
b) 5.0% o.m.f. ......................................................................................................................... 173
Figure 4.10 Effect of DSW and SSW on the mass of the dyed fabric at 0.05%, 1.0%,
3.0% and 5.0% o.m.f. depth compared to undyed fabric of 295.0 gm-2
................................ 174
Figure 4.11 K/Sλmax values of wool dyed with Lanasol Blue 3G dye in DSW and SSW ....... 177
Figure 4.12 K/S values of wool dyed in Lanasol Red 6G dye in DSW and SSW. ................ 177
Figure 4.13 K/Sλmax values of wool dyed in Lanasol Yellow 4G dye in DSW and SSW ...... 178
Figure 4.14 Tensile strength in warp direction of wool dyed fabric in DSW and SSW at
0.05%, 1.0%, 3.0% and 5.0% o.m.f. application levels compared to blank dyed fabric ....... 180
Figure 4.15 Tensile strength in weft direction of wool dyed fabric in DSW and SSW at
0.05%, 1.0%, 3.0% and 5.0% o.m.f. application levels compared to blank dyed fabric ....... 181
Figure 4.16 Abrasion resistance of wool fabric dyed in DSW and SSW at 0.05%, 1.0%,
3.0% and 5.0% o.m.f. application levels compared to undyed fabric .................................... 183
Figure 5.1 Chemical structure of PET fibre ........................................................................... 190
Figure 5.2 Structure of Dianix Yellow 4GSL-FS 400 dye (C.I. Disperse Yellow 227) ........ 192
Figure 5.3 Dyeing profile for Dianix, Dispersol and Terasil Dyes ....................................... 193
Figure 5.4 SEM micrograph of polyester fibres, a) after reduction clearing and cold rinse
in DSW; b) reduction cleared in SSW and rinsed in DSW .................................................... 203

15
Figure 5.5 SEM X-ray microanalysis of dyed wool that had been reduction cleared, acid
washed and then, washed in 2 gL-1
detergent at room temperature for 10 minutes in DSW
. ............................................................................................................................................... 204
Figure 6.1 Graph of Lanasan Red CF-WN dye absorbance versus concentration in
distilled water, λmax 498nm ..................................................................................................... 210
Figure 6.2 Exhaustion levels of Lanasan CF dyes at 0.05, 1.0 and 2.0% o.m.f. on nylon..... 212
Figure 6.3 Exhaustion levels of Acidol KM dyes at 0.05, 1.0 and 2.0% o.m.f. on nylon ..... 212
Figure 7.1 Molecular structure of (a) C. I. Basic Blue 41; (b) C. I. Basic Red 46; and (c)
C. I. Basic Yellow 45 . ........................................................................................................... 220
Figure 7.2 Dyeing profile for acrylic fabrics ......................................................................... 221
Figure 7.3 Graph of C. I. Basic Blue 41 absorbance versus concentration in DSW, λmax
608nm. .................................................................................................................................... 221
Figure 7.4 Graph of C. I. Basic Red 46 absorbance versus concentration in DSW, λmax
531nm. .................................................................................................................................... 222
Figure 7.5 Graph of C. I. Basic Yellow 45 absorbance versus concentration in DSW, λmax
440nm. .................................................................................................................................... 222
Figure 7.6 The effect of salt on the equilibrium sorption of cationic dyes on acrylic
fibres.. ..................................................................................................................................... 223
Figure 7.7 %E of Cationic dyes at different depths ............................................................... 224
Figure 8.1 Images of Fluorinated Azurtex filter membrane: a) untreated; b) Az 2%F2, 10';
c) Az 10%F2 batch 1; and d) Az 10%F2 batch 2. ................................................................... 233
Figure 8.2 SEM micrographs of fluorinated untreated PP fabric and Azurtex media at
different fluorination levels: a) Untreated PP, base fabric, magnification x 1.0K; b)
Untreated Azurtex, magnification x 1.0K; c) Az 2% F2, 10′, magnification x 2.0K; and d)
Az 10% F2, magnification x 1.0K. ......................................................................................... 236
Figure 8.3 SEM micrographs of modified Azurtex media at 2.0K magnification: a) Az
Ito; b) Az 2%F2, 10' Ito; c) Az 10%F2, Ito; and d) Az P2i std. .............................................. 237
Figure 8.4 ATR FTIR spectra of untreated Azurtex media ................................................... 238
Figure 8.5 ATR FTIR spectra of Fluorinated FC treated Azurtex medias............................. 239
Figure 8.6 ATR FTIR spectra of Fluorinated and FC treated Azurtex media ....................... 239
Figure 8.7 ATR FTIR spectra of Plasma treated Azurtex media ........................................... 240

16
Figure 8.8 Widescan XP spectra of Fluorinated Azurtex filter media ................................... 241
Figure 8.9 Widescan XP spectra of Itoguard FC treated fluorinated Azurtex filter media ... 241
Figure 8.10 Widescan XP spectra of plasma treated Azurtex filter media ............................ 242
Figure 8.11 C(1s) XP spectra of untreated Azurtex filter media ........................................... 244
Figure 8.12 C(1s) XP spectra of fluorinated Azurtex filter media: a) Az 2%F2, 2'; b) Az
2%F2, 10'; c) Az 5%F2, 2'; d) Az 5%F2, 10'; and e) Az 10%F2 . ............................................ 245
Figure 8.13 C(1s) XP spectra of Itoguard treated fluorinated Azurtex filter media: a) Az
Ito; b) Az 2%F2, 2', Ito; c) Az 2%F2, 10', Ito; d) Az 5%F2, 2', Ito; e) Az 5%F2, 10', Ito;
and f) Az 10%F2, Ito. .............................................................................................................. 246
Figure 8.14 C(1s) XP spectra of plasma treated Azurtex filter media: a) P2i std; b) P2i 1°;
and c) P2i 2°. .......................................................................................................................... 247
Figure 8.15 Relationship between contact angles and (CF2+CF3)/C(1s) in modified
selected filter media ............................................................................................................... 250
Figure 9.1 Average flow rate of Azurtex and proprietary filter media. ................................. 257
Figure 9.2 Average flow rate of modified Azurtex filter media ............................................ 259
Figure 9.3 Effect of pH on dye removal on SSW dyebath. Coagulation/flocculation with
12 gL-1
Pluspac 2000 and 8 gL-1
HPSS .................................................................................. 265
Figure 9.4 Removal of Lanaset Blue 2R dye with different concentration of PP2000 and
HPSS at different pH .............................................................................................................. 266
Figure 9.5 Colour removal and turbidity as a function pH for Lanaset Blue 2R dye with
15 gL-1
Pluspac 2000 and 10 gL-1
HPSS (turbidity of original dye solution was 46.2
NTU). ..................................................................................................................................... 266
Figure 9.6 Removal of Sandolan Red MF-GRLN dye with different concentration of
PP2000 and HPSS in gL-1
at different pHs.. .......................................................................... 267
Figure 9.7 pH effect on turbidity after coagulation/flocculation for Sandolan Red MF-
GRLN dye at different ratio of Pluspac 2000 and HPSS in gL-1
. .......................................... 268
Figure 9.8 Colour removal and Turbidity in a function of pH for Sandolan Red MF dye
with 15 gL-1
Pluspac 2000 and 15 gL-1
HPSS. ...................................................................... 269
Figure 10.1 Exhaustion, %E, of Lanaset Blue 2R dye at different stage of dyeing, λmax at
588nm, in SSW. ..................................................................................................................... 283
Figure 10.2 Exhaustion, %E, of Sandolan Red MF-GRLN dye at different stage of
dyeing, λmax at 494nm, in SSW .............................................................................................. 284

17
Figure 10.3 ∆ECMC (2:1) plots for fabrics dyed with Lanaset Blue 2R dye with no filtration
of the dyebath ......................................................................................................................... 286
Figure 10.4 ∆ECMC(2:1) plots for fabrics dyed with Lanaset Blue 2R dye with filtration
after the 3rd
reused dyebath .................................................................................................... 286
Figure 10.5 ∆ECMC (2:1) plots for fabrics dyed with Lanaset Blue 2R dye with filtration
after 4th
reused dyebath .......................................................................................................... 287
Figure 10.6 ∆ECMC(2:1) plots for fabrics dyed with Lanaset Blue 2R dye with filtration
after the 5th
reused dyebath .................................................................................................... 287
Figure 10.7 ∆ECMC (2:1) plots for fabrics dyed with Sandolan Red MF-GRLN dye with no
filtration .................................................................................................................................. 288
Figure 10.8 ∆ECMC (2:1) plots for fabrics dyed with Sandolan Red MF-GRLN after
filtration of the 3rd
, 6th
, and 9th
reused dyebath ..................................................................... 288
Figure 10.9 ∆ECMC (2:1) plots for fabrics dyed with Sandolan Red MF-GRLN after
filtration of the 4th
, and 8th
reused dyebath ............................................................................ 289
Figure 10.10 ∆ECMC(2:1) plots for fabrics dyed with Sandolan Red MF-GRLN after
filtration of the 5th
and 10th
reused dyebath ........................................................................... 289
Figure 10.11 Turbidity results of reused dyebath with no filtration. ..................................... 293
Figure 10.12 Tensile strength of weft of wool dyed fabric in SSW at 3.0% (o.m.f.) depth
compared to blank dyed fabric ............................................................................................... 295

18
LIST OF SCHEMES
Scheme 1.1 Fluorination Process .......................................................................................... ..84
Scheme 1.2 Mechanism of coagulation with aluminium-based coagulants ........................... 90
Scheme 3.1 Mechanism of wool and acid dye ....................................................................... 138
Scheme 3.2 Effects of anions on water absorbency ............................................................... 148
Scheme 3.3 Effects of cations of chlorides on water absorbency .......................................... 148
Scheme 4.1 Possible formation of groups after nucleophilic and addition reactions with
Lanasol reactive dye and wool .............................................................................................. 165
Scheme 4.2 Possible further reactions of wool and Lanasol reactive dyes ........................... 181
Scheme 4.3 Formation of thi-irane ring due to thiol-disulphide interchange reaction .......... 182
Scheme 10.1 Sequence of recycling stages in acid dyeing reuse process .............................. 282

19
LIST OF EQUATIONS
Equation 1.1
60
Equation 1.2 60
Equation 1.3
60
Equation 1.4
61
Equation 1.5
61
Equation 1.6 61
Equation 1.7
69
Equation 1.8
69
Equation 1.9 ( ) 69
Equation 1.10
( )
69
Equation 1.11
( ) 69
Equation 1.12
( )
70
Equation 1.13
( )
70
Equation 1.14
70
Equation 1.15 ( )
( ) 70
Equation 1.16
70
Equation 1.17
( )
70

20
Equation 1.18
( )
71
Equation 1.19
71
Equation 1.20
71
Equation 1.21
71
Equation 2.1 ( )
121
Equation 2.2 ( )
122
Equation 2.3 ( ) ( )
122
Equation 2.4 [(
)
(
)
(
)
]
123
Equation 2.5 ( )
124
Equation 2.6 ( )
124
Equation 2.7
127
Equation 2.8 ( )
127
Equation 2.9
132
Equation 4.1 ( ⁄
)
( ⁄
) 168
Equation 4.2
168

21
LIST OF NOTATIONS
A/A after ammonia treatment
A/D after dyeing
A0 absorbance of solution before filtration or before dyeing
Af absorbance of solution after filtration
A/W after wash-off
c mass of solid per unit volume of suspending liquid (kg)
C0 concentration of dye initially in solution (gL-1
)
Cs concentration of dye in solution after dyeing (gL-1
)
D1, D2… consecutive dyeing 1, 2….
dp dynamic (hydraulic) pressure difference across thickness
dx thickness of porous filter medium (m)
dw unit mass of solid deposited
%E percentage exhaustion
%F degree of fixation or fixation quotient
k cake permeability (m2)
K absorption coefficient
K0 Kozeny constant
K/S colour strength
( ⁄
) colour strengths of the dyed samples before washing
( ⁄
) colour strengths of the dyed samples after washing
L cake thickness (m)
m wet to dry cake mass ratio
p liquid (filtrate) pressure (Pa)
po operating pressure (Pa)
q superficial liquid velocity (ms−1
)
R proportional reflectance of the dyed fabric
Rm medium resistance m−2
Rc resistance of cake m-2
s particle mass fraction of suspension
S scattering coefficient

22
S0 specific surface area of the particles
t time (s)
%T percentage of total dye fixed or fixation ratio
V cumulative filtrate volume per unit medium surface area (m)
w cake mass per unit medium (or bowl) surface area (kgm−2
)
x distance away from medium (m)
Greek letters
α specific cake resistance (mkg−1
)
αav average specific cake resistance (mkg−1
)
molar absorbtivity with units (Lmol-1
cm-1)
λmax maximum wavelength (nm)
ΔC* difference in chroma
ΔE colour difference
ΔH* difference in hue
ΔL* difference in lightness/darkness value
Δp pressure gradient
Δpc pressure drop across cake (Pa)
ΔPm pressure drop across medium (Pa)
µ fluid viscosity (Pas)
ρ filtrate density (kgm−3
)
ρs filtrate density (kgm−3
)

23
ABBREVIATIONS
AATCC American Association of Textile Chemists and Colorists
ADMI American Dye Manufacturers Institute
AOX Adsorbable Organic Halogens
ASTM American Society for Testing and Materials (ASTM)
ATV Abwasser Technishe Vereinigung (Waste Water Technical
Association), Germany
BOD Biological Oxygen Demand
CD Charge density
CIE Commission Internationale de l’Eclairage
CMC Colour Measurement Committee
COD Chemical Oxygen Demand
CSIRO Commonwealth Scientific and Industrial Research Organisation
DLVO Theory Derjaguin, Landau, Verwery and Overbeek Theory
DSW Distilled water
ED Electrodialysis
EPA US Environmental Protection Agency
FC Fluorocarbon
HPSS Hydrosolanum polystyrene sulphonate
INDA Associations for Nonwoven Fabric Industry
KES-F Kawabata Evaluation System for Fabrics
MF Microfiltration
NF Nanofiltration
NTU Nephelometric Turbidity Units
OECD Organisation for Economic Co-operation and Development
o.m.f. On the mass of fabric
PAC Polyaluminium chloride
PAM Polyacrylamide
PDADMAC Polydiallyldimethylammonium chloride
PET Polyethylene Terephthalate
PHV Primary Hand Value
PP Polypropylene

24
RO Reverse osmosis
SAE Society for Automotive Engineers
SDC Society of Dyers and Colourists
SEM Scanning Electron Microscope
SSW Simulated Seawater
THV Total Hand Value
UF Ultrafiltration
VOC Volatile Organic Compound
XPS X-ray Photoelectron Spectroscopy

25
ABSTRACT
The aim of this research was to find a suitable alternative medium for scarce freshwater
for textile dyeing, and to recycle and reuse the dyebath using a combined
coagulation/flocculation and microfiltration technique. Simulated seawater (SSW) was
tested as the alternative dyeing medium with a salt concentration of 3.5% where NaCl
was the major component.
Fibre/dye systems of wool/acid and metal complex, wool/reactive, polyester/disperse,
nylon/acid and metal complex, and acrylic/cationic dyes were tested in simulated
seawater and the performances of dyed fabric were compared to conventional dyeing
system of distilled water (DSW). The study found that commercial dyeing processes were
robust and can be practically transferable into the seawater medium. The dye exhaustions,
build-up, colour characteristics, and fastness to wash, cross-staining, rub and light were
satisfactory within the dye ranges studied, which covers commercially available
monochromatic Red, Yellow and Blue at light, medium and deep shades. Although SEM
micrographs didn’t show any presence of salt, a typical wash-off process of 1gL-1
with a
non-ionic detergent at 70°C was sufficient to remove any salt that could be present on the
surface or sub-surface of the dyed fabric.
At room temperature, some acid and metal complex dyes were only partially soluble in
SSW but this improved with gentle heating and addition of levelling agents. At dyeing
temperatures near the boil, these dyes were completely soluble. A saturation limit was
found to be existed for acrylic dyeing of cationic dyes over 1.0% o.m.f. depth. Although
ionic interaction was the dominant mechanism for dyeing of wool, nylon and acrylic fibre
with acid, metal complex and cationic dyes, the adsorption in highly saline dyebath most
likely depended on the combined effects of ionic and physical/hydrophobic interactions.
The resultant effect was higher dye exhaustion and consequently higher colour difference
in SSW for some dyes. Reactive dyes are known to be sensitive to the hardness of water
but this study confirmed the viability for deep dyeing for wool fibre in SSW. Reactive
dyeing of wool followed a similar mechanism of gradual phase transfer as was observed
for disperse dyeing of hydrophobic fibres over 3.0% o.m.f. depth. In contrast disperse
dyeing of polyester produced consistent results for all dyes but some black dyeings

26
produced superior colour strength in SSW. The build-up of colour in SSW compared to
DSW can be different depending on the application level.
To improve permeate flux by reducing membrane fouling, a number of surface
modification were carried out to introduce fluorine based functional groups. Gaseous
fluorination, fluorocarbon finish (FC) and plasma polymerisation were performed to
introduce hydrophilic and oleophobic properties on supplied Azurtex media. The
fluorinated Azurtex media exhibited increased wettability although it was not directly
proportional to an increase in the fluorination level and treatment time. The water and oil
repellency of FC and plasma treated filter media provided a reasonable level of
repellency while the contact angle remained in the range of 130 to 145°. Pre-fluorination
of filter media before FC treatment didn’t change the water and oil repellency.
Surface characterisation of Azurtex media was performed with ATR-FTIR, XPS and
SEM. An increased level of fluorination at 10% F2 and prolonged gaseous exposure
showed a degradation of the surface along with colour change. The fluorinated, FC
treated and plasma polymerised membrane showed a typical C-F stretching vibration in
the region of 1100-1350 cm-1
and weakly at 400-800 cm-1
. The XPS study showed a
gradual increase in the -CF2 and -CF3 functionality signal intensities that resulted in
imparting hydrophobicity The benchmarking of these modified Azurtex filter media
against newly developed materials proved that plasma treatment improved the flow,
reduced turbidity and provided an easy cake removal compared to fluorinated and FC
finished filter media.
Recycling of exhausted dyebath using a dual component coagulant/flocculant system of
Pluspac 2000 and polyanionic Hydrosolanum protein derivative (HPSS) and
microfiltration with Azurtex filter media was investigated. The process parameters such
as pH and dosage of coagulants/flocculants were very critical during
coagulation/flocculation for overall colour removal. The trial with model dye solution in
SSW showed that the system worked in the saline environment with a relatively high
concentration ratio of coagulant/flocculants but highly depends on the class and structure
of dyes. Maximum colour removal was achieved for Lanaset Blue 2R and Sandolan Red
MF-GRLN dye and was 89% and 61%, respectively, based on a ratio of 15:10 and 15:15
for PP2000: HPSS at pH 4.0 and 5.0, respectively.

27
The reuse of the dyebath with combined physicochemical and microfiltration treatment
was demonstrated to be feasible with wool/acid dye system. The colour profile of Lanaset
Blue 2R and Sandolan Red MF-GRLN dyed fabrics up to 12th
dyeing, with dyebath
filtration undertaken after the 3rd
/4th
/5th
reuse of the dyebath, remained comparable to
dyeing in fresh baths. The colour strength, K/S, of dyed fabric decreased after every
filtration and the colour differences, ΔE* increased, but reversed in subsequent dyeing in
reused dyebath. The wash and dry rub fastness of the dyed fabrics remained comparable
and significant improvements in the abrasion resistance were observed.

28
DECLARATION AND COPYRIGHT
The experiments in this project constitute work carried out by the candidate and no
portion of the work referred to in this thesis has been submitted in support of an
application for another degree or qualification at this or any other university or institute
of learning.
The author of this thesis (including any appendices and/or schedules to this thesis) owns
any copyright in it (the “Copyright”) and he has given the University of Manchester the
right to use such Copyright for any administrative, promotional, educational and/or
teaching purposes.
Copies of this thesis, either in full or in extracts, may be made only in accordance with
the regulations of the John Rylands University Library of Manchester. Details of these
regulations may be obtained from the Librarian. This page must form part of any such
copies made.
The ownership of any patents, design, trademarks and any and all other intellectual
property rights except for the Copyright (the “Intellectual Property Rights”) and any
reproductions of copyright works, for example graphs and tables (“Reproductions”),
which may be described in this thesis, may not be owned by the author and may be
owned by third parties. Such Intellectual Property Rights and Reproductions cannot and
must not be made available for use without the prior written permission of the owner(s)
of the relevant Intellectual Rights and/or Reproductions.
Further information on the conditions under which disclosure, publication and
exploitation of this dissertation, the Copyright and any Intellectual Property Rights and/or
Reproductions described in it may take place is available from the Head of School of
Materials.

29
THE AUTHOR
Mohammad Abbas Uddin graduated as a Textile Technologist from Bangladesh
University of Textiles, previously College of Textile Technology under The University of
Dhaka, in 2002. From then onward, he has been working in various capacities in the
textile and apparel supply chain.
After graduation, he joined the Textile and Apparel Division of Bangladesh Export
Import Company Limited, (previously known as Beximco Textiles Ltd.) one of the
largest South Asian vertically integrated textile and garment companies. After two
months intensive industrial training in yarn dyeing, woven and knit fabric dyeing and
finishing, and weaving/knit fabric production, he joined as a Quality Assurance officer in
the woven fabric processing segment. He was promoted later to the Design and Product
Development, which showcased the range of fabrics and garments at international fairs
and to respective buyers. As part of the job he produced fabric CADs, and successfully
developed those designs from initial stages to the final finishing stages. He carried out
chemical and mechanical tests of fabrics, solved online technical problems, and often
suggested creative solutions for intended products for retailers like M&S, Zara, PVH. He
actively helped Beximco laboratory to gain Oeko-Tex certificates and M&S
accreditation. Subsequently he joined to Interfab (BD) Ltd., an M&S approved garment
production site, and a sister concern of Viyellatex group, where he was responsible for
the creation of the product development department and diversified the product ranges
from school shirts to fashion products. He executed orders and followed up until
shipment.
In 2005 he was selected for prestigious Australian Development Scholarship (ADS) for
his Masters of Design course in Curtin University of Technology. He conducted his
dissertation titled, ‘Readymade Garment Industry of Bangladesh: How the industry is
affected in post MFA period?’ under Prof. Dr. Suzette Worden, which involved
questionnaires and interviews of factories in Bangladesh. He achieved a ‘High
Distinction’ grade and graduated within the top 2% of his class.
He returned to Bangladesh and joined in Primeasia University as a faculty member. He
taught undergraduate theory and laboratory classes in Dyeing and Finishing, textile raw

30
materials, textile testing and quality control, introduction to ready-made garment industry
of Bangladesh. He directed and supervised various projects during his time on
improvement of dyeing, how to achieve right first time dyeing (RFT), filtration with
natural materials and dyeing with natural colours to name a few.
In 2009 he was awarded a prestigious Commonwealth Scholarship from the British
government for conducting his PhD at the University of Manchester under the
supervision of Prof. Chris Carr and Dr. Muriel Rigout. He won Best Poster in
Postgraduate Conference 2011 and presented as plenary speaker in 2012. Apart from his
research as daily activities, he also worked as a Teaching Assistant in various textiles
labs, Facilitator for problem based learning for cases of sustainable development, Skills
for Sustainability and Social Responsibility (SSSR) and Interdisciplinary Sustainable
Development (ISD), for Manchester Business School and Electronics and Electrical
Engineering department. He also holds a position as Associate Editor of Bangladesh
Textile Today, the first Bangladeshi Textile publication.
Professional Affiliations:
Member, The Textile Institute, Manchester, UK
Member, Institute of Engineers of Bangladesh (IEB)
Member, Institute of Textile Engineers and technologists (ITET), Bangladesh
List of publications/Conferences:
Uddin, M. A., C. Carr, and M. Rigout. The use of seawater as dyeing medium for
commercial textile processing. Accepted for conference presentation to 2nd
Annual
International Conference on Water, 2014, 14-17 July 2014, Athens, Greece.
Uddin, M. A., C. Carr, and M. Rigout. Investigation of acrylic/cationic dye system in
simulated seawater. Accepted for conference presentation to 6th
International Istanbul
Conference on Future Technical Textile, FTT 2014, 15-17 Oct; Istanbul, Turkey.
Uddin, M. A., C. Carr, and M. Rigout. Reuse of dyebath in simulated seawater medium
for wool/acid dye system. Accepted for poster presentation to Ozwater'14 conference,
Australia's International Water Conference & Exhibition, 2014, 29 Apr-1 May; Brisbane,
Australia.

31
Uddin, M. A., C. Carr, and M. Rigout. Bulk trial of nylon dyeing in simulated seawater
Dyeing. Plenary speaker at Postgraduate research conference in School of Materials, The
University of Manchester, 2012, 17-18 May; Manchester, UK.
Uddin, M. A., C. Carr, and M. Rigout. Seawater Dyeing of Textiles: A possible solution.
Poster Session presented at Postgraduate Conference in School of Materials, The
University of Manchester, 2011, 18-20 May; Manchester, UK.
Uddin, M. A., C. Carr, and M. Rigout. Investigation of the use of novel filtration media
for colouration processing and recycling of textile effluent. Paper presented at
Postgraduate research conference in School of Materials, The University of Manchester,
2010, 20-21 May; Manchester, UK.

32
ACKNOWLEDGEMENT
It is a great pleasure for me to thank my supervisor Prof Chris Carr. It has been a good
experience to work under his supervision for the last three years. I have always been
benefited from his excellent scientific knowledge, constructive comments and solutions
to problems that I faced during laboratory work. His support, guidance and incessant
encouragement were invaluable all through the first year of work. I would also like to
thank my co-supervisor Dr. Muriel Rigout for her helpful suggestions and guidance in the
thesis work and ideas for the future.
I would also like to express my sincere gratitude to Dr. Huw Owens for the technical
discussion on colour physics and assistance on interpreting data.
I am very thankful to the following technical staffs in the Textile Department for their
training and assistance: Mr. Phil Cohen, Ms. Alison Harvey, Mr. Adrian Handley and Ms.
Xiangli Zhong.
I am grateful to Dr. Richard Lydon, VP Technology and Business Development at Clear
Edge Filtration, for supplying the filter media, filter bomb and for his suggestions and
arrangement for the trainings. I would also like to thank Mr. Joe Johnson, laboratory
technician for his technical support.
I wish to express my gratitude to all my colleagues for creating an excellent research
environment and to all my friends for their friendship and support.
I would like to thank Commonwealth Scholarship Commission for their financial support
through commonwealth scholarship.
In addition, I wish to thank my family, especially my mother Hosney Ara Begum, for
their support and love to my cause. I indebted to my wife, Farida Yasmin, who has taken
the most pains during my final year. My late father, Md. Abdul Manan would have been
proud to see this work.

33
Dedication
To my late father Md. Abdul Manan
and
mother Hosney Ara Begum

34
THESIS OVERVIEW
The main purpose of this thesis was to find a suitable alternative medium of dyeing for
textiles and to recycle/reuse the exhausted dyebath with a filter media. The alternative
medium was simulated seawater, a far more bountiful resource compared to the
freshwater. The thesis was conducted mainly in two phases. In the first phase
commercially successful dye ranges were evaluated under typical textile dyeing
conditions using distilled water and simulated seawater, and the performances of the dyed
fabrics assessed. Since dyeing in seawater would probably need a filtration process prior
to use in dyeing, a commercial Azurtex filter media from Clear Edge Ltd. was assessed as
a possible pre- and post-filter media.
The main body of the thesis starts with the introduction of the water resources and their
availability in the world. This is followed by an overview of the consumption of water in
textiles, and generated wastewater and their treatment methods. Textile fibres and dyes
and dyeing processes are discussed in terms of exhaustion and dye fixation. Literature
reviews on filtration, membrane process and surface modification of the filter media are
extensively discussed in Chapter 1. The composition of simulated seawater, materials and
the experimental approaches used are discussed in Chapter 2. The methods of
modification of the filter media and performances of modified filter media are also
discussed in this chapter.
The main experimental works of five fibre/dye systems using a simulated seawater
environment and their results are evaluated in Chapter 3 to 7. These fibre/dye systems
are: wool/acid and metal complex, wool/reactive, polyester/disperse, nylon/acid and
metal complex, and acrylic/cationic. A bulk trial of nylon fabric was also performed. In
addition to the results, the objectives, materials and experimental designs are also
included at the beginning of each chapter.
The modification and performance of Azurtex are assessed in Chapter 8 to 10. The
modified microfilter media are evaluated with a view to reducing membrane fouling and
increase permeate flow. The characterisation of the modified filters and their performance
is benchmarked against the new Azurtex media, Chapter 8 and 9. Before the
microfiltration, a dual component coagulation/flocculation was carried out with Pluspac

35
2000 and HPSS in order to determine the optimum concentration and pH. Based on these
results, laboratory saline wastewater was filtered after a coagulation/flocculation process
with commercial agents followed by microfiltration, Chapter 10. The filtered wastewater
was reused in dyeing and its properties/performance is compared to reused aqueous baths
with no filtration.
Finally, overall conclusions are drawn, and future work is suggested at the end of this
thesis in Chapter 11.

Literature Review
36
1. Literature Review
The need for freshwater for human consumption is a comparable environmental
challenge to that of climate change and is high on the international development agenda.
An abundant supply of clean water is necessary for many industrial activities and the
textiles industry has traditionally been one of them. The textile industry is also a
chemically intensive industry as water is the carrier medium for the wet processing [1].
The consumption of freshwater for textile processing is significant and provides the
need for the ongoing search for alternative processing media and optimization of the
existing processes [2]. Therefore, two approaches were set for this study: firstly, to
establish the potential use of the more abundant seawater as dyeing medium instead of
freshwater; secondly, to examine the performance of filter media for treatment of textile
dyeing effluent by surface modification. As a result, this study addresses two inter-
related issues, one the scarcity of freshwater for textile processing and secondly the
recycling and reuse of textile wastewater. Consequently a proper understanding of
freshwater, sources of water, impurities and their removal, and a knowledge of textile
wastewater is essential for this study and in general.
1.1 Introduction to the Water Resource
1.1.1 Water Reserves on Earth
Freshwater is a vital natural resource for plant irrigation, wildlife survival, and human
consumption. The 2010 report by World Health Organization/United Nations Children's
Fund Joint Monitoring Programme on water supply and sanitation stated that 884
million people, mostly from the developing regions do not receive their drinking water
from acceptable sources and that 3.3 million people die from the water related health
problems [3]. According to a UN report on Water, it was estimated that, by 2025, two
thirds of the population would suffer from a lack of water resources in agriculture,
energy, domestic purposes, and the environment, with a threshold limit, defined as 1700
m3/person/year [4]. Figure 1.1 shows the distribution of freshwater in the world, where
the scarcity of water is severe particularly for developing countries or regions, with an
availability of 500m3/person/year in a group of 1.8 billion people. In the Middle East,
water is already in short supply [5].

Literature Review
37
Figure 1.1 Distribution of freshwater in the world in 2007 [5]
The quantity of freshwater on the earth's surface is constant. Seawater consists of 97.4%
of total water while freshwater contributes only of 2.6%, Figure 1.2 indicates that for

Literature Review
38
every litre of water on the earth's surface just 26 mL is freshwater. However, this
amount of freshwater is not available for use, rather only 0.6% is economically
accessible for humans through ground, rivers, or rainwater [6].
Figure 1.2 Available freshwater for use on earth [6]
Consumption of freshwater increased six fold between 1900 and 1995, more than
double the expected considering population growth. In the EC, approximately half the
countries representing 70% of the population are facing a water shortage and the
situation requires a comprehensive management of water supply and demand. In India, a
large number of villages are facing inland salinity with a recurring water shortage
problem. China is classified as one of the 13 poorest water shortage countries in the
world [7].
In developing countries, 85% of freshwater is extracted from grounds or rivers and is
used in agriculture [8]. In China, the overdraft rate of groundwater for irrigation exceeds
25%, and in parts of northwest India it is over 56% [9]. In the UK, the cost of mains
water supply in 2000/01 was around £0.70/m3 while private supply from reservoirs is
around £0.10/ m3. Water softening can add a further £0.10 per m
3 [10]. Water UK [11]
has estimated that the average cost of the water supply has increased more than three
fold in last 15 years from 1984-85 to 1999-2000.
The factors related to the water shortage in developing countries are extremely complex
and often interrelated. High growth of the population, lack of investment in
infrastructure and scarcity of natural water resources all play their part simultaneously
in the water shortage [12].

Literature Review
39
1.1.2 Water Reserves for Bangladesh
Bangladesh has been called the ‘land of rivers’. Three principal rivers have surrounded
the major plains of Bangladesh: the Ganges, Brahmaputra and Meghna, with their
tributaries the Tista, Dharla, Surma and Kushiyara and the Karnafully [13]. These river
systems drain into the Bay of Bengal through the mainland of Bangladesh, with the
main port being Chittagong [14].
The rivers are a significant source of water, but they are in many cases unusable due to
the pollution. In 2008, approximately 79% of the total water supply came from
underground sources, Figure 1.3a, with agriculture being the biggest sector user of
freshwater, around 88%, Figure 1.3b. Even though, the ratio of water usage has not
changed in last two decades for industry (2% in 2008 and 1990) [15], the overall
consumption rate has been increased from 14.6 km3 in 1990 to 35.87 km
3 in 2008. As a
result, the extraction of water has dramatically increased but without any significant
replenishment of the water reserves.
Figure 1.3 Water withdrawal a) by source and b) sector in Bangladesh. Total water
withdrawal was 35.87 km3 in 2008
1.1.3 Water Consumption in Textiles
Textile processing, particularly dyeing and finishing is a water intensive process.
Almost all dyes, specialty chemicals, and finishing chemicals are applied to textile
substrates from water baths. Rinsing and washing consumes further large amounts of
water together with steam still being the main heat transfer media for dyeing &
finishing.
21%
79%
Surface water
Goundwater
a)
88%
10%
2%
Irrigation and
livestock
Municipalties
Industry
b)

Literature Review
40
Table 1.1 Typical water usage, Lkg-1
of product, in woven fabric wet processing [16]
Subcategory Minimum Median Maximum
Simple processing 12.5 78.4 275.2
Complex processing 10.8 86.7 276.9
Complex processing plus desizing 5.0 113.4 807.9
Table 1.1 showed that the textile operations vary considerably in water consumption
depending on the complexity of processing and the steps required to fulfil the end use,
the equipment used, and the prevailing management philosophy concerning water use.
In general the ratio of water consumption in a factory depends on the everyday use to
processing needs, Figure 1.4. Wool and felted fabric processes are more water intensive
than other processing sub-categories such as wovens, knits, stock, and carpet [17].
Water use can also vary widely between similar operations. For example, a knit-dyeing
factory uses an average of 120 L of water for 1 kg of cotton dyeing with reactive dye,
yet usage of water ranges from a low of 70 L to a high of 200 L [18]. Orhon, Kabdasli
and others [19] reported that Turkish factories require 20–230 L of water to produce 1
kg of textile fabric.
Figure 1.4 Consumption of water in a) textile industry; b) wet processing industry [20]
72%
8%
8% 6% 5% 1%
Wet processing
Sanitary
Water treatment for specific purpose
Cooling water
Steam production
Fire fighting
a)
1% 2% 5%
4% 13%
3% 2%
70%
Desizing Scouring
Bleaching Mercerising
Dyeing Printing
Finishing Several Intermediate
b)

Literature Review
41
Water consumption varies considerably among unit processes, Figure 1.4b, and
intermediate washing stages after the each unit processes are the more intensive steps.
Within the dyeing category, certain unit processes are particularly low in water
consumption such as pad/batching. Different types of processing machinery use
different amounts of water, Table 1.2, particularly in relation to the liquor ratio in
dyeing processes.
Wet processing, therefore, is considered a critical component in textile manufacturing
because of its frequent use and strong economic impact. Manufacturers increasingly
focus their attention on reducing water consumption, which leads to subsequent energy
and hot water savings and consequently a reduction in wastewater.
Table 1.2 Water consumption in typical textile wet processing and machines [21]
Dyeing machine/process Water consumption (Lkg-1
)
Beam 167
Beck 234
Jet 200
Jig 100
Paddle 292
Skein 250
Stock 167
Pad-batch 17
Package 184
Continuous 167
Indigo range 8 to 50
1.1.4 Sources of Water
Dyehouses are usually located in areas where the natural water supply is sufficiently
fresh and plentiful. Water mainly comes from surface or underground from a depth of at
least 50 ft below the surface depending on the availability of the reserve. Rain, rivers
and melting snow are a few of the sources that recharge the supply of underground
water. Due to the many sources of recharge, groundwater may contain any or all of the
contaminants found in surface water as well as the dissolved minerals it collects during

Literature Review
42
its long stay underground. A comparison of characteristics of surface and ground water
is given in Table 1.3. The physical and chemical characteristics of surface water may
vary frequently e.g. drought and flood or over extended period of time. In comparison,
ground water is very stable and depends on the strata. A high iron content in
groundwater may contain surface reducing bacteria, which is a source of fouling and
corrosion in industrial water systems [22].
Table 1.3 Comparison of surface water and groundwater characteristics [22]
Characteristic Surface Water Groundwater
Turbidity high low
Dissolved minerals low-moderate high
Biological content high low
Temporary variability very high low
Table 1.4 shows the survey results carried out in 2000 by CRIET (the European Textile
Finishers’ Organisation) which found that in Europe and the UK the patterns of water
extraction are the same, reflecting geographical proximity as necessary for the selection
of water sources [18].
Table 1.4 Survey of water sources used by selected European dyers and finishers in
2000 [23]
Water source %
Country Main supply River Ground
Austria 12 88 0
Belgium 6 17 77
Germany 10 0 90
Denmark 58 7 35
France (1999) (1) (99) (0)
UK 10 0 99
Italy 6 5 89
The Netherlands 19 29 52
Turkey (1999) (50) (0) (50)
Weighted average* 16 9 75
*values obtained in 2000 only

Literature Review
43
In general, source water for usage in dyehouses comes from either surface or ground
water. Surface waters mainly require treatments which reduce turbidity, colouration and
the concentration of organic substances, while groundwater requires treatments aimed at
eliminating alkaline earth metals, iron and manganese.
1.1.5 Effect of seawater on industrial processing
Water is ‘the universal solvent’ as it can dissolve every natural substance to some
degree. The nature of this solvency poses major threats such as corrosion [22]. The
impact of corrosion on the economy and environment is huge which includes
infrastructure, oil and gas rigs, bridges, highways, chemical processing, and water and
wastewater systems [24]. Corrosion reduces the lifetime of assets, requires high
maintenance and causes severe damage and increases the risk of public safety. The
annual cost of corrosion is US$2.2 trillion, equivalent to the 3% of the world’s GDP
[25].
Figure 1.5 Regions of corrosion with metals and alloys in seawater
The presence of large amounts of inorganic salts e.g. chlorides and associated high
conductivity results in seawater being highly corrosive [26]. The oxygen present in
marine environments, in the surface region and sometimes at greater depths exacerbates
the corrosion. Corrosion by seawater is an electro-chemical process, where under acid
or alkaline pH seawater generates an electrical potential (or corrosion potential) with
metals and alloys [22, 27]. Figure 1.5 shows the regions of free metal corrosion; the
region of passive corrosion where stable oxide or other films cause quiet corrosion; the
Pote
nti
al (
Volt
s)
Pitting
Corrosion
Passivity
Immune
0 7 14
pH

Literature Review
44
region of pitting where corrosion potential of metal overcomes that of its oxides; and
the region of immunity where the metal is usually resistant to corrosion [27]. Seawater
desalination plants are particularly prone to corrosion problems, as in addition to the
aggressive marine environment, movement of liquids containing particulates or deposit
forming liquids could be involved. The localised corrosion such as pitting and crevice
corrosion are quite common [28]. The common impurities that are found in freshwater
and seawater along with their associated difficulties are given in Table 1.5.
Table 1.5 Common impurities found in freshwater and seawater [27]
Constituent Difficulties Caused
Hardness: Ca2+
,
Mg2+
salts
Main source of scale in boiler, pipe lines, heat exchange
equipment etc.; interferes with dyeing and other processing
Alkalinity: HCO3-,
CO32-
, and OH-
Creates foam, carries solids with steam; embrittlement of boiler
steel; causes corrosion in condensate as produces CO2 in steam
CO2 corrosion in steam and condensate lines
Cl - Increases solids content and corrosiveness of water
O2 Corrosion of water lines, heat exchange equipment, boilers, pipes
Fe2+
, Fe3+
Discolours water on precipitation; source of deposits in boilers,
water lines etc.; interferes with dyeing, tanning, papermaking, etc.
SO42-
Forms calcium sulphate scale
NO3- Adds to solids content, useful for control of boiler metal
embrittlement
Na+ Adds to solids content of water: when combined with OH-, causes
corrosion in boilers under certain conditions
SiO2 Scale in boilers and cooling water systems
Mn2+
Same as iron
AI3+
Deposits in cooling systems, contribute to complex boiler scales
H2S Corrosion, cause of "rotten egg" odour
NH3 Corrosion of Cu/Zn alloys by formation of complex soluble ion
Free mineral acid Corrosion
Dissolved Solids Process interference at high concentrations and cause of foaming
in boilers
Suspended Solids Deposits in boilers, heat exchange equipment, water lines, etc.

Literature Review
45
Corrosion in seawater can be controlled by painting or coating, using corrosion
inhibitors, changing the pH of the local environment, using more corrosion resistant
material or composites [27]. The corrosion behaviour of stainless steel, carbon steel, α-
aluminium bronze, titanium, copper-nickel alloys, copper alloys and composites in
natural seawater has extensively studied [28, 29, 30, 31, 32, 33, 34]. Modern day
industrial equipment which used in marine applications are copper-nickel alloys with
different ratios because these materials provides corrosion resistance, good electrical
and thermal conductivities and ease of fabrication of the equipment [35]. The 90/10
copper-nickel alloy is particularly suitable for desalination plant where seawater is used
as a coolant for condensers and heat exchangers [36, 37]. These alloys are resistant to
corrosion cracking by ammonia and sulphide ions [38] and to pitting and crevice
corrosion [39]. A guideline of using copper-alloys in seawater has also been established
[40].
1.1.6 Water Quality for Textile Processing
The raw material that is used in the greatest quantity in virtually every stage of textile
wet processing is water. There are several key categories to be considered for
processing, utilities, potable and laboratory use of water. Each requires different water-
quality parameters. Process water (for preparation, dyeing, and finishing) is mainly used
for making concentrated bulk chemical stock solutions, substrate treatment solutions,
and washing. Potable water is for drinking and food preparation. Utility use includes
non-contact applications uses such as boiler use, equipment cleaning etc. [41].
Consistent water quality plays a significant role in the success of textile wet processing
operations. Water from almost all supply sources contains impurities to some extent.
The type and amount of impurities in water depend upon the type of water source.
Generally, process water should have little or no chlorine, low metals content (i.e. iron
and copper) and low salts concentrations (i.e. chloride and sulphate) and acceptable
water hardness. The established requirements of the water used in textile processing are
given in Table 1.6.

Literature Review
46
Table 1.6 Dyehouse water standard [42]
Characteristic Permissible Limit
Colour Colourless
Smell Odourless
pH value Neutral pH 7–8
Water hardness < 5 dH (6.25eH; 8.95fH; 5.2USA)
Dissolved solids < 1 mgL-1
Solid deposits < 50 mgL-1
Organic substances < 20 mgL-1
(KMnO4 consumption)
Inorganic salts < 500 mgL-1
Iron (Fe) < 0.1 mgL-1
Manganese (Mn) < 0.02 mgL-1
Copper (Cu) < 0.005 mgL-1
Nitrate ( NO3-) < 50 mgL
-1
Nitrite ( NO2- ) < 5 mgL
-1
Contaminants from the water source are not the only materials found in textile water
supplies. There may be substantial internal contamination from such sources as the grey
substrate, machinery, plumbing and valves and prior treatment of water [43].
1.2 Textile Wastewater [44, 45, 46, 47]
The amount of wastewater generated by the textile industry is significant with the
colour of the water channels providing a crude indicator of the quality of the water,
Table 1.7. Industrial waste is one of the main reasons for changing of the original water
colour, and the textile industry was notorious for producing such change [44]. Textile
mills produce huge amounts of effluent; particularly the textile wet processing industry.
In 2003, industrial wastewater generated in China was about 21.2 billion m3/year, of
which textile industry wastewater amounted to 1.6 billion m3/year [45].

Literature Review
47
Table 1.7 Colour indicators in wastewater effluent [18]
Colour Problem Indicated
Grey None
Red Blood or other industrial wastes
Green, yellow Industrial wastes (e.g., paints) not pre-treated
Red or other soil colour Surface runoff into influent; industrial flows
Black Septic conditions or industrial flows
As previously discussed, among the wet processes, dyeing and finishing are responsible
for 80% of the total wastewater generated [46]. Figure 1.6 summarizes the potential
chemicals that can be released during textile wet processing except heat-setting which
doesn’t involve any chemicals during the processing, Figure 1.1.
Little or no wastewater generated
VOCs, BOD from water-soluble packaging waste; sizes e.g. PVA, starch, lint; yarn waste; cleaning lubricants; biocides; etc.
VOCs, scouring solvents, NaOH; detergents, fats; oils; pectin; wax; knitting lubricants; spin finishes; spent solvents
H2O2, sodium silicate or organic stabilizer; AOX or chlorine by product, high pH
High pH; NaOH
VOCs, metals; salt; surfactants; toxics; organic processing assistants; cationic materials; colour; BOD; COD; sulphide; acidity/ alkalinity; spent solvents
VOCs, BOD; COD; suspended solids; toxics; spent solvents
Cotton or cotton blends
Singeing
Desizing (only for woven)
Scouring
Bleaching
Mercerizing (optional)
Dyeing and/or printing
Mechanical and/or Chemical Finish
Finished fabric
100% Synthetic
Scouring
Heat setting
Potential release in wastewaterWater* use
(Lkg-1)
--
3-9
26-43
3-124
232-308
16-22
10-15
Figure 1.6 Potential chemical releases in textile dyeing and finishing, redrawn from [48]

Literature Review
48
The types of chemical release depend on the number of processing steps and the
corresponding application process; hence pollution loads can be related to specific
dyeing applications, Table 1.8. A common feature is that modern dyes are highly stable
to external agents such as chemical compounds or light. Therefore, removal of colour
can be difficult, and low concentrations of dyes are visible [47].
Table 1.8 Characteristics of dyeing effluents [47]
Dye Fibre Colour
(ADMI)
BOD
(mgL-1
)
TOC
(mgL-1
)
TSS
(mgL-1
)
TDS
(mgL-1
) pH
Acid Nylon 4000 240 315 14 2028 5.1
Cationic Acrylic 5600 210 255 13 1469 4.5
Direct (copper
treated)
Cotton 525 87 135 41 2763 5.0
Reactive (Batch) Cotton 3890 0 150 32 12500 11.2
Reactive
(Continuous)
Cotton 1390 102 230 9 691 9.1
Sulphur
(Continuous)
Cotton 450 990 400 34 2000 3.7
Vat Cotton 1910 294 265 41 3945 11.8
Disperse (high
temp)
Polyester 1245 198 360 76 1700 4.2
ADMI: American Dye Manufacturers Institute, BOD: Biological Oxygen Demand; COD:
Chemical Oxygen Demand; TOC: Total Oxygen Content; TSS: Total Suspended solid; and
TDS: Total Dissolved Solid
1.2.1 Textile Wastewater in Bangladesh
In Bangladesh, most of the textile effluents go directly to the public sewerage, river,
lands or other surface channels, Figure 1.6. The effect of wastewater is enormous as
freshwater is getting even scarcer, crop production is decreasing, and fish and livestock
are now endangered species.

Literature Review
49
Figure 1.7 Discharge of textile wastewater in Bangladesh a) direct discharge to water
flow b) stream of wastewater towards the river [49]
Accordingly the Ministry of Environment and Forestry of Bangladesh has now
produced water standards for the ever growing textile dyeing and finishing industry,
Table 1.9, however, maintaining that standard is far reaching.
Table 1.9 Characteristics of textile wastewater and standard in Bangladesh [50]
Parameters Typical values found Standard
Appearance Colloidal -
pH 8-10 6-9
Colour Intensively coloured -
Suspended solids (ppm) 200 – 300 150*
Heavy Metals (ppm) 10 – 15 Varies depending on
type
Total Dissolved Solids TDS (ppm) 5000 – 6000 2100
Chemical Oxygen Demand COD (ppm) 1500 – 1750 200
Biochemical Oxygen Demand BOD5
20°C (ppm) 500 – 600 50
Oil & Grease (ppm) 40 – 60 10
Sulphide as S (ppm) 50 – 60 1
Wastewater Flow of fabric processing 120-200 Lkg-1
100 Lkg-1
*BOD limit of 150 mgL-1
will be applicable only for physicochemical processing
method
a) b)

Literature Review
50
1.2.2 Effluent Treatment Methods [51, 52, 53, 54, 55, 56, 57, 58, 59]
Textile wastewater pollution can be reduced in three ways: (1) by using new and less
polluting technologies; (2) by treating effluent effectively to conform to specified
discharge requirements; and (3) recycling effluent through different processes several
times before discharge [51], and this latter approach is considered the most practical
solution [52, 53]. The quality requirement for recycled water depends on the end use.
Reusing for washing and rinsing would require less-pure freshwater while for dyeing a
fresh quality of water is regarded as essential. Hoehn [54] has further suggested a
chemical specification of recycled water, Table 1.10.
Table 1.10 Suggested quality requirements to achieve colourless water from recycled
textile effluent [54]
Parameter Level
pH Neutral
COD < 20–50 mgL-1
Total hardness < 90 ppm (as CaCO3)
Iron < 0.1 ppm
Chromium < 0.1 ppm
Copper < 0.005 ppm
Aluminium < 0.2 ppm
Inorganic salts < 500 mgL-1
Effluent can be treated in various ways depending on the pollution load and the levels of
treatment required. These levels are known as preliminary, primary, secondary and
tertiary. The mechanism of treatment can be divided into three broad categories:
physical, chemical and biological, under which there are a number of different
processes, Table 1.11. A single treatment plant consists of different level of treatment,
combining two or more as required.

Literature Review
51
Table 1.11 Wastewater treatment levels and processes [55, 56]
Treatment
level
Description
Process
Preliminary Removal of large solid, equalisation,
neutralisation
Physical
Primary Removal of floating materials, undissolved
chemicals and particulate matters
Physical and chemical
Secondary Removal of biodegradable organic matter Chemical and
Biological
Tertiary Removal of dissolved solids, ions, suspended
solids
Biological and/or
Membrane
Treatment and source is preferred rather than end of pipe treatment [57] and can reduce
the overall flow and complexity of the effluent [58, 59]. The estimated dye
concentration for end-pipe treatment is 10-800 gL-1
while after dyeing the effluent is
highly concentrated. The most important methods that are widely used for effluent
treatments are listed below and discussed in more details in subsequent sections:
Coagulation, flocculation and precipitation methods;
Oxidation methods;
Adsorption methods;
Biological methods;
Membrane methods.
1.2.2.1 Coagulation, Flocculation and Precipitation [45, 60, 61]
Coagulation and flocculation are widely used in diverse applications, which includes
biochemistry, rubber and cheese manufacturing, and in water and wastewater treatment
[60]. This is the first step, in most cases, in an effluent treatment plant. In the process,
adjustment of pH or treatment with some inorganic or organic chemical causes
precipitation of impurities to form microflocs. Flocculation then aggregates these
microflocs into larger particles. As a result, a large amount of sludge is produced, which
is then removed by flotation, settling or other physical techniques. The subsequent
disposal of the sludge, which may also contain hazardous chemicals, may have some
restrictions on its disposal.

Literature Review
52
The common coagulants used are alum, iron salts, lime, and other organic polymers
[61] and typically has almost no effect on the elimination of soluble dye. However,
recent developments in organic polymer and polyelectrolytes have improved colour
removal significantly [45]. The process will be discussed in details in Section 1.10.
1.2.2.2 Oxidation Methods [45, 62, 63, 64]
Oxidation techniques are widely used for treatment of wastewater, particularly for
discolouration, sterilization and for biological treatments [45]. A variety of oxidation
techniques can be used for decolouration of wastewater. The process could be in single
or in combinations such as ozone and UV irradiation or ozone and hydrogen peroxide,
which is widely used for industrial treatment [62]. Other oxidising agents available are
sodium hypochlorite, nitric acid and Fenton’s reagent (a solution of hydrogen peroxide
and an iron catalyst) [63].
Production of less complex and lower amounts of sludge has put oxidation treatments in
favour over other treatments. However the typical levels used can still only produce
partial discolouration of the dye loaded wastewater, does not reduce the Chemical
Oxygen Demand (COD) significantly [64] and the cost of installation is very high [63].
1.2.2.3 Adsorption Methods [65, 66, 67]
The use of adsorbents in water treatment is one of the oldest methods available. Initially
activated carbon was used as an all-purpose adsorbent [65] and used specifically to
absorb dye from solution. Since then, various other adsorbents based on inorganic,
synthetic and bio-adsorbents were introduced [66]. The adsorbents have high surface
areas and depending on the type, can absorb the high levels of dye. Nevertheless,
adsorbents are commonly used in combination with pre-treatments as suspended solids
rapidly clog the filter [67].
1.2.2.4 Biological Treatments [68, 69]
Biological processing uses the natural bacterial metabolism for degrading waste
material. There are two types of bacterial degradation, aerobic (in presence of free
oxygen) and anaerobic (without oxygen, reduction process) [68]. In the aerobic process,
liquid waste is fed into the microorganism system, and air is passed through for multiple

Literature Review
53
growth cycles. The anaerobic process is advantageous as the end product are gases like
methane and carbon dioxide, with very little amount of solid waste. Nevertheless, the
process is more difficult to control as the bacteria are distinctly different to the aerobic
types and highly sensitive to oxygen. In addition, the initial investment is very high and
generation of greenhouse gases is potentially problematical. The two most common
biological processes are through activated sludge and biological filtration. Since dyes
are manufactured to achieve better fastness, most of them have low biodegradability,
and as a result, in many cases the activated sludge process is less effective [69].
1.2.2.5 Membrane Processing [70]
Membranes are the most popular method individually and in combination can be used
for "in-process" treatment rather than so called "end-of-pipe" treatment. The choice of
membrane process depends on the quality of the final products and is discussed further
in Section 1.8 . In this study only coagulation/flocculation and membrane separation are
of interest.
1.3 Textile Fibres
The demand for textile products has continued to grow with the per capita consumption
in the world increasing from 3.7 kg to 11.1 kg in 1950 to 2007, Figure 1.8 [71]. The rate
of consumption of textiles increased by 35% between 2000 and 2007 but declined 4.3%
in 2008 which was equivalent to 2.9 million tons. In 2010 demand rose again to a record
of 69.7 million tons, a 7.4% increase. Despite reaching these record levels in 2010, the
per capita consumption was still lower than 2007; a steady decline to 10.5 kg, 10.4 kg in
2008 and 2009, respectively which partially recovered in to 11.0 kg in 2010. The
consumption levels also varied between developed and developing countries: 13% and
20% between 2007 and 2010, respectively [72].

Literature Review
54
Figure 1.8 Evolution of world apparel fibre consumption, in million tons [72]
The total volume of natural and manmade fibres that are used in textiles and nonwovens
was over 70 million tonnes in 2009 and the share of natural to man-made fibres was
around 44:56, Figure 1.9. The relative proportion of polyester fibre continues to grow
[73] while natural fibre production is gradually approaching its plateau limit of around
32-35 million tonnes per year [74]. The annual production of cotton and wool is around
25 and 1 million tonnes, respectively, with a share of 36% and 2%, respectively, of the
total production of textile fibres [75, 76]. However it is accepted that the two major
fibre types are cellulosics and polyester and provide a focus for textile recycling.
Figure 1.9 Global share of textile fibre in 2009 [73]
36%
2%
0.4%
45%
5%
3% 4%
5%
0%
Cotton
Wool
Silk
Polyester
Polyamide
Acrylics
Polypropylene
Cellulosics
Others

Literature Review
55
1.4 Textile Dyes [45, 77, 78, 79, 80, 81, 82]
Colouration of textiles is perhaps as old as human civilization itself and the colorant is
the key component for imparting colour to textiles and other products. There are two
types of colorants, i.e. dyes and pigments, which differ in their methods of application,
nature, performance and processing [77]. Natural dyes dominated the colouration
industry until the mid-19th
century, when in 1856 Perkin first discovered the process of
chemically synthesizing dye. Subsequently and within 50 years synthetic dyes
accounted for more than 90% of dyes used [45]. In contrast pigments are water
insoluble and mostly used for plastics, paints, printing inks. Pigments are commonly
used in textile printing in combination with a polymer binder or in mass colouration by
melt spinning [45].
The 38,000 new dye products that has been named, but only 8000 of them have a
different structure and of those only 4000 have commercial and technical importance
[78]. The rapid growth of dyestuffs was possible due to the development of new
precursor materials, adding functionality or through improved synthetic manufacturing
routes [79]. The estimated global annual production of dyestuff is 700,000 tonnes [80]
and two thirds of the market is accounted for by the textile industry [81]. Traditionally
synthetic dyes were manufactured from coal tar, but these days are derived from the
petrochemical industries. The raw materials, such as benzene, toluene, xylene,
naphthalene etc., are converted into dye intermediates through chemical reactions such
as oxidation, reduction, halogenation, nitration, sulphonation etc. followed by various
chemical reactions in multi-stage batch processes [82]. Essentially the dye provides the
colour in the visible region, can be applied to a substrate/medium and have some kind
of bonding with the textile substrate.
1.4.1 Characteristics of Dyes [45, 78, 83]
Otto Witt in 1876 first formulated his theory which established the relationship between
colour and the structure of the dye molecule and proposed that the dye chromogen
consisted of a chromophore and auxochrome. Chromophores are the colour bearing
group containing an unsaturated conjugated system, whose presence gives colour to the
molecule. Some of the most widely used chromophores are given in Figure 1.10 and

Literature Review
56
Table 1.12 and identify the hues associated with the chromophore.
Nitroso Azo P- quinoide O-quinoide
Figure 1.10 Chemical structures of some chromophores
Table 1.12 Chromophores typically present in colorants [83]
Hue Typical Chromophore
Brilliant yellow Methine; Coumarins, Pyridone
Yellow Nitrodiphenylamine, Heterocyclic, Azo with pyridone couplers
Orange Azo
Red Azo, Anthraquinone, Benzodifuranone
Pink Anthraquinone
Violet Azo, Anthraquinone
Blue Azo, Anthraquinone, Thiophene
Black Azo
Auxochromes are used to intensify colours even though they alone cannot produce
colour. They could be salt producing groups and hence could be acidic (-OH, -COOH, -
SO3H) or alkaline (-NHR, -NH2, -NR2) in nature. Some of these auxochrome groups
such as –SO3H may also help to solubilise dye.
1.4.2 Classification of Dyes [45, 78, 84]
Dyes and pigments were first catalogued by the Society of Dyers and Colourists, (SDC)
and the Colour Index was first published in 1924. The recent edition is jointly published
by the SDC and AATCC. The main classification is done by the chemical structure of
dyes and its application method.

Literature Review
57
1.4.2.1 Based on Chemical Constitution [45, 78]
Classification based on chemical structure is particularly of interest to the chemists and
virtually unlimited as new structures are continuously added to the ranges. Some of the
chemical classes are illustrated in Table 1.13 and Figure 1.11
Table 1.13 Chemical classes of dyes [45, 78]
Azo dyes Polymethine dyes Thiazole
Anthraquinone dyes Stilbene dyes Diphenylmethane
Heterocyclic dyes Sulphur dyes Azine
Indigoid dyes Triphenylmethane dyes Vinylsulphone
Nitro dyes Polymethine dyes Chlorotriazinyl
Phthalocyanine dyes Hydroxyketone
Azo Anthraquinoid Azine
Triphenylmethane Stilbene Phthalocyanine
Figure 1.11 Example of chemical structure of dyes
1.4.2.2 Based on Application Method [45, 78]
The dye application methods are quite varied, but in all cases the dye has to be soluble
in water at some point in the dyeing cycle. Water is the universal medium of dyeing and
some of the dyes are readily soluble while some are solubilised through chemical
Ar N N Ar'
O
O
N
N
+H
H
N
N
N
N
N
N
N
NH
H

Literature Review
58
modification. The classification based on the method of application is appropriate for
the dyers:
Water Soluble: Acid, Cationic, Reactive, Direct, Solubilised Vats, Optical
brighteners;
Water Insoluble: Vat, Sulphur, Disperse, Mordant;
Ingrain dyes: Azoic dye, Oxidation and Mineral Colours.
The basic characteristics of different dyes and their relations with the substrate are
presented in Table 1.14.
Table 1.14 Dye characteristics, associated fibres and method of application [85]
Class Characteristics Substrates Method of application
Acid Anionic, water
soluble
Nylon, wool, silk Usually from neutral to acidic
dyebaths
Cationic Cationic, water
soluble
PAN, modified
nylon, polyester
Applied from acidic dyebaths
Direct Anionic, water
soluble
Cotton, rayon,
leather, nylon
Applied from neutral or slightly
alkaline baths containing
additional electrolytes
Disperse Low water
solubility
Polyester,
polyamide,
acetate, plastic,
acrylic
Fine aqueous dispersions often
applied by high temperature
pressure or lower temperature
carrier methods
Reactive Anionic, water
soluble
Cotton, wool,
silk, nylon
Reactive site on dye reacts with
functional groups on fibre to bind
dye covalently under the influence
of heat and pH (alkaline)
Sulphur Colloidal,
insoluble
Cotton, rayon Aromatic substrate vatted with
sodium sulphide and re-oxidized
to insoluble sulphur containing
products on fibre
Vat Colloidal,
insoluble
Cotton, rayon Water-insoluble dyes solubilised
by reduction with sodium
hydrosulphite, then exhausted on
fibre and re-oxidized

Literature Review
59
1.5 Textile Dyeing [45, 77, 86]
Dyeing is the application and fixing of dye to a substrate, normally with the intention of
obtaining an even distribution throughout the substrate. Dyeing is mostly a
physicochemical process and in some cases a chemical process as well and involves
essentially a transport phenomenon, in which dye molecules leave one medium such as
water, emulsion or solvent and enters the fibre structure. For dyeing, generally four
forms of energy are normally employed: Chemical (through bonding with the fibre),
thermal (high temperature), mechanical (fabric transport in a stationary dyeing bath),
the fluid (for example circulation of dye liquor through a stationary textile material in
package form) [77].
1.5.1 Theory of Dyeing [45, 86]
The dyeing process is essentially a distribution process: the dye is distributed over at
least two phases or phase systems: dyebath or dye solution and the substrate i.e. textile
material. The theory of dyeing is used to explain phenomena such as [86]:
The state of dyes in solution or dispersion in the dyebath and the substrate
during and after dyeing;
Effects occurring at the dye–substrate interface;
Kinetics of diffusion of dye molecules into the substrate matrix;
Thermodynamics of the dye–substrate equilibrium; and
Interactions between dye molecules and fibrous polymer segments.
The entire dyeing process can be divided into a number of stages as shown [45]:
Transfer of dye molecule from dyebath to the fibre surface;
Adsorption of dye molecule on the surface of the fibre;
Diffusion of the dye from the surface to the interior of the fibre;
Interaction of dye molecule with the fibre by ionic, covalent or hydrogen bonds,
or other forces of physical nature.
These successive stages of dyeing are described below:
Transport of dye to the fibre surface: the first step of dyeing is for the dye to come
into contact with the textile substrate. Therefore, dye should be in a soluble molecular

Literature Review
60
state in the dyebath. To assist in the process efficiently, the dyebath or material, or both,
are circulated or agitated. In most cases dyeing starts around 400C and dye is dosed into
the machine within a set duration of time. The part of the material that comes contact
with dye first is dyed first and therefore there is always possibility of unlevellness.
Dye adsorption at the fibre surface: fundamentally dyeing starts at the interface of
substrate and aqueous dyebath. Dye in solution reduces surface tension thus trying to
accumulate on the surface of fibre i.e. deposition on the solid surface rather than in the
fibre bulk. This is known as adsorption and is usually studied by plotting dye
concentration in the dyebath, Ds, and corresponding dye concentration in the fibre, Df, at
equilibrium, and is known as an adsorption isotherm. Three different isotherms are
recognised:
The Langmuir isotherm, which is most appropriate for hydrophilic fibres where the dye
interacts strongly with the fibre and can be represented as:
Equation 1.1
The Freundlich isotherm is used for fibres which interact weakly with the dye by
hydrogen bonding or van der Waals’ force and may be written as:
Equation 1.2
The Nernst isotherm is linear and is obtained with disperses dyes on hydrophobic fibres.
This is the simplest equation and can be expressed as . In all cases K is
constant and N is a fraction, usually 0.5.
Diffusion of Dye: Once the dye adsorbed on the fibre surface, dye starts diffusing and
penetrating into the fibre. The diffusion in the fibre is usually slowest step in the entire
dyeing process and depends on the morphological structure of the fibre. Natural fibres
have pores and synthetic fibres that create free space during dyeing show different rates
and paths of diffusion. The rate of diffusion can be expressed by Ficks law, Equation
1.3.
Equation 1.3
Where F is flux, i.e. rate of transfer per unit area of cross section;
is the concentration
gradient in section X; and D is the diffusion coefficient.

Literature Review
61
Fixation of Dyes: Fixation of the dye to the fibre is important for end-use fastness
requirements. Dye could be fixed with either physically or chemically with the fibre by
covalent, hydrogen, van der Waals’ force, ionic/salt linkage or through insolubilisation
inside the fibre.
1.5.2 Absorbance [45, 87]
Many compounds absorb visible or ultra-violet light. Therefore absorbance, A can be
defined in terms of light transmittance, T. Transmittance is expressed in Equation 1.4
with a monochromatic beam of power I0 that was directed to the sample with I radiant
power leaving behind.
Equation 1.4
Thus absorbance A can be expressed as Equation 1.5
Equation 1.5
The Beer-Lambert Law, Equation 1.6 states that there is a linear relationship between
absorbance of dye and concentration for very dilute solutions. Typically a calibration
curve of absorbance versus concentration allows the determination of the concentration
of the dye in an unknown solution, provided that the curve is linear irrespective of
composition and temperature of the solution. The calibration study requires preparation
of dye solution of known concentration and measurement of absorption at specified
wavelength.
Equation 1.6
Where is the molar absorptivity with units of Lmol-1
cm-1,
l is the path length of the
sample (cell length), and c is the concentration of the compound in solution, expressed
in molL-1
.
1.5.3 Colour Fastness
For dyers, fastness is probably the second most important parameter after the required
colour. A good dye must withstand the subsequent treatment (e.g. laundering, dry
cleaning, etc.) or environmental wearing (e.g. rubbing, light exposure, etc.). The degree
to which a dyed material can withstand such treatment is called the colour fastness,
which is the most practical importance for the consumer. In many cases, fastness is

Literature Review
62
tailor-made during the synthesis of dye. Fastness depends on the complex number of
variables such as [78]:
Molecular structure of the dye;
Manner in which the dye is bound to the fibre, or the physical form present;
Amount of dye present in the fibre;
Chemical nature of the fibre;
Presence of other chemicals in the material;
Actual conditions prevailing during exposure of any agencies.
1.5.4 Degree of Dye Fixation and Dye Loss
The degree of fixation of any individual dye varies according to type of fibre, depth, and
dyeing parameters. It has been estimated that about 450 kilotonnes of synthetic dyes are
manufactured annually worldwide, with around 9 kilotonnes (2%) and 41 kilotonnes
(41%) are wasted during manufacturing and application, respectively [88]. The extent of
dyeloss in exhausted dyebaths and wash liquors are continuously assessed with on
average, losses for deep shades typically 10%, while for medium and pastel dyeing, the
loss is about 2% for all classes of dyes [89]. Table 1.15 shows the losses of dyes in
textile wastewater assessed by different environmental agencies corresponding with the
benchmark fixation with each dye classes.

Literature Review
63
Table 1.15 Percentage of unfixed dye that may be discharged in the effluent along with
benchmark fixation
Dyestuffs EPA OECD ATV Bayer (1)
Euratex Spain Benchmark
Fixation %
Acid dyes
- for wool
- for polyamide
10
20
7 - 20
7 - 20
-
5 - 15
5 - 15
90
-
Cationic dyes 1 2 - 3 2 - 3 2 - 0 - 2 97
Direct dyes 30 5 - 20 5 - 30 10 5 - 35 5 - 20 85
Disperse dyes
- for acetate
- for polyester 1 bar
- for polyester HT
25
15
5
8 - 20
8 - 20
5
1 - 15
0 - 10
-
95
-
-
Reactive dyes (2)
- for cotton
- for wool
50 -
60
20 –
50
5 - 50
5 - 50
20 – 45
3 – 10
10 –35
70
Metal complex 10 2 - 5 2 - 5 5 2 - 15 5 - 15 94
Chrome dyes - - 1 - 2 - - 5 - 10 -
Vat dyes 25 5 - 20 5 - 20 - 5 - 30 5 - 30 90
Sulphur dyes 25 30 - 40 30 - 40 - 10 - 40 15 - 40 75
Azoic dyes 25 5 - 10 5 - 10 - 10 - 25 10 - 25 -
Source: US-EPA [16], Euratex [90], Spain [91],
EPA: US Environmental Protection Agency
OECD: Organisation for Economic Co-operation and Development
ATV: Abwasser Technishe Vereinigung (Wastewater Technical Association of
Germany)
Notes: (1)
Now Dystar (including BASF) (2)
High Fixation reactive dye is available

Literature Review
64
1.6 Introduction to Filtration [66, 70, 92, 93, 94]
Public and government concerns over the environment are creating pressure for a
reduction in energy consumption and increased fresh water provision, and filtration has
a vital role to play in delivering sustainable technologies [92]. Filters are traditionally
used in the automotive, construction, agriculture, industrial, pharmaceuticals, food,
medical, and water and beverage industries and are now impacting in biotechnology and
medicine [70].
Filtration is considered to be the separation of distinct or mixed phases [66, 70, 92, 93,
94]. The phases include solid from solid, solid from liquid, liquid from liquid, and
liquid from gas or gas from liquid. In addition some advanced membrane processes
work with molecular diffusion instead of separation of phases but still is popularly
considered as filtration. Filtration and separation achieve two crucial purposes, firstly,
to remove impurities from the mixtures as pre-determined by legal limits, and, secondly,
to recover valuable materials that can be reused or recycled, which is an important
theme for waste management.
Solid/liquid filtration is the most common due to the industrial pollution of water,
however, solid/gas filtration is also increasing due to the rapid pollution of air through
machines, automobiles or boilers exhaust gases [70]. The types of contaminant and their
concentrations in the filtration environment decide the success and failure of filtration.
1.6.1 Filtration Process [70, 92, 93]
Filtration can occur through four mechanisms, depending on the size of the solid
particle and how the solid particle is trapped in the filter media [70, 92, 93]. These are
surface straining, depth screening, depth filtration and cake filtration [70]. However,
any filtration process can occur by a combination of two or more mechanisms
depending on the circumstances present.
Filtration entirely depends on the particle size and to some extent the shape of the
particles. However, mean particle size and particle size distribution play major influence
on the filtration efficiency. Size of the particles that are filtered by the media is used to

Literature Review
65
describe various terms in the filtration process. Coarse filtration is used for separating
particles over 2 mm while fine filtration covers from 15 to 75µm, Table 1.14.
Table 1.16 Particle size range for various filtration technologies
Type Approximate size range (µm, microns)
Screening or sieving >2000
Coarse filtration 75-2000
Fine filtration 15-75
Microfiltration 0.1-15
Ultrafiltration (UF) 0.005-0.1
Nanofiltration (NF) 0.001-0.005
Reverse Osmosis (RO) 0.0001-0.0010
In any filtration process, the filter is placed along the liquid flow, which works as a
barrier to this flow. However, NF and RO operate on a different principle, with no
physical holes to trap the particulates instead one or more molecular species diffuse
through the membrane itself under high pressure. It should be noted that in this case the
solution should have no or very little suspended matter.
1.6.2 Process Fundamentals
1.6.2.1 Filter Permeability [70, 94]
Permeability refers to flow of a fluid and is reciprocal to the resistance of flow through
the filter media. High permeability means a low resistance by the filter media and vice
versa. Permeability of any medium in filtration depends on filter size, fluid temperature,
and filtration time. The higher the size i.e. the filter area and temperature, the higher
permeability of a fluid but a prolonged filtration time would reduce the permeability.
Again, it also depends on the thickness of the media, as the thicker the media, the higher
the pressure drop and in the case of asymmetric membranes, the pressure drop will vary
across the density of the media [70].

Literature Review
66
1.6.2.2 Flux
Flux is defined as the flow of fluid passing through a unit area of membrane per unit
time and is expressed in m3 per day or m/sec or Lm
-2h
-1. The flux of permeate depends
on the following factors [70]:
The membrane resistance;
Driving force per unit membrane area;
Hydrodynamic conditions at the membrane-liquid interface;
Fouling and subsequent cleaning of the membrane surface.
The general flux for membrane operation is between 10 to 1000 Lm-2
h-1
and directly
relates to the driving force and total resistance offered by the membrane.
1.6.2.3 Pressure Drop [70]
This is the measure of differential pressure between the upstream and downstream side
of the filter media and the pressure drop is inversely proportional to the filter area.
1.6.3 Filtration Mechanism
Since filtration operates by capturing particles of all sizes, there are a number of
theories to explain its action through four mechanisms: inertial impaction, interception,
diffusion or electrostatic attractions [70, 92, 95]. In many cases, multiple mechanisms
work in a single filtration process, Figure 1.12. These four mechanisms are discussed as
follows:

Literature Review
67
Figure 1.12 Particle collection mechanisms [93]
Inertial Impaction: Fluids or gases always follow the direction that is easily
accessible, however some particles, specifically larger ones or particles moving fast
have a high inertia to follow the path. Hence the particles are breaking away from the
streamlines, collide with the filter fibres and are trapped;
Direct Interception: when the streamlines bend to get around the filter fibre,
some particles with a distance less than half of its diameter from the fibre surface
become trapped on the fibre. This mechanism known as direct interception, and by
definition, it should occur on the side of the fibre and not trapped directly in front of it;
Diffusion behaviour is known as Brownian motion, where the particles,
especially the finer ones (> 0.5µm) become directly trapped across the media while
following the streamlines;
Electrostatic Attraction: when the particle and/or fibre are charged electrically
or electrostatically, and this charge is used to force the particle from streamline to the
fibre.
The dominant mechanism depends on the size of the particles. Very small particles
follow Brownian motion while large particles with more momentum are captured
through inertia. There are two distinctive mechanisms in filtration, i.e. conventional and
cross-flow filtration.
Particles

Literature Review
68
1.6.3.1 Conventional Filtration [70]
In conventional filtration fluid flows vertically through the filter media, so that all the
liquid passes through the medium and the solids are either held on the surface or trapped
inside the medium, Figure 1.13a, to form a cake. This is also called through-flow or
dead-end filtration, and in this process a heavy pressure is created over the filter
medium and separates most or all of the suspended solids. The build-up of particles
increased the thickness of the cake as the filtration proceeds [96].
Figure 1.13 Conventional cake filtration, a) typical process [96] b) flow over time
In this research cake filtration is relevant due to the use of filter media. Filtration starts
at the surface of the medium and particles deposit on the surface. After subsequent
layers of deposition, it forms a cake which itself then acts as filter medium. Particles
larger than the pore size are trapped in the surface as with surface straining until those
particles form a cake. In case of smaller particles, they can also be trapped by bridging
together at the entrance of the pore, which acts as a base to build cake particularly if the
solid concentration is higher (>2% by weight in a liquid).
The primary operating variable for cake filtration is the pressure applied. The filtration
process could be carried out under constant pressure, variable pressure i.e. P0, the
applied pressure, is a specified function of time or under constant rate [96]. The most
important factor in cake filtration is the permeate flow or the resistance of the filter cake
[97].
b) a)

Literature Review
69
a. Theory of cake filtration through porous media [96, 97, 98, 99]
The model of cake formation has been derived from Darcy’s Law (1856) which was
originally developed to describe flow of water through porous sand beds. It was found
that the flow rate is proportional to the pressure gradient and therefore Equation 1.7 was
developed to show the relationship for steady laminar flow through homogeneous
porous media:
Equation 1.7
Where is the is the dynamic (hydraulic) pressure difference across thickness dx of
porous medium of permeability k (m2), q is the superficial velocity of liquid (volume
flow rate per unit cross-sectional area of the medium, m3 m
-2 s
-1) and µ is the liquid
viscosity which was not included in Darcy's original equation.
In filtration, the law is used in modified form, where permeability, k, was replaced by
local specific flow resistance α, and the pressure gradient,
, was replaced by pressure
loss per unit mass of solid deposited,
, on the medium:
Equation 1.8
Where w is the mass of dry cake per unit filter area deposited within the distance x from
the filter medium. The mass dw and dx are related by:
( ) Equation 1.9
Where ε is cake porosity. From Equation 1.8 and 1.9, we get:
( )
Equation 1.10
The relationship between k and α is:
( ) Equation 1.11
The cake porosity and permeability are the two key factors in cake filtration. The cake
porosity, ε, is the fraction of a porous medium available for fluid flow while the cake
permeability, k, is a measure of the ease of flow of fluid through the voids. The extent
of the permeability is thus determined by the perceived openness of the filter medium.
The complex geometry of the pores present in the internal structure of the filter media is
almost impossible to describe mathematically, therefore a simplistic model of Kozeny
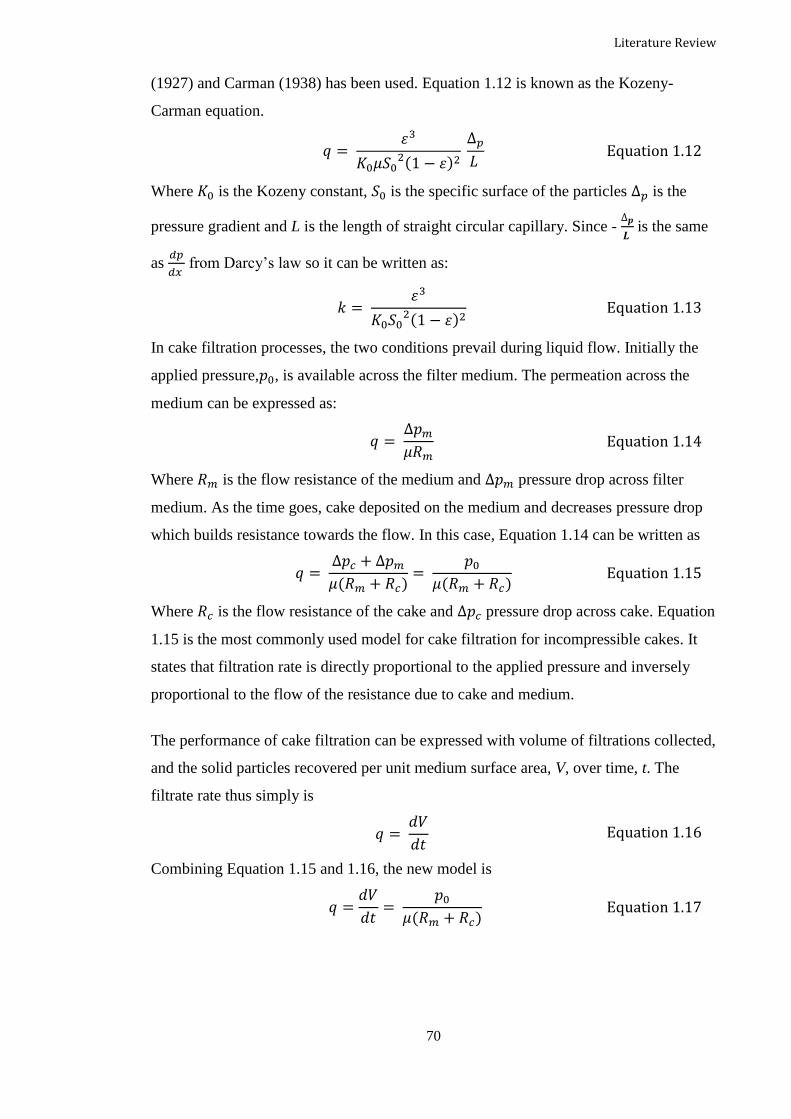
Literature Review
70
(1927) and Carman (1938) has been used. Equation 1.12 is known as the Kozeny-
Carman equation.
( )
Equation 1.12
Where is the Kozeny constant, is the specific surface of the particles is the
pressure gradient and L is the length of straight circular capillary. Since -
is the same
as
from Darcy’s law so it can be written as:
( )
Equation 1.13
In cake filtration processes, the two conditions prevail during liquid flow. Initially the
applied pressure, , is available across the filter medium. The permeation across the
medium can be expressed as:
Equation 1.14
Where is the flow resistance of the medium and pressure drop across filter
medium. As the time goes, cake deposited on the medium and decreases pressure drop
which builds resistance towards the flow. In this case, Equation 1.14 can be written as
( )
( ) Equation 1.15
Where is the flow resistance of the cake and pressure drop across cake. Equation
1.15 is the most commonly used model for cake filtration for incompressible cakes. It
states that filtration rate is directly proportional to the applied pressure and inversely
proportional to the flow of the resistance due to cake and medium.
The performance of cake filtration can be expressed with volume of filtrations collected,
and the solid particles recovered per unit medium surface area, V, over time, t. The
filtrate rate thus simply is
Equation 1.16
Combining Equation 1.15 and 1.16, the new model is
( )
Equation 1.17

Literature Review
71
The Equation 1.17can be re-written in the form of Equation 1.18 since, may assumed
to be directly proportional to the amount of cake deposited over time, therefore average
cake resistance was more significant
( )
Equation 1.18
Here V is the filtrate volume and c is the mass of solids, which can be expressed through
Equation 1.19
Equation 1.19
Where is the filtrate density, m is the moisture or liquor content defined by Equation
1.20 and s is the mass fractions of solid in the feed slurry as given in Equation 1.21.
Equation 1.20
Equation 1.21
1.6.3.2 Cross-flow Filtration
In this mode, fluid flows parallel to medium, and some of the fluid passes through the
medium due to the pressure difference between the two sides of the media, Figure 1.11b
[100]. Cross-flow filtration can be used for both sub-millimetre and sub-micron ranges
and for the former during filtration a filter cake will develop [101]. The maximum
amount of contaminants flows on and out of the filter, thus a minimum amount is
retained by the medium, which increases its service life. This filtration usually employs
surface filtration, as passing contaminants across the medium would be damaging and
would reduce the service life. To keep the filter medium free of deposits, a high velocity
can be applied across the medium, or alternatively some sort of rotation or movement of
the media would be employed. A great number of parameters influence cross-flow
filtration such as membrane pressure, layer resistance, cross-flow velocity, particle size,
form, distribution and agglomeration behaviour, surface effects of the particles etc.
[102].

Literature Review
72
Figure 1.14 Cross-flow filtration, a) typical process [96]; b) flow over time
The cross-flow filtration in some ways solves fouling, the critical problem of any filter
media [103] and thus maintains almost similar permeability throughout its lifetime.
This mechanism is now increasingly used in food, water purification, beverage, and
biotechnology industry [104].
1.7 Filter Media [92, 93, 105, 106, 107]
A filter is a device that is used to separate one substance from another and is placed in
the path of the fluid/gas flow to block/trap/isolate the target material or contaminants.
The Filtration Dictionary and Glossary defines a filter medium as:
“Any permeable material used in filtration and upon which, or within which,
the solids are deposited.”
However this definition is old and assumes the solid as the main contaminant. This
definition does not cover the array of filtration and separations that occurs currently.
Therefore a new definition has been developed:
“A filter medium is any material that, under the operating conditions of the
filter, is permeable to one or more components of a mixture, solution or
suspension, and is impermeable to the remaining components” [92].
The components that are retained are known as the concentrate/retentate and may be
solid particles, liquid droplets, colloidal material or ionic species in solution and
components that pass through are known as the permeate or filtrate, and often are fluid
or gas. The filter medium is the critical component of the filtration process from
economic and performance standpoint [105]. A variety of filter media are used for
a) b)

Literature Review
73
different application, and a range of technologies and materials are employed to meet
the ever growing demand. Figure 1.15 summarizes the classification of filter media
based on structure of filters.
Figure 1.15 Classification based on the structure of filters [106]
The mechanistic action of the filter media could be as an absorbent (i.e. sponge like
absorption of fluid e.g. paper), adsorbent (i.e. attraction at molecular level e.g.
powdered carbon) or coalescing (i.e. two immiscible liquid i.e. oil mists in water) [92].
The type of materials that can be used for filters is wide, ranging from organic (natural
and synthetic) to inorganic such as minerals, carbon, glass, metals and ceramics. These
materials can be used in all different types of format, ranging from loose, bonded or
needled felts to woven/knitted fabric to nonwovens. Woven or nonwoven textiles are
extensively used for filtration application and can be from natural sources such as
cotton or wool or from synthetic polymers such as polyester, polypropylene, PTFE or
other fine fibres such as carbon, glass, metals and ceramics [93].
The characteristics of filter medium made of textile material, therefore, inherently
depend on the type of fibre material and its associated properties. The most notable
factor is the size of the fibre/filament. Filter media made of finer fibres would retain
finer particles, but would also be the weakest. Therefore fibre choice would influence
some properties such as degree of filtration required (cut-off point and the efficiency),
pressure drop (energy consumption in the process) and mechanical strength [70]. In
addition the primary factors that influence the selection or design of the filter media
depend on [107]:
Thermal and chemical conditions;
nonwoven filter media

Literature Review
74
Filtration requirements;
Equipment considerations;
Cost.
Since both woven and nonwovens play an important role in filter media, they are
discussed further.
1.7.1 Woven fabric [70, 92, 93]
Most filter media are made of woven fabrics components. They are characterized as
being relatively less stiff compared to paper and may need some support to be used as a
filter medium. Properties of woven fabric would depend on the fibre and the nature of
yarn: spun or continuous filament. The woven fabrics may be made of monofilament or
multifilament yarn or twisted staple yarn. Fabrics made of natural fibres are usually
thicker than corresponding media based on synthetic materials. With monofilament
media, filtration occurs in spaces between the yarns while in the case of multifilament
and staple yarns filtration also occurs in the spaces within the yarn. The physical and
chemical properties of yarn can be tailored to suit specific filtration application.
In addition to the material and types of yarn, the almost unlimited variety of woven
fabric can be used for woven fabric. In basic terms these are three types of weave: plain,
twill and satin, with associated derivatives. Of the three, plain weaves produce the
tightest fabrics, have the highest filtration efficiency and rigidity [107] while satins are
very flexible with lowest efficiency of filtration. Twill fabrics fall in between these two
extremes and are easier to fit into a filter, Table 1.3.
Table 1.17 Effect of Weave pattern on fabric performancea [94]
Maximum
filtrate
clarity
Minimum
resistance to
flow
Minimum
moisture in
cake
Easiest cake
discharge
Maximum
fabric life
Least
tendency to
blind
Plain Satin Satin Satin Twill Satin
Twill Twill Twill Twill Plain Twill
Satin Plain Plain Plain Plain Plain
ain decreasing order performance

Literature Review
75
1.7.2 Nonwoven [70, 92, 93]
Nonwoven media dominate the filtration sector, and with the filtration industry
continuously looking for finer filtration, of both liquid and gases, nonwoven fabrics
made of fine spun or filament material are capable of meeting those requirements.
The definition of a nonwoven is contentious and in most cases is due to their distinction
from paper. ISO and Nonwoven Fabrics Handbook (INDA) define nonwoven as:
‘A sheet, web or batt of natural and/or manmade fibres or filaments, excluding
papers, that have not been converted into yarns, and that are bonded to each
other by any of several means.’
This definition also includes more than 50% by mass of fibres with a length to diameter
ratio greater than 300 (ISO) or more than 30% by mass of fibres with a length to
diameter ratio more than 600 (INDA) to distinguish nonwoven from paper. A nonwoven
fabric, therefore, is essentially made of an agglomeration of fibres and filaments with
bonding. The chemical property of the material along with the bonding chemicals (if
applied) directly influences the properties of the filter media.
However there is still confusion in defining nonwoven materials which can be used for
filtration. Therefore Hutten [93] combines all of them with the following definition:
‘A nonwoven filter medium is a porous fabric composed of a random array of
fibres or filaments and whose specific function is to filter and/or separate phases
and components of a fluid being transported through the medium or to support
the medium that does the separation.’
The media may contain additional components which are used for during formation
such as ‘particulate fillers (clays, calcium, adsorptive powders, etc.), sizing agents, wet
strength agents, antimicrobial additives, plasticizers, dyes and pigments, softening
agents, and wetting agents etc.
Nonwovens are classified by the process of formation: dry formed and wet laid. The
same material would show different types of properties because the different types of
formation. The dry formed processes uses air as a medium whereas the wet laid process
uses water similar to paper manufacturing for formation of web. There are five major

Literature Review
76
dry formed processes: air laid, dry laid (carding operations), spunbonded, melt-blown
and electrospun.
1.7.2.1 Composite Structures
A composite structure is a layered medium, in which every layer has its specific
characteristics or purpose. The layers could be a fibrous nonwoven, or a woven material
or plastic or metal mesh material for structural support. The nonwoven layers could be
needle punched, needle felt or electrospun. Some of the functions of composite
structures are:
One or more layer provides mechanical support to the whole media;
Different layers have different gradient density, usually from lighter to denser to
assist in depth filtration;
One layer may act as pre-filter media; while following layers provide higher
filtration efficiency as they remove smaller and finer particles;
Different separation technology can be employed in different layers, for
example, one layer could be sand or activated carbon combined with one or
more nonwoven layer;
The outer layer protects the medium from outside intervention of dust or
movement of layers in between.
The composite structures can be bonded in numerous ways: laminating, needle
punching or hydroentanglement, wet laying or using different techniques such as
spunbond/melt-blown/spunbond or during collection for forming the other layers.
1.7.3 Woven Wire and Screen
The greatest amount of filter media is made from metal in the form either woven
wire/mesh or perforated sheets. These filter media are stronger, have high resistance to
corrosion and abrasion like the original metal and can be made exactly as per
specification required for filter media.
These types of filters have two major applications: separating the solid particles and
pre-screening of gas or liquid before the finer filtration. Woven wire is made of nickel
chrome stainless steel, copper, and aluminium alloys etc, whereas screen or mesh is
made of different types of weaves, most commonly, Dutch or Hollander weaves.

Literature Review
77
1.8 Membranes [70, 108, 109, 110, 111, 112, 113]
Membranes are now used an alternative to conventional separation methods and the
fastest growing market for filter media [108, 109]. As a filtration media, the membrane
is based on thin, porous or nonporous, flexible or rigid, semi-permeable sheets of
different polymers that separate two phases and/or act as passive or active barrier at the
molecular and ionic level (0.1 µm or below). Membranes were first used for purification
of salt from water by reverse osmosis (which is not truly a filtration process) and now
extended to microfiltration, ultrafiltration and nanofiltration [70]. They can be used for
separating liquids from liquids, solids from liquids, gases from liquids and gases from
gases [70, 110]. The specific capability of separating micro-level particles makes
membrane technology very popular in the filtration sector. Membranes can be called
porous if the separation of particles is in the region of 0.005-1 µm. When pores are on
the size of 0.001-0.005 µm, then the membrane is microporous while any separation of
particles below 0.005 µm or in the nanometre range is not a true pore but rather the
spaces in between the molecules of the membrane material that are “open” during
operation. The latter, is a diffusion process and, hence, such a membrane is deemed
non-porous or semi-permeable.
The basic criteria of membranes for use in filtration and separation application are [70]:
Chemically resistant to feed and cleaning fluids;
Mechanically and thermally stable;
High throughput/permeability;
Better cake release;
High selectivity to desired permeate constituent;
Low energy requirement;
Stable in operation for prolonged periods;
Strong enough to be resistant to the trans-membrane pressure;
Low cost per unit membrane area.
Membranes can be distinguished based on their: i) geometry; ii) separation regime; iii)
bulk structure; iv) production method; v) and application [111]. Membranes can be
constructed either symmetrically or asymmetrically. Symmetric membranes have the
same physical and chemical structure throughout their thickness in the direction of

Literature Review
78
filtration while asymmetric or anisotropic membranes have different density gradients
along the thickness. This density gradient can be different in some materials, or in many
cases, due to the use of different material, which are highly selective and can be used for
structural support.
Membranes hold great promise [112] for recycling water, but membranes can also be
used to recover chemicals that can be reused in the process. Membrane technology
operates at ambient temperature, and in general requires less energy to operate
compared to other processes. Table 1.18 shows briefly the factors that influence the
membrane separation process. The choice of membrane process depends on the quality
of the final products.
Table 1.18 Membrane separation process and influencing factors [113]
Process Usual purpose
Influencing Factors
Size Diffusivity Ionic
charge
Solubility
Microfiltration
(MF)
Removal of suspended
solids, including
microorganisms
+ +
+
- - -
Ultrafiltration
(UF)
Removal of both large,
dissolved solute molecules
and suspended colloidal
particles
+ +
+
- + -
Nanofiltration
(NF)
Selective removal of
multivalent ions and certain
charged or polar molecules
+ +
+
+ + -
Reverse
osmosis (RO)
Removal of inorganic/
monovalent ions
+ + + + + + + +
Electrodialysis
(ED)
Selective extraction from
water and/or concentration
+ + + + + -
‘+’ represents positive influence, more the ‘+’ sign, greater the influence
‘-’ represents negative influence

Literature Review
79
1.8.1 Membrane separation types
Five different types of membrane process are available for liquid application,
microfiltration, ultrafiltration, nanofiltration, reverse osmosis and electrodialysis [113].
They are usually classified according to the pore size or size of the particles that they
can retain. They are suitable for specific applications but have recognised limitations.
1.8.1.1 Microfiltration (MF) [45]
Microfiltration can filter particles in the range of 0.1µm and above and let the liquid
flow through relatively quickly. It is suitable for treating pigment dyebaths [114] and
suspensions containing detergents and dispersing agents [45]. The auxiliary chemicals
are retained in the permeate [115]. As a final single end treatment, it is not satisfactory,
so it is used as a pre-treatment for other membrane process like nanofiltration or reverse
osmosis [116].
1.8.1.2 Ultrafiltration (UF) [45, 70]
Ultrafiltration (UF) is effective for elimination of macromolecules and particles, but
removal of dye is incomplete, between 31% and 76% [117]. As a single step treatment
for secondary wastewater, the recycled water can be reused in secondary processes like
washing and rinsing [118] in which salinity is not a problem [56]. This is a pressure
driven process and can remove particle size of over 0.01µm. They are used to filter
colloids and polymers with molecular weights ranging from 1,000 to 5,000,000. This is
useful for multi-stage treatment processes, such as a pre-treatment for reverse osmosis
[119] or in combination with a membrane bioreactor [120, 121, 122]. The UF
membranes are typically composed of polyvinylidene chloride, polyethersulphone,
polysulphone, polyacrylonitrile, cellulose acetate and regenerated cellulose or inorganic
materials such as alumina, zirconia and titania [123].
1.8.1.3 Nanofiltration (NF) [70, 124]
Nanofiltration can retain smaller sizes of molecule than UF and MF and separates low
molecular weight organic compounds, divalent salts of Ca2+
, Mg2+
, large monovalent
ions, hydrolyzed reactive dyes and auxiliaries with an appropriate softening effect. Most
studies suggest that NF treatment of dyehouse effluents should not have more than 20

Literature Review
80
gL-1
mineral salts and 1.5 gL-1
of dyestuffs [125]. Chakraborty, Purkait et al. [126]
have reported in their study that NF can retain over 90% of dye effluent and the pressure
and driving forces are much lower compared to RO. However, Van der Bruggen,
Cornelis et al. [127] found that the NF treatment process is negatively influenced by
membrane fouling assumed to be due to adsorption of organic compound. A
combination of the methods are suggested for treatment of effluent, and it was found
that for a combination UF/NF system, colour, TDS, bivalent ions can be retained at
95%, 80%, 95%, respectively [128]. In another study, after coagulation/flocculation
treatment, NF showed better flux then RO [129].
1.8.1.4 Reverse osmosis (RO) [45, 70]
Reverse osmosis system is based on molecular diffusion, where effluent is forced under
pressure to cross a semi-permeable membrane to produce a pure permeate and
concentrate. RO has a retention rate of over 90% for most ionic compounds [116] and
monovalent salts, such as NaCl, can be recovered to an efficiency of 30-98% [45] and
larger species from dyebath effluents. A single step RO can decolorize and remove
chemical auxiliaries in textile effluent. However, the high concentration of salt in
effluent increases the osmotic pressure, hence higher processing pressures are required
to separate mixtures [52].
1.8.1.5 Electrodialysis (ED) [45]
A charged membrane that operates as an electrochemical separation technique and as a
result can separate ionic species from water and other uncharged species.
1.8.2 Membrane Fouling [124, 127, 130, 131]
Membranes work by creating barriers for particles based on porosity. Accordingly there
is a tendency for blockage of pores by fine particles. The blockage mainly occurs at the
surface, but with increased thickness, depth filtration may cause blockage of pore inside
the material, which is known as membrane fouling. Fouling lowers the flux of permeate,
reduces the serviceability of membrane and increases maintenance or chemical costs
[124]. Membrane fouling is classified as reversible or irreversible and could be
responsible for up to 18% and 26-46% reduction of permeate flux, respectively [127].
The mechanism of reversible fouling is based on gel layer formation, concentration

Literature Review
81
polarisation and osmotic pressure [124], Figure 1.16. While the expected causes for
irreversible fouling are adsorption, cake layer formation and pore blocking [130]. The
blocking of pores can further be characterized by standard, intermediate and complete
pore blocking, [131], Figure 1.16.
Figure 1.16 Mechanisms of membrane fouling, a) concentration polarisation; b)
adsorption; c) gel layer formation d) complete blocking; e) standard blocking; f)
intermediate blocking [132]
The main fouling categories are inorganic, organic, biological and particulate fouling
[124]. The fouling in itself is an extremely complex process. Adsorption takes place
with dissolved organic compounds while the dominant mechanism for dissolved
inorganics is precipitation. Colloidal fouling takes place through cake layer formation or
blocking of pores while biological fouling is due to the growth and attachment of
biolayers on the membrane surface [133]. The membrane fouling depends on three main
factors [134]:
Properties of the membrane;
Properties of the suspension;
Properties of the process (hydrodynamics).
Fouling layers need to be cleared periodically by cleaning, however, that also reduces
the efficiency of media and encourages approaches to cleaning and avoiding the
formation of a fouling layer.

Literature Review
82
1.8.2.1 Membrane Fouling due to Dyes
Dye molecules can be found in colloidal solutions of disperse, sulphur and vat dyes or
in dissolved forms of acid, cationic, direct, and reactive dyes [60]. The chromophore
and auxochrome in the dye molecule are recognised as the main sources of the foulants
[135]. These chemical groups interact with the functional groups, such as amino, amide,
carboxyl in the membrane. The interaction could be strong as dyes are designed to be
fast to fibres and similarly fouled membrane could be difficult to clean [127].
Depending on the types of dye, dye/membrane interactions could be based on ionic,
covalent bond, hydrophobic, hydrogen bond and/or van der Waals forces. Adsorption of
dyes on membrane will cause irreversible fouling depending on the size of the dye
molecule (or aggregates) or the size of the membrane pore [124]:
With dye molecules < pore size of 0.5-2nm, pore penetration and/or blocking is
possible, and adsorption of dye molecules takes place on the surface, in the
pores, and the back of the membrane;
With dye molecules > pore size of 0.5-2nm pore blocking is possible and
adsorption of dye molecules occurs on the surface only.
1.8.3 Cost of Membrane System for Wastewater Treatment
The economic feasibility of the implementation of membrane technology has been
evaluated extensively. Ciardelli, Corsi et al. [119] carried out a study in Italy, where it
was found that about £0.85/m3 would be a reasonable cost to implement membrane
technique for treating dyehouse wastewater, leading to reuse of the water. In addition
Ranganathan, Karunagaran et al. [136] reported that the total cost of water treatment
and recovery of effluent in Tamilnadu, India, including commissioning and
maintenance of a RO/NF system, was about £1.12/m3. Similarly in a study in Istanbul,
Turkey, it was reported that in the current market conditions, the membrane recovery
system for treatment of textile effluent would cost around £0.35/m3 [137]. In a similar
study in the UAE it was shown that desalting of wastewater would cost around £0.29/m3
whereas it costs around £0.65/m3
for 35% recovery of desalination of seawater [138].
Lockerbie and Skelly [23] compared the effluent treatment cost in the UK, Table 1.19 ,
and membrane processes produced acceptable quality of water but was found to be
expensive compared to others.

Literature Review
83
Table 1.19 Comparison of effluent treatment in the UK [23]
Reuse of dyebaths has been a key research target for more than sixty years and many
pilot studies and laboratory experiment have been carried out. Volooj [44] and others
[139] extensively studied recycling of textile effluent with Primapor filter media and
concluded that bleach and dyebath could be reused following dyeing. The area will be
discussed more in Chapter 10. In another study, it was found that recycling of water
substantially saved on chemical costs [140]. Numerous studies also concluded that a
membrane system alone was not sufficient to recycle water in a cost effective way and
therefore, various combinations have been studied [85].
1.9 Surface Modification of Filter Media [44, 141, 142, 143,
144, 145, 146, 147, 148, 149, 150, 151, 152, 153, 154]
The filtration of filter media depends on the specific capability of separating micro-level
particles, high throughput, efficient cake release, chemically resistant to feed and
cleaning liquids, mechanical and thermal stability and low energy requirements [70].
The performance of filter media for filtration can be improved by employing two
distinct strategies. Firstly, by chemical modification of the polymer [142] and a phase
inversion method to prepare polymeric membranes [143]. The improvements can be
Parameter Membrane Adsorption
Chemical
oxidation/
electrochemical
Biological Coagulation/
flocculation
Water quality Excellent Moderate/
good Moderate/ good Poor/moderate Poor/
moderate
Footprint Small Small Small Moderate/large Small/large
Characteristics Fouling,
cake
release
More space AOX Less sludge Large sludge
Capital costs High Moderate/
high Moderate Moderate Moderate
Operating
costs High Moderate/
high High Low Moderate
Civil costs Low Low Low High Low/high

Literature Review
84
achieved by modifying the polymer through halogenation [144, 145, 146, 147, 148],
carboxylation [149], sulphonation [150, 151] etc. The other approach is a post-media
process where finished media is modified, especially on the surface to improve the
overall performances by imparting certain properties [152]. These properties include
increasing flux and selectivity and chemical resistance (e.g. solvent resistance, swelling
etc.). Selective chemical modification of the membrane surface by halogen gas or
plasma treatment can improve the blinding/fouling resistance of media and membranes
along with change in flux [153]. Chemical stability, oil repellency or selectivity of
membranes for reverse osmosis, electrodialysis, evaporation and gas separation
applications can be improved by cross-linking of polymers [154].
1.9.1 Fluorination [155, 156, 157, 158, 159, 160, 161, 162, 163]
Direct gaseous fluorination is a popular method for surface modification of polymers
[155, 156, 157, 158]. This is a dry gaseous technology that is applied for thin surface
modification, with treatment thickness ranges of 0.01-10µm in the media. Direct
fluorination is a heterogeneous reaction where the highly electronegative fluorine
molecule modifies the polymer surface [159], Scheme 1.1. Usually fluorine is diluted
by nitrogen, helium, or argon in order to prevent excessive uncontrolled damage on the
polymer surface [160, 161]. Surface fluorination involves absorption and diffusion
of the F2 into the polymer, R, and subsequent chemical reactions [152].
RH+ F2 R· +HF +F
·
R· + F2 RF + F
·
Scheme 1.1 Fluorination Process [163]
The main advantage of gaseous fluorine is that it can modify any material shape due to
its gaseous nature and high diffusion characteristics. During fluorination most of the H
atoms are substituted by F atoms and double and saturated bonds are fluorinated with
the formation of C-F bonds, followed by CF2, CF3 bond formation in a strong
exothermic process [159]. Destruction of C-C and C-Si bonds with cross-linking
(formation of C-C bonds) may occur [162, 163]. The degree of modification depends on
concentration of fluorine, duration and temperature of treatment.
Surface fluorination differs from other surface modification techniques in that this dry
modification is long lived and has no reported lifetime limits [159]. The change is stable

Literature Review
85
due to high penetration depth during the reaction and incorporation of fluorine in the
polymer backbone. The rotational motions of chain segment are prevented below the
softening temperature, which would otherwise invert the chain and thus adversely
affecting the repellency effect [161].
Direct fluorination is used, in many cases, to increase the application properties of
polymeric materials. Fluorinated polymers have shown a set of unique properties, such
as good barrier properties, improved chemical stability, thermostability etc. [161].
1.9.1.1 Barrier Properties [157, 161, 164, 165, 166, 167, 168, 169].
This is the most commercially significant application at present. Direct fluorination
creates a barrier for permeation of hydrocarbons especially in automotive polymer fuel
tanks and vessels for volatile liquids and storage of toxic materials [157, 161, 164, 165,
166, 167, 168, 169].
1.9.1.2 Membrane Technology [160, 161, 165, 167, 168, 170]
Polymeric membranes are very effective material for filtration of gas mixtures such as
He/CH4, H2/ CH4, H2/CO2, CO2/ CH4, H2/ N2, O2/ N2, CO2/ H2S, CH4/CO2/ H2/He, etc.
[167]. However, highly permeable membranes often have low separation factors, and
vice versa. Direct fluorination can be used to increase separation factor without
reducing permeability significantly [161, 165, 167, 168]. In the same way, fluorine as a
highly electronegative material, imparts hydrophilicity to a surface, therefore, increases
the permeability considerably [160, 170].
1.9.1.3 Chemical Resistance [166, 168]
Direct fluorination improves physical and chemical properties of polymeric materials.
Crosslinking during the treatment process increases resistance to chemical such as
aggressive reagents and physico-mechanical resistance such as swelling to materials
[166, 168].
1.9.1.4 Adhesion and Printability Properties [159, 164, 166, 167]
One of the main disadvantages of polyolefins and some other polymers is that they have
low adhesion properties due to their lower surface energy and low polarity of the

Literature Review
86
surface. Direct fluorination can modify those characteristics such as wettability,
hydrophobicity by imparting polar component on the surface [165, 166, 168].
Kharitonov and others [159, 164, 166, 167] also listed the possible commercial
application of gaseous fluorination, namely, the increased of adhesion of polymer fibres
and fabric to rubber, enhancement of dyeability of polymer goods, reinforcement of
polymer composites increased resistance to delamination in coated flexible films [164].
1.9.1.5 Frictional Coefficient [161, 166, 168, 171]
Direct fluorination can improve the wear life of polypropylene (PP) and elastomeric
materials made of co-polymer by reducing the static and dynamic friction coefficient
[168]. The modification takes place without degradation of the bulk tensile strength of
materials [166, 168, 171]. The fluorinated surface may act as a protective coating and
become more stable to aggressive liquids and gases [161].
1.9.1.6 Anti-reflecting Coating and Reduction of UV radiation [159, 165]
A layer of anti-reflecting properties can be imparted on the surface by direct
fluorination [165]. In the same way, a protective coating can be imparted which
decreases the transparency of UV light through polymer materials [159].
1.9.2 Fluorocarbon (FC) Finishes [172, 173, 174, 175, 176, 177]
Textile surfaces can be modified both physical/mechanical and chemical textile finishes.
The chemical finishing includes different functional finishes to the fibres such as oil-
and water-repellent, softening, antimicrobial, antistatic, flame-retardant, easy-care and
soil-release agents [172, 173, 174, 175, 176]. The modification of the surface is due to
change of the surface free energy, and therefore, depends on the chemical structure of
agent used [177].
Paraffin or silicone-based water repellent finishing agents do not offer sufficient liquid
repellency protection of textiles therefore, fluorocarbon polymers, commonly known as
fluorocarbons (FC) are used. FCs are an integral part of oil, water, and soil-repellent
finishing and provides the lowest surface energies of all the repellent finishes in use
[176]. Conventional FC based finishes contain a combination of resins, catalysts, homo-
and co-polymers, pH adjusters, cross-linking agents, and solvents [178]. They are

Literature Review
87
synthesized by incorporating perfluoroalkyl groups into acrylic or urethane monomers
and then polymerised to form fabric finishes. The final polymer, after application to the
fibre, forms a structure with dense CF3 at the outer surface for maximum repellency. A
typical structure of the final polymer is given in Figure 1.17 [176].
A
A
Where, m = 8-10. X and Y are co-monomers, mainly stearylacrylates. R = H or CH3
(polyacrylic or polymethacrylic acid esters). A is the fibre surface.
Figure 1.17 FC repellent finish on fibre surface.
The application method for most FC products is a simple pad-dry-cure process. At low
active add-ons (<1.0% on the mass of fabric) drying and heat curing will provide a
durable repellent finish to the textile. Heat treatment at the elevated temperature causes
the orientation of the perfluoro side chains to the air interface and creates crystalline
structures [176].
1.9.3 Plasma Technology [179, 180, 181, 182, 183, 184, 185, 186, 187,
188, 189, 190, 191, 192, 193, 194]
Plasma polymerisation is another popular dry surface modification techniques as
treatment time is short with a consistent and reproducible chemical modifications and
gaseous byproducts can be easily removed under vacuum [179]. The process is also
versatile as many different types of gases such as Air, Ar, H2, He, O2, CO2, N2, NH3, F2
and SO2 can be used to introduce required properties [180, 181]. Thus obtaining a C-F
film through plasma could provide several favourable advantages such as controlled
thickness, high deposition rate, and less production cost [182]. The depth of film is

Literature Review
88
usually limited to 10 nm or less, which means plasma only influences the outermost thin
layer of the substrate [183]. The chemical structure of the polymer invariably affects
the properties of a plasma polymer film, which is dependent on input plasma
characteristics [182]. Fluorocarbon thin films deposited by plasma polymerisation can
provide a variety of desirable properties, such as low dielectric constant, chemical
inertness [184], hydrophobicity [182], hydrophobic non-stick coatings [186], low-
friction coatings [188]. Therefore plasma polymerisation of fluorocarbon thin films has
been previously studied [185, 186] but offers the potential for improved filter media.
In all of the cases, fluorine content and its distribution along the polymeric chain
determine the properties of the materials. In general, higher fluorine content provides
better liquid repellency, weatherability, chemical and thermal stability, solvent
resistance [189]. The properties of the fluorinated surface depend on both the coverage
and degree of order of fluorocarbon on the surface [187].
The main disadvantage of any plasma treated polymers is that the surface modifications
are not stable over extended periods of time, for example, the wettability decreases on
storage after treatment [190, 191, 192, 193]. The stability also varies depending on the
type of plasma treatment. For instance, on storage of samples in air for few days,
contact angle marked increased for ammonia plasma-treated samples but remained
constant for water plasma-treated samples over many weeks [194]. The long term
stability of fluorocarbon polymer surfaces of water plasma-treated samples was
reasoned to be deeper modification of the surfaces. Wang et al.[195] plasma-
polymerised fluorocarbon on PET surfaces with monomers CF4, C2F6, C3F6, C4F8, and
mixtures thereof with CH4 to create a water barrier layers and found that the barrier was
relatively stable particularly the mixture of C3F6 and CH4 .
1.10 Coagulation/Flocculation [44, 45, 59, 60, 61, 196]
Coagulation and flocculation, if used, is considered to be the most critical stage for
overall colour removal [60] Therefore the need for understanding
coagulation/flocculation processes is important, which usually works by colloidal
suspension. Colloidal material includes mineral substances, silt, bacteria, plankton,
viruses, biopolymers, macromolecules and small aggregates of precipitated and

Literature Review
89
flocculated matter. The particle size of colloids is between 1-10 nm [60]. The key to
effective coagulation and flocculation depends how individual colloids interact with
each other. In water, the behaviour of colloids is strongly influenced by their
electrokinetic charge. Each colloidal particle carries a similar charge, which repels each
other and effectively prevents agglomeration and flocculation. The reduction of charges
brings them together to agglomerate and flocculate, which will ultimately produce
visible, larger flocs.
Coagulation works by destabilising the stable colloidal dispersion, which is generally
carries a positively charged species in an appropriate amount to neutralize the charge in
dispersion. Flocculation then aggregates these microflocs into larger sizes [61]. As a
result, sludge is produced which is then removed by flotation, settling or other physical
techniques. The disposal of this sludge, which commonly contains hazardous chemicals,
has some restrictions.
In water/wastewater treatment hydrolysed metal salts such as aluminium or iron salts or
synthetic organic polymers are widely used [196]. However these metal salts have
almost no effect on elimination of soluble dye, especially acid and reactive dyes, which
are designed to withstand microbial, chemical and photodegradation [59]. However,
recent developments in organic polymer and polyelectrolytes have improved colour
removal significantly [45]. Volooj [44] worked extensively on wool keratin dyeing in
order to remove dyebath colour after the dyeing process with a hybrid
coagulant/flocculant and demonstrated beneficial effects.
Generally, the coagulant is added under conditions of intense and rapid mixing followed
by the flocculant, with slower agitation, in order to promote larger floc formation. A
rapid mixing allows coagulant to be distributed evenly throughout the suspension,
which is crucial as poor mixing can lead to destabilisation or local overdosing of some
particles [196]. The efficiency of coagulation/flocculation process in water treatment
depends on many variables, such as [60]:
Type of coagulant used and dosages;
Coagulant feed concentration;
Final pH;

Literature Review
90
Type of dosage of chemical additives other than primary coagulant (e.g.
polyelectrolytes);
Sequence of chemical addition and time lag between dosing points;
Intensity, duration and type of rapid mixing;
Velocity gradients applied during flocculation stage;
Flocculator retention time and its geometry;
Types of stirring device used.
1.10.1 Types of coagulants/flocculants
Coagulants and flocculants used for treatment of wastewater can be classified into two
groups: Inorganic compounds (metal coagulants) and organic polymers [197].
1.10.1.1 Metal Coagulants [132, 197, 198, 199, 200]
Metal salts are widely used as coagulant due to their low cost and relatively high
effectiveness. The commercial range is focused on aluminium sulphate, ferric chloride,
aluminium chloride, ferrous sulphate [132]. Aluminium based coagulants are
considered particularly effective as coagulants and flocculants, but polyaluminium
chloride (PAC), a polymer derived from Al3+
, has several advantages over other
metallic salts, which includes, improved floc formation, lower volume of sludge, and
effectiveness over a wide range of pH [198]. It has been reported that PAC improved
turbidity compared to other metallic coagulants such as aluminium sulphate and ferric
chloride [197]. Aluminium-based coagulants generally work by two major mechanisms
when removal of dye is involved: namely precipitation and adsorption. At pH lower
than 6.5 the precipitation mechanism dominates while at higher pH the dominant
mechanism is adsorption or sweep coagulation, Scheme 1.2[199, 200].
Scheme 1.2 Mechanism of coagulation with aluminium-based coagulants [199, 200]
Precipitation: At pH 4-5 Dye + monomeric Al [dye – monomeric Al] (s)
At pH 5-6 Dye + polymeric Al [dye – polymeric Al] (s)
Adsorption: Dye + Al(OH)3 (s) [particle]
[Dye + polymeric Al] (s) + Al(OH)3 (s) [particle]
These flocs polymerise as: n Al(OH)3 Aln(OH)3n

Literature Review
91
Although aluminium-based coagulants are very effective in removal of dye the residual
aluminium in the permeate is a major concern due to its association with Alzheimer’s
disease [60]. As a result an alternative approach is necessary either focused on reducing
the dosage, or a blend or alternative coagulant [132].
1.10.1.2 Organic Polymers as Coagulants/Flocculants [61, 201, 202, 203,
204, 205]
In many industrial applications such as mineral processing, water treatment,
biotechnology, papermaking, polymers have been widely used for flocculants for
suspensions [201, 202] and in water and wastewater treatments for decades [61, 203].
All flocculants that are used in water or related application are water soluble and mainly
synthetic in nature [203]. Natural polymers have low toxicity but are less effective.
Flocculants can be broadly classified according to the nature of the charge, molecular
weight (MW) and charge density (CD), Table 1.20. The nature of the charge could be
anionic, cationic, zwitterionic or non-ionic. Usually polymer structures are linear, but
there are some branched or cross-linked polymers effective for certain applications
[204]. Some examples of polymeric flocculants are [205]:
Non-ionic: Polyethylene oxide (PEO); polyacrylamide (PAM); polyvinyl
alcohol (PVA); polyvinyl pyrrolidone (PVP);
Anionic: Hydrolyzed polyacrylamide; polyacrylic acid (PAA); polyvinyl
sulphate;
Cationic: Poly(diallyldimethylammonium chloride) (PDADMAC),
diallyldimethylammonium chloride (DADMAC); cationic polyacrylamide
(CPAM); polyethyleneimine (PEI); polyvinyl pyridine (PVP).
The charge density can be expressed as mole percent of charged groups or as milli-
equivalents per gram (meqg-1
). For highly-charged polyelectrolytes, such as
PDADMAC, CD values are extremely high, up to around 7 meqg-1
[205], however,
exact information for commercial products is not always available.

Literature Review
92
Table 1.20 Classification of polymeric flocculants by molecular weight and size [61]
Amount MW (Dalton) CD (mol %)
High ca. 107 50-100
Medium 105-10
6 ca. 25
Low 104-10
6 ca. 10
In comparison with the more common coagulant alum, the use of polymers provides
some benefits such as lower dosing, smaller volumes of sludge, smaller increases in
ionic load and reduced level of aluminium in treated water [206]. It is commonly found
that polymeric flocculants provide stronger, and larger flocs compared to the flocs
produced by hydrolysing metal coagulants [196].
1.10.1.3 Synthetic Cationic Polyelectrolyte Polymers [61, 203]
The different types of organic polyelectrolytes are reviewed in detail and generally
cationic polymers are most effective followed by anionic and non-ionic [61, 203]. The
most common cationic structures are given in Figure 1.18, and usually contain
quaternary ammonium groups with a positive charge irrespective of the pH. Some
natural products, chitosan or its derivatives are also available for water treatment [61].
Figure 1.18 Structures of the cationic polyelectrolytes: PDADMAC, polymers from
epichlorohydrin and dimethylamine (ECH/DMA), CPAM, chitosan and Anionic PAM.

Literature Review
93
1.10.2 Mechanism of Coagulation/Flocculation
The mode of actions of inorganic salts or synthetic organic polymers is well understood
and described below [196, 205].
1.10.2.1 Coagulation by Charge Neutralization [61, 199]
Alum, iron salts, lime, and organic polymers as hydrolysable salts are a widely
accepted technology, and have been thoroughly investigated [199]. Charge
neutralization takes place when the cations are brought into the solution with anions,
which produces microflocs and the amount depends on the operating pH [61]. In the
case of aluminium, different mono-hydroxo species are formed instantaneously, such as
Al(OH)2+
, Al(OH)2+ and Al(OH)4
-. Also other species such as the dimer Al2(OH)2
4+ or
polymeric forms Al13(OH)345+
can be formed. The Al(OH)3 can be formed
instantaneously and continues during the period of treatment [199].
For coagulation of humic substances by aluminium ions, several mechanisms have been
proposed. At pH 4-5, there is a stoichiometric reaction to produce aluminium humate
when the organic acids are present at least 50% levels.
2RCOO- + AlOH
2+ (RCOO)2AlOH
At pH 5-6 and above, the same reactions proceed, but by adsorption of the organics on
aluminium hydroxide through ligand exchange reaction:
RCOO- + OH-Al< RCOO-Al< + OH
-
1.10.2.2 Coagulation by Double Layer Compression [44, 207]
Double layer compression involves the addition of large quantities of electrolytes such
as NaCl. Any colloidal suspension in an ionic environment can be visualised by a
double layer model, Figure 1.19, and explains how repulsive forces operate between the
particles. The negative colloid initially attracts some positive ions, which forms a firmly
attached layer, known as the Stern layer of counter ions. Additional positive ions are
still attracted but repelled by the Stern layers and other approaching positive ions to the
colloids. This dynamic formation causes a diffuse layer of counter ions. The charge
density is highest near the colloid and gradually diminishes to zero as the positive and
negative ions concentration merges together. Together the Stern layer and diffuse layer
are known as the double layer. The thickness of the layer depends on the concentration

Literature Review
94
and types of ions in solution, and can be several hundred nanometres. The mobility of
the particles, known as the zeta potential, is the work done to move charges around.
Figure 1.19 Visualisation of the double layer [207]. The right side of the diagram shows
the distribution of positive and negative ions while the left view shows the change in
charge density around the cloud.
The stability of any suspension depends on the repulsive and attractive forces operating
among the particles. The balance of repulsion and attraction in a colloidal suspension
can be explained by the DLVO theory (named after Derjaguin, Landau, Verwey and
Overbeek), Figure 1.20, which combines two opposing forces: electrostatic repulsion
and van der Waals attraction. The theory proposes that an energy barrier exists due to
the repulsive forces between approaching and adhering colloids. However, if the
particles collide with sufficient energy to overcome the barrier, then the net attractive
force would pull them together strongly to agglomerate, but this process will be
irreversible.
The energy barrier in a colloidal suspension can be increased or decreased depending on
the requirements. The effective aggregation of particles requires a reduction or removal
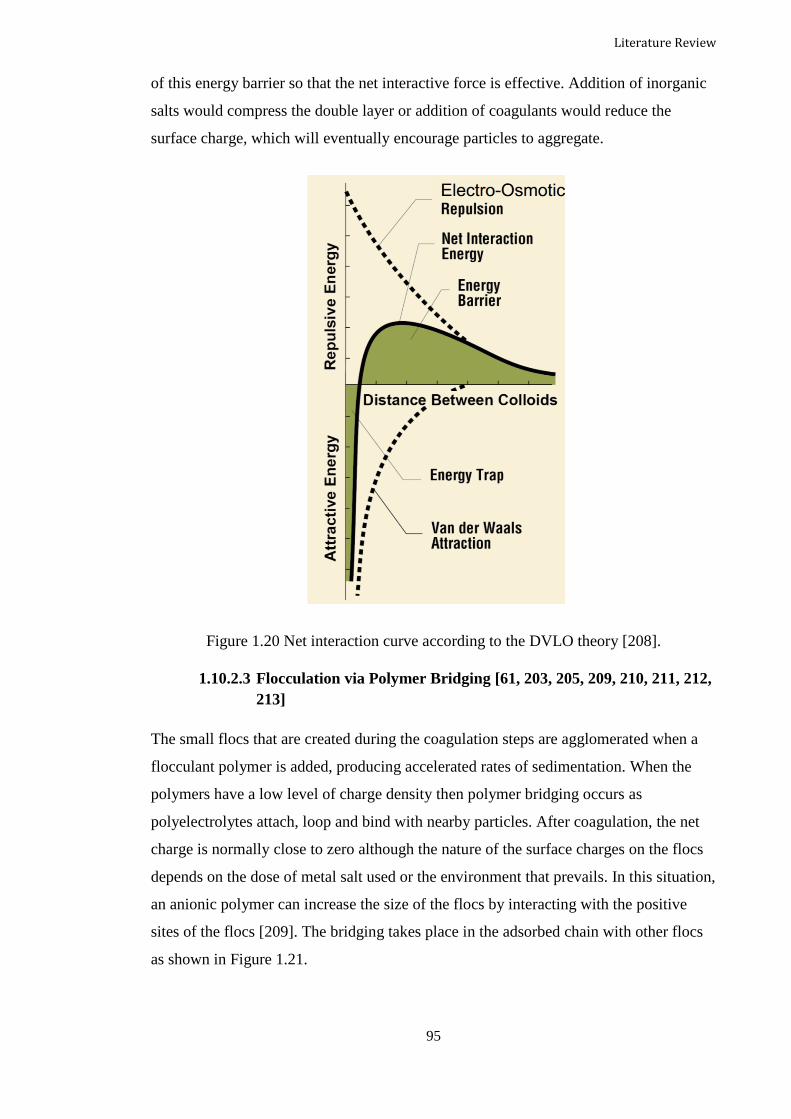
Literature Review
95
of this energy barrier so that the net interactive force is effective. Addition of inorganic
salts would compress the double layer or addition of coagulants would reduce the
surface charge, which will eventually encourage particles to aggregate.
Figure 1.20 Net interaction curve according to the DVLO theory [208].
1.10.2.3 Flocculation via Polymer Bridging [61, 203, 205, 209, 210, 211, 212,
213]
The small flocs that are created during the coagulation steps are agglomerated when a
flocculant polymer is added, producing accelerated rates of sedimentation. When the
polymers have a low level of charge density then polymer bridging occurs as
polyelectrolytes attach, loop and bind with nearby particles. After coagulation, the net
charge is normally close to zero although the nature of the surface charges on the flocs
depends on the dose of metal salt used or the environment that prevails. In this situation,
an anionic polymer can increase the size of the flocs by interacting with the positive
sites of the flocs [209]. The bridging takes place in the adsorbed chain with other flocs
as shown in Figure 1.21.

Literature Review
96
Figure 1.21 The bridging flocculation model [210]
When the polyelectrolytes have high density charges, polymers will adsorb where there
is an excess of positive charges, which is known as the electrostatic patch model [211].
The adsorption onto the particles is likely to be in flat patches of the polymer surface
domain with associated excess charges. As a result, direct electrostatic attraction occurs,
which aggregate the flocs [61], Figure 1.22. Further it was also suggested that the
possible random coil configuration is somewhat expanded due to the repulsion between
segments but in a solution with high ionic strength, the repulsion is lessened due to the
screening of ions [203, 205]. It was also reported that the formation of a higher
adsorption layer on the polymeric surface occurred [212]. The removal of metal ions in
solution is possible either by precipitation or formation of a soluble polymer-metal
complex which can be removed via membrane technology [61].

Literature Review
97
Figure 1.22 The charge patch agglomeration model [210]
The balance between the two mechanisms depends on the charge neutralisation with
high charge density polymers and polymer bridging with low ionic content polymers
[213]. Therefore,the practical implication on the process, such as reaction rates, size and
strength of the flocs, are dependent on the degree of charge, molecular size and the ionic
strength [61].
1.10.3 Dual Component System
Coagulation and flocculation play a significant role in the treatment of wastewater and
for alleviating the fouling of membrane. When the process is used as a pre-treatment for
microfiltration (or other membranes), it is mainly aimed to improve permeability and
throughput of the filtration process [214]. Polymers can be used alone, or in addition to
flocculant aids, such as inorganic salts, a second polymer or surfactants [215]. More
often, metal components can be used as the primary coagulant to a flocculant polymer
[132]. It was reported that a dual component system, consisting of two oppositely
charged polymers, could improve the performance of the flocculation process [205, 216,
217]. Two or more components, if used in sequence as a flocculant system, can produce
synergistic effects under suitable conditions [218, 219, 220, 221]. It has been shown that
in an optimised polymer/polymer system of highly charged polycations and a high

Literature Review
98
molecular weight polyanion, this system could be beneficial to the paper industry for
applications such as dewatering, superior retention, and shear resistant flocs [218, 219,
222]. In this case the mechanism that operates involves charge patch formation and
polymer bridging [216, 217]. The first polymer adsorbs on the particles to create
primary flocs, which serve as anchors for the adsorption of the second polymer as
shown with alumina particles [216]. The effectiveness of cationic polymers, such as
polyacrylamide (PAM) and polydiallyldimethylammonium chloride (PDADMAC) has
been widely investigated in synthetic colloidal systems and water treatment [201].
In the study of PDADMAC and different polycations, Petzold et al. [217, 222] found
that the flocculation behaviour essentially depends on the concentration of polycation
(as related to anionic character of suspension) and the molar ratio of anionic and
cationic charges. The amount of polycation necessary for flocculation could be high if
complexation between polyanion and polycation is the mechanism for flocculation. A
molar ratio of anionic charges to cationic charges of n-/n
+ of 0.6 should be obtained for
effective flocculation. In addition to complexation, with relatively high molecular
weight (>1,000,000) polyanion patchwise adsorption and bridging occurs.

Literature Review
99
1.11 References
1. Correia, V. M., T. Stephenson and S. J. Judd, Characterisation of textile
wastewaters - a review, Environmental Technology, 1994, 15 (10), p.917-929.
2. Skelly, J. K., ed. Water Recycling in Textile Wet Processing. 2003, Society of
Dyers and Colourists.
3. WHO/UNICEF, Progress on sanitation and drinking-water 2010 update, 2010,
World Health Organization and UNICEF, Geneva. p.60.
4. UN-Water, Coping with water scarcity - Challenge of the twenty-first century.
Prepared for World Water Day, 2007, United Nations.
5. Grimshaw, D., Nanotechnology for clean water: Facts and figures 2009,
Science and Development Network.
6. Clariant, Technical paper: Ecoswat, in Textile Chemicals, M. Maïsseu, Editor,
2003, T. L . P Division, Clariant, Basel. p.53.
7. Macedonio, F., E. Drioli, A. A. Gusev, A. Bardow, R. Semiat and M. Kurihara,
Efficient technologies for worldwide clean water supply, Chemical Engineering
and Processing, 2012, 51 (January), p.2-17.
8. World-Bank, World development report 2008, 2008, World Bank, Washington
DC.
9. World-Bank, Re-engaging in agricultural water Management: Challenges and
options. , 2006, World Bank, Washington DC.
10. Easton, J. R., General considerations in reuse of water: reuse from coloration
processes, in Water Recycling in textile Wet processing, J. K. Skelly, Editor,
2003, Society of Dyers and Colourists.
11. Water-UK, Water facts 2000., 2000, Water UK, London.
12. van der Bruggen, B., K. Borghgraef and C. Vinckier, Causes of water supply
problems in urbanised regions in developing countries, Water Resources
Management, 2010, 24 (9), p.1885-1902.
13. Sarker, M. H., I. Huque, M. Alam and R. Koudstaal, Rivers, chars and char
dwellers of Bangladesh, International Journal of River Basin Management,
2003, 1 (1), p.61-80.
14. Allison, M. A., Geologic framework and environmental status of the Ganges-
Brahmaputra delta, Journal of Coastal Research, 1998, 14 (3), p.827-836.

Literature Review
100
15. EarthTrends, Country profile: Water resources and freshwater ecosystems--
Bangladesh, 2003.
16. US-EPA, Manual - Best management practices for pollution prevention in the
textile industry, B. Smith, Editor, 1995, U.S. Environmental Protection Agency.
17. Anonymous, Water efficiency fact sheet, in Water Efficiency industry specific
processes: Textiles, 2009, North Carolina Division of Pollution Prevention and
Environmental Assistance, Raleigh, NC. p.9.
18. Personal communication, 2008, Masco factories Ltd., Dhaka.
19. Orhon, D., I. Kabdasli, F. Germirli Babuna, S. Sozen, H. Dulkadiroglu, S.
Dogruel, O. Karahan Gul and G. Insel, Wastewater reuse for the minimization of
fresh water demand in coastal areas—selected cases from the textile finishing
industry, Journal of Environmental Science and Health, Part A, 2003, 38 (8),
p.1641-1657.
20. DOE, Guide for Assessment of Effluent Treatment Plants, June 2008,
Department of Environment, Ministry of Environment and Forest, Bangladesh,
and Canadian International Development Agency, Dhaka. p.79.
21. Shukla, S. R., Pollution abatement and waste minimisation in textile dyeing, in
Environmental aspects of textile dyeing, R. Christie, Editor, 2007, Woodhead
Publishing Limited and The Textile Institute, Cambridge and Manchester,
p.116-148.
22. GE, Handbook of Industrial Water Treatment, 2000, GE Water and Process
Technology, PA USA.
23. Lockerbie, M. and J. K. Skelly, Economic factors in recycling – UK experience,
in Water Recycling in Textile Wet Processing, J. K. Skelly, Editor, 2003, Society
of Dyers and Colourists, p.224-233.
24. Schmitt, G., M. Schütze, G. F. Hays, W. Burns, E.-H. Han, A. Pourbaix and G.
Jacobson, Global Needs for knowledge dissemination, research, and
development in materials deterioration and corrosion control, 2009, World
Corrosion Organization, New York.
25. Hays, G. F., Now is the Time 2012, World Corrosion Organization, New York.
26. Miyasaka, M., H. Takayama, K. Amaya and S. Aoki. Corrosion protection
design of seawater pump by Boundary element analysis system. Proc. in The
international pump users symposium. 2000, p.121-130.
27. MCF. Marine Corrosion. 2008 [cited 2013 12/11]; Available from:
http://www.marinecorrosionforum.org/explain.htm.

Literature Review
101
28. Malik, A. U. and P. C. Mayan Kutty, Corrosion and material selection in
desalination plants, Proc SWCC Operation Maintenance Conference, Al-Jubail,
1992, p.304-331.
29. Little, B. J. and F. B. Mansfeld, Corrosion behavior of stainless steels and
copper alloys exposed to natural seawater, Werkstoffe und Korrosion, 1991, 42
(7), p.331-340.
30. Habib, K. and A. Husain, Stress corrosion cracking of copper-nickel alloys in
sulphide polluted natural seawater at moderate temperatures, Desalination,
1994, 97 (1-3), p.29-34.
31. Drach, A., J. Decew, J. Aufrecht, I. Tsukrov, U. Hofmann and A. Grohbauer,
Corrosion and biofouling performance of copper alloys investigated in the north
atlantic ocean, 2013.
32. Ateya, B. G., E. A. Ashour and S. M. Sayed, Stress corrosion behavior of α-
aluminum bronze in saline water, Corrosion, 1994, 50 (1), p.20-25.
33. Huang, G. Q., W. X. Jin and W. T. Hou, A study on relationship between
corrosion resistance and corrosion potential of stainless steels in seawater,
Journal of the Chinese Society of Corrosion and Protection, 2000, 20 (1), p.39-
40.
34. Duan, J., S. Wu, X. Zhang, G. Huang, M. Du and B. Hou, Corrosion of carbon
steel influenced by anaerobic biofilm in natural seawater, Electrochimica Acta,
2008, 54 (1), p.22-28.
35. Cahn, R. W., P. Hassen and E. J. Kramer, Materials science and technology, A
comprehensive treatment, structure and properties of non-ferrous Alloys, Vol. 8,
1996, VCH, New York.
36. Todd, B. and P. A. Lovett, Marine engineering practice: selecting materials for
seawater systems, Technical report, 1976, Institute of Marine Engineers,
London. .
37. West, E. G., Copper and Its Alloys, 1982, Ellis Horwood Ltd., Halsted Press,
New York.
38. Powell, C. A., Marine applications of copper-nickel alloys, section 1: copper-
nickel alloys-resistance to corrosion and biofouling, Technical report, 1998,
Copper Development Association, Potters Bar, UK.
39. Kato, C., B. G. Ateya, J. E. Castle and H. W. Pickering, On the mechanism of
corrosion of Cu-9.4Ni-1.7Fe alloy in air saturated aqueous NaCl solution,
Journal of the Electrochemical Society, 1980, 127 (9), p.1890-1896.
40. Tuthill, A. H., Guidelines for the use of copper alloys in seawater, Materials
Performance, 1987, 26 (9), p.12-22.

Literature Review
102
41. Shamey, R. and T. Hussein, Critical Solutions in the dyeing of cotton textile
materials, Textile Progress, 2005, 37 (1-2), p.1-84.
42. Gailey, I., Journal of the Society of Dyers and Colourists, 1980, 96 (600).
43. Shamey, R. and T. Hussein, Critical solution in the dyeing of cotton textile
materials, Textile Progress, 2005, 10 (1), p.1-84.
44. Volooj, S., Investigation into the wet processing of Keratin fibres and filter
media, in Department of Textiles, 2003, The University of Manchester Institute
of Science and Technology, PhD Thesis, Manchester.
45. Choudhury, A. K. R., Textile preparation and dyeing, 2006, Science Publishers,
Enfield, N.H.
46. Kocabas, A. M., H. Yukseler, F. B. Dilek and U. Yetis, Adoption of European
Union's IPPC Directive to a textile mill: Analysis of water and energy
consumption, Journal of Environmental Management, 2009, 91 (1), p.102-113.
47. R.H. Horning, Textile dyeing wastewaters: Characterization and treatment,
American Dye Manufacturers Institute, New York, 1978, p.1992-2000.
48. Judd, S., Introduction, in Membranes for Industrial Wastewater Recovery and
Reuse, S. Judd, Editor, 2003, Elsevier, p.1-12.
49. Chowdhury, N. S. and A. E. V. Clemett, Industrial pollution and its threat to
wetlands in Bangladesh: Example of Mokesh Beel wetland in Kaliakoir, in
Technical Report, 2006, Management of Aquatic Ecosystems through
Community Husbandry (MACH), USAID, Winrock International, Bangladesh
Centre for Advanced Studies, Center for Natural Resources Studies, and Caritas
Bangladesh, Dhaka.
50. Ministry of Environment, The Environment Conservation Rules, Schedule 12,
Rule 13 (Unofficial English Version), 1997, Ministry of Environment and
Forests, Government of the People’s Republic of Bangladesh, Dhaka.
51. Sule, A. D. and M. K. Bardhan, Objective evaluation of feel and handle,
appearance and tailorability of fabrics. Part-II: The KES-FB system of
Kawabata, Colourage, 1999, 46, p.23-28.
52. Babu, B. R., A. K. Parande, S. Raghu and T. P. Kumar, Cotton textile
processing: Waste generation and effluent Treatment, The Journal of Cotton
Science, 2007, 11, p.141-153.
53. Metcalf, E. and I. Eddy, Wastewater engineering: Treatment and reuse, 4th ed.,
2003, McGraw-Hill Education, ISBN 9780070418783.
54. Hoehn, W., Melliand Textilber., 1998, 79, p.647.

Literature Review
103
55. Hai, F. I., K. Yamamoto and K. Fukushi, Hybrid treatment systems for dye
wastewater, Critical Reviews in Environmental Science and Technology, 2007,
37 (4), p.315-377.
56. Rott, U. and R. Minke, Overview of wastewater treatment and recycling in the
textile processing industry, Water Science and Technology, 1999, 40 (1), p.137-
144.
57. Koyuncu, I. and D. Topacik, Effects of operating conditions on the salt rejection
of nanofiltration membranes in reactive dye/salt mixtures, Separation and
Purification Technology, 2003, 33 (3), p.283-294.
58. Mondal, S., Methods of dye removal from dye house effluent - An overview,
Environmental Engineering Science, 2008, 25 (3), p.383-396.
59. Anjaneyulu, Y., N. S. Chary and D. S. S. Raj, Decolourization of industrial
effluents - available methods and emerging technologies - A Review, Reviews in
Environmental Science and Biotechnology, 2005, 4 (4), p.245-273.
60. Bratby, J., Coagulation and flocculation in water and wastewater treatment,
Second ed., 2006, IWA publishing, London.
61. Bolto, B. A., Soluble polymers in water purification, Progress in Polymer
Science, 1995, 20 (6), p.987-1041.
62. Langlais, B., D. A. Reckhow and D. R. Brink, Ozone in water treatment:
application and engineering 1991, Lewis Publishers, Chelsea, London.
63. Scott, J. P. and D. F. Ollis, Integration of chemical and biological oxidation
processes for water treatment: Review and recommendations, Environmental
Progress, 1995, 14, p.88-103.
64. Coste, C., O. Marmagne and J.-C. Jacquart, Effluents decoloration, L’Industrie
Textile, 1996, 1278, p.46-51.
65. Jovančić, P. and M. Radetić, Advanced sorbent materials for treatment of
wastewaters, in Emerging Contaminants from Industrial and Municipal Waste,
2008, p.239-264.
66. Holdich, R., Filtration fundamentals, in Solid-Liquid Filtration and Separation
Technology, A. Rushton, A. S. Ward, and R. G. Holdich, Editors, 1996, VCH
Verlagsgesellschaft GmbH and VCH Publishers, Inc., Weinheim and New York.
67. Matsui, Y., R. Murase, T. Sanogawa, N. Aoki, S. Mima, T. Inoue and T.
Matsushita, Rapid adsorption pretreatment with submicrometre powdered
activated carbon particles before microfiltration, Water Science and
Technology, 2005, 51, p.249-256.

Literature Review
104
68. Bl´anquez, P., M. Sarr`a, and M.T. Vicent, Study of the cellular retention time
and the partial biomass renovation in a fungal decolourisation continuous
process Water Research, 2006, 40, p.1650-1656.
69. Pala, A. and E. Tokat, Color removal from cotton textile industry wastewater in
an activated sludge system with various additives, Water Research, 2002, 36,
p.2920-2925.
70. Sutherland, K., Filters and filtration handbook, 5th ed., 2008, Elsevier, Oxford,
ISBN 9781856174640.
71. FAO and ICAC. A Summary of the world apparel fiber consumption survey
2005-2008. 2011; 11]. Available from:
http://www.fao.org/fileadmin/templates/est/COMM_MARKETS_MONITORIN
G/Cotton/Documents/World_Apparel_Fiber_Consumption_Survey_2011_-
_Summary_English.pdf.
72. FAO/ICAC, World apparel fiber consumption survey, 2013, Food and
Agriculture Organization of the United nations and International Cotton
Advisory Committee Washington.
73. Aizenshtein, E., Polyester fibres continue to dominate on the world textile raw
materials balance sheet, Fibre Chemistry, 2009, 41 (1), p.1-8.
74. Perepelkin, K. E., Trends and changes in world production of chemical fibres.
An analytical review. Part 1. Trends in the evolution of world Chemical fibre
economic structure, Fibre Chemistry, 2003, 35 (3), p.173-182.
75. Wakelyn, P. J., B. Condon and D. P. Thibodeaux, Cotton, Encyclopedia Of
Polymer Science and Technology, 2010.
76. Bechtold, T., E. Burtscher and Y.-T. Hung, Treatment of textile wastes, in Waste
Treatment in the Process Industries, L. K. Wang, Y.-T. Hung, H. H. Lo, and C.
Yapijakis, Editors, 2006, CRC Press Taylor & Francis Group, LLC, Boca Raton.
77. Shenai, V. A., Technology of Dyeing, 2nd ed. Technology of Textile Processing,
Vol. iv, 1994, Sevak Publisher, Bombay.
78. Broadbent, A. D., Basic Principles of Textile Coloration, 2001, Society of Dyers
and Colourists, Bradford, England, ISBN ISBN 0 901956 76 7.
79. Stakelbeck, H. P. (1999) Economy, ecocompatibility, process optimization, PL
Acid / Metal Complex 2010, Clariant (Schweiz) AG
80. Robinson, T., G. McMullan, R. Marchant and P. Nigam, Remediation of dyes in
textile effluent: a critical review on current treatment technologies with a
proposed alternative, Bioresource Technology, 2001, 77 (3), p.247-255.

Literature Review
105
81. Lourenço, N. D., J. M. Novais and H. M. Pinheiro, Effect of some operational
parameters on textile dye biodegradation in a sequential batch reactor, Journal
of Biotechnology, 2001, 89 (2–3), p.163-174.
82. Zollinger, H., Color Chemistry: Syntheses, Properties, and Applications of
organic dyes and pigments, 3rd, Revised ed., 2003, Wiley-VCH, USA, ISBN
9783906390239.
83. Mock, G., Dyeing of polyester fibres, in Synthetic Fibre Dyeing, C. J.
Hawkyard, Editor, 2004, Society of Dyers and Colourists, Bradford.
84. Trotman, E. R., Dyeing and Chemical Technology of Textile Fibres, 4th ed.,
1970, Griffin, London.
85. Lau, W.-J. and A. F. Ismail, Polymeric nanofiltration membranes for textile dye
wastewater treatment: Preparation, performance evaluation, transport
modelling, and fouling control -- a review, Desalination, 2009, 245 (1-3), p.321-
348.
86. Park, J. and J. Shore, Does dyeing practice need dyeing theory?, Coloration
Technology, 2007, 123 (6), p.339-343.
87. SHU, Beer's law, in Resources for Physical Chemistry, 2003, Faculty of Health
and Wellbeing, Biosciences Division, Sheffield Hallam University.
88. Lewis, D. M., Coloration in the next century, Review of Progress in Coloration
and Related Topics, 1999, 29 (23-28).
89. Laing, I. G., The impact of effluent regulations on the dyeing industry, Review
of Progress in Coloration and Related Topics, 1991, 21, p.56-71.
90. Euratex, Textile industry BREF document (Chapter 2-6), 2000, Euratex.
91. Spain, Comments made by Spain to the First Draft of the BREF, 2002.
92. Purchas, D. B. and K. Sutherland, Handbook of filter media, 2nd ed., 2002,
Elsevier Advanced Technology, Oxford, ISBN 1856173755.
93. Hutten, I. M., Handbook of Nonwoven Filter Media, 2007, Butterworth-
Heinemann, Amsterdam.
94. Purchas, D. B., Industrial filtration of liquids, 2nd ed., 1971, Leonard Hill,
London.
95. Lee, K. W. and R. Mukund, Filter collection, in Aerosol Measurement:
Principles, Techniques, and Applications, P. A. Baron and K. Willeke, Editors,
2001, Wiley-InterScience, Inc., New York, p.197-218.

Literature Review
106
96. Tien, C., Introduction to cake filtration: analyses, experiments and applications,
First ed., 2006, Elsevier, Amsterdam, ISBN 978-0-444-52156-9.
97. Orr, C., Filtration : principles and practices Part I, 1977, Marcel Dekker Inc,
New York.
98. Wakeman, R. J. and E. S. Tarleton, Filtration: Equipment selection, modelling
and process simulation, 1999, Elsevier Advanced Technology, Oxford, ISBN
9781856173452.
99. Khean, T. S., Studies in filter cake characterisation and modelling, in Chemical
and Environmental Engineering, 2003, National University of Singapore, PhD
Thesis, Singapore.
100. Lu, W.-M., K.-J. Hwang and S.-C. Ju, Studies on the mechanism of cross-flow
filtration, Chemical Engineering Science, 1993, 48 (5), p.863-872.
101. Mackley, M. R. and N. E. Sherman, Cross-flow cake filtration mechanisms and
kinetics, Chemical Engineering Science, 1992, 47 (12), p.3067-3084.
102. Altmann, J. and S. Ripperger, Particle deposition and layer formation at the
crossflow microfiltration, Journal of Membrane Science, 1997, 124 (1), p.119-
128.
103. Mackley, M. R. and N. E. Sherman, Cake filtration mechanisms in steady and
unsteady flows, Journal of Membrane Science, 1993, 77 (1), p.113-121.
104. Davis, R. H. and J. D. Sherwood, A similarity solution for steady-state crossflow
microfiltration, Chemical Engineering Science, 1990, 45 (11), p.3203-3209.
105. Grace, H. P., Structure and performance of filter media. I. The internal structure
of filter media, AIChE Journal, 1956, 2 (3), p.307-315.
106. Kaur, S., R. Gopal, W. J. Ng, S. Ramakrishna and T. Matsuura, Next-generation
fibrous media for water treatment, MRS Bulletin, 2008, 33 (January), p.21-26.
107. Hardman, E., Some aspects of the design of filter fabrics for use in solid/liquid
separation processes, Filtration & Separation, 1994, 31 (8), p.813-818.
108. Bowen, W. R. and F. Jenner, Theoritical descriptions of membrane filtration of
colloids and fine particles: an assessment and review, Advances in Colloid and
Interface Science, 1995, 56, p.141-200.
109. Boerlage, S. F. E., M. Kennedy, Z. Tarawneh, R. De Faber and J. C. Schippers,
Development of the MFI-UF in constant flux filtration, Desalination, 2004, 161
(2), p.103-113.

Literature Review
107
110. Holdich, R., Membrane technology, in Solid-Liquid Filtration and Separation
Technology, A. Rushton, A. S. Ward, and R. G. Holdich, Editors, 1996, VCH
Verlagsgesellschaft GmbH and VCH Publishers, Inc., Weinheim and New York.
111. Pinnau, I., Membrane separations | Membrane preparation, in Encyclopedia of
Separation Science, D. W. Ian, Editor, 2000, Academic Press, Oxford, p.1755-
1764.
112. Marcucci, M., G. Nosenzo, G. Capannelli, D. I. Ciabatti and G. C. Corrieri,
Treatment and reuse of textile effluents based on new ultrafiltration and other
membrane technologies, Desalination, 1970, 38, p.75-82.
113. Cheremisinoff, N. P., Handbook of Water and Wastewater Treatment
Technologies, 2002, Elsevier, ISBN 978-0-7506-7498-0.
114. Al-Malack, M. H. and G. K. Anderson, Use of crossflow microfiltration in
wastewater treatment, Water Research, 1997, 31 (12), p.3064-3072.
115. Buckley, C. A., Membrane technology for the treatment of dyehouse effluents,
Water Science and Technology, 1992, 25 (10), p.203-209.
116. Ghayeni, S. B., P. J. Beatson, R. P. Schneider and A. G. Fane, Water
reclamation from municipal wastewater using combined microfiltration-reverse
osmosis (MERO): Preliminary performance data and microbiological aspects of
system operation, Desalination, 1988, 116, p.65-80.
117. Watters, J. C., E. Biagtan and O. Senler, Ultrafiltration of a textile plant effluent,
Separation Science and Technology, 1991, 26 (10-11), p.1295-1313.
118. Bottino, A., G. Capannelli, G. Tocchi, M. Marcucci and G. Ciardelli.
Membranes processes for textile wastewater treatment aimed at its re-use. Proc.
in 8th World Filtration Congress, Symposium and Exhibition. 2000, Brighton,
UK, p.521-524.
119. Ciardelli, G. and N. Ranieri, The treatment and reuse of wastewater in the textile
industry by means of ozonation and electroflocculation, Water Research, 2001,
35, p.567-572.
120. Van Dijk, L. and G. C. G. Roncken, Membrane bioreactors for wastewater
treatment: The state of the art and new developments, Water Science and
Technology, 1997, 35 (10), p.35-41.
121. Mignani, M., G. Nosenzo and A. Gualdi, Innovative ultrafiltration for
wastewater reuse., Desalination, 1999, 124, p.287-292.
122. Schoeberl, P., M. Brik, R. Braun and W. Fuchs, Treatment and recycling of
textile wastewater -case study and development of a recycling concept,
Desalination, 2005, 171 (2), p.173-183.

Literature Review
108
123. Cheryan, M. and D. W. Ian, Membrane separations | ultrafiltration, in
Encyclopedia of Separation Science, 2000, Academic Press, Oxford, p.1797-
1802.
124. Schäfer, A. I., A. G. Fane and T. D. Waite, Nanofiltration: principles and
applications, 2005, Elsevier Advanced Technology, ISBN 9781856174053.
125. Tang, C. and V. Chen, Nanofiltration of textile wastewater for water reuse,
Desalination, 2002, 143 (1), p.11-20.
126. Chakraborty, S., M. K. Purkait, S. DasGupta, S. De and J. K. Basu,
Nanofiltration of textile plant effluent for color removal and reduction in COD,
Separation and Purification Technology, 2003, 31 (2), p.141-151.
127. Van der Bruggen, B., G. Cornelis, C. Vandecasteele and I. Devreese, Fouling of
nanofiltration and ultrafiltration membranes applied for wastewater
regeneration in the textile industry, Desalination, 2005, 175 (1), p.111-119.
128. Fersi, C. and M. Dhahbi, Treatment of textile plant effluent by ultrafiltration
and/or nanofiltration for water reuse, Desalination, 2008, 222 (1-3), p.263-271.
129. Suksaroj, C., M. Héran, C. Allègre and F. Persin, Treatment of textile plant
effluent by nanofiltration and/or reverse osmosis for water reuse, Desalination,
2005, 178 (1-3), p.333-341.
130. Tansel, B., W. Y. Bao and I. N. Tansel, Characterization of fouling kinetics in
ultrafiltration systems by resistances in series model, Desalination, 2000, 129
(1), p.7-14.
131. Field, R. W., D. Wu, J. A. Howell and B. B. Gupta, Critical flux concept for
microfiltration fouling, Journal of Membrane Science, 1995, 100 (3), p.259-272.
132. Zahrim, A. Y., C. Tizaoui and N. Hilal, Coagulation with polymers for
nanofiltration pre-treatment of highly concentrated dyes: A review,
Desalination, 2011, 266 (1-3), p.1-16.
133. Van der Bruggen, B., M. Mänttäri and M. Nyström, Drawbacks of applying
nanofiltration and how to avoid them: A review, Separation and Purification
Technology, 2008, 63 (2), p.251-263.
134. Huisman, I. H. and D. W. Ian, Membrane separations | microfiltration, in
Encyclopedia of Separation Science, 2000, Academic Press, Oxford, p.1764-
1777.
135. You, S. H., D. H. Tseng and W. C. Hsu, Effect and mechanism of ultrafiltration
membrane fouling removal by ozonation, Desalination, 2007, 202 (1–3), p.224-
230.

Literature Review
109
136. Ranganathan, K., K. Karunagaran and D. C. Sharma, Recycling of wastewaters
of textile dyeing industries using advanced treatment technology and cost
analysis -Case studies, Resources, Conservation and Recycling, 2007, 50 (3),
p.306-318.
137. Babursah, S., M. Çakmakci and C. Kinaci, Analysis and monitoring: costing
textile effluent recovery and reuse, Filtration & Separation, 2006, 43 (5), p.26-
30.
138. Madwar, K. and H. Tarazi, Desalination techniques for industrial wastewater
reuse, Desalination, 2003, 152 (1-3), p.325-332.
139. Water quality requirements and waste water recycling in the UK textile industry,
Textile Research Council, 1978.
140. Easton, J. R., ed. The dye maker’s view. Colour in Dyehouse Effluent, ed. P.
Cooper. 1995, Society of Dyers and Colourists, Bradford, England.
141. Howe, K. J., K. P. Ishida and M. M. Clark, Use of ATR/FTIR spectrometry to
study fouling of microfiltration membranes by natural waters, Desalination,
2002, 147 (1–3), p.251-255.
142. Mohr, J. M., D. R. Paul, Y. Tam, T. E. Mlsna and R. J. Lagow, Surface
fluorination of composite membranes. Part II. Characterization of the
fluorinated layer, Journal of Membrane Science, 1991, 55 (1-2), p.149-171.
143. Mulder, M., Membrane preparation | Phase inversion membranes, in
Encyclopedia of Separation Science, D. W. Ian, Editor, 2000, Academic Press,
Oxford, p.3331-3346.
144. White, D. M. and C. M. Orlando, Brominated Poly(Phenylene Oxide)s. II.
Bromination of Poly(2,6-Dimethyl-1,4-Phenylene Oxide), in Polyethers, 1975,
American Chemical Society, p.178-184.
145. Chern, R. T., F. R. Sheu, L. Jia, V. T. Stannett and H. B. Hopfenberg, Transport
of gases in unmodified and arylbrominated 2,6-dimethyl- 1,4-poly (phenylene
oxide), Journal of Membrane Science, 1987, 35 (1), p.103-115.
146. Percec, S., Chemical modification of poly(2,6-dimethyl-1,4-phenylene oxide) via
phase transfer catalysis, Journal of Applied Polymer Science, 1988, 36 (2),
p.415-427.
147. Kerres, J. A., D. Xing and F. Schönberger, Comparative investigation of novel
FBI blend ionomer membranes from nonfluorinated and partially fluorinated
poly arylene ethers, Journal of Polymer Science, Part B: Polymer Physics, 2006,
44 (16), p.2311-2326.
Literature Review
110
148. Percec, S. and G. Li, Chemical Modification of Poly(2,6-dimethyl-1,4-phenylene
oxide) and Properties of the Resulting Polymers, in Chemical Reactions on
Polymers, 1988, American Chemical Society, p.46-59.
149. Koros, W. J., B. J. Story, S. M. Jordan, K. O'Brien and G. R. Husk, Material
selection considerations for gas separation processes, Polymer Engineering &
Science, 1987, 27 (8), p.603-610.
150. Johnson, B. C., İ. Yilgör, C. Tran, M. Iqbal, J. P. Wightman, D. R. Lloyd and J.
E. McGrath, Synthesis and characterization of sulfonated poly(acrylene ether
sulfones), Journal of Polymer Science: Polymer Chemistry Edition, 1984, 22 (3),
p.721-737.
151. Percec, S., Chemical modification of poly(2,6-dimethyl-1,4-phenylene oxide) by
friedel–crafts reactions, Journal of Applied Polymer Science, 1987, 33 (1),
p.191-203.
152. Mohr, J. M., D. R. Paul, T. E. Mlsna and R. J. Lagow, Surface fluorination of
composite membranes. Part I. Transport properties, Journal of Membrane
Science, 1991, 55 (1-2), p.131-148.
153. Goosen, M. F. A., S. S. Sablani, H. Al-Hinai, S. Al-Obeidani, R. Al-Belushi and
D. Jackson, Fouling of reverse osmosis and ultrafiltration membranes: A critical
review, Separation Science and Technology, 2004, 39 (10), p.2261-2297.
154. Pinnau, I., Membrane separation | Membrane preparation, in Encyclopedia of
Separation Science, D. W. Ian, Editor, 2000, Academic Press, Oxford, p.1755-
1764.
155. Jagur-Grodzinski, J., Modification of polymers under heterogeneous conditions,
Progress in Polymer Science, 1992, 17 (3), p.361-415.
156. Carstens, P. A. B., S. A. Marais and C. J. Thompson, Improved and novel
surface fluorinated products, Journal of Fluorine Chemistry, 2000, 104 (1),
p.97-107.
157. Hobbs, J. P., P. B. Henderson and M. R. Pascolini, Assisted permeation through
surface fluorinated polymers, Journal of Fluorine Chemistry, 2000, 104 (1),
p.87-95.
158. Kharitonov, A. P. and L. N. Kharitonova, Surface modification of polymers by
direct fluorination: A convenient approach to improve commercial properties of
polymeric articles, Pure and Applied Chemistry, 2009, 81 (3), p.451-471.
159. Kharitonov, A. P., Direct fluorination of polymers-from fundamental research to
industrial applications, Progress in Organic Coatings, 2008, 61 (2-4), p.192-204.

Literature Review
111
160. du Toit, F. J., R. D. Sanderson, W. J. Engelbrecht and J. B. Wagener, The effect
of surface fluorination on the wettability of high density polyethylene, Journal of
Fluorine Chemistry, 1995, 74 (1), p.43-48.
161. Kharitonov, A. P., R. Taege, G. Ferrier, V. V. Teplyakov, D. A. Syrtsova and G.
H. Koops, Direct fluorination--Useful tool to enhance commercial properties of
polymer articles, Journal of Fluorine Chemistry, 2005, 126 (2), p.251-263.
162. du Toit, F. J. and R. D. Sanderson, Surface fluorination of polypropylene: 2.
Adhesion properties, Journal of Fluorine Chemistry, 1999, 98 (2), p.115-119.
163. du Toit, F. J. and R. D. Sanderson, Surface fluorination of polypropylene: 1.
Characterisation of surface properties, Journal of Fluorine Chemistry, 1999, 98
(2), p.107-114.
164. Hobbs, J. P. and M. Anand, Engineering Plastics, 1992, 5, p.247-258.
165. Kharitonov, A. P., Practical applications of the direct fluorination of polymers,
Journal of Fluorine Chemistry, 2000, 103 (2), p.123-127.
166. Kharitonov, A., R. Taege, G. Ferrier and N. Piven, The kinetics and mechanism
of the direct fluorination of polyethylenes, Surface Coatings International Part B:
Coatings Transactions, 2005, 88 (3), p.201-212.
167. Kharitonov, A. P., L. N. Kharitonova, R. Taege, G. Ferrier, É. Durand and A.
Tressaud, Direct fluorination of polymer vessels and membranes: Enhancement
of barrier and gas separation properties, Actualite Chimique, 2006 (301-302),
p.130-134.
168. Tressaud, A., E. Durand, C. Labrugère, A. P. Kharitonov and L. N. Kharitonova,
Modification of surface properties of carbon-based and polymeric materials
through fluorination routes: From fundamental research to industrial
applications, Journal of Fluorine Chemistry, 2007, 128 (4), p.378-391.
169. Taege, R., G. Ferrier and A. P. Kharitonov, Surface fluorination of plastics
materials, U. S. P. Application, Editor, 2007, Air Products and Chemicals, Inc,
PA, US.
170. Le Roux, J. D., D. R. Paul, J. Kampa and R. J. Lagow, Surface fluorination of
poly (phenylene oxide) composite membranes Part I. Transport properties,
Journal of Membrane Science, 1994, 90 (1–2), p.21-35.
171. Roberts, A. D., R. Pitrola and P. Barnes, Influence of skim rubber on ice friction,
NR technology, 1989, 20 (1), p.1-7.
172. Knittel, D. and E. Schollmeyer, Technologies for a new century. surface
modification of fibres, Journal of the Textile Institute, 2000, 91 (3), p.151 - 165.

Literature Review
112
173. Bajaj, P., Finishing of textile materials, Journal of Applied Polymer Science,
2002, 83 (3), p.631-659.
174. Luo, S., V. Ooij and W. J., Surface modification of textile fibers for
improvement of adhesion to polymeric matrices: a review, Journal of Adhesion
Science and Technology, 2002, 16, p.1715-1735.
175. Heywood, D., ed. Textile finishing. 2003, Society of Dyers and Colourists,
Hampshire.
176. Schindler, W. D. and P. J. Hauser, Chemical finishing of textiles, 2004, The
Textile Institute, Woodhead Publishing Limited, Manchester, England.
177. Cerne, L., B. Simoncic and M. Zeljko, The influence of repellent coatings on
surface free energy of glass plate and cotton fabric, Applied Surface Science,
2008, 254 (20), p.6467-6477.
178. Badyal, J. P. S., Beyond the surface, Chemistry In Britain, 2001, 37 (1), p.45-46.
179. Langowski, B. A. and K. E. Uhrich, Oxygen Plasma-Treatment Effects on Si
Transfer, Langmuir, 2005, 21 (14), p.6366-6372.
180. Chan, C. M., T. M. Ko and H. Hiraoka, Polymer surface modification by
plasmas and photons, Surface Science Reports, 1996, 24 (1–2), p.1-54.
181. Ozdemir, M., C. U. Yurteri and H. Sadikoglu, Physical polymer surface
modification methods and applications in food packaging polymers, Critical
Reviews in Food Science and Nutrition, 1999, 30 (5), p.457-477.
182. Gnanappa, A. K., C. O'Murchu, O. Slattery, F. Peters, B. Aszalós-Kiss and S. A.
M. Tofail, Effect of annealing on hydrophobic stability of plasma deposited
fluoropolymer coatings, Polymer Degradation and Stability, 2008, 93 (12),
p.2119-2126.
183. Buyle, G., Nanoscale finishing of textiles via plasma treatment, Materials
Technology: Advanced Performance Materials, 2009, 24 (1), p.46-51.
184. Agraharam, S., D. W. Hess, P. A. Kohl and S. A. B. Allen, Electrical properties
and temperature-humidity studies of fluorocarbon films deposited from
pentafluoroethane/argon plasmas, Journal of the Electrochemical Society, 2001,
148 (5), p.F102-F107.
185. Yasuda, H. and T. S. Hsu, Some aspects of plasma polymerization of fluorine-
containing organic compunds, J Polym Sci Polym Chem Ed, 1977, 15 (10),
p.2411-2425.
186. Grischke, M., K. Bewilogua, K. Trojan and H. Dimigen, Application-oriented
modifications of deposition processes for diamond-like-carbon-based coatings,
Surface and Coatings Technology, 1995, 74-75 (2), p.739-745.

Literature Review
113
187. Genzer, J., E. Sivaniah, E. J. Kramer, J. Wang, H. Körner, M. Xiang, K. Char,
C. K. Ober, B. M. DeKoven, R. A. Bubeck, M. K. Chaudhury, S. Sambasivan
and D. A. Fischer, The orientation of semifluorinated alkanes attached to
polymers at the surface of polymer films, Macromolecules, 2000, 33 (5), p.1882-
1887.
188. Pittman, A. G., Fluoropolymers, L. A. Wall, Editor, 1972, Wiley, New York.
189. Grampel, R. D. V. D., Surfaces of fluorinated polymer systems, 2002,
Technische Universiteit Eindhoven, Eindhoven. p.151.
190. Terlingen, J. G. A., H. F. C. Gerritsen, A. S. Hoffman and J. Feijen, Introduction
of functional groups on polyethylene surfaces by a carbon dioxide plasma
treatment, Journal of Applied Polymer Science, 1995, 57 (8), p.969-982.
191. Inagaki, N., S. Tasaka and K. Hibi, Polymer Preprints, 1990, 31, p.380-381.
192. Fahmy, A., R. Mix, A. Schönhals and J. Friedrich, Surface and bulk structure of
thin spin coated and plasma-polymerized polystyrene films, Plasma Chemistry
and Plasma Processing, 2012, 32 (4), p.767-780.
193. Dupont-Gillain, C. C., Y. Adriaensen, S. Derclaye and P. G. Rouxhet, Plasma-
Oxidized polystyrene: wetting properties and surface reconstruction, Langmuir,
2000, 16 (21), p.8194-8200.
194. Ximing, X., T. R. Gengenbach and H. J. Griesser, Changes in wettability with
time of plasma-modified perfluorinated polymers, Journal of Adhesion Science
and Technology, 1992, 6 (12), p.1411-1431.
195. Wang, H. Z., M. W. Rembold and J. Q. Wang, Characterization of surface
properties of plasma-polymerized fluorinated hydrocarbon layers: Surface
stability as a requirement for permanent water repellency, Journal of Applied
Polymer Science, 1993, 49 (4), p.701-710.
196. Yukselen, M. A. and J. Gregory, The effect of rapid mixing on the break-up and
re-formation of flocs, Journal of Chemical Technology & Biotechnology, 2004,
79 (7), p.782-788.
197. Delgado, S., F. Diaz, D. Garcia and N. Otero, Behaviour of inorganic
coagulants in secondary effluents from a conventional wastewater treatment
plant, Filtration & Separation, 2003, 40 (7), p.42-46.
198. Rebhun, M. and M. Lurie, Control of organic matter by coagulation and floc
separation, Atmosphere, 1993, 638, p.02.
199. Rebhun, M. and M. Lurie, Control of organic matter by coagulation and floc
separation, Water Science and Technology, 1993, 27 (11), p.1-20.

Literature Review
114
200. Alinsafi, A., M. Khemis, M. N. Pons, J. P. Leclerc, A. Yaacoubi, A.
Benhammou and A. Nejmeddine, Electro-coagulation of reactive textile dyes
and textile wastewater, Chemical Engineering and Processing: Process
Intensification, 2005, 44 (4), p.461-470.
201. Yu, J., D. Wang, X. Ge, M. Yan and M. Yang, Flocculation of kaolin particles
by two typical polyelectrolytes: A comparative study on the kinetics and floc
structures, Colloids and Surfaces A: Physicochemical and Engineering Aspects,
2006, 290 (1–3), p.288-294.
202. Moody, G. M., Polymeric flocculants, Handbook of Industrial Water Soluble
Polymers, 2007, p.134.
203. Bolto, B. and J. Gregory, Organic polyelectrolytes in water treatment, Water
Research, 2007, 41 (11), p.2301-2324.
204. Shin, J. H., S. H. Han, C. Sohn, S. K. Ow and S. Mah, Highly branched cationic
polyelectrolytes: Filler flocculation, Tappi Journal, 1997, 80 (11), p.179-185.
205. Gregory, J. and S. Barany, Adsorption and flocculation by polymers and
polymer mixtures, Advances in Colloid and Interface Science, 2011, 169 (1),
p.1-12.
206. Kawamura, S., Considerations on improving flocculation, Journal / American
Water Works Association, 1976, 68 (6), p.328-336.
207. Zeta-Meter Zeta potential: A complete course, Zeta-Meter Inc.
208. Jansson, M. The DLVO theory, Bentonite Erosion and Colloid Transport.
209. Edzwald, J. K., J. D. Haff and J. W. Boak, Polymer coagulation of humic acid
waters, ASCE Proc. J. Environment Engineering Division, 1977, 103 (6), p.989-
1000.
210. Norman, P. I. and R. Seddon, Pollution control in the textile industry — the
chemical auxiliary manufacturer's role, Journal of Society of Dyers and
Colourists, 1991, 107, p.215-218.
211. Okubo, T., Adsorption of synthetic polyelectrolytes on colloidal spheres,
Polymer Bulletin, 1990, 23 (2), p.211-218.
212. Dahlgren, M. A. G., Effect of counterion valency and ionic strength on
polyelectrolyte adsorption, Langmuir, 1994, 10 (5), p.1580-1583.
213. Durand-Piana, G., F. Lafuma and R. Audebert, Flocculation and adsorption
properties of cationic polyelectrolytes toward Na-montmorillonite dilute
suspensions, Journal of Colloid and Interface Science, 1987, 119 (2), p.474-480.
214. Gregory, J., Chapter 3: Floc formation and floc structure, 2006. p.25-43.

Literature Review
115
215. Narkis, N., B. Ghattas, M. Rebhun and A. J. Rubin, The mechanism of
flocculation with aluminium salts in combination with polymeric flocculants as
flocculant aids, Water Supply, 1991, 9 (1), p.37-44.
216. Fan, A., N. J. Turro and P. Somasundaran, A study of dual polymer flocculation,
Colloids and Surfaces A: Physicochemical and Engineering Aspects, 2000, 162
(1–3), p.141-148.
217. Petzold, G., M. Mende, K. Lunkwitz, S. Schwarz and H. M. Buchhammer,
Higher efficiency in the flocculation of clay suspensions by using combinations
of oppositely charged polyelectrolytes, Colloids and Surfaces A:
Physicochemical and Engineering Aspects, 2003, 218 (1–3), p.47-57.
218. Moore, E. E., Charge relationship of dual polymer retention aids, TAPPI, 1976,
59 (6), p.120-122.
219. Britt, K. W., A. G. Dillon and L. A. Evans, Sorption and flocculation
mechanisms in paper stock systems, TAPPI, 1977, 60 (7), p.102-104.
220. Yu, X. and P. Somasundaran, Enhanced flocculation with double flocculants,
Colloids and Surfaces A: Physicochemical and Engineering Aspects, 1993, 81
(December), p.17-23.
221. Yoon, S.-Y. and Y. Deng, Flocculation and reflocculation of clay suspension by
different polymer systems under turbulent conditions, Journal of Colloid and
Interface Science, 2004, 278 (1), p.139-145.
222. Petzold, G., H. M. Buchhammer and K. Lunkwitz, The use of oppositely
charged polyelectrolytes as flocculants and retention aids, Colloids and
Surfaces A: Physicochemical and Engineering Aspects, 1996, 119 (1), p.87-92.

Experimental
116
2. Experimental
This chapter will discuss the materials used in this research, experimental approaches
and their materials performances.
2.1 Simulated Seawater (SSW)
Many investigations have been carried out in order to find out the major constituents of
seawater. Marcet in 1819 examined samples collected from the Arctic and Atlantic
Oceans, the Mediterranean, Black, Baltic, China and White Seas [1] and concluded that
seawater constitutes the same ingredients with nearly same proportion but differs in the
total amount of salt contents [1, 2]. In later studies, it was found that the major
constituents of seawater consist of eleven ions: chloride, sodium, sulphate, magnesium,
calcium, potassium, bicarbonate, bromide, strontium, borate and fluoride [1]. Seawater
is a saline solution, a solution of predominantly sodium chloride, NaCl. Na and Cl
account for more than 86% of salt content in water by mass. The other cations present
are Mg2+
> Ca2+
> K+> Sr
2+, in order of concentration. The anion Cl
- is approximately
equal to the sum of the other anions, SO42-
, HCO3-, Br
-, F
- [3].
Table 2.1 Composition of 3.50% salinity simulated seawater [4]
Gravimetric salt
Salt Mol. Wt. gL-1
Sodium chloride (NaCl) 58.44 23.926
Potassium chloride (KCl) 74.56 0.677
Sodium sulphate (Na2SO4) 142.04 4.008
Potassium bromide (KBr) 119.01 0.098
Boric acid (H3BO3) 61.83 0.026
Sodium bicarbonate (NaHCO3) 84.00 0.196
Sodium fluoride (NaF) 41.99 0.003
Volumetric salt
Salt Molecular wt. moleskg-1
of solution
Magnesium chloride (MgCl2.6H2O) 203.33 0.05327
Calcium chloride (CaCl2.2H2O) 147.03 0.01033
Strontium chloride (SrCl2.H2O) 266.64 0.00009

Experimental
117
The most used standard formulation for producing simulated seawater was proposed by
Lyman and Fleming, in 1940, who considered the seawater salinity at 3.50% [5, 6].
Kester, Duedall et al. [4] revised the formula of simulated seawater to bring down the
difference of composition to 1 mgkg-1
from natural seawater, Table 2.1. The recipe
consists of two types of mineral salt; one anhydrous the other based on hydrous salts
and is added into seawater as a solution.
In this research, SSW was prepared according to recipe given in Table 2.1, however, for
simplicity a formula from Marine Biological Laboratory was followed, Table 2.2. SrCl2,
H3BO3, NaF and KBr were omitted as they can be regarded as insignificant
components. NaHCO3 was not added when the dyeing condition was acidic. Laboratory
grade salts were used in all cases, and distilled water was used to make the test
simulated seawater solution. The pH of SSW was 7.80 at 19.6°C.
Table 2.2 Composition of SSW used in this research [7]
Salt gL-1
molar
NaCl 24.72 0.425
KCl 0.67 0.009
CaCl2 1.03 0.0093
MgSO4. 7H2O 6.29 0.0255
MgCl2. 6H2O 4.66 0.023
NaHCO3 0.18 0.002
2.2 Textile Fibres and Dyes used in this Research
The four major fibre types, wool, polyester, nylon and acrylic were examined under
dyeing conditions in simulated seawater environment. These fabrics were supplied by
Whaleys, Bradford and Phoenix Calico, Manchester. The dyeing systems evaluated
were wool/acid, wool/reactive, polyester/disperse, nylon/acid, acrylic/cationic dye/fibre
combinations. These are discussed in Chapters 3, 4, 5, 6 and 7.

Experimental
118
2.3 Filter Media
Azurtex filter media was supplied by Clear Edge Filtration, Germany (formerly
Madison Filtration Limited), which is an advanced development of Primapor, Figure
2.1. The filter media is a microporous multi-filament polypropylene plain weave fabric
with a polyurethane (PU) coating. The media is used across a range of processing
conditions [8]. The average pore size is 6µm with a corresponding liquid permeability
of 110 Lm-2
min-1
[9]. Azurtex provides an excellent liquid throughput and cake release,
and good particle retention, combined with good abrasion resistance [8]. The maximum
width available is 1.65m, with a nominal weight is around 620 gm2-
[9, 10] and can be
used for fine filtration of liquid slurries TiO2, china clay and dyestuffs.
Figure 2.1 SEM micrograph of a cross-section of Primapor Blue filter, showing the
upper layer of microporous polyurethane coating combined with the polypropylene
woven support (x 400 magnification)
2.4 Slurry
The titanium dioxide, TiO2 slurry used in this research was supplied by Huntsman,
Germany, and its composition and properties are given in Table 2.3. This is common
slurry that is used in the filtration industry and was studied as a model filtration
material. The slurry was thoroughly stirred prior to each filtration to ensure reproducible
results.

Experimental
119
Table 2.3 Slurry used in the filtration tests [9, 11, 12]
Parameters Composition and Properties
Titanium Dioxide 80-90%
Aluminium hydroxide 0-9%
Amorphous silica 0-10%
Solubility insoluble in water
Specific gravity 1.8-2.4
pH of slurry 6.7
2.5 Coagulants and Flocculants
Volooj [9] used a dual system of highly cationic polyaluminium salts and an anionic
flocculant to treat Acid dyebath solutions, based on freshwater, and achieved dye
removal up to 99.2%, although the result varied with dye structure and dye class.
Therefore, similar chemicals were investigated for the SSW dyebath recycling. Pluspac
2000 (Feralco, UK) is a coagulant based on low charge density PAC blended with an
organic polymer, polydiallyldimethylammonium chloride, Figure 2.2, which is a blend
of cationic inorganic coagulant and organic polyelectrolyte flocculant. The active
component is [Al13O4(OH)24(H2O)12]7+
, a highly cationic aluminium polymer in low
concentrations [13].
Figure 2.2 Structures of PDADMAC (polydiallyldimethylammonium chloride) and
cationic aluminium polymer - the active components of Pluspac 2000
HPSS (Croda Chemicals, UK) is a copolymer of anionic hydrolysed vegetable protein
and sodium polystyrene sulphonate with high charge density, Figure 2.3 [14].

Experimental
120
Figure 2.3 Hydrosolanum PSS-copolymer of hydrolysed vegetable protein and
polystyrene sulphonate
Generally, the coagulant was added to the solution with intense and rapid mixing
(approximately 250 rpm) followed by the flocculant with slower mixing (20 rpm) in
order to promote larger flocs. A rapid mixing allows coagulant to be distributed among
the suspension, which is essential as proper mixing can lead destabilisation or local
overdosing of some particles [14].
2.6 Filtration
Pressure filtration tests, typically duplicates or triplicates, were carried out in a low
pressure filter bomb vessel, supplied by Clear Edge Filtration. The system consisted of a
filter bomb vessel and a pressure unit, Figure 2.4. The filter media was positioned at the
bottom end of the vessel and tightly sealed in order to prevent leakage of the solution
through the joint under pressure. The slurry of known weight, 100±0.8% gm, was
transferred into the vessel and then the lid was closed with connection to pressure pipe.
A variable pressure of 2.5 to 5.5 bar was applied to the system with an effective
filtration area of 38.48 cm2.

Experimental
121
Air compressor
Figure 2.4 Schematic diagram of a filtration apparatus used in this study
2.7 Experimental Methods
2.7.1 Dye Exhaustion
The rate and extent of the exhaust dyeing process can be defined as the degree of
dyebath exhaustion in relation to time [15]. For a single dye, the exhaustion is defined
as the amount of the dye taken up by the material divided by the total initial amount of
dye in the solution, in a bath of constant volume, Equation 2.1:
( )
Equation 2.1
Where
C0 = Concentration of dye initially in solution;
CS = Concentration of dye in solution after dyeing.
The exhaustion of dyeing of a textile is aided by auxiliaries or controlled by a gradual
increase of temperature. While there is always equilibrium at the end of a dyeing
process, in reality, commercial practical dyeing attaining equilibrium may not be
economically feasible as it would require an infinite amount of time. In addition
prolonged exposure to the dye liquor could have a detrimental effect on the substrate
material being dyed. The levelness is of critical importance in exhaust dyeing as the
initial strike of dye to the material maybe uneven and will need correction.
Filter bomb

Experimental
122
The uptake of dye by the fabric was determined spectrophotometrically by measuring
the amount of dye remaining in the dyebath. In this study initially calibration curves
were calculated for each sample dye in SSW and DSW by appropriate dilution of the
solution. λmax was determined for each of the dyes using a Perkin Elmer Lambda 18 UV-
Vis Spectrophotometer (10 mm cell). Based on the variation between linearity of the
calibration curve, either DSW or both were chosen for subsequent calculation of
exhaustion.
To calculate exhaustion, the absorbance was measured at λmax for the exhausted dyebath
at room temperature and the concentration of the dye solution was determined from the
corresponding calibration curve. The percentage of dye exhaustion was calculated using
Equation 2.2.
( )
Equation 2.2
Where %E is the percentage exhaustion after dyeing, and are the concentrations
(gL-1
), measured at λmax, of the dyebath before and after dyeing, respectively.
2.7.2 Dye Fixation [15]
One of the main environmental concerns within the textile colouration industry is the
release of dyes from the process or material itself. In all cases, it depends on the level
and strength of fixation of dye with the fibre. Fixation is the amount of dye fixed with
the fibre after all the washes. The formula for fixation is given in Equation 2.3:
( )
( )
Equation 2.3
Where C0 = Initial concentration of dye;
Cs= Concentration of dye after dyeing;
CW1, CW2 are concentrations of the dye in each wash.
The fixation value of exhaust dyeing depends to a large extent on dyeing conditions.
The higher the affinity of the dye for the fibre or the lower the liquor ratio and dye
concentration, the higher is the fixation value for fibre and dye.
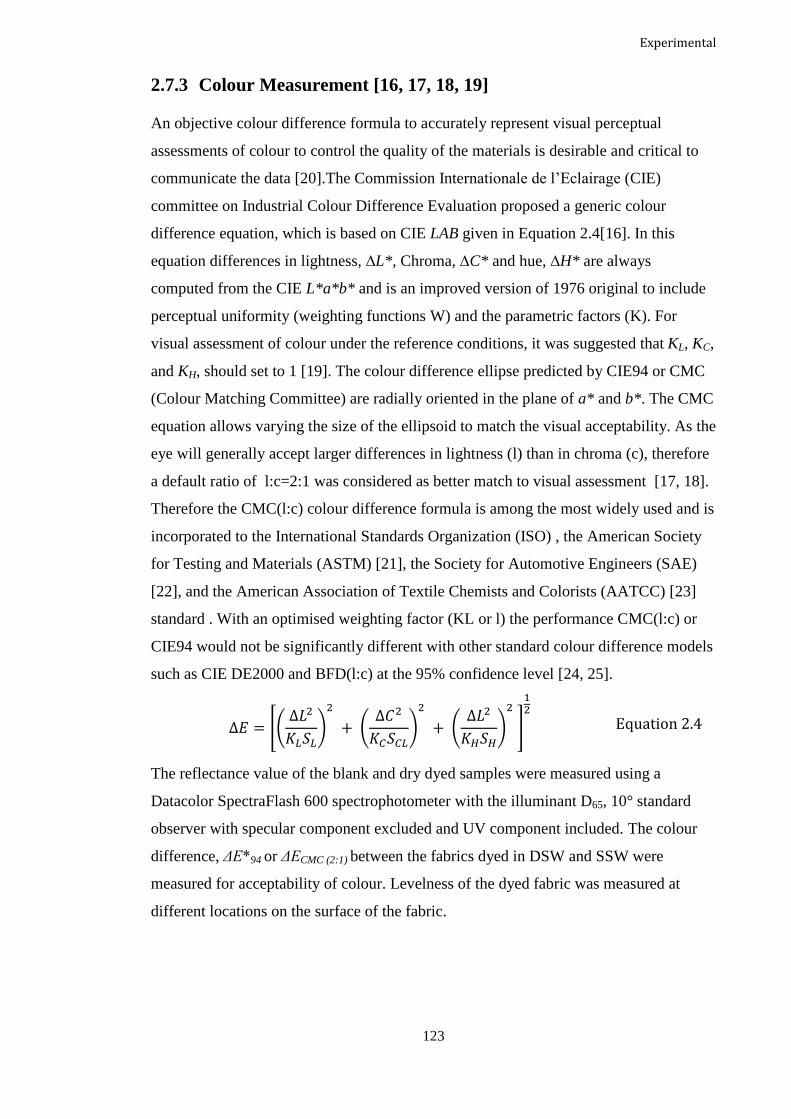
Experimental
123
2.7.3 Colour Measurement [16, 17, 18, 19]
An objective colour difference formula to accurately represent visual perceptual
assessments of colour to control the quality of the materials is desirable and critical to
communicate the data [20].The Commission Internationale de l’Eclairage (CIE)
committee on Industrial Colour Difference Evaluation proposed a generic colour
difference equation, which is based on CIE LAB given in Equation 2.4[16]. In this
equation differences in lightness, ∆L*, Chroma, ∆C* and hue, ∆H* are always
computed from the CIE L*a*b* and is an improved version of 1976 original to include
perceptual uniformity (weighting functions W) and the parametric factors (K). For
visual assessment of colour under the reference conditions, it was suggested that KL, KC,
and KH, should set to 1 [19]. The colour difference ellipse predicted by CIE94 or CMC
(Colour Matching Committee) are radially oriented in the plane of a* and b*. The CMC
equation allows varying the size of the ellipsoid to match the visual acceptability. As the
eye will generally accept larger differences in lightness (l) than in chroma (c), therefore
a default ratio of l:c=2:1 was considered as better match to visual assessment [17, 18].
Therefore the CMC(l:c) colour difference formula is among the most widely used and is
incorporated to the International Standards Organization (ISO) , the American Society
for Testing and Materials (ASTM) [21], the Society for Automotive Engineers (SAE)
[22], and the American Association of Textile Chemists and Colorists (AATCC) [23]
standard . With an optimised weighting factor (KL or l) the performance CMC(l:c) or
CIE94 would not be significantly different with other standard colour difference models
such as CIE DE2000 and BFD(l:c) at the 95% confidence level [24, 25].
[(
)
(
)
(
)
]
Equation 2.4
The reflectance value of the blank and dry dyed samples were measured using a
Datacolor SpectraFlash 600 spectrophotometer with the illuminant D65, 10° standard
observer with specular component excluded and UV component included. The colour
difference, ΔE*94 or ΔECMC (2:1) between the fabrics dyed in DSW and SSW were
measured for acceptability of colour. Levelness of the dyed fabric was measured at
different locations on the surface of the fabric.

Experimental
124
Measurement of colour strength, K/S was based on the reflectance values of dyed fabric
and was measured at λmax using the Kubelka-Munk, Equation 2.5 [26];
( )
Equation 2.5
Where K is the absorption coefficient, S is the scattering coefficient, and R is the
proportional reflectance of the dyed fabric at λmax.
2.7.4 Dye Removal
Following the exhaustion method, the dye removal after the coagulation/flocculation
and filtration process was determined by measuring absorbance with a Perkin Elmer
Lambda 18 UV-Vis Spectrophotometer (10 mm cell) using the Equation 2.6:
( )
Equation 2.6
Where is the absorbance before filtration (i.e. after dyeing) and is the absorbance
after the filtration process
2.7.5 Fastness
Wash fastness to domestic laundering was carried out according to the ISO 105-CO6
C2S and B2S test standard using a Roaches Washtec P (Roaches International, UK) and
a Gyrowash (James H. Heal, Halifax, UK). The tests were performed at 60°C with or
without steel balls (for wool) and SDC adjacent multi-fibre strips incorporated into
wash liquor solution [27]. The dry rubbing and sublimation fastness were assessed
according to the ISO 105-X12:2001 and ISO 105-PO1:1990 (210 ±2°C, 30 sec) test
standards, respectively. Alkaline perspiration fastness was determined according to the
ISO 105:EO4:1990 method while light fastness was measured using blue wool standard
ISO B02/02 in Weatherometer with a xenon arc lamp.
After testing, fabrics were visually assessed in a colour matching cabinet relative to the
standard grey scale according to ISO 105:A02 and ISO 105:A03 test methods in order
to determine the degree of colour change and cross-staining. In the nine-step grey scale,
rating 5 represents no colour difference between samples, which increases geometrically
when moving from 5 to 1. The choice of psychophysical method is a primary concern
during the assessment of colour change [28]. Before doing any visual assessment, the

Experimental
125
researcher was tested for normal colour vision. The researcher evaluated at least 5
samples within a viewing booth visually which were matched instrumentally to confirm
the visual rating. The same viewing cabinet and sample presentation conditions were
used in each case. It was reported that an ‘expert’ with experience in commercial shade
matching industry, on average, produced 43% higher visual difference ratings than a
‘novice’ who had no prior experience of commercial pass/fail colour difference
assessments at 95% confidence level [20]. Since the researcher has over 3 years of
experience of commercial shade matching, therefore visual assessment of colour change
and cross-staining was carried out for each dyed fabric.
2.7.6 Wettability Test
Wetting time was determined by the standard drop test (AATCC-39-1980), where a
drop of water was placed onto the fabric surface and spreading time was measured in
seconds until totally disappeared. If the drop of water had not completely disappeared
after 4800 seconds, the measurement was stopped, and the result value set to 4800
seconds. The time was selected because some filter media tested didn’t change their
wettability behaviour even after this time period.
2.7.7 Oil and Water Repellency
The oil and water repellency were performed using the 3M oil and water repellency
tests (AATCC 118-1972). A range of eight different water/isopropyl alcohol mixtures
and hydrocarbon liquids with different surface tensions were used [29]. At least three
drops of each test liquid were dropped onto the surface of the filter media, and evaluated
within the specified 60 seconds. The wetting rating was based on test liquids over a
scale of 1 to 8, with 8 being the highest water or oil repellency.
2.7.8 Tensile Strength
The tensile strength of wool dyed fabrics was measured using an Instron 3345 tensile
tester according to the BS EN ISO 13934-1:1999 method. 50 mm wide fabric samples
with a grip distance of 150 mm were used under standard conditions (20 ±1°C and 65
±2% RH) in laboratory for testing. Five separate samples were tested, and the mean
value calculated. A 5 kN load was applied with an extension speed of 100 mm/min.

Experimental
126
2.7.9 Abrasion Resistance
The abrasion resistance of the fabrics were determined according to the BS EN ISO
12947-2: 1999 method using a Martindale abrasion tester. Four circular fabric samples
of 38 mm from different area of same fabric were abraded against a standard worsted
wool abradant fabric at a constant pressure of 9 kPa. The standard abradant cloth was
replaced after 50,000 cycles. Abrasion resistance was measured by subjecting the test
sample to a geometric rubbing motion, known as Lissojous motion which was initially a
straight line and gradually becomes gradually a widening ellipse until it forms another
straight line in the opposite direction. The advantage of the Martindale abrasion test is
that the fabric sample gets abraded in all directions [30]. The number of cycles required
under 10 kPa to produce two yarn breaks for woven fabric or a hole in knit fabric was
considered as the end point of the testing for the particular sample [31]. After first 2000
cycles, the pills were cut from the fabric surface.
2.7.10 Turbidity Test
Industrially the quality of filtrate water is routinely monitored in water treatment plants
by turbidity measurements [32] and measurement of the degree of particulate
contamination in the water [33]. The higher the level of turbidity, the cloudier the water
is and vice versa. Turbidity is defined as an “expression of the optical property that
causes light to be scattered and absorbed rather than transmitted in straight lines through
the sample [9].” Turbidity is typically measured in Nephelometric Turbidity Units
(NTU) or in Jackson Turbidity units (JTU) but these measurements do not indicate the
size of the suspended particles in water, but rather the amount of particles. The turbidity
of the filtrate was measured using a Hach 2100Q portable turbidimeter, with an upper
limit of 1000 NTU, and five measurements were done for each filtrate and the average
NTU calculated.
2.7.11 Flow Rate and Solution Recovery %
The flow rate was determined by plotting the weight of the filtrate (100 g) against time
(seconds), and the average of two cycles was taken without changing the filter media.

Experimental
127
2.7.12 Filtrate Properties
The filtrate weight was measured after the filtration. The solution recovery was
calculated adding weight of filtrate and wet cake. Solid contents of the filtrate were
calculated from Equation 2.7 after drying in an oven for 24 hours at 80±3°C.
Equation 2.7
2.7.13 Properties of Filter cake
The moisture contents of the filter cake, as a weight percentage, were calculated
following the evaporation of water in an oven for at least 24 hours at 80°±3°C, Equation
2.8.
( )
Equation 2.8
The slurry thickness was measured with slide callipers at four different locations over
the filter cake and the average values were determined. The cake disposal rating was
assessed arbitrarily using a scale of 1 to 5, where 1 is very poor, and 5 is very good. A
description of this scale was given in Equation 2.4. The associated rating images for this
this research is given in Figure 2.5.
Table 2.4 Cake rating scale used in this research
Rating Interpretation Description
1 Very poor Cake is attached heavily with the bomb and the media, broke
down into pieces and needs extra effort while taking the cake out
2 Poor Cake is attached moderately to media and bomb, broke into mini
pieces while coming out from the bomb.
3 Moderate The number of chunks are regular in size and mild effort is
needed to remove from the bomb and media
4 Good Few chunks of cake, easy to remove from the filter bomb and
media
5 Very Good Cake fell down in one chunk from the filter bomb and the media
with no attachment

Experimental
128
Cake disposal rating: 1 Cake disposal rating: 2
Cake disposal rating: 3 Cake disposal rating: 4
Figure 2.5 Associated image for cake disposal rating used in this research. Since rating
5 is an unbroken flat cake it is not included here.
2.7.14 Kawabata Evaluation System (KES)
The KES system measured the tensile, shear, bending, surface and compression
properties of fabrics using similar forces to those applied by a human hand during the
subjective assessment of fabric handle [34]. Sixteen mechanical parameters were
determined using 20×20 cm fabric samples that had been conditioned at 201ºC and
652% relative humidity in a laboratory for 24 hours prior to analysis in an air-

Experimental
129
conditioned laboratory. The list of measured parameters for the test is given in Table
2.5. These parameters uniquely define the characteristics of fabric, known as a ‘handle
fingerprint,’ which then can be used for quality control and process characterisation.
Table 2.5 KES parameters for woven fabrics
Property Symbol Description Unit
Tensile
LT Linearity of extension curve -
WT Tensile energy gf.cm/cm2
RT Tensile Resilience %
EMT Extension at 500 gf.cm-1
load %
Shear
G Shear Stiffness gf.cm-1
.degree
2HG Shear Hysteresis (0.5º) gf.cm-1
2HG5 Shear Hysteresis (5.0º) gf.cm-1
Bending B Bending Stiffness gf.cm
2/cm
2HB Bending Hysteresis gf.cm/cm
Surface
MIU Coefficient of Friction -
MMD Mean Deviation of MIU -
SMD Geometrical Roughness µm
Compression
LC Linearity of Compression Curve -
WC Compression Energy gf.cm/cm2
RC Compression Resilience %
To Thickness at 0.5 gf.cm-2
Pressure mm
Tm Thickness at 50 gf.cm-2 Pressure mm
Weight W Weight Per Unit Area mg.cm-2
Primary Hand
Value
Koshi Stiffness -
Numeri Smoothness -
Fukurami Soft and Fullness -
Total Hand Value THV - -

Experimental
130
2.8 Microscopic and Spectroscopic Analysis
2.8.1 X-ray Photoelectron Spectroscopy (XPS)
XPS, which is also known as Electron Spectroscopy for Chemical Analysis (ESCA), is
an important and widely used analytical technique for surface analysis and is capable of
providing quantitative and qualitative information about fibre surfaces [35, 36, 37, 38].
The popularity of XPS techniques can be attributed to the breadth of information
obtained and flexibility in examining a wide variety of samples [39, 40]. While surface
and interface analysis is the main application of the technique, new promising areas of
measurement include magnetic properties, surface and bulk electronic structure, and
time-resolved processes including chemical kinetics [41]. XPS is particularly suited to
examining the fluorinated layers of filter media as it will specifically analyse the surface
active regions [42]. A Kratos Axis XPS spectrometer, equipped with an Al Kα (1486.69
eV) X-ray source and power of 150W was used to analyse the samples. Samples were
mounted onto the sample plate with double sided adhesive tape. The exposed surface
area was approximately 10 mm2. Binding energy values were calculated relative to the
C(1s) photoelectron peak at 285.0 eV. Wide scan spectra were taken at a pass energy of
80 eV for determining the surface composition of N, O, C and F while high resolution
spectra were obtained at pass energy of 40 eV in order to characterise the elemental
chemical states of C(1s), N(1s), O(1s) and F(1s). The analysis depth at the materials
surface was in the range of 1-5 nm. The data was analysed using the CASA XPS
software [43].
2.8.2 Attenuated Total Reflectance Fourier Transform Infrared (ATR
FTIR)
ATR-FTIR spectra of the modified media were collected using a Nicolet 5700
spectrophotometer equipped with a diamond crystal for a penetration depth analyses of
5-20μm. A total of 32 scans were recorded with a resolution of 4 cm-1
. The OMNIC
spectroscopy software was used to collect process and present the data.

Experimental
131
2.8.3 Surface Morphology Analysis by Scanning Electron Microscopy
The surface morphology of fibres and coatings were observed using a Hitachi S-4000
Scanning Electron Microscope (SEM), operating at an accelerating voltage of 5 kV. The
samples were coated with gold, under vacuum, prior to analysis in order to dissipate
charge. In addition, the elemental composition of acid-dyed wool fabric was determined
using an EDX (INCA PentafetX3) system operating at 10 to 15 kV. In this case samples
were coated with either carbon or gold.
2.8.4 Contact Angle Measurements
The hydrophobicity/hydrophilicity of a surface can be expressed in terms of liquid
wettability and can be quantified by contact angle measurements. The contact angle, θ,
is defined geometrically as the angle formed by a liquid at the three-phase boundary
where a liquid, gas and solid interact, as shown in Figure 2.6. A high value of θ
indicates the liquid is poorly wetting and vice-versa. If the angle θ is less than 90°, then
that liquid wets the solid. Alternatively if θ is greater than 90° it is said to be non-
wetting. A zero contact angle represents complete wetting. The primary focus of the
contact angles studies was in assessing the wetting characteristics of solid/liquid
interactions. Contact angle is commonly used as the most direct measure of wetting [9].
However, contact angle depends on many factors such as surface roughness, surface
heterogeneity, surface preparation and contamination, surface electrical charge,
surrounding environment, pressure, temperature, drop size and heat transfer [44].
Figure 2.6 Water droplet on a surface
The contact angle of each sample was measured using the T 458 om-84 method using
the drop shape analysis system based on the AB Lorentzen and Wettre (L & W) tester

Experimental
132
contact angle meter. The video contact angle system used distilled water with a drop
size of 0.004 µl ±10% as the test liquid. A Panasonic WV-CL700 camera, connected to
a video monitor, captured the image of the drop, with a background light for
illumination. After 60s of contact, the height (h) and width (a) of the drop were
measured from the base and then used to calculate the contact angle, α, from Equation
2.9. Four measurements were obtained at different locations over the media surface and
the mean presented. A measurement error of ±3° was typical.
Equation 2.9

Experimental
133
2.9 References
1. Culkin, F. and R. A. Cox, Sodium, potassium, magnesium, calcium and
strontium in sea water, Deep Sea Research and Oceanographic Abstracts, 1976,
13 (5), p.789-804.
2. Riley, J. P. and M. Tongudai, The major cation/chlorinity ratios in sea water,
Chemical Geology, 1967, 2, p.263-269.
3. Murray, J., Major ions of seawater, 2004, University of Washington.
4. Kester, D. R., I. W. Duedall, D. N. Connors and R. M. Pytkowicz, Preparation
of artificial seawater, Limnology & Oceanography, 1967, 12, p.176-179.
5. Riley, J. P. and G. Skirrow, Chemical oceanography, Vol. 1, 1965, Academic
press, London.
6. Harvey, H. W., The chemistry and fertility of seawaters, 1960, University Press,
Cambridge.
7. Cavanaugh. Appendix 4: Seawater Formulae. The Bioloogical Bulletin 1975
[cited 2010 Nov 16]; Available from:
http://www.mbl.edu/BiologicalBulletin/MMER/ECK/EckApp4.html.
8. Lydon, R., Filter media surface modification technology: state of the art,
Filtration & Separation, 2004, 41 (9), p.20-21.
9. Volooj, S., Investigation into the wet processing of Keratin fibres and filter
media, in Department of Textiles, 2003, The University of Manchester Institute
of Science and Technology, PhD Thesis, Manchester.
10. Purchas, D. B. and K. Sutherland, Handbook of filter media, 2nd ed., 2002,
Elsevier Advanced Technology, Oxford, ISBN 1856173755.
11. Huntsman, Ti oxide: Material safety data sheet, 2003, Huntsman. p.7.
12. Omya Inc. Proctor, V., Calcium Carbonate slurry: Material safety data sheet, in
Experimental Series, 2005, Omya Inc, Vermont USA. p.2.
13. Feralco, Product Data Sheet, 2011, Feralco UK Ltd, Cheshire.
14. Yukselen, M. A. and J. Gregory, The effect of rapid mixing on the break-up and
re-formation of flocs, Journal of Chemical Technology & Biotechnology, 2004,
79 (7), p.782-788.
15. Choudhury, A. K. R., Textile preparation and dyeing, 2006, Science Publishers,
Enfield, N.H.

Experimental
134
16. CIE, Technical report: Industrial colour-difference evaluation, Pub. No. 116,
1995, Central Bureau of the CIE, Vienna, Austria.
17. Melgosa, M., Testing CIELAB-based color-difference formulas, Color Research
& Application, 2000, 25 (1), p.49-55.
18. X-Rite, A guide to understanding color communication, 2007, Michigan, US.
19. Guan, S. S. and M. R. Luo, A colour-difference formula for assessing large
colour differences, Color Research & Application, 1999, 24 (5), p.344-355.
20. Shamey, R., L. M. Cárdenas, D. Hinks and R. Woodard, Comparison of naïve
and expert subjects in the assessment of small color differences, Journal of the
Optical Society of America A, 2010, 27 (6), p.1482-1489.
21. ASTM, ASTM D2244-07: Standard practice for calculation of color tolerances
and color differences from instrumentally measured color coordinates, 2007,
ASTM International.
22. SAE, SAE J1767: Instrumental color difference measurements for color fastness
of automotive interior trim materials 1995, Society for Automotive Engineers.
23. AATCC, Test Method 173-1998, “CMC: Calculation of small color differences
for acceptability, in AATCC Technical Manual 2005, American Association of
Textile Chemists and Colorists. p.311–315.
24. Geol Lee, S., R. Shamey, D. Hinks and W. Jasper, Development of a
comprehensive visual dataset based on a CIE blue color center: Assessment of
color difference formulae using various statistical methods, Color Research &
Application, 2011, 36 (1), p.27-41.
25. Gibert, J. M., J. M. Dagà, E. J. Gilabert, J. Valldeperas and G. The Colorimetry,
Evaluation of colour difference formulae, Coloration Technology, 2005, 121 (3),
p.147-152.
26. Judd, D. B. and G. Wysezcki, Colour in business, science and industry, 3rd ed.,
1975, John Wiley & Sons, New York.
27. SDC, Standard Methods for the Determination of the Colour Fastness of
Textiles and Leather Amendment No. 1, 5th ed, 1992, Society of Dyers and
Colourists, Bradford, UK.
28. Montag, E. D. and D. C. Wilber, A comparison of constant stimuli and gray-
scale methods of color difference scaling, Color Research & Application, 2003,
28 (1), p.36-44.
29. 3M, Water repellency test II water/alcohol drop test, 3M Test Methods (Oct
1988). 3M oil repellency test I, 3M Test Methods (Oct 1988).

Experimental
135
30. Özdil, N., G. Ö. Kayseri and G. S. Mengüç, Analysis of Abrasion
Characteristics in Textiles Abrasion Resistance of Materials, ed. M. Adamiak,
2012, InTech, ISBN 978-953-51-0300-4.
31. ISO, 12947-2:1999 Textiles—Determination of theabrasion resistance of fabrics
by the Martindale method—Part 2: Determination of specimen break down,
1999.
32. Sethi, V., R. M. Clark, E. W. Rice, P. Patnaik and P. Biswas, Evaluation of
optical detection methods for waterborne suspensions, Journal of the American
Water Works Association, 1997, 89 (2), p.98-112.
33. Gregory, J., Turbidity and beyond, Filtration & Separation, 1997, 35 (1), p.63-
67.
34. Kawabata, S., The standardization and analysis of hand evaluation, 1980,
Textile Machinery Society of Japan, Osaka, Japan.
35. Carley, A. F., Surface analysis: X-ray photoelectron spectroscopy, in
Encyclopedia of Materials: Science and Technology, K. H. J. Buschow, W. C.
Robert, C. F. Merton, I. Bernard, J. K. Edward, M. Subhash, and V. Patrick,
Editors, 2001, Elsevier, Oxford, p.8991-8996.
36. Chusuei, C. C. and D. W. Goodman, X-Ray Photoelectron Spectroscopy, in
Encyclopedia of Physical Science and Technology, A. M. Robert, Editor, 2001,
Academic Press, New York, p.921-938.
37. Hercules, D. M., Electron spectroscopy: applications for chemical analysis,
Journal of Chemical Education, 2004, 81 (12), p.1751-1766.
38. Tougaard, S., Surface Analysis | X-Ray Photoelectron Spectroscopy, in
Encyclopedia of Analytical Science, P. Worsfold, A. Townshend, and C. Poole,
Editors, 2005, Elsevier, Oxford, p.446-456.
39. Vickerman, J. C. and A. J. Swift, Chapter 5, in Surface analysis- The Principal
Technique, 1997, John Wiley and Sons Ltd.
40. Briggs, D., Chapter 4, in Surface analysis of polymers by XPS and static SIMS,
1998, Cambridge University Press.
41. Fadley, C. S., X-ray photoelectron spectroscopy: Progress and perspectives,
Journal of Electron Spectroscopy and Related Phenomena, 2010, 178-179, p.2-
32.
42. Mohr, J. M., D. R. Paul, Y. Tam, T. E. Mlsna and R. J. Lagow, Surface
fluorination of composite membranes. Part II. Characterization of the
fluorinated layer, Journal of Membrane Science, 1991, 55 (1-2), p.149-171.

Experimental
136
43. Walton, J., P. Wincott, N. Fairley and A. Carrick, Peak Fitting with CasaXPS,
2010, Acolyte Science, Cheshire.
44. Yekta-Fard, M. and A. B. Ponter, Factors affecting the wettability of polymer
surfaces, Journal of Adhesion Science and Technology, 1992, 6 (2), p.253-277.

137
Part A: Dyeing of Textiles in Distilled
Water and Simulated Seawater

Wool/Acid dyes
138
3. Dyeing of Wool with Acid dyes
3.1 Introduction
Wool is the most extensively used natural fibre after cotton and is a heterogeneous fibre
both chemically and physically. There are about 25-70% impurities in raw wool, which
includes suint, grease, dirt and vegetable matter [1]. Clean wool is a protein
biopolymer, of which about 82% is keratin. In wool, the amount of amino and
carboxylic acid groups are almost equal (820 and 770 mmolg-1
, respectively) [2]. Acid,
metal-complex, chrome, and reactive dyes may be used for wool dyeing [1]. The dye is
anionic in aqueous solution and is therefore attracted to the cationic ammonium ion in
the protein fibre, Scheme 3.1.
Wool –NH2 + H+
+ HSO4- Wool-NH3
+HSO4
-
Wool-NH3+HSO4
- + Dye-SO3
- Wool-NH3
+Dye-SO3
- + HSO4
-
Scheme 3.1 Mechanism of wool and acid dye
Acid dyes have molecular weights in the range 300–1000 gmol-1
. The commercially
available acid dye ranges varies enormously in respect to molecular size and the polarity
of the molecule. Most dyestuffs are monosodium sulphonates or carboxylates [3]. In
general, higher molecular mass and low polarity dyes would show the highest wet
fastness with low migration properties and vice versa, Figure 3.1.
Figure 3.1 Classification of wool dyestuffs in relation to migration and fastness [3]
Fast
acid
1:1 Metal
Complex
Sandolan
MF
Level
Dyeing
acid
Super
milling /
1:2 metal
complex
Milling
Chrome
Reactive
Fastness
Lev
elli
ng/m
igra
tion

Wool/Acid dyes
139
In this chapter, wool fibre was tested in simulated seawater environment with
commercially available acid and metal complex dyes and the performances of the fabric
were evaluated against that in freshwater.
3.2 Experimental
3.2.1 Materials
A woven 100% wool botany serge (2/2 twill, scoured and set) fabric (295 gm-2
) was
supplied by Whaley’s (Bradford) Ltd. In order to encompass the whole spectrum of
available acid and metal complex dyes, five different commercial ranges were selected
These are the acid milling, levelling, metal complex and mixture of these dyes, Table
3.1 to 3.6, and were kindly donated by Clariant, Everlight and Huntsman and assessed
over a range of colour depths, given in Section 3.2.2. The structures of the some
available dyes were given in Figure 3.2.
Table 3.1 Sandolan E acid dyes used in this study and their characteristics
Manufacturer Dye Structure/CI
number Dye Class Properties of dye
Clariant
Sandolan Rubylon
E-3GSL
Monoazo Levelling Exhibits high migration
power with good
penetration and high
light fastness. They are
particularly used for
piece dyeing and the
hat industry.
Sandolan Blue E-
FBLL
Anthraquinone Levelling
Sandolan Yellow
E-2GL
CI Acid Yellow
17
Levelling

Wool/Acid dyes
140
Table 3.2 Lanasan CF acid dyes used in this study and their characteristics
Manufacturer Dye Structure/CI
number Dye Class Properties of dye
Clariant
Lanasan Red
CF-WN
Blend of acid
milling and 1:2
metal complex
Metal Produces ‘Frostless
wool’ through good
levelness and optimized
root-tip distribution.
Have a wide colour
spectrum, economical
cost with high fastness.
The dyeing process is
in the isoelectric region
in order to minimise
strength loss [4].
Lanasan Brilliant CF-
BA combination
contains brightening
element.
Lanasan
Brilliant Blue
CF-BA
1:2 Metal
Complex, Acid
Blue 256
Milling
Lanasan
Brilliant
Yellow CF-
BA
Blend of acid
milling and 1:2
metal complex
Milling
Table 3.3 Sandolan MF acid dyes used in this study and their characteristics
Manufacturer Dye Structure/CI
number Dye Class Properties of dye
Clariant
Sandolan Red
MF-GRLN
Mixture of
monosulphonated
half milling and
disulphonated
milling
Levelling,
Fast Acid
Eco-friendly and is
gentle dyeing to piece
goods and yarn [4].
Sandolan MF dyes are
claimed to be the
fastest acid dyes with
good migration
properties relative to its
molecular size range
[3]. Sandolan MF
offers trichromatic
dyeing in the isoelectric
region at low
temperature.
Sandolan
Blue MF-GL
Mixture of
monosulphonated
half milling and
disulphonated
millling
Levelling,
Fast Acid
Sandolan
Golden
Yellow MF-
RLN
Mixture of
monosulphonated
half milling and
disulphonated
millling
Levelling,
Fast Acid

Wool/Acid dyes
141
Table 3.4 Lanasyn S acid dyes used in this study and their characteristics
Manufacturer Dye Structure/CI
number Dye Class Properties of dye
Sandoz/
Clariant
Lanasyn Red
S-G
Monosulphonated,
CI Acid Red 315
1:2 Metal
Complex
Very good light and
wet fastness properties
with simple and
reliable dyeing process
[3]. Especially suitable
for the low temperature
dyeing of loose stock or
tops and knitted goods
[5].
Lanasyn Blue
S-GB
Monosulphonated 1:2 Metal
Complex
Lanasyn
Yellow S-GB
Monosulphonated 1:2 Metal
Complex
Lanasyn
Black S-G
Monosulphonated 1:2 Metal
Complex
Table 3.5 Lanaset acid dyes used in this study and their characteristics
Manufacturer Dye Structure/CI
number Dye Class Properties of dye
Huntsman/
Ciba
Lanaset Red
G
Monoazo 1:2 Metal
Complex
Shows good
combination with other
dyes and covers root-
tip differences. These
are considered ideal for
polyester/wool blends
with good build-up
during dyeing and good
fastness [6].
Lanaset Blue
2R
Anthraquinone, CI
Acid Blue 225
1:2 Metal
Complex
Lanaset
Yellow 2R
Azo, CI Acid
Yellow 220
1:2 Metal
Complex
Lanaset
Black B
Monoazo, CI Acid
Black 172 and a
non-CI Acid Black
1:2 Metal
Complex
Table 3.6 Other Acid Black dyes used and their characteristics
Manufacturer Dye Structure/CI
number Dye Class Properties of dye
Clariant Sandolan
Black NR
Disulphonated Milling N/A
Everlight
Chemical
Everacid
Black LD
CI Acid Black 172 Metal
complex
Provides deep colour
and high light and wet
fastness [7]

Wool/Acid dyes
142
Figure 3.2 Structure of acid dyes used in this study a) Everacid Black LD CI Acid Black
172; b) Sandolan Yellow E-2GL CI Acid Yellow 17; c) Lanaset Blue 2R- CI Acid Blue
225; d) Lanaset Yellow 2R CI Acid Yellow 220.
3.2.2 Dyeing
All dyeings were performed using a Mathis IR laboratory dyeing machine using both
DSW and SSW, at a liquor to goods ratio of 10:1 and a pH of 4.5-5.5 (pH adjusted with
acetic acid/acetate buffer) or pH 3.0-3.5 for the Sandolan E range (pH adjusted with
sulphuric acid). The dye application levels were 0.05, 1.0 and 3.0% on mass of fibre
(o.m.f.) for the red, blue and yellow dyes and 1.0, 2.0, and 4.0% o.m.f. for the black
dyes. The recommended commercial dyeing conditions commenced at 40-50ºC, raised
to 98ºC at 2ºC per minute and the dyebath maintained at 98ºC for 45 minutes, or for 60
minutes with the black dyes. In addition to dye, the aqueous bath contained a non-ionic
wetting agent (Matexil WA-KBN, ICI) and the levelling agents recommended by the
dye manufacturers i.e. Lyogen MF and Albegal Set [4] at 1-2 gL-1
. The recommended
10% (o.m.f.) sodium sulphate was not added to simulated seawater baths for Sandolan
E, Sandolan MF and Sandolan N-R dyeings. The dyeings were performed in duplicate
to confirm reproducibility.
(a)
(b)
(c)
(d)
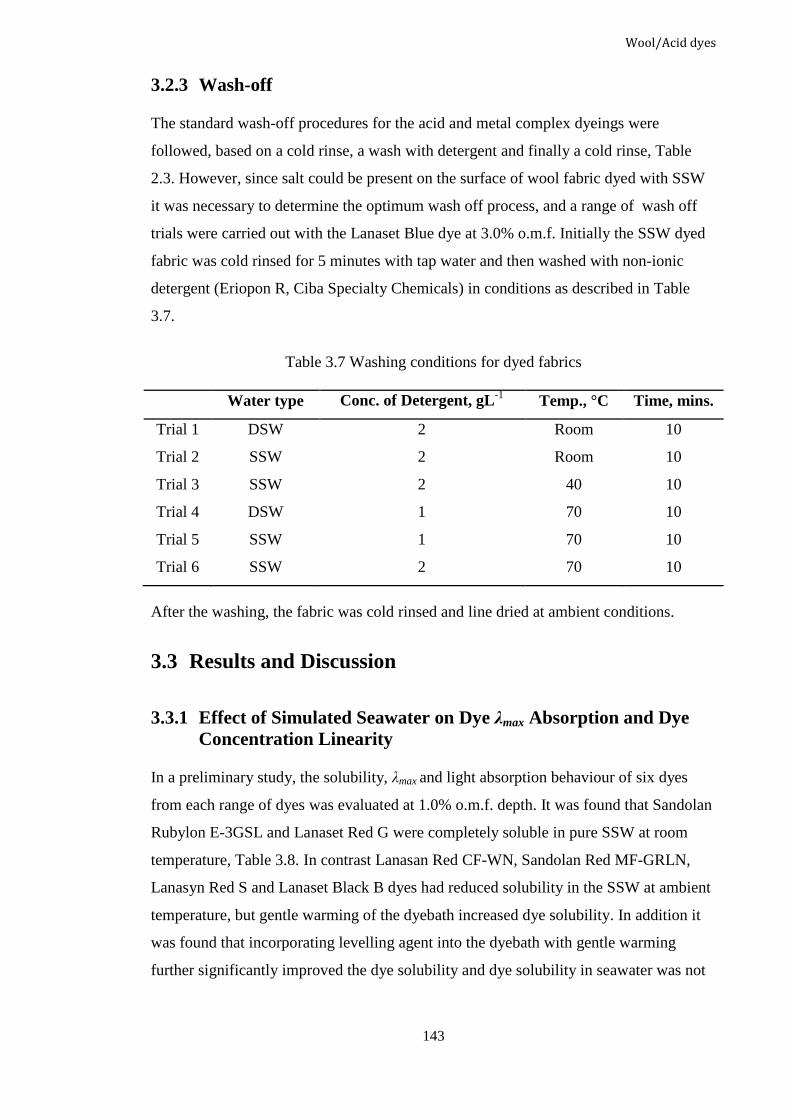
Wool/Acid dyes
143
3.2.3 Wash-off
The standard wash-off procedures for the acid and metal complex dyeings were
followed, based on a cold rinse, a wash with detergent and finally a cold rinse, Table
2.3. However, since salt could be present on the surface of wool fabric dyed with SSW
it was necessary to determine the optimum wash off process, and a range of wash off
trials were carried out with the Lanaset Blue dye at 3.0% o.m.f. Initially the SSW dyed
fabric was cold rinsed for 5 minutes with tap water and then washed with non-ionic
detergent (Eriopon R, Ciba Specialty Chemicals) in conditions as described in Table
3.7.
Table 3.7 Washing conditions for dyed fabrics
Water type Conc. of Detergent, gL-1
Temp., °C Time, mins.
Trial 1 DSW 2 Room 10
Trial 2 SSW 2 Room 10
Trial 3 SSW 2 40 10
Trial 4 DSW 1 70 10
Trial 5 SSW 1 70 10
Trial 6 SSW 2 70 10
After the washing, the fabric was cold rinsed and line dried at ambient conditions.
3.3 Results and Discussion
3.3.1 Effect of Simulated Seawater on Dye λmax Absorption and Dye
Concentration Linearity
In a preliminary study, the solubility, λmax and light absorption behaviour of six dyes
from each range of dyes was evaluated at 1.0% o.m.f. depth. It was found that Sandolan
Rubylon E-3GSL and Lanaset Red G were completely soluble in pure SSW at room
temperature, Table 3.8. In contrast Lanasan Red CF-WN, Sandolan Red MF-GRLN,
Lanasyn Red S and Lanaset Black B dyes had reduced solubility in the SSW at ambient
temperature, but gentle warming of the dyebath increased dye solubility. In addition it
was found that incorporating levelling agent into the dyebath with gentle warming
further significantly improved the dye solubility and dye solubility in seawater was not

Wool/Acid dyes
144
envisaged to be a processing problem. A slight shift of λmax was observed when dyeing
auxiliaries were present, however, comparable results were observed with both DSW
and SSW.
Table 3.8 λmax for wool dyes in distilled and simulated saltwater solutions
λmax, nm
DSW SSW DSW + chemicals SSW + chemicals
Lanasan Red CF-WN 498 -* 504 503
Sandolan Rubylon E-3GSL 512 510 512 512
Sandolan Red MF-GRLN 494 -* 501 501
Lanasyn Red S-G 501 -* 503 -*
Lanaset Red G 494 494 502 501
Lanaset Black B 572 -* 583 581
* Insoluble dyes were found after heating and cooling, therefore the measurement was
not performed.
Previously Valko [8] found that higher amounts of salt causes higher dye aggregation,
but increasing the temperature of dyebath reduced aggregation either by complete
dispersion or dissolution. Further studies of acid dyes at 55, 75 and 95°C showed that
dyes were highly aggregated, particularly when the non-polar nature of the dyes
increased [9].
The addition of levelling agents was reported to reduce dye aggregation [10] and was
particularly effective in covering tippy dyeing, even with dyes which are more likely to
produce these faults [11] and allow reproducibility with high exhaustion [3]. The
amphoteric levelling agents that are used in this study, Lyogen MF and Albegal SET,
are dye-substantive in acidic media [12]. Lyogen MF is based on an ethoxylated tertiary
aliphatic amine [13] and Albegal SET is based on a modified nitrogen-containing fatty
alcohol ethoxylates [14]. Both are able to form dye/complexes and capable of tolerating
high salinity, especially in the presence of divalent magnesium and calcium cations
[15].
The dye absorbance studies indicated that for all six dyes in SSW the
absorbance/concentration graphs were linear and comparable to the DSW based
dyebaths, Figure 3.3 and 3.4, thus obeying Beer-Lambert Law.

Wool/Acid dyes
145
Figure 3.3 Graph of Sandolan Rubylon E-3GSL dye absorbance versus concentration in
water, λmax 512nm, ▲ - distilled water dyeing; and ■ - simulated seawater dyeing.
Figure 3.4 Graph of Lanaset Black B dye absorbance versus concentration in water
with dyebath auxiliaries, λmax 583nm, ▲ - distilled water dyeing; and ■ - simulated
seawater dyeing.
RDSW² = 0.999
RSSW² = 0.988
0.00
0.50
1.00
1.50
2.00
2.50
3.00
3.50
0.00 0.05 0.10 0.15 0.20 0.25 0.30
Ab
sorb
an
ce, A
Concentration, gL-1
RDSW+ Auxiliaries² = 0.989
RSSW+ Auxiliaries² = 0.997
0.00
0.50
1.00
1.50
2.00
2.50
3.00
3.50
4.00
4.50
0.00 0.05 0.10 0.15 0.20 0.25 0.30
Ab
sorb
an
ce, A
Concentration, gL-1

Wool/Acid dyes
146
3.3.2 Effect of Wash-off on Fibre Topography
SEM analysis of dyed fabrics followed by different wash-off conditions, Table 3.7,
showed that the fibre surfaces were relatively smooth and uniform for the DSW dyed
fabrics. Similarly, no cracking or etching on the surface of wool was visible for SSW
dyed fabric at a magnification of 1.0K, Figure 3.5a. However, examination of the fibre
surfaces at higher magnification indicated some particulates were present on the fibre
surface, Figure 3.5b. Fabric dyed in DSW also exhibited similar surface properties,
albeit in a lower quantity. Examination of the surface particulates using X-ray
microanalysis indicated the absence of sodium, magnesium, calcium or chloride or other
inorganics and suggested that the material was organic in nature, Figure 3.6.
Figure 3.5 SEM micrographs of dyed wool fabric washed in a) 2 gL-1
detergent at room
temperature for 10 minutes in SSW, magnification x 1.0 K; b) 2 gL-1
detergent at 70°C
for 10 min in SSW, magnification x4.0 K.
a) b)

Wool/Acid dyes
147
Figure 3.6 SEM X-ray microanalysis of dyed wool that had been washed in 2 gL-1
detergent at room temperature for 10 minutes in DSW.
Although SEM/EDX analysis showed none of the wash-off processes left any sodium
chloride deposits on the fibre surface, a 2gL-1
at 70°C for 10 minutes standard wash-off
process was selected for further studies.
3.3.3 Effect of Saline Environment on Wool
The wettability of fibre in dyeing medium is very crucial factor, as it can influence the
uptake of dyes from the solution. The outer layers of the fibre surface plays an
important role in wettability and dye penetration and the permeability of water is
influenced by cell membrane lipids [16]. The interaction between wool and liquid water
is complex and depends on the binding strength, with water being bound to wool with

Wool/Acid dyes
148
varying strength [17]. Both adsorption to the surface and swelling are reported to
contribute to fibre wettability [18, 19]. Chemical degradation of wool results in
cleavage of the surface long chain fatty acids linked by ester and thioester bonds to the
surface protein [20].
In a study of water absorbency in untreated wool in the presence of 1M salt solution at
29°C, Nostro [16] showed that behaviour of wool in highly saline water depends on the
specific ion-ion pairing, which follows ‘Hofmeister effects’ and is dominated by
dispersion forces. Anions and cations have different effects on the water absorption
where anions induce stronger variations in the amount of absorbed water. When
compared to water with no salts, anions can reduce water absorbency significantly, with
the following order sequence, Scheme 3.2:
F- ≈ HCOO
- > WO4
2- > SO3
2- ≈ SO4
2- > VO3
- > Cl
- > SiF6
2- > H2PO4
- ≈ IO3
- ≈ CO3
2- >
NO3- > SeO4
2- > ClO3
- > Br
- > NO2
- > CH3COO
- > BrO3
- > I
- > ClO4
- ≈ SCN
- > N3
- >
PO43-
> CrO42-
Scheme 3.2 Effects of anions on water absorbency
Similarly when cations are considered, trivalent ions have lower solubility compared to
divalent or monovalent species. Thus for chlorides the absorbency order is, Scheme 3.3.
Al3+
> Cr3+
> Mg2+
> Ca2+
> K+ ≈ NH4
+ > Rb
+ ≈ Na
+ ≈ Sr
2+ > Cs
+ > Ba
2+ ≈ Li
+
Scheme 3.3 Effects of cations of chlorides on water absorbency
This peculiar behaviour of chlorides with different cations can be attributed to the
interplay of the positive and the negative ions, and essentially depends on the specific
ion pair.
3.3.4 Effects of Salts on Wool/Acid Dye System
Wool contains both cationic and anionic functionalities, and under acidic dyeing
conditions ionic interactions prevail as main bonding mechanism with fibre. However, it
was reported that salt affects both ionic and hydrophobic interactions between the fibre
and dye [21], and this phenomenon has been reported for both acid and cationic dyes
[22, 23], where salt affects the dyeing properties by reducing ionic interactions between
fibre and dye. Thus for acid and cationic dyes, salt reduces dye sorption due to reduced

Wool/Acid dyes
149
ionic attraction between dye and fibre, whereas for direct and reactive dye, salt
increased dye sorption due to reduced ionic repulsion between dye and fibre [24]. It has
been reported that in saline dyebath the dye sorption is a function of combined effects of
ionic and physical interactions [23, 25, 26, 27]. At low salt concentration (e.g. <
0.05M), electrolytes provide stronger ionic interactions than physical interactions,
which resulted in decreased dye sorption. In contrast when salt concentration increased
(e.g. > 0.50M), for some anions such as sulphates and phosphates, the effect of physical
interactions exceeded the ionic interactions resulting an increased dye sorption [24].
The exhaustion levels of the 15 dyes onto wool in DSW and SSW was in the range of
78% to 98%, Table 3.9, 3.10 and 3.11. The swelling of wool can be affected by salts,
acids and other chemicals [28] and exhaustion values depend on the structure of fibre
and dyeing conditions. However, it appears SSW does not have any major impact on the
uptake of dyes into wool fibre. It has been reported that that sorption of dyes also
depends on type of electrolytes. NaCl and NaNO3 reportedly decreased the dye
adsorption due to the reduction of ionic attraction, but for Na2SO4 and NaH2PO4 the
adsorption behaviour is less clear [24, 29]. Therefore the slightly increased value of
exhaustion observed in some cases in the SSW dyeing can be explained by the
increased physical interactions between the dye and fibre. This result agreed with other
studies where at very high concentrations of salt dye sorption increased for acid dyes on
wool [25, 26]. This phenomenon is explained by increased hydrophobic/ physical
interactions between the dye and fibre, although a salt-out effect has also been widely
considered. The salt-out effect results in a strong interaction between water and salt
ions, and as the relative concentration of dye increases the dye sorption increases [26].
The addition of Na2SO4 as reported by Duffield [3] increased exhaustion for the
levelling and fast acid dyes, such as Sandolan E and Sandolan MF, respectively. In the
absence of Na2SO4, SSW dyed fabric produced similar exhaustion values indicating the
salts present in SSW fulfilled the function of the Glauber’s salt.

Wool/Acid dyes
150
Table 3.9 Exhaustion levels of Acid Red dyes at 0.05, 1.0 and 3.0% o.m.f. on wool
Dye Applied
Dye Exhaustion, % at Specified Application Level
0.05%
o.m.f.+
0.05%
o.m.f. *
1.0%
o.m.f.+
1.0%
o.m.f.*
3.0%
o.m.f.+
3.0%
o.m.f.*
Lanasan Red CF-WN 95.1 96.0 91.0 90.8 90.8 90.4
Sandolan Rubylon E-3GSL 95.2 94.3 92.2 90.8 90.4 91.6
Sandolan Red MF-GRLN 98.0 98.1 89.2 90.6 81.0 79.3
Lanasyn Red S-G 97.9 97.4 94.3 93.4 92.9 92.4
Lanaset Red G 98.0 96.7 85.9 89.7 84.8 87.6
+ Dyed in distilled water
* Dyed in simulated seawater
Table 3.10 Exhaustion levels of Acid Blue dyes at 0.05, 1.0 and 3.0% o.m.f. on wool
Dye Applied
Dye Exhaustion, % at Specified Application Level
0.05%
o.m.f.+
0.05%
o.m.f. *
1.0%
o.m.f.+
1.0%
o.m.f.*
3.0%
o.m.f.+
3.0%
o.m.f.*
Lanasan Brilliant Blue CF-BA 97.2 96.5 89.9 90.2 80.3 82.2
Sandolan Blue E-FBLL 98.0 96.9 97.4 95.8 96.9 95.9
Sandolan Blue MF-GL 92.9 93.3 91.1 91.8 88.4 90.8
Lanasyn Blue S-GB 93.7 91.7 88.2 87.6 83.2 85.0
Lanaset Blue 2R 93.0 97.8 93.5 94.5 92.3 92.5
+ Dyed in distilled water
* Dyed in simulated seawater
Table 3.11 Exhaustion levels of Acid Yellow dyes at 0.05, 1.0 and 3.0% o.m.f. on wool
Dye Applied
Dye Exhaustion, % at Specified Application Level
0.05%
o.m.f.+
0.05%
o.m.f. *
1.0%
o.m.f.+
1.0%
o.m.f.*
3.0%
o.m.f.+
3.0%
o.m.f.*
Lanasan Brilliant Yellow CF-BA 96.2 95.6 86.6 85.7 88.8 87.3
Sandolan Yellow E-2GL 97.8 96.7 96.0 96.3 95.9 96.2
Sandolan Golden Yellow MF-RLN 84.5 89.4 83.5 85.1 80.4 77.4
Lanasyn Yellow S-2GL 93.8 92.1 90.1 88.4 89.2 87.2
Lanaset Yellow 2R 94.1 94.1 84.6 81.0 82.2 80.8
+ Dyed in distilled water
* Dyed in simulated seawater
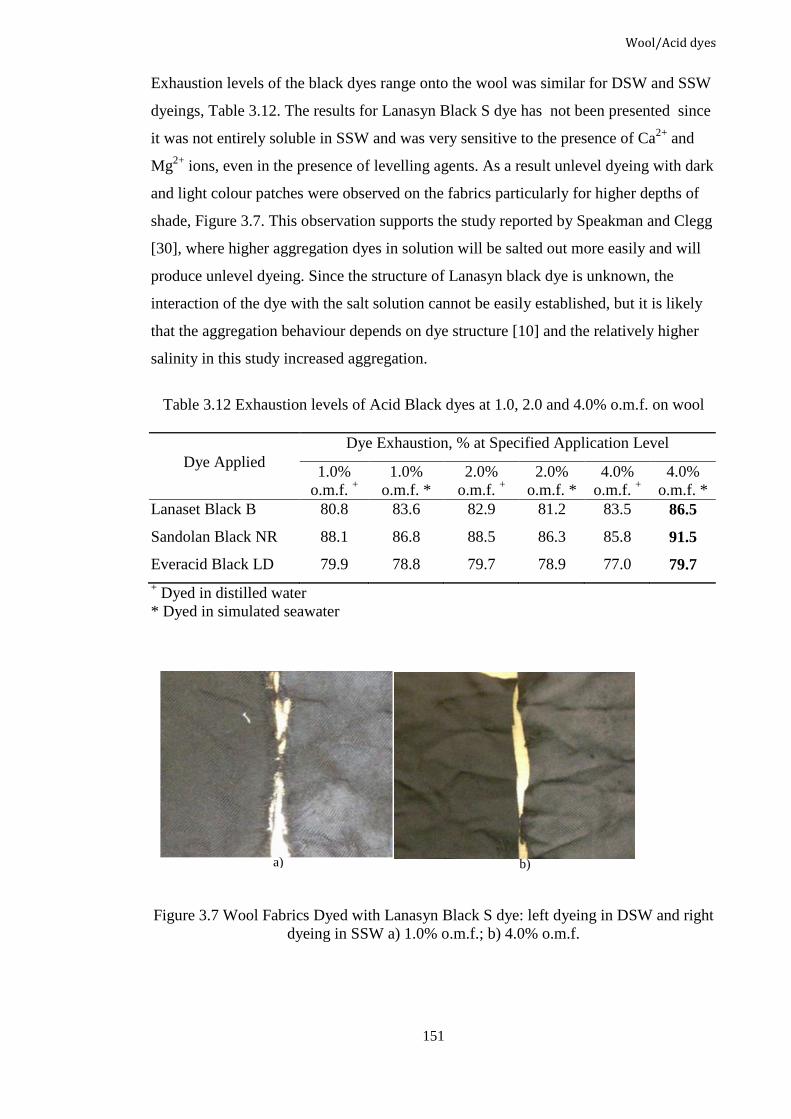
Wool/Acid dyes
151
Exhaustion levels of the black dyes range onto the wool was similar for DSW and SSW
dyeings, Table 3.12. The results for Lanasyn Black S dye has not been presented since
it was not entirely soluble in SSW and was very sensitive to the presence of Ca2+
and
Mg2+
ions, even in the presence of levelling agents. As a result unlevel dyeing with dark
and light colour patches were observed on the fabrics particularly for higher depths of
shade, Figure 3.7. This observation supports the study reported by Speakman and Clegg
[30], where higher aggregation dyes in solution will be salted out more easily and will
produce unlevel dyeing. Since the structure of Lanasyn black dye is unknown, the
interaction of the dye with the salt solution cannot be easily established, but it is likely
that the aggregation behaviour depends on dye structure [10] and the relatively higher
salinity in this study increased aggregation.
Table 3.12 Exhaustion levels of Acid Black dyes at 1.0, 2.0 and 4.0% o.m.f. on wool
Dye Applied
Dye Exhaustion, % at Specified Application Level
1.0%
o.m.f. +
1.0%
o.m.f. *
2.0%
o.m.f. +
2.0%
o.m.f. *
4.0%
o.m.f. +
4.0%
o.m.f. *
Lanaset Black B 80.8 83.6 82.9 81.2 83.5 86.5
Sandolan Black NR 88.1 86.8 88.5 86.3 85.8 91.5
Everacid Black LD 79.9 78.8 79.7 78.9 77.0 79.7
+ Dyed in distilled water
* Dyed in simulated seawater
Figure 3.7 Wool Fabrics Dyed with Lanasyn Black S dye: left dyeing in DSW and right
dyeing in SSW a) 1.0% o.m.f.; b) 4.0% o.m.f.
b) a)

Wool/Acid dyes
152
3.3.5 Colour Characteristics
In this research three application levels of dye were used to determine the build-up of
colour on wool in DSW and SSW dyebath and λmax to measure colour strength, K/Sλmax,
was within acceptable 5 nm ranges to each other.
Table 3.13, 3.14, 3.15, and 3.16 indicated that increasing the dye application level
similarly increased K/Sλmax of the fabrics dyed in DSW and SSW, irrespective of the
saline solution of SSW. In general, the K/Sλmax values of the fabrics dyed in SSW, for all
the dye ranges, were comparable to the DSW dyeings, as expected from the exhaustion
values in 3.3.4. For Lanasyn Red and Blue dyes and Yellow dyes, at the 3% o.m.f.
level, higher K/Sλmax values were observed, possibly due to the increased hydrophobic
interactions. The on-tone dye build up with increasing dye application indicated that
successful dyeing could be achieved in SSW with the milling to metal dye complex
ranges.
Table 3.13 K/Sλmax, of Acid Red dyes at 0.05, 1.0 and 3.0% o.m.f. on wool fabric
Dye Applied
K/Sλmax
0.05%
o.m.f.+
0.05%
o.m.f.*
1.0%
o.m.f.+
1.0%
o.m.f.*
3.0%
o.m.f.+
3.0%
o.m.f.*
Lanasan Red CF-WN 0.5 0.5 7.5 6.8 23.3 22.4
Sandolan Rubylon E-3GSL 0.7 0.7 8.2 7.9 20.2 19.1
Sandolan Red MF-GRLN 0.8 0.8 10.0 10.0 26.1 25.6
Lanasyn Red S-G 0.8 0.9 15.2 15.3 29.8 33.9
Lanaset Red G 0.9 0.9 11.0 10.8 27.0 27.9
+ Dyed in distilled water
* Dyed in simulated seawater

Wool/Acid dyes
153
Table 3.14 K/Sλmax, of Acid Blue dyes at 0.05, 1.0 and 3.0% o.m.f. wool fabric
Dye Applied
K/Sλmax
0.05%
o.m.f.+
0.05%
o.m.f.*
1.0%
o.m.f.+
1.0%
o.m.f.*
3.0%
o.m.f.+
3.0%
o.m.f.*
Lanasan Brilliant Blue CF-BA 0.7 0.6 9.2 8.9 24.4 25.1
Sandolan Blue E-FBLL 0.6 0.6 3.1 3.2 12.6 10.1
Sandolan Blue MF-GL 0.8 0.8 9.9 10.4 27.9 27.5
Lanasyn Blue S-GB 0.5 0.4 7.4 6.5 21.7 22.2
Lanaset Blue 2R 0.6 0.6 8.5 8.4 24.5 24.5
+ Dyed in distilled water
* Dyed in simulated seawater
Table 3.15 K/Sλmax, of Acid Yellow dyes at 0.05, 1.0 and 3.0% o.m.f. on wool fabric
Dye Applied
K/Sλmax
0.05%
o.m.f.+
0.05%
o.m.f.*
1.0%
o.m.f.+
1.0%
o.m.f.*
3.0%
o.m.f.+
3.0%
o.m.f.*
Lanasan Brilliant Yellow CF-BA 1.0 0.9 6.7 6.5 18.2 19.7
Sandolan Yellow E-2GL 1.3 1.2 8.0 10.4 23.1 23.2
Sandolan Golden Yellow MF-RLN 1.3 1.4 12.7 12.7 26.8 27.1
Lanasyn Yellow S-2GL 0.8 0.8 9.3 8.6 24.4 27.6
Lanaset Yellow 2R 0.9 0.8 6.4 6.9 20.4 20.5
+ Dyed in distilled water
* Dyed in simulated seawater
Table 3.16 K/Sλmax, of Acid Black dyes at 1.0, 2.0 and 4.0% o.m.f. on wool fabric
Dye Applied
K/Sλmax
0.05%
o.m.f.+
0.05%
o.m.f.*
1.0%
o.m.f.+
1.0%
o.m.f.*
3.0%
o.m.f.+
3.0%
o.m.f.*
Lanaset Black B 7.1 6.3 15.3 13.2 25.4 25.2
Sandolan Black NR 17.2 18.4 29.9 29.8 34.4 33.7
Everacid Black LD 13.9 11.2 22.8 19.5 26.7 29.6
+ Dyed in distilled water
* Dyed in simulated seawater
A progressive build-up of colour depth was observed in dyeing of wool with the range
of black dyes with very little batch to batch variation, Table 3.16. Sandolan Black NR
displayed the highest K/Sλmax values over the application levels studied and again the

Wool/Acid dyes
154
Lanasyn Black S data was omitted due to its poor solubility and associated unlevellness.
The resulting colour difference, ΔE*94, between fabrics dyed in DSW and SSW, Table
3.17, and 3.18 was between 1-3 CIE L*a*b* units [31, 32]. Typically differences of
greater than 2 are considered commercially unacceptable [31, 33, 34, 35], while ΔE*94
below 1-2 is commercially acceptable.
Table 3.17 Colour difference, ΔE*94, between Acid Red, Yellow and Blue dyed wool
fabrics dyed in SSW aqueous media with DSW is being the standard.
ΔE*94, at Specified Application Level
Dye Applied 0.05% o.m.f. 1.0% o.m.f. 3.0% o.m.f.
Lanasan Red CF-WN 2.3 3.2 1.0
Sandolan Rubylon E-3GSL 1.8 1.1 1.1
Sandolan Red MF-GRLN 0.9 0.5 0.4
Lanasyn Red S-G 0.9 0.6 1.6
Lanaset Red G 0.4 0.4 0.5
Lanasan Brill Blue CF-BA 1.7 0.7 1.2
Sandolan Blue E-FBLL 2.0 0.8 1.9
Sandolan Blue MF-GL 1.5 0.5 0.6
Lanasyn Blue S-GB 0.6 1.6 1.0
Lanaset Blue 2R 1.5 0.6 0.7
Lanasan Brilliant Yellow CF-BA 1.6 2.3 3.7
Sandolan Yellow E-2GL 1.8 2.9 0.9
Sandolan Golden Yellow MF-RLN 3.0 1.2 2.0
Lanasyn Yellow S-GB 1.5 1.6 2.5
Lanaset Yellow 2R 1.4 1.6 0.7
Table 3.18 Colour difference, ΔE*94, between Black dyed wool fabrics dyed in SSW
aqueous media with DSW is being the standard.
ΔE*94, at Specified Application Level
Dye Applied 1.0% o.m.f. 2.0% o.m.f. 4.0% o.m.f.
Lanaset Black B 0.3 2.1 2.6
Sandolan Black NR 2.4 0.1 0.3+
Everacid Black LD 2.4 0.4 0.6

Wool/Acid dyes
155
The most notable colour difference between DSW and SSW dyeings was found for
lighter depths, particularly for yellow, blue and black dyes, which indicated that SSW
may not be suitable for pastel shades. However, when the depth of shade increased the
colour difference diminished. The Lanasan CF and Sandolan E dye ranges showed the
highest variation, which may be due to the increased dye sorption due to enhanced
hydrophobic interactions leading to increased K/Sλmax values. Among them, the variation
in yellow dyes in particular resulted increased differences, which may be due to the
effect of salts on the dye structure as the type of dye varied from metal complex to
milling dyes. Since there was on tone build-up colour, the effect of salts on the
chromogen and auxochrome is important and it might be possible to get lower ΔE*94 by
decreasing the concentration of dyes when the K/Sλmax value is higher in SSW and vice
versa [36]. In contrast the black dyes, Table 3.18, showed almost no difference as the
colour depth increased.
3.3.6 Fastness Properties
Examination of the colour fastness of wool fabrics dyed with the acid dye ranges
indicated that the fastness properties of wool fabrics dyed in DSW and SSW were
comparable, Table 3.19 and 3.20. The wash fastness ratings for the dyed fabrics were in
general commercially acceptable, except for the Sandolan E range, where ratings of 2-3
were observed. Nevertheless these ratings were comparable in DSW and SSW,
reflecting the inherent nature of lower fastness of the levelling dye class [37]. The level
of cross-staining for the dyed fabrics was in general fair to excellent for light and deep
shades with the wool and nylon consistently the most discoloured components in the
multi-fibre strip due to the higher substantivity of acid dyes towards those fibres.
The dry rubbing fastness rating of both the DSW and SSW dyed fabrics was very good
to excellent, Table 3.19 and 3.20. Similarly, the light fastness of both the DSW and
SSW dyed fabrics were in the grey scale 3-5 range.

Wool/Acid dyes
156
Table 3.19 Fastness performance of Lanasan, Lanaset and Lanasyn dyed wool fabrics.
Dye %
o.m.f.
Wash
Fastness
Wool
Staining
Nylon
Staining
Dry Rub
Fastness
Light
Fastness
DSW SSW DSW SSW DSW SSW DSW SSW DSW SSW
Lanasan Red
CF-WN
0.05 5 5 4/5 4/5 4/5 4/5 5 5 2/3 2/3
1.0 4/5 4/5 4/5 4/5 4 4 4/5 4/5 2/3 2/3
3.0 4/5 4/5 5 5 3/4 3/4 4 4 3/4 3/4
Lanasan
Brilliant Blue
CF-BA
0.05 5 5 5 5 4/5 4/5 5 5 3/4 3/4
1.0 4/5 4/5 5 5 4 4 4/5 4/5 4 4
3.0 3/4 4 5 5 4 3/4 4/5 4/5 4/5 4/5
Lanasan
Brilliant
Yellow
CF-BA
0.05 5 5 5 5 4/5 4/5 5 5 3 3
1.0 4/5 4/5 4/5 4/5 4 4/5 5 5 4/5 4
3.0 4 4 4/5 4/5 4/5 4/5 4/5 4/5 5 5
Lanaset Red
G
0.05 4/5 4/5 4 4/5 5 5 5 5 4 4
1.0 4/5 5 4 4 5 5 4/5 4/5 4 4
3.0 4/5 4/5 4 4 4/5 4 4/5 4 5 5
Lanaset
Yellow 2R
0.05 5 4/5 4/5 4 4/5 4/5 5 5 5 5
1.0 4/5 4/5 4/5 4/5 4/5 4/5 5 5 5 5
3.0 5 4/5 4 4 4/5 4 4/5 4/5 5 5
Lanaset Blue
2R
0.05 4/5 4/5 4 4 5 5 5 5 4 4
1.0 4 3/4 4 4 4 4/5 4/5 4/5 4 4
3.0 3/4 4 4 4 4 4 4 4 4 4
Lanasyn Red
S-G
0.05 4/5 4/5 4 4 5 5 5 5 3 3
1.0 4/5 4 4 4 4 4 4/5 4/5 3/4 3/4
3.0 4/5 4/5 4 3/4 3/4 3 4 4 4/5 4/5
Lanasyn Blue
S-GB
0.05 4/5 4/5 4/5 4/5 4/5 4 5 5 4 4
1.0 4/5 4 4 4 4 3/4 4/5 4/5 3/4 3/4
3.0 5 5 4 4 4 2/3 4 4 3/4 3/4
Lanasyn
Yellow
S-GB
0.05 5 5 4 4 5 5 5 5 4/5 4/5
1.0 4/5 4/5 4 4 4/5 4 5 5 5 4/5
3.0 4/5 4/5 4 4 4 3/4 4/5 4/5 4/5 4/5

Wool/Acid dyes
157
Table 3.20 Fastness performance of Sandolan E and Sandolan MF dyed wool fabrics
Dye %
o.m.f.
Wash
Fastness
Wool
Staining
Nylon
Staining
Dry Rub
Fastness
Light
Fastness
DSW SSW DSW SSW DSW SSW DSW SSW DSW SSW
Sandolan
Rubylon
E-3GSL
0.05 3/4 3/4 4/5 4/5 4/5 4/5 5 5 4/5 4/5
1.0 3 2/3 4/5 4/5 4/5 4/5 4/5 4/5 4/5 4/5
3.0 2/3 2/3 4 4 4/5 4/5 4 4 4/5 4/5
Sandolan
Blue
E-FBLL
0.05 3 2 3/4 4/5 4/5 4/5 5 5 4 4
1.0 2/3 2 4/5 4 4/5 4/5 4/5 4/5 4 4
3.0 2/3 2 4 2/3 3 3 4/5 4/5 4/5 4/5
Sandolan
Yellow
E-2GL
0.05 3 2/3 4 4 4/5 4/5 5 5 4/5 4/5
1.0 3 2/3 4 4 3/4 4 5 5 4/5 4
3.0 2/3 2/3 4 4 3 2/3 4/5 4/5 5 5
Sandolan
Red
MF-
GRLN
0.05 4 4 4/5 4/5 4/5 4/5 5 5 4/5 4/5
1.0 4 4 4 3/4 3 2/3 4/5 4/5 4 4
3.0 4 4 3/4 3/4 2 2 4 4 4/5 4/5
Sandolan
Blue
MF-GL
0.05 4/5 4 4/5 4/5 4/5 4/5 5 5 4/5 4/5
1.0 4 3/4 3 3 2/3 2/3 4/5 4/5 4 4
3.0 3/4 4 3 3 2/3 2/3 4 4 4/5 4/5
Sandolan
Golden
Yellow
MF-RLN
0.05 4/5 4/5 4/5 4/5 4/5 4/5 5 5 4/5 4/5
1.0 3/4 3/4 3/4 3/4 3 3 4/5 4/5 4/5 4/5
3.0 3/4 3/4 3 3 2/3 2/3 4 4 4/5 4/5
The level of cross-staining, Table 3.21, for the black dyes was overall comparable.
Wash fastness and cross-staining was lowered in Sandolan Black and Everacid black
dyes as the depth increased. The cross-staining of the nylon components for Lanaset
Black dyes at 4.0% depth showed a maximum difference of 1.0 grey scale units.

Wool/Acid dyes
158
Table 3.21 Fastness performance of Acid Black dyed wool fabrics.
Dye %
o.m.f.
Wash Wool Staining
Nylon
Staining
Dry Rub Light
Fastness Fastness Fastness
DSW SSW DSW SSW DSW SSW DSW SSW DSW SSW
Lanaset
Black B
1 3/4 4 4 4 4/5 4/5 4/5 4/5 4/5 4/5
2 4 4 4 4 4 4 4/5 4 5 5
4 4 4 4 4 4/5 3/4 4/5 4 5 5
Sandolan
Black
NR
1 4 4 4/5 4/5 4 4 4/5 4/5 4/5 4/5
2 3/4 3/4 3/4 3/4 3/4 4 4/5 4/5 4 4
4 3 3/4 3/4 3/4 3 2/3 4 4 4/5 4/5
Everacid
Black
LD
1 4 4 4 4 4 4 4/5 4/5 3/4 3/4
2 3/4 3/4 3/4 4 3/4 4 4 4 4 4
4 3/4 3/4 3 3 3/4 3/4 4 4 4/5 4/5
3.3.7 Kawabata Evaluation System (KES) Analysis [38]
Table 3.22 illustrates the major difference in handle properties exhibited by the fabric
dyed with 4 dyes in DSW and SSW at 3.0% o.m.f. depth. The mixed tensile resilience
(RT), elongation (EM), compressive resilience (RC) and shear rigidity (G) indicated
that the effect of dyeing in SSW was negligible on the fabric’s mechanical properties.
Inter-yarn friction, 2HG5, is a sensitive indicator of fabric softness [39] and with both
dyeing systems little difference in the dyed fabric’s softness was observed.
The primary hand values for softness, stiffness and smoothness presented in Table 3.23
truly reflected the mechanical and surface properties of the fabrics. The values for the
primary hand qualities are in the range of 0-10 and the higher the value within the
range, the stronger the intensity of this particular hand (tactile) feeling [40]. The results
indicated that the primary hand values were similar for both dyeing systems.

Wool/Acid dyes
159
Table 3.22 Mechanical and surface properties of wool fabrics dyed in DSW and SSW
Parameter
Lanasan Brilliant
Blue CF-BA
Sandolan Yellow
E-2GL
Sandolan Red
MF-GRLN
Lanasyn
Black S
DSW SSW DSW SSW DSW SSW DSW SSW
EMT 13.2 14.4 12.6 12.0 14.7 13.0 13.5 13.7
LT 0.6 0.6 0.6 0.6 0.6 0.7 0.6 0.6
WT 18.2 23.1 18.8 17.6 20.7 21.7 18.5 18.8
RT 57.8 61.8 59.8 62.5 61.5 58.1 64.3 63.7
B 0.1 0.1 0.1 0.2 0.1 0.1 0.1 0.1
2HB 0.1 0.1 0.1 0.1 0.1 0.1 0.1 0.1
G 0.4 0.4 0.4 0.4 0.4 0.4 0.4 0.4
2HG 0.6 0.6 0.5 0.7 0.5 0.6 0.6 0.6
2HG5 0.8 0.8 0.7 0.8 0.7 0.8 0.8 0.8
MIU 0.3 0.3 0.3 0.3 0.3 0.3 0.3 0.3
MMD 0.0 0.0 0.0 0.0 0.0 0.0 0.0 0.0
SMD 4.9 5.2 4.9 4.9 5.1 4.9 4.7 4.5
LC 0.4 0.4 0.4 0.4 0.4 0.4 0.4 0.4
WC 0.7 0.7 0.7 0.7 0.8 0.7 0.7 0.7
RC 50.7 50.2 52.6 52.2 52.1 50.2 50.4 50.6
T 1.6 1.6 1.6 1.6 1.6 1.6 1.6 1.6
W 25.6 26.4 24.3 25.4 25.3 26.5 25.5 25.7
Table 3.23 Primary Hand Values of fabrics dyed in DSW and SSW
PHV Parameter
Lanasan
Brilliant Blue
CF-BA
DSW SSW
Sandolan
Yellow E-
2GL
DSW SSW
Sandolan
Red
MF-GRLN
DSW SSW
Lanasyn
Black S
DSW SSW
Stiffness (Koshi) 2.3 2.3 2.3 3.0 2.7 2.6 2.7 2.7
Smoothness (Numeri) 6.7 6.4 6.5 6.0 6.7 6.4 6.1 6.2
Fullness and Softness
(Fukurami) 8.8 8.6 8.6 8.3 8.1 8.4 8.5 8.4

Wool/Acid dyes
160
3.4 Conclusions
The study found that commercial dyeing processes were robust and can be practically
transferred into the simulated seawater medium. Based on the experimental results, it
can be stated that:
The absorbance/concentration curve at λmax was linear and comparable for all six
dyes in SSW;
Although SEM micrographs didn’t show any presence of salt, a typical wash-off
process of 1gL-1
with a non-ionic detergent at 70°C would be sufficient to remove any
salt that could be present on the surface or sub-surface of the dyed fabric;
At room temperature, some acid and metal complex dyes were only partially
soluble in SSW but this improved with gentle heating and addition of levelling agents.
At dyeing temperatures near the boil, with the exception of Lanasyn S dye, the dyes
were fully soluble during dyeing;
Although ionic interaction was the dominant mechanism for dyeing wool/acid
and metal complex dyes, the adsorption in the saline dyebath most likely depended on
the combined effects of ionic and physical/hydrophobic interactions;
With the exception of Lanasyn Black S, there was relatively little difference in
the colouration of the final dyed fabric. The uptake of dyes was high in a range of 78 to
98% for both DSW and SSW dyes and consistent. In some cases, for example black
dyes at 4.0% o.m.f. depth, the slightly higher exhaustion in SSW can be explained by
the increased hydrophobic interactions between the dye and fibre due to high salt
conditions;
Although with the colour difference, ΔE*94 of Lanasan CF and Sandolan E was
in the range of 0.8 to 3.0, particularly for pastel shades hence not commercially
acceptable, it would be possible to reduce the colour difference by optimising the
dyeing conditions. Indeed some dyes such as Lanasyn S and Lanasan CF displayed
higher colour difference mainly due to the increased sorption in SSW;
The Lanasyn Black S did not dye acceptably in SSW, and low colour strength
and poor uniformity was observed. This was probably related to the dye structure and
the associated lower dye solubility and higher aggregation in seawater. In contrast, all
other black dye performed well in SSW and exhibited good colouration performance
and comparability with the distilled water dyeing;

Wool/Acid dyes
161
Overall the fastness of the SSW dyed fabrics was comparable to the DSW dyed
fabrics with wash, cross-staining, rub and light fastness rated commercially acceptable
ranges of 4 to 5 except for Sandolan MF range, which is a moderate fast dye ;
KE-SF analyses of the dyed fabrics indicated the softness sensitive 2HG5 value
was unaffected by the SSW dyebath and the overall fabric handle was comparable to the
DSW dyed wool.

Wool/Acid dyes
162
3.5 References
1. Rippon, J. A., The Structure of wool, in Wool dyeing, D. M. Lewis, Editor, 1992,
Society of Dyers and Colourists, Bradford.
2. Broadbent, A. D., Basic Principles of Textile Coloration, 2001, Society of Dyers
and Colourists, Bradford, England, ISBN ISBN 0 901956 76 7.
3. Duffield, P. A., Dyeing wool with acid and chrome dyes, in Wool dyeing, D. M.
Lewis, Editor, 1992, Society of Dyers and Colourists, Bradford.
4. Stakelbeck, H. P. (1999) Economy, ecocompatibility, process optimization, PL
Acid / Metal Complex 2010, Clariant (Schweiz) AG
5. Sandoz, Dyes and chemicals for wool dyeing and finishing, in Business Sector
Textiles, 1994, Sandoz Chemicals Ltd Muttenz.
6. Huntsman, Lanaset dyes: Dyeing system for wool and wool blends, in Textile
Effects, 2007, Huntsman Ltd.
7. Everlight, Everacid, in Acid dyes, 2009, Everligh Chemical industries
Corporation, Taipei.
8. Valkó, E., Particle size in wool dyeing, Journal of the Society of Dyers and
Colourists, 1939, 55 (4), p.173-182.
9. Datyner, A. and M. T. Pailthorpe, A study of dyestuff aggregation. part II. The
influence of temperature on the aggregation of some anionic dyestuffs, Journal
of Colloid and Interface Science, 1980, 76 (2), p.557-562.
10. Datyner, A. and M. T. Pailthorpe, A study of dyestuff aggregation: Part III—The
effect of levelling agents on the aggregation of some anionic dyes, Dyes and
Pigments, 1987, 8 (4), p.253-263.
11. Welham, A. C., ed. The role of auxiliaries in wool dyeing. Wool Dyeing, ed. D.
M. Lewis. 1992, Society of Dyers and Colourists, Bradford, West Yorkshire,
p.88-110.
12. Choudhury, A. K. R., Textile preparation and dyeing, 2006, Science Publishers,
Enfield, N.H.
13. Clariant, Chemicals wool, in Exhaust dyeing of wool & silk : with Reactive, Acid
& Metal-complex dyes, 2004, Clariant, TLP Division/ BU Textile Cheimcals/ PL
Dyeing and Printing.
14. TPI, Nomenclature of Textile Auxiliaries, in Textilhilfsmittel-Katalog 1991,
TEGEWA, Editor, 1991, Textil Praxis International, Konradin Verlag Robert
Kohlhammer GmbH, Leinfelden-Echterdingen.

Wool/Acid dyes
163
15. Salager, J. L., ed. Surfactants, types and uses. FIRP Booklet no. 300A. 2002,
University of Los Andes, Merido, Venezuela.
16. Nostro, P., L. Fratoni, B. W. Ninham and P. Baglioni, Water absorbency by
wool fibers: Hofmeister effect, Biomacromolecules, 2002, 3 (6), p.1217-1224.
17. Gregorski, K. S., An x-ray diffraction study of thermally-induced structural
changes in alpha-keratin, Adv Exp Med Biol, 1977, 86A, p.329-344.
18. Jones, L. N., D. E. Rivett and D. J. Tucker, Wool and related mammalian fiber
in Handbook of Fiber Chemistry, M. Lewin and E. M. Pearce, Editors, 1998,
Marcel Dekker, Inc., New York.
19. Slade, P. E., Antistats, 2nd ed. Handbook of Fiber Chemistry, 1998, Marcel
Dekker, Inc., New York.
20. Bradley, R. H., I. Mathieson and K. M. Byrne, Spectroscopic studies of modified
wool fibre surfaces, Journal of Materials Chemistry, 1997, 7 (12), p.2477-2482.
21. Yang, Y. Effect of Electrolytes on Hydrophobic Interaction in Dyeing. Proc. in
AATCC International Conference and Exhibition. 1992, Research Triangle Park,
NC, American Association of Textile Chemists and Colorists, p.266-269.
22. Yiqi Yanh, I. and C. M. Ladisch, Hydrophobic Interaction and Its Effect on
Cationic Dyeing of Acrylic Fabric, Textile Research Journal, 1993, 63 (5),
p.283-289.
23. Yang, Y., S. Li and T. Lan, Ion sorption by polyamide with consideration of
ionic interaction and other physical interactions, Journal of Applied Polymer
Science, 1994, 51 (1), p.81-87.
24. Yiqi, Y., Effect of salts on physical interactions in wool dyeing with acid dyes,
Textile Research Journal, 1998, 68 (8), p.615-620.
25. Bell, J. P., Effect of fiber and dyebath variables on the rate of acid dyeing of
nylon 6, 6, Textile Research Journal, 1968, 38 (10), p.984-989.
26. Vickerstaff, T., The Physical Chemistry of Dyeing, 1954, Imperial Chemical
Industries, London, U.K.
27. Alberghina, G., S. Fisichella and S. Occhipinti, Donnan approach to equilibrium
sorption: influence of electrolytes on dyeing of Dralon X-100 with CI Basic Blue
3, Textile Research Journal, 1990, 60 (9), p.501-507.
28. Bird, C. L., The theory and practice of wool dyeing, 4th ed, 1972, Society of
Dyers and Colourists, Bradford.
29. Bell, J. P., W. C. Carter and D. C. Felty, Dye concentration profiles within
single nylon filaments, Textile Research Journal, 1967, 37 (6), p.512-516.

Wool/Acid dyes
164
30. Speakman, J. B. and H. Clegg, Some Relationships between the Chemical
Constitution and Levelling Properties of Acid Dyes as applied to Wool, Journal
of the Society of Dyers and Colourists, 1934, 11 (50), p.348-365.
31. Tzanov, T., S. Costa, G. M. Guebitz and A. Cavaco-Paulo, Effect of temperature
and bath composition on the dyeing of cotton with catalase-treated bleaching
effluent, Coloration Technology, 2001, 117 (3), p.166-170.
32. Chen, C.-C., R. H. Wardman and K. J. Smith, The mapping of a surface of
constant visual depth in CIELAB colour space, Coloration Technology, 2002,
118 (6), p.281-294.
33. Harold, R. W., Textiles: appearance, analysis and shade sorting, Textile
Chemists and Colorist, 1987, 19 (12), p.23-31.
34. Li, Y. S. W., C. W. M. Yuen, K. W. Yeung and K. M. Sin, Regression analysis
to determine the optimum colour tolerance level for instrumental shade sorting,
Coloration Technology, 1999, 115 (3), p.95-99.
35. Bauman, W., R. Brossman, B. T. Grobel, N. Kleinemeier, M. Krayer, A. T.
Leaver and H. P. Oesch, Determination of relative color strength and residual
color difference by means of reflectance measurements. Part II. Determination
of residual color difference, Textile Chemists and Colorist, 1987, 19, p.21-22.
36. Tzanov, T., S. Costa, G. M. Guebitz and A. Cavaco-Paulo, Dyeing in catalase-
treated bleaching baths, Coloration Technology, 2001, 117 (1), p.1-5.
37. Lewis, D. M., Dyeing wool with reactive dyes, in Wool dyeing, D. M. Lewis,
Editor, 1992, Society of Dyers and Colourists, Bradford.
38. Bishop, D. P., Fabrics: Sensory and mechanical properties, Textile Progress,
1996, 26 (3), p.1-62.
39. Sule, A. D. and M. K. Bardhan, Objective evaluation of feel and handle,
appearance and tailorability of fabrics. Part-II: The KES-FB system of
Kawabata, Colourage, 1999, 46, p.23-28.
40. Radhakrishnaiah, P., S. Tejatanalert and A. P. S. Sawhney, Handle and comfort
properties of woven fabrics made from random blend and cotton-covered
cotton/polyester Yarns, Textile Research Journal, 1993, 63 (10), p.573-579.

Wool/Reactive dyes
165
4. Dyeing of wool with Reactive dyes
4.1 Introduction
Reactive dyes have been developed for wool in order to achieve better wash fastness
through the covalent bonding between the dye and fibre [1, 2]. Therefore, the reactive
dye is unique among dyes, where the dye and fibre substrate share electrons to form a
bond and the energy required to split this bond is similar to a carbon-carbon bond in the
substrate itself [3]. Although commercial usage is still relatively new the awareness of
the potential for reactive dyes was recognised much earlier in 1932 [4, 5]. At present,
reactive dyeing of wool is increasingly preferred over metal-complex dyes, despite their
good fastness properties, particularly for deep shades of black and navy blue [5], and to
increasing environmental pressure . In contrast to acid dyeing of wool, levelness is a
significant problem in reactive dyeing of wool, due to the difficulties with diffusion and
migration processes, especially once the dye is fixed [5].
The most commercially successful reactive dyes for wool have been the Lanasols and
were introduced in 1966 by Ciba-Geigy. These dyes are based on the α-
bromoacrylamide (-NHCO-C(Br)=CH2) functionality although is usually referred to as
α,β-dibromopropionylamide, believed to be the precursor of α-bromoacrylamide dyes
[3]. Lanasol dyes, along with a proprietary levelling agent, Albegal B, have eliminated
the initial levelling problems associated with reactive dyes [6]. Lanasol dyes for wool
dyeing react either by nucleophilic substitution or by a Michael addition reaction [3],
with the possible formation of aziridine derivatives [7], Scheme 4.1.
D-NH-C-C=CH2
Br
peptide NH2
substitution
reaction
addition
reaction
wool fragment
aziridine derivatives
aziridine ring
D-NH-C-C=CH2
D-NH-C-CH-CH2
NH-peptide
NH-peptideD-NH-C-CH-CH2
Br
NH-peptide
Scheme 4.1 Possible formation of groups after nucleophilic and addition reactions with
Lanasol reactive dye and wool [7]

Wool/Reactive dyes
166
After the research of wool/acid and metal complex dyes in Chapter 3, this study of
reactive dyeing on wool in simulated seawater (SSW) environment provides another
processing opportunity but very much with the background that reactive dyes are
considered to be sensitive to water hardness and ions such as Ca2+
and Mg2+
[8, 9]
which are often present in SSW in significant amounts [10]. In contrast, the exhaustion
of reactive dye on cotton increases greatly in the presence of electrolytes such as sodium
chloride [8, 9].
4.2 Experimental
4.2.1 Materials
Scoured woven wool fabric (2/2 twill, 295 gm-2
) was supplied by Whaley’s Bradford.
The compatible trichromatic system of α-bromoacrylamide Lanasol reactive dyes were
evaluated in the study without further purification. These dyes were Lanasol Red 6G
(C.I. Reactive Red 84), Lanasol Blue 3G (C.I. Reactive Blue 69) and Lanasol Yellow
4G (C.I. Reactive Yellow 39), Figure 4.1. All of the dyes are disulphonated and contain
one reactive group. The reactive red and yellow dyes are azo based whereas the
reactive blue dye is anthraquinone-based [11],
Figure 4.1 Chemical structure of (a) C.I. Reactive Red 84 [12]; (b) C.I. Reactive Blue
69; (c) C.I. Reactive Yellow 39 [13].
(a)
(b)
(c)

Wool/Reactive dyes
167
The levelling agent, Albegal B is a derivative of an ethoxylated fatty acid amine [14]
with a general chemical structure of Figure 4.2 [3] . It was described as a representative
of the modern dyebath additives used for reactive dyeing of wool fibre [15]. The
Albegal B was used with wetting agent Matexil WA-KBN (ICI). Glauber’s salt
(Na2SO4) was used only for DSW dyeing.
Figure 4.2 Chemical structure of Albegal B [3]
4.2.2 Dyeing
All dyeings were performed in either DSW or SSW at a liquor to goods ratio of 1:10, at
dyeing depths of 0.05, 1.0, 3.0 and 5.0% o.m.f., Figure 4.3. Albegal B was used in all
experiments at the recommended level of 1.0 % o.m.f. [3]. For dyeings at 5.0% o.m.f.,
the amount of Albegal B and Na2SO4 was increased to 2% and 10%, respectively.
Repeat samples were performed; the first series being based on 5 g of fabric, while the
second batch was performed using 30 g fabric.
Figure 4.3 Reactive dyeing profile for wool and post-washing process
a)
1-2 % Albegal B2g/L Wetting agent pH 4.5~5.5 acetic acid
5-10% Na2SO4 (Dst only)
Dyes
5'
100°C
70°C
Room Temperature
4°C/min
3°C/min
60 '
20 '
4°C/min
20'
80°C
1 g/L ammonia pH 8.5~9.5
1. Cold rinse, 5'2. 2g/L washing agent at 70C, 10'
3. Cold rinse, 5'
5°C/min
b)

Wool/Reactive dyes
168
4.2.3 After-treatment and Wash-off
An alkaline after-treatment, using 1 gL-1
ammonia, was performed, Figure 4.4 b, for
fabric dyed in DSW and SSW in a second corresponding “fresh” DSW or SSW bath in
order to improve wet fastness properties, especially in deeper shades of more than 1.0%
o.m.f. [3, 9].
After-treated samples were rinsed with cold water (DSW or SSW) for 5 minutes and
neutralised in 1 gL-1
acetic acid. Afterwards, samples were washed at 70°C for 10
minutes with 2 gL-1
Eriopon R, a non-ionic surfactant, to remove any salt on the fabric
surface, as discussed in Section 3.2.3. Previous studies have indicated the non-ionic
surfactant has no effect on the alkali damage of wool [16]. The fabric was then finally
cold rinsed in DSW and dried under ambient conditions.
4.2.4 Dye Exhaustion and Fixation
In reactive dyeing, hydrolysis during the dyeing process is a significant factor therefore,
in addition to determining the exhaustion, as described in Section 2.7.1, two more
performance criteria were determined. Fixation can been expressed as, %T, the
percentage of total dye fixed or fixation ratio, and, %F, degree of fixation or fixation
quotient, and are, described in Equation 4.1 and 4.2 respectively [3, 17]. T refers to the
dye chemically bound to the sample relative to the dye applied to the sample.
( ⁄
)
( ⁄
) Equation 4.1
Equation 4.2
Where ( ⁄
) and ( ⁄
) are the colour strengths of the dyed samples
before and after washing.
4.3 Results and Discussion
4.3.1 Effect of SSW on Dye Solution
Reactive dyeing in “hard” water has been recognised as a difficult problem in cotton
dyeing where inconsistencies in shades and/or the production of blotches are most

Wool/Reactive dyes
169
common faults. As a result, water softening below 5°dH is recommended [8, 18].
However since there is no reported literature on dyeing wool with reactive dyes in
seawater, therefore, an initial series of experiments with Lanasol Red 6G were
performed in order to determine the absorption behaviour and dyeability of wool with
reactive dyes in SSW. Four depths at 0.05, 1.0, 3.0 and 5.0% o.m.f. were used and
fabrics dyed in both DSW and SSW without any after-treatment. In addition, blank
dyeing (without dye) and dyeing without fabric at 1.0% depth for the entire dyeing
cycle was carried out with or without dyebath chemicals and the dye absorbances were
measured.
The dye absorbance studies indicated that the relationship between dye absorbance and
dye concentration in SSW was linear according to the Beer-Lambert Law for very dilute
solutions [9], Figure 4.4 and 4.5. In addition this linearity was also apparent with DSW,
with little effect on corresponding exhaustion values observed. A slight change of λmax
was observed with or without the presence of chemicals in dyebath however this was
not perceived as a potential problem.
Figure 4.4 Graph of Lanasol Red 6G dye absorbance versus concentration in distilled
water, λmax 499nm and in simulated seawater λmax 496nm, ■ - distilled water dyeing; and
▲ - simulated seawater dyeing.
RDSW² = 0.999
RSSW² = 0.999
0.00
0.50
1.00
1.50
2.00
2.50
0.01 0.03 0.05 0.07 0.09 0.11 0.13 0.15
Ab
sorb
an
ce, A
Concentration, gL-1

Wool/Reactive dyes
170
Figure 4.5 Graph of Lanasol Red 6G dye absorbance versus concentration, ■ - distilled
water dyeing with chemicals, λmax 500nm; ▲ - simulated seawater dyeing with
chemicals, λmax 502nm.
Both blank dyebaths before dyeing were visually clear, Figure 4.6a and 4.6b, however,
after dyeing both DSW dyebaths turned more yellowish than that of SSW, Figure 4.6c
and 4.6d. This may be an indication of wool degradation during boiling in the presence
of auxiliaries and acidic pH. Since dyeing wool in SSW released less colour, a series of
dye solutions at 1.0% o.m.f., without fabric, were performed, and a full dyeing cycle
carried out on each to determine the change in absorbance before and after dyeing,
Table 4.1. There is only a small change in absorbance before and after dyeing,
increasing for dyeing in DSW while decreasing for dyeing in SSW. This observation is
supported by results found by Cegarra, Riva and Aizpurua [1], who concluded that the
presence of electrolytes lowers the absorbance of the dye solution.
RDSW + Chemicals² = 0.998
RSSW + Chemicals² = 0.996
0.00
0.50
1.00
1.50
2.00
2.50
0.01 0.03 0.05 0.07 0.09 0.11 0.13 0.15
Ab
sorb
an
ce, A
Concentration, gL-1

Wool/Reactive dyes
171
Figure 4.6 Blank dyeing of wool (with no dyes), (a) DSW, before dyeing; (b) SSW,
before dyeing; (c) DSW, after dyeing, λmax, 300nm, A, 0.4; (d) SSW, after dyeing, λmax,
300nm, A, 0.3.
Table 4.1 Absorbance of 1.0% dye solution: before and after (without fabric)
Dye solution without fabric Absorbance, A
Before dyeing After dyeing
DSW 14.5 14.8
DSW + chemicals 14.5 15.0
SSW 12.7 12.0
SSW + Chemicals 12.8 12.2
At depths of 0.05 and 1.0% o.m.f. of dye, the dye was readily soluble in SSW at room
temperature; however, at greater than 3.0% o.m.f. the dye was only partially soluble,
Figure 4.7c and 4.8c. During dyeing, dye was exhausted gradually into the fabric
leaving a soluble lighter exhausted dyebath, Figure 4.7d and 4.8d. A similar mechanism
was observed during the disperse dyeing of hydrophobic fibres, known as aqueous
phase transfer, where dye particles are exhausted by the fabric during dyeing, from the
saturated aqueous bulk dispersion [19, 20, 21, 22, 23, 24, 25]. As Albegal B is strongly
recommended for reactive dyeing of wool, the effect of Albegal B on Lanasol dyeing
has been well documented [1, 3, 13, 15, 26, 27, 28]. This levelling agent produces a
more uniform colour [3, 26], as well as considerably enhancing the rate and the extent
of dye uptake leading to high colour yield [13], particularly at lower temperatures [15],
(a) (b) (c) (d)

Wool/Reactive dyes
172
but only works for halogen based reactive dyes [11, 29]. It has been suggested that
Albegal B has disaggregating effects on Lanasol dye solutions [15, 27], potentially
caused by formation of dye complexes, or fibre or surface mechanisms [28, 30]:
The Dye complex mechanism results in the formation of a relatively
hydrophobic complex between the auxiliary and dye which leads to an increased
affinity for the more hydrophobic root of the wool fibre [4];
The Fibre mechanism relates to a greater mobility of dyes inside the fibre due to
the auxiliary and therefore a faster reduction of tip/root differences [28];
The Surface mechanism considers different extents of accumulation of auxiliary
at the tips and roots, resulting in an improved distribution and levelling of dyes
between the two parts of the fibre [28].
This could be an explanation for the level dyeing observed for dyeing in SSW at and
over 3.0% o.m.f. depth.
Figure 4.7 Dye solutions of DSW and SSW at 3.0% o.m.f., before dyeing and exhausted
dyebath after full dyeing cycle, a) DSW before dyeing; b) DSW after dyeing; c) SSW
before dyeing; and d) SSW before dyeing.
a) c) b) d)
Precipitation
before dyeing
SSW shows lighter solution
compared to DSW before dyeing No precipitation
after dyeing

Wool/Reactive dyes
173
Figure 4.8 Dye solutions of DSW and SSW at 5.0% o.m.f., before dyeing and exhausted
dyebath after full dyeing cycle, a) DSW before dyeing; b) DSW after dyeing; c) SSW
before dyeing; and d) SSW before dyeing.
Figure 4.9 Dye solutions of SSW after full dyeing cycle without fabric, a) at 3.0%
o.m.f.; b) 5.0% o.m.f.
In the absence of wool fabric, the partial insolubility of dyes at 3.0 and 5.0% o.m.f.
depth in SSW remained even after the entire dyeing cycle, Figure 4.9, which means the
dye is highly stable to the hydrolysis at the boil under weakly acid conditions and the
dyeing auxiliaries were not able to solubilise reactive dyes. This result is supported by
Precipitation
before dyeing SSW shows lighter solution
compared to DSW before dyeing
No precipitation
after dyeing
a) c) b) d)
a) b)
Precipitation still present after dyeing without fabric

Wool/Reactive dyes
174
other study [7], which showed that even after prolonged boiling of Lanasol dyes for 15
hours with no wool, no bromide ion was liberated.
In view of the results obtained in this initial research, it was found that the existing
dyeing process was feasible to dye wool fabric over 3.0% o.m.f. in SSW and provided
level dyeing. Calculated exhaustion from absorbance values remained comparable,
therefore all subsequent calculations of exhaustion were made based on the calibration
curve for DSW.
Wool fibres swell when immersed in water, and the swelling is further promoted by the
ammonia after-treatment [3]. The presence of electrolytes in SSW could enhance the
swelling, so changes in mass were determined. Fabric was cut into 4 squares, each 5 x
5 cm, and conditioned in a standard atmosphere (20±1°C and 65±2% RH) for 24 hours
and then weighed. Mean values were calculated and % change in mass compared to the
undyed fabric was determined. Figure 4.10 showed the progressive increase in mass
with increasing depth. At a given depth, the change in mass was slightly higher in the
case of SSW, the exception of 0.05% depth. Since the maximum change in fabric mass
between DSW and SSW was just over 1%, analysis for the other dyes was not carried
out.
Figure 4.10 Effect of DSW and SSW on the mass of the dyed fabric at 0.05%, 1.0%,
3.0% and 5.0% o.m.f. depth compared to undyed fabric of 295.0 gm-2
. - distilled
water dyeing; and - simulated seawater dyeing
-1
0
1
2
3
4
5
6
7
0.05% 1.0% 3.0% 5.0%
mass
loss
gain
rati
o, %
Depth of dyeing , o.m.f.

Wool/Reactive dyes
175
4.3.2 Exhaustion and Fixation of Dye
Examination of the data, Table 4.2, indicates the three reactive dyes have higher
exhaustion values in SSW compared to DSW, which can be attributed to the increased
electrolytes present in SSW. Each of the dyed fabrics showed level dyeing, again
highlighting the importance of Albegal B in processing. The results also suggested that
an aqueous dye transfer mechanism for reactive dyeing in SSW works well with the
Albegal B, even in the presence of hard water ions, and achieved the similar level of
exhaustion for untreated wool as demonstrated by Graham [15].
Table 4.2 Exhaustion (%E), Fixation quotient (%F) and Total Fixation (%T) of Lanasol
dyes at 0.05, 1.0, 3.0% and 5.0% o.m.f. on wool fabric
Dye
applied
%E, at Specified Dye application level
0.05% o.m.f. 1.0% o.m.f. 3.0% o.m.f. 5.0% o.m.f.
DSW SSW DSW SSW DSW SSW DSW SSW
Lanasol
Blue 3G
%E 93.7 99.5 95.7 98.2 94.6 97.5 91.6 96.3
%F 100 98.9 98.9 94.5 99.9 99.9 98.2 99.2
%T 93.7 98.4 94.7 92.8 94.5 97.4 90.0 95.6
Lanasol
Red 6G
%E 87.4 93.4 96.4 97.6 93.2 98.4 91.8 95.9
%F 99.3 98.6 99.7 100.0 92.7 98.1 95.4 98.7
%T 86.8 92 96.1 97.5 86.4 96.5 87.6 94.7
Lanasol
Yellow
4G
%E 70.6 89.8 91.6 95 86.9 91.9 89.6 87.8
%F 96.2 98.8 96.4 99.9 97.1 99.9 95.7 95.1
%T 67.9 88.7 88.3 94.9 84.4 91.8 85.7 83.6
In reactive dyeing, there is always a possibility of hydrolysed and unfixed dye being
present on the fabric. In order to improve wet fastness, an after-treatment with ammonia
was carried out. In both cases dye substantivity increased significantly at higher depths,
particularly for dyeing in DSW, as evident by %F, Table 4.2.
At the isoelectric region (pH 4 to 5) less damage to wool fibres occurs during dyeing
because of the increased salt linkage cohesion and stabilisation of the fibre. This
stability is disrupted when the aqueous pH is changed to either strongly acidic or
alkaline conditions and this effect is significantly enhanced in the presence of

Wool/Reactive dyes
176
electrolytes. Internal and external pH in wool are also important in dyeing and the
presence of neutral salt reduces the difference in the pH [31]. Peryman [32]
comprehensively studied the effect of solution pH, in the range of 1.5 to 9.0, when
treating wool in boiling liquors for three hours and concluded that there was marked
increase in wool damage in the presence of sodium sulphate in alkaline liquor. Another
study found that amine pre-treatment of wool increased the rate of dyeing, a result of
alkaline modification to the wool surface, particularly prominent in presence of salt
[33]. The slight increase in exhaustion in acidic solution compared to the marked
increase in fixation in alkaline solution concur with the study of Lewis and Seltzer [34].
It was shown that ammonia after-treatment was essential to achieve the maximum
fixation values, and was due to the active fixation of partially hydrolysed reactive dyes
to the wool fibre, which was inactive in cellulose fibres. In acid conditions of the wool
pad-batch dyeing process, the dye residue was in the reactive ketone form and reacted
with highly nucleophilic thiol and amino residues in wool keratin. Overall, %T was in a
range of 83 to 98% for SSW and 85 to 96% for DSW, Table 4.2, and in agreement with
fixation results reported by others in DSW [15, 35].
4.3.3 Colour Characteristics
Figure 4.11, 4.12, 4.13 and Table 4.3 demonstrated a consistent build-up of dye on the
wool fabric, both in DSW and SSW, for three different stages: after dyeing, after
ammonia treatment and after wash-off. It was evident that for deeper shades, dyeing in
SSW produced higher K/Sλmax values in comparison to DSW dyeings, a contrast of the
previous findings where it was reported that electrolytes caused no marked effect on the
colour for hetero bi-functional reactive dyes[11]. Also with the SSW blank dyed fabric,
the changes of K/Sλmax after ammonia treatment in SSW from 0.62 to 0.77, imparted a
more intense shade of yellow. In contrast, little change in the K/Sλmax value was observed
for the fabric in blank dyed in DSW. This again confirmed the observation identified in
Section 4.3.1 where exhausted solutions were clearer in SSW than in DSW solution,
and consequently resulted in a yellowish fabric when blank dyed in SSW.
The effect of ammonia and other aliphatic amines on wool under alkaline conditions has
been previously studied by Asquith, Garcia-Dominguez and other co-workers [36, 37,
38]. Hydrolysis of wool breaks the disulphide cross-links, producing cysteine, which

Wool/Reactive dyes
177
may then be converted to a β-amino acrylic acid residue. This residue could undergo a
variety of reactions in the presence of ammonia producing lanthionine [39] and
ultimately leading to alkali stable cross-links and an associated characteristic yellow
colour. The modification of wool in ammonia was possibly enhanced in the presence of
salt, allowing further dye to react and hence, increasing the K/Sλmax value. The small
change in K/Sλmax before and after ammonia treatment did not correlate with the deeper
shade observed for SSW upon visual inspection, and could be due to the slight change
of texture due to fibre swelling and therefore, a limitation of colour measurement of
spectrophotometer due to surface effect [40, 41].
Figure 4.11 K/Sλmax values of wool dyed with Lanasol Blue 3G dye in DSW and SSW.
- 0.05% DSW; - 0.05% SSW; - 1.0% DSW; - 1.0% SSW; - 3.0% DSW; -
3.0% SSW; - 5.0% DSW; and - 5.0% SSW.
Figure 4.12 K/S values of wool dyed in Lanasol Red 6G dye in DSW and SSW.
- 0.05% DSW; - 0.05% SSW; - 1.0% DSW; - 1.0% SSW; - 3.0% DSW; -
3.0% SSW; - 5.0% DSW; and - 5.0% SSW.
0
5
10
15
20
25
30
35
After Dyeing After Ammonia
treatment
After Wash-off
K/S
0
5
10
15
20
25
30
35
After Dyeing After Ammonia
treatment
After Wash-off
K/S

Wool/Reactive dyes
178
Figure 4.13 K/Sλmax values of wool dyed in Lanasol Yellow 4G dye in DSW and SSW.
- 0.05% DSW; - 0.05% SSW; - 1.0% DSW; - 1.0% SSW; - 3.0% DSW; -
3.0% SSW; - 5.0% DSW; and - 5.0% SSW.
The colour difference, ΔE*94 is commercially acceptable when the range is within 1 to
1.5 units for blue and red dyes after dyeing, whereas a high difference was found for
yellow dyes over 3.0% o.m.f. depth. ΔE*94 was increased, for the majority of
comparable fabrics, from the after dyeing stage to the final after wash-off stage, Table
4.3, indicating that after the ammonia treatment some partial hydrolysed dye was further
bonded to the fibres leading to increased dye exhaustion and fixation, as previously
mentioned. The slight decrease in ΔE*94 between the ammonia treatment stage and
washing is due to the removal of unfixed dye.
Table 4.3 Colour difference of comparable Lanasol dyed wool fabrics in DSW and
SSW at three stages: after dyeing; after ammonia treatment; and after wash-off.
Dye applied
ΔE*94
0.05% o.m.f. 1.0% o.m.f. 3.0% o.m.f. 5.0% o.m.f.
A/D+ A/A* A/W
^ A/D
+ A/A* A/W
^ A/D
+ A/A* A/W
^ A/D
+ A/A* A/W
^
Lanasol Blue 3G 0.7 2.7 2.1 1.1 1.0 3.4 1.1 1.5 0.7 0.8 1.4 1.4
Lanasol Red 6G 1.2 0.6 2.1 0.7 1.1 0.3 0.6 0.7 1.0 1.7 2.1 1.0
Lanasol Yellow 4G 0.7 1.3 1.4 1.4 3.0 3.0 2.1 4.1 3.8 2.2 3.7 3.7
+A/D: After Dyeing, *A/A: After Ammonia treatment, ^A/W: After Wash-off
0
5
10
15
20
25
30
35
After Dyeing After Ammonia
treatment
After Wash-off
K/S

Wool/Reactive dyes
179
4.3.4 Colour Fastness Performance
The colour fastness properties of the Lanasol dyed fabrics are shown in Table 4.4,
where excellent colour fastness to light, rubbing and wash fastness were observed.
Generally fastness ratings in a range of 4 to 5, following the ammonia after-treatment
were obtained, which removed hydrolysed/original dye and soluble coloured peptide
material [3]. The improvement in wash fastness by alkaline after-treatment is solely due
to the increased covalent bonding, leading to a high fixation ratio [42].
Table 4.4 Comparison of fastness properties of Lanasol dyed wool fabrics
Dye
applied
%
o.m.f.
Wash
fastness
Staining to adjacent fabric Dry Rub
Fastness
Light
Fastness Wool Nylon Cotton
DSW SSW DSW SSW DSW SSW DSW SSW DSW SSW DSW SSW
Lanasol
Blue 3G
0.05 4/5 4/5 4/5 4/5 4/5 4/5 5 5 5 4/5 4/5 4/5
1.0 4/5 4/5 4/5 4/5 4/5 4/5 5 5 4/5 4/5 4/5 4/5
3.0 4/5 4/5 4/5 4/5 4/5 4/5 4/5 4 4/5 4/5 4/5 4/5
5.0 4 4 4 4 4 3/4 4/5 5 4 4 4/5 4/5
Lanasol
Red 6G
0.05 5 5 4/5 4/5 4/5 4/5 5 4/5 5 5 4 4
1.0 4/5 4/5 4/5 4/5 4/5 4/5 4/5 4/5 4/5 4/5 4/5 4/5
3.0 4/5 4/5 4/5 4/5 4/5 4/5 4/5 4/5 4/5 4/5 5 5
5.0 3 3 4/5 4/5 4/5 4/5 4/5 4/5 4 4 5 5
Lanasol
Yellow 4G
0.05 4/5 4/5 4/5 4/5 4/5 4/5 5 5 5 5 4 4
1.0 4 4 4/5 4/5 4/5 4/5 5 5 5 5 4/5 4/5
3.0 4 4 4/5 4/5 3/4 3 4/5 4 5 4/5 5 4/5
5.0 3/4 4 4/5 4/5 4 4 4/5 4/5 5 4/5 4/5 4/5

Wool/Reactive dyes
180
4.3.5 Tensile Strength
All types of reactive dyes exert a fibre-protective effect to some extent irrespective of
the functionality [43, 44, 45]. Lanasol reactive dyes as have been shown by Lewis [46],
using a wet burst strength measurements, significantly prevent damage to the wool
fibres at moderate to heavy depths, over 3.0% o.m.f . These dyes are suggested to form
cross-links within the fibre thus enhancing the fibre protective effect, especially at
higher dyeing temperatures. Werkes [47] also demonstrated that at concentrations up to
10.0% o.m.f. the cross-linking dyes imparted a protective effect from alkali degradation.
Figure 4.14 and 4.15 indicate the tensile strength test results clearly supports the work
reported by Lewis and Werkes. Generally, at lower depths, the strength decreased but as
the dye application increased the strength consistently increased. It can also be seen that
this increase in strength was different for the red, blue and yellow dyes, which can be
attributed to dye structure. The increase in strength is more prominent for the yellow
dye with increased strength being as high as 5% and 7% for the warp and weft,
respectively.
Figure 4.14 Tensile strength in warp direction of wool dyed fabric in DSW and SSW at
0.05%, 1.0%, 3.0% and 5.0% o.m.f. application levels compared to blank dyed fabric,
- distilled water dyeing; - simulated seawater dyeing; and Blank dyed fabric.
8.00
8.20
8.40
8.60
8.80
9.00
9.20
9.40
0.05% 1.0% 3.0% 5.0% 0.05% 1.0% 3.0% 5.0% 0.05% 1.0% 3.0% 5.0%
Lanasol Blue 3G Lanasol Red 6G Lanasol Yellow 4G
Ten
sile
str
en
gth
, k
Nm
-1

Wool/Reactive dyes
181
Figure 4.15 Tensile strength in weft direction of wool dyed fabric in DSW and SSW at
0.05%, 1.0%, 3.0% and 5.0% o.m.f. application levels compared to blank dyed fabric,
- distilled water dyeing; - simulated seawater dyeing; and Blank dyed fabric.
The increase in strength can be explained on the basis that α-bromoacrylamide reactive
dyes as well as reacting mono-functionally can potentially react bi-functionally, Scheme
4.2 and so cross-link the protein and reduce protein loss and maintain fibre strength.
Scheme 4.2 Possible further reactions of wool and Lanasol reactive dyes [3]
The nature of fibre-protective effect of reactive dyeing was explained by Lewis and
Smith [48] and involved two mechanisms. Firstly, a sufficient amount of reactive dyes
5.50
5.70
5.90
6.10
6.30
6.50
6.70
6.90
7.10
0.05% 1.0% 3.0% 5.0% 0.05% 1.0% 3.0% 5.0% 0.05% 1.0% 3.0% 5.0%
Lanasol Blue 3G Lanasol Red 6G Lanasol Yellow 4G
Ten
sile
str
eng
th, k
Nm
-1

Wool/Reactive dyes
182
present in boiling dyebaths restrict wool fibre setting by interfering the thiol-disulphide
interchange reaction, which blocks cysteine thiol groups and attack hydrogen sulphide.
Lee-Son and Hester [49] obtained a thi-irane ring at 695 cm-1
for C.I. Reactive Red 84,
Scheme 4.3, which supported this mechanism. Secondly, the covalent boding of reactive
dyes may take place at different morphological regions of the wool fibres, preferably
with the non-keratinous regions of cell membrane complex and the endocuticles [5],
where proteins are easily accessible.
Scheme 4.3 Formation of thi-irane ring due to thiol-disulphide interchange reaction
4.3.6 Abrasion Resistance
Abrasion is one of the most important factors which can make many textile materials
unserviceable. Abrasion is resulted from the physical destruction of fibres, yarns, and
fabrics due to the rubbing of textile surface over another surface [50]. Abrasion occurs
during washing, wearing, cleaning or any other methods of end use. Certain parts of
apparels such as collar, cuffs and pockets are subjected to heavy wear in use [51]. The
resultant effect is loss of performance characteristics such as strength and appearance of
fabric [52]. Similarly abrasion is a critical problem for carpets and upholstery fabrics,
technical textiles and socks.
Abrasive wear in textiles is caused by friction which could occur due to [53]:
Friction with the same textile material such as rubbing of jacket or coat lining of
a shirt, pockets against pants fabric;
Friction with external objects such as yarn to needles or rubbing of trousers to
the seat;
Friction with the fibres and dust/grit such as swimwear with unremoved sand;
Friction with the fabric components during flexing, stretching or bending of the
fibres.
Abrasion resistance of the textile materials is very complex and can be affected my
many factors such as fibre, yarn, fabric properties and finishing process. Some of these

Wool/Reactive dyes
183
factors affect the surface of the fabric while others have an influence on the internal
structure of the fabric [54]. In the case of woven fabric, weave type, fabric construction,
weight, thickness, thread density and interlacement per unit area are the fabric
properties that can affect abrasion resistance. Similarly in knit fabric, structure plays an
important role as the average abrasion resistance for interlock knitted fabric is higher
than that of rib and single jersey fabrics [55].
Abrasion kinetics can be explained by the surface and structural degradation of the
fabric. During the first stages of abrasion, a surface degradation occurs, which increased
the structural damage as the test progressed. The effect of dyeing on wool fabric was to
reduce the flat abrasion, Figure 4.16 with the strength loss being due to damage to the
cell membrane complex [56, 57]. ‘Wool gelatins’ are known to be produced during
boiling and can be released into solution and can impart a 25% wet strength loss when
gelatin is extracted up to 2% o.m.f. [58]. Previous studies have identified this region as
the weak fracture point in the fibre and that multi-functional reactive dyes can cross-link
the low sulphur protein and maintain fibre strength [59, 60, 61]. Examination of Figure
4.16 indicates the effect of the reactive dyes on abrasion resistance was entirely clear
but the cross-linking effect of the Lanasol dyes may cross-link the cell membrane
complex (CMC), improve CMC cohesion and maintain fibre strength. The SSW
dyeings may be marginally better than the comparable DSW dyeings.
Figure 4.16 Abrasion resistance of wool fabric dyed in DSW and SSW at 0.05%, 1.0%,
3.0% and 5.0% o.m.f. application levels compared to undyed fabric, - distilled water
dyeing; - simulated seawater dyeing; and Blank dyed fabric
0
2
4
6
8
10
12
14
16
18
20
1.0% 3.0% 5.0% 1.0% 3.0% 5.0% 1.0% 3.0% 5.0%
Lanasol Blue 3G Lanasol Red 6G Lanasol Yellow 4G
Av
era
ge
no
. o
f cy
cles
Th
ou
san
ds

Wool/Reactive dyes
184
4.4 Conclusions
Reactive dyes were known to be sensitive to hardness of water but this study confirmed
that reactive dyes could be used as an alternative for deep dyeing for wool fibre in SSW.
Based on the experimental study it can be concluded that:
Reactive dye solutions in SSW produce a linear and similar
absorbance/concentration curves to DSW as measured in λmax;
Blank dyeing of wool with no dye, produced a yellower exhausted solution in
DSW than SSW at boiling, indicating possibly a higher wool damage. Similarly after
dyeing solution of blank dyebath without fabric showed a lower absorbance values than
before dyeing solution confirming the previous results that presence of electrolytes
lowers the absorbance of the dye solution;
Lanasol dye is readily soluble in SSW at lower concentrations at room
temperature but at higher application levels, >3.0% o.m.f., the dye was only partially
soluble, even using dyeing temperatures near boiling in the presence of chemicals and
auxiliaries;
Reactive dyeing of wool followed a similar mechanism of gradual phase transfer
as was observed for disperse dyeing of hydrophobic fibres over 3.0% o.m.f. depth.
After-treatment with ammonia increased dye fixation possibly due to more
reactive groups being available in alkaline conditions due to modification of wool,
which could be enhanced in presence of electrolytes. A total fixation of 83 to 98% in
SSW was observed compared to 85 to 96% in DSW;
Coloration properties of the SSW dyed fabric of wool were comparable to DSW
dyed wool except when it produced higher colour strength after dyeing, ammonia
treatment and wash-off. A lower colour difference after wash-off proved that some dyes
were bonded when dye substantivity was increased after ammonia treatment;
Wash, light and rubbing fastness properties of DSW and SSW dyed fabric were
high following ammonia treatment, a characteristic of Lanasol dyes and comparable
performance with DSW and SSW;
The use of monofunctional Lanasol reactive dyes on wool appeared to increase
the tensile strength and abrasion resistance of wool, particularly at greater than 1.0%
o.m.f. application levels, and is probably due to the crosslinking of the protein polymer
and reduced loss of protein gelatin.

Wool/Reactive dyes
185
4.5 References
1. Cegarra, J., A. Riva and L. Aizpurua, The action of Albegal B on The dyeing of
Wool with α-bromoacrylamide reactive dyes, Journal of the Society of Dyers
and Colourists, 1978, 94 (9), p.394-401.
2. Bauer, J., Journal of American Dyestuff Reporter, 1956, 45, p.253.
3. Lewis, D. M., Dyeing wool with reactive dyes, in Wool dyeing, D. M. Lewis,
Editor, 1992, Society of Dyers and Colourists, Bradford.
4. Lewis, D. M., The dyeing of wool with reactive Dyes, Journal of the Society of
Dyers and Colourists, 1982, 98 (5-6), p.165-175.
5. Lewis, D. M., ed. The coloration of wool. Advances in Wool technology, ed. N.
A. G. Johnson and I. Russell. 2009, Woodhead Publishing Limited in
association with The Textile Institute, Cambridge, England, p.183-216.
6. Burkinshaw, S. M. and K. Gandhi, The dyeing of conventional decitex and
microfibre nylon 6,6 with reactive dyes- I. Chlorodifluoropyrimidinyl dyes, Dyes
and Pigments, 1996, 32 (2), p.101-127.
7. Mäusezahl, D., Die Reaktion von Lanasol-Farbstoffen mit Wolle und
Wollmodellen, Textiiveredlung, 1970, 5.
8. Shamey, R. and T. Hussein, Critical Solutions in the dyeing of cotton textile
materials, Textile Progress, 2005, 37 (1-2), p.1-84.
9. Choudhury, A. K. R., Textile preparation and dyeing, 2006, Science Publishers,
Enfield, N.H.
10. Culkin, F. and R. A. Cox, Sodium, potassium, magnesium, calcium and
strontium in sea water, Deep Sea Research and Oceanographic Abstracts, 1976,
13 (5), p.789-804.
11. Cho, H. J. and D. M. Lewis, Reactive dyeing systems for wool fibres based on
hetero-bifunctional reactive dyes. Part 1: Application of commercial reactive
dyes, Coloration Technology, 2002, 118 (4), p.198-204.
12. Naebe, M., P. G. Cookson, J. Rippon, R. P. Brady, W. Xungai, N. Brack and G.
van Riessen, Effects of plasma treatment of wool on the uptake of sulfonated
dyes with different hydrophobic properties, Textile Research Journal, 2010, 80
(4), p.312-324.
13. Naebe, M., P. G. Cookson, J. A. Rippon and X. G. Wang, Effects of leveling
agent on the uptake of reactive dyes by untreated and plasma-treated wool,
Textile Research Journal, 2010, 80 (7), p.611-622.

Wool/Reactive dyes
186
14. Clariant, Chemicals wool, in Exhaust dyeing of wool & silk : with Reactive, Acid
& Metal-complex dyes, 2004, Clariant, TLP Division/ BU Textile Cheimcals/ PL
Dyeing and Printing.
15. Graham, J. F., R. R. D. Holt and D. M. Lewis. New possibilities for the low
temperature dyeing of wool. Proc. in 1st International Wool Research
Conference. 1975, Aachen, Germany, p.200-210.
16. Meichelbeck, H. and H. Knittel, Der Einfluß von Anion- und kationtensiden auf
die chemische reaktionsfähigkeit von Wolle, Fette, Seifen, Anstrichmittel, 1971,
73 (1), p.25-29.
17. Zollinger, H., Grundlagen und Problematik des Reaktivf & aumlrbens von
Text, Textilveredlung, 1971, 6, p.57-61.
18. Heetjans, J. H. and R. Tindall, A handbook for the yarn dyer, 1995, Thies GmbH
& Co.
19. Bird, C. L., The dyeing of acetate rayon with disperse dyes. I -Aqueous solubility
and the influence of dispersing agents II -The relation between aqueous
solubility and dyeing properties, Journal of the Society of Dyers and Colourists,
1954, 70 (2), p.68-77.
20. Bird, C. L., Disperse dyes on hydrophobic fibres, Journal of the Society of
Dyers and Colourists, 1956, 72 (7), p.343-351.
21. Bird, C. L., M. P. Harris and F. Manchester, The dyeing of acetate rayon with
disperse dyes III-The influence of dispersing agents on the rate of dyeing,
Journal of the Society of Dyers and Colourists, 1955, 71 (3), p.139-142.
22. Bird, C. L. and F. Manchester, The dyeing of acetate rayon with disperse dyes IV
- The adsorption isotherms, Journal of the Society of Dyers and Colourists,
1955, 71 (10), p.604-609.
23. Bird, C. L., H. K. Partovi and G. Tabbron, The dyeing of cellulose acetate with
disperse dyes VIII– determination of fibre saturation values, Journal of the
Society of Dyers and Colourists, 1959, 75 (12), p.600-604.
24. Clavel, R., Rev. Gen. Matiere Col., 1923, 28, p.145-147, 167-169.
25. Clavel, R. and T. Stanisz, Rev. Gen. Matiere Col., 1924, 29, p.94-96, 158-160,
222-224.
26. Burkinshaw, S. M. and K. Gandhi, The dyeing of conventional and microfibre
nylon 6,6 with reactive dyes. Part 2. α-bromoacrylamido dyes, Dyes and
Pigments, 1997, 33 (4), p.259-280.

Wool/Reactive dyes
187
27. Datyner, A. and M. T. Pailthorpe, A study of dyestuff aggregation: Part III—The
effect of levelling agents on the aggregation of some anionic dyes, Dyes and
Pigments, 1987, 8 (4), p.253-263.
28. Hannemann, K., Mechanistic investigations on the action of levelling agents in
reactive wool dyeing, Journal of the Society of Dyers and Colourists, 1992, 108
(4), p.200-202.
29. Cho, H. J. and D. M. Lewis, Reactive dyeing systems for wool fibres based on
hetero-bifunctional reactive dyes. Part 2: Investigation of dyeing properties
during the dyeing cycle, Coloration Technology, 2002, 118 (5), p.220-225.
30. Rippon, J. A., The Structure of wool, in Wool dyeing, D. M. Lewis, Editor, 1992,
Society of Dyers and Colourists, Bradford.
31. Baumann, H. and L. Mochel, Textil Praxis, 1974, 29, p.507.
32. Peryman, E. V., The effect on wool of boiling in aqueous solutions i-solutions at
ph 1.5–9 with and without sodium sulphate, Journal of the Society of Dyers and
Colourists, 1954, 70 (2), p.83-92.
33. AlHariri, D. K., I. D. Rattee and I. Seltzer, Improvements in the dyeing of wool
at low temperatures by the use of amine or ammonia pretreatments, Journal of
the Society of Dyers and Colourists, 1978, 94 (4), p.149-155.
34. Lewis, D. M. and I. Seltzer, Pad-Batch dyeing of wool with reactive dyes,
Journal of the Society of Dyers and Colourists, 1968, 84 (10), p.501-507.
35. Church, J. S., A. S. Davie, P. J. Scammells and D. J. Tucker, Chemical
interactions of α–bromoacrylamide reactive dyes with wool, Review of Progress
in Coloration and Related Topics, 1999, 29 (1), p.85-93.
36. Asquith, R. S. and J. J. Garcia-Dominguez, New amino acids in alkali-treated
wool, Journal of the Society of Dyers and Colourists, 1968, 84 (3), p.155-158.
37. Asquith, R. S. and J. J. Garcia-Dominguez, Crosslinking reactions occurring in
keratin under alkaline conditions, Journal of the Society of Dyers and
Colourists, 1968, 84 (4), p.211-216.
38. Asquith, R. S. and J. D. Skinner, Textilveredlung, 1970, 5.
39. Miro, P. and J. Garcia-Dominguez, Action of ammonium and sodium hydroxides
on keratin fibres in relation to their morphological structure, Journal of the
Society of Dyers and Colourists, 1973, 89 (4), p.137-140.
40. Xin, J. H., H.-L. Shen and C. C. Lam, Investigation of texture effect on visual
colour difference evaluation, Color Research & Application, 2005, 30 (5),
p.341-347.
Wool/Reactive dyes
188
41. Williams, S., Practical colour management, Optics & Laser Technology, 2006,
38 (4–6), p.399-404.
42. Carlini, F., U. Meyer and H. Zollinger, Melliand Textilber., 1979, 60, p.587.
43. Flensberg, H. and W. Mosimann. Proc. in 7th International Wool Textile
Research Conference. 1985, Tokyo, Society of Fiber Science and Technology,
5, p.39.
44. Baumann, H. and M. Schepp. Proc. in 7th International Wool Textile Research
Conference. 1985, Tokyo, Society of Fiber Science and Technology, 4, p.372.
45. Ball, P., U. Meyer and H. Zollinger. Proc. in 7th International Wool Textile
Research Conference. 1985, Tokyo, Society of Fiber Science and Technology,
5, p.33.
46. Lewis, D. M., The effect of reactive dyes on damage in wool dyeing, Journal of
the Society of Dyers and Colourists, 1990, 106 (9), p.270-274.
47. Werkes, N., The effect of reactive dyeing on the urea bisulphite solubility of
wool, Melliand Textilber, 1989, 70, p.52-63.
48. Lewis, D. M. and S. M. Smith. Proc. in 8th International Wool Textile Research
Conference. 1990, Christchurch, Wool Research Organisation of New Zealand,
4, p.50.
49. Lee-Son, G. and R. E. Hester, Laser raman studies of bromoacrylamide reactive
dyes on wool Journal of Society of Dyers and Colourists, 1990, 106 (2), p.59-63.
50. Morton, W. E., The designing of fabrics to meet consumers' requirements,
Journal of the Textile Institute Proceedings, 1948, 39 (6), p.187-P192.
51. Hu, J., Fabric testing, 1st ed., 2008, Woodhead Publishing, ISBN
9781845692971.
52. Collier, B. J. and H. H. Epps, Textile Testing and Analysis, 1999, Prentice Hall,
New Jersey.
53. Mehta, P. V., An introduction to quality control for the apparel industry, 1985,
J.S.N. International.
54. Manich, A. M., M. D. de Castellar, R. M. Saurí, R. A. L. Miguel and A. Barella,
Abrasion kinetics of wool and blended fabrics, Textile Research Journal, 2001,
71 (6), p.469-474.
55. Özguney, A., G. Özcelik and K. Özkaya, A study on specifying the effect of laser
fading process on the colour and mechanical properties of the denim fabrics,
Tekstil ve Konfeksiyon, 2009, 19 (2), p.133–138.
Wool/Reactive dyes
189
56. Hine, R. J. and M. J. R. Minimizing damage in dyeing and chemical treatment of
wool. Proc. in 3rd International Wool Textile Research Conerence. 1965, Paris,
3, p.261.
57. Feldtman, H. D. and J. R. McPhee, The spreading and adhesion of polymers on
wool, Textile Research Journal, 1964, 34 (7), p.634-642.
58. Baumann, H., Fibrous proteins-scientific, industrial and medical aspects, D. A.
D. Parry and L. K. Creamer, Editors, 1979, Academic Press, London.
59. Holmes-Brown, R. L., E. J. Wood and G. A. Carnaby, Damage to wool during
stock-dyeing, Journal of the Society of Dyers and Colourists, 1982, 98 (7-8),
p.243-247.
60. Kilpatrick, D. J. and I. D. Rattee. The low temperature dyeing of wool. Proc. in
5th International Wool Textile Conference. 1975, Aachen, II, p.189-193.
61. Zollinger, H. Wool dyes and wool dyeing. Proc. in 5th International Wool
Textile Conference. 1975, Aachen, I, p.167-169.

Polyester/Disperse dyes
190
5. Dyeing of Polyester with Disperse Dyes
5.1 Introduction
Polyester is the most important synthetic textile apparel fibre [1]. The ongoing growth
in the usage of polyester fibre is high [2] due to the fibre’s high strength, dimensional
stability, light stability and suitability for blending with natural fibres [1, 3]. Although
there are many variants of polyester, Polyethylene Terephthalate (PET), Figure 5.1,
remains the predominant fibre type, enjoying worldwide production and commercial
success [4]. Chemically PET fibre is highly resistant to oxidising agents, reducing
agents, many solvents and is hydrophobic in nature. Therefore, hydrophobic disperse
dyes are invariably used for dyeing of polyester fibre [1, 4] and fulfil all types of
commercial needs and applications [1]. Due to their nature, disperse dyes are sparingly
soluble in water at room temperature and contain some polar groups in order to form a
stable dispersion in aqueous dyebaths [5]. The dye essentially should be in
monomolecular form to be absorbed during the high temperature dyeing process and
progressively migrates towards the interior of the fibre allowing more dye to dissolve.
A dispersing agent is used to aid aqueous solubility and to maintain the dye as a stable
dispersion especially at high temperature [4, 6]. High temperature (HT) dyeing at 125-
135°C is now the accepted norm for commercial dyeing of polyester fibres resulting in
shorter dyeing times, better dye migration, high colour yield, excellent coverage of
barré, and superior fastness properties in some cases [4].
Figure 5.1 Chemical structure of PET fibre
Most disperse dyes consists of azo, anthraquinone, pyridone or methine chromophores
and their chemistry has been extensively discussed [4, 7, 8, 9]. It is known that dyeing
processes can be differentially affected by the presence of alkaline-earth metal or heavy
metals such as iron and copper due to the aggregation of dyestuffs [10]. It is reported
that dulling of the colour shade of anthraquinone disperse dyes can occur, although it
varies from dye to dye [11]. The presence of calcium and magnesium cations are
reported to affect anionic dispersing agents, anionic wetting agents and levelling agents

Polyester/Disperse dyes
191
[12]. Therefore a sequestering agent is usually used to chelate metal ions and maintain
the dispersion stability, however, their presence in the dyebath can adversely affects azo
dyes, particularly over pH 5-7 [13].
The main aim of this experiment was to study the suitability of commercially
established exhaust dyeing of PET polyester with disperse dyes in a simulated seawater
(SSW) environment as an alternative to freshwater.
5.2 Experimental
5.2.1 Materials
100% polyester double jersey knitted fabric (120 gm-2
, Phoenix Calico, UK) was used
throughout this work. Four disperse dye ranges were used in order to encompass a
realistic commercial application range, In particular the Foron, Dianix, Dispersol and
Terasil ranges and their performance properties are described in Table 5.1. The dye
structures are unknown with the exception of Dianix Yellow 4gSL-FS 400 (C.I.
Disperse Yellow 227), Figure 5.2. Matexil DA-N (a condensate of naphthalene
sulphonic acid and formaldehyde from ICI) was used as the dispersing agent during
dyeing.

Polyester/Disperse dyes
192
Table 5.1 Disperse dyes used in this research and their characteristics
Manufacturer Name of Dyestuffs Characteristics
Dystar Dianix Red AC-E Designed for rapid and reliability in dyeing,
and production of high-quality dyeing for
pale shades [14]
Dianix Blue AC-E
Dianix Yellow 6GSL-FS
Dianix Black AD-R
Huntsman/
Ciba
Terasil Red R Suitable for rapid exhaust dyeing with good
levelling properties. The range provides
trichromaticity with acceptable wash fastness
[15].
Terasil Blue R
Terasil Yellow 4G
Terasil Black LBSN
Zeneca Dispersol Rubine XFN Thiophene based azo dyes, developed to
meet most critical wash fastness
requirements for polyester and its blend with
cellulosics. They show high fastness with
almost no staining of adjacent nylon, yellow
and ester fibres in washing tests at 60°C with
detergent [16].
Dispersol Yellow XF
Dispersol Blue XF
Dispersol Black XF
Clariant
Foron Red RD-GL 200% Distinguished by rapid exhaustion, high
diffusion power and are insensitive to
temperature or time deviations and hence
have short fixation times at 130°C. They are
also stable to hydrolysis, hence can be used
over a wide pH range, from pH 4 to 9. These
dyestuffs have low sublimation fastness [17].
Foron Yellow RD -4GRL
Foron Blue RD-GLF
Foron Black RD-3G 300%
Figure 5.2 Structure of Dianix Yellow 4GSL-FS 400 dye (C.I. Disperse Yellow 227)

Polyester/Disperse dyes
193
5.2.2 Dyeing
Dianix, Terasil and Dispersol dyeings were performed according to the procedure
illustrated in Figure 5.3 using a Werner Mathis Labomat IR laboratory dyeing machine.
For the Foron RD dyes the dyeing process varied slightly from this procedure. The
temperature was raised to 130°C in two stages, initially at 2°C/minutes up to 100°C and
then at 4°C/minutes. A 5g piece of fabric was dyed with liquor to goods ratio of 10:1 at
pH 4.5 to 5.5, adjusted by acetic acid. Each of the dyes was applied at 0.05%, 1.0% and
2.0% o.m.f. depth of shade. Dispersing agent, Matexil DA-N was added at 1, 2, 2 gL-1
,
respectively. For all Black dyes, the depth was set at 1.0%, 2.0%, and 4.0% o.m.f.
Duplicate dyeing was carried out with 10g of fabric while other parameters remained
constant.
Figure 5.3 Dyeing profile for Dianix, Dispersol and Terasil Dyes [14, 15]
5.2.3 Alkaline Reduction Clearing
The dyed fabric was cold rinsed before alkaline reduction clearing was carried out
according to manufacturer’s instructions in order to remove unfixed surface dye and
oligomer. The process is illustrated in Figure 5.3 using a non-ionic detergent (Eriopon
R) at a liquor ratio of 10:1. After reduction clearing and/or neutralising, the fabric was
cold rinsed and line dried at ambient conditions.
1. Dispersing agent 2. Dyes 3. Alkaline reduction clear 4. Acetic acid
pH 4.5~5.5 acetic acid 1% caustic soda 20°Bé to neutralise
2 gL-1
Hydrosulphite
60°C
4°C/min
3°C/min
2°C/min
30’
80°C
5’
130°C
1 2 20’
3
40°C
4

Polyester/Disperse dyes
194
5.3 Results and Discussion
5.3.1 Effect of Simulated Seawater on Dye Dispersion
It was confirmed that, even though dye dispersions do not obey the Beer–Lambert law,
like fully soluble dye solutions, the relationship between dye concentration and the
total light absorbed and scattered was approximately linear [18]. In this context, the λmax
and light absorption behaviour of sixteen dyes were evaluated. During the experimental
work, it was noted that some of the dye dispersions in SSW took a little longer to
produce stable dispersions. However, calibration curves of absorbance versus
concentration were found to be linear for each of the dyes both in DSW and SSW, with
similar gradients, confirming the salt had no effect on dispersion properties. The
inclusion of dispersing agent is important for disperse dyeing providing a higher
apparent solubility for the dye, although it also depends on the nature of the agent.
Addition of dispersing agent during the dyeing process makes the dispersion stable. It
was also reported that in presence of alkali metal salts, such as calcium ions, the
dispersibility of ligninosulphate-based dispersing agent was improved [19]. Subsequent
study confirms that Mn2+
, Mg2+
and Zn2+
can also inhibit azo dye reduction [20] and
perhaps explains the improved stability of the dye dispersion in SSW.
5.3.2 Colour Characteristics
Most of the literature suggests that dyeing of polyester with disperse dyes occurs with
the dye in the monomolecular form, in a mechanism known as “aqueous phase transfer”
[1, 4, 21]. Dye is continuously adsorbed on the surface and then subsequently migrates
into the interior of the fibre. The temperature of the dyebath controls the rate of
exhaustion in disperse dyeing [12]. As the temperature increases, the dissolution of dyes
in the dispersion increases, with the net effect being an enhancement of dye uptake and
a progressive build-up of colour, as evidenced through higher K/Sλmax values. Any
possible decrease in K/Sλmax values in SSW can be due to the increased aggregation of
disperse dyes or due to the release of trimer, which minimizes the penetration of dyes in
the compact structure of polyester fibre [22]. The results showed that the K/Sλmax values
of fabrics dyed in DSW or SSW were similar, Table 5.2 and 5.3 except for Foron Blue
RD-GLF which produced slightly higher K/Sλmax values at the 2.0% o.m.f. depth for the
SSW dyeing. The uniformity of the dyeing in SSW confirms the effectiveness of
anionic dispersing agents in maintaining dispersion stability during dyeing at room and

Polyester/Disperse dyes
195
elevated temperature. The study also confirms that anionic dispersing agent can prevent
dye aggregation/agglomeration and crystal growth [23].
Table 5.2 Colour strength, K/Sλmax, of Red, Yellow and Blue dyed polyester fabric at
0.05, 1.0 and 2.0% o.m.f. application levels
K/Sλmax, at Specified Application Level
Dye Applied 1.0%
o.m.f.+
1.0%
o.m.f.*
2.0%
o.m.f.+
2.0%
o.m.f.*
4.0%
o.m.f.+
4.0%
o.m.f.*
Dianix Red AC-E 0.4 0.4 5.1 5.0 13.1 12.3
Dianix Yellow 6GSL-FS 1.0 1.0 14.7 14.7 24.5 24.9
Dianix Blue AC-E 0.6 0.5 8.0 8.3 17.4 17.3
Terasil Red R 1.0 1.0 17.9 16.3 26.7 27.3
Terasil Yellow 4G 1.4 1.6 21.7 22.8 27.3 27.1
Terasil Blue R 0.5 0.6 8.0 7.8 15.0 15.0
Dispersol Red XFN 1.0 1.2 14.0 14.7 24.8 24.3
Dispersol Yellow XF 1.7 1.8 20.7 19.0 22.9 22.7
Dispersol Blue XF 0.7 0.7 10.9 10.4 21.9 23.0
Foron Red RD-GL 200% 1.5 1.6 22.3 22.4 27.9 28.5
Foron Yellow RD -4GRL 1.1 1.3 19.2 19.3 26.2 28.1
Foron Blue RD-GLF 1.2 1.2 16.4 17.4 25.6 27.9
+ Dyed in distilled water
* Dyed in simulated seawater
Table 5.3 Colour strength, K/Sλmax, of Black dyed polyester fabric at 0.05, 1.0 and 2.0%
o.m.f. application levels
K/Sλmax, at Specified Application Level
Dye Applied 1.0%
o.m.f.+
1.0%
o.m.f.*
2.0%
o.m.f.+
2.0%
o.m.f.*
4.0%
o.m.f.+
4.0%
o.m.f.*
Dianix Black AD-R 9.5 9.4 18.4 19.1 27.3 26.4
Terasil Black LBSN 11.6 11.3 20.3 20.3 28.9 28.9
Dispersol Black XF 6.9 7.2 14.7 14.5 24.4 23.6
Foron Black RD-3G 300% 14.1 14.9 23.9 24.0 31.1^ 31.6
^
+ Dyed in distilled water
* Dyed in simulated seawater

Polyester/Disperse dyes
196
Table 5.4 illustrates the colour difference, ΔECMC(2:1), between fabrics dyed in red,
yellow and blue in DSW and SSW. Overall the result was satisfactory since in most
cases, ΔECMC(2:1) was below the commercial acceptance level of 1.0 units [24]. There
were also some odd results observed, for example with Dianix Red and Foron Blue
RD-GLF, where the ΔECMC(2:1) was relatively low at 1.0% and 2.0% o.m.f. depth, yet
produced a relatively high ΔECMC(2:1) at 0.05% o.m.f. depth with a slight difference in
K/Sλmax values, whereas Terasil Yellow, Dispersol Red, Foron Yellow at 0.05% o.m.f.
produced a higher colour difference possibly due to the limitation of colour
measurement in lighter depth [25].
Table 5.4 Colour difference, ΔECMC(2:1), between Red, Yellow and Blue dyed polyester
fabrics dyed in DSW and SSW aqueous media.
ΔECMC(2:1)
Dye 0.05% o.m.f. 1.0% o.m.f. 2.0% o.m.f.
Dianix Red AC-E 2.5 0.3 0.3
Dianix Yellow 6GSL-FS 0.4 3.1 0.4
Dianix Blue AC-E 1.3 0.8 1.1
Terasil Red R 0.9 3.9 0.2
Terasil Yellow 4G 1.8 0.7 0.5
Terasil Blue R 1.6 0.5 0.8
Dispersol Red XFN 1.7 0.4 0.5
Dispersol Yellow XF 2.7 2.4 3.8
Dispersol Blue XF 0.2 1.2 1.2
Foron Red RD-GL 200% 1.0 0.2 0.4
Foron Yellow RD -4GRL 1.8 0.7 0.5
Foron Blue RD-GLF 2.0 1.0 0.6
The most notable colour differences were consistently produced in fabrics dyed with
Dispersol Yellow XF at all depths. Visual inspection of the fabric also confirmed the
dyed fabric in SSW looked greener compared to that of DSW. Although the exact
structure of Dispersol Yellow XF is unknown, it is a thiophene-based azo dye and it was
reported that bulky azo chromophores are sensitive to alkaline reduction. A high pH can
cleave the azo groups which is responsible for producing a characteristic lighter and
greener appearance [12]. In contrast, Dianix Yellow 6GSL-FS at 0.05% o.m.f. depth

Polyester/Disperse dyes
197
produces a greener tone in DSW and SSW, but as the depth increases, the tone gets
yellower and redder at 1.0% in SSW. The difference in dyeing properties of disperse
dyes in SSW may be due to a number of factors such as molecular weight, chemical
structure, extent of solubility, migration power, compatibility with other ingredients, or
diffusion characteristics [4, 6, 22, 26, 27, 28]. Alternatively in minimising colour
differences, other reduction clearing treatments such as blowing ozone directly on the
fabric surface during the finishing stage could be advantageous as reported [29].
Each of the black dyes produced acceptable dyed fabrics, with ΔECMC(2:1) as low as 0.2
units, Table 5.5, yet when the difference was higher as in the cases of Dianix Black at
2.0% o.m.f. depth, it was because the K/Sλmax value was higher in the dyed fabric in
SSW.
Table 5.5 Colour difference, ΔECMC(2:1), between Black dyed polyester fabrics dyed in
DSW and SSW aqueous media.
ΔECMC(2:1)
Dye 1.0% o.m.f. 2.0% o.m.f. 4.0% o.m.f.
Dianix Black AD-R 0.8 1.9 1.0
Terasil Black LBSN 0.2 0.4 0.3
Dispersol Black XF 0.2 0.7 0.7
Foron Black RD-3G 300% 0.3 0.2 0.4
5.3.3 Fastness Properties
Wash fastness of any disperse dyed polyester fabric depends on reduction clearing of
the fibre surfaces, the temperature and duration of any heat treatment and chemical
finishing. All the dyed fabrics used in our study have been alkaline reduction cleared in
order to remove any loose dye or oligomers from the surface.

Polyester/Disperse dyes
198
Table 5.6 and 5.6 show the wash fastness of fabrics dyed in DSW and SSW were very
good with the dry rub fastness in the range of 4 to 5. Diacetate and nylon were
consistently the most stained components of the multi-fibre strip, presumably since the
dye has substantivity for these fibres and are dyeable at the test temperatures. Diffusion
of dyes into polyester and acrylic was less pronounced than nylon and acetate due to the
relatively higher Tg of these polymeric fibres. The cross-staining results indicated that
although the reduction clearing process was acceptable for most dyes but it may need to
be adjusted with certain dyes, as it is reported that ease of removal varies with
chromophore to chromophore and dye to dye [12]. The effect of salts on staining was
apparent in other ways, for example with Terasil Red R both fabrics had a similar rating
of 2 on nylon but were differently stained as the depth increased. Initially the nylon
component remained bluer for both cases at 0.05% o.m.f. depth, and became redder as
the depth increased in SSW.
It is also known that subsequent chemical finishing such as softening, antistatic
finishing of dyed polyester fabric could increase the thermal migration of dyes,
presumably as the finishing agent can act as a carrier for the dyes, which might decrease
the overall fastness of the fabric [12, 30]. The effect of SSW on chemical finishes also
needs to be investigated, although the degree of thermal migration may not necessarily
reflect the results of fastness tests [31].

Polyester/Disperse dyes
199
Table 5.6 Wash fastness and staining, dry rub fastness performance of Disperse Red and
Yellow dyes at 0.05, 1.0 and 2.0% o.m.f. depth on polyester
Name of
Dyestuffs
%
o.m.f.
Wash
fastness
Polyester
staining
Nylon
staining
Acetate
staining Dry Rub
DSW SSW DSW SSW DSW SSW DSW SSW DSW SSW
Dianix
Red AC-E
0.05 5 5 5 5 4/5 4/5 5 5 5 5
1.0 4/5 4/5 4/5 4/5 5 5 5 5 5 5
2.0 4/5 5 5 5 5 5 3/4 3 5 5
Terasil
Red R
0.05 5 5 4/5 4/5 2/3 2 5 5 5 5
1.0 4/5 4/5 4/5 4 2 2 3/4 2/3 4/5 4/5
2.0 4 4 4/5 4 2 2 4 3 4/5 4
Dispersol
Red XFN
0.05 5 5 5 5 4/5 4/5 4/5 4/5 5 5
1.0 4/5 4/5 5 5 4/5 4/5 4/5 4/5 5 5
2.0 4/5 4/5 4/5 4 4/5 4 4 4 5 4/5
Foron Red
RD-GL
0.05 4/5 4/5 5 4/5 4/5 4/5 5 5 5 5
1.0 4/5 4/5 4/5 4/5 3/4 3 3 2/3 4/5 4/5
2.0 4/5 4/5 4 4 2/3 2 2 1/2 4/5 4/5
Dianix
Yellow
6GSL-FS
0.05 4/5 5 5 4/5 4 4 4/5 4/5 5 5
1.0 4/5 4/5 4/5 4/5 4 4 4/5 4/5 5 5
2.0 4/5 4/5 4/5 4/5 2/3 3 4/5 3 4/5 4/5
Terasil
Yellow
4G
0.05 4/5 4/5 4/5 4/5 2/3 3 4/5 4/5 5 5
1.0 4/5 4/5 4/5 4/5 2 3 4/5 4/5 5 5
2.0 4/5 4/5 4/5 4/5 2/3 2/3 4/5 4/5 5 5
Dispersol
Yellow
XF
0.05 5 4/5 5 5 4/5 4/5 4/5 4/5 5 5
1.0 4/5 4/5 5 5 4/5 4/5 4/5 4/5 4/5 4/5
2.0 4/5 4/5 5 4/5 4/5 3 4/5 3/4 5 4
Foron
Yellow
RD -
4GRL
0.05 5 5 5 5 5 5 5 5 5 5
1.0 5 5 4/5 4/5 4/5 4/5 4/5 4/5 4/5 4/5
2.0 4/5 4 4/5 4/5 4/5 4/5 4 4 4/5 4
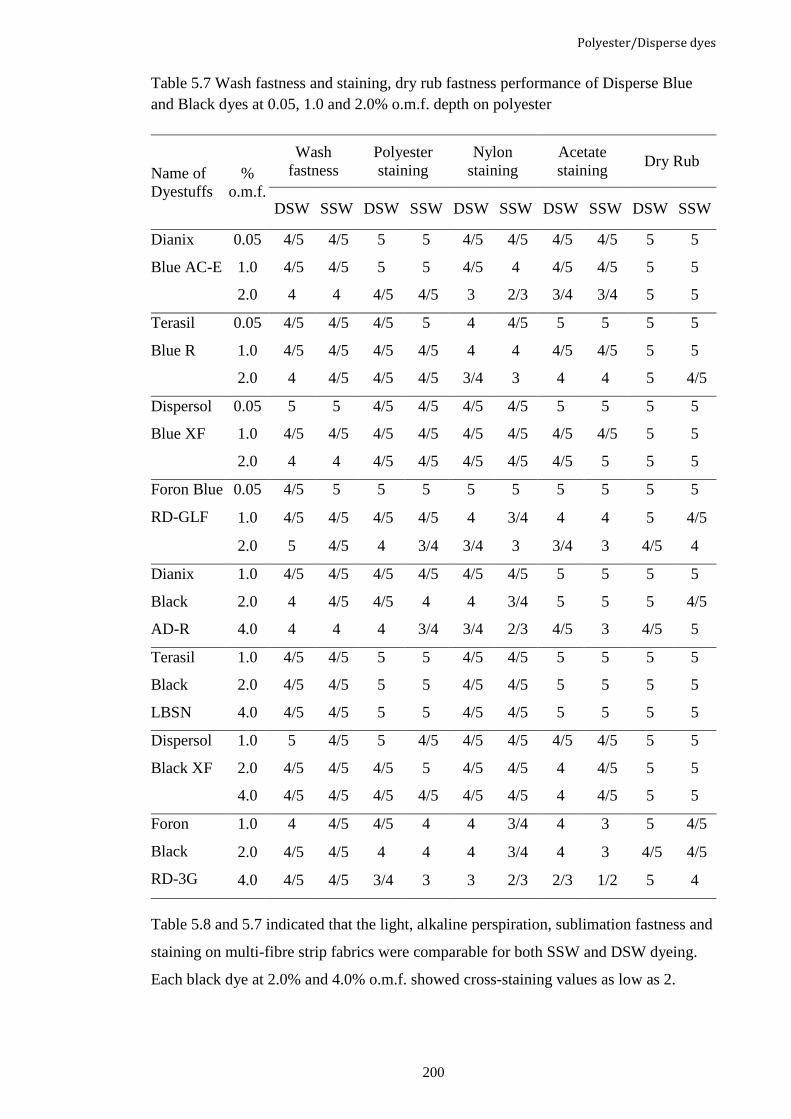
Polyester/Disperse dyes
200
Table 5.7 Wash fastness and staining, dry rub fastness performance of Disperse Blue
and Black dyes at 0.05, 1.0 and 2.0% o.m.f. depth on polyester
Name of
Dyestuffs
%
o.m.f.
Wash
fastness
Polyester
staining
Nylon
staining
Acetate
staining Dry Rub
DSW SSW DSW SSW DSW SSW DSW SSW DSW SSW
Dianix
Blue AC-E
0.05 4/5 4/5 5 5 4/5 4/5 4/5 4/5 5 5
1.0 4/5 4/5 5 5 4/5 4 4/5 4/5 5 5
2.0 4 4 4/5 4/5 3 2/3 3/4 3/4 5 5
Terasil
Blue R
0.05 4/5 4/5 4/5 5 4 4/5 5 5 5 5
1.0 4/5 4/5 4/5 4/5 4 4 4/5 4/5 5 5
2.0 4 4/5 4/5 4/5 3/4 3 4 4 5 4/5
Dispersol
Blue XF
0.05 5 5 4/5 4/5 4/5 4/5 5 5 5 5
1.0 4/5 4/5 4/5 4/5 4/5 4/5 4/5 4/5 5 5
2.0 4 4 4/5 4/5 4/5 4/5 4/5 5 5 5
Foron Blue
RD-GLF
0.05 4/5 5 5 5 5 5 5 5 5 5
1.0 4/5 4/5 4/5 4/5 4 3/4 4 4 5 4/5
2.0 5 4/5 4 3/4 3/4 3 3/4 3 4/5 4
Dianix
Black
AD-R
1.0 4/5 4/5 4/5 4/5 4/5 4/5 5 5 5 5
2.0 4 4/5 4/5 4 4 3/4 5 5 5 4/5
4.0 4 4 4 3/4 3/4 2/3 4/5 3 4/5 5
Terasil
Black
LBSN
1.0 4/5 4/5 5 5 4/5 4/5 5 5 5 5
2.0 4/5 4/5 5 5 4/5 4/5 5 5 5 5
4.0 4/5 4/5 5 5 4/5 4/5 5 5 5 5
Dispersol
Black XF
1.0 5 4/5 5 4/5 4/5 4/5 4/5 4/5 5 5
2.0 4/5 4/5 4/5 5 4/5 4/5 4 4/5 5 5
4.0 4/5 4/5 4/5 4/5 4/5 4/5 4 4/5 5 5
Foron
Black
RD-3G
1.0 4 4/5 4/5 4 4 3/4 4 3 5 4/5
2.0 4/5 4/5 4 4 4 3/4 4 3 4/5 4/5
4.0 4/5 4/5 3/4 3 3 2/3 2/3 1/2 5 4
Table 5.8 and 5.7 indicated that the light, alkaline perspiration, sublimation fastness and
staining on multi-fibre strip fabrics were comparable for both SSW and DSW dyeing.
Each black dye at 2.0% and 4.0% o.m.f. showed cross-staining values as low as 2.

Polyester/Disperse dyes
201
Table 5.8 Alkaline perspiration fastness and staining, sublimation fastness and staining,
and light fastness performance of Disperse Red and Yellow dyes at 0.05, 1.0 and 2.0%
o.m.f. on polyester fabrics
Name of
Dyestuffs
%
o.m.f.
Alkaline
perspiration
fastness
Nylon
staining
Sublimation
Fastness
Polyester
staining
Light
Fastness
DSW SSW DSW SSW DSW SSW DSW SSW DSW SSW
Dianix
Red AC-E
0.05 5 5 5 5 4/5 4/5 4 4 5 5
1.0 5 5 5 5 3/4 4 3 3 5 5
2.0 4/5 4/5 4/5 4/5 3 4 2 2 5 5
Terasil
Red R
0.05 5 5 5 5 5 5 4/5 4/5 5 5
1.0 5 5 5 5 4 4 3/4 3/4 5 5
2.0 5 4/5 4/5 4/5 4/5 4/5 2/3 3 4/5 4/5
Dispersol
Red XFN
0.05 5 5 5 5 5 5 5 5 4/5 4/5
1.0 5 5 5 5 4/5 4/5 3 3 4 3/4
2.0 4/5 4/5 4/5 4/5 4/5 4/5 2/3 2/3 4/5 4
Foron Red
RD-GL
0.05 5 5 5 5 4/5 4/5 4/5 4/5 5 5
1.0 5 5 4/5 4/5 4/5 4/5 3/4 3/4 5 5
2.0 5 4/5 4/5 4 4 4/5 2 2 5 5
Dianix
Yellow
6GSL-FS
0.05 5 5 5 5 4/5 4/5 4/5 4/5 5 5
1.0 4/5 4/5 5 5 4/5 4 3/4 3/4 4/5 4/5
2.0 4/5 4/5 5 5 4/5 4 3/4 3/4 4/5 4/5
Terasil
Yellow
4G
0.05 5 5 5 5 4/5 4/5 4/5 4/5 5 5
1.0 4/5 4/5 5 5 4/5 4/5 4 4 5 5
2.0 4 4/5 4/5 4/5 4/5 4 3 3 5 5
Dispersol
Yellow
XF
0.05 5 5 5 5 4/5 4/5 4/5 4/5 5 5
1.0 4/5 4/5 5 5 3 4 3/4 3/4 5 5
2.0 4/5 4/5 4/5 4/5 2/3 3/4 2/3 2/3 5 5
Foron
Yellow
RD-4GRL
0.05 5 5 5 5 4/5 4/5 4/5 4/5 4/5 4/5
1.0 4/5 4/5 5 5 3/4 3/4 3/4 3/4 4/5 4/5
2.0 4/5 5 4/5 5 4 4 2/3 2/3 5 4/5

Polyester/Disperse dyes
202
Table 5.9 Alkaline perspiration fastness and staining, sublimation fastness and staining,
and light fastness performance of Disperse Blue and Black dyes at 0.05, 1.0 and 2.0%
o.m.f. depths on polyester fabrics
Name of
Dyestuffs
%
o.m.f.
Alkaline
perspiration
fastness
Nylon
staining
Sublimation
Fastness
Polyester
staining
Light
Fastness
DSW SSW DSW SSW DSW SSW DSW SSW DSW SSW
Dianix
Blue
AC-E
0.05 5 5 5 5 4/5 4/5 3/4 3/4 5 5
1.0 4/5 4/5 5 5 4 4 2/3 2/3 4/5 4/5
2.0 4/5 4/5 5 5 4 4 2 2 4/5 4/5
Terasil
Blue R
0.05 5 5 5 5 4/5 4/5 4/5 4/5 4/5 4/5
1.0 5 5 5 5 4/5 4/5 4 4 4 4/5
2.0 5 4/5 4/5 4/5 4/5 4/5 3/4 3/4 4 4
Dispersol
Blue XF
0.05 5 5 5 5 5 5 4/5 4/5 4/5 4/5
1.0 5 5 5 5 4/5 4/5 4 4 4 4
2.0 4/5 4/5 4/5 4/5 4/5 4/5 3/4 3/4 4/5 4/5
Foron
Blue
RD-GLF
0.05 5 5 5 5 5 5 4/5 4/5 4/5 4/5
1.0 5 5 5 5 4/5 4/5 3/4 3/4 4 4
2.0 5 5 5 5 4 4 2/3 2/3 4 4/5
Dianix
Black
AD-R
1.0 5 5 5 5 4/5 4/5 4 4 3 3
2.0 4/5 4/5 4/5 4/5 4/5 4/5 2/3 2/3 4 4
4.0 4/5 4/5 4 4/5 4 3/4 2/3 2/3 4/5 5
Terasil
Black
LBSN
1.0 5 5 5 5 4/5 4/5 4/5 4/5 2 2
2.0 4/5 4/5 4/5 4/5 4/5 4/5 3/4 3/4 1/2 1/2
4.0 5 5 4/5 4 4/5 4/5 3 3 3 3
Dispersol
Black XF
1.0 5 5 5 5 4/5 4/5 4 4 4 4
2.0 5 5 5 5 4/5 4/5 2/3 2/3 4/5 4/5
4.0 5 4/5 5 5 4 4/5 2 2 4/5 4/5
Foron
Black
RD-3G
1.0 5 5 5 5 4/5 4/5 4 4 3/4 3/4
2.0 5 5 5 5 4/5 4/5 2/3 2/3 4/5 4/5
4.0 5 5 4/5 4/5 4 4 2 2 4/5 4/5

Polyester/Disperse dyes
203
5.3.4 Surface Morphology
The SEM micrographs of polyester fibres after dyeing in DSW and SSW showed
particulates at the surface of the fibre, Figure 5.4a and 5.4b. These particulates were
both visible in DSW and SSW, and did appear to be salt crystals. In addition further
EDX analysis showed that these particulates were not sodium chloride and arose from
oligomer migration, Figure 5.5. A 70°C wash with 2 gL-1
non-ionic detergent for 10
minutes removed most "particulates” from the surface like wool fabric dyed in SSW
with acid dye in Chapter 3.
Figure 5.4 SEM micrograph of polyester fibres, a) after reduction clearing and cold
rinse in DSW; b) reduction cleared in SSW and rinsed in DSW
a)
b)

Polyester/Disperse dyes
204
Figure 5.5 SEM X-ray microanalysis of dyed wool that had been reduction cleared, acid
washed and then, washed in 2 gL-1
detergent at room temperature for 10 minutes in
DSW (Peak at 2.3units is gold from coating)

Polyester/Disperse dyes
205
5.4 Conclusions
The results of the dyeing study on polyester fabric indicated:
The relationship between absorption and scattering of light with disperse dye
concentration is approximately linear in SSW;
Although for some dye dispersions in SSW took longer to stabilise in SSW, the
robustness and effectiveness of the commercial dispersing agents was evident;
Disperse dyeing of polyester produced consistent results for all dyes but some
black dyeings higher colour strength values in SSW;
An alkaline reduction process in the presence of salt may adversely affect yellow
azo chromophores resulting in lighter and greener hues. Alternative reduction clearing
processes may need to be identified;
Wash, dry rub, light and sublimation fastness were very good to excellent for
SSW dyeings, with cross-staining of nylon and diacetate being the greatest;
The effect of chemical finishing needs to be investigated as it could cause
increased thermal migration of dyes similar to that observed with residual carriers;
The presence of salt on the surface if any of the polyester fibres can be easily
removed by established procedure of detergent wash at 700C.
The results indicated that disperse dyeing in SSW is feasible without any major changes
to the processing conditions.

Polyester/Disperse dyes
206
5.5 References
1. Mock, G., Dyeing of polyester fibres, in Synthetic Fibre Dyeing, C. J.
Hawkyard, Editor, 2004, Society of Dyers and Colourists, Bradford.
2. Aizenshtein, E., Polyester fibres continue to dominate on the world textile raw
materials balance sheet, Fibre Chemistry, 2009, 41 (1), p.1-8.
3. Ward, J. S., Aspects of Man-made fibre development 1934–1984, Review of
Progress in Coloration and Related Topics, 1984, 14 (1), p.98-113.
4. Burkinshaw, S. M., Chemical principles of synthetic fibre dyeing, 1995, Blackie
Academic & Professional, Chapman & Hall, Glasgow.
5. Murray, A. and K. Mortimer, Dye auxiliaries in the application of disperse dyes
to man-made fibres, Journal of the Society of Dyers and Colourists, 1971, 87
(6), p.173-181.
6. Bird, C. L., The dyeing of acetate rayon with disperse dyes. I -Aqueous solubility
and the influence of dispersing agents II -The relation between aqueous
solubility and dyeing properties, Journal of the Society of Dyers and Colourists,
1954, 70 (2), p.68-77.
7. Gregory, P., ed. Classification of dyes by chemical structure. The Chemistry and
application of dyes, ed. D. R. Waring and G. Hallas. 1990, Plenum Press, New
York.
8. Shuttleworth, L. and M. A. Weaver, eds. Dyes for polyester fibers. The
Chemistry and application of dyes, ed. D. R. Waring and G. Hallas. 1990,
Plenum Press, New York.
9. Stead, C. V., ed. The Chemistry of Synthetic Dyes, ed. K.Venkataraman. Vol.
III. 1970, Academic Press, New York, p.385-462.
10. Balland, J., Dyeing process using a sequestering agent, U. S. Patent, Editor,
1980, Manufacturer de Produits Chimiques Protex Societe Anonyme, France.
11. Leuck, J. F., Squestrants in dyeing and finishing, American Dyestuff Reporter,
1979, 68 (11), p.49.
12. Aspland, J. R., A Series on Dyeing, Chapter 8: Disperse Dyes and Their
Application to Polyester, Textile Chemists and Colourists, 1992, 24 (12), p.18-
23.
13. Clark, G. T., M. A. Weaver and H. W. Somers, Textile Chemists and
Coloursists, 1981, 13, p.238.
14. Dystar, Dianix dye, 2005, DyStar Textilfarben GmbH.
15. Huntsman, Terasil dyes, in Textile Effects, 2007, Huntsman Ltd.

Polyester/Disperse dyes
207
16. Park, J. and J. Shore, Fibre Types and Dyeing Processes, in Practical Dyeing,
2004, Society of Dyers and Colourists, Bradford.
17. Clariant, Technical paper: Ecoswat, in Textile Chemicals, M. Maïsseu, Editor,
January 2003, T. L . P Division, Clariant, Basel. p.53.
18. Schindler, W., B. Trunk, T. Dorfler and V. Reith, Can thermosol dyeing be
improved by photometric measurements of the pad liquor?, Melliand
International 1991, 9, p.744-748.
19. Blaisdell, L. A., Dyestuffs and alkali metal salths of wood sugar acids and lignin
sulfonate, U. S. P. Office, Editor, 1964, American Can Company, New York , a
corporation of New Jersey, US.
20. Dilling, P., Effect of cation type on lignosulfonate dispersant performance in
disperses dye systems, Textile Chemist and Colourists, 1988, 20 (5), p.17-22.
21. Broadbent, A. D., Basic Principles of Textile Coloration, 2001, Society of Dyers
and Colourists, Bradford, England, ISBN ISBN 0 901956 76 7.
22. Imafuku, H., An alkaline dyeing system for polyester, Journal of the Society of
Dyers and Colourists, 1993, 109 (11), p.350-352.
23. Kenneth, J. and S. Kelly, Dyeing of texturised polyester yarn, Journal of the
Society of Dyers and Colourists, 1973, 89 (10), p.349-358.
24. Hassan, M. M. and C. J. Hawkyard, Reuse of spent dyebath following
decolorisation with ozone, Coloration Technology, 2002, 118 (3), p.104-111.
25. Choudhury, A. K. R., Textile preparation and dyeing, 2006, Science Publishers,
Enfield, N.H.
26. Nakamura, T., S. Ohwaki and T. Shibusawa, Dyeing properties of polyester
microfibers, Textile Research Journal, 1995, 65 (2), p.113-118.
27. Odvárka, J. and H. Schejbalová, The effect of dispersing agents on the dyeing of
polyester with a disperse dye, Journal of the Society of Dyers and Colourists,
1994, 110 (1), p.30-34.
28. Teli, M. D. and N. M. Prasad, Influence of thermal modification of carrier-free
dyeable polyester on dyeability with disperse dyes, American Dyestuff Reporter,
1991, 80 (6), p.18-22.
29. Eren, H. A., D. Ozturk and S. Eren, Afterclearing of disperse dyed polyester
with gaseous ozone, Coloration Technology, 2012, 128 (2), p.75-81.
30. Avinc, O., M. Wilding, J. Bone, D. Phillips and D. Farrington, Evaluation of
colour fastness and thermal migration in softened polylactic acid fabrics dyed
with disperse dyes of differing hydrophobicity, Coloration Technology, 2010,
126 (6), p.353-364.

Polyester/Disperse dyes
208
31. Baldwinson, T. M., Post-stentered wash fastness of disperse dyes on Polyester-
The significance of various test conditions, Journal of the Society of Dyers and
Colourists, 1989, 105 (7-8), p.269-276.

Nylon/Acid dyes
209
6. Dyeing of Nylon with Acid dyes
6.1 Introduction
The global total market share of nylon fibre was 5% in 2009 [1] and it has a large share
in the synthetic fibres sector. Nylon fibres are hydrophobic in nature and have low
reactivity to chemical agents [2]. The chemical behaviour of nylon fibre depends on its
functional end groups (-NH2 and –COOH) and chain amide groups (-CONH) [3]. The
presence of terminal amino groups determines the dyeing properties of nylon fibre [4]
and dye substantivity can be enhanced by increasing the concentration of terminal
amino groups [5].
Following wool/acid dye in Chapter 3, nylon fibre was tested in simulated seawater
with acid and metal complex dyes and their performances were evaluated against that in
freshwater.
6.2 Experimental
6.2.1 Materials
Knitted nylon 6, 6 fabric (sharkskin construction, 140 gm-2
, interlock) was supplied by
Phoenix Calico, UK and was used with no further treatment. The six commercial acid
dyes that were assessed were Lanasan Red CF-WN, Lanasan Brilliant Yellow CF-BA,
Lanasan Brilliant Blue CF-BA from Clariant and Acidol Red KM-S, Acidol Yellow
KM-F, Acidol Blue KM-R from BASF. Lanasan CF brand is a mixture of 1:2 metal
complex and milling dyes although the structures of these component dyes and the
structures of the individual dyes are unknown. Lyogen P (Clariant) was used as
levelling agent as recommended and Nylofixan PSA (Clariant) was applied as a fixation
agent, which is reported to improve wet fastness, with excellent tolerance to acid pH
[6].
6.2.2 Dyeing
Dyeing experiments with acid dyes were performed in DSW and SSW using the
following experimental parameters: liquor ratio, 1:10, 0.05, 1.0, and 2.0% o.m.f. dye
application levels; 2% o.m.f. levelling agents, and pH 4.5 to 5.5 adjusted with a buffer

Nylon/Acid dyes
210
system of acetic acid and sodium acetate [4]. 5g fabric samples were dyed in a Mathis
IR laboratory dyeing machine following the standard dyeing procedure provided by
Clariant [7]. Initially the fabric was in the dyebath for 10 minutes at 40°C and then the
temperature was increased at a rate of 2°C/minute until 98°C was reached. After 45
minutes at 98°C the dyebath was cooled and the fabric removed. The samples were then
cold rinsed in DSW for 5 minutes, and then after-treated with 2% Nylofixan PSA 70°C
for 20 minutes in corresponding DSW or SSW medium and then cold rinsed and air
dried. In all cases, duplicate runs were performed.
6.3 Results and Discussion
6.3.1 Initial studies: Effect of Simulated Seawater on Dye λmax
Absorption and Dye Concentration linearity
It has been shown in Chapter 3 that acid and metal complex dyes were suitable for
dyeing wool in a simulated seawater environment. It has also been shown that most
metal complex dyes were readily soluble at room temperature, and if not, like Lanasan
Red CF-WN, gentle warming of the dyebath dissolved the dyes completely. Dye
absorbance studies indicated that absorbance/concentration in SSW graph was linear
and comparable to the DSW-based dyebath, Figure 6.1, for all six dyes, and therefore
obeyed the Beer-Lambert Law [8]. The shift of λmax was minimal in SSW and as a result
the subsequent exhaustion value was calculated based on the DSW calibration curves.
Figure 6.1 Graph of Lanasan Red CF-WN dye absorbance versus concentration in
distilled water, λmax 498nm. ▲ - distilled water dyeing; and ■ - simulated seawater
dyeing.
RDSW² = 0.998
RSSW² = 0.995
0.00
0.50
1.00
1.50
2.00
2.50
3.00
3.50
0.00 0.05 0.10 0.15 0.20 0.25 0.30
Ab
sorb
an
ce, A
Concentration, gL-1

Nylon/Acid dyes
211
6.3.2 Effect of Salts on Nylon/Acid Dye System
In Chapter 3 it had been noted that the presence of high levels of salt caused dye
aggregation of acid dyes but higher temperatures and the incorporation of levelling
agents reduced aggregation in the wool dyebath [9, 10, 11]. Therefore while dyeing of
nylon 6,6 with metal complex dyes appears similar to that of dyeing wool there are
some significant differences, in particular nylon is more hydrophobic and the ratio of
amino groups in wool relative to nylon is in the ratio of approximately 23:1 [12].
Although, the major dye/fibre interaction for nylon/metal complex dyes is ionic, it is
also believed that hydrophobic interactions (or physical interactions) are as important as
the ionic interactions [13, 14] and are greatly influenced by the presence of electrolytes
due to their different effects on water structure [15, 16]. Unlike the salt-out effect of
ionic interaction, the ionic distribution coefficient in any nylon/dye system depends on
the magnitude of the activities and properties of electrolytes ions in the solution [17,
18]. Some of these ions are water-structure makers (kosmotropes) and others are water-
structure breakers (chaotropes) [18]. The change in ionic distribution in nylon/dye
systems is considered to be negligible in presence of simple electrolytes such as NaCl
and Na2SO4 due to their small ionic size [18]. However, NaCl at higher concentrations
produces decreased dye sorption because it neutralised the charges on both the nylon 6,6
and dye, although this behaviour does offer improved levelling [17, 18]. It has also
been reported that in highly saline dyebaths, the dye sorption depends on combined
effects of ionic and physical interactions [18, 19]. Ionic interaction prevails at low salt
concentration (e.g. < 0.05M) over physical interactions, which results in decreased dye
sorption. However, at concentration over 0.50M, for some anions such as sulphates and
phosphates, the combined effect of the ionic interactions and increased physical
interactions result an increased dye sorption [18, 19, 20, 21].
6.3.3 Exhaustion of Dye
The exhaustion levels onto nylon are presented in Figures 6.2 and 6.3 indicate the
uptake of dye depends on dye structure and the environment of dyeing. Dyeing nylon
with Lanasan CF dyes resulted in exhaustion levels of over 90% in both DSW and SSW
dyebaths. The slightly increased exhaustion values, with consistent build-up, of Lanasan
CF dyes in SSW appeared similar to the behaviour observed with comparable wool
dyeings, suggesting this particular range of dyes is suitable for dyeing in SSW. In
contrast the Acidol ranges showed a lower dye exhaustion values and this may be

Nylon/Acid dyes
212
related to the nature and size of the dye molecule, in particular the degree of
sulphonation and larger planar structure [22]. It can be also seen that adsorption of
Acidol Red and Yellow dye at over 1.0% o.m.f. was higher in SSW compared to that of
DSW possibly due to greater physical interactions that existed in the saline dyebath. As
discussed earlier, the concentration of salt over 0.5M concentration increased dye
adsorption in the presence of sodium sulphate and phosphate salts. The results in this
study also prove that a mixture of salts, of similar molar concentrations, could provide
enough physical interactions to increase dye sorption, particularly in presence of
chloride salts with a mixture of larger ionic sizes such as magnesium and calcium.
Figure 6.2 Exhaustion levels of Lanasan CF dyes at 0.05, 1.0 and 2.0% o.m.f. on nylon,
- distilled water dyeing; and - simulated seawater dyeing.
Figure 6.3 Exhaustion levels of Acidol KM dyes at 0.05, 1.0 and 2.0% o.m.f. on nylon,
- distilled water dyeing; and - simulated seawater dyeing.
6.3.4 Colour Characteristics
Like the exhaustion values, an excellent build-up of colour was observed in both DSW
and SSW and is a typical characteristics of metal complex dyes [12], Table 6.1. The
50
60
70
80
90
100
0.05% 1.0% 2.0% 0.05% 1.0% 2.0% 0.05% 1.0% 2.0%
Lanasan Red CF-WN Lanasan Brilliant yellow CF-
BA
Lanasan Brilliant Blue
CF-BA
%E
50
60
70
80
90
100
0.05% 1.0% 2.0% 0.05% 1.0% 2.0% 0.05% 1.0% 2.0%
Acidol Red KM-S Acidol Yellow KM-F Acidol Blue KM-R
%E

Nylon/Acid dyes
213
rate of dyeing did not depend on the concentration of dyes in the dyebath or the
molecular size of the acid in the formic acid-hexanoic acid series [17]. Thus it can be
assumed that the established dyeing process for nylon 6, 6-acid dye was easily
reproducible in saline environment. The colour strength, K/Sλmax, was quite similar in
0.05% and 1.0% o.m.f. depth for both dyeings, but the difference increased when the
depth increased to 2.0% o.m.f. This difference in K/Sλmax was particularly obvious for
each Acidol dyes, consistent with the corresponding exhaustion data, confirming that
the physical interactions in presence of salts greatly contributed to the dye fibre
substantivity. As a result the colour difference, ∆ECMC (2:1), also increased to a level that
was more than the commercial acceptable range of 1.0.
Table 6.1 Colour strength, K/Sλmax and colour difference of dyed nylon fabrics at 0.05,
1.0 and 2.0% o.m.f. of applied metal complex dyes
Dye Applied
K/Sλmax ΔECMC(2:1)
0.05%
o.m.f.+
0.05%
o.m.f.*
1.0%
o.m.f.+
1.0%
o.m.f.*
2.0%
o.m.f.+
2.0%
o.m.f.*
0.05%
o.m.f.
1.0%
o.m.f.
2.0%
o.m.f.
Lanasan Red CF-
WN
0.4 0.4 7.0 7.1 14.2 14.6 0.8 0.3 0.4
Lanasan Brilliant
yellow CF-BA
0.6 0.6 6.3 6.4 12.3 12.9 0.8 0.6 0.6
Lanasan Brilliant
Blue CF-BA
0.5 0.6 8.1 8.5 16.6 18.2 0.2 0.5 0.5
Acidol Red KM-S 0.7 0.6 11.9 12.0 18.4 23.5 1.2 1.2 0.7
Acidol Yellow
KM-F
0.9 0.9 10.2 10.2 16.0 17.9 0.6 0.5 0.9
Acidol Blue KM-R 0.5 0.6 10.1 10.6 17.6 20.8 1.3 0.9 0.5
+ Dyed in distilled water
* Dyed in simulated seawater
The uniformity of dyeing is an important characteristic of the finished coloured textile
fabrics and in nylon, the ionic interactions between the metal complex dyes with the
protonated terminal amino groups influences the exhaustion and levellness. The ionic
attraction is relatively strong, which hinders the movement of dyes after the initial
strike. Levelling occurs when dye anions at the surface move to the unoccupied dye
anions at the interior of the fibre. The nature of chemical and physical irregularities
present in nylon 6, 6 fabric, and the sensitiveness of anionic dyes towards this
Nylon/Acid dyes
214
variability resulted in this area of study receiving much attention [4]. Metal complex
dyes have different abilities to cover variations in the fibre and dyeing auxiliaries are
used to control these variations [12, 23]. Lyogen P, is anionic in nature and thus has
fibre affinity and hence competes with the dyes for levelling both internally and on the
surface [24]. However, their effect is temporary and replaces the dye anions as the
dyeing progresses and temperature rises [12].
The observed colour of dyed fabric was uniform in SSW and DSW. However, a
characteristics barré effect of nylon-acid dyeing was observed in each Acidol dyes but it
was severe for Acidol Blue along with Lanasan Blue to some extent. Although
previously known the effect can result from chemical variations in production of
polymer but nowadays physical variations during the fibre processing is considered the
main reason for variation [12]. Dyed fabric in Lanasan Red and Yellow dyes displayed
almost no barré effect, which validated the claim that Lyogen P can prevent barré
dyeing of nylon 6, 6 with acid dyes [6]. However, it also generated the question of
relationship of dye structure and levelling agent with the quality of substrate. Levelling
agents vary in their ability to promote level dyeing and a careful match of dye affinity
and levelling agents may require achieving optimum results [25, 26]. A suitable
alternative levelling agent or higher temperature (110-115°C) can be employed to
overcome barré effect [23, 26].
In the light of the laboratory results a bulk trial with 2000 g of nylon 6, 6 fabric was
carried out in Roaches (UK) Rotohouse rotary dyeing machine (120L capacity). Fabric
was dyed with Lanasan Blue dye in DSW and SSW at 2.0% o.m.f. depth in a liquor
ratio of 1:10. K/Sλmax was slightly higher than obtained in the laboratory trials but have
similar values in DSW and SSW. The colour difference, ΔEcmc(2:1) was 0.68, which was
within the commercially acceptable range. The change in mass due to shrinkage in
water in highly agitated dyebath produced similar changes in both DSW and SSW.
6.3.5 Colour Fastness Properties
In general, the light and wash fastness of nylon coloured with the Acidol and Lanasan
metal complex dyes was very good, Table 6.2. The good wash fastness was probably
due the ionic interactions in terminal amino groups of the nylon 6,6 fibre [12] and the
use of the fixing agent Nylofixan PSA. The excellent light fastness performance was a

Nylon/Acid dyes
215
reflection of dye energy transfer to the chelated metal and subsequent deactivation of
excited energy states through the empty d orbitals and heat dissipation.
The grey scale rating for staining of dry rub fastness was 5 for each of the dyes, and was
not included in the data. In the wash fastness testing, the six dyes displayed similar
behaviour over the three depths examined. The cross-staining of wool was in the
acceptable range of 4 to 5. Light fastness was lower for the Lanasan Red dye; otherwise
they displayed similar ratings on dyed fabric in DSW and SSW. The wash fastness and
cross-staining of a larger scale bulk trial produced similar results to the laboratory trials
and accordingly were encouraging.
Table 6.2 Fastness performance of Lanasan, and Acidol dyed nylon 6,6 fabrics
Dye applied %
o.m.f.
Wash fastness Wool Staining Nylon Staining Light fastness
DSW SSW DSW SSW DSW SSW DSW SSW
Lanasan Red
CF-WN
0.05 5 5 4/5 4/5 4/5 4/5 2 2
1.0 4/5 4/5 4/5 4/5 4/5 4/5 3 3
2.0 4/5 4/5 4/5 4/5 4/5 4/5 3/4 3/4
Lanasan
Brilliant Yellow
CF-BA
0.05 5 5 4/5 4/5 4/5 4/5 4 4
1.0 4/5 4/5 4/5 4/5 4/5 4/5 4/5 4/5
2.0 4/5 4/5 4/5 4/5 4 4 4/5 4/5
Lanasan
Brilliant Blue
CF-BA
0.05 5 5 4/5 4/5 4/5 4/5 4/5 4/5
1.0 4/5 4/5 4/5 4/5 4/5 4/5 4 4
2.0 4 4/5 4/5 4/5 4 4 4 4/5
Acidol Red
KM-S
0.05 5 5 4/5 4/5 5 5 5 5
1.0 4/5 4/5 4 4 4/5 4/5 4 4
2.0 4/5 4/5 4 4 4/5 4/5 4/5 4/5
Acidol Yellow
KM-F
0.05 5 5 5 5 5 5 5 5
1.0 4/5 4/5 4/5 4/5 5 5 4/5 4/5
2.0 4/5 4/5 4 4 5 5 4/5 5
Acidol Blue
KM-R
0.05 5 5 5 5 5 5 5 5
1.0 4 4/5 4/5 4/5 5 5 4/5 4/5
2.0 3/4 4 4/5 4/5 5 5 4/5 4/5

Nylon/Acid dyes
216
6.4 Conclusions
It was found in Chapter 3 that acid and metal complex dyeing of wool in SSW was
possible for bulk scale of production. Similarly the colouration study of metal complex
dyes on nylon concluded that:
The absorbance/concentration curve in SSW obeys Beer-Lambert law and any
shift of λmax was minimal;
The dye exhaustion levels onto the nylon fabric using metal dye complexes were
similar for both DSW and SSW dyeings. Excellent build-up of colour was observed
throughout with acceptable small colour differences between SSW and DSW dyed
fabrics;
The relationship of dye structure and levelling agent to cover barré effect of
nylon fibre needs to be investigated as Lyogen P could cover some dyes but failed to
perform adequately with Lanasan Blue and Acidol Blue dyes;
The wash, dry rub and light fastness of the SSW and DSW dyed fabrics was
comparable and excellent while cross-staining on wool and nylon 6, 6 produced similar
results. The colorimetric data and fastness of bulk trials confirmed the laboratory
results.

Nylon/Acid dyes
217
6.5 References
1. Oerlikon, The Fiber Year 2009/10 A World Survey on Textile and Nonwovens
Industry, 2010, Oerlikon Corporation AG, Pfäffikon. p.100.
2. Lewin, M. and E. M. Pearce, Chapter 2, in Handbook of Fiber Chemistry, M.
Dekker, Editor, 1998, New York, p.72-73.
3. Mark, H. F., S. M. Atlas and E. Cernia, Man-made fibers: science and
technology, 1967, Interscience Publishers.
4. Burkinshaw, S. M., Chemical principles of synthetic fibre dyeing, 1995, Blackie
Academic & Professional, Chapman & Hall, Glasgow.
5. De Winter, W. and A. Decorte, Polyamide 6,6 for deep dyeing, Textile Research
Journal, 1971, 41 (9), p.726-732.
6. Clariant, Textile chemicals for pretreatment, optical brightening, dyeing &
printing and finishing, in Directory for Textile Chemicals Department, 2003,
Clariant Corporation, Textile Business Unit, Charlotte, NC.
7. Park, J. and J. Shore, Fibre Types and Dyeing Processes Practical Dyeing, Vol.
2, 2004, Society of Dyers and Colourists, Bradford.
8. Choudhury, A. K. R., Textile preparation and dyeing, 2006, Science Publishers,
Enfield, N.H.
9. Valkó, E., Particle size in wool dyeing, Journal of the Society of Dyers and
Colourists, 1939, 55 (4), p.173-182.
10. Datyner, A. and M. T. Pailthorpe, A study of dyestuff aggregation. part II. The
influence of temperature on the aggregation of some anionic dyestuffs, Journal
of Colloid and Interface Science, 1980, 76 (2), p.557-562.
11. Datyner, A. and M. T. Pailthorpe, A study of dyestuff aggregation: Part III—The
effect of levelling agents on the aggregation of some anionic dyes, Dyes and
Pigments, 1987, 8 (4), p.253-263.
12. Lewis, D. M. and D. J. Marfell, Chapter 3: Nylon dyeing, in Synthetic fibre
dyeing, C. Hawkyard, Editor, 2004, Sociey of Dyers and Colourists, Bradford.
13. Giles, C. H., in The Theory of Coloration of Textiles, C. L. Bird and W. S.
Boston, Editors, 1975, Dyers Company Publication Trust, Bradford, England.
14. Yang, Y. Effect of Electrolytes on Hydrophobic Interaction in Dyeing. Proc. in
AATCC International Conference and Exhibition. 1992, Research Triangle Park,
NC, American Association of Textile Chemists and Colorists, p.266-269.

Nylon/Acid dyes
218
15. Yiqi Yanh, I. and C. M. Ladisch, Hydrophobic Interaction and Its Effect on
Cationic Dyeing of Acrylic Fabric, Textile Research Journal, 1993, 63 (5),
p.283-289.
16. Yiqi, Y., Effect of salts on physical interactions in wool dyeing with acid dyes,
Textile Research Journal, 1998, 68 (8), p.615-620.
17. Bell, J. P., W. C. Carter and D. C. Felty, Dye concentration profiles within
single nylon filaments, Textile Research Journal, 1967, 37 (6), p.512-516.
18. Yang, Y., S. Li and T. Lan, Ion sorption by polyamide with consideration of
ionic interaction and other physical interactions, Journal of Applied Polymer
Science, 1994, 51 (1), p.81-87.
19. Bell, J. P., Effect of fiber and dyebath variables on the rate of acid dyeing of
nylon 6, 6, Textile Research Journal, 1968, 38 (10), p.984-989.
20. Vickerstaff, T., The Physical Chemistry of Dyeing, 1954, Imperial Chemical
Industries, London, U.K.
21. Alberghina, G., S. Fisichella and S. Occhipinti, Donnan approach to equilibrium
sorption: influence of electrolytes on dyeing of Dralon X-100 with CI Basic Blue
3, Textile Research Journal, 1990, 60 (9), p.501-507.
22. Atherton, E., D. A. Downey and R. H. Peters, Studies of thedyeing of nylon with
acid dyes: part I: Measurement of affinity and the mechanism of dyeing, Textile
Research Journal, 1955, 25 (12), p.977-993.
23. Ginns, P. and K. Silkstone, The dyeing of synthetic polymer and acetate fibres,
D. M. Nunn, Editor, 1979, The Society of Dyers and Colourists, Bradford.
24. Cockett, K. R. F., Industrial Application of Surfactants, 1988, Royal Society of
Chemistry, London.
25. Holfeld, W. T. and R. H. Pike, Role of fiber surface in dye rate uniformity,
Textile Chemist and Colorist, 1985, 17 (12), p.19.
26. Bittles, J. A., J. Brooks, J. J. Iannarone and H. P. Landerl, The dyeing of filament
Nylon with acid dyes, American Dyestuff Reporter, 1958, 47 (194), p.183-186.

Acrylic/Cationic dyes
219
7. Dyeing of Acrylic with Cationic Dyes
7.1 Introduction
Acrylic fibre is the third most used synthetic textile material in the world [1] and is an
alternative to wool products [2]. Currently, acrylic has extensive application in the
apparel and industrial sectors due to its chemical and physical properties, for example,
high strength, microbial resistance and good abrasion properties [3]. Acrylic fibres
contain long chain polymers composed of at least 85% acrylonitrile and are commonly
referred to as PAN fibres. The remaining 1-15% are co-monomers, such as methacrylic
acid, vinyl acetate or similar vinyl compounds, and in some cases acidic groups, are
incorporated to improve dyeability and other mechanical properties [1, 4]. Acrylic fibre
is the major consumer of cationic or basic dyes even though their level dyeing is
difficult [5]. Acrylic fibres are resistant to chemical attack due to their hydrophobic
nature and show excellent fastness properties when dyed with cationic dyes [6]. A
retarding agent is usually used in the dyeing process to overcome the difficulties of
levelling and added electrolytes also improve the levelness and migration in dyeing [7].
Based on the successful performance of the wool, polyester, nylon fibres in Chapter 3 to
6, acrylic fibre was dyed with cationic dyes in simulated seawater. The performance of
the dyed fabric was compared and evaluated against the fabric dyed in freshwater.
7.2 Experimental
7.2.1 Materials
Plain knitted acrylic fabric (scoured and set, 395 gm-2
, Phoenix Calico, UK) was used
with no further pre-treatment. Three representative commercial cationic dyes from
Huntsman Textile Effects were used to assess dyeability performance: Maxilon Red
GRL 150% (C. I. Basic Red 46), Maxilon Blue GRL 300%, (C. I. Basic Blue 41) and
Maxilon Yellow GL 200% (C. I. Basic Yellow 45) and used as supplied. The structures
of the dyes are given in Figure 7.1.

Acrylic/Cationic dyes
220
Figure 7.1 Molecular structure of (a) C. I. Basic Blue 41[8]; (b) C. I. Basic Red 46 [9];
and (c) C. I. Basic Yellow 45 [9].
A cationic retarder, Tinegal MR (Ciba Specialty Chemicals) was used to improve
levelling and its structure was based on a colourless quaternary ammonium compound,
n-tetra-alkyl ammonium halide [11].
7.2.2 Dyeing
5 g samples of fabric were dyed in a 200 mL of either DSW or SSW at depths of 0.05,
1.0, and 3.0 % o.m.f., respectively, using a Mathis IR lab dyeing machine. The liquor
ratio was 1:10 and the solution was adjusted to pH 3.5-4 with the addition acetic acid
and sodium acetate. 1 gL-1
sodium sulphate was added to the DSW dye bath. The
standard dyeing procedure provided by Ciba was followed, Figure 7.2, and incorporated
1-2% o.m.f. of Tinegal MR [6]. A typical wash-off process as shown in Figure 7.2 was
performed in DSW. In all cases, duplicate samples were performed.
(a)
(c) (b)

Acrylic/Cationic dyes
221
Figure 7.2 Dyeing profile for acrylic fabrics
7.3 Results and Discussions
7.3.1 Effect of Simulated Seawater on dye λmax Absorption and Dye
Concentration Linearity
Initially, the linearity of the calibration curve and the corresponding shift in λmax were
determined keeping DSW and SSW as the reference solutions for the corresponding
measurements. λmax for each of the dyes was identical (RedDSW, 531nm; RedSSW,
531nm; BlueDSW, 609nm, BlueSSW, 608nm; YellowDSW, 440nm; YellowSSW, 440nm).
The calibration curve was also found to be linear, Figure 7.3 and 7.4, however, with a
different gradient was observed for the yellow dye, Figure 7.5. Therefore, subsequent
calculations of %E for each dye were measured using respective DSW and SSW
calibration curves.
Figure 7.3 Graph of C. I. Basic Blue 41 absorbance versus concentration in DSW, λmax
608nm. ▲ - distilled water dyeing; and ■ - simulated seawater dyeing.
RDSW² = 0.990
RSSW² = 0.977
0.00
0.50
1.00
1.50
2.00
2.50
0 0.01 0.02 0.03 0.04 0.05
Ab
sorb
an
ce
Concentration, gL-1
Room Temperature
1-2 % Tinegal MR pH 3.5~4 1gL
-1 sodium acetate
Cold rinse Washing with 1 gL
-1
detergent at 70°C for 10 min Cold rinse and dry
105°C
75°C
4°C/min
1°C/min
Dyes 5'
45' 20' 0.5°C/min

Acrylic/Cationic dyes
222
Figure 7.4 Graph of C. I. Basic Red 46 absorbance versus concentration in DSW, λmax
531nm. ▲ - distilled water dyeing; and ■ - simulated seawater dyeing.
Figure 7.5 Graph of C. I. Basic Yellow 45 absorbance versus concentration in DSW,
λmax 440nm. ▲ - distilled water dyeing; and ■ - simulated seawater dyeing.
7.3.2 Effect of Salts on Exhaustion of Dye
The chemical and physical interactions between dyes and fibres in the colouration
process are fundamental to understanding the substantivity between the materials. Like
other dye classes and fibres cationic dyes also have a saturation limit for the dye
adsorption on the acrylic fibres [10, 11]. The effect of different electrolytes on the
acrylic fibre/cationic dye system has been previously studied [12, 13] with an emphasis
on the dyeing rate and the dye saturation values of the fibre. In general, electrolytes in a
cationic dye bath for acrylics tend to retard dyeing, Figure 7.6 (Curve II) and the effect
can be attributed to the cations [13], but is of smaller magnitude, ~20-30%, to the total
retarding effect observed with cationic levelling agents. The retarding effect depends on
RDSW² = 0.988
RSSW² = 0.999
0.00
0.50
1.00
1.50
2.00
2.50
0 0.01 0.02 0.03
Ab
sorb
an
ce
Concentration, gL-1
RDSW² = 0.999
RSSW² = 0.999
0.00
0.50
1.00
1.50
2.00
2.50
0 0.01 0.02 0.03 0.04 0.05
Ab
sorb
an
ce
Concentration, gL-1

Acrylic/Cationic dyes
223
the nature of cations, for example, K+ ion has more retarding effect than that of Na
+ ion
due to the higher electropositivity and smaller ionic volume [14]. Furthermore, the
retarding effect increases as the concentration of salt increases.
The effect levels at a certain concentration for monovalent ions is illustrated in Figure
7.6, Curve II [14] and the effect of retarding agent was attributed to ionic interaction,
the reduction of zeta potential and mechanical obstruction [15]. In addition for some
electrolytes at higher concentration increased dye sorption for acrylic fibres was
observed [15, 16].
Although previously some researchers found that the effect of anions had little influence
on dye sorption [13, 17], the increase of dye sorption in Figure 7.6, Curve I), was
attributed to the anions present in dyebath such as sulphates and phosphates [15]. The
increase in sorption due to salt effects was explained by the increase in surface tension
(except MgCl2) for proteins [18], the increase in the free energy of the solutes [19, 20]
or hydrophobic interactions [14, 17]. The increase in sorption in acrylic due to anions
follows the lyotropic series of Hofmeister as shown in Section 3.3.3 for wool, and in the
sequence of sulphates > acetates > chlorides > iodides [21]. Others reported that Cl- was
more effective than other anions [10].
Figure 7.6 The effect of salt on the equilibrium sorption of cationic dyes on acrylic
fibres. Curve I represents sulphates and phosphates; Curve II represents chlorides,
nitrates, and bromides [16], redrawn from the experimental results of reference [15].
Thus the exhaustion values presented in Figure 7.7 exhibited two distinct phenomena
for cationic dyeing of acrylic fibres. Firstly, up to 1.0% o.m.f., the exhaustion was over
Salt concentration in dyebath
Dye
sorp
tion o
n f
ibre

Acrylic/Cationic dyes
224
95%, which means the saturation values of fibre was yet to be reached. A slight
reduction in exhaustion at 1.0% o.m.f. depth in SSW can be explained by the
competition between dye cations and salts for the sorption sites which the reduced ionic
interactions between dye and fibre. Secondly, at 3.0% o.m.f. depth, a much lower
exhaustion value was observed compared to below 1.0% o.m.f. depth, which means a
saturation limit was established in the dyeing system. A slightly higher exhaustion value
was observed in SSW and may be explained by the increased hydrophobic interactions
due to presence of salt at higher concentration in SSW. It can be concluded that a
combined total concentration of around 0.5M chloride ions of K, Na, Mg, Ca and
MgSO4 can increase dye sorption, as was observed with a high concentration of Na2SO4
(i.e. 0.922 M) [15]. Further the Na2SO4 (0.028 M) used in this study for DSW dyeing
was functioning as a retarding agent for improved levelling as evidence in the
exhaustion values.
Figure 7.7 %E of Cationic dyes at different depths. - distilled water dyeing; and -
simulated seawater dyeing
Coupled to the dye exhaustion studies it was observed that a consistent build-up of
colour was achieved for all dyes, Table 7.1. The colour yield increase from 1.0% to
3.0% o.m.f. depth, for both DSW and SSW, was relatively small. The increment in
conjunction with the exhaustion values indicates that the saturation point of dyeing for
acrylic fibre has been achieved. Colorimetric data for trial 1 and 2, also supported this
result, providing almost comparable L*a*b* values. Colour difference values, ΔE*94,
under 1.0 is within an acceptable range. At 0.05% and 1.0% o.m.f. depth, the ΔE*94 was
due to the higher K/Sλmax values in DSW whereas at 3.0% depth, the increased K/Sλmax
values resulted in increased colour difference.
0
10
20
30
40
50
60
70
80
90
100
0.05% 1.0% 3.0% 0.05% 1.0% 3.0% 0.05% 1.0% 3.0%
CI Basic Red 46 CI Basic Blue 41 CI Basic Yellow 45
%E

Acrylic/Cationic dyes
225
Table 7.1 K/Sλmax and ΔE*94 of cationic dyes at 0.05, 1.0 and 3.0% o.m.f.
Dye Applied
K/Sλmax ΔE*94
0.05%
o.m.f.+
0.05%
o.m.f.*
1.0%
o.m.f.+
1.0%
o.m.f.*
3.0%
o.m.f.+
3.0%
o.m.f.*
0.05%
o.m.f.
1.0%
o.m.f.
3.0%
o.m.f.
Basic Red 46 2.1 2.2 32.9 32.4 42.1 45.2 0.9 0.8 2.0
Basic Blue 41 2.4 2.3 36.8 32.4 42.2 43.0 0.9 1.2 0.8
Basic Yellow 45 1.3 1.3 21.4 20.6 32.0 33.8 4.3 2.2 3.7
+ Dyed in distilled water
* Dyed in simulated seawater
7.3.3 Fastness Properties
Cationic dyes on acrylic fibre show good fastness to washing and rubbing because the
washing temperature is well below the Tg of the fibre polymer [5]. It also shows
outstanding resistance to weather, micro-organisms and sunlight due to its hydrophobic
nature [6]. Similar wash and rub fastness result were found in this study for DSW and
SSW dyeings, Table 7.2 with a range from 4 to 5. The cross-staining was also in the
range from 4 to 5, with little or no difference between SSW and DSW. Staining of the
blue dye at 3.0% o.m.f. depth, on the nylon strip, was as low as 2/3 for both fabrics.
Table 7.2 Comparison of fastness properties of cationic dyes
Dye %
o.m.f.
Wash fastness Wool
Staining
Nylon
Staining
Acetate
Staining
Dry Rub
fastness
DSW SSW DSW SSW DSW SSW DSW SSW DSW SSW
C. I. Basic
Red 46
0.05 5 5 5 5 5 5 5 5 5 5
1.0 4/5 4/5 4/5 4/5 4/5 4/5 4/5 4/5 5 5
3.0 4 4 4/5 4 4 4 3/4 3 5 5
C. I. Basic
Blue 41
0.05 4/5 4/5 4/5 4/5 4/5 4/5 5 5 5 5
1.0 4 4 4/5 4/5 4 4 4/5 4/5 5 5
3.0 4 4 4/5 4/5 2/3 2/3 4/5 4/5 5 5
C. I. Basic
Yellow 45
0.05 5 5 5 5 5 5 5 5 5 5
1.0 4/5 5 4/5 4/5 4/5 4/5 4/5 4/5 5 5
3.0 4/5 4/5 4/5 4/5 4/5 4 4/5 4/5 5 5

Acrylic/Cationic dyes
226
7.4 Conclusions
Based on the experimental results on acrylic dyeing with cationic dyes it can be
concluded that:
A linear absorbance/concentration curves were found for each of the dyes
although yellow dyes exhibited a slightly different gradient in SSW;
A saturation limit was observed as at 1.0% o.m.f. application the exhaustion
value was over 90% while at 3.0% o.m.f. depth it only reached over 77%;
The saturation level of dye sorption in acrylic fibre through ionic interactions
can be increased by addition of electrolytes or their anions due to increased physical
interactions as showed at 3.0% o.m.f. depth in SSW. At low concentrations, electrolytes
retard dyeing thus acting as levelling agents;
Colorimetric data reflected the exhaustion data where K/Sλmax increased with as
the application level increased to 3.0% o.m.f. The colour differences again mirrored the
colour strength profiles and at lower depths colour differences were acceptable but at
the same time build-up can be at different depending on the application level;
Cationic dyes on acrylic fibre in general show good fastness properties, and this
was observed over wash and rubbing fastness and cross-staining for the both DSW and
SSW dyebath.

Acrylic/Cationic dyes
227
7.5 References
1. Choudhury, A. K. R., Textile preparation and dyeing, 2006, Science Publishers,
Enfield, N.H.
2. Gupta, V. B. and V. K. Kothari, eds. Manufactured Fibre Technology. 1997
Chapman & Hall, New York.
3. El-Shishtawy, R. M. and N. S. E. Ahmed, Anionic coloration of acrylic fibre.
Part 1: Efficient pretreatment and dyeing with acid dyes, Coloration
Technology, 2005, 121 (3), p.139-146.
4. Cox, R., Acrylic and modacrylic fibers, 1st ed. Synthetic fibre dyeing, ed. C.
Hawkyard, 2004, Society of Dyers and Colourists, Bradford, p 122-163.
5. Broadbent, A. D., Basic Principles of Textile Coloration, 2001, Society of Dyers
and Colourists, Bradford, England, ISBN ISBN 0 901956 76 7.
6. Park, J. and J. Shore, Fibre Types and Dyeing Processes Practical Dyeing, Vol.
2, 2004, Society of Dyers and Colourists.
7. Trotman, E. R., Dyeing and Chemical Technology of Textile Fibres, 4th ed.,
1970, Griffin, London.
8. Vončina, B., V. Vivod and D. Jaušovec, β-Cyclodextrin as retarding reagent in
polyacrylonitrile dyeing, Dyes and Pigments, 2007, 74 (3), p.642-646.
9. Huntsman, Technical Information Data, 2007, Huntsman International LLC.
10. Balmforth, D., C. A. Bowers and T. H. Guion, Acrylic polymer composition and
its relation to basic-dye substantivity, Journal of Society of Dyers and
Colourists, 1964, 80, p.577-583.
11. Laucius, J. F., R. A. Clarke and J. A. Brooks, Dyeing "Orlon" acrylic fiber and
blends with other fibers, American Dyestuff Reporter, 1955, 44 (11), p.362-366.
12. Arcoria, A., M. L. Longo and M. Torre, Dyeing rate of cationic dyes, effects of
pH, dyebath concentration, temperature and electrolytes, Chim. Ind., 1981, 63,
p.330-332.
13. Longo, M. L., D. Sciotto and M. Torre, The role of electrolytes in the cationic
dye-acrylic fiber system, Textile Research Journal, 1982, 52 (4), p.233-237.
14. Beckmann, W., Dyeing polyacrylonitrile fibres with cationic dyes, Journal of the
Society of Dyers and Colourists, 1961, 77 (12), p.616-625.
15. Alberghina, G., S. Fisichella and S. Occhipinti, Donnan approach to equilibrium
sorption: influence of electrolytes on dyeing of Dralon X-100 with CI Basic Blue
3, Textile Research Journal, 1990, 60 (9), p.501-507.

Acrylic/Cationic dyes
228
16. Yiqi Yanh, I. and C. M. Ladisch, Hydrophobic Interaction and Its Effect on
Cationic Dyeing of Acrylic Fabric, Textile Research Journal, 1993, 63 (5),
p.283-289.
17. Cegarra, J., Physical chemistry of the dyeing of acrylic fibres with basic dyes,
Journal of the Society of Dyers and Colourists, 1971, 87 (5), p.149-155.
18. Melander, W. and C. Horváth, Salt effects on hydrophobic interactions in
precipitation and chromatography of proteins: An interpretation of the lyotropic
series, Archives of Biochemistry and Biophysics, 1977, 183 (1), p.200-215.
19. Arakawa, T., Thermodynamic analysis of the effect of concentrated salts on
protein interaction with hydrophobic and polysaccharide columns, Archives of
Biochemistry and Biophysics, 1986, 248 (1), p.101-105.
20. Arakawa, T. and S. N. Timasheff, Mechanism of protein salting in and salting
out by divalent cation salts: balance between hydration and salt binding,
Biochemistry, 1984, 23 (25), p.5912-5923.
21. Hofmeister, F., On the understanding of the effect of salts, second report, on the
regularities in the precipitating effect of salts and their relationship to their
physiological behavior, Arch. Exp. Pathol. Pharmakol., 1888, 24, p.247-263.
229
Part B: Development of Novel Filter
Media for Textile Effluent Treatment

Surface Characterisation of Filter Media
230
8. Surface Characterisation of Filter Media
8.1 Introduction
Filtration of liquids can be achieved either through microfiltration, nanofiltration,
ultrafiltration or reverse osmosis [1]. The simplest filtration approach is through a
microfilter media which typically consists of a coated woven fabric with a well-defined
pore size. A number of factors can affect the filtration performance of dye solutions and
removal of colour from waste effluent.
As discussed in Section 1.6.8 the major problem for all filtration processes is the
reduction of flow as the filtration continues due to the accumulation of
particles/molecules on media surface, known as membrane fouling or media blinding
[2]. Therefore, several approaches and various combinations have been proposed to
recycle and then reuse textile wastewater in a cost effective way [3, 4, 5]. The methods
that were investigated to control the propensity to fouling/blinding include [6]:
By reducing the concentration of foulant, e.g. through coagulation/flocculation;
By promoting mass transfer from media surface to bulk, e.g. through turbulence;
By reducing the foulant capacity to attach to media surface, e.g. media fibre or
surface modification.
Microfilters are the dominant sector in separation technology and are relatively cheap.
The attractive performance profile also includes a higher filtration rate per unit area
with much less media surface and cost effective for many applications [7, 8]. It has been
reported that inorganic microfilters such as titania-coated stainless steel and ceramic
filters can remove soluble anionic dyes such as C. I. Direct Red 2 and C. I. Acid Red 1
and ions from aqueous solution [9, 10]. In addition, a polypropylene microfilter with a
pore size 0.2 micron removed a maximum 50% of dye [8]. Soluble ionic dye can be
removed with filters with nominal pore diameters below that of the ionic dye
dimensions. Nevertheless a performance limitation would be always apparent if removal
levels of over 95% are required and a smaller pore size ultrafiltration or nanofiltration
would be necessary [8]. The assumption that molecular salt ions can easily pass through
the microfilter media was in contrast to results reporting that trace contaminants, time of
operation, construction of material and number of cleaning can influence the passage of
ions [7, 8].

Surface Characterisation of Filter Media
231
Therefore in this study in order to develop robust separation systems a standard Azurtex
media has been surface modified and the influence of surface character of the media's
hydrophobicity/hydrophilicity on filtration rate, cake formation, cake release and
turbidity was investigated. The effect of surface modification was evaluated by direct
gaseous fluorination, fluorocarbon (FC) finishing or plasma polymerisation technology.
In all these modification techniques the fluorine content and fluorine species were
determined and the properties of the materials assessed. In general, it has been reported
that a higher fluorine content provides better weatherability, chemical and thermal
stability, solvent resistance to materials [11]. The properties of the fluorinated surface
depends on both the coverage and degree of order of fluorocarbon on the surface [12].
The aim of the treatments on the media was to introduce the surface functional groups
that can increase filtration efficiency and improve anti-fouling properties. In this
chapter, these surface modifications were characterised.
8.2 Experimental
8.2.1 Materials
With the success of Primapor filter media by Volooj [13], the newly advanced Azurtex
filter media (polyurethane coated polypropylene woven, 620gm-2
) was used for this
research and kindly supplied by Clear Edge Filtration, Haslingden, UK. Some of the
recent developments of Azurtex family have been given in 9.2.1. The Azurtex filter
media was surface modified by gaseous fluorination, plasma polymerisation and
gaseous fluorination followed by a fluoropolymer application, Table 8.1 the
fluorocarbon Itoguard LJC6MUL, supplied by LJ Specialities, UK, and is classified as a
cationic multi-purpose C6 fluorocarbon finish, 30% solids, typically applied at 10-80
gL-1
, dried at 100ºC for 1 minute and cured at 160ºC for 3 minutes.

Surface Characterisation of Filter Media
232
Table 8.1 Modification of Azurtex media and its modification details
Reference Details
Untreated Azurtex filter media
Az Ito Azurtex treated with 50 gL-1 Itoguard LJC6MUL
Az 2%F2, 2' Fluorinated at 2% F2 for 2 minutes
Az 2%F2, 2', Ito Fluorinated at 2% F2 for 2 minutes and then treated with 50
gL-1 Itoguard LJCC6MUL
Az 2%F2, 10' Fluorinated at 10% F2 for 2 minutes
Az 2%F2, 10', Ito Fluorinated at 2% F2 for 10 minutes and then treated with
50 gL-1 Itoguard LJCC6MUL
Az 5%F2, 2' Fluorinated at 5% F2 level for 2 minutes
Az 5%F2, 2', Ito Fluorinated at 5% F2 level for 2 minutes and then treated
with 50 gL-1 Itoguard LJCC6MUL
Az 5%F2, 10' Fluorinated at 5% F2 level for 10 minutes
Az 5%F2, 10', Ito Fluorinated at 5% F2 level for 10 minutes and treated with
50 gL-1 Itoguard LJCC6MUL
Az 10%F2 Fluorinated at 10% F2 level for 2 minutes
Az 10%F2, Ito Fluorinated at 10% F2 level for 2 minutes and treated with
50 gL-1 Itoguard LJCC6MUL
P2i std Standard plasma treatment for textile surface
P2i 1° Plasma treatment for 40 minutes
P2i 2° Scale up plasma treatment
8.2.2 Fluorination
Following the work of Volooj [13] Azurtex media was gaseous fluorinated by Fluor
Technik GMBH, Germany (http://www.fts-de.com/) in an autoclave-type chamber. The
media were exposed to 2%, 5% and 10% of fluorine diluted with gaseous nitrogen, N2,
for specified time periods. A further batch was fluorinated in a 10%/90% F2/N2 gas
mixture, however the filter media could not withstand the intensive fluorination and
heat degradation was observed. It was observed that as the fluorination intensified, the
fluorinated sample changed its colour, Figure 8.1, from light blue to yellow green,
suggesting that extensive surface fluorination had progressed into the bulk [14] and sub-
surface as suggested by Mohr and Paul [15] and had modified the blue pigment.

Surface Characterisation of Filter Media
233
Figure 8.1 Images of Fluorinated Azurtex filter media: a) untreated; b) Az 2%F2, 10'; c)
Az 10%F2 batch 1; and d) Az 10%F2 batch 2.
8.2.3 Fluorocarbon (FC) Finish Application
The Azurtex media were treated with the Itoguard LJC6MUL finish by a conventional
pad/dry/cure (PDC) method. Since the wet pick-up percentage was low, around 15%
o.m.f., a number of application variations were explored, such as varying the
concentration of the FC, the use of iso-propanol as wetting agent, increase the dipping
time and number of dips, and lowering the padding pressure. All of these measures
provided a maximum of 26% o.m.f. wet pick-up. The final processing conditions
selected were 50 gL-1
Itoguard, 30 seconds dipping time, 1 bar pad pressure and
1m/minute padding speed, respectively. The wet pick-up percentage was in the range of
19 to 23.5%, Table 8.2. Three 1/3 size of A4 media sheets were first dipped into the FC
solution, padded through a horizontal two-roll laboratory padder (Mathis Switzerland),
then dried at 90°C for 5 minutes and cured at 150°C for 2 minutes in a Mathis
baker/steamer. A lower curing temperature than the conventional temperature (180°C)
was chosen because polypropylene has lower melting points.
a) b) c) d)
10.0 mm

Surface Characterisation of Filter Media
234
Table 8.2 Average wet pick-up percentge of original and fluorinated Azurtex media
Sample Average pick up % Standard error
Untreated 23.0 0.3
Az 2% F2, 2', Ito 23.3 0.2
Az 2% F2, 10', Ito 23.1 1.1
Az 5%F2, 2', Ito 21.9 0.4
Az 5% F2, 10', Ito 22.6 1.2
Az 10% F2, Ito 19.2 0.7
8.2.4 Plasma Treatment
The surface characteristics of polypropylene (PP) based materials, such as wettability
and adhesion, can be significantly altered by applying the appropriate plasma treatments
(e.g. argon, oxygen or fluorine) [16]. P2i (www.p2i.com) has developed nano-coating
technology to impart liquid repellent properties to the surface of materials. Its patented
“cold” non-equilibrium plasma technology, known as glow plasma, for materials
coating is claimed to produce thin layers, only molecules thick over the entire product
surface and does not adversely affect the bulk properties [6]. Depending on the initial
chemical composition of the plasma polymerisation feedstock variable composition
coatings can be grafted onto the surface and can impart a wide range of properties such
as increased liquid protection [17]. Therefore the resultant material has increased oil
and water repellency without affecting the material’s bulk properties or porosity and air
flow. Accordingly in this study we explored the potential for improved cake release in
filtration processing which offers performance improvements over a number of
application sectors. Overall the technology is claimed to be cost effective, quick,
substrate-independent, reliable, environment friendly and can produce high efficiency
oil/water repellent media [18] without using catalysts, cross-linking agents or
surfactants that require in traditional fluorocarbon application.
P2i have previously discussed their patented experimental process in several reported
studies [19, 20, 21]. In a typical plasma treatment for fluorocarbon application, the
experiments were carried out in an inductively coupled cylindrical glow discharge
reactor (5 cm diameter, 470 cm3 volume, base pressure of 6 × 10
-3 mbar, and a leak
rate of better than 6 × 10⁻⁹ mols-1
). The reactor was initially scrubbed with detergent
and rinsed with isopropyl alcohol and oven dried. The system was re-assembled and

Surface Characterisation of Filter Media
235
further cleaned with a 50W air plasma for 30 minutes. Then chamber was vented to air
and an A4 size Azurtex filter media was placed in the centre of the reactor. Next the
chamber was evacuated down to base pressure. Subsequently, the fluorochemical
feedstock vapour was introduced into the chamber at a constant pressure of ~0.2 mbar
and continued to purge for 5 minutes, followed by ignition of the glow discharge. After
5 minutes the deposition process was terminated, and the monomer vapour was passed
over the substrate for another 5 minutes. At the end of the cycle the plasma chamber
pressure was evacuated and then vented to atmosphere. The samples was treated under
three different conditions, the standard commercial process and two more aggressive
scaled-up processes, P2i std, P2i 1° and P2i 2°, respectively to see the fluorination
effect.
8.3 Results and Discussion
8.3.1 SEM Analysis
SEM was used initially to investigate the effect of surface treatments on the physical
topography of the media surface. Examination of the untreated polypropylene base
fabric showed the polypropylene filaments had relatively rough surfaces with some
roughening and surface particulates, Figure 8.2a. In contrast the untreated Azurtex has a
smooth surface due to polyurethane coating but there was variable coverage and
adhesion of the coating to the PP surface, Figure 8.2b. When the untreated Azurtex was
fluorinated, the roughening and etching increased with the increasing level of
fluorination, Figure 8.2c. More obvious fracturing/fusing occurred at the surface treated
with 10% F2 due to the exothermic nature of the gaseous treatment, Figure 8.2 d. It was
found that this roughness depends on the level of fluorination but that prolonged
exposure was not advantageous and led to degradation of the treated surface. In other
studies, extended fluorination was reported to cause increased surface roughness and
damage to the polymer structure [22].

Surface Characterisation of Filter Media
236
Figure 8.2 SEM micrographs of fluorinated untreated PP fabric and Azurtex media at
different fluorination levels: a) Untreated PP, base fabric, magnification x 1.0K; b)
Untreated Azurtex, magnification x 1.0K; c) Az 2% F2, 10′, magnification x 2.0K; and
d) Az 10% F2, magnification x 1.0K.
SEM micrographs of the modified Azurtex media with the Itoguard fluorochemical
showed that, whether fluorinated or non-fluorinated, a physical layer was formed on top
of the PU coating or exposed fibres, hence smoothing out the rough surface, Figure
8.3a, b, and c. In contrast, the plasma polymerised treated samples showed surface
cracking and particles to varying degrees on the surface of the media, Figure 8.3d,
which also varied depending on the treatment time.
a a)
d)
b)
c)

Surface Characterisation of Filter Media
237
Figure 8.3 SEM micrographs of modified Azurtex media at 2.0K magnification: a) Az
Ito; b) Az 2%F2, 10' Ito; c) Az 10%F2, Ito; and d) Az P2i std.
8.3.2 ATR FTIR Analysis of Filter Media
The ATR-FTIR technique provides chemical information up to several microns into the
fibre surface and offers potentially complementary information to the more surface
specific XPS technique [23].
The FTIR spectra of the untreated media, Figure 8.4, exhibited the typical vibrational
bands for a polyurethane: - NHstr (free and bonded) at 3300-3400 cm-1
, CH2str at 2850-
2950 cm-1
, C=Ostr in bonded urethane groups at 1620-1680 cm-1
(referred to as amide I),
NHstr stretch (amide II) and NH bending at 1533, 1540, 1313 and 1224 cm-1
[24, 25],
respectively, and -C-O-C-str in urethane groups at around 1000-1200 cm-1
[26, 27, 28].
Several kinds hydrogen bonds can be formed due to the presence of donor N-H group
and a C=O group in the urethane linkage [25]. C-C stretching vibrations, between 1373
to1600 cm-1
, originate from the aromatic ring from PU or aliphatic chain of PP.
a)
c) d)
b)

Surface Characterisation of Filter Media
238
Figure 8.4 ATR FTIR spectra of untreated Azurtex media
Typically the C-F stretching vibration is observed in the 1100-1350 cm-1
region, Figure
8.5 and 8.6 and can also be observed weakly at 400-800cm-1
[26]. The band observed at
about 550cm-1
can be assigned to the asymmetric deformation mode of CF3 groups. The
presence of the C-Ostr in the urethane at a similar wavelength made it difficult to detect
the changes that occur due to fluorination and FC finishing. Due to high electronegative
inductive effect of fluorine atom, ester C=O group can shift up to 5.7 x 10⁻⁴
cm-1
[29],
which was observed in these specimens. After fluorination polymers can be oxidised by
the gaseous fluorine and in the spectra of the treated media there is an increase in signal
intensity between 1690 to 1780 cm-1
due to the formation of carbonyl species, Figure
8.5. With the gaseous fluorination of polypropylene polymer, acid fluoride species can
be formed and it’s C=Ostr absorption would occur at about 1820 cm-1
, however no
spectral intensity was found with the polyurethane coating. A broad peak appeared in the
region of 1103 cm−1 can be attributed to the C-F stretch [30]. The appearance of the 1145
cm−1 band for only FC finished media, Figure 8.6, was due to the C-F stretching.
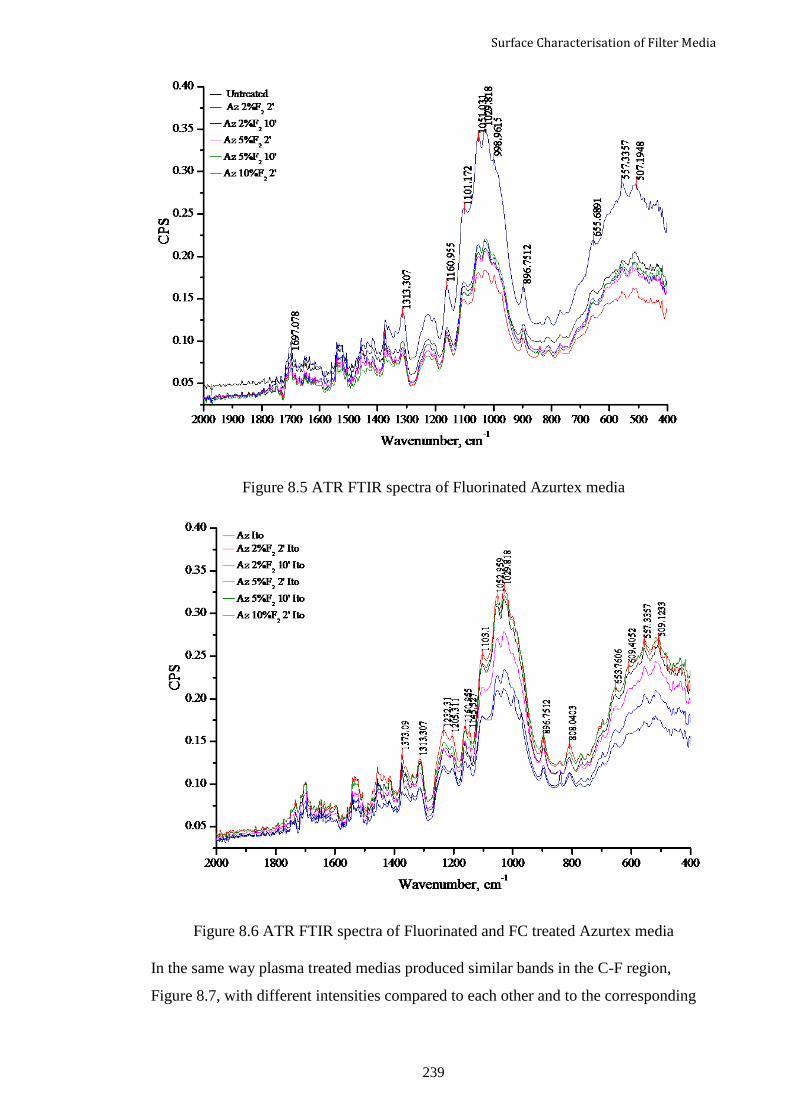
Surface Characterisation of Filter Media
239
Figure 8.5 ATR FTIR spectra of Fluorinated Azurtex media
Figure 8.6 ATR FTIR spectra of Fluorinated and FC treated Azurtex media
In the same way plasma treated medias produced similar bands in the C-F region,
Figure 8.7, with different intensities compared to each other and to the corresponding

Surface Characterisation of Filter Media
240
FC finished media, suggesting different compositions and thicknesses of the fluorine-
based molecular species attached in order to impart water repellency.
Figure 8.7 ATR FTIR spectra of Plasma treated Azurtex media
8.3.3 XPS
The XPS wide scan spectra Figure 8.8, 8.9 and 8.10 indicate that fluorine has been
introduced into the filter media surface either by gaseous fluorination, aqueous
fluorocarbon application or plasma polymerisation. In this study, the C(1s) and F(1s)
regions were of particular interest in that they allowed good characterisation of the outer
1-10 nm. The surface nitrogen concentration, N(1s), attributed to the polyurethane
polymer, was below 1% and appears to be relatively low due to probable surface
coating of fluorine. As the degree of fluorination increased, a well-defined F(1s) peak at
a binding energy of 686.0 eV was evident demonstrating the surface enrichment of
fluorine at the media interface. The increasing abundance of surface oxygen, O(1s), as
the gaseous fluorination treatment severity increased, reflected the oxidative nature of
the treatment on exposure to subsequent atmospheric oxygen. Subsequent FC treatment
on both non-fluorinated and fluorinated surfaces produced an obvious increase in
fluorine concentration. Similar behaviour was also shown by the plasma treated
samples, Figure 8.10.

Surface Characterisation of Filter Media
241
Figure 8.8 Widescan XP spectra of Fluorinated Azurtex filter media
Figure 8.9 Widescan XP spectra of Itoguard FC treated fluorinated Azurtex filter media
1100 1000 900 800 700 600 500 400 300 200 100
F1s
N1s O1s 10%F2
5%F2, 10'
5%F2, 2'
2%F2, 10'
2%F2, 2'
CP
S (
Arb
itra
ry u
nit
s)
Binding Energy, eV
Untreated
C1
s
1100 1000 900 800 700 600 500 400 300 200 100
CP
S (
Arb
itra
ry u
nit
s)
Binding Energy, eV
F1s
N1s O1s 10%F2, Ito
5%F2, 10', Ito
5%F2, 2', Ito
2%F2, 10', Ito
2%F2, 2', Ito
Az Ito
C1s

Surface Characterisation of Filter Media
242
Figure 8.10 Widescan XP spectra of plasma treated Azurtex filter media
It was suggested that thickness of the gaseous fluorinated layer depends on the
fluorination time [15], composition of fluorination mixture and polymer nature [31].
This study shows that level of fluorine at the outer surface reached a maximum within
the first 2 minutes of gaseous fluorination. The result supported the findings of others
[13, 22, 32], which showed fluorination on the surface was a rapid process. Thus the
fluorine surface saturation remained almost the same for both 2 and 10 minutes of
gaseous treatment time. In contrast, the 10% fluorination treatment on the media
showed high levels of fluorine, with a fourfold increase relative to the initial 2% level,
and caused a colour change of the original media, due to severe oxidative degradation to
the polyurethane coating and the incorporated pigment. Table 8.3 also showed a
significant enrichment of fluorine on the surface after the FC finish, in the range of over
60% atomic fluorine. Az 10% F2 and Itoguard post-treatment showed a lower value of
surface fluorination than Az 5% F2, Ito, possibly for two reasons. Firstly, due to be
potential development CF3 group at fluorination stage, which reduced pick up of FC
chemical or alternatively available groups for cross-linking with PU were minimized.
Similarly plasma treated media produced a highly fluorine enriched surface, as high as
over 87%, for the standard treatment.
1100 1000 900 800 700 600 500 400 300 200 100 C
PS
(A
rbit
rary
un
its)
Binding Energy, eV
F1s
O1s P2i 2°
P2i 1°
P2i std
C1s

Surface Characterisation of Filter Media
243
Table 8.3 XPS surface analysis of fluorinated and plasma treated Azurtex media
Sample Elemental composition, % Atomic ratio
C O F N Si F factor* F/O C/Si
Untreated 77.5 17.6 1.2 0.4 3.3 - - 23.9
Az Ito 64.1 24.7 9.2 0.5 1.6 9.2 0.4 40.3
Az 2%F2, 2' 64.4 24.6 9.4 0.6 1.1 9.4 0.4 59.0
Az 2%F2, 2', Ito 63.0 23.8 12.2 0.6 0.5 12.4 0.5 136.9
Az 2%F2, 10' 63.9 22.6 12.5 0.7 0.3 12.6 0.6 220.3
Az 2%F2, 10', Ito 50.2 20.1 28.7 0.9 0.1 36.6 1.4 502.1
Az 5%F2, 2' 46.8 8.5 43.8 - 0.8 60.0 5.1 58.5
Az 5%F2, 2', Ito 45.6 9.0 44.4 - 1.0 62.4 4.9 45.6
Az 5%F2, 10' 46.7 7.7 45.1 - 0.6 61.9 5.8 83.3
Az 5%F2, 10', Ito 43.8 8.1 47.7 - 0.5 69.8 5.9 93.1
Az 10%F2 45.2 7.7 46.8 - 0.4 66.5 6.1 118.8
Az 10%F2, Ito 45.8 7.7 46.1 - 0.4 64.4 6.0 109.1
P2i std 39.5 6.4 54.1 - - 87.8 8.4 -
P2i 1° 44.9 7.1 48.0 - - 68.5 6.7 -
P2i 2° 40.8 6.9 52.3 - - 82.2 7.6 -
*F factor is surface enrichment factor and defined as ratio between surface F/C and
stoichiometric F/C level [33].
The C(1s) XP spectrum of the untreated media was curve fitted using a Gaussian
Lorentzian procedure and showed two peaks from PU coating: C-H at 285.0 eV; C-O
and C-N at 286.6 eV, Figure 8.11. The characteristic peak of urethane (NH–CO2) at
289.5 eV was too small to allow accurate peak resolution. Similarly, the C(1s) XP
spectra of gaseous fluorinated, FC treated and plasma polymerised filter media were
curve fitted and quantified into six different components: C-H at 285.0 eV; C-O/CC-F
species at 286.6 eV; O-C=O/CHF at 289.0 eV, CF2 at 290.9 – 291.4 eV; and CF3 at
291.7-293.7 eV [13, 20]. The CHx functional groups decreased with fluorination and
other higher binding energy species were formed, in particular, oxygen related
functional groups formed such as C-OH, C=O, O-C-O and O-CO-O due to oxidation
and the electronegative fluorinated species. As shown in Figure 8.12, following
fluorination, the higher binding energy carbon species increase and additional oxidised
species start to appear. However as the CFx components increased, the CF3 component

Surface Characterisation of Filter Media
244
only appeared when the media was extensively fluorinated at 10% level. The intensities
of CF2 and CF3 peaks relative to original fluorinated media also increased when the FC
chemical was applied, Figure 8.13. The peak intensities were also increased when same
amount of FC chemical was applied on the fluorinated media. In contrast the plasma
treated samples showed immediate peak intensities at CF2 and CF3, the highest levels
were for the P2i std sample, Figure 8.14.
298 296 294 292 290 288 286 284 282
0
2000
4000
6000
8000
Inte
nsity,
CP
S
Binding energy, eV
CHX
C-O
C-N
Figure 8.11 C(1s) XP spectra of untreated Azurtex filter media

Surface Characterisation of Filter Media
245
298 296 294 292 290 288 286 284 282
0
2000
4000
6000
8000
Inte
nsity, C
PS
a)
Binding energy, eV298 296 294 292 290 288 286 284 282
0
2000
4000
6000
8000
298 296 294 292 290 288 286 284 282
0
2000
4000
6000
8000
298 296 294 292 290 288 286 284 282
0
2000
4000
6000
8000
298296294292290288286284282
0
2000
4000
6000
8000
298 296 294 292 290 288 286 284 282
0
2000
4000
6000
8000
298 296 294 292 290 288 286 284 282
0
2000
4000
6000
8000
Inte
nsity,
CP
S
Binding energy, eV
b)
298 296 294 292 290 288 286 284 282
0
2000
4000
6000
8000c)
Binding energy, eV
Inte
nsity, C
PS
298 296 294 292 290 288 286 284 282
0
2000
4000
6000
8000d)
Binding energy, eV
Inte
nsity, C
PS
298 296 294 292 290 288 286 284 282
0
2000
4000
6000
8000
Inte
nsity,
CP
S
C-O
C-CF
Binding energy, eV
e)
CF3
CF2
O-C=O
C-F
CHX
Figure 8.12 C(1s) XP spectra of fluorinated Azurtex filter media: a) Az 2%F2, 2'; b) Az
2%F2, 10'; c) Az 5%F2, 2'; d) Az 5%F2, 10'; and e) Az 10%F2 .

Surface Characterisation of Filter Media
246
298 296 294 292 290 288 286 284 282
0
2000
4000
6000
8000
298 296 294 292 290 288 286 284 282
0
2000
4000
6000
8000
298296294292290288286284282
0
2000
4000
6000
8000
298 296 294 292 290 288 286 284 282
0
2000
4000
6000
8000
298 296 294 292 290 288 286 284 282
0
2000
4000
6000
8000
298 296 294 292 290 288 286 284 282
0
2000
4000
6000
8000
Inte
nsity,
CP
S
Binding energy, eV
a)
298 296 294 292 290 288 286 284 282
0
2000
4000
6000
8000
298 296 294 292 290 288 286 284 282
0
2000
4000
6000
8000
298 296 294 292 290 288 286 284 282
0
2000
4000
6000
8000
b)
Inte
nsity,
CP
S
Binding energy, eV
298 296 294 292 290 288 286 284 282
0
2000
4000
6000
8000
298 296 294 292 290 288 286 284 282
0
2000
4000
6000
8000
298 296 294 292 290 288 286 284 282
0
2000
4000
6000
8000
298296294292290288286284282
0
2000
4000
6000
8000
298 296 294 292 290 288 286 284 282
0
2000
4000
6000
8000
298 296 294 292 290 288 286 284 282
0
2000
4000
6000
8000
Inte
nsity,
CP
S
Binding energy, eV
c)
298 296 294 292 290 288 286 284 282
0
2000
4000
6000
8000
298 296 294 292 290 288 286 284 282
0
2000
4000
6000
8000
298 296 294 292 290 288 286 284 282
0
2000
4000
6000
8000
298 296 294 292 290 288 286 284 282
0
2000
4000
6000
8000
Inte
nsity,
CP
S
Binding energy, eV
d)
298 296 294 292 290 288 286 284 282
0
2000
4000
6000
8000
Inte
nsity,
CP
S
Binding energy, eV
e)
298 296 294 292 290 288 286 284 282
0
2000
4000
6000
8000
Inte
nsity,
CP
S
CHX
Binding energy, eV
f)
CF3
CF2
O-C=O
C-F C-O
C-CF
Figure 8.13 C(1s) XP spectra of Itoguard treated fluorinated Azurtex filter media: a) Az
Ito; b) Az 2%F2, 2', Ito; c) Az 2%F2, 10', Ito; d) Az 5%F2, 2', Ito; e) Az 5%F2, 10', Ito;
and f) Az 10%F2, Ito.

Surface Characterisation of Filter Media
247
298 296 294 292 290 288 286 284 282
0
2000
4000
6000
8000
298 296 294 292 290 288 286 284 282
0
2000
4000
6000
8000
298 296 294 292 290 288 286 284 282
0
2000
4000
6000
8000
Inte
nsity,
CP
S
Binding energy, eV
a)
298 296 294 292 290 288 286 284 282
0
2000
4000
6000
8000
298 296 294 292 290 288 286 284 282
0
2000
4000
6000
8000
Inte
nsity,
CP
S
Binding energy, eV
b)
298 296 294 292 290 288 286 284 282
0
2000
4000
6000
8000
Inte
nsity,
CP
S
CHX
Binding energy, eV
c)
CF3
CF2
O-C=O
C-F
C-O
C-CF
Figure 8.14 C(1s) XP spectra of plasma treated Azurtex filter media: a) P2i std; b) P2i
1°; and c) P2i 2°.
8.3.4 Wettability
In this study, the surface wetting properties of the treated filters are of interest since in
general, it is known that the hydrophobic surfaces are prone to fouling/blinding due to
the hydrophobic interactions between the surface of filter materials, solutes, and
microbial cells [34]. The adsorption of organic species and the precipitation of inorganic
salts could be other factors [34]. Previously it was shown that the anti-fouling property
of microporous polypropylene media can be improved by surface modification through
grafting hydrophilic polymer [35, 36, 37] or plasma technology [34, 38]. Thus
hydrophilicity/hydrophobicity of the surface can be an influential indicator to organic
fouling. Lower surface contact angle, a measure of hydrophilic surface, has been
correlated with improved fouling/blinding resistance [39, 40]. Consequently, imparting
hydrophilicity could make blinding less critical and improve filtration performance [41].
However it is also known that surface characterization of media may not reflect their
bulk properties [40].
Polypropylene-based media are widely used for microfiltration but their hydrophobicity
is high which may cause the adsorption of hydrophobic and amphoteric solutes [42].
Surface Characterisation of Filter Media
248
The contact angles, wetting time and 3M oil/water repellency of the media can indicate
the hydrophilicity or hydrophobicity of the media. The water/oil repellency and wetting
time of the filter media are shown in Table 8.4 and it can be seen that the fluorinated
Azurtex media exhibited increased wettability. Although the result was unexpected as
fluorine is a highly electronegative oxidative molecule nevertheless the water repellency
rating remained zero as measured after 60 seconds. Similar trends were reported for the
surface fluorination of PP in other studies [43, 44, 45], and Volooj [13] reported that
fluorination of the Primapor media increased wettability but that it was not directly
proportional to an increase in the fluorination treatment time.
The Azurtex media has a PU coating with hard segment fraction which similarly reacts
with the PP material during fluorination. The shorter fluorination times was resulted an
increase in the polar component of the surface energy, but decreased with increasing
fluorination. Although the change in wetting time was significant as the degree of
fluorination or treatment time increased, with the wettability decreased dramatically for
Az 10%F2, where it is likely the higher amounts of CF3 and CF2 on the surface, as
evident by XPS analysis , reduced wetting. The surface hydrophobicity of the gaseous
treated media was significantly increased with the further addition of FC chemicals. It
was evident that the FC chemical finish was responsible for maximum wetting time of
4800 seconds considered in this study, whether the surface was fluorinated or non-
fluorinated. Plasma treated filter media also showed an increasing wetting time
particularly for plasma std and 2° treatments. It is also known that the location of
plasma-polymerised fluorocarbon films is essentially a surface phenomenon [46].

Surface Characterisation of Filter Media
249
Table 8.4 Oil/Water repellency and wetting times for treated Azurtex filter media. 4800s
has been the upper measurable limit
Sample Water Repellency
Rating
Oil Repellency
Rating
Wetting time
(s)
Untreated 0 0 8
Az 2%F2, 2′ 0 0 15
Az 2%F2, 10′ 0 0 21
Az 5%F2, 2′ 0 0 22
Az 5%F2, 10′ 0 0 26
Az 10%F2 0 0 386
Az Ito 4 3 4800
Az 2%F2, 2′, Ito 4 4 4800
Az 2%F2, 10′, Ito 4 3 4800
Az 5%F2, 2′, Ito 4 3 4800
Az 5%F2, 10′, Ito 4 3 4800
Az 10%F2, Ito 4 4 4800
P2i std 4 3 4800
P2i 1° 4 3 2000
P2i 2° 4 3 4800
Although hydrophilic surfaces were reported to be favourable for anti-fouling
applications, nevertheless a decrease of flux was also observed due to the deposition of
cake layer. Thus an improvement of flux and ease of cake removal was considered
important and achievable by imparting a hydrophobic FC treatment after fluorination of
the Azurtex filter fabric. The results of the 3M oil/water repellency in Table 8.4 showed
that the 60 seconds threshold for the test was enough to get similar
hydrophilic/oleophilic properties for both the original and fluorine treated filters. The
FC and plasma treated filter media were found to have water and oil repellency ratings
of 4 and 3, respectively, which means they can repel 40% water/60% isopropyl alcohol
mixtures and hexadecane, offering a reasonable level of liquid repellency. In contrast,
Pre-fluorination of filter media before FC treatment didn’t change the water and oil
repellency, except at the 10% level. This effect can be explained by the FC coating
cross-linking the porous structure of the filter fabric thus making the fabric more
“impenetrable” to any effect that can be caused by the fluorination.

Surface Characterisation of Filter Media
250
The contact angle remained in the range of 130 to 145°, but it did not correlate with Az
2%F2, 2′, Ito and P2i 1° due to the presence of CF2 and CF3 groups compared to the
overall alkyl C(1s) species, Figure 8.15. It has been established that surface tension
decreases in the order of CH2 (36 mN/m) > CH3 (30 mN/m) > CF2 (23 mN/m) > CF3
(15 mN/m) [47]. CF3 is more effective than CF2 at lowering the surface tension due to
the bulky F atom lowering the density of attractive centres per unit area at the surface
[48], which could be attributed to the lower contact angles for Az 2%F2, 2′ Ito and P2i
1° samples. Additionally, the wetting properties of fluorinated surfaces depend on both
the coverage of surfaces and degree of order in the surface [12]. A uniformly organized
or closely packed CF3 groups can create the lowest possible surface tension [47].
Figure 8.15 Relationship between contact angles and (CF2+CF3)/C(1s) in modified
selected filter media. ■ – contact angle (°); and ▲- (CF2+CF3)/C(1s).
8.4 Conclusions
The results illustrate that a combination of XPS and ATR FTIR analysis provides
information about the chemical structure of the surface of the filter media. Fluorination
can improve and impart stable hydrophilic properties, which could reduce media
fouling/blinding. The XPS study showed a gradual increase in the -CF2 and -CF3
functionality signal intensities that resulted in imparting hydrophobicity. These
modifications on untreated filter media provides water repellency and oil repellency
could alter the cake discharge performance. The presence of electronegative group,
fluorine, could potentially improve the flux, hence promote improvements in efficiency.
0%
10%
20%
30%
40%
50%
60%
0.0
20.0
40.0
60.0
80.0
100.0
120.0
140.0
160.0
Untr
eate
d
Az
10%
F₂
Az
Ito
Az
2%
F₂,
2',
Ito
Az
2%
F₂,
10',
Ito
Az
5%
F₂,
2',
Ito
Az
5%
F₂,
10',
Ito
Az
10
%F₂,
Ito
P2i
std
P2i
1°
P2i
2°
Ato
mic
% (
CF₂+
CF₃)
/C(1
s)
Conta
ct a
ngle
, d
egre
e

Surface Characterisation of Filter Media
251
8.5 References
1. Sutherland, K., Filters and filtration handbook, 5th ed., 2008, Elsevier, Oxford,
ISBN 9781856174640.
2. Akbari, A., J. C. Remigy and P. Aptel, Treatment of textile dye effluent using a
polyamide-based nanofiltration membrane, Chemical Engineering and
Processing: Process Intensification, 2002, 41 (7), p.601-609.
3. Lau, W.-J. and A. F. Ismail, Polymeric nanofiltration membranes for textile dye
wastewater treatment: Preparation, performance evaluation, transport
modelling, and fouling control -- a review, Desalination, 2009, 245 (1-3), p.321-
348.
4. Anjaneyulu, Y., N. S. Chary and D. S. S. Raj, Decolourization of industrial
effluents - available methods and emerging technologies - A Review, Reviews in
Environmental Science and Biotechnology, 2005, 4 (4), p.245-273.
5. Hai, F. I., K. Yamamoto and K. Fukushi, Hybrid treatment systems for dye
wastewater, Critical Reviews in Environmental Science and Technology, 2007,
37 (4), p.315-377.
6. Yang, J., Prospects for flux enhancement in anaerobic membrane bioreactors
treating saline wastewater, in Civil Engineering and Geosciences, 2013, Delft
University of Technology. p.141.
7. Porter, J. J., P. J. Brown and J. Malphrus, Influence of pH on the rejection of
salts and ionic dyes by microfilters, Desalination, 2005, 184 (1–3), p.23-35.
8. Porter, J. J. and A. C. Gomes, The rejection of anionic dyes and salt from water
solutions using a polypropylene microfilter, Desalination, 2000, 128 (1), p.81-
90.
9. Porter, J. J. and S. Zhuang, Microfiltration of sodium nitrate and Direct Red 2
dye using asymmetric titanium dioxide membranes on porous ceramic tubes,
Journal of Membrane Science, 1996, 110 (1), p.119-132.
10. Porter, J. J. and R. S. Porter, Filtration studies of selected anionic dyes using
asymmetric titanium dioxide membranes on porous stainless-steel tubes, Journal
of Membrane Science, 1995, 101 (1–2), p.67-81.
11. Grampel, R. D. V. D., Surfaces of fluorinated polymer systems, 2002,
Technische Universiteit Eindhoven, Eindhoven. p.151.
12. Genzer, J., E. Sivaniah, E. J. Kramer, J. Wang, H. Körner, M. Xiang, K. Char,
C. K. Ober, B. M. DeKoven, R. A. Bubeck, M. K. Chaudhury, S. Sambasivan
and D. A. Fischer, The orientation of semifluorinated alkanes attached to
polymers at the surface of polymer films, Macromolecules, 2000, 33 (5), p.1882-
1887.

Surface Characterisation of Filter Media
252
13. Volooj, S., Investigation into the wet processing of Keratin fibres and filter
media, in Department of Textiles, 2003, The University of Manchester Institute
of Science and Technology, PhD Thesis, Manchester.
14. Rehwinkel, C., Fluorination of filter media, 2010, Fluor technik, Lauterbach.
15. Mohr, J. M., D. R. Paul, Y. Tam, T. E. Mlsna and R. J. Lagow, Surface
fluorination of composite membranes. Part II. Characterization of the
fluorinated layer, Journal of Membrane Science, 1991, 55 (1-2), p.149-171.
16. Borcia, G., C. A. Anderson and N. M. D. Brown, The surface oxidation of
selected polymers using an atmospheric pressure air dielectric barrier
discharge. Part I, Applied Surface Science, 2004, 221 (1–4), p.203-214.
17. Coulson, S. and D. Cowieson, Plasma: efficient filter enhancement, Filtration &
Separation, 2005, 42 (9), p.38-40.
18. Coulson, S., Plasma processing: Nano-coating enhances filtration media,
Filtration & Separation, 2010, 47 (4), p.34-36.
19. Coulson, S. R., I. S. Woodward, J. P. S. Badyal, S. A. Brewer and C. Willis,
Plasmachemical functionalization of solid Surfaces with low surface energy
perfluorocarbon chains, Langmuir, 2000, 16 (15), p.6287-6293.
20. Coulson, S. R., I. S. Woodward, J. P. S. Badyal, S. A. Brewer and C. Willis,
Ultralow surface energy plasma polymer films, Chemistry of Materials, 2000, 12
(7), p.2031-2038.
21. Coulson, S. R., I. Woodward, J. P. S. Badyal, S. A. Brewer and C. Willis, Super-
repellent composite fluoropolymer surfaces, The Journal of Physical Chemistry
B, 2000, 104 (37), p.8836-8840.
22. Le Roux, J. D., D. R. Paul, M. F. Arendt, Y. Yuan and I. Cabasso, Surface
fluorination of poly (phenylene oxide) composite membranes: Part II.
Characterization of the fluorinated layer, Journal of Membrane Science, 1994,
90 (1-2), p.37-53.
23. Simon, F., G. Hermel, D. Lunkwitz, C. Werner, K. Eichhorn and H. J.
Jacobasch, Surface modification of expanded poly(tetrafluoroethylene) by means
of microwave plasma treatment for improvement of adhesion and growth of
human endothelial cells, Macromolecular Symposia, 1996, 103 (1), p.243-257.
24. Nakayama, K., T. Ino and I. Matsubara, Infrared spectra and structure of
polyurethane elastomers from polytetrahydrofuran, diphenylmethane-4, 4′-
diisocyanate, and ethylenediamine, Journal of Macromolecular Science: Part A -
Chemistry, 1969, 3 (5), p.1005-1020.
25. Oprea, S. and V. Oprea, Influence of crosslinkers on properties of new
polyurethane elastomers, Materiale Plastice, 2010, 47 (1), p.54-58.

Surface Characterisation of Filter Media
253
26. Stuart, B., Infrared spectroscopy: Fundamentals and applications Analytical
Techniques in the Science, ed. D. J. Ando, 2004, John Wiley and Sons, Ltd,
West Sussex.
27. Kuptsov, A. H. and G. N. Zhizhin, Handbook of Fourier Transform Raman and
Infrared spectra of polymers Physical Sciences data, Vol. 45, 1998, Elsevier,
Netherlands.
28. Schoonover, J. R., D. M. Dattelbaum, J. C. Osborn, J. S. Bridgewater and J. W.
Kenney, Pressure-dependent Fourier Transform Infrared spectroscopy of a poly
(ester urethane), Spectrochimica Acta Part A: Molecular and Biomolecular
Spectroscopy, 2003, 59 (2), p.309-319.
29. Rappaport, G., M. Hauptschein, J. F. O'Brien and R. Filler, Fluorinated Esters.
IV. The Effect of Neighboring Fluorine Atoms on the Ester Carbonyl Frequency,
Journal of the American Chemical Society, 1953, 75 (11), p.2695–2697.
30. Peng, H., P. Reverdy, V. N. Khabashesku and J. L. Margrave, Sidewall
functionalization of single-walled carbon nanotubes with organic peroxides,
Chemical Communications, 2003 (3), p.362-363.
31. Kharitonov, A. P., Direct fluorination of polymers-from fundamental research to
industrial applications, Progress in Organic Coatings, 2008, 61 (2-4), p.192-204.
32. Le Roux, J. D., D. R. Paul, J. Kampa and R. J. Lagow, Surface fluorination of
poly (phenylene oxide) composite membranes Part I. Transport properties,
Journal of Membrane Science, 1994, 90 (1–2), p.21-35.
33. Ming, W., L. van Ravenstein, R. van de Grampel, W. van Gennip, M. Krupers,
H. Niemantsverdriet and R. van der Linde, Low surface energy polymeric films
from partially fluorinated photocurable solventless liquid oligoesters, Polymer
Bulletin, 2001, 47 (3-4), p.321-328.
34. Yu, H.-Y., Y.-J. Xie, M.-X. Hu, J.-L. Wang, S.-Y. Wang and Z.-K. Xu, Surface
modification of polypropylene microporous membrane to improve its antifouling
property in MBR: CO2 plasma treatment, Journal of Membrane Science, 2005,
254 (1–2), p.219-227.
35. Liu, Z. M., Z. K. Xu, J. Q. Wang, J. Wu and J. J. Fu, Surface modification of
polypropylene microfiltration membranes by graft polymerization of N-vinyl-2-
pyrrolidone, European Polymer Journal, 2004, 40 (9), p.2077-2087.
36. Ulbricht, M. and G. Belfort, Surface modification of ultrafiltration membranes
by low temperature plasma II. Graft polymerization onto polyacrylonitrile and
polysulfone, Journal of Membrane Science, 1996, 111 (2), p.193-215.
37. Xu, Z., J. Wang, L. Shen, D. Men and Y. Xu, Microporous polypropylene
hollow fiber membrane. Part I. Surface modification by the graft polymerization
of acrylic acid, Journal of Membrane Science, 2002, 196 (2), p.221-229.

Surface Characterisation of Filter Media
254
38. Liu, Z.-M., Z.-K. Xu, L.-S. Wan, J. Wu and M. Ulbricht, Surface modification of
polypropylene microfiltration membranes by the immobilization of poly(N-vinyl-
2-pyrrolidone): a facile plasma approach, Journal of Membrane Science, 2005,
249 (1–2), p.21-31.
39. Nabe, A., E. Staude and G. Belfort, Surface modification of polysulfone
ultrafiltration membranes and fouling by BSA solutions, Journal of Membrane
Science, 1997, 133 (1), p.57-72.
40. Gilron, J., S. Belfer, P. Väisänen and M. Nyström, Effects of surface
modification on antifouling and performance properties of reverse osmosis
membranes, Desalination, 2001, 140 (2), p.167-179.
41. Chang, I. S., S. O. Bag and C. H. Lee, Effects of membrane fouling on solute
rejection during membrane filtration of activated sludge, Process Biochemistry,
2001, 36 (8-9), p.855-860.
42. Shim, J. K., H. S. Na, Y. M. Lee, H. Huh and Y. C. Nho, Surface modification of
polypropylene membranes by γ-ray induced graft copolymerization and their
solute permeation characteristics, Journal of Membrane Science, 2001, 190 (2),
p.215-226.
43. du Toit, F. J., R. D. Sanderson, W. J. Engelbrecht and J. B. Wagener, The effect
of surface fluorination on the wettability of high density polyethylene, Journal of
Fluorine Chemistry, 1995, 74 (1), p.43-48.
44. du Toit, F. J. and R. D. Sanderson, Surface fluorination of polypropylene: 1.
Characterisation of surface properties, Journal of Fluorine Chemistry, 1999, 98
(2), p.107-114.
45. du Toit, F. J. and R. D. Sanderson, Surface fluorination of polypropylene: 2.
Adhesion properties, Journal of Fluorine Chemistry, 1999, 98 (2), p.115-119.
46. Gnanappa, A. K., C. O'Murchu, O. Slattery, F. Peters, B. Aszalós-Kiss and S. A.
M. Tofail, Effect of annealing on hydrophobic stability of plasma deposited
fluoropolymer coatings, Polymer Degradation and Stability, 2008, 93 (12),
p.2119-2126.
47. Zisman, W. A., Relation of the equilibrium contact angle to liquid and solid
constitution, in Contact Angle, Wettability, and Adhesion, Advances in
Chemistry Series, F. M. Fowkes, Editor, 1964, American Chemical Society,
Washington DC.
48. Johnson, R. E., Jr. and R. H. Dettre, eds. Chapter 1. Wettability, ed. J. C. Berg.
1993, Marcel Dekker, New York.

Performance of Filter Media
255
9. Performance of coagulation/ flocculation with
selected filter media
9.1 Introduction
Colour removal by pressure-driven media processing is industrially preferred over
conventional chemical treatments, e.g. ozonation, electro-chemical etc., as it provides
high removal efficiency and allows reuse of water and ingredients in the residual
dyebath [1, 2, 3]. However, a single filter stage may not be adequate for full removal of
colour, and even though there is continuous improvement in filter media treatment
processing, new materials for media are still being developed and sought. Ultrafiltration
has been successfully used for high molecular weight and insoluble dyes such as indigo,
and chemicals like PVA [4]. Nanofiltration and reverse osmosis can efficiently remove
low molecular soluble dyes like acid and direct dye, and are considered essential for
using reuse of dyeing wastewater [4, 5, 6].
In this chapter, the modified Azurtex filter media, as discussed in Chapter 8, was
selected as an appropriate separation system, but prior to testing surface modified filters
were benchmarked against newly developed filter materials in order to compare their
performance.
9.2 Filter Media Benchmarking Study
9.2.1 Experimental
A series of modified Azurtex filter media were supplied by Clear Edge Filtration, UK
were assessed as part of the benchmarking investigation. The proprietary filters were
identified as 28730A, 28730C, 28730K, 97400A, 97400C and 97400T, and their details
are given in Table 9.1. A standard TiO2 slurry was tested for measuring the performance
of media. The details of the slurry are given in Section 2.4. Ease of cake removal was
arbitrarily rated in a scale of 1 to 5, where 5 is the very good and commercially
attractive.

Performance of Filter Media
256
Table 9.1 Properties of the filter media used in the benchmarking study
Ref Fibre Weight Liquid Permeability
(l/m²/min@20kPa)
Warp x
Weft
Thickness
(Micron)
28730A Microporous
Polymer
Coating on PP
620 >110 31 x 14 950
28730C Microporous
Polymer
Coating on PP
620 <80 31 x 14 900
28760K PP 590 2 max. 31 x 14 900
97400A Polyester 620 >110 24 x 9.5 1000
97400C Polyester 610 <50 24 x 9.5 750
97400T Polyester 620 >80 24 x 9.5 850
9.2.2 Results and Discussion
9.2.2.1 Average Flow Rate and Filtrate Properties
The average flow rate of the filter media supplied by Clear Edge showed little
difference in the filtrate flows, Figure 9.1. Typically it took 80 to 90 seconds to filter a
50 mL slurry, except for filter media 28760K which took 100 seconds. In this
assessment, due to the limitation of air pressure system, the pressure was low and
variable, in a range of 2.5 to 5.5 bar, and therefore, a clear explanation was not possible.

Performance of Filter Media
257
Figure 9.1 Average flow rate of Azurtex and proprietary filter media, 28730A;
28730C; 28760K, 97400A; 97400C; and 97400T.
Table 9.2 shows the properties of the filtrate after filtration process. The recovery of
solution was over 96% for all the samples, which means a little slurry was lost in the
process. The average filtrate recovery was similar for all the media tested. The
differences in turbidity and solid contents percentage were much more obvious and
indicated that 97400C filter media was able to filter the slurry to an acceptable level,
with a much clearer filtrate compared to the other filters.
Table 9.2 Properties of permeate for benchmarking testing
Sample Solution recovery% Filtrate (g) Solid content% Turbidity (NTU)
28730A 97.1 43.9 0.38 >1000
28730C 98.0 44.9 0.28 291
28760K 97.2 44.9 0.68 >1000
97400A 97.1 43.9 0.34 299
97400C 97.5 44.4 0.05 33
97400T 96.9 43.1 0.24 232
0
5
10
15
20
25
30
35
40
45
50
0 5 10 15 20 25 30 35 40 45 50 55 60 65 70 75 80 85 90 95 100
filt
ra
te, g
ms
time (seconds)

Performance of Filter Media
258
9.2.2.2 Cake Properties
The properties of cake in terms of moisture content, thickness, and disposal rating is
given in Table 9.3. There was no difference in terms of moisture content and thickness
of the cake but the ease of cake removal was much better with filter 97400C. In general,
the 97400 series performed better for cake disposal with less filter fouling.
Table 9.3 Performance properties of cake for benchmarking test
Sample Moisture content% thickness (mm)
Cake disposal rating (arbitrary) wet dry
28730A 41.2 8.0 7.6 3
28730C 41.2 8.2 7.8 3
28760K 41.5 8.1 7.9 4
97400A 40.9 8.0 7.7 4
97400C 41.0 8.1 8.0 4
97400T 41.3 8.3 7.9 3
9.3 Filtration Performance Comparison Test
Modified Azurtex media as shown in Section 8.2.1, were tested and compared with the
9700C from the benchmarking test. The filtration of the plasma treated media was
carried out over six months of the plasma treatment.
9.3.1 Results and Discussion
9.3.1.1 Average Flow Rate and Filtrate Properties
The average flow rate of selected modified media is given in Figure 9.2. Fluorinated and
FC finished media imparted water repellency and hence it was difficult for slurry to
pass through the media. The 10% gaseous fluorinated and their corresponding FC
finished media violently shaked the filter bomb at the end of the filtration process due to
their inherent hydrophobicity. This study expected a higher flow rate with fluorinated
sample, which was achieved as it took lesser time to filter the slurry suspension.
Fluorination at the 2% or 5% F2 levels for 10 minutes increased the flow rate compared
to fluorination for 2 minutes. Extended fluorination imparted hydrophobicity and

Performance of Filter Media
259
reduced the process flux. Plasma treated filters displayed similar results to the
fluorinated filters. In contrast, FC finishing of non-fluorinated filter media surprisingly
improved the flow rate. The repeating filtration in each media produces a reduced flow
and cleaner permeates due to efficient cake formation and filtration.
Figure 9.2 Average flow rate of modified Azurtex filter media: Untreated; Az
Ito; Az 2%F2, 2′; Az 2%F2, 10′; Az 5%F2, 10′; P2i 1°; and
97400C.
Typically all the filter solution recoveries were over 95%, table 9.4, however
differences in turbidity were observed. Each gaseous fluorinated filter media produced
solutions with turbidity values below 600 NTU, while the comparable FC treated filters
displayed the highest turbidity values. In contrast the plasma polymerised
fluoropolymer treatments produced filtrates with much lower turbidity. The improved
flux of the Itoguard treated Azurtex filter media, compared to 97400C, was due to the
lower ability to filter TiO2 particles, as evidenced by the higher turbidity.
0
5
10
15
20
25
30
35
40
45
0 5
10
15
20
25
30
35
40
45
50
55
60
65
70
75
80
85
90
95
100
105
110
115
120
Fil
trat
e m
ass,
g
time, s

Performance of Filter Media
260
Table 9.4 Properties of permeate after filtration process, a value of 1000 NTU was the
upper measurable limit
Sample Solution recovery,
%
Filtrate,
g
Solid content,
% Turbidity (NTU)
Untreated 97.8 41.4 0.06 491
Az Ito 97.3 40.1 0.09 >1000
Az 2%F2 2′ 97.8 40.1 0.05 406
Az 2%F2 2′ Ito 97.3 43.2 0.12 >1000
Az 2%F2 10′ 96.6 43.4 0.10 419
Az 2%F2 10′ Ito 97.7 43.3 0.11 >1000
Az 5%F2 2′ 98.0 44.5 0.07 663
Az 5%F2 2′ Ito 96.2 41.8 0.18 >1000
Az 5%F2 10′ 95.3 40.4 0.08 583
Az 5%F2 10′ Ito 97.2 40.8 0.13 >1000
Az 10%F2 96.5 40.1 0.05 479
Az 10%F2 Ito 93.1 42.3 0.20 >1000
P2i std 96.1 43.1 0.06 354
P2i 1° 96.7 41.2 0.06 357
P2i 2° 95.5 42.7 0.06 299
9.3.1.2 Cake properties
The moisture content, thickness and ease of cake removal of modified samples are given
in Table 9.5. The moisture content of the cake and weight of the dry cake remained
constant for each of the sample. The ease of cake removal is very important due to the
necessity for ease of cleaning and durability of media. Plasma treated filters provided
bigger size cake pieces and better cake removal compared to the other samples. Similar
results were obtained for Az 10%F2 and Az 5%F2, 10′ treated filters, perhaps due to the
increased CF2 and CF3 groups that were generated during the gaseous fluorination
imparting water repellency or due to the greater adhesion to the surface. In contrast, the
expected ease of cake removal of fluorinated and FC finished fabric was not achieved,
perhaps due to the "needle-like" orientation of the CF3 groups on the surface. The cake
often hardly attached to the filter bomb or the media and broke into pieces.

Performance of Filter Media
261
Table 9.5 Properties of cake after filtration
Sample Moisture
content%
thickness
(mm) Cake disposal rating
(arbitrary) wet dry
Untreated 40.9 8.3 7.9 3
Az ito 40.6 8.7 8.2 3
Az 2%F2 2′ 40.8 8.1 7.8 3
Az 2%F2 2′ Ito 41.1 8.5 8.0 2
Az 2%F2 10′ 40.6 8.3 8.0 2
Az 2%F2 10′ Ito 40.8 8.6 8.2 2
Az 5%F2 2′ 39.8 8.8 8.4 2
Az 5%F2 2′ Ito 39.9 8.5 8.1 3
Az 5%F2 10′ 39.8 8.6 8.3 4
Az 5%F2 10′ Ito 41.2 8.7 8.0 3
Az 10%F2 39.8 8.6 8.1 4
Az 10%F2 Ito 40.0 8.8 8.4 3
P2i std 40.6 9.0 8.3 4
P2i 1° 40.4 8.7 8.4 4
P2i 2° 40.9 8.7 8.4 3
9.3.2 Conclusions
Based on the research findings it can be concluded that:
Fluorination can improve the flux but the performance depends on the extent
and time of fluorination. However extended fluorination reduced the flux of the
process and destabilises the system. In contrast plasma polymerised
fluoropolymer surface coatings can improve the flow;
Fluorinated and FC finished filters offered little benefit in terms of improved
flow rate or lowering the turbidity of permeate. The ease of cake removal was
also low perhaps due to the orientation of CF3 groups on the surface;
Plasma treatment improved the flow, reduced turbidity and ease of cake removal
compared to the other modification;
Overall the 97400C filter performed better than any of the modified filters with
reference to lowering filtrate turbidity and ease of cake removal. Therefore this
media was used for recycling and re-used studies of exhausted dyebaths.

Performance of Filter Media
262
9.4 Coagulation/flocculation
Coagulation, flocculation and precipitation are often considered as the first steps in any
effluent treatment plant and are used to eliminate organic substances. The process itself
is not effective for removal of soluble dyes and can generate a large amount of sludge
[4, 7, 8]. However, it can enhance the retention of dyes in the subsequent media
filtration [9] with an associated reduction of fouling/blinding. Therefore,
coagulation/flocculation followed by membrane treatments is considered the most
successful combination for water reuse in textile processing [10, 11, 12, 13].
Generally, studies have focused on the complete removal of colour and reuse of the
effluents for standard dyeing processes. In addition, other studies have focused on the
reuse of wastewater and subsequent dyeing through electrochemical processing [14],
filtering, pH regulation or ion-exchange [15]. The combination of
coagulation/flocculation pre-treatment and microfiltration has been aimed at improving
the permeability and flux of the filtration processes [16, 17] by removing organic load.
Previously a 50% removal of organic load and 70% increment of flux have been
achieved with a coagulation-flocculation pre-treatment and the subsequent
microfiltration removed a further 30-70% organic load [16].
In this section, the efficiency of coagulation/ flocculation was evaluated with model dye
effluents. The coagulant/flocculant concentrations and pH were optimised and water
quality was determined, after microfiltration, in terms of colour removal and turbidity
reduction. Since microfiltration is only suitable for large molecular weight dyes, such as
pigment dyes [18], filtration was focused on removing organic loads and colloidal
particles in wastewater that would be generated from the reused wool dyeing baths.
9.4.1 Experimental
9.4.1.1 Materials
Woven wool (100%) Botany Serge fabric (2/2 twill, scoured and set, 295 gm-2
) was
supplied by Whaley’s, Bradford. Lanaset Blue 2R (λmax at 588 nm) and Sandolan Red
MF-GRLN (λmax at 494 nm) acid dyes were kindly supplied by Huntsman (formerly
Ciba) and Clariant, UK, respectively, and were applied to the wool at 3.0% o.m.f.,
without further purification. These dyes were selected as they performed well in

Performance of Filter Media
263
saltwater, as shown in Chapter 3 and are widely used in the textile industry. The
dyebath contained a wetting agent, Alpocol CPB (Ciba Specialty Chemicals), a pH
regulator (CH3COOH and NaOH) and a levelling agent, Lyogen MF (for the Sandolan
Red MF-GRLN dye), and Albegal Set (for the Lanaset Blue 2R dye), as recommended
[19].
9.4.1.2 Model Dye Effluents
Lanaset Blue 2R and Sandolan Red MF-GRLN acid dyes were used in this study and in
a typical acid dyeing process of wool, the average residual dye concentration is 0.15%
o.m.f. [20], or lower than 400 mgL-1
[21], and would include, apart from solid wool
particles, dyeing auxiliaries and substantial quantities of acids. Therefore a model dye
solution was prepared with 0.15% o.m.f. dye, 1.0 gL-1
levelling agent and 1.0 gL-1
wetting agent in simulated seawater. The aqueous pH for Lanaset Blue 2R and Sandolan
Red MF dyebaths was 5.80, respectively. Concentrated acetic acid or dilute caustic was
added to adjust the pH for filtration treatments. Filter bomb was used to carry out the
filtration through Azurtex filter media.
9.4.1.3 Coagulation/Flocculation and Filtration
The basic principle of Jar testing has been used in assessing the dual coagulation and
flocculation system with a vertical stirrer. 50 mL of model wastewater was placed in a
jar and the required amount of Pluspac 2000 was added and mixed rapidly at high speed
for 10 minutes at room temperature. The flocculant was then gradually introduced and
stirred into solution at slow speed for 5 minutes. The jar was then left unstirred and the
solution was settled for 24 hours. The test parameters evaluated were pH and the
concentrations of coagulant and flocculant. Since 12 gL-1
Pluspac 2000 and 8 gL-1
HPSS (Hydrosolanum PSS) was reported to be effective as a dual coagulation and
flocculation system for Lanaset Blue 2R dye solution with distilled water [20], initially
the solution pH was investigated in the range of 3.0, 4.0, 5.0, 6.0, 7.0, 8.0 and 9.0 at
fixed coagulation and flocculation concentrations. Subsequently after selecting a
suitable pH, the amount of Pluspac 2000 and HPSS was varied to 12:8 gL-1
, 12:12 gL-1
,
15:10 gL-1
, 18:12 gL-1
, and 20:10 gL-1
in a ratio of 1:1, 2:1 and 3:2 to achieve maximum
removal of colour. The pH of the samples was adjusted by HCl or CH3COOH and
NaOH. In the filtration step of the reuse of dyebaths, the optimum pH and concentration
was used.

Performance of Filter Media
264
The coagulated/flocculated dye solution was strained in a 500µm steel sieve and
experiments with filter media performed in a pressure vessel, which has an active
filtration area of 38.48cm2. The operating conditions were using a variable pressure of
2.5 to 5 bar at room temperature. Removal of dye from the model dye effluents was
determined using a Perkin Elmer UV-Vis spectrophotometer at the wavelength of
maximum absorption.
9.4.2 Results and Discussion
9.4.2.1 Optimisation of Flocculation Parameters
Optimisation of parameters for coagulation/flocculation process is vital for filtration of
recycling dyebath effluents. Inefficient coagulation/flocculation can cause acceleration
of fouling [22]. The process strongly depends on the environment of the solution such
as pH, salt concentration, dye concentration, auxiliaries and the properties of
coagulant/flocculant itself [23, 24].
The addition of cationic Pluspac 2000 in the model dye effluent or exhausted dye bath,
did not produce any flocs possibly due to the use of smaller dye molecules and ions
rather than colloidal particles [24] or presence of salts, and no visible colour removal
was obtained. However when the anionic HPSS added to the effluent stable microflocs
or gels was formed.
9.4.2.2 Effect of pH
Volooj [24] used a concentration ratio of 12 gL-1
PP2000 and 8 gL-1
HPSS at pH 4.0 for
Lanaset Blue 2R dye to achieve a dye removal over 96% after filtration in DSW.
Similarly in this research the same ratio was initially used and the effect of pH in the
range of 3.0 to 9.0 was assessed, Figure 9.3. Using the Equation 2.6 the dye removal
was calculated and the results indicated that only 89% dye removal for Lanaset Blue 2R
dye was achieved. Nevertheless the optimum dye removal was obtained at pH 4.0, as
like Volooj [24], when flocs started to appear after flocculation [24, 25]. This can be
attributed to the overlapping of complex formation and sweep coagulation of the species
[25]. At pH 6 to 9, the colour of model dye effluent changed, and as the pH increased
the change of colour was rapid and fewer and fewer beads formed. In presence of
aluminium salts, the flocs were physically attached at the surface as the hydrous metal
oxide.

Performance of Filter Media
265
In contrast the treated Sandolan Red MF-GRLN dyebath did not show any significant
dye removal, with just below 30% removed across the tested pH range. The result
proved that there is a strong correlation between pH and dye removal for acid dye and
varies depending on the types of dyes in the stated pH range as reported earlier [26].
Figure 9.3 Effect of pH on dye removal on SSW dyebath. Coagulation/flocculation
with 12 gL-1
Pluspac 2000 and 8 gL-1
HPSS. ▲ – Lanaset Blue 2R; and ■ – Sandolan
Red MF-GRLN
9.4.2.3 Effect of Pluspac 2000 and HPSS Concentration
It is known that the optimal dosage of coagulant differs from one structure to another
[27]. For Pluspac coagulants dosing could be an important method to control media
binding/fouling [28]. When the suitable pH range was found, in order to address the
effect of the saline water environment, a further optimal concentration for PP2000 and
HPSS was determined. Lanaset Blue 2R dyebath set at pH 3.0 and 4.0 was more
effective with 15 gL-1
PP2000 and 10 gL-1
HPSS compared to the other concentrations
ratio, Figure 9.4. A similar level of dye removal was found with a concentration ratio of
18:12 gL-1
however, the former conditions would take lesser amounts of chemicals. A
further test was performed at a concentration of 15:10 gL-1
at pH 3.5, Figure 9.5.
Contrary to the other results in distil water [20] at pH 3.0, 3.5 and 4.0 the dye removal
percentage was not that variable in SSW and pH 4.0 was chosen as it was closer to the
dyeing pH. In all cases turbidity removal was very high, often achieving the same
10
20
30
40
50
60
70
80
90
100
3 4 5 6 7 8 9
Co
lou
r re
mo
val
, %
pH of the model dye effluent

Performance of Filter Media
266
clarity as tap water. It is reported that removal of turbidity at pHs below 5 depends on
charge neutralisation [29] but that the presence of dissolved organic matter makes the
system re-stabilised due to the displacement of the equilibrium of the positively charged
species [25].
Figure 9.4 Removal of Lanaset Blue 2R dye with different concentration of PP2000 and
HPSS at different pH. ■ – pH 3.0; ▲ – pH 4.0; and ●– pH 5.0
Figure 9.5 Colour removal and turbidity as a function pH for Lanaset Blue 2R dye with
15 gL-1
Pluspac 2000 and 10 gL-1
HPSS (turbidity of original dye solution was 46.2
NTU). ▲ – colour removal; and ■ – turbidity.
20
30
40
50
60
70
80
90
100
12:8 15:10 18:12 12:12 20:10
Co
lou
r re
mo
val
, %
PP2000:HPSS, gL-1
0
0.5
1
1.5
2
2.5
0
10
20
30
40
50
60
70
80
90
100
3.0 3.5 4.0 5.0
Tu
rbid
ity, N
TU
Co
lou
r R
emoval
%
pH of the model dye effluent

Performance of Filter Media
267
Since processing of the Sandolan Red MF-GRLN dyebath offered only minimal dye
removal, therefore various concentration ratios at pH range from 3.0 to 7.0 were
examined. Figure 9.6 showed that the optimum PP2000 and HPSS coagulant/flocculant
ratio improved the performance that was seen in Figure 9.3, and 61% dye removal was
possible at pH 5.0, at a concentration of 15:15 gL-1
. It can be seen the influence of pH
and concentration of flocculant was critical, and at pH 3 to 5 the increase of flocculant
concentration improved dye removal. However a sharp drop in performance was
observed when the flocculant concentration was reduced. This can be attributed to the
fact that flocculant concentration was not high enough to neutralise the positive charge
of the flocs. This effect can also be observed with the bath turbidity after
coagulation/flocculation, Figure 9.7. The initial increase in turbidity means there were
more particles available in the suspension and an incremental level of removal
efficiency was obtained. In contrast, the removal of dye at pH 6 and 7 remained level
over the concentration ratio range studied. In general, such low removal of Sandolan
Red MF-GRLN dye from solution was related to the dye structure. This acid milling
dye has a smaller molecular size compared to the Lanaset Blue 2R metal complex dye
and it is known that the greater the interaction between the coagulant and the dye, the
greater would be the dye removal [30].
Figure 9.6 Removal of Sandolan Red MF-GRLN dye with different concentration of
PP2000 and HPSS in gL-1
at different pHs. ■ - 3.0; ▲ - 4.0; ● - 5.0; ▬ - 6.0; and ♦- 7.0.
0
10
20
30
40
50
60
70
12:8 15:10 18:12 12:12 15:15 16:8
Colo
ur
rem
oval
, %
PP2000:HPSS, gL-1

Performance of Filter Media
268
Figure 9.7 pH effect on turbidity after coagulation/flocculation for Sandolan Red MF-
GRLN dye at different ratio of Pluspac 2000 and HPSS in gL-1
. - 3.0; - 4.0; - 5.0;
- 6.0; and - 7.0. A value of 1000 NTU was the upper measurable limit.
It is reported that the adsorption forces are the poorest for red dyes, where the
aluminium coagulant, Al2(SO4)3 has no effect on dye removal [31]. As a result
Sandolan Red MF-GRLN dye produced fewer beads and gels after flocculation
compared to Lanaset Blue 2R dye. In addition, the blinding due to
coagulation/flocculation of Sandolan Red MF-GRLN dye, in particular at pH 3 and 4,
was difficult to remove, and as reported was to be more or less reversible as a function
of molecular weight and class of dyes [6] and also a function of pH. The decrease of
flux was also observed particularly at pH 3 and 4 and the filtration process was not
stabilized even after 6 hours of operation. After stirring, the flow improved a little
although it was known that back-flushing would be more effective than stirring [32].
The effectiveness of the flocculation process can be measured by the reduction of
turbidity [25]. The concentration conditions of 15:15 gL-1
Pluspac 2000: HPSS at pH
5.0, where maximum removal of dye achieved, increased the turbidity over the upper
measurable limit of 1000 NTU after coagulation and flocculation but after filtration was
reduced to an acceptable value, Figure 9.8. In contrast, at pH 3.0 and 4.0, although the
turbidity was again low over 6 hours the flux was also very low due to the increased
physical attachment of gel and flocs to the media surface.
0
100
200
300
400
500
600
700
800
900
1000
Original 12:8 15:10 18:12 12:12 15:15 16:8
Tu
rbid
ity, N
TU
PP2000:HPSS, gL-1

Performance of Filter Media
269
Figure 9.8 Colour removal and Turbidity in a function of pH for Sandolan Red MF dye
with 15 gL-1
Pluspac 2000 and 15 gL-1
HPSS. ▲ – colour removal; and ■ – turbidity.
9.4.3 Discussion
To analyse the overall results in addition to the effect of the individual dyes, three
scenarios have to be considered. Firstly, the environment is simulated seawater, with a
total concentration of salt of over 35 gL-1
. Secondly, the effect of coagulant as a mixture
of metallic aluminium salts and organic polyelectrolyte in combination with a highly
anionic HPSS working in a dual component system. Thirdly there is microfiltration of
the flocculated effluent with modified Azurtex filter media.
9.4.3.1 Effect of Dye Structure in Coagulation/flocculation Process
The influence of chromophore and auxochrome groups is very important during
coagulation/flocculation, with dye retention reportedly varying according to the
molecular size and concentration of the dyes [21]. The lower anionic charge, smaller
chain lengths and non-linear structure of dye molecules decreased the effectiveness of
coagulation [26]. Due to the variety of dye molecules, the removal of dye is therefore
complex. Any removal of dye depends on the physicochemical coagulation and/or
chelation/complexation [33, 34]. It was found that acid dyes with positively and
negatively charged auxochrome groups do not coagulate well [35]. Therefore, selecting
an appropriate standard coagulant was difficult due to the high solubility of dyes and the
continuing development of new dye variants and associated chemical structures [30].
Even with nominally water soluble dyes, the solubility varies due to the different
0
50
100
150
200
250
300
350
400
450
0
10
20
30
40
50
60
70
3.0 4.0 5.0 6.0 7.0
Tu
rbid
ity, N
TU
Co
lou
r R
emo
val
%
pH of the model dye solution

Performance of Filter Media
270
chemical structures [4] and the dye formulation containing additives and impurities like
sodium chloride, sulphite cellulose [23].
The coagulation efficiency is also influenced by the type of chromophore presents in the
dye molecule. Using modified polyacrylamide as a coagulant it was observed that
decolourisation increased in following order: azo> xanthene (for acid dyes),
phthalocyanine> anthraquinone (for reactive dyes) [36]. In other study, using 12 acid
dyes with various chromophores, such as, azo, xanthenes, anthraquinone,
triarylmethane, and metal complex, Han et al. [35] concluded that levelling acid dyes
were more difficult to coagulate.
Yu et el [30] studied 27 Direct, Acid and Reactive dyes with an organic flocculant,
PAN-DCD, which is a mixture of polyacrylonitrile (PAN) and dicyandiamide (DCD),
and found that the dye removal under acidic conditions depended on the sulphonic acid
and carboxyl groups. The higher the number of acid groups, greater was the interaction
with flocculant and higher the dye removal. In contrast Han et al. [35] reported that
triarylmethane acid dyes with two sulphonic groups were easier to coagulate than dyes
with four sulphonic acid groups. Similarly, the greater the number and size of
hydrophobic groups the greater was the interaction with flocculant and resultant higher
dye removal. In the case of anthraquinone dyes, binding of flocculant depends on both
number of sulphonic acids and hydrophobic groups in the structure. Amino and
hydroxyl groups in dyes can also contribute to dye removal with the formation of
hydrogen bonds with the flocculants [30].
Aggregation of dyes also plays a role in membrane fouling and media blinding where
dye retention on the surface may lead to blocking of media pores. The permeate flow
could be low unless they form a porous cake of large particles [37]. It was reported that
molecular aggregation of dyes depends on pH and that high levels of aggregation of C.
I. Direct Red 1 at pH 4 occurred due to ionisation of the sulphonate group. Over pH 4,
the carboxyl group was dissociated which increased the solubility and hence
aggregation was reduced [38]. Dye aggregates were stated to be more dominant and
better adsorbed onto the fibre rather than the individual dye molecules [39]. This may
explain the behaviour of Sandolan Red MF-GRLN dye at pH 3 and 4, where irreversible
fouling occurred and flux was decreased drastically.

Performance of Filter Media
271
9.4.3.2 Effect of SSW in Coagulation/flocculation Process
The presence of inorganic salts in the SSW environment may change the interactions
between the cationic coagulants and anionic flocculants. Dye aggregation in the
presence of electrolyte is very distinctive and reported to cause similar aggregation
irrespective of dye concentration due to the screening effect of salt ions [40]. Higher
charge or higher concentration would increase the aggregates of C. I. Reactive Red 2 in
both acid and alkaline conditions. The aggregation is greater in presence of calcium and
magnesium ions than in the presence of sodium ions. In acidic conditions, the dye
aggregation due to the influence of metal ions is associated with a reduction in dye
hydrophobicity. In contrast, under alkaline conditions the dye hydrophobicity increased
[38]. The DLVO theory predicts that a colloidal suspension with low to moderate
charge should be coagulated when the concentration of salts exceeded the critical
coagulation concentration. In contrast, polyelectrolyte adsorption, in presence of salts,
increases due to non-DLVO surface interactions such as steric repulsion, depletion
forces [41, 42] and consequently dye retention could be higher [21].
The presence of NaCl influences negatively on the performance of biological
wastewater treatment and the extent of influence depends on the degree of salinity. In an
attempt to use the NaCl present in saline wastewater as a coagulant to control membrane
fouling/blinding it was found that this approach was ineffective, and concluded that an
external coagulant was necessary for long term control of fouling [28]. It was also
previously reported [43] that NaCl up to 80 gL-1
rapidly decreased flux during
nanofiltration for C. I. Reactive Black 5 but at a concentration up to 50 gL-1
the dye
rejection greater than 98.5% was achieved. Similar results were found for C. I. Acid
Red 7 and C. I. Acid Orange G, over a concentration range of 2 to 2000 mgL-1
[21]
where dye retention increased with a decline of flux as the concentration of NaCl
increased [44]. It was concluded that at low salt concentration cake layer formation was
the main cause of the decline in flux, but at higher ionic strength adsorption was the
dominant mechanism [43]. In a study of a wool effluent bath containing acid/metal
complex dyes it was shown that there was a flux decline of up to 73%, which is partly
reversible [45]. The decline of flux was largely dependent on the concentration of
organic loads, with a higher concentration causing a lower water flux [45].

Performance of Filter Media
272
MgCl2, one of the components of SSW, alone or in combination has been used as a
coagulant in wastewater treatment at concentrations of over 4 gL-1
, similar to in this
study [46]. MgCl2 can achieve up to 90% dye removal and was seen to perform better
than alum or polyaluminium chloride (PAC) [46], while the related MgCl2/Ca(OH)2
system was superior to MgCl2/NaOH, Al2(SO4)3, PAC and FeSO4/Ca(OH)2 in terms of
dye removal when tested with disperse and reactive dye waste [47]. In another study,
using CaCl2 as coagulant with a concentration up to 50 mgL-1
at pH 6.5 reduced the
COD and turbidity to 12 mgL-1
and 3 NTU, respectively [48]. It was also reported that
CaCl2 and MgCl2, followed by a PDADMAC cationic polymer could “clean up” some
dyehouse effluent, with CaCl2 being the more effective [49]. Similar results were found
when anionic polyelectrolytes were used as flocculant aids with calcium and
magnesium as the cation, with a concentration of moderate hardness [50] .
In other studies increasing the solution salinity from 10,000 to 25,000 ppm NaCl in
combination with PDADMAC resulted in increased removal of humic substances. A
subsequent increase of salinity up to 35,000 ppm did not produce any further increase in
dye removal as a further compression of double layer was negligible. Addition of heavy
metals with PDADMAC in the coagulation bath resulted in increased removal of humic
substances in a saline environment [51] which supports the previous study of the hybrid
Pluspac 2000 coagulant system. Monovalent electrolytes such as NaCl deteriorate the
performance properties of flocs derived from reactive dyes [24] while the direct
addition of divalent cations such as Ca2+
and Mg2+
improved biofloc strength in a pilot
study using industrial activated sludge [52].
9.4.3.3 Effect of Dual Component System in Coagulation/flocculation
Process
It was mentioned in Section 1.6.4.5 that in a dual component system the flocculation
behaviour essentially depends on the concentration of polycation and the molar ratio of
the anionic and cationic charges [53, 54]. A step by step introduction of cationic
coagulants caused “patchwise” adsorption and subsequent addition of high molecular
weight anionic flocculants, >1,000,000 caused bridging on the surface of the media [55]
. When the anionic flocculant is of low molecular weight then a complex mechanism
occurs. In this case, a molar ratio of anionic charges to cationic charges, n-/n
+ of 0.6
should be reached for effective flocculation [53, 54]. The influence of polyanions was

Performance of Filter Media
273
found to be critical compared to polycations for clay suspension [56]. This is evident
when the amount of polyanion flocculant was increased in Sandolan Red MF-GRLN
dye, which led to larger floc formation and higher dye removal and was also observed
in other studies [53, 57]. The size and strength of flocs depends on the molecular size,
degree of charge and ionic strength of solution [58].
In most dyebaths, there are anionic chemicals and auxiliaries and Zemaitaitiene et al.
[59] have shown that cationic polymers such as PDADMAC react with these anions,
and form intermolecular complexes of different stoichiometry. Under controlled
conditions these complexes can incorporate dye ions or molecules and precipitate
together. Flocculation is the result of this triple complex formation and can be
controlled by pH and ionic strength of solutions. Depending on the mixing ratio of
polycations/polyanions, n-/n
+, these complexes could eliminate commercial dyes, such
as C. I. Acid Blue 74 or C. I. Acid Yellow 3 due to their hydrophobicity and structure
[55].
At high salt concentrations the interaction between charges is “screened” and thicker
adsorbed layers formed, which depends on the ionic strength rather than the valency of
the counterions [60]. With increasing ionic strength, after initial screening of charges, it
is possible to have reduced adsorption affinity as salt ions compete with polymer and
surface charges [61, 62]. Overall the charge mechanism with “patchwise” adsorption
takes place when the added hybrid aluminium-organic polycation coagulant provides
adsorption sites. Subsequently, the high molecular weight polyanion causes polymer
bridging to produce larger flocs with some degree of complexation also observed.
9.4.4 Conclusions
Based on the experimental results and discussions the following conclusions can be
made:
Flocculation of dye solutions with the combined cationic hybrid Pluspac2000
and polyanionic Hydrosolanum protein derivative system was achieved;
Suitable pH and dosage of coagulants/flocculants were vital for the interaction
of dye and flocculants and, therefore floc formation and subsequent dye
removal. Each dye showed a distinctive relationship with pH and concentration
ratios in the formation of molecular aggregates;

Performance of Filter Media
274
The coagulant/flocculant system worked effectively in the saline environment
but was highly dependent on the class of dyes, their structure, molecular size,
concentration and structural linearity as evident through a metal complex and
levelling dye;
In the saline environment a relatively high concentration ratio of
coagulant/flocculants (PP2000:HPSS=15:10 gL-1
) was required for Lanaset Blue
2R dye compared to previous study in distilled water (PP2000:HPSS =12:8 gL-1
)
[24]. In addition only a maximum dye removal of 61% was achieved for
Sandolan Red MF-GRLN dye at these relatively high concentration ratios;
The mechanism of flocculation with polycation could be through “patchwise”
adsorption, which provides adsorption sites for polyanions and can form bridges
with polyanions. Possible complexation can occur due to the presence of salt,
the hybrid coagulant and anions. In this situation, the molar ratio of cationic
charges to anionic charges, n-/n
+ is crucial and this specificity was demonstrated
through the ratio of Pluspac 2000 and HPSS;
The model effluent used in this study had no visible turbidity and therefore
perhaps the required concentration of coagulant/flocculant compared to
industrial scenario maybe higher. Real dye effluent would be expected to contain
dissolved organic solids, which would enhance the flocculation process through
polymer adsorption;
The influence of the dye chromophore and auxochrome in the saline
environment led to a compact fouling layer as evident at pH 3 and 4 for the
Sandolan Red MF-GRLN dye. The behaviour could be explained either by the
formation of dye aggregates [39] or of the presence of di-cations, like Ca2+
and
Mg2+
, and lead to compact fouling and compression of the adsorbed double
layer [63]. The compression of the double layer by NaCl has its limitations and
above a certain ionic strength, the compression is negligible [51];
It was observed that inorganic salt such as NaCl deteriorated the floc properties,
but divalent salts improved them [52].
The decline of flux was due to the higher organic load. At higher ionic strength,
this decline was due to the dominant adsorption mechanism and cake layer
formation. The operating conditions similarly influence on the flux permeates.

Performance of Filter Media
275
9.5 References
1. Sójka-Ledakowicz, J., T. Koprowski, W. Machnowski and H. H. Knudsen,
Membrane filtration of textile dyehouse wastewater for technological water
reuse, Desalination, 1998, 119 (1-3), p.1-10.
2. Rozzi, A., M. Antonelli and M. Arcari, Membrane treatment of secondary textile
effluents for direct reuse, Water Science and Technology, 1999, 40 (4–5), p.409-
416.
3. Rearick, W. A., L. T. Farias and H. B. G. Goettsch, Water and salt reuse in the
dyehouse, Textile Chemist and Colorist, 1997, 29 (4), p.10-19.
4. Mondal, S., Methods of dye removal from dye house effluent - An overview,
Environmental Engineering Science, 2008, 25 (3), p.383-396.
5. Xu, Y., R. E. Lebrun, P. J. Gallo and P. Blond, Treatment of textile dye plant
effluent by nanofiltration membrane, Separation Science and Technology, 1999,
34 (13), p.2501-2519.
6. Akbari, A., J. C. Remigy and P. Aptel, Treatment of textile dye effluent using a
polyamide-based nanofiltration membrane, Chemical Engineering and
Processing: Process Intensification, 2002, 41 (7), p.601-609.
7. Anjaneyulu, Y., N. S. Chary and D. S. S. Raj, Decolourization of industrial
effluents - available methods and emerging technologies - A Review, Reviews in
Environmental Science and Biotechnology, 2005, 4 (4), p.245-273.
8. Hai, F. I., K. Yamamoto and K. Fukushi, Hybrid treatment systems for dye
wastewater, Critical Reviews in Environmental Science and Technology, 2007,
37 (4), p.315-377.
9. Shkavro, Z. N., V. M. Kochkodan and V. V. Goncharuk, Intensification of the
ultrafiltration process when separating aqueous solutions of acid dyes, Journal
of Water Chemistry and Technology, 2009, 31 (5), p.292-296.
10. Suksaroj, C., M. Héran, C. Allègre and F. Persin, Treatment of textile plant
effluent by nanofiltration and/or reverse osmosis for water reuse, Desalination,
2005, 178 (1-3), p.333-341.
11. Choo, K.-H., S.-J. Choi and E.-D. Hwang, Effect of coagulant types on textile
wastewater reclamation in a combined coagulation/ultrafiltration system,
Desalination, 2007, 202 (1-3), p.262-270.
12. Bes-Piá, A., M. I. Iborra-Clar, A. Iborra-Clar, J. A. Mendoza-Roca, B. Cuartas-
Uribe and M. I. Alcaina-Miranda, Nanofiltration of textile industry wastewater
using a physicochemical process as a pre-treatment, Desalination, 2005, 178 (1–
3), p.343-349.

Performance of Filter Media
276
13. Bes-Piá, A., J. A. Mendoza-Roca, M. I. Alcaina-Miranda, A. Iborra-Clar and M.
I. Iborra-Clar, Reuse of wastewater of the textile industry after its treatment with
a combination of physico-chemical treatment and membrane technologies,
Desalination, 2002, 149 (1–3), p.169-174.
14. Riera-Torres, M., M. C. Gutierrez-Bouzan, J. V. Morell, M. J. Lis and M.
Crespi, Influence of electrochemical pre-treatment in dyeing wastewater reuse
for five reactive dyes, Textile Research Journal, 2011, 81 (18), p.1926-1939.
15. Erdumlu, N., B. Ozipek, G. Yilmaz and Z. Topatan, Reuse of effluent water
obtained in different textile finishing processes, Autex Research Journal, 2012,
12 (1), p.23-28.
16. Chapman, H., S. Vigneswaran, H. H. Ngo, S. Dyer and R. B. Aim, Pre-
flocculation of secondary treated wastewater in enhancing the performance of
microfiltration, Desalination, 2002, 146 (1–3), p.367-372.
17. Judd, S. J. and P. Hillis, Optimisation of combined coagulation and
microfiltration for water treatment, Water Research, 2001, 35 (12), p.2895-
2904.
18. Al-Malack, M. H. and G. K. Anderson, Use of crossflow microfiltration in
wastewater treatment, Water Research, 1997, 31 (12), p.3064-3072.
19. Park, J. and J. Shore, Fibre Types and Dyeing Processes, in Practical Dyeing,
2004, Society of Dyers and Colourists, Bradford.
20. Volooj, S., Investigation into the wet processing of keratin fibre and filter
media, in Department of Textiles, 2003, University of Manchester Institute of
Science and Technology, PhD Thesis, Manchester.
21. Gomes, A. C., I. C. Gonçalves and M. N. d. Pinho, The role of adsorption on
nanofiltration of azo dyes, Journal of Membrane Science, 2005, 255 (1–2),
p.157-165.
22. Farahbakhsh, K., C. Svrcek, R. K. Guest and D. W. Smith, A review of the
impact of chemical pretreatment on low-pressure water treatment membranes,
Journal of Environmental Engineering and Science, 2004, 3 (4), p.237-253.
23. Zahrim, A. Y., C. Tizaoui and N. Hilal, Coagulation with polymers for
nanofiltration pre-treatment of highly concentrated dyes: A review,
Desalination, 2011, 266 (1-3), p.1-16.
24. Volooj, S., Investigation into the wet processing of Keratin fibres and filter
media, in Department of Textiles, 2003, The University of Manchester Institute
of Science and Technology, PhD Thesis, Manchester.
25. Delgado, S., F. Diaz, D. Garcia and N. Otero, Behaviour of inorganic
coagulants in secondary effluents from a conventional wastewater treatment
plant, Filtration & Separation, 2003, 40 (7), p.42-46.

Performance of Filter Media
277
26. Beltrán-Heredia, J. and J. Sánchez Martín, Azo dye removal by Moringa oleifera
seed extract coagulation, Coloration Technology, 2008, 124 (5), p.310-317.
27. Thakur, B. D. and M. Joshi, Zero discharge in textile processing through TDS
control, American Dyestuff Reporter, 1994, 83 (8), p.32-39.
28. Yang, J., Prospects for flux enhancement in anaerobic membrane bioreactors
treating saline wastewater, in Civil Engineering and Geosciences, 2013, Delft
University of Technology. p.141.
29. Ghosh, M., A. Amirtharajah and A. Adin, Particle destabilization for tertiary
treatment of municipal wastewater by filtration, Water Science and Technology,
1994, 30 (9 pt 9), p.209-218.
30. Yu, Y., Y. Y. Zhuang, Y. Li and M. Q. Qiu, Effect of dye structure on the
interaction between organic flocculant PAN-DCD and dye, Industrial and
Engineering Chemistry Research, 2002, 41 (6), p.1589-1596.
31. Wenzel, H., H. H. Knudsen, G. H. Kristensen and J. Hansen, Reclamation and
reuse of process water from reactive dyeing of cotton, Desalination, 1996, 106
(1–3), p.195-203.
32. Nabe, A., E. Staude and G. Belfort, Surface modification of polysulfone
ultrafiltration membranes and fouling by BSA solutions, Journal of Membrane
Science, 1997, 133 (1), p.57-72.
33. Gaydardzhiev, S., J. Karthikeyan and P. Ay, Colour removal from model
solutions by coagulation - Surface charge and floc characterisation aspects,
Environmental Technology, 2006, 27 (2), p.193-199.
34. Mohan, S. V., P. Sailaja, M. Srimurali and J. Karthikeyan, Color removal of
monoazo acid dye from aqueous solution by adsorption and chemical
coagulation, Environmental Engineering and Policy, 1999, 1, p.149-154.
35. Han, T. S., H. H. Yoon and B. S. Kim, A study on the effect of dye properties on
the decolourisation of acid dyes wastewater with coagulants, Journal of Korean
Institute of Chemical Engineers, 1998, 36, p.20-26.
36. Parac-Osterman, D., A. M. Grancaric and A. Sutlovic. Influence of chemical
structure of dyes on decolouration effects. Proc. in AIC 2004 , Color and Paints,
Proceedings of the Interim Meeting of the International Color Association.
2004, Porto Alegre, Brazil p.179-182.
37. Schäfer, A. I., A. G. Fane and T. D. Waite, Nanofiltration: principles and
applications, 2005, Elsevier Advanced Technology, ISBN 9781856174053.
38. Navarro, A. and F. Sanz, Dye aggregation in solution: study of C.I. Direct Red I,
Dyes and Pigments, 1999, 40 (2–3), p.131-139.

Performance of Filter Media
278
39. Inglesby, M. K., S. H. Zeronian and T. J. Elder, Aggregation of direct dyes
investigated by molecular modelling, Textile Research Journal, 2002, 72 (3),
p.231-239.
40. Bračko, S. and J. Špan, Osmotic coefficients of C.I. Acid Orange 7 in aqueous
solution and in the presence of simple electrolyte, Dyes and Pigments, 1997, 35
(2), p.165-169.
41. Blomberg, E., E. Poptoshev and F. Caruso, Surface interactions during
polyelectrolyte multilayer build-up. 2. The effect of ionic strength on the
structure of preformed multilayers, Langmuir, 2006, 22 (9), p.4153-4157.
42. Zhou, Y., Y. Gan, E. J. Wanless, G. J. Jameson and G. V. Franks, Interaction
Forces between Silica Surfaces in Aqueous Solutions of Cationic Polymeric
Flocculants: Effect of Polymer Charge, Langmuir, 2008, 24 (19), p.10920-
10928.
43. Koyuncu, I., D. Topacik and M. R. Wiesner, Factors influencing flux decline
during nanofiltration of solutions containing dyes and salts, Water Research,
2004, 38 (2), p.432-440.
44. Badani, Z., C. Cabassud and H. Ait-Amar, Membrane separation process for the
treatment and reuse of bath dye effluents, Desalination and Water Treatment,
2009, 9 (1-3), p.105-111.
45. Van der Bruggen, B., I. de Vreese and C. Vandecasteele, Water reclamation in
the textile industry: Nanofiltration of dye baths for wool dyeing, Industrial and
Engineering Chemistry Research, 2001, 40 (18), p.3973-3978.
46. Tan, B. H., T. T. Teng and A. K. M. Omar, Removal of dyes and industrial dye
wastes by magnesium chloride, Water Research, 2000, 34 (2), p.597-601.
47. Gao, B.-Y., Q.-Y. Yue, Y. Wang and W.-Z. Zhou, Color removal from dye-
containing wastewater by magnesium chloride, Journal of Environmental
Management, 2007, 82 (2), p.167-172.
48. Abdessemed, D. and G. Nezzal, Tertiary treatment of a secondary effluent by
the coupling of coagulation-adsorption-ultrafiltration for reuse, Desalination,
2005, 175 (1), p.135-141.
49. Zouboulis, A. I., K. A. Matis and G. A. Stalidis, Innovations in Flotation
Technology, P. Mavros and K. A. Matis, Editors, 1992, Dordrecht, Kluwer.
50. Gregory, J. and S. Barany, Adsorption and flocculation by polymers and
polymer mixtures, Advances in Colloid and Interface Science, 2011, 169 (1),
p.1-12.
51. Hilal, N., M. Al-Abri, A. Moran and H. Al-Hinai, Effects of heavy metals and
polyelectrolytes in humic substance coagulation under saline conditions,
Desalination, 2008, 220 (1–3), p.85-95.

Performance of Filter Media
279
52. Higgins, M. J., L. A. Tom and D. C. Sobeck, Case study I: Application of the
divalent cation bridging theory to improve biofloc properties and industrial
activated sludge system performance - Direct addition of divalent cations, Water
Environment Research, 2004, 76 (4), p.344-352.
53. Petzold, G., M. Mende, K. Lunkwitz, S. Schwarz and H. M. Buchhammer,
Higher efficiency in the flocculation of clay suspensions by using combinations
of oppositely charged polyelectrolytes, Colloids and Surfaces A:
Physicochemical and Engineering Aspects, 2003, 218 (1–3), p.47-57.
54. Petzold, G., H. M. Buchhammer and K. Lunkwitz, The use of oppositely
charged polyelectrolytes as flocculants and retention aids, Colloids and
Surfaces A: Physicochemical and Engineering Aspects, 1996, 119 (1), p.87-92.
55. Petzold, G. and S. Schwarz, Dye removal from solutions and sludges by using
polyelectrolytes and polyelectrolyte–surfactant complexes, Separation and
Purification Technology, 2006, 51 (3), p.318-324.
56. Yu, X. and P. Somasundaran, Role of polymer conformation in interparticle-
bridging dominated flocculation, Journal of Colloid and Interface Science, 1996,
177 (2), p.283-287.
57. Chang, M.-C., H.-L. Lin, C.-L. Huang, Y.-Y. Wang and C.-C. Wan,
Conditioning characteristics of kaolin sludge with different cationic
polyelectrolytes, Colloids and Surfaces A: Physicochemical and Engineering
Aspects, 1998, 139 (1), p.75-80.
58. Bolto, B. A., Soluble polymers in water purification, Progress in Polymer
Science, 1995, 20 (6), p.987-1041.
59. Zemaitaitiene, R. J., E. Zliobaite, R. Klimaviciute and A. Zemaitaitis, The role
of anionic substances in removal of textile dyes from solutions using cationic
flocculant, Colloids and Surfaces A: Physicochemical and Engineering Aspects,
2003, 214 (1–3), p.37-47.
60. Dahlgren, M. A. G., Effect of counterion valency and ionic strength on
polyelectrolyte adsorption, Langmuir, 1994, 10 (5), p.1580-1583.
61. Hoogeveen, N. G., M. A. C. Stuart and G. J. Fleer, Polyelectrolyte Adsorption
on Oxides: I. Kinetics and Adsorbed Amounts, Journal of Colloid and Interface
Science, 1996, 182 (1), p.133-145.
62. Rojas, O. J., P. M. Claesson, D. Muller and R. D. Neuman, The effect of salt
concentration on adsorption of low-charge-density polyelectrolytes and
interactions between polyelectrolyte-coated surfaces, Journal of Colloid and
Interface Science, 1998, 205 (1), p.77-88.
63. Tam, L., T. Tang, W. Leung, G. Chen and K. Sharma, A pilot study on
performance of a membrane bioreactor in treating fresh water sewage and
saline sewage in Hong Kong, Separation Science and Technology, 2006, 41 (7),
p.1253-1264.

Recycling and Reuse of Textile Effluent
280
10. Recycling of Textile Wastewater and Re-use of
Exhausted Dyebaths
10.1 Introduction
Industrial textile wastewater contains dyes and chemicals such as salts, heavy metals,
dispersing agents, surfactants etc. and requires treatment prior to discharge [1]. A
Danish Research group in 1992 in their programme for water reclamation and reuse in
the textile industry strategized on a stepwise procedure for process optimization,
modernization of dyeing equipments, chemical savings or substitutions and water
reclamation and reuse of water and chemicals [2]. Reuse of residual dyebath has been
always considered as an alternative to prevent pollution and to reduce the consumption
of water, energy, chemicals along with the treatment of effluents [3, 4]. The majority of
work undertaken to date has focused on using cotton/Reactive, cotton/Direct, nylon
carpet/Acid, polyester/Disperse, nylon/Disperse, acrylic/Disperse, nylon
microfibre/Metal complex dye and nylon/Acid dye in package and batch dyeing in both
lab or industrial pilot scale studies [5, 6, 7, 8, 9, 10, 11, 12, 13]. The performance of
dyeing with exhausted dyebaths showed limitations compared to the “fresh” bath dyeing
as the dyeing behaviour in residual dyebath could only be applicable if processing
parameters such as pH, temperature remain compatible for subsequent dyeing [14]. The
major challenges are to reuse dyebaths with the least amount of treatments or if
possible, with no treatment at all.
The main aim of this work was to reuse “dyebath wastewater” in a simulated seawater
environment and combine a coagulation/flocculation treatment with microfiltration.
Then after identifying the optimum operating conditions, the filtration could be applied
at different stages of the dyebath sequence.
10.2 Experimental
10.2.1 Materials
For complete description of materials used in these experiments see Section 9.4.1.1.

Recycling and Reuse of Textile Effluent
281
10.2.2 Coagulation/Flocculation and Filtration
From Chapter 9, the optimum concentration ratios of Pluspac 2000 and HPSS were
found to be 15 gL-1
and 10 gL-1
, respectively, at pH 4 for the removal of Lanaset Blue
2R dye from dyebath. The maximum colour removal for Sandolan Red MF-GRLN was
at the ratio of 15 gL-1
Pluspac 2000 to 15 gL-1
HPSS at pH 5. The
coagulation/flocculation process followed by filtration with a filter bomb was carried
out according to Section 9.4.1.3. The 97400C material was used as the preferred filter
media as suggested in Section 9.3.2.
The concentrations of remaining dye in exhausted dyebath were determined by a Perkin
Elmer UV-Vis spectrophotometer at the wavelength of maximum absorption using
Equation 2.1. After the first filtration at any stages in the reuse dyebath, the filter media
were used for corresponding subsequent filtration at every 3rd
/4th
/5th
stages of dyeing.
10.2.3 Acid Dyeing of Wool
15 g wool fabrics were dyed at 3.0% o.m.f. depth by the procedure discussed in Chapter
3. The dyed fabric was then washed in cold water and then washed at 70°C for 10
minutes at room temperature with a 2 gL-1
non-ionic detergent (Eripon R, Ciba
Specialty Chemicals) and cold rinsed for 5 minutes with tap water and finally dried at
ambient temperature.
10.2.4 Dyebath Reuse and Recycling Procedure
The dyebath-reuse and/or dyebath-reuse-recycle-reuse sequence was repeated 11 times
(12 dyeings in total) and the sequence of the acid dyebath recycling and reuse procedure
is shown in Scheme 10.1. The standard procedure involved: 1) Dyeing of wool fabric in
three/four/five consecutive baths; 2) Coagulate/Flocculate the exhausted dyebaths; 3)
Filter the dye solution and reuse again. The optimum filtration sequence was
investigated and related to the dyeing performance. To assess the reuse test after
filtration, a reference dyeing without filtration was carried out to determine the
performance of recycled dyebath. The additional liquor contains 2 gL-1
levelling agent
and 2 gL-1
wetting agents to reconstitute the original dyebath.
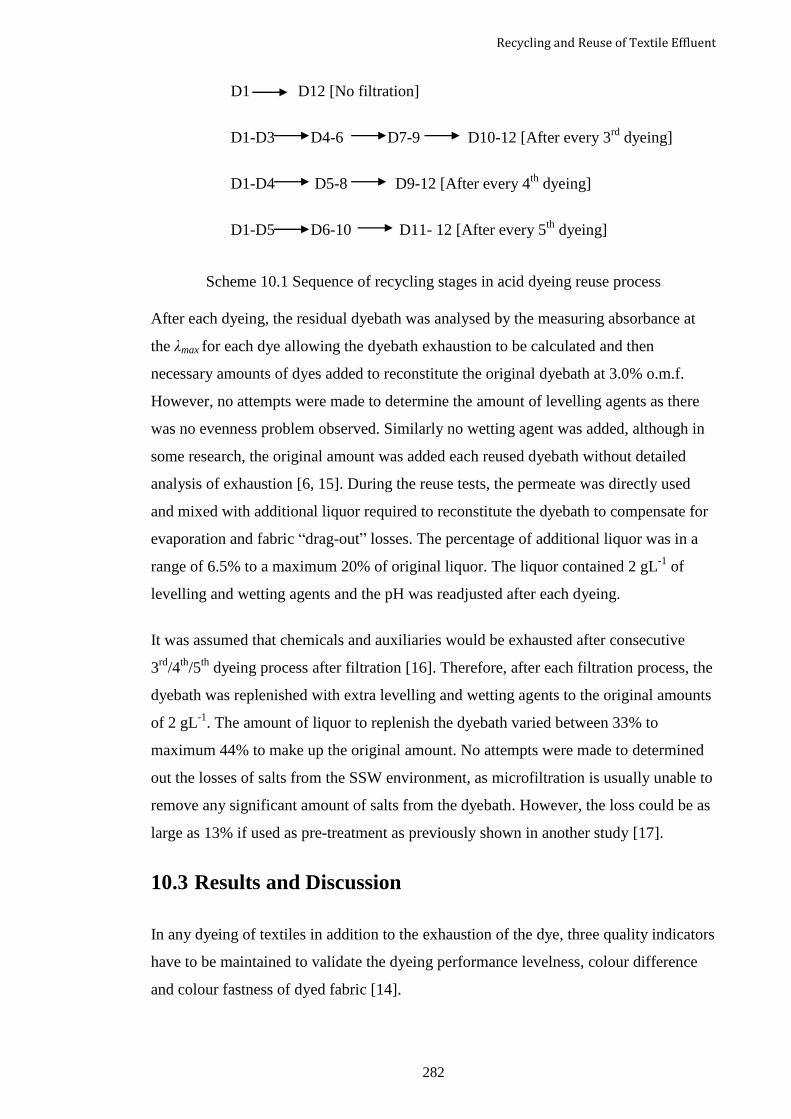
Recycling and Reuse of Textile Effluent
282
Scheme 10.1 Sequence of recycling stages in acid dyeing reuse process
After each dyeing, the residual dyebath was analysed by the measuring absorbance at
the λmax for each dye allowing the dyebath exhaustion to be calculated and then
necessary amounts of dyes added to reconstitute the original dyebath at 3.0% o.m.f.
However, no attempts were made to determine the amount of levelling agents as there
was no evenness problem observed. Similarly no wetting agent was added, although in
some research, the original amount was added each reused dyebath without detailed
analysis of exhaustion [6, 15]. During the reuse tests, the permeate was directly used
and mixed with additional liquor required to reconstitute the dyebath to compensate for
evaporation and fabric “drag-out” losses. The percentage of additional liquor was in a
range of 6.5% to a maximum 20% of original liquor. The liquor contained 2 gL-1
of
levelling and wetting agents and the pH was readjusted after each dyeing.
It was assumed that chemicals and auxiliaries would be exhausted after consecutive
3rd
/4th
/5th
dyeing process after filtration [16]. Therefore, after each filtration process, the
dyebath was replenished with extra levelling and wetting agents to the original amounts
of 2 gL-1
. The amount of liquor to replenish the dyebath varied between 33% to
maximum 44% to make up the original amount. No attempts were made to determined
out the losses of salts from the SSW environment, as microfiltration is usually unable to
remove any significant amount of salts from the dyebath. However, the loss could be as
large as 13% if used as pre-treatment as previously shown in another study [17].
10.3 Results and Discussion
In any dyeing of textiles in addition to the exhaustion of the dye, three quality indicators
have to be maintained to validate the dyeing performance levelness, colour difference
and colour fastness of dyed fabric [14].
D1 D12 [No filtration]
D1-D3 D4-6 D7-9 D10-12 [After every 3rd
dyeing]
D1-D4 D5-8 D9-12 [After every 4th
dyeing]
D1-D5 D6-10 D11- 12 [After every 5th
dyeing]

Recycling and Reuse of Textile Effluent
283
10.3.1 Dyebath Exhaustion
With average exhaustion values of 88% and 78% for Lanaset Blue 2R and Sandolan
Red MF-GRLN dye, respectively, after the first dyeing, the dyeing performance is
comparable to the levels observed in the literature for acid dyes at high depths. Results
showed that despite reusing the same dyebath up to the 12th
time, the exhaustion level of
Lanaset Blue 2R dye has gradually increased, up to 4%, Figure 10.1. This result is
consistent with similar reuse experiments of up to 20 times of Acid Blue Marine Irgasol
dye [14], which concluded that dyeing from residual dyebaths has no negative effect on
the exhaustion of dyes. It was also reported that the presence of sodium chloride did not
cause any adverse effects on dye exhaustion of polyester/disperse dye [13]. In contrast
the exhaustion of the Sandolan Red MF-GRLN dye is interesting in that the exhaustion
level increased to around 90% in SSW, Figure 10.2, a 20% increase.
Figure 10.1 Exhaustion, %E, of Lanaset Blue 2R dye at different stage of dyeing, λmax at
588nm, in SSW: - no filtration; - filtration after every 3rd
dyeing; - filtration after
every 4th
dyeing; and - filtration after every 5th
dyeing.
50%
55%
60%
65%
70%
75%
80%
85%
90%
95%
100%
1st 2nd 3rd 4th 5th 6th 7th 8th 9th 10th 11th
%E
Reused dyebath

Recycling and Reuse of Textile Effluent
284
Figure 10.2 Exhaustion, %E, of Sandolan Red MF-GRLN dye at different stage of
dyeing, λmax at 494nm, in SSW: - no filtration; - filtration after every 3rd
dyeing; -
filtration after every 4th
dyeing; and - filtration after every 5th
dyeing.
This level of increase of exhaustion is somewhat counterbalanced whenever
coagulation/flocculation and filtration of other exhausted dyebaths was performed and
the exhaustion decreased to as low as 53% and 57% for Lanaset Blue and Sandolan Red
dyes, respectively, and gradually increased in subsequent dyeing in the reused dyebaths.
It usually took three dyeings in the residual dyebath to reach the exhaustion values of
original dyeing before any further filtration takes place.
The overall filtration time for the exhausted dyebaths was up to 12 hours to filter 150
mLs of exhausted dyebath, but this would be improved with commercial filtration
systems.
10.3.2 Colour Characteristics
Table 10.1 shows the colour strength, K/Sλmax, of dyed fabric with and without filtration
and it was evident that the K/Sλmax value remained similar in the reused dyebaths when no
filtration took place. In addition, after every filtration step, the K/Sλmax values initially
decreased, which then increased to the original values after successive dyeing. A
possible explanation could be that the unused coagulant/flocculant, limits the dye
molecules penetration into the fibre. The trend remained the same even when another
filtration was performed in the same dyebath cycle.
50%
55%
60%
65%
70%
75%
80%
85%
90%
95%
1st 2nd 3rd 4th 5th 6th 7th 8th 9th 10th 11th 12th
%E
Reused dyebath

Recycling and Reuse of Textile Effluent
285
Table 10.1 Colour strength, K/Sλmax, of Lanaset Blue 2R, λmax at 610nm, and Sandolan
Red MF-GRLN, λmax at 510nm, dyed wool fabric. Dyeing performed in reused dyebath
with and without filtration.
Reuse
Dyebath
K/Sλmax of Dyed Wool Fabrics
Lanaset Blue 2R
λmax, 630 nm
Sandolan Red MF-GRLN,
λmax, 510 nm
No
filtration
Filtration after every No
filtration
Filtration after every
3rd 4th 5th 3rd 4th
5th
1st 25.5 24.4 23.2 25.4 24.1 25.0 24.4 25.0
2nd 22.4 22.7 22.8 22.9 23.1 23.7 23.9 23.3
3rd 22.7 22.7 23.0 22.8 23.4 24.0 25.1 24.7
4th 22.7 17.7 23.1 23.1 25.5 20.1 25.1 25.0
5th 22.9 22.8 17.2 22.2 25.2 21.4 21.9 24.3
6th 22.4 22.3 19.2 18.1 25.4 24.1 23.1 21.5
7th 22.5 16.3 19.4 21.8 27.0 21.7 23.8 23.8
8th 23.2 22.2 21.9 23.1 26.7 22.2 24.8 22.5
9th 24.0
25.3 23.3 21.1 24.5
10th 22.6
26.0 21.3 23.1 23.4
11th 22.3
26.7 22.4 22.9 20.6
12th 23.2
24.0 22.2 23.9 21.2
The distribution of dyed samples inside the acceptance ellipsoids CMC(2:1) of standard
colour difference (ΔE=1.0) for both dyes was illustrated in Figure 10.3, and 10.7. In
general, a total colour difference, ΔE CMC (2:1) value of less than 1.0 is considered
acceptable in the textile industry [13]. Figure 10.3 indicated that the ΔE CMC (2:1) values
for fabrics dyed from the reused dyebaths stayed outside the acceptable ellipse for
Lanaset Blue 2R but the values were in predictable close cluster and could allow colour
compensation and prediction.
In contrast, the Sandolan Red MF-GRLN dyed fabrics showed a close cluster near the
value of the fabric from the original dyebath, Figure 10.7, with a ΔE CMC (2:1) range of
0.33 to 0.72 units, which means no large colour difference between the 1st baths to 12
th
bath, which is acceptable in textile industry. This result was interesting in the sense that
with a remarkable increase of over 11% exhaustion, the colour difference between 1st
and 12th
bath was quite low, although a visual assessment showed a significantly deeper
colour in fabric dyed in 12th
reused bath.

Recycling and Reuse of Textile Effluent
286
Figure 10.3 ∆ECMC (2:1) plots for fabrics dyed with Lanaset Blue 2R dye with no
filtration of the dyebath
Figure 10.4 ∆ECMC(2:1) plots for fabrics dyed with Lanaset Blue 2R dye with filtration
after the 3rd
reused dyebath
Dyebath 7
Dyebath 4
Dyebath 8
Standard
Standard

Recycling and Reuse of Textile Effluent
287
Figure 10.5 ∆ECMC (2:1) plots for fabrics dyed with Lanaset Blue 2R dye with filtration
after 4th
reused dyebath
Figure 10.6 ∆ECMC(2:1) plots for fabrics dyed with Lanaset Blue 2R dye with filtration
after the 5th
reused dyebath
Dyebath 6
Dyebath 7
Dyebath 5
Dyebath 7, 8
Dyebath 6
Standard
Standard

Recycling and Reuse of Textile Effluent
288
Figure 10.7 ∆ECMC (2:1) plots for fabrics dyed with Sandolan Red MF-GRLN dye with
no filtration
Figure 10.8 ∆ECMC (2:1) plots for fabrics dyed with Sandolan Red MF-GRLN after
filtration of the 3rd
, 6th
, and 9th
reused dyebath
Dyebath 4 Dyebath 7
Dyebath 10
Standard
Standard

Recycling and Reuse of Textile Effluent
289
Figure 10.9 ∆ECMC (2:1) plots for fabrics dyed with Sandolan Red MF-GRLN after
filtration of the 4th
, and 8th
reused dyebath
Figure 10.10 ∆ECMC(2:1) plots for fabrics dyed with Sandolan Red MF-GRLN after
filtration of the 5th
and 10th
reused dyebath
Dyebath 5
Dyebath 12
Dyebath 9
Dyebath 6
Dyebath 12
Dyebath 8
Dyebath 11
Standard
Standard

Recycling and Reuse of Textile Effluent
290
Filtration of any the reused dyebaths increased the ∆ECMC (2:1) between the first dyebath
for both dyes, Figure 10.4, 10.5, 10.6, 10.8, 10.9, and 10.10, which subsequently
decreased as the reuse experiment continued without filtration. The dyed fabric after
filtration typically looked visually lighter and brighter. Thus, reuse of the residual
dyebath without filtration was sufficient to perform subsequent dyeing as it was obvious
that the filtrate has a limited influence on colour. Similar results were also found in
other studies using 4 to 20 reused dyebaths based on freshwater [2, 9, 14, 18]. This
proved the possibility of continuous use of residual dyebath over 12 cycles even in the
seawater environment without sacrificing colour conformity of the dyed sample. The
main difference in our study was gradual increment of exhaustion as the reuse of
dyebath continued.
The levelness of the dyeing is another factor that has been considered for successful
dyeing in reused dyebaths. The colour was measured at four different locations on the
surface of the fabric, and the DE values calculated between these locations. On average,
the difference between these positions remained below 0.20, with standard deviations
between 0.05 to 0.16 units. This indicated that levelness achieved over successive
reuses was excellent, irrespective of the filtration steps at any stages of reuse. It must be
noted that, this good levelness on fabrics dyed from reused dyebath with no filtration
was obtained without any further addition of auxiliaries.
In addition, levelness depends on the initial absorption and subsequent migration of
dyes in any particular dyeing cycles, and therefore, SSW provided similar levelness to
freshwater. De Vreese and Bruggen [18] also concluded that concentrations of iron and
manganese and degree of hardness do not cause any problems for reuse in
disperse/polyester and reactive/cotton systems. A contrasting result has been shown
when ammonium sulphate was used as the pH controlling agent and attributed to the
aggregating effect due to build-up of electrolytes [15].

Recycling and Reuse of Textile Effluent
291
10.3.3 Fastness
The results of fastness to colour change and staining for Lanaset blue 2R and Sandolan
Red MF-GRLN dye is given in Tables 10.2 and 10.3, respectively. The wash fastness
and dry rubbing fastness performance of Lanaset Blue 2R dyed fabric was in the range
4/5 to 5. Similarly for Sandolan Red MF-GRLN dyed fabric the fastness to colour
change and dry rub fastness was 4 to 4/5 in all reused dyebaths when no filtration takes
place. Staining to nylon and wool was quite low, but consistent throughout the reuse
experiments, agreeing with similar reuse experiments [9, 15]. Indeed, colour fastness
characteristics have not changed in residual dyebaths from those of initial dyebaths,
unless a filtration was performed where a decrease in wash fastness by 0.5 to 1.0 grey
scale units was observed. A possible explanation could be presence of
coagulant/flocculant in the filtered dyebath which limited the interactions of dye-fibre
and produced more surface dye on the coloured fibrous materials.
Table 10.2 Fastness properties of Lanaset Blue 2R dyed wool at different stages of
dyeing (Bold indicates dyeing stage after filtration)
Reused
Dyebath
Fastness to colour change Staining to Wool Staining to Nylon
No
filtration
Filtration after
every No
filtration
Filtration after
every No
filtration
Filtration after
every
3rd 4th 5th 3rd 4th 5th 3rd 4th 5th
1st 4/5 4/5 4/5 4/5 4/5 4/5 4/5 4/5 4/5 4/5 4/5 4/5
2nd 4/5 4/5 4/5 4/5 4/5 4/5 4/5 4/5 4/5 4/5 4/5 4/5
3rd 4/5 4/5 4/5 4/5 4/5 4/5 4/5 4/5 4/5 4/5 4/5 4/5
4th 4/5 4/5 4/5 4/5 4/5 4/5 4/5 4/5 4/5 4/5 4/5 4/5
5th 4/5 4/5 4 4/5 4/5 4/5 4/5 4/5 4/5 4/5 4/5 4/5
6th 4/5 4/5 4/5 4/5 4/5 4/5 4/5 4/5 4/5 4/5 4/5 4/5
7th 4/5 4/5 4/5 4/5 4/5 4/5 4/5 4/5 4/5 4/5 4/5 4/5
8th 4/5 4/5 4 4/5 4/5 4/5 4/5 4/5 4/5 4/5 4/5 4/5
9th 4/5
4/5 4/5
4/5
10th 5
4 5
4/5
11th 4/5
4/5
4/5
12th 4 4 4/5

Recycling and Reuse of Textile Effluent
292
Table 10.3 Fastness properties of Sandolan Red MF-GRLN dyed wool at different
stages of dyeing (Bold indicates dyeing stage after filtration)
Reused
Dyebath
Fastness to colour change Staining to Wool Staining to Nylon
No
filtration
Filtration after
every No
filtration
Filtration after
every No
filtration
Filtration after
every
3rd 4th 5th 3rd 4th 5th 3rd 4th 5th
1st 4-5 4-5 4-5 4-5 3-4 3-4 3-4 3-4 2 2 2 2
2nd 4-5 4-5 4-5 4-5 3-4 3-4 3-4 3-4 2 2 2 2
3rd 4-5 4-5 4-5 4-5 3-4 3-4 3-4 4 2 2 2 2
4th 4-5 3-4 4-5 4-5 4 3-4 3-4 3-4 2-3 2-3 2 2
5th 4-5 4 4 4-5 3-4 3-4 3-4 3-4 2 2 2 2
6th 4-5 4 4 3-4 3-4 3-4 3-4 3-4 2 2 2 2
7th 4 3-4 4-5 4 3-4 3-4 3-4 3-4 2 2 2 2
8th 4-5 4 4 4-5 3-4 3-4 3-4 3-4 2 2 2 2
9th 4-5 4 3 4-5 3-4 3-4 4 3-4 2 2 2-3 2
10th 4 3-4 3-4 4 3-4 4 3-4 3-4 2 2 2 2
11th 4 4 4-5 4 3-4 3-4 3-4 3-4 2 2 2 2
12th 4 3-4 4-5 4 3-4 3-4 3-4 3-4 2 2 2-3 2
Turbidity measurements, Figure 10.11, show that except for the 3rd
and 4th
reused bath
for the Sandolan Red MF-GRLN F dyeings, the dyebath turbidity and associated
suspended particulates remained constant throughout the dyeing and reuse. The
turbidity differences between the dyes may be due to the structure of the dye or
associated components in the dyebath formulation.

Recycling and Reuse of Textile Effluent
293
Figure 10.11 Turbidity results of reused dyebath with no filtration. Turbidity of original
dye solution for Lanaset Blue 2R and Sandolan Red MF-GRLN dye is 46.2 and 149
NTU, respectively. ▲- Lanaset Blue 2R; and ■ – Sandolan Red MF-GRLN.
As it can be seen from Table 10.4 that combined coagulation/flocculation and filtration
has a significant effect on turbidity removal for Sandolan Red MF-GRLN dyes. The
turbidity was significantly increased after coagulation/flocculation and but reduced back
to near the value of freshwater after microfiltration.
Table 10.4 Turbidity at different stages of filtration for Sandolan Red MF-GRLN dye,
Tap water 0.59 NTU, DSW 0.21 NTU, SSW 1.63 NTU, a value of 1000 NTU was the
upper measurable limit.
Dyebath
Turbidity after Specified Filtration stage
Dyeing cycle, after Dyeing cycle, after Dyeing cycle, after
3rd
dyeing
6th
dyeing
9th
dyeing
4th
dyeing
8th
dyeing
5th
dyeing
10th
dyeing
Exhausted 299 293 303 363 217 178 273
Coagulated/flocculated 970 >1000 >1000 >1000 >1000 >1000 >1000
Filtered 16 5.4 8.58 3.49 2.21 3.77 3.68
0
50
100
150
200
250
300
350
400
1st 2nd 3rd 4th 5th 6th 7th 8th 9th 10th 11th 12th
Tu
rbid
ity, N
TU
Reuse dyebath

Recycling and Reuse of Textile Effluent
294
10.3.4 Abrasion Resistance
The effect of filtration on wool dyed fabric is clear, Table 10.5, and has produced a
twofold improvement over the comparable blank dyed fabric. Overall, the average
resistance improved albeit differently for the dyes tested. The fabric after first dyeing in
Lanaset Blue R and Sandolan Red MF-GRLN dye showed abrasion resistance levels to
10,000 and 19,000 cycles, respectively, which improved after first filtration at any
stages of reuse sequence. When no filtration takes place in reused dyebath the abrasion
resistance remained within the range of 8,000 to 13,000 cycles for Lanaset Blue R dyed
fabric. The abrasion resistance were much varied for Sandolan Red MF-GRLN dye in a
range of 9,000 to 19,000 cycles without any filtration. The latter dye produced an
abrasion resistance as high as 26,000 cycles after filtration at 5th
reused dyebath
sequence. Although no definite trend of abrasion resistance was found as a function of
the number of reused dyebath in SSW, however, it can be concluded that abrasion
resistance was at least similar if not better than the blank dyed fabric. It has been shown
in Section 4.3.6, that reactive dye induced inter and intra cross-linking with reactive
groups which improved wet burst strength and reduced loss of protein [19, 20, 21].
Table 10.5 Average abrasion resistance of wool dyed fabric in reused dyebath (Blank
dyed fabric has an abrasion level of 7500 cycles to two yarns broken)
Reused
Dyebath
Lanaset Blue 2R Sandolan Red MF-GRLN
No
filtration
Filtration after every No
filtration
Filtration after every
3rd 4th 5th 3rd 4th 5th
1st 10,000 - - - 19,000 - - -
2nd 13,000 - - - 21,000 - - -
3rd - - - - 17,000 - - -
4th - 13,000 - - 9,000 24,000 - -
5th 8,000 - 19,000 - 13,000 - 23,000 -
6th - - - 14,000 10,000 - - 26,000
7th - 19,000 - - 15,000 21,000 - -
8th 12,000 - - - 12,000 - - -
9th - - - - 11,000 - 19,000 -
10th 10,000 17,000 - - 9,500 22,000 - -
11th - - - - 19,000 - - 22,000
12th 8,000 - - - 11,000 - - -

Recycling and Reuse of Textile Effluent
295
10.3.5 Tensile Strength
Tensile strength of the wool dyed fabric in weft direction is shown in Figure 10.12.
Volooj [16] showed that bleaching of wool and cashmere fibre in recycled, and filtered
bath improved the tensile strength and attributed to the protective nature of protein
materials. However, in this study, dyeing in recycled dyebath did not produce any
significant changes. This study also found that strength remained consistent throughout
the reused dyebath and the variation lies within the standard deviation of the fabric.
Figure 10.12 Tensile strength of weft of wool dyed fabric in SSW at 3.0% (o.m.f.) depth
compared to blank dyed fabric: - Lanaset Blue 2R; - Sandolan Red MF-
GRLN; and ____
blank dyed fabric
10.4 Conclusions
The combined physico-chemical and microfiltration treatment applied to textile
wastewater achieved contrasting results on the colour removal efficiency. For the
Lanaset Blue 2R dye over 89% was removed while for Sandolan Red MF-GRLN only
approximately 61% was removed indicating the dye structure is a key factor. While the
optimum pH and concentration is important, in the SSW environment these factors are
not as critical as in fresh water, due to the presence of salt ions and their interaction with
the dual cationic/anionic coagulation/flocculation systems.
0.00
1.00
2.00
3.00
4.00
5.00
6.00
7.00
8.00
9.00
1st 2nd 3rd 4th 5th 6th 7th 8th 9th 10th 11th 12th
Ten
sile
str
ength
, K
Nm
-1
Reuse Dyebath

Recycling and Reuse of Textile Effluent
296
Reuse of the dyebath with filtration was demonstrated to be feasible through
coagulation/flocculation followed by microfiltration with Azurtex media. The colour
profile of Lanaset Blue 2R and Sandolan Red MF-GRLN dyed fabrics up to 12th dyeing,
with dyebath filtration undertaken after the 3rd/4th/5th reuse of the dyebath, remained
comparable to dyeing in fresh SSW baths. The colour strength, K/Sλmax, decreased after
every filtration in any reused sequence and the colour differences, ∆ECMC (2:1) increased,
but reversed in subsequent dyeing in reused dyebath. The wash and dry rub fastness of
the dyed fabrics was in the commercially acceptable range of over4 and remained
comparable after each filtration steps. Significant improvements in the abrasion
resistance were observed for Sandolan Red MF-GRLN after each filtration cycle.
This study also demonstrated that the reuse of dyebaths with no filtration for acid
dyeing of wool fabric in SSW was a feasible route for reducing water and chemicals
consumption in SSW along with freshwater. The dye exhaustion values gradually
increased as the dyebath reuse progresses, albeit differently for two dyes. An increase of
around 4% and over 12% was observed for Lanaset Blue 2R and Sandolan Red MF-
GRLN dyes, respectively over the 12 reuse sequence. The colour characteristics of dyed
fabric remained excellent throughout the dyebath reuse up to 12th
cycle. The colour
difference, ∆ECMC (2:1) was low (below 1.0) for the fabric produced in the Sandolan Red
MF-GRLN dyebath compared to the first dyebath. Even though the ∆ECMC (2:1)
difference was relatively high for the comparable Lanaset Blue 2R dyeings, the dyebath
reuse results remained in a close cluster and may allow predictive corrections to be
applied. The colour of fabrics produced from the reused dyebaths was uniform even
without replenishing the initial levelling agents and wetting agents, but it is anticipated
these additions would be beneficial for industrial scale processing.
In conclusion the degree of hardness and presence of salts did not adversely affect the
colour performances of the dyed fabric and thus the reuse of residual SSW dyebaths
offers two-fold solutions to the scarcity of freshwater.

Recycling and Reuse of Textile Effluent
297
10.5 References
1. Anjaneyulu, Y., N. S. Chary and D. S. S. Raj, Decolourization of industrial
effluents - available methods and emerging technologies - A Review, Reviews in
Environmental Science and Biotechnology, 2005, 4 (4), p.245-273.
2. Wenzel, H., H. H. Knudsen, G. H. Kristensen and J. Hansen, Reclamation and
reuse of process water from reactive dyeing of cotton, Desalination, 1996, 106
(1–3), p.195-203.
3. Park, J. and J. Shore, Water for the dyehouse: Supply, consumption, recovery
and disposal, Journal of the Society of Dyers and Colourists, 1984, 100 (12),
p.383-399.
4. Volooj, S., Investigation into the wet processing of Keratin fibres and filter
media, in Department of Textiles, 2003, The University of Manchester Institute
of Science and Technology, PhD Thesis, Manchester.
5. Smith, B., Pollutant source reduction: Part IV- Audit procedures American
Dyestuff Reporter, 1989, 79 (6), p.31.
6. Carr, W. W. and F. L. Cook, Savings in dyebath reuse depend on variations in
impurity concentrations, Textile Chemist and Colorist, 1980, 12 (5), p.106-110.
7. Tincher, W. C., Energy conservation in carpet dyeing by dyebath recycling,
American Dyestuff Reporter, 1977, 55 (5), p.36-72.
8. Cook, F. L. and W. C. Tincher, Dye bath reuse in batch dyeing, Textile Chemist
and Colourist, 1978, 10 (1), p.21-25.
9. Koh, J., Y. Kim and J. Kim, Dyebath reuse in dyeing of nylon microfiber non-
woven fabric with 1:2 metal complex dyes, Fibers and Polymers, 2001, 2 (1),
p.35-40.
10. Agudelo, C., M. Lis, J. Valldeperas and T. Sato, Fabric color changes in
polyester micro-fibers caused by the multiple reuse of dispersed-dyes dye baths:
Part 1, Textile Research Journal, 2008, 78 (12), p.1041-1047.
11. Shams-Nateri, A., Reusing wastewater of madder natural dye for wool dyeing,
Journal of Cleaner Production, 2011, 19 (6–7), p.775-781.
12. Sundrarajan, M., G. Vishnu and K. Joseph, Ozonation of light-shaded exhausted
reactive dye bath for reuse, Dyes and Pigments, 2007, 75 (2), p.273-278.
13. Hassan, M. M. and C. J. Hawkyard, Reuse of spent dyebath following
decolorisation with ozone, Coloration Technology, 2002, 118 (3), p.104-111.
14. Moussa, A., A. El Ghali, S. Ellouzi and F. Sakli, Color and fastness study of
wool dyeing in multiple reuse dye baths using acid and reactive dyestuffs in
laboratory scale, Journal of the Textile Institute, 2013, 104 (3), p.260-269.
Recycling and Reuse of Textile Effluent
298
15. Koh, J., S. Park, G. Shim, D. Cho and J. Kim, pH control for dyebath reuse in
dyeing of polyamide with binary mixtures of acid dyes, Fibers and Polymers,
2004, 5 (2), p.110-116.
16. Volooj, S., Investigation into the wet processing of keratin fibre and filter
media, in Department of Textiles, 2003, University of Manchester Institute of
Science and Technology, PhD Thesis, Manchester.
17. Tahri, N., G. Masmoudi, E. Ellouze, A. Jrad, P. Drogui and R. Ben Amar,
Coupling microfiltration and nanofiltration processes for the treatment at
source of dyeing-containing effluent, Journal of Cleaner Production, 2012, 33
(0), p.226-235.
18. De Vreese, I. and B. Van der Bruggen, Cotton and polyester dyeing using
nanofiltered wastewater, Dyes and Pigments, 2007, 74 (2), p.313-319.
19. Holmes-Brown, R. L., E. J. Wood and G. A. Carnaby, Damage to wool during
stock-dyeing, Journal of the Society of Dyers and Colourists, 1982, 98 (7-8),
p.243-247.
20. Kilpatrick, D. J. and I. D. Rattee. The low temperature dyeing of wool. Proc. in
5th International Wool Textile Conference. 1975, Aachen, II, p.189-193.
21. Zollinger, H. Wool dyes and wool dyeing. Proc. in 5th International Wool
Textile Conference. 1975, Aachen, I, p.167-169.

Conclusions and Future work
299
11. Conclusions and Future Work
11.1 Overall conclusions
11.1.1 Simulated Seawater Dyeing
Simulated seawater dyeing of wool, polyester, nylon, acrylic fibres with acid, reactive,
disperse, cationic dyes indicated that the commercially established dyeing process is
robust and can be practically transferable with the seawater as dyeing medium. The dye
exhaustions and build-up was satisfactory within the dye ranges studied, which covers
red, yellow and blue at light, medium and deep shades.
The absorbance/concentration curve at λmax was linear and comparable for all dyes used
in this study in SSW, in most cases there were no differences with the linearity of
comparable DSW dye solutions. No salt crystals were found after dyeing in SSW and a
wash-off at 70°C with 1 gL-1
non-ionic detergent was found to be sufficient to remove
any surface salt crystal that may present SEM analysis showed that no or very little
surface damage occurred on fibre due to dyeing in SSW.
Some acid and metal complex dyes were only partially soluble in SSW at room
temperature but the solubility improved with gentle heating and addition of levelling
agents. The dyes were completely soluble at dyeing temperatures near the boil, with the
exception of Lanasyn Black S dye, which was partially precipitated. Acid dyeing of
wool and nylon fabric showed that there was relatively little difference in the final
colour of the dyed fabric. The uptake of dyes was high and consistent. Although ionic
interactions between acid dye and fibre is the dominant mechanism of fibre-dye bonding
the adsorption of acid dyes in highly saline dyebath most likely depended on the
combined effects of ionic and physical/hydrophobic interaction. At low concentrations
of salt, "screened out" ionic interactions caused low dye sorption but with the increasing
salt concentrations, increased physical interactions resulted in increased dye sorption.
As a result, in some cases, dye exhaustion was higher in SSW, and consequently colour
difference was higher between DSW and SSW dyed fabric. In other cases, where colour
difference was over 1.0 unit, optimising the dyeing conditions could result an
acceptable colour differences. The Lanasyn Black S showed colour patches and unlevel
dyeing due to low solubility at higher temperature, a specific examples of how high salt

Conclusions and Future work
300
solution could influence dye structure and dye aggregation. The Kawabata Evaluation
analysis indicated that the overall fabric handle was comparable to DSW dyed fabric.
The reactive dye in salt water is very sensitive to hardness of water such as Ca2+
and
Mg2+
for cotton dyeing, although NaCl, often in large amounts was added to increase
dye exhaustion. However the three α-bromoacrylamide-based Lanasol reactive dyes
used for dyeing of wool showed that unlike cotton dyeing, reactive dye could be a real
option for wool fibre in SSW particularly for achieving deep colours. Lanasol reactive
dyes were readily soluble at lower concentration at room temperature, however over
3.0% o.m.f. depths, the dye was partially soluble even after full dyeing cycle. However
during dyeing, dye was gradually exhausted into the fabric leaving a soluble lighter
dyebath. The mechanism is similar to the aqueous phase transfer process of disperse
dyeing of hydrophobic fibres.
In addition to provide level dyeing, Albegal B worked like a dispersing agent used in
hydrophobic fibre dyeing. A total fixation of 83 to 98% in SSW was observed compared
to 85 to 96% in DSW. After-treatment with ammonia, used for dye fixation, increased
dye substantivity and colour strength value. A characteristic yellow colour was also
observed which may be due to the formation of lanthionine, a product of hydrolysis of
wool. A lower colour difference after wash-off proved that some dyes were bonded
when dye substantivity was increased after ammonia treatment. The Lanasol reactive
dyes have been known to prevent damage to wool fibres at moderate to heavy depths of
over 3.0% o.m.f. Inter and intra-crosslinking within the chain was responsible for this
added strength and can protect from alkali degradation. Although the Lanasol type
reactive dye is mono-functional dye yet increase of tensile strength and abrasion
resistance was observed for dyed fabric in SSW. It can also be confirmed that the
increase in strength depends on the dye structure, as yellow dyes showed an increase of
5% and 7% for the warp and weft, respectively. For nylon dyeing, the colorimetric data
and fastness of bulk trials conforms the laboratory results.
Analysis of the disperse dyes used for dyeing of polyester in SSW showed that the
Beer-Lambert law of dye absorbance/concentration in dilute solutions was also
applicable for dispersions as the relationship between absorption and scattering of light
with dye concentration was approximately linear in SSW. Some dyes took longer to
disperse in SSW yet no unlevelness was observed. A satisfactory colour difference was

Conclusions and Future work
301
achieved although with a different dye build-up along the depth studied. Each of the
black dyed fabrics showed a close match or higher colour strength in SSW. Following
the alkaline reduction process, typical for disperse dyeing, yellow dyed polyester had
lighter and greener hues. The results indicated that disperse dyeing in SSW is feasible
without any major changes to the processing conditions.
The acrylic dyeing with basic dyes proved that there was a saturation limit exists for
ionic interactions in the system, as up to 1.0% o.m.f. depth the exhaustion value was
over 90% while at 3.0% o.m.f. depth it never reached over 77%. Similar to acid dyeing
of wool and nylon, addition of electrolytes or anions can increase hydrophobic
interactions at 3.0% o.m.f. depth in SSW. Thus the saturation limit of dye adsorption
can slightly overcome in highly saline solution as evident by the colorimetric data and
colour strength profiles. At low concentrations, electrolytes act as levelling agents by
retarding the dyeing process. Similar to disperse dyeing, the build-up can be different
depending on the application level.
Overall the fastness of the SSW dyed fabrics for each dyes used for wool, polyester,
nylon and acrylic was comparable to the DSW dyed fabrics with wash, cross-staining,
rub and light fastness rated commercially acceptable.
11.1.2 Filtration and Reuse of Dyebath
Colour removal by filter media is industrially preferred due to its’ high removal
efficiency, which also allows reuse of water and ingredients in the residual dyebath.
Nevertheless, microfilter media itself is not enough commercially for full removal of
colour. The major problem for all filtration processes is the reduction of permeates flux
due to membrane fouling or media blinding. Introducing surface functional groups such
as fluorine can increase filtration efficiency and improve anti-fouling properties.
Therefore gaseous fluorination, fluorocarbon finish and plasma polymerisation were
performed to introduce hydrophilic and oleophobic properties on the supplied Azurtex
media.
Surface characterisation of Azurtex media was performed with ATR-FTIR, XPS and
SEM. Increased fluorination caused etching and roughening of the media increased and
due to the exothermic nature of the gaseous treatment more fracturing/fusing occurred at
the surface treated with 10% F2. Therefore increased levels of fluorination and

Conclusions and Future work
302
prolonged exposure could lead to the degradation of surface. A physical layer was
formed on top of the PU when fluorinated/non-fluorinated media was treated with
Itoguard, which smoothened the rough surface. In contrast, plasma polymerised treated
wool samples showed cracking and particles in SEM micrographs, but again it
depended on the treatment conditions. The roughness of filter media can improve the
cake discharge performance but over time can wear out, which would reduce the
serviceability of the treated media. The FTIR spectra of the untreated media, PU coated
polypropylene fabric, exhibited the typical bands for the polyurethane coated fabrics.
Typically the C-F stretching vibration was observed in the 1100-1350 cm-1
region and
weakly at 400-800 cm-1
. The XPS study showed that introduction of gaseous fluorine
impart stable hydrophilic properties but progressive fluorination produced -CF2 and -
CF3 groups to impart hydrophobicity. The surface tension decreases in the order of CH2
(36 mN/m) > CH3 (30 mN/m) > CF2 (23 mN/m) > CF3 (15 mN/m) but also depends on
the coverage of surfaces and degree of order in the surface.
The fluorination of Azurtex media increased wettability but that it was not directly
proportional to an increase in the fluorination level and treatment time. The water and
oil repellency of FC and plasma treated filter media were 4 and 3, respectively, offering
a reasonable level of liquid repellency. Pre-fluorination before FC treatment didn’t
change the repellency, which is due to the cross-linking of FC coating with porous
structure which makes the fabric more ‘impenetrable’ to the effect of fluorination. The
contact angle remained in the range of 130 to 145°.
The performance of modified Azurtex filter media was benchmarked against newly
developed materials. It was found that, although fluorination can improve the flux
extended fluorination reduced the flux of the process and destabilised the system.
Fluorinated and FC finished filters offered little benefits in terms of flux, turbidity and
cake removal. In contrast, plasma treatment improved the flow, reduced turbidity and
provided an easy cake removal compared to the other modification. Overall, the
supplied 97400C filter performed better than any of the modified filters with reference
to lowering filtrate turbidity and ease of cake removal.
The selection of coagulation/flocculation process parameter such as pH and dosage of
coagulants/flocculants was very critical for subsequent filtration for overall colour
removal. The trial with a dual component system, a cationic hybrid Pluspac2000 and a

Conclusions and Future work
303
polyanionic Hydrosolanum protein derivative (HPSS) with model dye solution showed
that the system worked in the saline environment but was highly dependent on the class
of dyes, their structure, molecular size, concentration and structural linearity. Each dye
has a distinctive relationship with pH and concentration ratios in the formation of
molecular aggregates and a relatively high concentration ratio of coagulant/flocculants
may require in saline water. Maximum colour removal was achieved for Lanaset Blue
2R and Sandolan Red MF-GRLN dye and was 89% and 61%, respectively, based on a
ratio of 15:10 and 15:15 for PP2000: HPSS at pH 4.0 and 5.0, respectively.
A compact gel layer was produced at pH 3 and 4 for Sandolan Red MF-GRLN dye, due
to the formation of dye aggregates or the presence of di-cations like Ca2+
and Mg2+
which compressed the adsorbed double layer. The mechanism of flocculation with
polycation could be through “patchwise” adsorption, bridging or complexation due to
the presence of salt, the hybrid coagulant and anions. The molar ratio of cationic
charges to anionic charges, n-/n
+ was crucial to determine which mechanism would
dominate. The model dye effluent showed no visible turbidity but after
coagulation/flocculation but a decline of flux was observed due to the higher organic
load. It was also observed that monovalent salts such as NaCl deteriorated the floc
properties, but divalent salts improved them.
A combined physico-chemical and micro-filtration treatment was applied to textile
wastewater for the purpose of reusing the liquor into subsequent dyeing processes.
Reuse of the dyebath with the combined treatment was demonstrated to be feasible. The
dyeing behaviour remained the same for Lanaset Blue 2R and Sandolan Red MF-GRLN
dyes up to 12th
dyeing after the filtration that was undertaken after the 3rd
/4th
/5th
reuse of
the dyebath. When filtration took place, initially, in every case, the colour strength,
K/Sλmax, of the fabric decreased and the colour differences, ∆ECMC (2:1) increased.
Subsequent dyeing in reused dyebath showed an increased K/Sλmax values and decreased
∆ECMC (2:1) decreased until another filtration stage was introduced. The wash and dry rub
fastness of the series of dyed fabrics in the reused/filtered process were not affected and
were overall comparable and very good. Significant improvements in the abrasion
resistance were observed and were sometimes tripled in the number of cycles to failure.
In contrast, media blinding increased such an extent that sometimes filtration of 150mL
exhausted dyebath sometimes required up to 15 hours. However it must be noted that

Conclusions and Future work
304
the pressure used in this study was relatively low compared to other standard filtration
processes and is probably not a commercial problem.
The reuse of consecutive dyebaths without filtration could be a feasible route for acid
dyeing of wool fabric, which would eventually reduce water and chemicals
consumption. The dye uptake gradually increased with each reuse sequence for both
dyes in different rate. An overall increase of around 4% and over 12% after 12th
dyeing
was found for Lanaset Blue 2R and Sandolan Red MF-GRLN dyes, respectively. The
colour strength and levelness of dyed fabric remained excellent throughout the reuse
cycle. Dyed fabric with Sandolan Red MF-GRLN showed a commercially acceptable
colour difference (∆ECMC (2:1) =1.0) in comparison to the initial dyebath. In contrast,
Lanaset Blue 2R dyeings showed a higher ∆ECMC (2:1) compared to the first bath in the
reuse sequence yet the colour difference remained in a close cluster and may allow
predictive corrections to be applied. The degree of hardness and presence of other salts
didn’t hinder the colour performances and thus the reuse of residual SSW dyebaths
could offer two-fold solutions to the scarcity of freshwater.
11.2 Further Research
In assessing the results obtained in this study the following further work can be
proposed:
Investigate the dyeing of cotton fibre with reactive and direct dye in SSW
dyebath. Cotton is the most used natural fibre and the performance of cotton reactive
dye is known to be the lowered in the presence of increased water hardness;
Assess the behaviour of binary and trichromatic dye mixtures of wastewater
recycle and the effect of dyeing with binary/trichromatic recipes in SSW and recycled
baths;
Evaluation of other classes of acid dyestuffs as well as other class of dyes and
textile substrates used in commercial dyeing due to the potential increase bath
particulates which may adversely affect the colour reproducibility;
Investigate the relationship of dye structure and levelling agent to cover barré
effect of nylon fibre needs as Lyogen P could cover some dyes while failed to perform
adequately with Lanasan Blue and Acidol Blue dyes;
Identify suitable reduction processes for each disperse dyes for polyester dyeing;

Conclusions and Future work
305
Investigate the effect of chemical finishing on dyed polyester for thermal
migration of dyes;
Extend the use of SSW in textile pre-treatments (e.g. desizing, bleaching,
mercerising etc.) and chemical finishing of textiles;
Undertake pilot scale trials with pre-filtered seawater for use in the dyeing
machine and evaluate the effect of corrosion of dyeing equipment with saline solutions;
Determine the number of dyebath reuse cycles and the quality of dyebath filtrate
that is suitable for reuse for the each class of dye/fibre system;
Undertake pilot and industrial scale trials in order to validate the laboratory
work;
Evaluate the effect of Pluspac1000 as a coagulant as it carries a higher charge
density that Pluspac 2000 in SSW;
Investigate the effect of molecular weight of cationic and anionic flocculants on
the colour removal efficiency in the seawater environment;
Evaluate the performance of modified Azurtex filter media with exhausted
dyebath, both conventional and cross-sectional filtration. A suitable cartridge for cross-
sectional filtration also needs to be determined for the optimum performance of Azurtex
media.