Belden Brick ISO 14000 Series Brick - The Belden Brick Company

INVESTIGATION OF ABUNDANT THREATED SEA SAND IN
CEMENT BRICK WITH THE RATIO OF 1:6 WITH
DIFFERENT PERCENTAGES
KHAIRUL DANIAL BIN ABD. LATIF
A report submitted in partial fulfillment of the
requirements for the award of degree of
Bachelor of Civil Engineering.
Faculty of Civil Engineering & Environmental
Universiti Malaysia Pahang
11
December 2010 2010

ABSTRACT
Nowadays the high demand of river sand is an indication of development
especially for the construction industry. Therefore, it is needed an alternative way in
fulfill this condition. However, from the study, it stated that the quantity of the river
sand became slowly decrease. Thus, the alternative that is viable to replace the river
sand is by using the sea sand. In applying this alternative, the chloride content and the
sea sand shape particles are the major problems that should be taken note. High level of
chloride content is possibility affecting the strength of the construction structure.
Therefore the sea sand that will used should be washed first to reduce the chloride
content for a particular period of time. In the basic structure material, they are already
having their own limitation of chloride level. This is to ensure that the construction
structure such as reinforcement bars would not corrode in the concrete. In the cement
brick manufacture, the high rate of chloride content will affected the strength of the
brick because the Portland cement also have its own chloride content. Brick is one of the
basic normal structures in the building. In this study, there are several experiments need
to be performed to determine the chloride content and the grading size of the abundant
treated sea sand ( ATSS ).The compressive strength and the water absorption testing
also need to be performed in order to study the comparison strength by using river sand
and the sea sand. The ratio cement to sea in this study is 1:6. The brick size that been
used was 2 15mm x 102.5mm x 65mm which is work size stated in British Standard
(BS). The result showed that the properties and strength of the sea sand brick samples
have exceeded the minimum strength required.
VII

ABSTRAK
Pada masa kini , permintaan yang tinggi terhadap pasir suangai merupakan satu
petunjuk pembangun terutamanya daim industry pembangunan.Oleh yang demikian, ia
adalah perlu untuk memnuhi keperluan semasa mi. Walau bagaimanapun, mengikut
kepada kajian semasa, peratusan kandungan pasir pantai semakin menurun. Oleh itu,
alternatif lain yang boleh ditekankan untuk menggantikan pasir sungai ialah dengan
menggunakan pasir pantai. Dalam mengapalikasikan alternatif mi, kandungan klorida
dan juga pengkelasan saiz pasir laut merupakan masalah utama. Kandungan kiorida
yang banyak juga akan melemahkan sesuatu struktur binaan. Pasir pantai yang akan
digunakan terlebih dahulu akan dibasuh dan dibilas untuk satu jangka masa bagi
mengurangkan kandungan klorida Di dalam sesuatu asas struetur bahan, kadar
kandungan kiorida yang dibenarkan sudah ditetapkan. mi adalah untuk memastikan
struktur binaan seperti besi tetulang tidak terkakis di dalam konkrit. Di dalam
pembuatan bata simen, kadar kandungan kloride yang tinggi juga akan mengurangkan
kekuatan bata itu kerana simen Portland juga mengandungi kandungan kiorida. Bata
merupakan satu asas normal yang ada dalam sesuatu bangunan. Dalam kajian mi,
beberapa ujikaji perlu dijalankan untuk menentukan kadar kangunan kiorida dan juga
pengkelasan saiz pasir pantai. Ujian mampatan dan penyerapan air juga dijalankan
untuk membandingkan kekuatan antara pasir sungai dengan pasir laut bagi tujuan
pen ilaian. Nisbah simen kepasa pasir dalam kajian mi adalm 1:6. Saiz bata yang
digunakan ialah 215nm x 102.5mm x 65mm iaitu saiz kerja merujuk kepada Standard
British. Keputusan menunjukkan bahawa ciri-ciri kekuatan sample pasir pantai telah
melebihi minumum piawaian yang telah ditetapkan.
viii

ix
TABLES OF CONTENT
CHAPTER
TITLE PAGE
TITLE PAGE
DECLARATION DEDICATION iv
ACKNOWLEDGEMENT vi ABSTRACT vii
ABSTRAK viii
TABLE OF CONTENTS ix
LIST OF TABLES xii
LIST OF FIGURES xiii
LIST OF SYMBOL xiv
1 INTRODUCTION 1
1.1 Background of Study 1
1.2 Problem Statements 2
1.3 Objectives of Study 3
1.4 Scope area of Study 4
1.5 Significant of Study 6
2 LITERATURE RWIEW 8
2.1 Introduction 8
2.2 Sand 9
2.3 Sea Sand 10

2.4 Sieve Analysis Sea Sand 10 2.5 Application of Sea Sand in Construction 12 2.6 Brick 13
2.6.1 Compressive Strength of Brick 13
2.6.2 Water Absorption Characteristic of Brick 15 2.6.3 Cement Brick 15
2.6.4 Cement Brick Standards 17 2.6.5 Dimension of Cement Brick 17
2.7 Permeability, Strength and Efflorescence 17 2.8 Standard for Sea Sand 18 2.9 Particles Shape of Sea Sand 19
2.10 Chloride Content in Sea Sand 19 2.11 Acceptable Chloride Levels 21 2.12 Brick Testing 22
2.12.1 Compressive Strength 23
2.12.2 Water Absorption and Initial Rate of Absorption 24 2.12.3 Water! Cement Ratio 26
3 METHODOLOGY 29
3.1 Introduction 29 3.2 Material Selection 30
3.2.1 Cement 30 3.2.2 Sand 31
3.2.3 Abundant Treated Sea Sand (ATSS) 32 3.2.4 Water 33
3.3 Sieve Analysis 33 3.4 Preparation of Specimens 35
3.5.1 Brick Mix Design 35 3.5.2 Batching, Mixing, Casting 36
3.5 Curing 37
X

3.6 Size of Specimen 38 3.7 Mould 39 3.8 Compressive Strength Test 40 3.9 Water Absorption Test 40
3.10 Chloride Mercuric Thiocyanate method for Chloride 41 3.11 Experimental Program 43
4 RESULT AND DISCUSSION 44
4.1 General 44 4.2 Data Analysis of Chloride Content 45 4.3 Sieve Analysis of Abundant Treated Sea Sand( ATSS) 48 4.4 Compressive Strength of Brick Samples 50
4.4.1 Result on Compressive Strength for Control! Samples 51
4.4.2 Result on Compressive Strength for Different
Percentages 54 4.5 Data Analysis of Water Absorption 60
4.5.1 Controlling Samples for Water Absorption 61 4.5.2 Comparison on Water Absorption of Different
Percentages of Brick Samples 63
5 CONCLUSION AND RECOMMENDATIONS 71
5.1 Introduction 71 5.2 Conclusion 72 5.3 Recommendation 73
REFERENCES 75
APPENDIXES 78
xi

xl'
LIST OF TABLES
TABLE NO. TITLE PAGE
1.1 The Number of Brick Needed for Compressive Testing 5
1.2 Number of Brick Required for Testing 6 2.1 Grading Characteristic of Fine Aggregate 12 2.2 Characteristic compressive strength of brick masonry 14 2.3 Classification of bricks by compressive strength and 15
Water Absorption
2.4 Sizes of Cement Bricks 17 2.5 Ionic Components of Sea Water 20 3.1 The number of brick needed for compressive testing 35
4.1 Chloride dissolve of ATSS 45 4.2 Percentage Chloride Content of ATSS 47 4.3 Sieve Analysis of ATSS 49 4.4 Average compressive strength after 7 days curing for 51
controlling
4,5 Average compressive strength after 28 days curing for 52 controlling
4.6 Average compressive strength after 7 days curing in 54
different percentages.
4.7 Average compressive strength after 28 days curing in 54
different percentages
4.8 Average water absorption after 7 days curing for controlling 61 4.9 Average water absorption after 28 days curing for 62
controlling
4.10 Average water absorption after 7 days curing on different 64
different percentages.
4.11 Average water absorption after 28 days curing on different 64
different percentages

xli'
LIST OF FIGURES
FIGURE NO. TITLE PAGE
1.1 Location the Samples Taken(Anonymous Al) 4 1.2 Location the Samples Taken(Anonymous A2) 4 2.1 Average Granulometric of a Typical Sea Sand Used 11
As Concrete Aggregate
2.2 Characteristic Compressive Strength of Brick Masonry 14 2.3 Compressive Strength Specimens 23 2.4 Typical Value in W/C Ratio of Concrete 27 3.1 Cement 31 3.2 Sand 31 3.3 The Treated Sea Sand Process 32 3.4 The Water Change Process 32 3.5 Mechanical Sieve Shaker. 34 3.6 Automatic Concrete Mixer 37 3.7 Curing Tank 38 3.8 Standard Dimension of Brick Specimens 39 3.9 Brick Mould 39
3.10 Procedure in Finding Chloride Content 42 3.11 Experimental Process Flow 43 4.1 Graph of Chloride Content Dissolved Value 46 4.2 Graph of Sieve Analysis od Sand and ATSS 49 4.3 Compressive Strength Testing 50
4.4 Graph of Compressive Strength for Controlling Sample 53 4.5 Comparison of Compressive Strength on 7 Days in 55
Different Percentages.
4.6 Comparison of Compressive Strength on 28 Days in 56
Different Percentages.

4.7 Comparison of Compressive Strength on 7and 28 Days 57
4.8 Rounded Shape of Sea Sand in the Brick 58
4.9 Efflorescence Occur in the Brick 59
4.10 Average Water Absorption on 7 and 28 Days Curing for 63
Controlling
4.11 Average Water Absorption on 7 Days Curing in 65
Different Percentages
4.12 Average Water Absorption on 28 Days Curing in 66
Different Percentages
4.13 Comparison of Water Absorption on 7 and 28 Days of 67
Curing
4.14 Voids Occur in the Brick Samples 68
xiv

CHAPTER 1
INTRODUCTION
1.1 Background of the study
Nowadays, Malaysia is one of the world developing countries that develop lots
of invention and innovation in the technology. For example, Petronas Twin Tower,
Kuala Lumpur Tower, Kuala Lumpur International Airport (KLIA) and also the Smart
Tunnel are the symbolic of Malaysia for its construction development. In term of
engineering technology, Malaysia also produce lots of engineers, researchers and create
lots of implementations regarding to the technology in construction industry.
In most common structure, brick are really needed to foam the structure of the
building. Therefore, brick is one of the important component or material needed for
building construction especially for building structures. Normally brick can be classified
into two types which are clay brick and sand brick. Until now, there are lots of
researches and further implementations of brick manufacturer found by the researchers.
Brick very unique and it is only man made building materials that testify to their use
1
2
since the early human civilization. It can be attractive appearances and also have
superior properties such as compressive strength and durability.
Sand is a main type of aggregate that used in manufactured of Portland cement
concrete, masonry and also brick in the construction sector. For the sand brick
manufacture, river sand is the raw material for the overall manufacture other than water
and cement. The demanding use of sand in construction industry lead the used of river
sand widely. Now a days, the quantity of river sand become decrease and hard to find
the cleanliness. Furthermore the river sand also hard to get the absence of salinity
Abundant Treated Sea Sand (ATSS) can be use as an alternative way for
replacing the overall used of river sand. It is the reliable replacement for river sand in
terms of cost, impact environmental impact and also its availability of sand properties.
By using ATSS and mixing with different type's ratio and percentage of ATSS, the
comparison of it results and analysis can be made whether it is suitable for construction
material. It is great practical significance to developing new product for civil
engineering works.
1.2 Problem Statement
Sand is one of the principal components of brick. The cost of sand brick is
increasing due to the high demand on the construction industry. Furthermore, if using
the laterite sand as the material in brick, the cost becomes extremely high.

3
This study is conducted and constructed in order to know the effectiveness of the
ATSS as the replacement of the normal sand in brick making with different percentages
of the ATSS. The properties of sea sand and the cement itself are important to make sure
that the combination between sea sand, sand and water are properly combine with each
other.
With the ratio 1:6 of cement-sand and percentage constitutions, the ATSS is been
taken to add and combine with the river sand in brick making. The selection of ratio
must be done properly by considering the result of the quality of brick. The scope of this
study is based on the source of material added and proportion of the material according
to British Standard 3921 1985 (BS3921 1985).
1.3 Objectives
The objectives of this study are:
i. To measure the compressive strength of bricks ratio 1.6 with different
percentage of ATSS replacement.
ii. To determine the water absorption of bricks 1.6 with with different
percentage of ATSS replacement

4
1.4 Scope of Study
The study is basically focused on the east peninsular of Malaysia which is,
Pahang, Terengganu and Kelantan. For the sample, it was taken from the Teluk Lipat
which is located at Dungun, Terengganu. During the sample taking, it only involves the
sea sand that been spread near the road or the sea shore and not involving the sea sand
that close to the water.
L2-J -
Aran nrrcr'-P
1i. J \ .: ?4IDungun t!ii•.
£
Figure 1.1: Location of samples taken
Source: Anonymous 2010a1
K,fl AurM6t,
fAa. N
T -
ILi angç
T.16 Uj5 Wong
-' DnK.mpg . fakSbh 4ir '- -
• •Ta •"-- øecIa
C, v, Traaa -•- -- - Srr ,nPOrI
Figure 1.2: Location of samples taken
Source: Anonymous 2010a2

5
The constitutions of the properties of sea sand might be change because of the
weather changes and also pollution circumstance. The entire sample taken will sieve to
classify into grade of sizes. Test method for compressive strength of brick is based on
BS3921 1985. For the water absorption of brick, the test is based on BS3921 1985.
Abundant sea sand that will use is the treated sea sand where the abundant sea
sand that been taken from the sea shore is treated by using the natural water and classify
as Abundant Treated Sea Sand (ATSS). The percentages that will use are between 0% as
the control percentages until up to 20%. For the ATSS impurities, this experiment only
considered for chloride testing only. Therefore for the chloride testing, HACH programs
DR5000 will be run.
Table. 1.1 below shows the detailing of the number of bricks that needed for the
overall thesis. For every percentages research, it is divides into three different day of
testing which are seven days testing, fourteen days testing and twenty eight days testing.
For every single percentage, the number of bricks needed is 10.
Table 1.1: The Number of Bricks Needed for The Compressive Testing.
Percentage
ratio
Days
7 28
0% 10 10
5% 10 10
10% 10 10
15% 10 10
20% 10 10
Total 100

6
The total 100 bricks as mentioned in Table 1.1 only for compressive testing.
With these numbers of bricks, water absorption also can be used at the same time. The
value of its dry and wet weight is been recorded before the compressive testing is been
run.
Table 1.2 below showed that the number of bricks required for testing regarding
to British Standard.
Table 1.2: Number of Bricks Required for Testing
Purpose Appendix reference
Number of bricks required for sample
Dimensional checks A 24 (available for subsequent tests)
Determination of B 10 soluble salts content Determination of D 10 compressive strength
Determination of E 10 (available for water absorption subsequent compressive
_ ________ strength tests)
Source: BS 3921, 1985
1.5 Significance of Study
Sea sand one of the largest sources of sand on earth. Generally beach covered
almost three quarter of the land. This study is important to know the strength in the sea
sand that will affect the brick block. Sea sand is not commercially used since its interior
properties which are chloride can affect the structure of the material by damaging it with
chemical attack.

7
This study is worthy to investigate because sea sand is finer than river sand and
easy to get the material and crucial to know the factor in the sea sand that effect cement
brick structure. Laterite sand is the most expensive sand because the type of sand are
really give a good strength on the structure but it will course extremely high cost. If this
study is reliable, ATSS can be used widely in brick making and decrease cost in
construction progress.

CHAPTER 2
LITERATURE RI VIEW
2.1 Introduction
In the construction industry, sand is one of the most valuable materials that really
needed to run the construction. Sand is the material in concrete production and sand also
is the main constitutions in sand brick production. Concrete also apart of construction
materials and is a man-made material. Therefore it is the most widely building material
in the construction industry.
In the production of sand brick, normally river sand been used for the
manufacturer. River sand have a grain textures that have many surface where it good to
attach each other when the cement is added. Compare to the sea sand, river sand are
larger than the sea sand.
8
Sea sand nowadays is been adapt to implement the new technology and uses in
the manufacturer. Therefore this study tries to come with another use of sea sand to be

9
commercialized by sea sand brick. According to Naalir (2006), he stated that some steps
have been taken to popularize the use of sea sand for construction. This is because the
shortage of sea sand at certain place.
Nowadays, abundant sea sand is one major environmental aspect that been taken
note by the local authority. Therefore the study is really needed in order to act an action
to this environmental problem and wastage problem and finally apply it for industry
especially in construction.
2.2 Sand
According to the Selvaraju and Pushpavanam (2000), sand and brick used for
construction activity in the Indian Institute of Technology Madras was taken without any
chemical treatment. The bricks were broken down to increase the surface area. The sand
and brick particles were sieved with mechanical sieves and the fraction containing
particle size less than 710 urn was used for experiments.
The desired fraction was then washed withwater and then decanted. After
settling, the water was poured out and the sand was taken for drying. After drying at 85
oC, the solid particles were ready for use as the adsorbent. Analysis of the physical
characteristics of sand included specific surface area, pore specific volume and pore size
distribution.

10
2.3 Sea Sand
On the previous research held on by Lee (2002), he finalize that sea sand has
become a potential resource capable to supplying fine aggregate material for domestic
civil engineering and construction usage and sea sand mainly contains much salinity as
sodium chloride. He also stated that if the salt is not treated and sea sand is directly
utilized for civil engineering and construction concrete project, the durability of the
structural may be affected and as the result the concrete might be swelling, precipitating,
sulfating and other adverse consequences. Therefore, the salt content of the sea sand
must be eliminated before it is utilized to avoid the potential hazards (Lee, 2002).
According to Shantha (2006), the top most layers of sand dunes contain higher
chloride content due to continuous exposure to sea breeze. However, when sea sand is
actually utilized, the first problem encountered is the salt contained in the sea sand. A
distinction must also be made between sea sand and sand deposits in dry coastal areas.
The latter would tend to have very high chloride contents resulting from salt spray and
evaporation over long periods of time.
2.4 Sieve Analysis Sea Sand
The sieve analysis of sea sand is to determine the gradation of sea sand such as
the distribution of aggregate particles, by size and within a given sample. The Figure 2.1
shows the sieve analysis of sea sand that use as concrete aggregate.
11
100
80
.! z
40
20
00.25 0.5 1 2 4 8 16 31.5
Sieve Size (mm)
—0--Sea sand
-4-- Lower Jun11
—'—Recoin, upper limit
—*— Upper limit
60
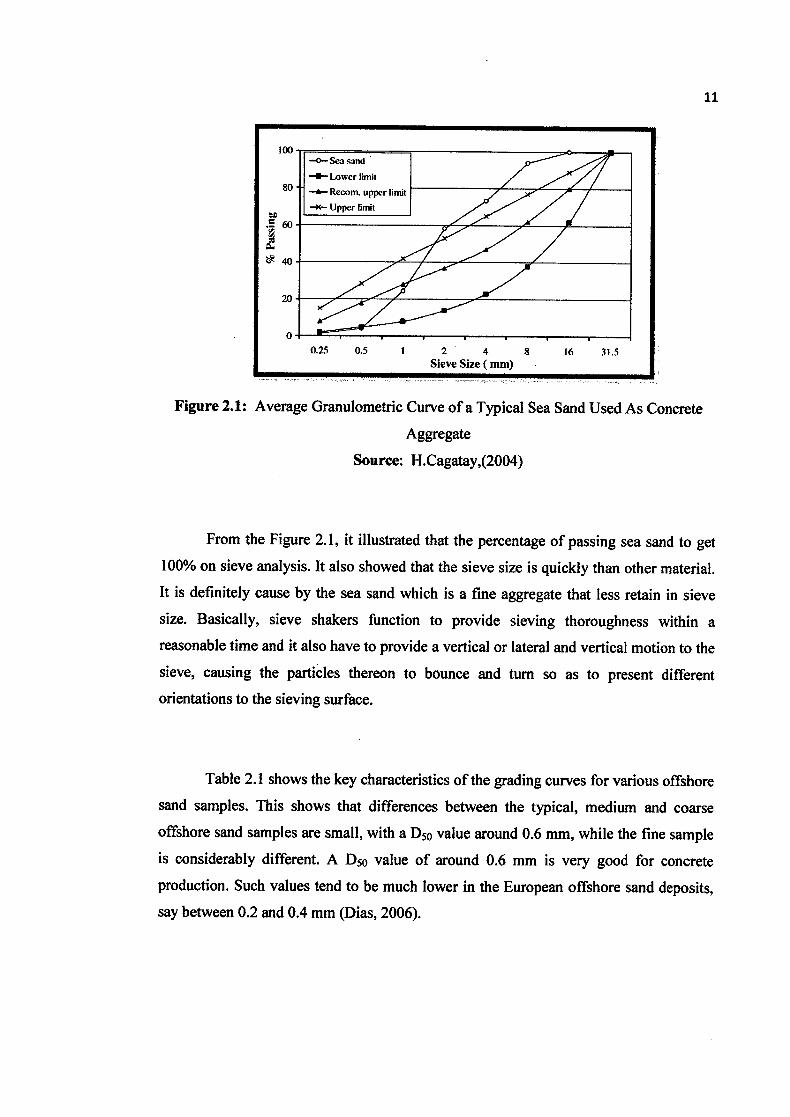
Figure 2.1: Average Granulometric curv e of a Typical Sea Sand Used As Concrete
Aggregate
Source: H.Cagatay,(2004)
It is definitely cause by the sea sand which is a fine aggregate that less reta in in sieve
size. Basically, sieve shakers function to provide sieving thoroughness within a
reasonable time and it also have to provide a vertical or lateral and vertical motion to the
orientations to the sieving surface.
offshore sand samples are small, with a D50 value around 0.6 mm, while the fi ne sample
is considerably different. A D50 value of around 0.6 mm is very good for concrete
production. Such values tend to be much lower in the European offshore sand deposits,
From the Figure 2.1, it illustrated that the percentage of passing sea sand to get
100% on sieve analysis. It also showed that the sieve size is quickly than other material.
sieve, causing the particles thereon to bounce and turn so as to present different
Table 2.1 shows the key characteristics of the grading curves for various offshore
sand samples. This shows that differences between the typical, medium and coarse
say between 0.2 and 0.4 mm (Dias, 2006).

12
Table 2.1: Grading Characteristics of Fine Aggregate
Characteristic Sea sand types
Typical Coarse Medium Fine
<0.60 mm (%) 44 42 49 85
<0.15 mm (°') 2.6 2.5 2.7 12
D50 (mm)0.63 0.66 0.60 0.21
2.5 Application of Sea Sand in Construction
Dias (2007) stated that although offshore sand is reportedly used in many
countries such as the UK, Continental Europe, India, Seychelles and Singapore, most of
the documentation regarding its use was found mainly regarding UK practice, and to a
lesser extent regarding European practice.
From a research by Dias (2002) , he stated that study done on Sri Lankan beach
sands has also shown fairly high chloride levels in some samples. He also said that the
use of sea water for batching or for curing would also promote corrosion; such practices
should not be resorted to. In the UK around 11% of its aggregate extraction is from
offshore sources. In South East England and South Wales, the situation is as high as
30% and 90%, respectively. While much of this aggregate is processed (inclusive of
washing), it is largely unprocessed sand (together with land based coarse aggregate) that
is used on the West Coast and along the Bristol Channel (Dias, 2007).

13
According to Dias (2002), he clarify that the use of such aggregate in concrete
has not caused any major durability problems in the UK during the past 60 or more years
of its use. In fact, chloride related durability problems in the UK have largely been due
to the use of Calcium chloride as an accelerator up to a dosage of 0.15% by weight of
cement, a practice that had been permitted up to 1977. The use of dc-icing salts also
causes chloride related durability problems in many countries. It shows that with well
processed sea sand, they are pretty safe to human's life and property( Dias et al, 2002)
2.6 Brick
Brick have their own characteristics. It included compressive behavior, water
absorption behavior and also durability behavior (BS3921, 1985)
2.6.1 Compressive Characteristics of Brick
The compressive strength of perforated bricks and hollow blocks is determined
by dividing the ultimate load by the gross plan area of the unit, as if it were solid. This
compressive strength should therefore be used in obtaining the value of compressive
strength, ft from Table 2.1. Table 2.1 shows application of masonry to build with
standard format bricks complying with the requirements of BS 187, BS 6073-1 or BS
3921.
For normally bonded masonry can be defined in terms of the shape and
compressive strength of the structural units and the designation of the mortar. The values

14
given in Table 2 inclusive may be taken to be the characteristic compressive strength,
fk, of walls constructed under laboratory conditions tested at an age of 28 days under
axial compression in such a manner that the effects of slenderness may be neglected
(Cavalieri, 2000).
Table 2.2: Characteristic Compressive Strength of Brick Masonry, fk,
(a) Constructed withstandard format bricks
designationCompressive strength of unit Fmrn2
5 10 15 20 27.5 50 70 100
2.5 4.4 6.0 7.4 9.2 11.415.0; 19.2 24.0 2.5 4.2 5.3 6.4 7.9 9.4 12.2.15-1 18.2
1ii) 2.5 4.1 5.0 5.8 7.1 8.5 10.6 13.1 15.5 2.2 3.5 4.4 5.2 6.2 7.3 9. 10110 1_8 12..7
(b) Constructed with blocks having a ratio of height to least horizontal dimension of 0.6
Source: BS5628-1, 1992
Figure 2.2: Characteristic Compressive Strength of Bri ck Masonry, fk
Source: (Cavalieri, 2000)
N LN 0111 JOE 201 0 ENE IN
ENE NOR .uu.ui.uaaaua giglI!UIIR* UU•RI

15
2.6.2 Water Absorption Characteristics of Brick
The method for the determination of water absorption specified in this standard is
the 5 h boiling test. Methods of test by 24 h cold immersion and absorption under
vacuum are also used as works control tests only. The results obtained from these tests
are generally lower than, and are not proportional to, those obtained using the method
given in this standard, nor are they equivalent to each other.
Table 2.3: Classification of Bricks by Compressive Strength and Water Absorption in
N/mm2
Class Compressive strength Water absorption (see 2.1) (see 2.2)
Ninun2 % by mass Engineering 70 <4.5 Engineering B 50 :5 7.0 Damp-proof course 1 5 <4.5 Damp-proof course 2 ^t 5 :5 7.0 All others ^! 5 No limits NOTE 1 There is no direct relationship between compressive strength and water absorption as given in this table and durability. NOTE 2 Damp-proof course 1 bricks are recommended for use in buildings whilst damp-proof course 2 bricks are recommended for use in external works (see Table 13 of BS 5628.3:1985).
Source: BS5628-1, 1992
2.6.3 Cement Brick
Cement brick is a construction material which is used to bond bricks together. It
is also known as brick mortar or masonry cement, and it comes in a variety of styles for
different applications. Home supply stores usually sell brick cement, and can order