InvestigatingtheMicrostructureofNetworkEvolution ... · 1994, Podolny and Stuart 1995). Arguing...
19
Organization Science Vol. 19, No. 5, September–October 2008, pp. 669–687 issn 1047-7039 eissn 1526-5455 08 1905 0669 inf orms ® doi 10.1287/orsc.1070.0339 © 2008 INFORMS Investigating the Microstructure of Network Evolution: Alliance Formation in the Mobile Communications Industry Lori Rosenkopf The Wharton School, University of Pennsylvania, Philadelphia, Pennsylvania 19104, [email protected] Giovanna Padula Bocconi University, Via Bocconi, 8, 20136 Milan, Italy, [email protected] T heories of network evolution frequently focus on “network endogeneity,” which stresses predictable, path-dependent evolution rooted in previous network structure. However, theories of technological evolution and innovation remind us that networks may undergo significant change as technological discontinuities exert pressures on existing relationships and firms engage in exploratory search. How can we incorporate sources of change into our theories of network evolution instead of focusing so squarely on sources of inertia? By using recent advances in graph theory, we develop a more flexible theory of network evolution by examining two patterns of partner selection that have the potential to change networks: “shortcut” formation between relatively unconnected partner clusters, and the entry of new firms into the “main component” of incumbent partners. Our findings suggest an important contingency for the endogeneity perspective: structural homophily predicts shortcut formation but not alliance formation within clusters. Furthermore, we demonstrate that the pattern of alliance formation between incumbents and new entrants to the alliance network is driven by a combination of endogenous and exogenous mechanisms. New entrants attach to more prominent incumbents, but they are more likely to attach with an alliance deal that comprises multiple partners. We demonstrate these findings in an industry where systemic technology encourages cooperation and where network entry is prevalent—the mobile communications industry from 1993–2002. Key words : network evolution and change; small world; shortcuts; exploration; strategic alliances History : Published online in Articles in Advance April 25, 2008. 1. Introduction Research on the evolution of alliance networks has revealed two well-proven rules of partner selection within these networks. Specifically, pairs of firms with direct or indirect ties in existing alliance networks are more likely to form future alliances (e.g.; Gulati 1995b, Walker et al. 1997, Chung et al. 2000), as are firms with more extensive histories of alliance forma- tion (e.g., Powell et al. 1996, Gulati and Gargiulo 1999). Taken together, these dynamics suggest that alliance net- works become ever more self-reproducing and central- ized, as more and more dense webs of relationships are developed among familiar and well-allied firms. Such a characterization of network evolution may be the norm, particularly in more mature industries, but does not help us address questions of how networks might change more dramatically. Understanding substantive network change requires a theory of network evolution that extends beyond these well-accepted drivers of network evolution. Utilizing insights from graph theory and network topology, we identify two gaps in the typical studies demonstrating network endogeneity. First, we employ the small-world imagery of clusters of locally embedded firms connected by a handful of “shortcuts” (Watts and Strogatz 1998, Watts 1999). Here, although the formation of short- cuts may be motivated by very different issues than the majority of local, within-cluster ties, these drivers of shortcuts can be masked by the drivers of the more prevalent local ties. We follow the lead of Baum et al. (2003) in separating out shortcuts as a subset of network ties worthy of study in their own right. Indeed, short- cut formation is one possible route to more significant network change. Another understudied aspect of network change is the role of entry by new firms into the network. Studies of “power-law” distributions in network topologies sug- gest that new entrants preferentially connect to well- connected actors in networks (Barabasi et al. 1999), but most studies of social networks limit their scope to actors that are members of the network throughout the study period. Even small-world studies in our field typ- ically limit their scope to the “main component”—the largest group of actors that already are connected to each other by at least one tie. By considering firms that are outside the main component or not yet in the network at all, we follow the lead of small-world theorists such as Uzzi et al. (2002) and Schilling and Phelps (2007). 669
Transcript of InvestigatingtheMicrostructureofNetworkEvolution ... · 1994, Podolny and Stuart 1995). Arguing...
OrganizationScienceVol. 19, No. 5, September–October 2008, pp. 669–687issn 1047-7039 �eissn 1526-5455 �08 �1905 �0669
informs ®
doi 10.1287/orsc.1070.0339©2008 INFORMS
Investigating the Microstructure of Network Evolution:Alliance Formation in the Mobile
Communications Industry
Lori RosenkopfThe Wharton School, University of Pennsylvania, Philadelphia, Pennsylvania 19104, [email protected]
Giovanna PadulaBocconi University, Via Bocconi, 8, 20136 Milan, Italy, [email protected]
Theories of network evolution frequently focus on “network endogeneity,” which stresses predictable, path-dependentevolution rooted in previous network structure. However, theories of technological evolution and innovation remind
us that networks may undergo significant change as technological discontinuities exert pressures on existing relationshipsand firms engage in exploratory search. How can we incorporate sources of change into our theories of network evolutioninstead of focusing so squarely on sources of inertia? By using recent advances in graph theory, we develop a more flexibletheory of network evolution by examining two patterns of partner selection that have the potential to change networks:“shortcut” formation between relatively unconnected partner clusters, and the entry of new firms into the “main component”of incumbent partners. Our findings suggest an important contingency for the endogeneity perspective: structural homophilypredicts shortcut formation but not alliance formation within clusters. Furthermore, we demonstrate that the pattern ofalliance formation between incumbents and new entrants to the alliance network is driven by a combination of endogenousand exogenous mechanisms. New entrants attach to more prominent incumbents, but they are more likely to attach withan alliance deal that comprises multiple partners. We demonstrate these findings in an industry where systemic technologyencourages cooperation and where network entry is prevalent—the mobile communications industry from 1993–2002.
Key words : network evolution and change; small world; shortcuts; exploration; strategic alliancesHistory : Published online in Articles in Advance April 25, 2008.
1. IntroductionResearch on the evolution of alliance networks hasrevealed two well-proven rules of partner selectionwithin these networks. Specifically, pairs of firms withdirect or indirect ties in existing alliance networksare more likely to form future alliances (e.g.; Gulati1995b, Walker et al. 1997, Chung et al. 2000), as arefirms with more extensive histories of alliance forma-tion (e.g., Powell et al. 1996, Gulati and Gargiulo 1999).Taken together, these dynamics suggest that alliance net-works become ever more self-reproducing and central-ized, as more and more dense webs of relationships aredeveloped among familiar and well-allied firms. Such acharacterization of network evolution may be the norm,particularly in more mature industries, but does not helpus address questions of how networks might changemore dramatically.Understanding substantive network change requires a
theory of network evolution that extends beyond thesewell-accepted drivers of network evolution. Utilizinginsights from graph theory and network topology, weidentify two gaps in the typical studies demonstratingnetwork endogeneity. First, we employ the small-worldimagery of clusters of locally embedded firms connected
by a handful of “shortcuts” (Watts and Strogatz 1998,Watts 1999). Here, although the formation of short-cuts may be motivated by very different issues thanthe majority of local, within-cluster ties, these driversof shortcuts can be masked by the drivers of the moreprevalent local ties. We follow the lead of Baum et al.(2003) in separating out shortcuts as a subset of networkties worthy of study in their own right. Indeed, short-cut formation is one possible route to more significantnetwork change.Another understudied aspect of network change is the
role of entry by new firms into the network. Studiesof “power-law” distributions in network topologies sug-gest that new entrants preferentially connect to well-connected actors in networks (Barabasi et al. 1999),but most studies of social networks limit their scope toactors that are members of the network throughout thestudy period. Even small-world studies in our field typ-ically limit their scope to the “main component”—thelargest group of actors that already are connected to eachother by at least one tie. By considering firms that areoutside the main component or not yet in the networkat all, we follow the lead of small-world theorists suchas Uzzi et al. (2002) and Schilling and Phelps (2007).
669

Rosenkopf and Padula: Investigating the Microstructure of Network Evolution670 Organization Science 19(5), pp. 669–687, © 2008 INFORMS
Most studies of alliance network evolution are unableto make substantive predictions about how firms thatare not advantaged by the current network structure areable to break into these networks, because these firmsdo not possess the alliance ties that are known to facili-tate future alliance formation. Therefore, we investigatehow new entrants are attracted to partners both in andout of the network, and also how established networkactors may choose to develop relationships both withnew entrants and with actors in distant clusters.Our study focuses on a domain where industry
standards and network effects are prevalent, makingalliance formation plentiful. We examine the dynamicsof alliance networks in the cellular industry from 1993 to2002. In established networks, we find that similar levelsof prominence among firms predict alliance formationacross local clusters. We also find that although firmsnew to the network may enter through alliances withprominent established actors, deals of this type are fre-quently populated by more than one new-to-the-networkfirm. Our results suggest that the emergence of newentrants, particularly through multiparty deals, createsnew clusters that can be the source of more fundamentalnetwork change.
2. TheoryThis section develops a more comprehensive theory ofnetwork evolution by acknowledging both endogenousand exogenous drivers of partner selection. We firstreview the two primary endogeneity mechanisms andnote the gaps unexplained by this perspective. Second,we discuss how firms’ exploratory search may motivatealliances with partners that would not be predicted by theendogeneity perspective. Third, we develop hypothesesabout alliance formation among relatively unconnectedclusters and among new entrants to fill the endogeneitygaps. Last, we consider how deals that admit uncon-nected firms to the alliance network may differ fromdeals among more familiar firms.
2.1. Network EndogeneityMuch extant research on network evolution highlightsthe role of previous structures in driving new allianceformation. Previous structures provide social cues aboutthe competencies and reliability of potential partners,which reduce the search costs and risks of exposure toopportunistic behavior (Gulati 1995a, Gulati and Singh1998). Two well-accepted rules of attachment have beenemphasized as drivers of alliance formation: cohesive-ness and prominence.
Cohesiveness suggests that pairs of firms with director indirect ties in existing alliance networks are morelikely to form future alliances. Previous direct tiesbetween two firms provide a reliable channel throughwhich each partner can learn about the competencesand the reliability of the other (Gulati 1995b). Byprovidingunique information about partner capability
and trustworthiness, a history of cooperation betweentwo firms increases the likelihood that these firms willform new alliances with each other in the future. Further-more, indirect ties provide a vehicle to gather informa-tion about potential partners through effective referrals(Coleman 1988). Referrals provide governance benefitsthat operate both ex ante, suggesting which potentialpartners are reliable and trustworthy (Baker 1990, Gulati1995b); and ex post, by disseminating information ondeviant behaviors (Raub and Weesie 1990). Therefore,the extent to which potential partners’ networks overlapwith common partners affects the likelihood of allianceformation between them (Ahuja 2000a, Chung et al.2000).A more structural indicator of the attractiveness of
a potential partner is its prominence in the alliancenetwork, because firms with more extensive historiesof alliance formation are more likely to form futurealliances. Differential levels of network involvementamong firms introduce and reinforce systemic reputa-tional differences among them that extend beyond theirimmediate circle of direct and indirect ties, affectingtheir visibility and attractiveness (Podolny 1993, Han1994, Podolny and Stuart 1995). Arguing that promi-nence signals attractiveness, previous research arguesthat firms attach preferentially to other prominent firms,so that new alliances are more common between firmsthat occupy central positions in the overall network(Powell et al. 1996, Gulati and Gargiulo 1999). Further-more, if prominence enhances the attractiveness of firmsto future partners, not only will central firms be likely toseek other central partners, but they will also have littleincentive to accept peripheral players.The demonstration of these endogenous determinants,
however, fails to address how firms that are either notprominent, or lack substantial direct and indirect ties,are able to participate in subsequent alliances. However,we know from research on technological evolution andinnovation that network structures may undergo moresignificant changes as technological discontinuities exertpressures on existing relations (Rosenkopf and Tushman1994, 1998) and firms engage in exploratory searchto enjoy the benefits of novel recombinant processes(Rosenkopf and Almeida 2003). We argue that adjust-ing the focus of network evolution studies to includesuch “nonendogenous” ties will allow us to understandsources of more significant network change rather thanfocusing so strongly on how networks reproduce them-selves. Therefore, we explore how the types of ties notpredicted by the network endogeneity perspective mayform. Whereas endogeneity studies tend to ignore orminimize the formation of features such as shortcuts orties to new entrants, we make these features the focusof our analysis.First, shortcuts, by definition, are the less common ties
that span locally embedded clusters. However, our statis-tical methods describe aggregate tendencies for alliance
Rosenkopf and Padula: Investigating the Microstructure of Network EvolutionOrganization Science 19(5), pp. 669–687, © 2008 INFORMS 671
formation favoring endogenous dynamics at the expenseof the less common shortcut dynamics.1 The more recentemphasis on small-world topology, however, suggeststhat such shortcuts need to be examined independentlyrather than in aggregation with other ties, because thepower of shortcuts is not in their prevalence but in theirscarcity and their valuable role in promoting efficiencyacross the overall network. Thus, for example, Baumet al. (2003) focused on shortcuts in investment bank-ing syndicate networks and provided evidence that short-cuts can be motivated by “control” and “insurgency”rationales, which suggests that shortcuts can be formedamong both core firms and peripheral firms, respectively.In this paper, we examine determinants of shortcut for-mation rooted in existing network structure.Second, endogeneity studies have traditionally exam-
ined mature, stable industries with little concern forentry or exit. However, graph theorists have also empha-sized how firms develop ties with even more distant,unfamiliar firms—those that have not yet entered the net-work (Barabasi et al. 1999). Indeed, recent studies haveconsidered how patterns of entry may shape networkstructure (Powell et al. 2005, Uzzi et al. 2002). As such,although the formation of shortcuts is one way in whichwe might think about more radical changes to networktopology, an even stronger force in fast-paced industriesmay be the entry of unconnected (or poorly connected)firms to established networks. However, an endogene-ity perspective is unable to make substantive predictionsabout how firms that are not advantaged by the currentnetwork structure are able to break into these networks.Therefore, we also incorporate analyses of network entryinto our study.To fully explore the dynamics of shortcuts and new
entry, we place several small-world attributes in the fore-ground of our study. Whereas most small-world studieslimit their analyses to only the main component (thelargest set of actors that are connected by any path),we emphasize the main component in both our the-ory and our methods, but contrast dynamics within themain component to those beyond the main component.This distinction allows us to speak of firms “embedded”within the main component forming alliances with eachother separately from firms that are not embedded inthe main component at a given time, but may enter themain component subsequently through an alliance withan embedded firm. We call the firms at risk of enteringthe main component “nonembedded firms” or “poten-tial new entrants.” Because embedded firms are able toaccess technological knowledge circulating in the maincomponent (Powell et al. 1996), we theorize that differ-ent dynamics will drive alliance formation among thesemembers than among nonembedded firms that do not yethave access to this knowledge.At the same time, following small-world approaches,
we also focus on the clustering of alliances within the
main component, separating the dynamics of allianceformation within clusters from those for shortcuts acrossclusters. Because shortcuts serve as bridges spanningthe structural holes across clusters (Burt 2005), theiruse suggests access to less familiar contexts comparedto that of prospective partners residing within the samecluster.These twin emphases on embedded versus nonem-
bedded firms, and on shortcuts versus within-clusteralliances, are key because they allow us to distinguishwhat we call “semidistant” firms (already admitted tothe main component but residing in different clusters ofthe main component) from “distant” ones (not yet admit-ted to the main component). This more nuanced view ofdistance generates the context in which firms undertakeexploratory search.
2.2. Exploratory Search and Distant PartnersAlthough the endogeneity perspective on network evo-lution has traditionally emphasized the tendency of thefirms to search locally among familiar prospective part-ners, other studies emphasize entrepreneurial behaviorand exploratory search of firms reaching out for moredistant partners (Burt 1992, 1998). Because shortcutsconnect locally embedded regions of relationships, theycan represent connections among less familiar partners,in contrast to the more familiar firms within a local clus-ter (Burt 2005). One rationale for distant search is thatbrokerage benefits derive from sparse structures and net-works rich in structural holes. A structural hole indicatesthat the actors on either side of the hole have accessto different flows of information (Hargadon and Sutton1997). Hence, developing positions that span the bridgesacross different local communities enables access tonew, unique information (Hansen 1999, Beckman et al.2004). This allows firms to accomplish novel recombi-nant processes (Hargadon and Sutton 1997, Rosenkopfand Almeida 2003, Verona et al. 2006) and supports theirstrategic performance (McEvily and Zaheer 1999, Baumet al. 2000). By exposing established firms to novel,different flows of information, nonlocal search can beparticularly beneficial in fast-paced, exploration invest-ment demanding industries (Rowley et al. 2000). Thus,although within-cluster alliance formation is shaped bytrust among interconnected partners, it does not pro-vide access to more unique knowledge.2 To access moreunique and innovative knowledge, firms must go beyondlocal clusters, yet spanning structural holes implies col-laborating with partners where no reservoir of trust hasbeen previously built through cohesive ties.Whereas shortcuts within the main component are one
way in which distant partners may connect, a “more dis-tant” pairing may be found between embedded firms andpotential new entrants to the network. Ahuja (2000a) hasshown that embedded firms may be willing to forsakethe trust benefits of cooperating with embedded, closely

Rosenkopf and Padula: Investigating the Microstructure of Network Evolution672 Organization Science 19(5), pp. 669–687, © 2008 INFORMS
connected firms when the new entrants possess relevant“technical capital” in the form of important inventions.In fact, systematic exploration of new sources of techni-cal knowledge may enable embedded firms to overcomepath dependence, reorienting their technological trajec-tories through dynamic capabilities (Teece et al. 1997).A consistent flow of new entrants may be expected totake place when industries experience disruptive techno-logical change (Rosenkopf and Tushman 1994). Whentechnological discontinuities emerge, new entrants pos-sess new insights and relevant technical capital that mayenable embedded firms to reposition themselves techno-logically and, consequently, maintain their competitiveleadership (Anderson and Tushman 1990). Moreover,several case studies on high-tech industries show thatby admitting new entrants, embedded firms increase thesize of the community of firms adopting their technolog-ical standard (e.g., Brandenburger 1995, Chandler 1997,Collis and Pisano 2002), and are consequently morelikely to influence the selection of a dominant designof an industry in their favor (Arthur 1989, Wade 1995,Schilling 1998). Thus, alliances with new entrants sup-port firm exploration and innovation, and are particularlybeneficial in technologically and competitively volatileindustries. Of course, although alliances made with firmsnot yet embedded in the network increase the likelihoodof access to unique knowledge, this benefit comes atthe expense of trust built through cohesive ties, becauseknowledge about firms outside the network is not avail-able through indirect network channels.Whether distant search is accomplished through short-
cuts or by admitting new entrants, these new relation-ships with distant partners can provide an impetus fornetwork reform. These relationships develop new com-binations of resources that can redefine the patterns ofinterdependence among firms in the network. As a con-sequence, the typical forms of network reproduction bycohesion and prominence shift, reforming extant net-work structure. As such, extending our current theoriesof network evolution to accommodate shortcuts and newentry patterns can enlarge our current understanding ofnetwork dynamics.
2.3. How and Why Do Firms Partner AcrossClusters and Beyond the Main Component?
To consider selection of unfamiliar alliance partners,we combine notions of exploratory search and endoge-nous social cues. In other words, whereas the search forexploratory benefits explains why embedded firms mayseek distant partners, extant structures play an impor-tant role in predicting which distant prospective partnerscollaborate. Given our distinction between semidistantembedded firms residing in different clusters in the maincomponent and distant firms not embedded in the maincomponent, we begin by examining shortcut generationwithin the main component and follow by examiningalliance formation with nonembedded firms.
2.3.1. Semidistant Shortcut Generation Within theMain Component. Within the established alliance net-work, firms in similar structural positions in the alliancenetwork are more likely to form subsequent partnerships(Podolny 1994). Studies of interorganizational learning(e.g., Powell et al. 1996) have suggested that explo-ration activity is based on developing positions thatenable firms to keep pace with significant changes. Todo so requires being “active participants” at the leadingedge of the scientific and technological world (Cohenand Levinthal 1990), which entails some resource-sharing activities and mutual commitment that developtrustworthiness and reliability of the partners (Ahuja2000b). In addition, the partnerships where novel sci-entific and technological cues are identified can pro-vide fertile ground where these major developments maybe leveraged and further knowledge built through newinnovation projects (Powell et al. 1996, p. 120). Aspromising new developments coming from exploratoryactivities are more likely to be pushed further in thesame partnership context from which they have emerged,collaborating on exploration with trustworthy partnersis paramount. Indeed, Burt (2005) has argued that thesocial capital benefits accruing from brokerage requiresome trust-enabling coordination mechanisms acrossthese distant partners.In these circumstances, where the governance benefits
of density are not available, the question of whether anunknown partner is trustworthy may be answered by thepartner’s record of prior alliance behavior. Firms withextensive alliance histories have demonstrated trustwor-thiness in these prior alliances, reassuring potential newallies. Thus, prominent firms in an alliance network aremore likely to be selected by other firms undertakingnonlocal search. This trust-based argument leads us tohypothesize that prominent firms will tend to attach toother prominent firms for shortcuts. However, becauseexploration is especially important in fast-paced indus-tries, less prominent firms are also compelled to carryout distant search. They are less able to rely on repu-tational benefits than are prominent firms, however, sothey can be expected to attach to other less prominentnetwork actors in their search for distant partners.A status-based argument also predicts shortcut forma-
tion among structurally similar actors. Whereas ties withhigher-status actors enhance the prestige with which afirm is viewed, ties with lower-status actors diminish it(Podolny 1993). Ceteris paribus, any firm would preferto form an alliance with another firm of equal or higherstatus to maintain or increase status. Thus, whereaslower-status firms desire alliances with prominent firmsto accrue some of the esteem and prestige of prominentaffiliates, prominent firms will tend to attach preferen-tially to other prominent firms to avoid any loss of sta-tus. As a result, lower-status firms seeking to explore aretypically left with opportunities to ally only with firmsof equivalently low status.

Rosenkopf and Padula: Investigating the Microstructure of Network EvolutionOrganization Science 19(5), pp. 669–687, © 2008 INFORMS 673
In each case, a structural homophily hypothesisfollows:
Hypothesis 1 (H1). The likelihood of a new shortcutbetween two firms increases with the similarity in promi-nence between those firms.
2.3.2. Distant Alliance Formation Between Em-bedded and Nonembedded Firms. Next, we consider thecase when nonembedded firms can be admitted to thenetwork through alliances with embedded firms. Here,we must consider the motivation of the embedded part-ner as well as that of the nonembedded partner. Clearly,the nonembedded partner seeks admission to the networkand would prefer embedded partners that are advan-taged by the current network structure, but only undercertain circumstances would embedded firms chooseto form alliances with nonembedded firms. Althoughnonembedded firms cannot confer status or demonstratetrustworthiness to embedded firms, they may compen-sate for these shortcomings by offering access to noveltechnology.Just like embedded firms, nonembedded firms prefer
trustworthiness and status. As we have discussed, whenselecting potential partners that are distant, firms mayrely on signals of trustworthiness. Lacking the gover-nance benefits of dense cluster membership, nonembed-ded firms will rely on the reputation benefits signaledby network centrality and will be more likely to partnerwith more prominent embedded firms. Of course, repu-tation is likely to be correlated with other resources thatare also critical to nonembedded firms, such as special-ized knowledge, capital, and complementary assets.Furthermore, a status-based argument will lead to the
same prediction. As we have discussed, relationshipsimplicitly transfer status between parties. A high-statusorganization increases the prestige and esteem of itsaffiliates (Podolny 1993, Podolny and Phillips 1996).Being a function of experience and ability to enter part-nerships, status may be an indicator of the quality of afirm, so that entering into partnerships with prominentplayers implies a transfer of reliability and trustworthi-ness to the connected partners. The reputation effectsprovided by the connections with prominent partners areparticularly critical for a new entrant, because the firstconnection to the network fixes an initial level of sta-tus, which is likely to shape future connections. Fur-thermore, partnerships with prominent incumbents canact as endorsements that influence the perception of anew entrant’s competence and trustworthiness. As anexample, Hsu (2004) finds that more experienced andwell-connected venture capitalists acquire early-stagestart-up equity at a 10%-14% discount. In other words,entrepreneurial start-ups are willing “to pay for status”while entering the financial network of VCs. Similarly,new entrants to a network may sacrifice more favorable
contract terms to form alliances with high-status embed-ded firms (Ahuja and Polidoro 2003).Of course, whereas new entrants search for trustwor-
thy partners and wish to accrue status, it is less clearwhy more prominent and higher-status embedded firmsmight be willing to forsake the trust benefits of well-connected embedded actors and/or wish to risk the lossof status given by associating with an unknown firm.Here we emphasize both the opportunity for establishedfirms to access new technology and the potential lossof status that may ensue. Henderson and Clark (1990)have argued that well-entrenched, dominant firms mayhave neither the ability nor the motivation to intro-duce architectural innovations, whereas less-entrenchedfirms would be expected to search actively for opportu-nities to introduce disruptive changes in product archi-tecture in an industry. Madhavan et al. (1998) havesuggested that peripheral actors are more likely tointroduce competence-destroying change in an indus-try because these radical innovations may offer firmsthe opportunity to gain significant advantage over dom-inant firms. Indeed, Ahuja (2000a) has demonstratedthat firms with low social capital can make attractivealliance partners when they possess “important inven-tions.” Consequently, despite the risks of collaboratingwith unknown, low-status firms, embedded firms will doso to get access to relevant insights and technical capi-tal to reposition themselves in the competitive landscaperesulting from the innovation activities in the industry.Stuart (1998) finds that prestigious firms are more likelyto seek “less crowded” areas of technological spacefor new alliances. Furthermore, Zuckerman and Phillips(2001) suggest that high-status actors are less suscep-tible to status loss when they do not conform, whichimplies that high-status actors may be able to accom-plish exploration through distant partners at lower costthan middle-status actors.Thus, whereas network actors can be expected to
accomplish distant search by forming alliances toperipheral firms—because they are more likely to pos-sess the relevant technical capital to face the competitivechallenges brought by the innovation efforts—peripheralfirms in turn can be expected to attach preferentiallyto more prominent network actors to take advantageof status transfer and reputation benefits. Hence, thisline of reasoning would suggest that the attachmentbias underlying distant partner selection processes wouldtend toward a social asymmetry hypothesis (Ahuja andPolidoro 2003), so that, ceteris paribus, distant shortcutswill occur that link nonembedded firms to prominentones.3�4
Hypothesis 2 (H2). The likelihood that a newentrant attaches to an incumbent firm increases with theprominence of the latter.
Rosenkopf and Padula: Investigating the Microstructure of Network Evolution674 Organization Science 19(5), pp. 669–687, © 2008 INFORMS
2.4. Power of Numbers? Exploratory AlliancesAmong Multiple Parties
In addition to investigating partner selection among dis-tant and semidistant firms, we can also focus on a char-acteristic of these alliances themselves. Little attentionhas focused on the number of parties contracting inan alliance, which we will term “deal size.” In fact,although many alliances contain more than two par-ties, most extant research treats these multiparty dealssolely as multiple, discrete, dyadic relationships.5 Mul-tiparty deals may be expected to be particularly relevantin alliance formation for exploration purposes, becauseexploration-type activities may encompass high-riskinnovations and large investments (Teece et al. 1997).Exploration activity is likely to be associated with
more disruptive change, which will require coordinationof complementary assets (Tripsas 1997) among a widerarray of actors. Cooperation to share the risks and costsof innovation as well as cooperation based on knowl-edge widespread across various different actors may beaccomplished more effectively by multiparty deals. Therole of larger deals is further heightened in systemicindustries. Because systemic technologies are based oncomplex knowledge that cuts across firm boundaries(Tushman and Rosenkopf 1992; Rosenkopf and Nerkar1999, 2001), new alliance formation in these contextsis likely to take account of the widespread nature ofcomplex knowledge and therefore is manifested in largerdeals.In addition, large deals convey a surrogate for gov-
ernance benefits. Because ties across distant partnerslack the benefits of embeddedness in cohesive struc-tures (Walker et al. 1997, Rowley et al. 2000, Baumet al. 2003), their formation through larger deals createsdensely linked clusters around their members. In thiscase, several participants mutually control their behav-ior and contributions to the alliance, thereby providinga relational context where trust and cooperation can beeffectively promoted. Even if this mechanism cannotsupplement ex ante referrals about potential partners’qualities, it can provide ex post referrals and governancebenefits close to those experienced by firms embeddedin a dense structure.Taken together, these arguments prompt us to pre-
dict that, ceteris paribus, exploration-type alliancesshould be more commonly developed through multipartydeals than through dyadic ones. Furthermore, becauseexploration-type search is a matter of degree (Vicariet al. 1996), the size of a deal may be positively associ-ated with the degree to which the search may be char-acterized as distant. Because we have argued above thatexploration may motivate alliances across clusters tosemidistant firms and outside the main component to dis-tant firms, we would expect that the number of partnersin alliances would increase as these alliances span clus-ter boundaries, and even more as these alliances reachoutside the main component:
Hypothesis 3 (H3). Among embedded firms, alliancesthat generate shortcuts will have more partners thanalliances limited to within a single cluster.
Hypothesis 4 (H4). Alliances that attach nonembed-ded firms to the main component will have more partnersthan alliances limited to within the main component.
3. MethodWe tested our hypotheses by examining U.S.-basedalliance formation in the cellular industry from 1993 to2002. The transition from analog to digital platforms inmobile communications technology was followed by thedevelopment of a mass market that stimulated industrygrowth. The early 1990s were characterized by tech-nological ferment, with many variants of digital tech-nologies competing to become the industry standard.Concurrent with the establishment of code division mul-tiple access (CDMA) technology in the United Stateswas the effort to develop protocols for the suite of per-sonal communications services (PCS) enabling the oper-ation of hand-held devices. Thus, the cellular industryis a fertile ground for examining our questions dur-ing this time frame because it exploits a particularlydynamic context: Industry standards and network effectsare prevalent; technology is systemic; and entry and exitare also plentiful.
3.1. Sample and DataWe tested our hypotheses using longitudinal data onstrategic alliances formed in the U.S. cellular com-munication business from 1993 to 2002. The firmsin our sample include both service providers (primaryfour-digit SIC code 4812) and manufacturers of cellu-lar equipment (primary four-digit SIC code 3663). Weemployed two rules to guide our construction of theindustry network. First, each alliance included at leastone participant that was a member of the target indus-try (indicated by its primary four-digit SIC). Second, tobe included in the target industry network, each alliancehad to operate in that industry, as indicated by its pri-mary SIC of activity. As per the first rule, we alsoincluded alliance partners from beyond the target indus-try because excluding them would eliminate our abilityto observe many of the indirect relationships betweenindustry members, thus biasing our measures of industryconnectivity. Coupling the first and second rules insuresthat the industry network consists of alliance activitiesfocused on the designated industry.6
We collected alliance data from the Securities DataCorporation (SDC) database, which includes all contrac-tual arrangements in which two or more entities havecombined resources to form a new, mutually advanta-geous business arrangement to achieve predeterminedobjectives. This information comes from SEC filings andtheir international counterparts, trade publications, wires,and new sources. SDC provides information aboutboth

Rosenkopf and Padula: Investigating the Microstructure of Network EvolutionOrganization Science 19(5), pp. 669–687, © 2008 INFORMS 675
alliance announcements and their realization and ter-mination. Only alliances with realization dates wererecorded. Furthermore, when available, we used infor-mation on alliance termination to remove that alliancefrom subsequent calculations. However, because data onalliance terminations are not as well documented as for-mations, we also employed a five-year moving windowin the analysis of our network data, so that the alliancesin our database are limited to a five-year life span.7
We also used the SDC database to track corporate-level changes such as mergers and acquisitions and cor-rected our data accordingly. All firms that had divested100% of their shares at the ultimate parent level wereremoved from the data set after that event. In thesecircumstances we also assumed that the alliances weretransferred from the seller to the acquirer, and the lat-ter was added to the database if it was not alreadyincluded. Consequently, our network analyses have beencarried out, for any point in time, on working alliances.Alliance formation data provided at the subsidiary levelwere matched and recorded in our database at the parentlevel. Data on firm size were collected from Compustat,Worldscope, and Amadeus.Basic characteristics of the yearly alliance networks
are displayed in Table 1. Both the number of firms activein any alliance and the total number of ties among thesefirms steadily increase over the study period. We identi-fied the main component of the alliance network in eachyear as the largest group of firms connected over anypath of alliance ties. Although the number of firms in
Table 1 Evolution of Network Connectivity and Small-World Characteristics of the Cellular Alliance Network
1991 1992 1993 1994 1995 1996 1997 1998 1999 2000 2001 2002
No. of active firms 16 31 40 72 88 95 101 112 118 118 118 120No. of ties 14 28 38 104 126 139 146 153 163 169 171 173No. of firms in MC1 �n� 9 12 25 56 71 74 82 89 93 94 94 94No. of ties MC 10 16 29 94 115 123 132 140 145 153 155 156No. of ties in MC 2�22 2�67 2�32 3�36 3�30 3�35 3�34 3�26 3�27 3�40 3�45 3�47
per firm �k�
Percent of active firms in MC 0�56 0�39 0�63 0�78 0�81 0�78 0�81 0�80 0�79 0�80 0�80 0�78Percent of ties in MC 0�71 0�57 0�76 0�90 0�91 0�89 0�90 0�91 0�89 0�91 0�91 0�90No. of firms in 3 3 5 18�67 17�75 18�5 20�5 22�25 23�25 23�5 23�5 23�5
MC/no. of firmsin second-biggestcomponent
Ca2 0�410 0�487 0�351 0�596 0�623 0�625 0�649 0�669 0�662 0�596 0�593 0�601
La2 2�194 2�197 3�575 3�714 3�761 3�730 3�807 3�840 3�901 3�779 3�745 3�736
Cr3 0�247 0�222 0�093 0�060 0�046 0�045 0�041 0�037 0�035 0�036 0�037 0�037
Lr3 2�752 2�533 3�825 3�324 3�574 3�559 3�653 3�800 3�827 3�709 3�672 3�653
Ca/Cr4 1�661 2�192 3�782 9�942 13�421 13�800 13�927 18�273 18�834 16�457 16�172 16�290
La/Lr4 0�797 0�867 0�982 1�117 1�052 1�048 1�042 1�011 1�019 1�019 1�020 1�023
SW5 2�083 2�527 3�851 8�897 12�754 13�168 15�281 18�082 18�476 16�151 15�855 15�929
�1�MC=main component.�2�Actual network cluster coefficient (Ca) and path length (La).�3�Random network cluster coefficient (Cr = k/n) and path length (Lr = ln�n�/ ln�k�), i.e., cluster coefficient and path length of a randomly
connected network of the same size/density as actual.�4�Actual-to-random ratios: Cluster coefficient ratio (Ca/Cr) and path length ratio (La/Lr).�5�Small-world connectivity index: (Ca/Cr)/(La/Lr).
the main component grows correspondingly until 2000,its population stabilizes at this time. Nonetheless, thetotal number of ties within the main component contin-ues to increase. The main component ratios suggest thatby 1994, almost 80% of all firms with active alliancesare members of the main component, and approximately90% of all alliances reside within this component. Tofurther suggest the dominance of the main component,we also computed the ratio between the number of firmsin the main component and the number of firms in thesecond-biggest component. By 1994, the main compo-nent represents approximately 20 times more firms thanthe second-largest component, reinforcing the sense thatthere is little isolated clustering. All these percentagesappear to be reasonably stable and suggest that we cap-ture most of the dynamics of alliance evolution by focus-ing on new alliances within the main component as wellas on the pattern of entry into the main component.The remaining rows summarize the small-world char-
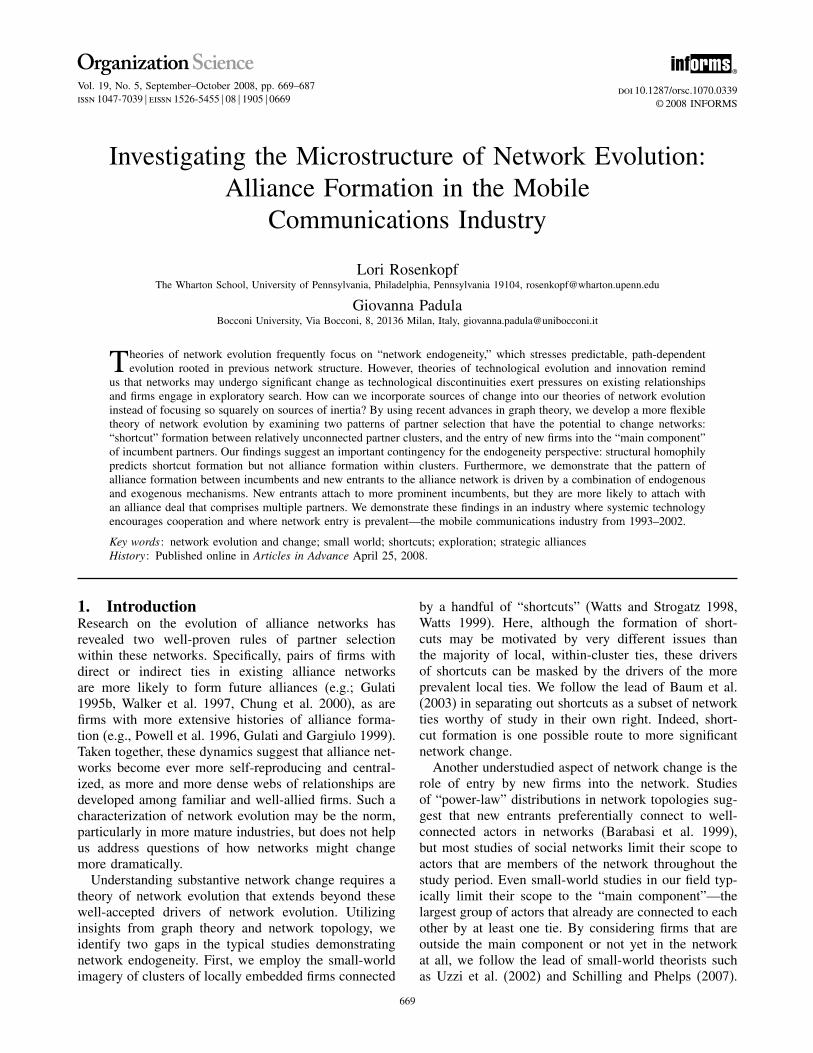
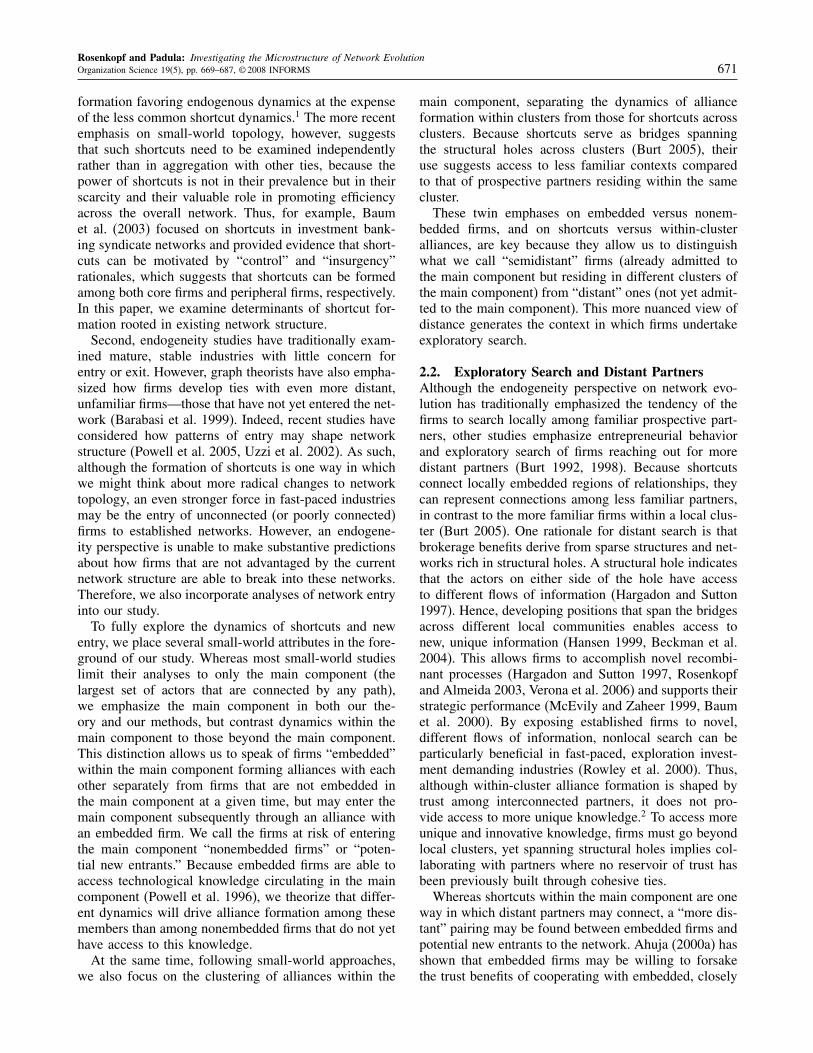
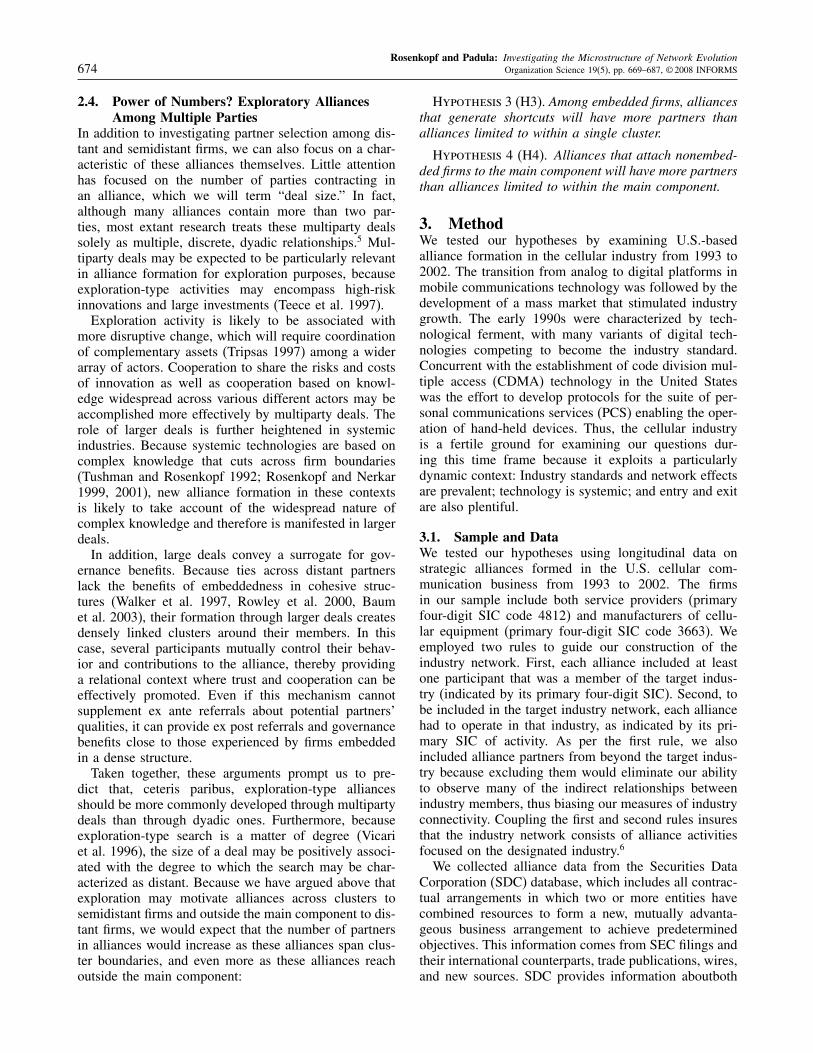
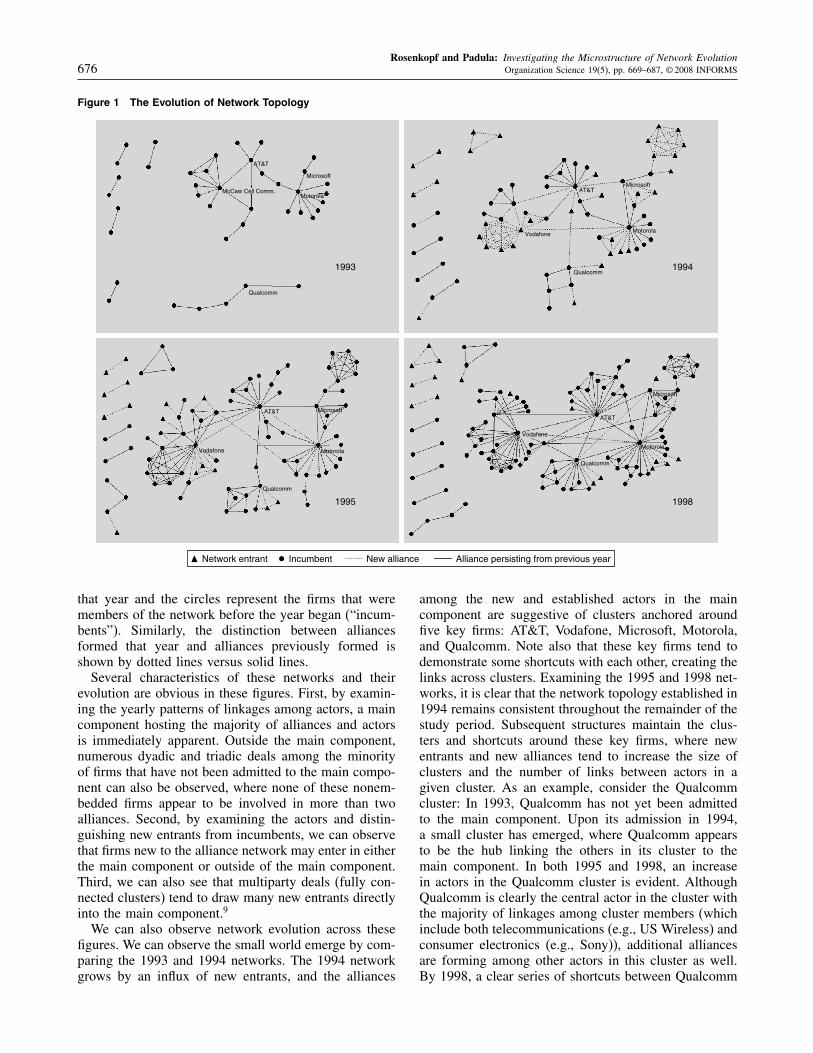
acteristics of our network from 1991–2002.8 Consistentwith prior studies (Uzzi et al. 2002, Baum et al. 2003,Davis et al. 2003), the small world emerges rapidly(seen by the dramatic rise in the small-world coefficientbetween 1993 and 1995) and demonstrates an endur-ing structure. This emergence is driven by movement inthe clustering coefficient ratio, because the average pathlength remains relatively consistent.Figure 1 displays Pajek-generated visualizations of
four different years of alliance networks. In each graph,the triangles represent the firms that entered the network
Rosenkopf and Padula: Investigating the Microstructure of Network Evolution676 Organization Science 19(5), pp. 669–687, © 2008 INFORMS
Figure 1 The Evolution of Network Topology
1993 1994
1995 1998
Network entrant Incumbent New alliance Alliance persisting from previous year
AT&T
AT&TAT&T
AT&T
Microsoft
Microsoft
Microsoft
MicrosoftMcCaw Cell Comm.
Motorola
MotorolaMotorola
Motorola
Qualcomm
Qualcomm
Qualcomm
Qualcomm
Vodafone
Vodafone
Vodafone
that year and the circles represent the firms that weremembers of the network before the year began (“incum-bents”). Similarly, the distinction between alliancesformed that year and alliances previously formed isshown by dotted lines versus solid lines.Several characteristics of these networks and their
evolution are obvious in these figures. First, by examin-ing the yearly patterns of linkages among actors, a maincomponent hosting the majority of alliances and actorsis immediately apparent. Outside the main component,numerous dyadic and triadic deals among the minorityof firms that have not been admitted to the main compo-nent can also be observed, where none of these nonem-bedded firms appear to be involved in more than twoalliances. Second, by examining the actors and distin-guishing new entrants from incumbents, we can observethat firms new to the alliance network may enter in eitherthe main component or outside of the main component.Third, we can also see that multiparty deals (fully con-nected clusters) tend to draw many new entrants directlyinto the main component.9
We can also observe network evolution across thesefigures. We can observe the small world emerge by com-paring the 1993 and 1994 networks. The 1994 networkgrows by an influx of new entrants, and the alliances
among the new and established actors in the maincomponent are suggestive of clusters anchored aroundfive key firms: AT&T, Vodafone, Microsoft, Motorola,and Qualcomm. Note also that these key firms tend todemonstrate some shortcuts with each other, creating thelinks across clusters. Examining the 1995 and 1998 net-works, it is clear that the network topology established in1994 remains consistent throughout the remainder of thestudy period. Subsequent structures maintain the clus-ters and shortcuts around these key firms, where newentrants and new alliances tend to increase the size ofclusters and the number of links between actors in agiven cluster. As an example, consider the Qualcommcluster: In 1993, Qualcomm has not yet been admittedto the main component. Upon its admission in 1994,a small cluster has emerged, where Qualcomm appearsto be the hub linking the others in its cluster to themain component. In both 1995 and 1998, an increasein actors in the Qualcomm cluster is evident. AlthoughQualcomm is clearly the central actor in the cluster withthe majority of linkages among cluster members (whichinclude both telecommunications (e.g., US Wireless) andconsumer electronics (e.g., Sony)), additional alliancesare forming among other actors in this cluster as well.By 1998, a clear series of shortcuts between Qualcomm

Rosenkopf and Padula: Investigating the Microstructure of Network EvolutionOrganization Science 19(5), pp. 669–687, © 2008 INFORMS 677
and other prominent hubs (AT&T, Microsoft, Motorola)has emerged.Analyzing alliance formation within the main com-
ponent required that we identify clusters in order todiscriminate the alliances embedded within the localcohesive regions of relationships from the shortcuts. Weused CONCOR, a hierarchical clustering algorithm thatsuccessively splits the firms into groups of firms basedon their structural equivalence (Breiger et al. 1975).Numerous researchers (Nohria and Garcia-Pont 1991,Walker et al. 1997) have used CONCOR or a variant ofthis procedure to identify clusters. Because CONCORgroups structurally equivalent firms, we insured thatthe intracluster densities were greater that the inter-cluster densities by merging clusters that violated thisrelationship. Full detail on our procedure for clusteridentification is provided in Appendix 1. Once clusterswere determined, shortcuts were defined as the alliancesbetween firms belonging to different clusters.
3.2. MeasuresTo test our hypotheses, we constructed variables attwo different levels of analysis. For our hypotheses onalliance formation (H1 and H2), we developed variablesusing the dyad-year as the unit of analysis, whereas forour hypotheses on deal size (H3 and H4), we developedvariables using the deal as the unit of analysis.
3.2.1. Dependent Variables. We constructed anevent history for each dyad spanning the years 1993 to2002.10 For each dyad-year record, we coded a dichoto-mous dependent variable, Alliance formation, indicatingwhether the pair of firms formed an alliance in the givenyear. Alliances reported among more than two firms arerepresented as alliance formation dyads among each ofthe firms included in the alliance. To avoid double count-ing, we discarded reverse-ordered dyads.We identified four different risk sets on which we run
these dyadic regressions. Three focus on alliance tiesformed among members of the main component in anygiven year: ties between clusters (shortcuts), ties withinclusters, and all ties. We examine each of these three setsto demonstrate the differences between the predictorsof shortcuts and within-cluster ties, and also to demon-strate which of these effects are observable on the aggre-gate set of ties in the main component. Our fourth riskset examines alliance ties formed by firms that are notmembers of the main component: These firms have thepotential to break into the main component by formingalliances both with firms embedded in the main compo-nent and with each other.11�12
The variable Deal size indicates the number of part-ners represented in each alliance formed. Using thedeal as the level of analysis, we examine the determi-nants of both the full risk set of deals as well as thesubset of embedded deals formed solely within the maincomponent.
3.2.2. Independent Variables. All of our dyadicindependent variables are derived from the alliance net-work structure. To compute these network measures, weconstructed year-by-year adjacency matrices represent-ing the relationships between the firms involved in eachof our risk sets. As per our choice to use a five-year mov-ing window, each year included the cumulative alliancesthat had been formed among industry panel members forthe previous five years.In constructing these matrices, we also made some
choices about the treatment of different types ofalliances, the accumulation of multiple ties by the samepairs of partners, and the past alliances that should beincluded. Because our study is concerned with the struc-tural pattern of interaction between firms, and the result-ing topology of the overall network, we constructedbinary adjacency matrices for each year. In other words,our indication of ties between firms is not sensitive tothe number of ties between the firms if multiple alliancesare active, and it is not sensitive to the “strength” of thealliance as denoted by governance form. This is consis-tent with a strict definition of topology as provided bythe small-world theoretical formulation.13 We computedall the network measures using UCINET 6.0 (Borgattiet al. 2002).
Structural Homophily. For embedded firm dyads, weassessed the similarity of the two firms’ network posi-tions. Structural homophily was constructed by calculat-ing the ratio of each firm’s Bonacich (1987) eigenvectormeasure of network centrality. Use of the Bonacich mea-sure is consistent with prior efforts to capture the posi-tion of an organization in a network (Mizruchi 1993;Podolny 1993, 1994; Gulati and Gargiulo 1999). Theeigenvector measure accounts for both direct and indi-rect firms’ ties, so that, using this index, the most cen-tral organizations are those linked to many firms, whichare in turn linked to several other firms.14 We com-puted the eigenvector measure of the network centralityof each firm for each year and normalized them so thatthe eigenvector score of the most central firm for anyyear would equal one. To ascertain the similarity in thecentrality position of any pair of firms, we computedthe ratio of the smaller to the larger centrality score ofthe two members of the dyad. This variable ranges fromzero to one, with higher scores representing higher sim-ilarity in network position between the firms.
Incumbent Prominence. For dyads where at least onemember is not in the main component, we neededto assess the network position of the embedded firmonly. Incumbent prominence represents the normalizedBonacich (1987) eigenvector measure of network cen-trality, as above, for the firm embedded in the main com-ponent. If neither firm of the dyad is a member of themain component, this score is set to zero.
Cross-Cluster and Nonembedded Deals. For deal-level analyses, Cross-cluster deal is a binary variablethat

Rosenkopf and Padula: Investigating the Microstructure of Network Evolution678 Organization Science 19(5), pp. 669–687, © 2008 INFORMS
is set to one for alliances among embedded firms thathave been formed with members of more than one clus-ter as indicated by CONCOR. The variable is set to zeroif all the members of the embedded deal are membersof the same CONCOR cluster. Similarly, for the full setof alliance deals, Nonembedded deal is a binary variablethat is set to one for alliances that include nonembeddedfirms. The variable is set to zero if all the members ofthe deal are already members of the main component.
3.2.3. Control Variables.
Time. To control for unobserved temporal factors suchas progressive legitimization or economic conditions thatmay influence alliance formation or deal size, we con-structed dummy variables for each year. We then com-pared these results with those coming from using asingle variable Time, which ranges from zero to eight(with the default year being 1993), thereby assuming lin-earity in the effects of time. Because we observed no dif-ferences in the results based on the alternative controlsfor time, we chose to use the time trend for simplicityof presentation.
Cluster Density. We also controlled for the densityof the cluster in which each embedded firm resides,because Rowley et al. (2000) suggest that dense clustersstrengthen the tendency to explore with distant partners.For each cluster, cluster density represents the actualnumber of alliances formed within the cluster divided bythe number of all possible ties that can be formed withinthe cluster—that is, �N �N −1��/2, where N is the num-ber of firms belonging to the cluster. Normalizing thewithin-cluster alliance count by dividing by the numberof possible alliances controls for the fact that the within-cluster alliance count will vary greatly with the size ofthe cluster.15 For embedded firm pairs, we constructeda dyadic measure of Cluster density for each pair offirms as the arithmetic mean of the cluster density scoreof each member of the dyads. For nonembedded pairs,we used the density of the embedded firm’s cluster. Fordeal-based analyses, we average the cluster densities ofeach embedded firm involved in the deal. If a dyad or adeal included only nonembedded firms, cluster densitywas set to zero.
Firm Size. Because alliance formation is positivelyassociated with firm size (Stuart 1998), we controlled forthe number of employees in each firm. We constructeda dyadic measure for the Firm size variable as the arith-metic mean of the firm’s size score for each member ofthe dyad or the deal, depending on the unit of analysis.This variable is logged due to high skew.
Horizontal Relationships. The propensity to formalliances and their distribution across clusters andshortcuts can also be influenced by industry-relatedtechnological features. To control for these effects, we
coded the firms according to their main SIC code, so thatwe could discriminate service providers from equipmentmanufacturers from other firms whose main activity doesnot fall in the target industry. We then created a dummyvariable called Horizontal dyad and coded 1 if both firmsin the dyad were in the same industry as shown by theirmain SIC code (identifying the dyads at risk of forminghorizontal ties) and 0 if they were not (identifying thecross-industry dyads). For deal-based analyses, Horizon-tal deal was coded 1 if all firms in the deal were in thesame industry, and 0 otherwise.
Network Endogeneity. We also controlled for threewell-established measures of relational and structuralembeddedness associated with alliance formation in thenetwork endogeneity literature. First, Repeated ties rep-resents the number of previous alliances formed betweenthe two firms in the previous five years. Because themarginal value of any subsequent alliance for the forma-tion of new alliances between any two firms is expectedto decrease as additional alliances are developed overtime between these firms, we also include the squareof this term. Second, to capture indirect ties in addi-tion to direct ties, we computed the number of part-ners shared by the two members of a dyad as a resultof their alliances in the previous five years. FollowingGulati (1995b), to capture the effect of indirect ties inthe absence of direct ties, we only allow the variableCommon ties to take this count as its value when themembers of the dyad have no prior direct ties with eachother during the previous five years. In other words,when Repeated ties is greater than zero, Common tiesis set to zero. Third, another common measure in theendogeneity literature is joint prominence. It is similarto the structural homophily variable, but represents themean of the two normalized Bonacich centrality scoresrather than the ratio.
Cross-Cluster Dyad. Based on the results of net-work partition provided by CONCOR, we constructeda dummy variable to indicate when a pair of firmsbelonged to the same cluster or different clusters withinthe main component. Cross-cluster dyad �CC� is val-ued 1 when each member of the dyad belongs to a dif-ferent cluster, and 0 when both members of the dyadare members of the same cluster. We also included aninteraction term between cross-cluster dyad and struc-tural homophily (CC × Structural homophily) to assesswhether the effects of structural homophily differ withthe extent to which new alliances form within, ratherthan across, clusters.
Main Component and New Entrant Prominence. Weincluded the count of the number of firms in the maincomponent during the year. Main component controls forthe extent of opportunities for new entrants to attach tothe main component. We also controlled for the promi-nence of new entrants, because firms not embedded in
Rosenkopf and Padula: Investigating the Microstructure of Network EvolutionOrganization Science 19(5), pp. 669–687, © 2008 INFORMS 679
the main component may still have formed alliances.New entrant prominence measures the degree centrality(count of active alliances) for potential new entrants tothe main component.
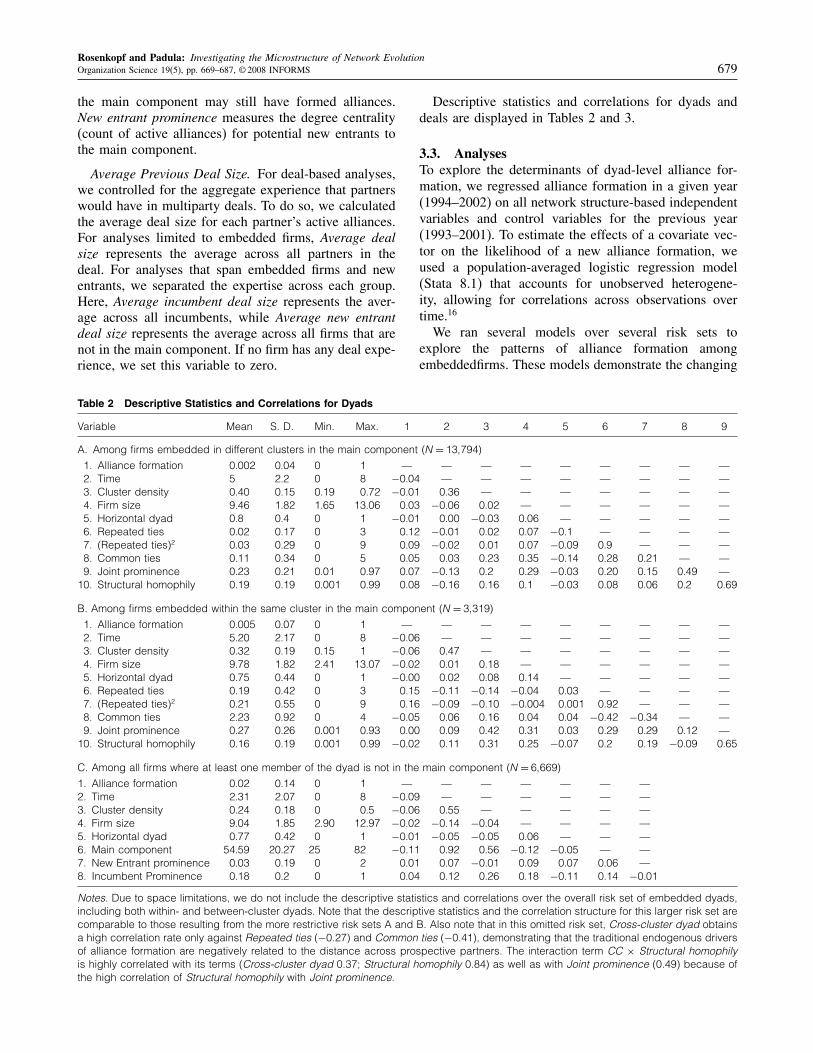
Average Previous Deal Size. For deal-based analyses,we controlled for the aggregate experience that partnerswould have in multiparty deals. To do so, we calculatedthe average deal size for each partner’s active alliances.For analyses limited to embedded firms, Average dealsize represents the average across all partners in thedeal. For analyses that span embedded firms and newentrants, we separated the expertise across each group.Here, Average incumbent deal size represents the aver-age across all incumbents, while Average new entrantdeal size represents the average across all firms that arenot in the main component. If no firm has any deal expe-rience, we set this variable to zero.
Table 2 Descriptive Statistics and Correlations for Dyads
Variable Mean S. D. Min. Max. 1 2 3 4 5 6 7 8 9
A. Among firms embedded in different clusters in the main component �N = 13�794�1. Alliance formation 0�002 0�04 0 1 — — — — — — — — —2. Time 5 2�2 0 8 −0�04 — — — — — — — —3. Cluster density 0�40 0�15 0�19 0�72 −0�01 0�36 — — — — — — —4. Firm size 9�46 1�82 1�65 13�06 0�03 −0�06 0�02 — — — — — —5. Horizontal dyad 0�8 0�4 0 1 −0�01 0�00 −0�03 0�06 — — — — —6. Repeated ties 0�02 0�17 0 3 0�12 −0�01 0�02 0�07 −0�1 — — — —7. (Repeated ties)2 0�03 0�29 0 9 0�09 −0�02 0�01 0�07 −0�09 0�9 — — —8. Common ties 0�11 0�34 0 5 0�05 0�03 0�23 0�35 −0�14 0�28 0�21 — —9. Joint prominence 0�23 0�21 0�01 0�97 0�07 −0�13 0�2 0�29 −0�03 0�20 0�15 0�49 —
10. Structural homophily 0�19 0�19 0�001 0�99 0�08 −0�16 0�16 0�1 −0�03 0�08 0�06 0�2 0�69
B. Among firms embedded within the same cluster in the main component �N = 3�319�1. Alliance formation 0�005 0�07 0 1 — — — — — — — — —2. Time 5�20 2�17 0 8 −0�06 — — — — — — — —3. Cluster density 0�32 0�19 0�15 1 −0�06 0�47 — — — — — — —4. Firm size 9�78 1�82 2�41 13�07 −0�02 0�01 0�18 — — — — — —5. Horizontal dyad 0�75 0�44 0 1 −0�00 0�02 0�08 0�14 — — — — —6. Repeated ties 0�19 0�42 0 3 0�15 −0�11 −0�14 −0�04 0�03 — — — —7. (Repeated ties)2 0�21 0�55 0 9 0�16 −0�09 −0�10 −0�004 0�001 0�92 — — —8. Common ties 2�23 0�92 0 4 −0�05 0�06 0�16 0�04 0�04 −0�42 −0�34 — —9. Joint prominence 0�27 0�26 0�001 0�93 0�00 0�09 0�42 0�31 0�03 0�29 0�29 0�12 —
10. Structural homophily 0�16 0�19 0�001 0�99 −0�02 0�11 0�31 0�25 −0�07 0�2 0�19 −0�09 0�65
C. Among all firms where at least one member of the dyad is not in the main component �N = 6�669�1. Alliance formation 0�02 0�14 0 1 — — — — — — —2. Time 2�31 2�07 0 8 −0�09 — — — — — —3. Cluster density 0�24 0�18 0 0�5 −0�06 0�55 — — — — —4. Firm size 9�04 1�85 2�90 12�97 −0�02 −0�14 −0�04 — — — —5. Horizontal dyad 0�77 0�42 0 1 −0�01 −0�05 −0�05 0�06 — — —6. Main component 54�59 20�27 25 82 −0�11 0�92 0�56 −0�12 −0�05 — —7. New Entrant prominence 0�03 0�19 0 2 0�01 0�07 −0�01 0�09 0�07 0�06 —8. Incumbent Prominence 0�18 0�2 0 1 0�04 0�12 0�26 0�18 −0�11 0�14 −0�01
Notes. Due to space limitations, we do not include the descriptive statistics and correlations over the overall risk set of embedded dyads,including both within- and between-cluster dyads. Note that the descriptive statistics and the correlation structure for this larger risk set arecomparable to those resulting from the more restrictive risk sets A and B. Also note that in this omitted risk set, Cross-cluster dyad obtainsa high correlation rate only against Repeated ties (−0.27) and Common ties (−0.41), demonstrating that the traditional endogenous driversof alliance formation are negatively related to the distance across prospective partners. The interaction term CC × Structural homophilyis highly correlated with its terms (Cross-cluster dyad 0.37; Structural homophily 0.84) as well as with Joint prominence (0.49) because ofthe high correlation of Structural homophily with Joint prominence.
Descriptive statistics and correlations for dyads anddeals are displayed in Tables 2 and 3.
3.3. AnalysesTo explore the determinants of dyad-level alliance for-mation, we regressed alliance formation in a given year(1994–2002) on all network structure-based independentvariables and control variables for the previous year(1993–2001). To estimate the effects of a covariate vec-tor on the likelihood of a new alliance formation, weused a population-averaged logistic regression model(Stata 8.1) that accounts for unobserved heterogene-ity, allowing for correlations across observations overtime.16
We ran several models over several risk sets toexplore the patterns of alliance formation amongembeddedfirms. These models demonstrate the changing

Rosenkopf and Padula: Investigating the Microstructure of Network Evolution680 Organization Science 19(5), pp. 669–687, © 2008 INFORMS
Table 3 Descriptive Statistics and Correlations for Deals
Variable Mean S. D. Min. Max. 1 2 3 4 5 6 7 8
D. Among firms embedded in the main component �N = 47�1. Deal size 2�07 0�33 2 4 — — — — — — —2. Time 3�90 2�18 1 8 0�12 — — — — — —3. Cluster density 0�37 0�20 0�15 1 0�03 0�05 — — — — —4. Firm size 9�93 1�98 1�65 13�45 0�47 −0�02 −0�13 — — — —5. Horizontal deal 0�38 0�49 0 1 −0�15 −0�31 −0�23 0�10 — — —6. Average deal size 1�01 0�37 1 2�75 0�67 0�17 −0�04 0�50 −0�17 — —7. Cross-cluster deal 0�58 0�50 0 1 0�16 0�37 0�37 −0�04 −0�48 0�20 —
E. Among all firms �N = 111�1. Deal size 2�24 0�78 2 7 — — — — — — — —2. Time 3�49 2�24 1 8 −0�02 — — — — — — —3. Cluster density 0�33 0�22 0�05 1 0�07 0�04 — — — — — —4. Firm size 9�18 2�05 1�05 13�45 0�31 −0�15 −0�12 — — — — —5. Horizontal deal 0�43 0�50 0 1 0�10 −0�33 −0�18 0�09 — — — —6. Main component 62�43 25�42 25 82 0�06 0�91 0�03 −0�17 −0�27 — — —7. Average incumbent deal size 0�90 0�48 1 6 0�01 0�41 −0�04 0�01 −0�26 0�43 — —8. Average new entrant deal size 0�04 0�20 0 1 −0�09 −0�25 −0�05 0�31 −0�09 −0�34 −0�43 —9. Nonembedded deal 0�16 0�36 0 1 0�41 −0�40 0�20 0�33 0�21 −0�69 0�55 −0�45
effects of our independent variables when we examineonly shortcuts, only within-cluster ties, or all ties. Sub-sequently, we examine alliance formation among dyadswhere one or both of the members of the dyad is notembedded in the main component.To explore how structural considerations might pre-
dict deal size, we regressed deal size in a given year(1994–2002) on all network structure-based indepen-dent variables and control variables for the previousyear (1993–2001).17 Hence, we used a Poisson model(Stata 8.1) that is consistent with the count nature of ourdependent variable.18
3.4. ResultsTable 4 displays logistic estimates of the probabilitythat a dyad of firms will form an alliance in a givenyear. Models 1A–3A examine shortcut formation amongfirms embedded in the main component. Examining thecontrol variables (1A), we observe that most of thedrivers of alliance formation traditionally emphasizedby the endogeneity perspective have a role in predict-ing shortcut formation as well. For example, Repeatedties demonstrates a significant curvilinear relation withshortcut formation. Likewise, the positive and signifi-cant coefficient of Joint prominence demonstrates thatshortcuts tend to be more common among central firms.In contrast to extant studies, however, our results showthat Common ties has no significant effect on newalliance formation among firms residing in differentclusters. Firm size is positively and significantly relatedto alliance formation, revealing that the propensity toform shortcuts increases with the average size of thefirms. Time is negatively and significantly related toalliance formation, suggesting that shortcut formationdecreases over time in the time span examined by the
study. All other control variables have no significanteffect on our dependent variable. These results are con-sistent throughout the other two models (2A and 3A),with one exception. Given the high correlation betweenJoint prominence and Structural homophily, we sub-stitute Structural homophily for Joint prominence inModel 2A, and Structural homophily generates a sig-nificant positive effect. When we include both variablessimultaneously in Model 3A, Structural homophily issignificant, whereas Joint prominence is not. Further-more, the chi-squared values indicate that the Model 2A,only including Structural homophily, is the preferred fit.This demonstrates that shortcuts tend to be more com-mon among firms with similar levels of centrality in thenetwork,19 confirming Hypothesis 1.In contrast, Models 1B–3B explore how the same
independent variables affect alliance formation amongfirms that reside within the same cluster, rather thanacross clusters. Here, Repeated ties obtains a posi-tive effect on alliance formation within clusters, butthe second-order term is not significant. As before,Common ties have no effect on alliance formation.Importantly, neither Joint prominence nor Structuralhomophily affects alliance formation within clusters.Because clusters host closer partners by definition, wecan expect that there would be less variation acrossthese observations with respect to the limited set ofwithin-cluster pairs. Indeed, Models 1C and 2C aggre-gate the information from the prior two sets of regres-sions (A and B) by demonstrating that the effect ofStructural homophily obtains across clusters only.Models 1D–2D examine alliance formation among
new entrants and are therefore run on a risk set madeup of dyads between two new entrants or one embed-ded firm and one new entrant, excluding dyads between

Rosenkopf and Padula: Investigating the Microstructure of Network EvolutionOrganization Science 19(5), pp. 669–687, © 2008 INFORMS 681
Table 4 Logistic Estimates of Dyad-Level Alliance Formation
A. Among firms embedded B. Among firms embeddedin different clusters in the within the same cluster in the
main component �N = 13�794� main component �N = 3�319�
Independent variable Model 1A Model 2A Model 3A Model 1B Model 2B Model 3B
Structural homophily 2�94∗∗ 2�46∗∗ −2�29 −2�96Time −0�39∗∗ −0�40∗∗ −0�40∗∗ −0�19 −0�19 −0�18Cluster density −0�01 −0�01 −0�01 −0�03 −0�03 −0�02Firm size 0�29∗ 0�41∗ 0�41∗ −0�08 −0�06 −0�09Horizontal dyad −0�14 0�04 0�01 −0�09 −0�21 −0�21Repeated ties 3�49∗∗ 3�57∗∗ 3�52∗∗ 4�47∗∗ 4�81∗ 4�81∗∗
(Repeated ties)2 −1�22∗ −1�20∗ −1�19∗ −0�81 −0�87 −0�88Common ties 0�25 0�43 0�39 0�21 0�24 0�27Joint prominence 2�48∗ 0�60 −0�09 0�71Chi-square 100�85∗∗ 106�49∗∗ 104�91∗∗ 32�75∗∗ 34�48∗∗ 33�97∗∗
C. Among all firms embedded in the main D. Among dyads where at least onecomponent, both within the same cluster firm is not embedded in the main
and in different clusters �N = 17�113� component �N = 6�669�
Model 1C Model 2C Model 1D Model 2D
Structural homophily 1�66∗∗
Incumbent prominence 1�24∗
Time −0�28∗∗ −0�29∗∗ 0�17 −0�24Cluster density −0�03 −0�02 0�06∗ 0�06∗
Firm size 0�03 0�12 −0�03 −0�04Horizontal dyad 0�09 0�02 −0�57∗ −0�51∗
Repeated ties 2�97∗∗ 3�19∗∗ −0�03 −0�03(Repeated ties)2 −0�72∗ −0�76∗
Common ties 0�51∗ 0�41Cross-cluster (CC) dyad 0�38 −0�69CC dyad × Structural homophily 4�93∗∗
Main component −0�05 −0�05New entrant prominence 0�19 0�23Chi-square 153�74∗∗ 160�46∗∗ 39�07∗∗ 43�49∗∗
∗p < 0�05; ∗∗p < 0�01.
two embedded firms. Our baseline Model 1D showsthat Cluster density obtains a positive, significant effect,suggesting that incumbents embedded in more denselyconnected clusters show a higher propensity to attachto new entrants compared to those embedded in lessdensely connected clusters. Moreover, Horizontal dyadhas a negative, significant effect, demonstrating that dis-tant search in the form of attaching to new entrants ismore likely to occur amongst firms at different stagesof the value chain. All other control variables areinsignificant throughout. Turning to Model 2D, Incum-bent prominence obtains a significant and positive effecton the probability of alliance formation, supportingHypothesis 2.Table 5 displays the Poisson estimates of deal size.
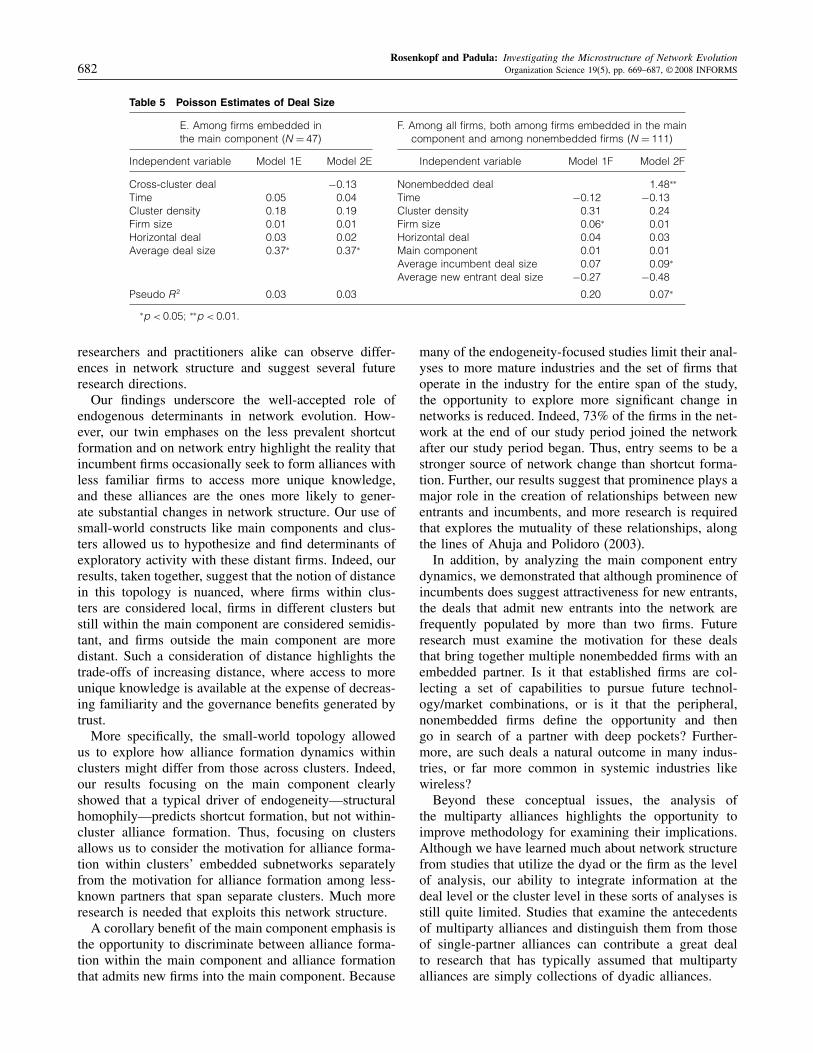
Models 1E–2E examine alliances formed among firmsembedded in the main component only. Neither of themodels has much explanatory power. Only Average dealsize has a significant effect on current deal size, andCross-cluster deals do not exhibit greater size. Thus, weare unable to support Hypothesis 3: Among embedded
firms, there is no difference in the number of partnersamong alliances within clusters and across clusters.In Models 1F–2F we examine all alliances formed.
Again, the control variables are not particularly infor-mative: Only Firm size obtains a significant effect.However, with the inclusion of the Nonembedded dealindicator, Model 2F demonstrates a significant fit, and asignificant positive effect of this indicator. Thus, nonem-bedded deals are associated with a greater number ofpartners than deals limited to within the main compo-nent, supporting Hypothesis 4.
4. Discussion and ConclusionsOur study shifts the focus in studies of network evo-lution from how networks stay the same to how net-works might change more significantly. To do so, weutilized several factors that have been underemphasizedin extant studies focusing on network endogeneity. Eachof these factors—the small-world topology, the entry ofnew firms into preexisting networks, and the existenceof multiparty alliances—generates avenues by which
Rosenkopf and Padula: Investigating the Microstructure of Network Evolution682 Organization Science 19(5), pp. 669–687, © 2008 INFORMS
Table 5 Poisson Estimates of Deal Size
E. Among firms embedded in F. Among all firms, both among firms embedded in the mainthe main component �N = 47� component and among nonembedded firms �N = 111�
Independent variable Model 1E Model 2E Independent variable Model 1F Model 2F
Cross-cluster deal −0�13 Nonembedded deal 1�48∗∗
Time 0�05 0�04 Time −0�12 −0�13Cluster density 0�18 0�19 Cluster density 0�31 0�24Firm size 0�01 0�01 Firm size 0�06∗ 0�01Horizontal deal 0�03 0�02 Horizontal deal 0�04 0�03Average deal size 0�37∗ 0�37∗ Main component 0�01 0�01
Average incumbent deal size 0�07 0�09∗
Average new entrant deal size −0�27 −0�48
Pseudo R2 0�03 0�03 0�20 0�07∗
∗p < 0�05; ∗∗p < 0�01.
researchers and practitioners alike can observe differ-ences in network structure and suggest several futureresearch directions.Our findings underscore the well-accepted role of
endogenous determinants in network evolution. How-ever, our twin emphases on the less prevalent shortcutformation and on network entry highlight the reality thatincumbent firms occasionally seek to form alliances withless familiar firms to access more unique knowledge,and these alliances are the ones more likely to gener-ate substantial changes in network structure. Our use ofsmall-world constructs like main components and clus-ters allowed us to hypothesize and find determinants ofexploratory activity with these distant firms. Indeed, ourresults, taken together, suggest that the notion of distancein this topology is nuanced, where firms within clus-ters are considered local, firms in different clusters butstill within the main component are considered semidis-tant, and firms outside the main component are moredistant. Such a consideration of distance highlights thetrade-offs of increasing distance, where access to moreunique knowledge is available at the expense of decreas-ing familiarity and the governance benefits generated bytrust.More specifically, the small-world topology allowed
us to explore how alliance formation dynamics withinclusters might differ from those across clusters. Indeed,our results focusing on the main component clearlyshowed that a typical driver of endogeneity—structuralhomophily—predicts shortcut formation, but not within-cluster alliance formation. Thus, focusing on clustersallows us to consider the motivation for alliance forma-tion within clusters’ embedded subnetworks separatelyfrom the motivation for alliance formation among less-known partners that span separate clusters. Much moreresearch is needed that exploits this network structure.A corollary benefit of the main component emphasis is
the opportunity to discriminate between alliance forma-tion within the main component and alliance formationthat admits new firms into the main component. Because
many of the endogeneity-focused studies limit their anal-yses to more mature industries and the set of firms thatoperate in the industry for the entire span of the study,the opportunity to explore more significant change innetworks is reduced. Indeed, 73% of the firms in the net-work at the end of our study period joined the networkafter our study period began. Thus, entry seems to be astronger source of network change than shortcut forma-tion. Further, our results suggest that prominence plays amajor role in the creation of relationships between newentrants and incumbents, and more research is requiredthat explores the mutuality of these relationships, alongthe lines of Ahuja and Polidoro (2003).In addition, by analyzing the main component entry
dynamics, we demonstrated that although prominence ofincumbents does suggest attractiveness for new entrants,the deals that admit new entrants into the network arefrequently populated by more than two firms. Futureresearch must examine the motivation for these dealsthat bring together multiple nonembedded firms with anembedded partner. Is it that established firms are col-lecting a set of capabilities to pursue future technol-ogy/market combinations, or is it that the peripheral,nonembedded firms define the opportunity and thengo in search of a partner with deep pockets? Further-more, are such deals a natural outcome in many indus-tries, or far more common in systemic industries likewireless?Beyond these conceptual issues, the analysis of
the multiparty alliances highlights the opportunity toimprove methodology for examining their implications.Although we have learned much about network structurefrom studies that utilize the dyad or the firm as the levelof analysis, our ability to integrate information at thedeal level or the cluster level in these sorts of analyses isstill quite limited. Studies that examine the antecedentsof multiparty alliances and distinguish them from thoseof single-partner alliances can contribute a great dealto research that has typically assumed that multipartyalliances are simply collections of dyadic alliances.
Rosenkopf and Padula: Investigating the Microstructure of Network EvolutionOrganization Science 19(5), pp. 669–687, © 2008 INFORMS 683
Our work also highlights how research streamsfocused on social capital and on small worlds use-fully intersect. Burt’s (2005) discussion of the interde-pendence between learning and trust benefits is clearlyrelated to our effort to couple instrumental search goalswith reliance on social cues in alliance formation. Ourfinding that different dynamics describe alliance forma-tion within, between, and beyond local clusters sup-ports his increasing emphasis on the complementarityof brokerage and closure in studies of social capital.Thus, the inclusion of small-world topology in theoriesof network evolution can help us discern more beneficialnetwork structures. Although some initial studies havedemonstrated the value of small worlds (Schilling andPhelps 2007, Uzzi and Spiro 2005), studies that shareour focus on the microstructure of networks can con-tribute much more to our understanding of the interde-pendence between brokerage and closure.Finally, significant opportunities arise to connect stud-
ies of network evolution to both the technological tra-jectories that provide context for alliance formation andalso to the movement of key individuals between firms.As technological discontinuities provide the impetus fornetwork reformation, our approach allows researchersto uncover the major sources of this network refor-mation. Do networks reform because of the entry ofnew firms? The development of new clusters? Increasedsearch for partners outside of established clusters? Or,at the extreme, by the emergence and growth of a newcomponent that proves the undoing of the establishednetwork? At the same time, to what extent can thenetwork-building activities of new entrants be facilitatedor constrained by the prior experiences of their exec-utive teams? Future research must provide insight intothese areas, which can help researchers and practitionersunderstand both endogenous and exogenous sources ofnetwork change.
AcknowledgmentsThe authors acknowledge financial support from the MackCenter for Technological Innovation at The Wharton Schoolof the University of Pennsylvania, Bocconi University, andSDA Bocconi School of Management. They are also grate-ful to Gautam Ahuja and their three anonymous reviewers forthoughtful comments throughout the review process.
AppendixBecause the determination of clusters is as much art as science,here we set out the procedure we used to make this determi-nation as systematic as possible. For our research purposes,we needed to partition the actors within the main compo-nent into more densely connected clusters of relationships.To do so, we used CONCOR, a procedure that successivelypartitions the firms into blocks of powers of 2 (2 blocks, 4blocks, 8 blocks, 16 blocks, etc.) based on their structuralequivalence. Of course, because structural equivalence doesnot require cohesion (Burt 1987), this procedure alone wouldnot guarantee that members within a block actually obtain the
Figure A.1 Potential Network Clusters for 1998 Suggested bya Three-Partition CONCOR Procedure
2
1
3
4
5
6
7
8
Vodafone
AT&T
Qualcomm
Motorola
Microsoft
cohesiveness that we would expect from clusters. Therefore,to determine the ultimate clusters for our analysis, we adheredto the following procedure.To assess whether a given partition of firms into clusters
effectively separates more cohesive blocks from each other, wedetermined that any set of clusters admitted into our analyseswould demonstrate a higher density within each cluster thanbetween any two clusters. If this assumption was violated bya suggested clustering via CONCOR, we merged the clusterswhere between-cluster density exceeded within cluster densityuntil we met this criterion.In CONCOR, there is no standard stopping rule about the
number of successive partitions to permit. Because our net-work visualizations (for example, Figures 1(a)–(d)) appearedto suggest three to six clusters, depending on the year, wechose to allow three partitions for our analyses, which enabled
Figure A.2 Final 1998 Network Clusters, After MergingPotential Clusters 1 and 2
1 + 2
3
4
5
6
7
8
Vodafone
AT&T
Qualcomm
Motorola
Microsoft

Rosenkopf and Padula: Investigating the Microstructure of Network Evolution684 Organization Science 19(5), pp. 669–687, © 2008 INFORMS
Table A.1 Density Matrix of the 1998 Potential NetworkClusters
Cluster 1 2 3 4 5 6 7 8
1 0.00 0.38 0.01 0.00 0.00 0.00 0.00 0.002 0.38 0.00 0.03 0.02 0.00 0.00 0.00 0.003 0.01 0.03 0.24 0.01 0.00 0.00 0.01 0.004 0.00 0.02 0.01 0.24 0.01 0.01 0.01 0.005 0.00 0.00 0.00 0.01 0.29 0.00 0.01 0.006 0.00 0.00 0.00 0.01 0.00 0.15 0.02 0.007 0.00 0.00 0.01 0.01 0.01 0.02 0.62 0.028 0.00 0.00 0.00 0.00 0.00 0.00 0.02 1.00
the identification of eight �2× 2× 2� potential clusters. Notethat alternative design choices for the number of partitionswere less suitable. Specifically, four partitions (yielding 16cluster candidates) required many more merges, ultimatelyrevealing results essentially comparable to the three-partitionsolution. More importantly, two partitions (yielding four clus-ter candidates), although satisfying the criterion of greaterwithin-cluster density than across-cluster density, tended tohave less difference between the within-cluster and across-cluster densities due to the aggregation of distinct subclustersinto this small set of potential clusters. Therefore, the three-partition approach was used, ultimately resulting in five clus-ters in 1993; eight clusters in 1994, and seven clusters in allother years.Figures A.1 and A.2 and Tables A.1 and A.2 depict our
cluster generation procedure, using 1998 data as an example.Figure A.1 displays the results of a three-partition CONCOR20
analysis and Table A.1 displays the inter- and intracluster den-sities. To satisfy the criterion above, the intracluster densities(on the diagonal) must exceed the intercluster (off-diagonal)densities. Although this is true for Clusters 3 through 8, Clus-ters 1 and 2 each have zero density on the diagonal, suggest-ing that the clusters represent structural equivalents that arenot cohesive with each other. Further examination of the rowssurrounding these zero diagonals suggest that these two clus-ters should be merged together, because there are significantlinkages spanning these clusters, which would create cohesive-ness within a merged cluster. Figure A.2 and Table A.2 depictthe revised clusters after this merge is completed. Now, alldiagonal (intracluster) densities exceed all off-diagonal (inter-cluster) densities, so this is the seven-cluster solution we useto discern shortcuts formed between clusters in the subsequentyear.
Table A.2 Density Matrix of the Final 1998 Network Clusters,After Merging Clusters 1 and 2
Cluster 1+ 2 3 4 5 6 7 8
1+ 2 0.18 0.02 0.01 0.00 0.00 0.00 0.003 0.02 0.24 0.01 0.00 0.00 0.01 0.004 0.01 0.01 0.24 0.01 0.01 0.01 0.005 0.00 0.00 0.01 0.29 0.00 0.01 0.006 0.00 0.00 0.01 0.00 0.15 0.02 0.007 0.00 0.01 0.01 0.01 0.02 0.62 0.028 0.00 0.00 0.00 0.00 0.00 0.02 1.00
Endnotes1Indeed, before the recent surge of small-world studies, Walkeret al. (1997) proposed that a firm’s motivation to generatestructural holes might lead to the formation of alliances withunfamiliar partners. Despite this insight, their empirical resultsdid not demonstrate support for this hypothesis because themajority of relationships were formed with familiar partners.2Of course, Burt (2000) argues that the trust benefits of clo-sure may be overrated, in that dense clusters may reinforcethe tendency of actors to echo “socially desirable” informa-tion. Because alliance clusters in some cases represent a divi-sion of labor, the threat of hold-up may exist, lessening trustand increasing “echo.” Although this perspective generates aslightly different slant on the full range of information sharedwithin clusters, it is still consistent with our larger view thatmore unique information is available beyond local clusters.3Another application of the social asymmetry hypothesis couldsuggest that alliances between core and peripheral firms mightbe more likely within the main component. We do not believethat this is a likely phenomenon with regard to shortcuts inthe main component, as given by our arguments developingHypothesis 1. However, this does not preclude core-peripheralalliances within clusters, which are not the focus of our anal-ysis, and would likely be predicted by cohesiveness withinclusters. Our argument for prominent embedded firms finding(peripheral) nonembedded firms attractive partners is spawnedby the cases where these nonembedded firms bring new-to-the-network technology, consistent with the Ahuja and Polidoro(2003) argument. Peripheral embedded firms are unlikely tobring new-to-the-network technology.4In an interesting analogy, Sorenson and Stuart (2001) findthat prominent venture capital firms are more likely to fundspatially distant targets.5Specifically, an alliance between one incumbent and two newentrants is treated as three dyads: one each between the incum-bent and the two new entrants, and another between the twonew entrants.6Whereas our networks are generated via a focus on industry-specific alliances, other authors have chosen to generate net-works via a focus on firms participating in that industry (e.g.,Gulati and Gargiulo 1999; Ahuja 2000a, b). Given our needto understand the broader network topology and to iden-tify new entrants, firm-generated networks were less likely toreveal these phenomena. A similar approach has been used bySchilling and Phelps (2007).7The choice of a five-year window is consistent with extantalliance studies (e.g., Gulati and Gargiulo 1999, Stuart 2000)and conforms to Kogut’s (1988) finding that the normal lifespan of most alliances is no more than five years. Schillingand Phelps (2007), in contrast, use a three-year window fortheir alliance network study. In our data, for the alliances withterminations reported in SDC Platinum (14 of 111), the meanlength of the terminated deal is 2.5 years, with a standarddeviation of three years. We ran our analyses with three-yearwindows and found that our results are robust to the selectionof either time frame.8Following Watts and Strogatz (1998) and Watts (1999), welook for the presence or absence of a small world by compar-ing the actual network’s clustering coefficient (Ca) and pathlength (La) to the clustering coefficient (Cr) and path length(Lr) of a randomly connected network of the same size and

Rosenkopf and Padula: Investigating the Microstructure of Network EvolutionOrganization Science 19(5), pp. 669–687, © 2008 INFORMS 685
density. Formally, a small world is said to exist if Ca is at leasttwice as large as Cr while La is approximately the same as Lr(Newman et al. 2001). For a random network the clusteringcoefficient is calculated as k/n and average path length canbe computed as ln�n�/ ln�k�, where k is the average numberof degrees per node and n is the number of nodes. Thus, thesmall world diverges from a random network by exhibitinghigh clustering while still maintaining short path lengths.9Several multiparty deals are pictured in our figures. First,Unitel was formed in 1994 as a joint venture between net-work incumbent BellSouth and six network entrants (ENI,Fiat, Fininvest, Premafin, Millicom, and Vodafone) to bid for amobile telephone network license. This deal is represented bythe cluster of seven firms in the lower-left quadrant. Second,also in 1994 (seen in the upper-right quadrant), the WirelessCable Digital Alliance is a consortium of six new entrants(American Telecasting, Andrew, California Amplifier, EMCEEBroadcast Product, Microwave Filter, and Zenith Electronics)to jointly develop digital technologies for delivery of digitalvideo programming and other services. Third, in 1995, RPGCellular Services was formed as a joint venture between Voda-fone and three new network entrants (Itochu, RPG, and Air-Touch Communications) to provide cellular telephone servicesin India (seen in the lower-left quadrant). Finally, in 1998, analliance was formed between Motorola and three new entrants(Netscape, Nextel, and Unwired Planet) to provide a wirelesstelephone package combining voice, data, and Internet servicesin the United States (seen in the lower-right quadrant).10Because the determination of our variables relies on theidentification of the main component, we begin our statisticalanalyses during the first year in which a main component isevident.11In analyses not reported here, we also split this risk set intothe subset of dyads with one firm already embedded in themain component and the subset of dyads with neither firmembedded. Results were comparable, so we only report theresults for the combined set of dyads.12Ties among nonembedded dyads may arise as a function ofmultiparty deals that include more than one nonembedded firmas well as deals limited to nonembedded firms.13The use of binary (rather than valued) adjacency matricesmay raise the concern that we overemphasize structural con-siderations at the expense of relational ones. Our method-ological choice is motivated by our desire to incorporate thesmall-world methodological assumptions, which are primarilystructural (Watts and Strogatz 1998, Watts 1999). However, toincorporate relational considerations, we include count mea-sures for cohesiveness controls, which are discussed later inthis section.14To compute the Bonacich (1987) index, we tested multiplevalues of the weighting factor Beta, which denotes the extentto which indirect ties should affect the focal firm’s centrality.We report results for the Beta parameter set at the three-quarterof the inverse of absolute value (or modulus) of the largesteigenvalue, which is consistent with previous research (e.g.,Podolny 1993). However, our results are robust to a range ofpositive values of Beta. They are also robust when Beta is setto zero, which essentially reduces the Bonacich measure toone of degree centrality.It is worth noting that two firms with equivalent Bonacich
centrality with Beta set to 0.75 may not experience the exact
same structure, because one could have a smaller number ofhigher-status partners whereas the other could have a largernumber of lower-status partners. Fortunately, the convergenceof the results with Beta set to both 0.75 and 0 strengthensour claim of structural homophily. We thank an anonymousreviewer for pointing this out.15We considered using a variable representing cluster size (thenumber of firms in the cluster) as well. Clearly, cluster densityis a function of cluster size N , and the two variables are cor-related at −0.34. Accordingly, alternative specifications of ourmodel with cluster size in place of cluster density, as well asboth cluster size and cluster density together, did not add anyexplanatory power to our models; cluster density alone is thepreferred predictor. Another specification with cluster size andnumber of ties in the cluster (instead of cluster density) againdid not exceed the predictive power of cluster density alone.16Our decision to employ a population-averaged model ratherthan a random or fixed-effects model is based on the follow-ing considerations. Recent studies of alliance formation withindyads (Gulati 1995b, Stuart 1998, Rosenkopf et al. 2001) haveused random effects rather than fixed effects because of thebiases inherent in fixed effects over short time horizons andbecause of the presence of time-invariant predictors for whichfixed effects do not provide any coefficient estimates. How-ever, random-effects models are based on the assumption thatthe random components are independent from the time-varyingpredictors, a restrictive condition that seems incorrect in ourresearch design and that would consequently lead to biasedestimates if employed to our case. Because the population-averaged approach makes no explicit assumption about therandom component in the regression model, it relaxes therandom-effects models restrictions by allowing for any possi-ble correlations between random component and time-varyingpredictors. At the same time, it can accommodate short timeframes and time-invariant predictors. Consequently, in our casethe population-averaged approach is the preferred way to obtainestimates adjusted to account for the correlation across obser-vations through time.17Although firm fixed effects might be desirable, our limitednumber of observations for the deal-based analyses precludetheir inclusion.18Although the dependent variable does not suffer fromoverdispersion, we tested negative binomial models to insurethere was no improvement in fit over our Poisson models.19The Joint prominence result suggests that the alliance forma-tion among firms with similar levels of centrality is generatedby more prominent firms forming alliances with each other thanby more peripheral firms forming alliances with each other.20Visual representations of our 1998 network clusters wereobtained using Pajek 1.19 (de Nooy et al. 2005).
ReferencesAhuja, G. 2000a. The duality of collaboration: Inducements and
opportunities in the formation of interfirm linkages. StrategicManagement J. 21(3) 317–343.
Ahuja, G. 2000b. Collaboration networks, structural holes and inno-vation: A longitudinal study. Admin. Sci. Quart. 45(3) 425–455.
Ahuja, G., F. Polidoro, Jr. 2003. Structural homophily or social asym-metry? The formation of alliances by poorly-embedded firms.Working paper, University of Michigan, Ann Arbor.

Rosenkopf and Padula: Investigating the Microstructure of Network Evolution686 Organization Science 19(5), pp. 669–687, © 2008 INFORMS
Anderson, P., L. M. Tushman. 1990. Technological discontinuities anddominant designs: A cyclical model of technological change.Admin. Sci. Quart. 35(4) 604–633.
Arthur, B. 1989. Competing technologies, increasing returns, andlock-in by historical events. Econom. J. 99 116–131.
Baker, W. E. 1990. Market networks and corporate behavior. Amer. J.Sociol. 96(3) 589–625.
Barabasi, A. L., R. Albert, H. Jeong. 1999. Mean-field theory forscale-free random networks. Physica Part A 272 173–187.
Baum, J. A., T. Calabrese, B. S. Silverman. 2000. Don’t go it alone:Alliance network composition and startups’ performance inCanadian biotechnology. Strategic Management J. 21 267–294.
Baum, J. A. C., A. V. Shipilov, T. J. Rowley. 2003. Where do smallworlds come from? Indust. Corporate Change 12(4) 697–725.
Beckman, C. M., D. Phillips, P. Haunschild. 2004. Friends orstrangers? Firm-specific uncertainty, market uncertainty, and net-work partner selection. Organ. Sci. 15(3) 259–275.
Bonacich, P. 1987. Power and centrality: A family of measures. Amer.J. Sociol. 92(5) 1170–1182.
Borgatti, S. P., M. G. Everett, L. C. Freeman. 2002. Ucinet for Win-dows: Software for Social Network Analysis. Analytic Technolo-gies, Harvard, Cambridge, MA.
Brandenburger, A. M. 1995. Power play (A): Nintendo in 8-bit videogames. Harvard Business School Case 9-795-102.
Breiger, R. L., S. A. Boorman, P. Arabie. 1975. An algorithm forclustering relational data, with applications to social networkanalysis and comparison with multidimensional scaling. J. Math.Psych. 12 326–383.
Burt, R. L. 1987. Social contagion and innovation, cohesion versusstructural equivalence. Amer. J. Sociol. 92(6) 1287–1335.
Burt, R. L. 1992. Structural Holes. Harvard University Press,Cambridge, MA.
Burt, R. L. 1998. The network structure of social capital. Paper pre-sented at the Social Network and Social Capital Conference,Duke University, Durham, NC.
Burt, R. 2000. The network structure of social capital. R. I. Sutton,B. M. Staw, eds. Research in Organizational Behavior. JAIPress, Greenwich, CT, 345–423.
Burt, R. L. 2005. Brokerage and Closure. An Introduction to SocialCapital. Oxford University Press, New York.
Chandler, A. D., Jr. 1997. The computer industry. The first half-century. D. B. Yoffie, ed. Competing in the Age of Digital Con-vergence. Harvard Business School Press, Boston, 37–122.
Chung, S., H. Singh, K. Lee. 2000. Complementarity, status similar-ity and social capital as drivers of alliance formation. StrategicManagement J. 21(1) 1–22.
Cohen, W. L., D. A. Levinthal. 1990. Absorptive capacity: A newperspective on learning and innovation. Admin. Sci. Quart. 35(1)128–152.
Coleman, J. S. 1988. Social capital in the creation of human capital.Amer. J. Sociol. 94 S95–S120.
Collis, D., G. Pisano. Intel Corporation: 1968–1997. Harvard BusinessSchool Case 9-797-137.
Davis, G. F., M. Yoo, W. E. Baker. 2003. The small world of theAmerican corporate elite, 1982–2001. Strategic Organ. 1(3)301–326.
de Nooy, W., A. Mrvar, B. Batagelj. 2005. Exploratory Social Net-work Analysis with Pajek. Structural Analysis in the Social Sci-ences, Vol. 27. Cambridge University Press.
Gulati, R. 1995a. Familiarity breeds trust? The implications ofrepeated ties on contractual choice in alliances. Acad. Manage-ment J. 38(1) 85–112.
Gulati, R. 1995b. Social structure and alliance formation pattern: Alongitudinal analysis. Admin. Sci. Quart. 40(4) 619–652.
Gulati, R., M. Gargiulo. 1999. Where do interorganizational networkscome from? Amer. J. Sociol. 104(5) 1439–1493.
Gulati, R., H. Singh. 1998. The architecture of cooperation: Man-aging coordination uncertainty and interdependence in strategicalliances. Admin. Sci. Quart. 43(4) 781–814.
Han, S. K. 1994. Mimetic isomorphism and its effects on the auditservice market. Soc. Forces 73(2) 637–664.
Hansen, M. T. 1999. The search-transfer problem: The role of weakties in sharing knowledge across organization subunit. Admin.Sci. Quart. 44(1) 82–111.
Hargadon, A. B., R. I. Sutton. 1997. Technology brokering and inno-vation: Evidence from a product design firm. Admin. Sci. Quart.42(4) 716–749.
Henderson, R., K. B. Clark. 1990. Architectural innovation: Thereconfiguration of existing product technologies and the failureof established firms. Admin. Sci. Quart. 35(1) 9–30.
Hsu, D. H. 2004. What do entrepreneurs pay for venture capital affil-iation? J. Finance 59(August) 1805–1844.
Kogut, B. 1988. Joint ventures: Theoretical and empirical perspec-tives. Strategic Management J. 9(2) 312–332.
Madhavan, R., B. R. Koka, J. E. Prescott. 1998. Networks in tran-sition: How industry events (re)shape interfirm relationships.Strategic Management J. 19(5) 439–459.
McEvily, B., A. Zaheer. 1999. Bridging ties: A source of firm het-erogeneity in competitive capabilities. Strategic Management J.20(12) 1133–1156.
Mizruchi, M. S. 1993. Cohesion, equivalence and similarity of behav-ior. A theoretical and empirical assessment. Soc. Networks 15(3)275–307.
Newman, M., S. Strogatz, D. Watts. 2001. Random graph with arbi-trary degree distribution and their applications. Phys. Rev. Part E64 026118.
Nohria, N., C. Garcia-Pont. 1991. Global strategic linkages and indus-try structure. Strategic Management J. 12 105–124.
Podolny, J. M. 1993. A status-based model of market competition.Amer. J. Sociol. 98(4) 829–872.
Podolny, J. M. 1994. Market uncertainty and the social character ofeconomic exchange. Admin. Sci. Quart. 39(3) 458–483.
Podolny, J. M., D. J. Philips. 1996. The dynamics of organizationalstatus. Indust. Corporate Change 5(2) 453–471.
Podolny, J. M., T. E. Stuart. 1995. A role-based ecology of techno-logical change. Amer. J. Sociol. 100(5) 1224–1260.
Powell, W. W., K. Koput, L. Smith-Doerr. 1996. Interorganizationalcollaboration and the locus of innovation: Networks of learningin biotechnology. Admin. Sci. Quart. 41(1) 116–145.
Powell, W. W., D. R. White, K. Koput, J. Owen-Smith. 2005. Net-work dynamics and field evolution: The growth of interorgani-zational collaboration in the life sciences. Amer. J. Sociol. 1101132–1205.
Raub, W., J. Weesie. 1990. Reputation and efficiency in social inter-actions: An example of network effects. Amer. J. Sociol. 96(3)626–654.
Rosenkopf, L., P. Almeida. 2003. Overcoming local search throughalliances and mobility. Management Sci. 49(6) 751–766.

Rosenkopf and Padula: Investigating the Microstructure of Network EvolutionOrganization Science 19(5), pp. 669–687, © 2008 INFORMS 687
Rosenkopf, L., A. Nerkar. 1999. On the complexity of technologicalevolution. Exploring coevolution within and across hierarchicallevels in the optical disc technology. J. Baum, B. McKelvey, eds.Variations in Organization Science: In Honor of D. T. Campbell.Sage Publications, Thousand Oaks, CA, 169–183.
Rosenkopf, L., A. Nerkar. 2001. Beyond local search: Boundary-spanning, exploration and impact in the optical disk industry.Strategic Management J. 22(4) 287–306.
Rosenkopf, L., M. Tushman. 1994. The Co-evolution of technologyand organization. J. Baum, J. Singh, eds. Evolutionary Dynamicsof Organizations. Oxford University Press, New York, 403–424.
Rosenkopf, L., M. Tushman. 1998. The co-evolution of communitynetworks and technology: Lessons from the flight simulationindustry. Indust. Corporate Change 7(2) 311–346.
Rosenkopf, L., A. Metiu, V. P. George. 2001. From the bottom up?Technical committee activity and alliance formation. Admin. Sci.Quart. 46(4) 748–772.
Rowley, T., D. Behrens, D. Krackhardt. 2000. Redundant governancestructures: An analysis of structural and relational embedded-ness in the steel and semiconductor industries. Strategic Man-agement J. 21(3) 369–386.
Schilling, M. 1998. Technological lock-out. An integrative model ofthe economic and strategic factors driving technology successand failure. Acad. Management Rev. 23(2) 267–284.
Schilling, M., C. Phelps. 2007. Interfirm collaboration networks: Theimpact of large-scale network structure on firm innovation. Man-agement Sci. 53(7) 1113–1127.
Sorenson, O., T. E. Stuart. 2001. Syndication networks and the spa-tial distribution of venture capital investments. Amer. J. Sociol.106(6) 1546–1588.
Stuart, T. 1998. Network positions and propensity to collaborate: Aninvestigation of strategic alliance formation in a high-technologyindustry. Admin. Sci. Quart. 43(3) 668–698.
Stuart, T. 2000. Inter-organizational alliances and the performanceof firms: A study of growth and innovation rates in a high-technology industry. Strategic Management J. 21(8) 791–811.
Teece, D. J., G. Pisano, A. Shuen. 1997. Dynamic capabilities andstrategic management. Strategic Management J. 18(7) 509–533.
Tripsas, M. 1997. Unraveling the process of creative destruction:Complementary assets and incumbent survival in the typesetterindustry. Strategic Management J. 18 119–142.
Tushman, M. L., L. Rosenkopf. 1992. On the organizational deter-minants of technological change: Towards a sociology of tech-nological evolution. B. Staw, L. Cummings, eds. Research inOrganizational Behavior, Vol. 14. JAI Press, Greenwich, CT,311–347.
Uzzi, B., J. Spiro. 2005. Collaboration and creativity: The small worldproblem. J. Sociol. 111(2) 447–504.
Uzzi, B., J. Spiro, D. Delis. 2002. Emergence: The origin and evolu-tion of career networks in the broadway musical industry, 1877to 1995. Working paper, Northwestern University, Evanston, IL.
Verona, G., E. Prandelli, M. Sawhney. 2006. Innovation and virtualenvironments: Towards virtual knowledge brokers. Organ. Stud.27(6) 765–788.
Vicari, S., G. von Krogh, J. Roos, V. Mahnke. 1996. Knowledgecreation though cooperative experimentation. G. von Krogh,J. Roos, eds. Managing Knowledge. Perspectives on Coopera-tion and Competition. Sage Publications, London.
Wade, J. 1995. Dynamics of organizational communities and tech-nological bandwagons: And empirical investigation of com-munity evolution in the microprocessor market. StrategicManagement J. 16 111–133.
Walker, G., B. Kogut, W. Shan. 1997. Social capital, structural holesand the formation of an industry network. Organ. Sci. 8(2)109–125.
Watts, D. J. 1999. Networks, dynamics and the small world phe-nomenon. Amer. J. Sociol. 105(2) 493–527.
Watts, D. J., S. H. Strogatz. 1998. Collective dynamics of “smallworld” networks. Nature 393 440–442.
Zuckerman, E., D. Phillips. 2001. Middle status conformity: Theo-retical restatement and empirical demonstration in two markets.Amer. J. Sociol. 107 379–429.