Investigating typicality and novelty through visual … Typicality and Novelty through Visual and...
214
Investigating Typicality and Novelty through Visual and Tactile Stimuli MOHD FAIZ YAHAYA Submitted in partial fulfilment of the requirements of the Degree of Doctor of Philosophy Faculty of Design Swinburne University of Technology, Melbourne 2017
Transcript of Investigating typicality and novelty through visual … Typicality and Novelty through Visual and...
Investigating Typicality and Novelty through Visual and Tactile Stimuli
MOHD FAIZ YAHAYA
Submitted in partial fulfilment of the requirements of the
Degree of Doctor of Philosophy
Faculty of Design
Swinburne University of Technology, Melbourne
2017

A B S T R A C T
ABSTRACT
Following its long history as a branch of philosophy, a breakthrough occurred in
aesthetics in 1876 when Fechner, a physicist, introduced empirical methods. These gave
rise to experimental aesthetics as a branch of experimental psychology. The current
research is framed within this field, and represents part of Project UMA (Unified Model
of Aesthetics), a five-year collaboration involving the universities of Cambridge, Delft,
Swinburne, and Vienna.
The overall aim of the current research is to understand the role of two key cognitive
variables in aesthetics, typicality and novelty, in predicting affective responses (like-
dislike) to designed products. The specific aim is to understand this relationship for two
sensory modalities, the visual and the tactile. The research questions therefore are: (1) Do
the laws that pertain to the visual also pertain to the tactile? (2) How do these two sensory
modalities interact? For example, how does high typicality in one sensory modality
interact with high novelty in the other modality?
In order to investigate this, designed stimuli varying systematically in both typicality and
novelty were needed. To avoid gender and prestige associations the stimuli selected were
neutral: computer mouse and toothbrush. Ten different versions of each were constructed
that seemed to vary in both typicality and novelty. Furthermore, these stimuli were
constructed as two-dimensional visual stimuli and as three-dimensional tactile stimuli.
To test that these stimuli varied in typicality and novelty, Experiment 1 was conducted
with 30 non-designer participants and Likert scales measuring typicality, novelty, and

ii
affective response (like-dislike). Its primary aim was to identify the extremes of typicality
and novelty for each stimulus set in both visual and tactile modalities. This enabled a new
and systematically controlled set of stimuli to be constructed for use in Experiment 2 to
answer the research questions. A secondary though important aim was to verify that
typicality and novelty did predict affective responses for both sensory modalities.
Experiment 1 was successful in achieving both aims. Typicality and novelty varied
considerably for each modality, and both were found to predict affective responses in
each sensory modality. Using three-dimensional stimuli, Experiment 2 obtained results
that largely corresponded to this obtained in Experiment 1. Interestingly, while typicality
played a more dominant role than novelty in predicting affective responses, as previous
research would indicate for the visual, it was even more dominant for the tactile. This
suggests an evolutionary cause: distal stimuli (visual) can tolerate novelty (or risk) while
proximal stimuli (tactile) are risk averse. After all, if you can see the lion you can escape,
but if you can touch the lion there is no escape.

A C K N O W L E D G E M E N T
iii
ACKNOWLEDGEMENT
Firstly, I would like to thank God for His mercifulness that allow me to finish this thesis.
My special thanks to my parents Hajjah Puzia and Haji Yahaya for their cares, prays and
supports throughout this whole journey. Also, my thanks and loves goes to Norhayati,
Nur Qistina Alisya, Qais Adam Qhusyairi and the new born Ayden Baihaqi, my wife,
daughter and sons for their patient, understanding, entertainment and sacrifice. My
deepest gratitude and respect goes to the core person for this research, my principal
supervisor Dr Anne Prince. Her continuous support and contributed knowledges has
guided me to the completion of this thesis. Thank you for believing in me. Also, my
special recognition must go to the ‘architect’ for this research, my associate supervisor
Prof. T.W. Allan Whitfield. His support and contribution in this research is way beyond
the completion. Thank you for giving me this lifetime opportunity. My thanks as well go
to all the people who never stop to encourage, motivate and help me until today. There
are my relatives, friends, teachers, academic and non-academic staff at Swinburne
University of Technology. Finally, I would like thanks Universiti Putra Malaysia and the
Ministry of Higher Education Malaysia for the scholarship and this precious opportunity.

D E C L A R A T I O N
iv
SIGNED DECLARATION
This thesis contains no material which has been accepted for award of any other degree
or diploma, except where due to reference is made in the text of the thesis. To the best of
my knowledge, this thesis contains no material previous published or written by another
person except where due references is made in the text of the thesis.
Signed:
Dated: 28 September 2017
v
TABLE OF CONTENTS
ABSTRACT ................................................................................................................. i
ACKNOWLEDGEMENT .............................................................................................. iii
SIGNED DECLARATION ............................................................................................. iv
TABLE OF CONTENTS ................................................................................................. v
LIST OF FIGURES ...................................................................................................... ix
LIST OF TABLES ....................................................................................................... xii
1. INTRODUCTION. .............................................................................................. 14
1.1. Aesthetics ......................................................................................................... 14
1.2. Project UMA ..................................................................................................... 15
1.3. Research Significance ........................................................................................ 17
1.4. Practical Significance ......................................................................................... 18
1.5. Research Question. ........................................................................................... 19
2. LITERATURE REVIEW. ...................................................................................... 20
2.1. Introduction. ..................................................................................................... 20
2.2. Cognitive Aesthetics .......................................................................................... 21
2.3. Typicality and Novelty. ...................................................................................... 26
2.4. Aesthetics and Consumer Liking for Products ..................................................... 29
2.5. Multisensory Aesthetics. ................................................................................... 33

vi
2.6. Processes and Procedures. ................................................................................ 37
2.7. Conclusion. ....................................................................................................... 45
3. METHODS: EXPERIMENT 1. .............................................................................. 49
3.1. Introduction. ..................................................................................................... 49
3.1.1. Multisensory Aesthetics Studies. ...................................................................... 51
3.1.2. Touch and Vision Variables. .............................................................................. 52
3.1.3. Stimuli. .............................................................................................................. 55
3.1.4. Preliminary Studies. .......................................................................................... 56
3.1.5. Scales and Analysis. .......................................................................................... 57
3.1.6. Considerations .................................................................................................. 57
3.2. Experiment 1. ................................................................................................... 60
3.2.1. Participants. ...................................................................................................... 62
3.2.2. Stimuli. .............................................................................................................. 67
3.2.3. Procedures. ....................................................................................................... 79
3.3. Result. .............................................................................................................. 84
3.3.1. Toothbrush: Visual ............................................................................................ 86
3.3.2. Toothbrush: Tactile ........................................................................................... 88
3.3.3. Computer Mouse: Visual .................................................................................. 90
3.3.4. Computer Mouse: Tactile ................................................................................. 92
3.3.5. Aesthetics Affective Likings............................................................................... 94
3.3.5.1. Toothbrush: Visual and Tactile ......................................................................... 94
3.3.5.2. Computer Mouse: Visual and Tactile ................................................................ 95
3.4. Discussion. ........................................................................................................ 96
4. METHODS: EXPERIMENT 2. ............................................................................ 100
4.1. Introduction. ................................................................................................... 100

vii
4.2. Participants ..................................................................................................... 100
4.3. Stimuli. ........................................................................................................... 103
4.3.1. Combinations. ................................................................................................. 109
4.3.2. Repetition of Combinations. ........................................................................... 117
4.3.3. Stimuli Fabrication Process. ............................................................................ 118
4.4. Procedures. ..................................................................................................... 121
4.5. Results and Analysis ........................................................................................ 124
4.5.1. Mixed Models ANOVA (Toothbrush). ............................................................. 125
4.5.2. Liking. .............................................................................................................. 129
4.5.3. Mixed models ANOVA (Computer Mouse) ..................................................... 129
4.5.4. Liking. .............................................................................................................. 133
4.5.5. MDS (Multi-Dimensional Scaling) Toothbrush................................................ 134
4.5.6. MDS (Multi-Dimensional Scaling) Computer Mouse ...................................... 138
4.5.7. Correlation Analysis. ....................................................................................... 142
4.5.7.1. Toothbrush...................................................................................................... 142
4.5.7.2. Computer Mouse. ........................................................................................... 143
4.6. Discussion. ...................................................................................................... 144
5. DISCUSSION AND CONCLUSION. .................................................................... 147
5.1. Introduction. ................................................................................................... 147
5.2. Typicality and Novelty. .................................................................................... 148
5.3. Visual and Tactile. ........................................................................................... 150
5.4. Suggestions for Future Research. ..................................................................... 151
BIBLIOGRAPHY. .................................................................................................... 153
APPENDIX. ............................................................................................................ 159
viii
A. LETTER OF ENDORSEMENT (UMA RESEARCHER). .................................................. 160
B. RESEARCH ETHICS APPLICATION. ......................................................................... 161
i. APPLICATION FORM. ............................................................................................... 161
ii. ETHICS APPROVAL. .................................................................................................. 176
iii. AMENDMENTS. ........................................................................................................ 178
C. STUDY LOCATION PERMISSION REQUEST. ............................................................ 180
i. APPLICATION LETTER. .............................................................................................. 180
ii. PERMISSSION. .......................................................................................................... 182
D. EXPERIMENT 1. ................................................................................................... 183
i. CONSENT INFORMATION STATEMENT .................................................................... 183
ii. DISCLOSURE AND CONSENT FORM. ........................................................................ 186
E. EXPERIMENT 1 QUESTION AND SCALE. ................................................................ 187
i. EXPERIMENT 1 TOOTHBRUSH (VISUAL)SCALE. ....................................................... 187
ii. EXPERIMENT 1 COMPUTER MOUSE (VISUAL) SCALE. ............................................. 192
iii. EXPERIMENT 1 TACTILE TEST SCALE (TOOTHBRUSH). ............................................. 198
iv. EXPERIMENT 1 TACTILE TEST SCALE (COMPUTER MOUSE). ................................... 201
F. EXPERIMENT 2. ................................................................................................... 204
i. EXPERIMENT 2 CONSENT INFORMATION STATEMENT. .......................................... 204
ii. DISCLOSURE AND CONSENT FORM. ........................................................................ 207
iii. EXPERIMENT 1 TACTILE TEST SCALE (TOOTHBRUSH & COMPUTER MOUSE). ........ 208
Publications Arising From This Thesis. ................................................................... 213

ix
LIST OF FIGURES
FIGURE 1.1. PROJECT UMA MODEL ................................................................................................................... 15
FIGURE 2.1 RESEARCH BASIC STRUCTURE. ....................................................................................................... 21
FIGURE 3.1 STRUCTURAL FRAMEWORK FOR THE PRESENT RESEARCH. ........................................................... 50
FIGURE 3.2 TYPICALITY AND NOVELTY. ............................................................................................................. 51
FIGURE 3.3 RESEARCH FRAMEWORK. ............................................................................................................... 60
FIGURE 3.4 PARTICIPANT RECRUITMENT POSTER PROPOSALS. ....................................................................... 64
FIGURE 3.5 INVITATION POSTER AND LIST OF REGISTERED PARTICIPANTS. .................................................... 66
FIGURE 3.6 STIMULI SELECTION CRITERIA. ....................................................................................................... 68
FIGURE 3.7 PRODUCTS PROPOSED. .................................................................................................................. 69
FIGURE 3.8 PRODUCT POST-MORTEM. ............................................................................................................. 70
FIGURE 3.9 SELECTED PRODUCTS WITH DIFFERENT ATTRIBUTES (COLOURS AND TEXTURES). ....................... 71
FIGURE 3.10 SELECTED VARIABLES. .................................................................................................................. 72
FIGURE 3.11 VISUAL ASSESSMENT SCALES. ...................................................................................................... 74
FIGURE 3.12 THE MOST TYPICAL SHAPE USING ADOBE PHOTOSHOP ‘SMART OBJECTS’ FUNCTION. .............. 75
FIGURE 3.13 SOME OF THE MATERIALS. ........................................................................................................... 76
FIGURE 3.14 DEMOGRAPHIC QUESTIONS IN SECTION 1. .................................................................................. 80
FIGURE 3.15 TACTILE ASSESSMENT. .................................................................................................................. 82
FIGURE 3.16 EXPERIMENT 1(PRELIMINARY) (N=31). ........................................................................................ 83
FIGURE 3.17 TOOTHBRUSH: MEAN TYPICALITY VISUAL ASSESSMENT. ............................................................ 86
FIGURE 3.18 TOOTHBRUSH: MEAN NOVELTY VISUAL ASSESSMENT. ............................................................... 87
FIGURE 3.19 TOOTHBRUSH: MEAN TYPICALITY TACTILE ASSESSMENT. ........................................................... 88

x
FIGURE 3.20 TOOTHBRUSH: MEAN NOVELTY TACTILE ASSESSMENT. .............................................................. 89
FIGURE 3.21 COMPUTER MOUSE: MEAN TYPICALITY VISUAL ASSESSMENT. ................................................... 90
FIGURE 3.22 COMPUTER MOUSE: MEAN NOVELTY VISUAL ASSESSMENT. ...................................................... 91
FIGURE 3.23 COMPUTER MOUSE: MEAN TYPICALITY TACTILE ASSESSMENT. .................................................. 92
FIGURE 3.24 COMPUTER MOUSE: MEAN NOVELTY TACTILE ASSESSMENT. ..................................................... 93
FIGURE 4.1 EXPERIMENT 2 RECRUITMENT POSTER. ....................................................................................... 102
FIGURE 4.2 OUTPUT FROM EXPERIMENT 1. ................................................................................................... 103
FIGURE 4.3 VISUAL AND TACTILE COMBINATIONS. ........................................................................................ 105
FIGURE 4.4 CNC 3D PRINTING PROCESS.......................................................................................................... 119
FIGURE 4.5 TEXTURES. .................................................................................................................................... 120
FIGURE 4.6 EXAMPLE OF TEXTURE CREATION. ............................................................................................... 120
FIGURE 4.7 EXPERIMENT 2 STIMULI ASSESSMENT. ........................................................................................ 121
FIGURE 4.8 EXPERIMENT 2 (N=50) .................................................................................................................. 123
FIGURE 4.9 TOOTHBRUSH: MEAN TYPICALITY. ............................................................................................... 126
FIGURE 4.10 TOOTHBRUSH: MEAN NOVELTY. ................................................................................................ 127
FIGURE 4.11 TOOTHBRUSH: MEAN LIKING. .................................................................................................... 128
FIGURE 4.12 COMPUTER MOUSE: MEAN TYPICALITY. .................................................................................... 130
FIGURE 4.13 COMPUTER MOUSE: MEAN NOVELTY. ....................................................................................... 131
FIGURE 4.14 COMPUTER MOUSE: MEAN LIKING. ........................................................................................... 132
FIGURE 4.15 TOOTHBRUSH COMMON SPACE 2 DIMENSION. ........................................................................ 135
FIGURE 4.16 TOOTHBRUSH COMMON SPACE 1 DIMENSION. ........................................................................ 137
FIGURE 4.17 COMPUTER MOUSE COMMON SPACE 2 DIMENSION. ............................................................... 139
FIGURE 4.18 TOOTHBRUSH COMMON SPACE 1 DIMENSION. ........................................................................ 141
FIGURE 4.19 THE ROLE OF VISUAL VERSUS THE TACTILE (TOOTHBRUSH). ..................................................... 145
FIGURE 4.20 THE ROLE OF VISUAL VERSUS THE TACTILE (COMPUTER MOUSE)............................................. 145

xi

xii
LIST OF TABLES
TABLE 3.1 TOUCH AND VISION VARIABLES ....................................................................................................... 52
TABLE 3.2 STANDARD INTERACTION BETWEEN PARTICIPANT AND STIMULI. .................................................. 53
TABLE 3.3 POSSIBLE CONDITIONS. .................................................................................................................... 54
TABLE 3.4 NUMBERS OF STIMULI...................................................................................................................... 73
TABLE 3.5 SAMPLE OF VARIANTS FOR EACH OF THE ASSESSMENT. ................................................................. 78
TABLE 3.6 QUESTIONNAIRES. ............................................................................................................................ 81
TABLE 3.7 TOOTHBRUSH VISUAL AND TACTILE SETS. ....................................................................................... 85
TABLE 3.8 TOOTHBRUSH VISUAL. ..................................................................................................................... 94
TABLE 3.9 TOOTHBRUSH TACTILE. .................................................................................................................... 95
TABLE 3.10 COMPUTER MOUSE VISUAL. .......................................................................................................... 95
TABLE 3.11 COMPUTER MOUSE TACTILE. ......................................................................................................... 96
TABLE 4.1 STIMULI (TOOTHBRUSH): VISUAL AND TACTILE COMBINATIONS. ................................................. 107
TABLE 4.2 STIMULI (COMPUTER MOUSE): VISUAL AND TACTILE COMBINATIONS......................................... 108
TABLE.4.3 COMBINATION 1 ............................................................................................................................ 109
TABLE.4.4 COMBINATION 2. ........................................................................................................................... 110
TABLE 4.5 COMBINATION 3............................................................................................................................. 111
TABLE 4.6 COMBINATION 4............................................................................................................................. 112
TABLE 4.7 COMBINATION 5............................................................................................................................. 113
TABLE 4.8 COMBINATION 6............................................................................................................................. 114
TABLE 4.9 COMBINATION 7............................................................................................................................. 115

xiii
TABLE 4.10 COMBINATION 8........................................................................................................................... 116
TABLE 4.11 COMBINATION 9........................................................................................................................... 117
TABLE 4.12 STIMULI TESTING SEQUENCES (TOOTHBRUSH). .......................................................................... 124
TABLE 4.13 STIMULI TESTING SEQUENCES (COMPUTER MOUSE). ................................................................. 125
TABLE 4.14 FIXED EFFECTS TOOTHBRUSH. ..................................................................................................... 129
TABLE.4.15 FIXED EFFECTS COMPUTER MOUSE. ............................................................................................ 133
TABLE 4.16 TOOTHBRUSH MDS 2 DIMENSION STRESS AND FIT MEASURES. ................................................. 134
TABLE.4.17 TOOTHBRUSH MDS 1 DIMENSION STRESS AND FIT MEASURES. ................................................. 136
TABLE 4.18 TOOTHBRUSH MDS 2 DIMENSION STRESS AND FIT MEASURES. ................................................. 138
TABLE 4.19 . TOOTHBRUSH MDS 1 DIMENSION STRESS AND FIT MEASURES. ............................................... 140
TABLE 4.20 TOOTHBRUSH PEARSON CORRELATION ANALYSIS. ..................................................................... 142
TABLE 4.21 COMPUTER MOUSE PEARSON CORRELATION ANALYSIS. ............................................................ 143

C H A P T E R 1
14
1. INTRODUCTION.
1.1. Aesthetics
Aesthetics has a long and contentious history going back to Plato and Aristotle. During its
first 3000 years, it lay firmly within the domain of philosophy. In addition to Plato and
Aristotle, such notables as Kant (1790), Schiller (1795) and Hegel (1835) sought to unravel
its central question, namely, the nature of beauty. Using observation and deductive reasoning
they advanced various explanatory theories. Perhaps, inevitably, it entered the curriculum of
philosophy courses in universities and became a branch of philosophy. Unfortunately,
deduction has its limitations and philosophy failed to answer its central question. As the
philosopher Sparshott (1963) so cruelly observed, aesthetics is the most despised area of
philosophy.
A transformation occurred in 1876 when Fechner, a physicist, contrasted what he called
“aesthetics from above” based on deduction to what he called “aesthetics from below” based
on induction. Fechner introduced four methods for investigation of aesthetics, one of which
has dominated subsequent research, the method of ‘choice’ (Fechner, 1876). In this method,
participants in experiments indicate their reaction to stimuli by ticking a box, verbalising
their choice, placing it in rank or, as has become most common, positioning it in a rating

15
scale. The latter became the dominant form of ‘choice’ during the 20th century and remains
so. Fechner’s transformation provided a new set of methods for investigating questions of
aesthetics, and also psychophysics (Fechner, 1948), placing reliance on empirical evidence,
and so ushered in the nascent field of experimental psychology, with the new experimental
aesthetics as one of its branches. The present research is conceived within this field.
1.2. Project UMA
The research is part of Project UMA (Unified Model of Aesthetics) (Appendix A). This is a
five-year international collaboration involving the universities of Cambridge (Engineering),
Delft Industrial Design Engineering), Swinburne (Design), and Vienna (Psychology). Figure
1.1 (below) illustrates the model of Project UMA. Research is divided into three levels. The
first is the perceptual level focusing on such elements as unity and variety; the second, termed
the cognitive, concentrates on typicality and novelty; the third, the social, involves
connectedness and uniqueness i.e. visual expressions of belonging to a group or being
different to that group. Each university has been allocated an area of aesthetics, with
Figure 1.1. Project UMA Model
16
Swinburne having the cognitive. Typicality and novelty are central research areas within the
cognitive. Typicality and novelty, therefore, are central research areas within the present
research, and their roles in determining positive and negative affect.
The theory underlying Project UMA is essentially Darwinian, conceiving of aesthetics as an
evolutionary modern manifestation of a primordial instinct: the balance of safety and risk
(Hekkert, 2006; Whitfield, 2011). Safety lies in the familiar – typicality, unity, and belonging
to a group. Risk lies in the unfamiliar – novelty, variety, and not belonging to a group. While
clear advantages lie with safety, new knowledge comes from exposure to the unfamiliar. In
human evolution early humans were a species with small teeth and small claws, and no match
for a predatory large cat; humans had to rely upon their highly developed cognitive
capabilities (Cila et al.; Whitfield, 2007). Effectively, they had to ‘out-think’ the large cat to
survive.
There is contrary evidence regarding the relationship between typicality and novelty. While
the research described in this thesis strongly supports the position that they are opposing
poles of the same scale, other research ((Hekkert et al., 2003); Thai, 2017) found them to be
independent scales. In both of these studies, liking was best predicted by high typicality in
combination with high novelty. Extending such cognitive capabilities requires exposure to
the unfamiliar, which generates new knowledge. For this reason, safety must be accompanied
by some risk. The trade-off between these two opposing instincts, and how this works, is the
underlying concern of ProjectUMA.

17
1.3. Research Significance
The significance of the research lies in three areas. The first is that it adds to a now growing
body of work focused upon understanding the aesthetics of designed objects. Until the 1970s
the field of experimental aesthetics was dominated by a concern for the aesthetics of art –
and remains so. However, during the 1970s attention was given to some designed objects,
most notably furniture (Whitfield & Slatter, 1979) and the built environment (Kaplan et al.,
1972; Küller, 1972). This has now extended into the aesthetics of a wide range of designed
objects, termed by Whitfield and de Destefani (2011) as mundane aesthetics. This is the
aesthetics of the everyday, of the products we purchase, and contrasts with the more rarefied
aesthetics of art.
Secondly, experimental aesthetics has focused upon the visual, and to a secondary extent, the
aural. This reflects the historic preoccupation with art as manifest in paintings and sculpture,
and music. Only recently has attention been given to the other sense modalities. While the
visual is undoubtedly important in the aesthetics of designed products, the touch and feel of
the product assumes an importance also. For example, a wine glass with a sandpaper-like
texture is probably aesthetically unacceptable, irrespective of its visual appeal. Little is yet
understood about the role of the touch in aesthetics, and its interaction with the visual. This
is the central concern of the present research.
Finally, and directly addressing the second area above, in order to control the visual and the
haptic in the design of stimuli for experimental purposes, it is necessary to make controlled,
three-dimensional products that vary systematically. This would probably be beyond the skill
18
capability of psychologists working in this field. However, this is not beyond the skill
capability of an industrial designer. And the present researcher is an industrial designer.
1.4. Practical Significance
The historic association of aesthetics with art has neglected the vast corpus of everyday
objects that have an aesthetic component. This covers clothing and accessories, furnishings,
cosmetics, and most things that are purchased in shopping malls. This is the domain of
economic interest to both developed and developing countries. Interestingly, the Chinese
government recently introduced a new policy document ‘Made in China: 2025’ (Liu, 2016).
The underlying objective is to increase the value of Chinese manufactured products. In
formulating this policy, the government committee responsible consulted with 150 engineers.
However, there is no evidence of consultation with other groups involved in the design of
manufactured products. Thus, designers appear to have been overlooked, as well as branding
specialists, and marketers. While engineers are an essential part of the product development
process, they represent only part of it. Engineers deal with the ‘hard’ side of products:
designers, branding specialists, and marketers deal with the ‘soft’ side of products. It would
seem self-evident that the myriad of products purchased in shopping malls and department
stores are selected not only because they perform their function well – the hard side – but
also because they look and feel good – the soft side. It is acknowledged that from a scientific
standpoint much more is known about the hard side than is known about the soft side. The
significance of Project UMA is that it addresses this problem and, as in the scientific domain,
adopts a team approach in which individuals investigate components of the underlying
problem.
19
1.5. Research Question.
As indicated, the research focuses upon the cognitive. It seeks to understand multi-sensory
aesthetic appraisal of designed products in which both visual and tactile assessments are
involved. The specific questions asked are: Do the laws that pertain to the visual also pertain
to the tactile? How do these two sensory modalities interact? For example, how does high
typicality in one sensory modality interact with high sensory novelty in the other modality?

C H A P T E R 2
20
2. LITERATURE REVIEW.
2.1. Introduction.
This section presents the relevant literature reviewed for the present research. It starts by
defining the meaning of cognitive aesthetics then continues by justifying the need for
multisensory appraisal in aesthetics assessment and lastly it looks at some of the potential
processes and procedures for this research.
Figure 2.1 presents the conceptual ideas of the proposed research. It suggests aesthetics as a
sensory pleasure, in this research sensory pleasure is define as a positive response aroused
from any of our senses after having an interaction to any kind of object (Cabanac, 1979). By
focusing on the cognitive aspect of aesthetics the research suggests another behaviour that
will assist visual behaviour in discovering new information about aesthetics judgement. This
will not only provide us with information on product appearance but will also give the
opportunity to experience product aesthetics via a different approach.

21
2.2. Cognitive Aesthetics.
Given its long and often contentious history, the quest to understand aesthetics has generated
a voluminous literature. Acknowledging the focus in the present research on two key
components, typicality and novelty, in both visual and tactile modalities, detailed attention
will be given to them. This will provide the foundation for the empirical studies that follow.
However, to provide a historical context, a brief overview will precede this.
In the Western world, the origin of aesthetics lies in Classical Greece where a distinction was
made between noesis – defined as intellectual knowledge (Merriam-Webster's collegiate
dictionary 2017), and aesis – sensory knowledge. As intellectual knowledge is known, and
sensory knowledge is felt, the definition of aesthetics has proved problematic. Also, its
application in different fields yields different nuanced interpretations. Thus, Vitruvius
(Vitruvius, 1998) in Classical Rome, the first author to write about architecture, distinguishes
Figure 2.1 Research Basic Structure.
22
between solid, useful, beautiful or delight. If the Classical Greek version regards aesis-
aesthetics as felt, Vitruvius clearly extends this into an emotion – delight. In his book The
Structure of Aesthetics, Sparshott (1963) neatly illustrates the problem. He lists the three
main definitions of beauty used in the philosophy literature; but then points out that these are
at odds with the actual use of the term – mainly to refer to women and the weather.
A solution – of sorts – occurred in (Baumgarten, 1954) when Baumgarten, a philosopher,
associated aesthetics with the fine arts, and introduced the notion of disinterested aesthetic
pleasure. This distinguishes it from physical and material pleasures, suggesting the need for
a ‘refined’ mind to appreciate it. Baumgarten’s positioning of aesthetics was, and remains,
highly influential. The special status accorded the fine arts had consequences. Repositories
of the fine arts abound – art galleries, opera houses, and concert halls – with audiences of
those who aspire to experience aesthetic pleasure. A further consequence was the
differentiation of the fine arts from functional products. Thus, designed products were
relegated to a lesser position. It is, after all, difficult to talk about the spirituality of a vacuum
cleaner, but much easier to do so about a Beethoven symphony or a Rembrandt portrait.
As indicated in Chapter 1, a transformation occurred with Fechner’s introduction of
inductive, scientific methods. While representing a paradigm shift in method, the underlying
preoccupation with the fine arts remained, as did Baumgarten’s notion of disinterested
aesthetic pleasure. So, while a new set of investigative tools was made available, they were
used to seek answers to the same questions. Furthermore, they were used to look in the same
place for answers, namely, in the external world. A common assumption was that lawfulness

23
existed whereby there were, for example, ideal proportions and harmonious colour
combinations. It was a matter of discovering them. Probably the most prolific area of research
in the first half of the 20th century was in colour. The quest was to demonstrate a universal
order of colour preference and also colour harmony. Ultimately, these failed (Whitfield &
Wiltshire, 1990)
Within the Behaviourist tradition that dominated psychology in the first half of the 20th
century, research attention was given to the components of the sensory experience – colour,
line, shape etc. However, in the 1960s and 1970s Berlyne (1971)framed a different question,
namely, why do people engage with aesthetics? Drawing upon Motivation Theory and early
work on reward and aversion centres in the brain e.g. (Olds & Milner, 1954) he postulated
that intermediate levels of arousal will be pleasurable, while low and high levels will be
aversive. The determinants of arousal level were what he termed ‘collative variables’. These
involved a comparison of previous experience against the experience of the stimuli now
presented. Importantly from the standpoint of the present research, novelty was a key
collative variable, and some experimental support was obtained for it as a determinant of
pleasure at intermediate levels. However, working in the Behaviourist tradition, Berlyne’s
empirical work largely used dot patterns and polygons as stimuli. Real world objects were
just beginning to be used as stimuli by researchers at the end of his career. Berlyne marks a
transition from looking at the external world for answers to looking at the internal world.
After a century of looking out there, perhaps the answers lay in here.

24
Berlyne’s Collative-Motivation Model, as he termed it, provided a plausible psychological
model of aesthetics, and was highly influential. However, with the advent of Cognitivism in
psychology in the 1970s, investigation of the internal world gathered pace. In 1979 Whitfield
and Slatter published results that challenged Berlyne’s position. They found that the extent
to which a stimulus conformed to expectations led to positive affect. Borrowing heavily from
Rosch’s (1977) work on cognitive categorisation, they advanced what they termed a
‘preference for prototypes’ position. Using real world objects – furniture – they found, for
example, that the closer an image of a chair corresponded to the participant’s internal
representation – cognitive prototype - of a chair, the more highly it was evaluated.
Furthermore, this depended upon the cognitive category that they accessed. As such, their
cognitive category for a modern chair had a different prototype to their cognitive category
for a Georgian chair. As will be apparent, this runs completely contrary to Berlyne’s position.
To test novelty against prototypicality as determinants of positive affect, Whitfield (1983)
used similar furniture as stimuli. The results confirmed the dominance of prototypicality,
with no role for novelty. Following from this, numerous studies have demonstrated the key
affective role of prototypicality – later shortened to typicality – in aesthetic responses to a
wide range of objects. These include Whitfield (2011).
The latest manifestation of typicality is in the Processing Fluency Model of aesthetics (Reber
et al., 2004) This posits that we favour stimuli that are easy to process; and as typical, familiar
stimuli are easy to process, so we favour them. From an evolutionary standpoint this is
plausible, given that it is difficult to process stimuli that entail risk. In our ancestral homeland,
the African savannah, speed of processing would be essential to avoid predators. For

25
example, they need food in order to survive but in the same time they must minimize risk to
stay alive. Typical or easy processing directed them to avoid predators by eating the same
food every day, getting the food from the usual places, avoid going to a risky place and doing
risky activity that will expose them to predators. Put more colloquially, slow brains would
be eaten.
While the role of typicality has gone from strength to strength, Berlyne’s seminal work on
collative variables was discontinued. This raises a major problem. If typicality is all-powerful
and novelty is incidental, then how do we account for work in Berlyne’s era that found
support for the role of novelty. More fundamentally, if positive affect is determined entirely
by positive typicality, then there would be no new designs. After all, we would like what we
know. This year’s Paris fashion would be the same as last year’s, and the new BMW would
look like the BMW of 1962. Clearly, this is not so.
Since Fechner's 1876 innovation in the introduction of “aesthetics from above”, most studies
in aesthetics explorations have used a measurable based approach as their method of
investigation (Berlyne, 1970; Gibson, 1962; Moles, 1966). This approach requires surveys,
observations, participants, experiments and fixed analysis. Also known as empirical types of
study, this approach is highly dependent on the generation of quantitative data for output
validation. These kind of studies were designed to look at consumer reactions towards
elements of aesthetics in products used daily, and it appears that aesthetics were not only
perceptible as cosmetic appearance but they also created an emotional connection between
the consumer and the product. Research also showed that consumers preferred products with

26
aesthetics elements that were harmonious between well-experienced and innovative features
(Hekkert et al., 2003; Simonson & Nowlis, 2000; Veryzer Jr & Hutchinson, 1998) .
Specifically, these factors refer to the typicality and novelty aspects of a product. Previous
scholars referred to cognitive aesthetics as a scientific study of beauty (Dion, 1972; Whitfield,
2011) and the focus of the present research is the aspects of familiarity and originality which
are also known as typicality and novelty. Based on the findings from the literature the
following section outlines in detail the meanings of typicality and novelty.
2.3. Typicality and Novelty.
Berlyne’s interest in aesthetics derived from Motivation Theory. Operating within the
Behaviorist tradition, he sought answers to such questions as what motivates people to
engage in aesthetic activities, and what rewards are contingent upon someone liking
something. Early work in neuroscience (Olds & Milner, 1954) provided a foundation with
the discovery of reward and aversion systems in the brain. Borrowing also from Information
Theory (Moles, 1966), he posited that arousal is a key motivator, whereby intermediate levels
of arousal will generate maximum pleasure. Low levels of arousal lead to boredom, while
high levels lead to stress. The class of stimulus attributes that generate arousal he termed
‘collative variables’(Berlyne, 1960b). These involve complex brain processing, and include
novelty, incongruity, and complexity. So, intermediate levels of these collative variables will
generate maximum pleasure to the brain.
As the most comprehensive theory of aesthetics to emerge from psychology, Berlyne’s work
was important (Machotka, 1980; Silvia, 2005b). While it assembled only limited empirical
27
evidence in support of its basic contention, nonetheless it drew attention to a variable that
figures prominently in designed products, namely novelty.
Berlyne's career ended at the onset of the cognitive revolution in psychology. This
reorientated thinking away from supposed laws that were to be found ‘out there’ in the
external environment, such as harmonious laws of colour (Whitfield & Wiltshire, 1990)
towards laws that were ‘in here’ within the brain. Effectively, the answers were to be found
within how the brain makes sense of the world. Following Rosch’s seminal work on
categorization (Rosch, 1975), Whitfield and Slatter found that preference for a stimulus was
mediated by a categorization process, whereby the more prototypic a stimulus was of that
category, the more it was preferred. Termed ‘preference-for-prototypes’, this came to
dominate subsequent research, with prototypicality becoming the dominant predictor of
aesthetic preference (Whitfield, 2000). In lay language, the message was that we like what
we know and can recognise. Acknowledging Berlyne’s work on collative variables,
Whitfield (1983) engineered an experimental confrontation between collative variables and
prototypicality, again using furniture. The results were unequivocal: prototypicality predicted
aesthetic preference, and novelty was incidental. Eventually, prototypicality was redefined
as typicality, and remains the strongest predictor of aesthetic preference to this day.
In the tide of history, Berlyne’s work has been consigned to obscurity. However,
commonsense indicates that Berlyne’s collative variables have a place in aesthetic
preference. After all, if we only prefer what we know, then there will be no changes to the
appearance of any products. We will still have the Ford car styling of 1970, the furniture that

28
grandmother liked 40 years ago, and women will still wear the clothes that their mothers and
grandmothers wore. This is demonstrably untrue, and experiments are not needed to
demonstrate this. It is apparent in the real world, the question remains therefore of how this
strange relationship between typicality and novelty operates. Typicality may be dominant,
but how does novelty come in? How do the two interact?
Within the framework of ProjectUMA, an answer has been hypothesized (Hekkert, 2012;
Whitfield, 2005). This conceives of aesthetics from an evolutionary standpoint, whereby a
conflict plays out between two contrary impulses. One impulse is the need for safety, the
familiar, the known, and is represented by typicality. The other impulse is the need for risk,
the unfamiliar, the unknown, and is represented by novelty. The contention is that while
safety is clearly preferred, without contending with risk then nothing new is learnt and
understood. As a species that specialized in its information processing prowess - as distinct
from large teeth, large claws, and great strength - humans needed to extend their knowledge
in order to survive more effectively. To achieve this extension, they needed to contend with
the unfamiliar in order to make it familiar.
Looked at from a modern day perspective, contending with the unfamiliar - risk, novelty - is
hardly life-threatening. But looked at from a five million year perspective when our distant
ancestors descended from the trees and entered the African savannah, the unfamiliar would
be distinctly life-threatening (Cerling et al., 2011) . The threat would come not only from
predatory animals, and poisonous species (spiders, snakes), but also from dangerous plants,
unfamiliar terrain, and other hominid groups. As we have only very recently achieved a world

29
in which such threats are removed (except for competing hominids) - a few hundred years
against a history of five million years - then the brain’s impulses remain wedded to survival
in a more hostile environment. As such, we favor safety - typicality - against risk; but we
favour some element of risk - novelty - for adaptive purposes. The question is, how these
conflicting impulses interact. This is the fundamental question posed in ProjectUMA.
2.4. Aesthetics and Consumer Liking for Products
The Oxford English Dictionary (2000) defines liking as it is contextualized in this research
as something that fulfils someone’s tastes or needs. In a different context, liking can describe
consumer satisfaction with product design. That is, in order to choose a product we must first
convince our senses that the product appeals to us (Hekkert, 2006; Lubbe, 2004). Aesthetics
is a dominant term in relation to liking, and for aesthetics both meanings of liking appear to
be identical. The main objective for this research is to investigate the role of cognitive
aesthetics (typicality and novelty) in determining consumer liking.
In order to stand out among competitors, new and developed products need to fulfil the
demands of today's consumers. The challenge for designers is to discover the factors that
increase the user liking aspect of a product, and to make product design better. A proven and
highly regarded factor that makes products preferable is the application of aesthetics.
One of the advantages designers possess is the ability to perceive the ways people understand
feelings towards an object or image. In addition, designers somehow understand how to
produce an object that can emotionally touch, attract or to the contrary, repel people (Ho,

30
2010; Norman & Ortony, 2003). These advantages only exist in our brain, and have been
stored there for a long time, based on our past experiences and past references. This speciality
and the complexity of the brain processes towards object preferences are now discoverable
through research, and can be documented and theorised.
Aesthetics appraisal, especially of products, often prioritizes visual appearances. Shapes,
colours and forms have mainly been used as evaluation variables and have been accepted as
first impression factors. Most of the studies on aesthetics judgements have used stimuli to
obtain responses, and these are normally presented in the form of images and photographs
(Mugge & Dahl, 2013; Veryzer Jr & Hutchinson, 1998; Zhao et al., 2009). However, for
some products more than a visual appearance is needed, and studies have shown that it takes
more than one type of modality in order to make a product desirable. As noted, visual
representation has established clear variables for aesthetics appraisal. To understand more
about the aesthetics aspect of product design and appraisal, it is important to use not only a
visual representation but also another variable, which is touch.
With regard to product design, typicality means the tendency to choose familiar or well-
experienced features while novelty refers to something new (Tyagi et al., 2013). This finding
is supported by the work of (Berlyne, 1960a), which showed that novelty refers to something
new that happens in our daily litves. However, any new experiences must be associated with
familiar experiences that might have happened before. In order to determine something new,
we tend to liken it to past experiences. As noted, Berlyne classified the experiences as stimuli,

31
and all past and new stimuli are called collative variables. The main reason for the
classification and categorization of variables is to make the evaluation process easier.
(Whitfield & Slatter, 1979) suggested two furniture selection tasks to demonstrate that
aesthetics responses to stimuli are easier to identify by using a categorization process. The
results showed that there was a gap between the styles of furniture presented, which
established a new, different category. At the same time, they also indicated that there were
many common features between the styles, which broadened the categories. In addition, one
of the furniture styles was measured as the most prototypic by considering the most features
in common with the other members of the category and the least with non-category members.
Furthermore, a second test confirmed that aesthetics preferences reflected categorization and
prototypically.
Additional research by Hekkert et al. (2003) demonstrated that aesthetics preference in
product design was usually influenced by typicality and novelty. Consumers only prefer a
novel design if the novelty does not have a dominant impact on the typicality aspects, and
surprisingly, the most preferable product is the one that has an equal combination of the two
aspects. Even though people find something new interesting, this does not mean that a new
product is going to be the most preferable product. This is mainly because the consumer’s
past experiences have categorized the previous version as the most salient. They need to
identify that the features from the previous product still exist in the new product in order to
accept the new version.

32
A recent study by Blijlevens et al. (2012) found that both typicality and arousal influence
aesthetic appraisal. Two studies were performed, the first demonstrated that typicality has a
‘curvilinear relationship’ with aesthetics appraisal of product design. ‘Curvilinear
relationship’ refers to a product with new features but at the same time one that does not
totally disregard previous features. Also, with regard to the consumer limitations of
knowledge, the arousal aspect is only restricted at the primary reward system, indicating a
direct relationship with aesthetic appraisal. Aesthetically, the newer the features introduced,
the more preferable the products.
(Hekkert, 2012), noted that the tendency to look for something familiar is the best option for
human survival, and means avoiding a potential harmful risk. Repetition of experiences
contributes to easy processing and resulting fluency and this will have a positive impact on
aesthetics judgements towards an object because familiarity will increase liking.
Nevertheless, survival requires more than ease of processing. The evolutions of brain and
desire to discover something original and new have affected our understanding of aesthetics
judgement. Novelty aspects have become one of the necessary criteria to look into and are
different from typicality; the aesthetics pleasures are derived from new and unfamiliar
features. The work of (Mugge & Schoormans, 2012a; Rindova & Petkova, 2007) supports
the view that novel appearance gives an association of high quality, advanced technology
and innovation to a product.
However, further work (Mugge & Schoormans, 2012b) argues that undiscoverable novelty
features will give a negative influence towards the aesthetics judgement for any product.

33
Normally, the risk of disliked novelty is very high, especially to the discontinuous developed
product rather than the continuous. Also, it is often advised that novelty must be moderately
emphasized in a product design in order to make sure the consumer is not affected by any
operational difficulties while assessing the product (Mugge & Dahl, 2013).
The cognitive level of aesthetic pleasure is therefore a tension between familiar and
unfamiliar processes. The tendency to prefer well-controlled situations and the avoidance of
risks equates with typicality. Novelty, on the other hand, refers to an untaught process of risk
taking and the pleasurable feeling after making sense of the new stimuli. Some studies
suggest both of these aspects need to be present in order to achieve positive aesthetic
appraisal. In product design, designers have manipulated aesthetics to attract consumers with
their skills, and this has been done unconsciously without realising the specific factors that
make the design preferable. It will be a considerable advantage to designers if we can
understand how to control aesthetics factors that make a product preferable.
2.5. Multisensory Aesthetics.
Almost the entire body of research in empirical aesthetics has been uni-sensory, with the vast
corpus focusing upon the visual (Li & Chen, 2009; Silvia, 2005a) and secondary strand upon
the aural (Brattico et al., 2011; Brattico et al., 2013). This probably reflects the association
of ‘art’ with paintings and sculpture (the visual) and music (the aural). It is only recently,
after all, that designed objects have been incorporated into this field. As to the dominance of
uni-sensory research, this perhaps reflects the uni-sensory nature of ‘art’: paintings-sculpture
is visual while music is aural, though opera and ballet would qualify as multi-sensory.

34
However, an underlying problem with the multi-sensory within empirical aesthetics research
is that strict experimental control of stimuli is required if participant responses are to be
reliably attributed to controlled features of the stimuli. The capacity to design and construct
such controlled stimuli may be outside the skill set of most psychologists. However, this is
precisely the skill set domain of industrial designers.
In acknowledging an aesthetically pleasing product we need to see a composition of some
familiar and some new features. The admittedly limited evidence indicate that designers have
to make sure that the typical and novel attributes are not too typical or too novel. Recent
research indicates that aesthetics is not confined to visual appearance but is also a sensory
pleasantness (Krishna et al., 2010; Schifferstein & Hekkert, 2011). Aesthetics appraising is
a sophisticated process that requires more than one way of input receiving and processing.
According to Schifferstein and Cleiren (2005)interactions between user and products are
naturally through multiple behaviours such as visualizing, touching, smelling, hearing and
tasting. Therefore, in order to gain more information about the product we have to get more
sensory involvement during user-product interaction (Demattè et al., 2006). The present
research utilizes vision and touch as the modalities to assess product typicality and novelty.
This is discussed in the following sections, which includes a review of literature explaining
the role of multisensory aesthetics and the research justification for the selected senses
employed.
Studies on cognitive aesthetics have tended to use vision and touch as their assessment
behaviour. Schifferstein, (2006) demonstrated that vision was the most dominant sensor

35
modality, but it was then discovered that vision was not the most important sensory modality
during user and product interactions. Most of the time it depends on the type of product and
on the task performed.
Touch is considered as an objectified sensor compared to visual and audio senses, which tend
to appraise any object or condition from far. This is due to its ways of interaction that require
a contact to the skin in order to appraise anything. Touch or tactile sense was selected for the
current research in addition to the visual. According to Spence and Gallace (2011) and
Blijlevens et al. (2012) beauty in touch is a sensation that leads to a different type of aesthetic
experience than the visual. Acknowledged as the first sense to develop, touch remains an
important exploration tool. In the case of product design, touch enables the user to experience
physical aspects of a product which cannot be understood by the visual. Weight, textures,
hardness and roughness are some of the variables that can be attained by using touch (Karana
et al., 2014; Parisi et al., 2017).
Research by Jansson-Boyd (2011) supports the view that input from the tactile sense can be
stronger than from the visual sense when it comes to consumer perceptions. In a review of
research across disciplines, Jansson-Boyd study’s answered a number of important questions
about the need for tactile input. For instance, tactile or touch input was generated from the
stimulation of receptors through the skin from every part of the body, while haptic was the
same type of input but was specifically generated by skin from the hand area. (Schifferstein,
2007) differentiated between touching and being touched. This research categorized the act
of touching as active while being touched was passive. In addition, Hekkert found that

36
compared to visual input, tactile input was very primitive. Hekkert also suggested that users
should be allowed to touch a product before buying. One reason for this was to enable the
user to extract more comprehensive information about the product. Tactile input ultimately
has the capacity to influence user decision-making and possibly to affect consumer loyalty
towards a product. This is important especially for product marketing because once loyalty
to a product has shifted it is difficult to regain.
(Liu et al., 2008) hypothesised that subjective judgement on touch, friction and feel were the
key factors to determine customer preferences. Their study identified touch as having the
intention of getting in contact with a product, while friction or feel were knowingly or
unknowingly having contact between skin and an object's surface. In addition, touch-feel
judgements are made by doing a 'stroke' of a product, made by using the index finger over
the test object in a routine of left and right movements. In this study, Liu et al. also took into
consideration variations of individual fingerprints, skin moisture, angle of the index finger
when touching the specimens, age of the participants and skin hydration.
Karana et al. (2009) focussed on the sensorial properties of the product materials and the
manufacturing process. Sensorial properties refer to physical aspects of the product such as
roughness and transparency, while the process of making means the standard practice of
producing the sensorial properties, for example shaping and polishing. This study argued that
some of the making process may contribute to the creation of product character. Even though
this was not a specific study about touch, it did utilize tactile input to reveal the meanings for
some of the experimented materials. The intention was to support designers to differentiate

37
the meanings of materials. Understanding material characteristics enables designers to
improve their designs by establishing a direct communication with the user. Based on five
predominantly different meanings suggested from a previous study, participants were asked
to convey the meanings of five different self-selected products. Tactile input such as pressure,
force, friction and temperature were exploited to gather a number of product meanings such
as softness, weight, roughness and even warmth. Participants then rated a visual
representation based on five-point rating scales. Both qualitative and quantitative data
analyses were performed.
2.6. Processes and Procedures.
Aesthetics measuring typically requires inducements as inputs and responses as outputs. The
following section discusses the procedures carried out in previous related studies. Spence and
Gallace (2011) looked at studies on the cognitive and neural correlates of aesthetic judgments
that had been carried out using visual as well as tactile evaluations of artworks. Looking first
at artworks from an artist’s point of view, the aesthetics judgements specifically used both
visual and touch senses as the method of appraisal. In order to look at the similarities between
visual and tactile aesthetics a second experiment attempted to demonstrate the possible neural
correlates with the aesthetics of touch. Results showed that although visual and tactile
aesthetics had many things in common, there were also significant differences, Tactile was
more intimate, primitive and closer to the appraiser, and provided better appraisal than the
visual aesthetics.

38
Today's consumer generally has two ways of purchasing a product. One is by visiting a store
in person and the other is to shop for online products (McCabe & Nowlis, 2003). The
difference between these two ways of purchasing is that the consumer can experience
physical attachment or evaluation if they prefer to come to the store. If they prefer to shop
online, the will only manage to judge the product visually. The purpose of McCabe &
Nowlis’s (2003) research was twofold. First, to understand why consumers needed to have a
physical attachment or touch a product before buying it, and second, to identify types of
products preferred by consumers for each of the buying approaches. They first looked into
decision-making made by consumers based on two factors, real products or descriptions of
the products. Participants rated two categories of stimuli. The first was termed materials
products and encompassed two everyday objects, a bath towel and a carpet. The second was
termed geometric products and consisted of another two everyday products different in their
physicality compared to the first category. Using vision and touch as the assessment
behaviours; sizes, shapes and colours were used as the visual variables while softness and
smoothness, weight, temperatures and pleasantness were used for tactile variables. However,
the variables for tactile assessment were presented by using written descriptions instead of
having real products.
Research by Peck and Childers (2006) involved evaluation in two types of settings, in store
and in front of a computer screen. Using purchasing descriptive signs as independent
variables, they identified the connection between point-of-purchase and the product. In a
study by (Wastiels et al., 2013) participants evaluated a list of stimuli (materials) based on
three different sensory conditions of vision, tactile and general (both). Each of the conditions

39
was given a related aspect such as gloss (visual), warmth (tactile), lively (general).
Participants then associated the stimuli verbally (keywords). The stimuli consisted of six
building materials; each fixed in white 0.4m x 0.4m mdf casing and mounted on an indoor
wall at eye level height. Using a 9-point scale, the evaluation of the stimuli was conducted
based on a list of 13 attribute pairs. Interaction between participants and samples was carried
out according to proposed sensory test conditions. For vision, participants were not allowed
to touch and had to keep a distance from the stimuli. Tactile evaluation required participants
to touch the stimuli without looking at them. For the general assessment participants
interacted freely with the stimuli using both visual and tactile senses. In a second part of this
study participants were given three written keywords while interacting with the stimuli.
Evidence from this study was that selection of materials for buildings should consider both
visual and tactile aspects. The findings showed that by using touch, people associated a
material precisely with its physical characteristics. Vision, on the other hand, tended to guide
people to evaluate and interpret a material based on their personal experiences.
A study by Lindberg et al. (2013) explored peoples' perceptions and associations of wood-
based materials, including wood composite materials. Stimuli selected were samples of nine
solid wood and wood-composites chosen from the most common wood-types for interior and
furniture design, presented in 16 cm width X 6 cm heights X 2cm thickness size. Respondents
evaluated the stimuli by using relevant word descriptions. Ten descriptive words were
divided into two categories, perceptual and cognitive. Respondents assessed each of the
materials by using their hands with their eyes covered and their ears blocked. A soft pad was
used as a platform for the stimuli to avoid the sound of knocking and vibrations. As
40
respondents were assessing the samples, the ten descriptive words were read to them through
a hearing protection device. Respondents rated each sample based on a 7-point scale from
not at all associated to strongly associated. The findings demonstrated that the tactile aspect
of materials selection plays a significant role in furniture and interior design.
A later study by Essick (2010) stressed that the pleasantness of tactile stimulation is very
important in our lives. The study obtained ratings of pleasantness from the sense of touch
across the skin of multiple body parts from two separate experiments. To make sure that the
exposure of stimuli against the skin was of consistent pressure or force, a new stimulator was
developed, known as RTS (Rotary Tactile Stimulator). Four stimuli were used in both
experiments. In the first experiment only one body site was exposed to the stimuli. For the
second, five body sites were exposed. To ensure that touch was the only sense used in this
assessment, participants were prevented from looking at the stimuli and were also provided
with an earplug to avoid any distraction of noise. The findings confirmed that any smooth
type of stimuli will give a pleasant feeling when touched. Further research was suggested to
investigate the possible differences between male and female skin.
In three different studies carried out by (Hekkert et al., 2003), a selection of stimuli in the
form of consumer product images was used. Each of the studies tested the hypothesis that
both typicality and novelty are needed in order to appraise aesthetics. In the first study,
stimuli were categorized according to the importance of their aesthetics appeal. This was to
identify the relationship between consumer products with typicality, novelty and aesthetic
preferences. The second study confirmed the results of the first and also investigated the
41
possibilities of having different judgments of aesthetics between experts and non-experts.
Aesthetics experts referred to someone with in-depth knowledge of a particular product,
while non-expert referred to a person with no specialist knowledge. The second study also
proposed that experts would pay much more attention to novelty aspects of a product than
non-experts. Twenty medium-sized car images were selected as the stimuli because it is
easier to identify a gap between someone with car interests (expert) and the usual consumer
(non-expert). The third study focused more on the typicality aspect of the selected stimuli
and observed only one category of stimuli instead of three. The study looked at the similarity
factor that is known as the basic component of typicality. The stimuli evaluated in this study
were images of a telephone. Using 9-point rating scale, respondents evaluated whether or not
the aesthetic appeal was important for the selected products. The typicality aspect was judged
on a scale of poor example - good example, the novelty aspect by not original – original and
aesthetics preferences by ugly – beautiful.
Research by Mugge and Schoormans. (2012a) found that consumers tended to associate any
new product features with the development of new technology, and most of the time this had
a negative impact on the product’s usability, especially for consumers who had already had
a past experience with the product. In particular, this research manipulated the level of
novelty using low vs. high indication towards the selected stimuli by changing their basic
properties. The attractiveness aspect of the stimuli was made using images of washing
machines. Along with the stimuli, a standard product specification was also presented to
participants for the usability evaluation. Participants reactions to the level of novelty
proposed were studied. Colour was used purposely to manipulate the stimuli because colour

42
is acknowledged as the simplest way to modify a novel product appearance. Usually, if we
refer to our past experience with this product, white is the typical colour of washing
machines. To investigate the influence of novel product appearances, pictures of digital
cameras were used as the stimuli. The focus of the study was the usability aspect of the
product. In contrast to the first study, shape was used as the novelty manipulator for the
stimuli. This was based on prior theorizing that variation in shape has a dominant novelty
impact on the design of a product. Again, participants were presented with two images of
stimuli (digital cameras), with one of the stimuli altered to indicate low or high levels of
novelty. A standard product specification was also presented for usability evaluation. This
study used a self-report scale to identify product expertise, similar to the method reported by
Hekkert et al. (2003).
In contrast, Blijlevens et al. (2011)concluded that typical products are more aesthetically
pleasing when presented in a new context. An image of two identical three-dimensional apple
juice packages was selected as the stimuli. The typical stimuli referred to a common and
well-known apple juice packaging whereas atypical stimuli were represented by the same
identical packaging but in a different shape.
A pre-test showed that the recognisable was perceived as more typical than the altered
packaging. Context was created by using various images of products and packages divided
into two categories. The first represented a typical product, which consisted of a familiar
product, while the second category represents an atypical product that consisted of an
upgraded version of the same familiar product. As expected, the context with the unfamiliar
43
product list was measured as less typical. The inclusion of the developed context was based
on prior research showing that repeated evaluation (RET) can provide a benchmark for
comparison. The second study used the constant approach but with different stimuli. Stimuli
for this study were a 3-D digital colour package of water bottles. Participants evaluated two
mineral water bottles, one of which had been modified. Everything was identical apart from
the shape of the bottles. To prevent participants from being influenced by the brand, the labels
were removed. Context was created by using landscape images; in this case the European
Alps were used as the image for the typical context because the participants were all
European. For an atypical context a non-European landscape image was used. Four
possibilities for water bottle advertisements were presented to participants, comprising
typical stimuli with typical context, atypical stimuli with an atypical context, typical stimuli
with an atypical context and atypical stimuli with a typical context. Statistical analyses
showed that a context-typicality approach influenced perceived typicality and aesthetic
appraisal of a typical product appearance, but not an atypical.
Whitfield and Slatter (1979) assembled images of three supposedly distinct types of furniture,
Modern, Georgian, and Art Nouveau. Each style set was matched on terms of type of
furniture (tables, chairs, etc), orientation, size of image, and with backgrounds removed.
Participants were set the task of furnishing a room which contained furniture from each style.
Thus, one condition contained Modern furniture, one contained Georgian furniture, and one
contained Art Nouveau furniture. As expected, participants added Modern furniture to the
Modern condition, and Georgian furniture to the Georgian condition, but unexpectedly added
Georgian furniture to the Art Nouveau condition. Further testing indicated that the
44
participants (civil servants) did not see the furniture as consisting of three styles, but rather
of two styles, Modern and Traditional. They placed both Georgian and Art Nouveau in the
Traditional category, with Georgian as more typical and Art Nouveau as least. Effectively,
they saw Art Nouveau as poor examples of Traditional, and judged them the least pleasing.
In a further study Whitfield (1983) using the same stimuli, the famous Art Nouveau chair by
Charles Rennie Macintosh, so beloved of designers, was the least liked by participants (civil
servants).
A discussed previously, Mugge and Schoormans. (2012a) used a three-dimensional colour
digital model of a washing machine and a single-lens reflex camera as stimuli for their study.
Using colour as the manipulator, the study hypothesized that novel appearance affects the
perceived performance quality of the product. White has been indicated as the lowest level
of novelty for washing machines and the highest-level of novelty for single-lens cameras,
and vice versa for the black. In this study, five versions of the same product were created for
each of the stimuli and these five new versions were presented in three different shades of
grey. Participants appraised novelty, performance quality and attractiveness of the stimuli.
Acknowledging the principal of ‘What is beautiful is good’ the study included novelty as an
additional variable that focussed on quality and performance by referring only to the
appearance of the product. In addition, this study also replicated experiments carried out by
Mugge and Schoormans (2012b) and the results were the same. In this experiment, two
identical images of washing machines were used, one in white indicating low novelty and
the other in black indicating high novelty. Both novelty and usability were measured using

45
three seven-point rating scales and a self-report scale, which is the same method used by
Hekkert et al. (2003).
2.7. Conclusion.
Two distinct trends are discernible in the literature. The first is the embrace of designed
objects as stimuli, and by implication the acceptance of designed objects as a legitimate area
of investigation. The second - and undoubtedly driven by the first - is the recognition that
designed objects are more than simply visual. The multisensory therefore becomes a
legitimate area of investigation.
As indicated in Chapter 1, research in aesthetics has largely focused upon the visual with its
preeminent concern being the understanding of art. Given the sway held by Behaviourism
during the first three-quarters of the 20th century, attempts to unravel this employed
essentially disembodied stimuli, favourites being dot patterns, random polygons, and colour
chips. The thinking was that by understanding the aesthetic performance of these ‘building
blocks’, then these could be eventually combined to understand more complex forms such as
paintings. The weakness of this position was revealed with the advent of Cognitivism, namely
that the brain responds to composites of these building blocks, and not to each block in
isolation. Composites led to the use of more ‘real world’ stimuli in the 1970s, with one of the
earliest being furniture (Whitfield & Slatter, 1979).
With the emergence of empirical design research in the 1960s, interest in design as a source
of aesthetic experience combined with Cognitivism provided another channel for research

46
into aesthetics. While not replacing art’s preeminence, nonetheless the growth of research
into designed objects intensified, as indicated in this chapter. Given the often practical nature
of designed objects, attention was given to the other dimensions of product performance in
interaction with aesthetics. Thus perceived usability came to the fore. While not reviewed in
this chapter, researchers in the field of Information Technology found that the aesthetic
appearance of an ATM machine layout influenced its perceived usability (Tractinsky, 1997),
information value, and trust. In Information Technology application, aesthetics seems to
provide a halo effect. Effectively, if it looked good, it was good. A seminal paper by
Tractinsky et al. (2000) neatly expresses this: “Beautiful is Useable”. This mirrors research
in social psychology of a halo effect in which good looking people are seen as ‘good’:
“Beautiful is Good” (Lemay et al., 2010). So, a pleasing appearance appears to predispose us
to a positive response to the performance of a designed object, including to humans.
While acknowledging the expansion of research in this field to now include design and the
multisensory, this expansion poses a number of challenges as reflected in the literature. The
first and undoubtedly the most difficult is the stimuli that represent designed objects. Ideally,
these would be ‘real’ three-dimensional designed objects that participants can see and, to
engage the tactile sense, can touch and hold in the hand. Most of the stimuli used in the
literature reviewed were digital, visual representations, and, where the tactile sense was
engaged, were material surfaces, such as wood grain. ‘Real’ designed objects are notable by
their absence. This is perhaps unsurprising given that most of the researchers reviewed are
from the social sciences and will lack the skills required to make highly controlled ‘real’
designed objects. This same pattern was apparent during Behaviourism where which

47
psychologists relied upon stimuli that they could not only control, but also make - dot patterns
and random polygons - or quite simply purchase - colour chips.
The second problem stems directly from the above. If the visual and the tactile are to be
investigated in tandem for designed objects, then ‘real’ three-dimensional designed objects
would facilitate this. Without such controlled designed objects as stimuli, investigating the
contribution of both senses and their interaction on aesthetic responses would be
compromised. This would impact heavily on, for example, understanding the contributions
of typicality and novelty on aesthetic responses. What weight would typicality have in the
visual against typicality in the tactile? Would high novelty in the visual be neutralized by
high typicality in the tactile? Given the historic focus on the visual, what weight would the
tactile have relative to the visual?
Given the above, the empirical studies that are described in the following two chapters seek
to address what appears as the fundamental weakness in this field, namely, the need for highly
controlled, ‘real’ three-dimensional designed objects as stimuli. As will be described, these
stimuli are designed to vary systematically in typicality and novelty for both the visual and
the tactile senses.

48
C H A P T E R 3
49
3. METHODS: EXPERIMENT 1.
3.1. Introduction.
This chapter discusses in detail the approaches taken, justifying the procedures used and steps
required in order to complete the first experiment for this research. As part of project UMA,
aesthetics appraisal for this research concentrated on the elements of typicality and novelty.
Multi-sensory assessment was then applied to help justify the features in product design
identified as the most preferable. The discussion starts with the information about the
participants, it then continues with the explanations of the development of the stimuli. Next,
the chapter describes the procedures taken to run the experiment. Lastly, the outputs of the
experiment are presented in the results and analysis section.
Figure 3.1 is the visualisation of the structural framework in developing the present research.
This framework starts by understanding aesthetics as the key factor to gain consumer
attention for any newly developed product. Focus will be given to the cognitive area of
aesthetics that is the aspects of typicality and novelty.

50
Based on the research discussed, the typicality aspect of aesthetic appraisal on product design
refers to an existing experience, familiar features or functions and the tendency to prefer
safety rather than risk (Hekkert, 2006 ; Whitfield, 1983). At the same time, novelty represents
new experiences, unfamiliar processing and discovery of enjoyment of aesthetic judgements
(Mugge & Schoormans, 2012b; Tyagi et al., 2013) . Most of the research suggested both
typicality and novelty need to be considered in the effort to pursue an optimum aesthetics
appraisal towards a product and not to rely only on one particular aspect (Blijlevens et al.,
2012; Tyagi et al., 2013). Even though feeling safe is good, in order to move on we need new
knowledge, and it is necessary to explore such new knowledge, but without previous
Figure 3.1 Structural Framework for the Present Research.

51
experiences we do not have a path to discovery. Figure 3.2 described significant comparison
between words that are related to typicality and novelty. In addition, these words can be
found in most of the discussed research (Berlyne, 1960b; Blijlevens et al., 2012; Whitfield,
1983).
3.1.1. Multisensory Aesthetics Studies.
A number of authors have discussed standard procedures for doing experiments for
multisensory assessment, especially involving visual and tactile (Sonneveld et al., 2008;
Spence & Gallace, 2011). Most experiments were done in order to create a comparative
measurement between the two senses. Visualizing and touch were the main evaluation
behaviours. Normally, variables selected for the experiments consisted of attributes that
favoured both of the behaviours. (See Table 3.1.)
Figure 3.2 Typicality and Novelty.
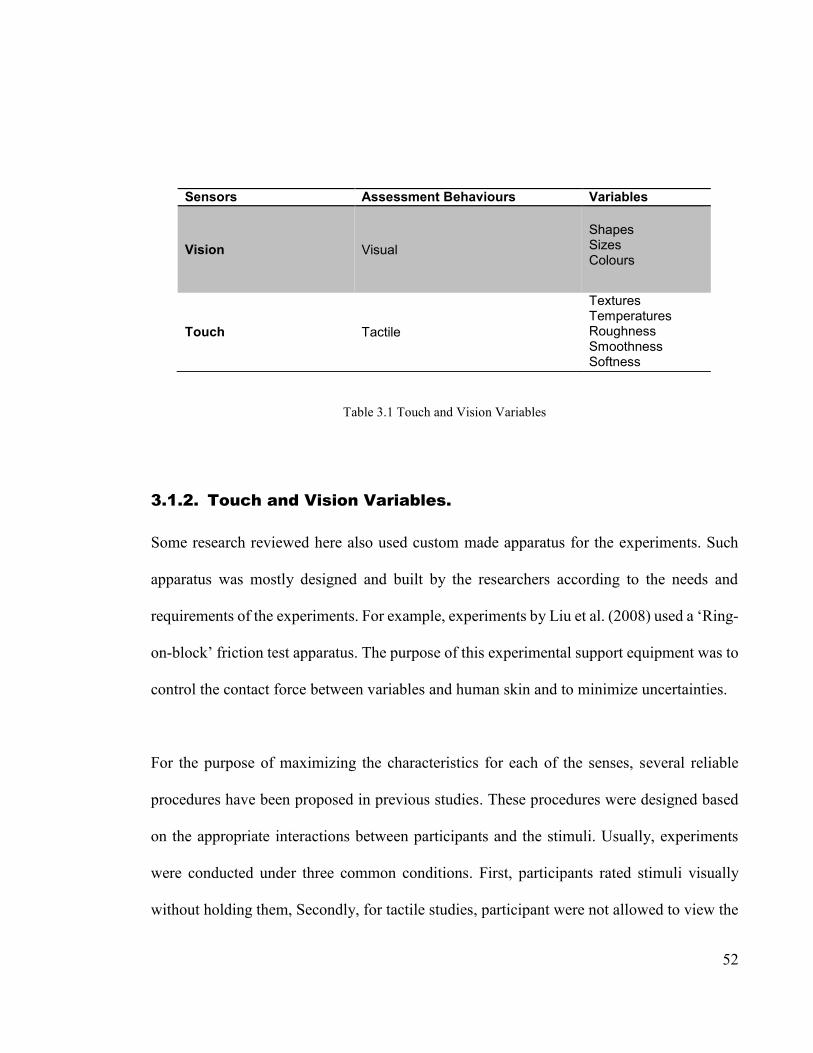
52
Table 3.1 Touch and Vision Variables
3.1.2. Touch and Vision Variables.
Some research reviewed here also used custom made apparatus for the experiments. Such
apparatus was mostly designed and built by the researchers according to the needs and
requirements of the experiments. For example, experiments by Liu et al. (2008) used a ‘Ring-
on-block’ friction test apparatus. The purpose of this experimental support equipment was to
control the contact force between variables and human skin and to minimize uncertainties.
For the purpose of maximizing the characteristics for each of the senses, several reliable
procedures have been proposed in previous studies. These procedures were designed based
on the appropriate interactions between participants and the stimuli. Usually, experiments
were conducted under three common conditions. First, participants rated stimuli visually
without holding them, Secondly, for tactile studies, participant were not allowed to view the
Sensors Assessment Behaviours Variables
Vision Visual
Shapes Sizes Colours
Touch Tactile
Textures Temperatures Roughness Smoothness Softness

53
stimuli and were asked either to cover their eyes or the stimuli were covered with some form
of preventive equipment to ensure that the only way to experience the stimulus was by
touching it (Ekman et al., 1965; Essick, 2010; Tiest, 2006). Third, participants were allowed
to use both of the senses to evaluate the stimuli. Table 3.2 visualizes the standard interaction
conditions between participant and stimuli in aesthetics judgement multi-sensory studies
Senses Interactions (Stimuli) Conditions
Vision Visual Looking without holding
Touch Tactile Holding without looking
Both Both Looking and holding
Table 3.2 Standard Interaction between Participant and Stimuli.
Based on the two variables proposed, four cognitive aesthetics conditions have been
formulated. These conditions were the orientation for the stimuli development in the two
experiments suggested. Table 3.3 presents the stimuli conditions starting with condition 1;
product with typical shape and typical texture, condition 2; product that have typical shape
and novel texture, condition 3; products with novel shape and typical texture and condition
4; products that have both novel variables.

54
Table 3.3 Possible Conditions.
Along with these four product conditions and influenced by Berlyne (1971), who proposed
the inverted U-shaped relationship between aesthetics preference and arousal potential, and
further aligned with the work of Hekkert et al. (2003), the present research tested four
potential hypotheses.
i. First hypothesis predicts we need both typical attributes in order to design the most
preferable product.
ii. Second hypothesis predicts that products with both novel attributes are less preferred.
iii. Third hypothesis predicts products with the combination of typical shape and novel
texture will be more preferred.
iv. Fourth hypothesis predicts that the participants will least prefer products with the
combination of typical texture and novel shape.
Variables/conditions 1 2 3 4
Shape Typicality Typicality Novelty Novelty
Texture Typicality Novelty Typicality Novelty

55
3.1.3. Stimuli.
Since Berlyne (1960b), researchers have experimented by using stimuli. Previous studies
discussed in this chapter informed the researcher regarding the development of appropriate
stimuli (products) for collecting data and the variables to be used. Stimuli refer to anything
that can generate responses from participants. Variables are proposed based on the type of
stimuli, the stimuli presentation, and the intention of the experiment. For example, most of
the studies noted here presented images of products as stimuli to measure aspects of typicality
and novelty. Therefore, variables chosen should be something that can be analysed visually
with regard to the criteria of 2D images such as colours, shapes or perhaps textures. However,
if the stimuli are presented as an object that can be touched, held or felt, the best variables
that can be suggested are tactile variables such as textures, weight, roughness or even
temperatures.
As noted, stimuli come in many forms, but most stimuli used in prior research were
representations of images. In many cases stimuli were selected only after conducting a pre-
test (Hekkert et al., 2003; Mugge & Schoormans, 2012b) before a final decision was made.
This procedure ensured that the stimuli were strongly related to the studies and well
understood by the participants. Some research highlighted that encouragement by the
surroundings also had an effect on results (McCabe & Nowlis, 2003; Peck & Childers, 2006).
56
3.1.4. Preliminary Studies.
A further point of importance is that numbers of experiments proposed were always
conducted more than once. The reason for this was normally to strengthen or to justify the
researchers' interpretations of the findings (Spence & Gallace, 2011). However in addition,
the repetition of experiments allowed researchers to carry out a comparative assessment in
order to construct more solid conclusions (Wastiels et al., 2013; Whitfield & Slatter, 1979).
Furthermore, most studies proposed a preliminary study before proceeding with the final
study. There are several reasons for supporting a preliminary study. The most typical is to
make sure that the selected stimuli are the most appropriate to generate the required
outcomes. Also known as pilot studies, these preliminary studies are necessary to confirm
the best instruments to be used for the research.
In this PhD research, the findings of previous studies regarding stimuli selection, brand
removal, pilot studies, preliminary studies and repeated studies were applied to assist in
developing the research as well as evaluation instruments such as scales or sets of questions.
In particular, a pre-study was important for revealing any problems with procedures which
might otherwise have been overlooked, and in helping to identify possible new procedures
and standards for the study. In addition, another advantage of having a pilot study is to enable
the researcher to identify the most appropriate participants for the research. For example,
previous work by Whitfield has demonstrated that participants with design study background
have a tendency to give particular responses because their appreciation of the stimuli is
mostly based on principals of design instead on the required inputs.
57
Typically, their responses are skewed to a statistically significant level. As recognized in
previous research in aesthetics appraisal, one further factor that can influence results is biased
stimuli. For example, if the research has numbers of stimuli and variables for the experiment,
the sequence must first be randomized before it can be assigned to the participants. A
randomization process is usually done particularly for experiments that have a sequence of
instruments to be tested, and this is a procedure that needs to be done to stop participants
from being influenced by a standard numbers arrangement.
3.1.5. Scales and Analysis.
Research on aesthetics normally depends on the statistical data generated from the
experiments. A number of methods for measuring have been identified, for example a 9 –
point rating scale in Hekkert et al. (2003). Other studies have used three to seven point items
or more. In studies using a scale such as this, results were analysed using a statistical data
analysis approach such as ICC (Inter-correlation coefficient) quantitative measuring,
ANCOVA (analysis of covariance), regression analysis or other recognised statistical
analysis approaches.
3.1.6. Considerations
Previous studies have demonstrated that consumers are consistently affected by brand, and
for that reason many studies have eliminated any signs of brand before conducting
experiments. Some studies took age and gender into consideration in their experiments
(Klatzky, 1985; Liu et al., 2008; Schifferstein, 2006); However, the effects of age and gender
58
were found to be inconsistent and unlikely to have affected the results. Nevertheless, it would
be interesting to know if age and gender preferences do in fact influence aesthetics appraisal.
This might well be an area to be explored in future research.
An earlier study by Klatzky (1985) determined that object recognition by using touch sensor
should be done by assessing three-dimensional and familiar objects. According to this study,
there are a number of additional requirements and procedures that must be in place. For
instance, it is advisable to use common products as the stimuli, referring to the majority of
market products, and to try to look for universal and genderless categories of products
(Schifferstein, 2006). Researchers are also reminded not to use artificial or two-dimensional
displays to assess tactile stimuli; it is better to have a full-scale product instead.
Comparative sensory assessment on aesthetics requires participants to focus only on one
sense, but this is a near-impossible task as human have more than one sense, and each of the
senses is very sensitive. Schifferstein’s (2006) study proved that even though vision was the
most dominant sense among all, during user and product interactions human need more than
visual assumptions. Therefore, preventive equipment is suggested by most of the existing
research reviewed here. The purpose of this preventive equipment is to stop the role of the
unwanted senses for the particular test, or at least to minimize it. Commonly, studies that
required participants not to look at the stimuli prevented the participant from looking at them
by using different kinds of preventive equipment. Some used blindfolded goggles while
others used custom-made walls or curtains to block the participants' view of the stimuli. In
addition, preventive actions also were put in place for the other senses that were not officially

59
related to the testing, but even so the existence of these will indeed influence the participant
judgment. For example, even though our eyes are covered we can still generally predict what
object we are holding by hearing the sound of it or the sound of the object being knocked on
a hard surface. Therefore, some research asked participants to put on headphones, earplugs
or even use a platform that was padded to reduce noise during the experiment.

60
3.2. Experiment 1.
Research components: Theoretical. Method. Experiments.
Literature review: Aesthetics Cognitive aspects Typicality and Novelty (Multi-sensory Aesthetics) Visual and
Tactile sensory.
Study (Final) o Ethics application o Numbers of respondents – 50, non-
specific clusters among SUT student. Location SUT main library.
o Stimuli (visual) and tactile (object), variables (shapes and textures) developments and selections.
o Scales and questionnaires.
Research analysis
Conclusions and Further
studies.
Phase 1 Study (Preliminary) o Ethics application o Small numbers of respondents - 30
non-specific clusters among SUT student. Location SUT main library.
o Stimuli (visual) and variables (shapes, colours and textures) selections and developments.
o Developments of scales and questionnaires.
Figure 3.3 Research Framework.
61
A fundamental question in multi-sensory aesthetics is: are the different senses subject to the
same ‘laws’ of aesthetics? For example, are typicality and novelty influential in affective
responses in the tactile, olfactory and gustory senses? And if so, how do they interact across
senses. Experiments 1 and 2 test this using the visual and tactile senses. Figure 3.3 shows the
details of the framework for the present research
As noted earlier, Project UMA outlined the specific area of research to be undertaken at
Swinburne. The aesthetics aspects of products that have been investigated are typicality and
novelty. Previous research provided the foundation for this research. This included the
development of stimuli, questionnaires and selection of participants. Until recently, most
research in this field used 2 dimensional stimuli. The present research extends this by
employing 3 dimensional designed products as stimuli in two experiments. Experiment 1 is
described in this chapter and Experiment 2 in the next chapter. The rationale for these two
related experiments is given below.
62
The primary purpose of Experiment 1 was to identify both visual and tactile properties of
stimuli that were perceived as high and low in typicality and novelty for each of the stimulus
sets (computer mouse and toothbrush). These properties were then incorporated into highly
controlled stimulus sets and used in Experiment 2. The secondary purpose of Experiment 1
was to verify that the two variables of interest, typicality and novelty have a statistically
significance role in predicting affective responses (liking) for the two object categories
(computer mouse and toothbrush) This was necessary as neither object category has been
used as stimuli in the field of empirical aesthetics. Without this verification, Experiment 2 as
planned would be invalid. Experiment 2 tested the theory by using developed stimuli from
the first experiment and validated the aesthetics preferences for a product through vision and
touch assessment. Both experiments used the same products as stimuli.
3.2.1. Participants.
Thirty participants were recruited for experiment 1. Students, staff and public users of the
university library on the Hawthorn campus of Swinburne University of Technology in
Melbourne were selected. This was because the research needed to have variety in
participants. By conducting the study in a public area like a library, it promised participation
from various kinds of people with different academic or professional fields and backgrounds.
These participants were identified as the most common users for the tested products.
However, design students and professional designers were specifically excluded as
participants. Research has shown that when design students, or design professionals, give
aesthetic evaluations of products their specialised design-focused knowledge influences their

63
aesthetic choices and judgements, whereby they are not the representative of the public
(Whitfield, 2007). One reason for this is that designers are atypical consumers and are drawn
to the novel aesthetics of products. As participants in this study were required to evaluate
products specifically for their typical or novelty, the inclusion of design students could have
'skewed' the results.
The study was conducted at the main library of Swinburne University of Technology
Hawthorn campus. In response to Ethics (see Appendix B) requirements, a formal request
was first made to the management of the library asking for permission to recruit participants
by advertising in the library and to conduct the experiments on library premises. The
researcher was granted permission for both. An area of participant recruitment was allocated
on the ground floor of the library, and a room reservation for conducting experiments was
provided for four hours daily for one week. The application process for the study location of
the experiment is provided in Appendix C.
In addition, posters were used as the main publicizing instrument for the research. In order
to make sure that the posters managed to catch as much attention as possible, three layout
proposals were used (see figure 3.4). Each of the proposals had the same layout, and the
captions and sentences were discussed among the research team members.

64
The posters were intended to be clear, attractive and simple. They included of all the
necessary details about the research such as, title of the research, brief about the purpose of
the study and the researcher contact details. Three different caricatures were proposed with
each of them presented as trying to discover an object without looking at it. Layout number
1 was decided as the selected poster.
As requested by the management of the library, the researcher pinned up participant-seeking
posters around the library, including on the doors of the male toilets on all floors. In addition,
posters were also pinned up on some of the notice board around the campus. Another formal
request had been made to the Swinburne Student Amenities Association to authorize the
Figure 3.4 Participant Recruitment Poster Proposals.
65
researcher to do so. Participants were recruited a week before the experiment started. A table
with a research information poster to recruit participants was set up in the library main
entrance lounge for one week. In the recruitment week, forty respondents expressed their
interest to participate; they were among the staff and students, some of whom came in
response to seeing a poster somewhere while some were just walk in participants. According
to these participants, the way the research was promoted was the reason for their
participation. The poster and the procedures of the survey motivated people to get involved.
Details recorded from the recruited participants were their name, contact details and preferred
time to take part in the experiment. Therefore, a total of 40 names was listed and scheduled
to do the experiment according to their preferred date and time (refer figure 3.5). The
experiment took place a week after the recruitment. In the beginning, the researcher presumed
an average duration for each participant taking part in the experiment would be an hour. Since
four hours were provided for the researcher to use to room, four participants were scheduled
every day to undertake the experiment.
Each of the scheduled participants was sent an email as a notification of their participation a
few days before their turn, and another last reminder was sent to them a day before the
experiment day. However, out of 4 names recruited only 1 turned up during the first
experiment day and out of total of 40 names registered in the previous week only 5 turned up
for the experiment. Most of the recruited participants stated they had to withdraw their
participation due to other commitments. The researcher also realised that the selected week
for the survey experiment was a crucial week for student participants as it was the last week

66
of the semester and happened to be a submission and exam week for the students. Therefore,
the researcher had to look for more participants.
New participants were recruited in the same way as previously, and asked to participate
during the same time period. As a result, 31 participations completed the experiment in one
week. Each participant was given a small incentive of a $10 gift voucher after completing
the experiment as thanks for participating. There was no specific percentage of gender
required for the study and the age range of participants was between 18 to 30 years old.
Figure 3.5 Invitation Poster and List of Registered Participants.
67
Based on the responses by the participants, the researcher identified a number of problems
that needed to be addressed for future experiments. The idea of having two separate weeks
for recruitment and survey experiment was not helpful, and even worse it was time
consuming. The experiment should have been conducted immediately after the recruitment.
Regarding the promotion and information about the research that had just been completed, it
was insufficient. It should have been extended, so that besides putting posters on the walls,
posters should also have been distributed online. Online distribution has the possibility of
reaching more potential respondents. On the other hand, the selected location for the study
was a good place to get potential participants. These two conditions gave a positive indicator
to the researcher and were a valuable lesson for what needed to be taken into consideration
in the next stage recruitment.
3.2.2. Stimuli.
Two daily used products were selected as the stimuli for the research. A number of criteria
were used in order to choose the stimuli for the study. For example, stimuli had to be ageless
and genderless.
Figure 3.6 shows the stimuli selection criteria for the present study. The first criterion for the
stimuli was it should be amongst a poor category of daily-used products; poor category refers
to a category of products that do not have many subcategories (Rosch, 1977). Products that
had many sub-categories, for example a chair, were excluded. A chair was considered as a
rich category of daily-used product as it has many sub-categories such as sofa, bench, garden
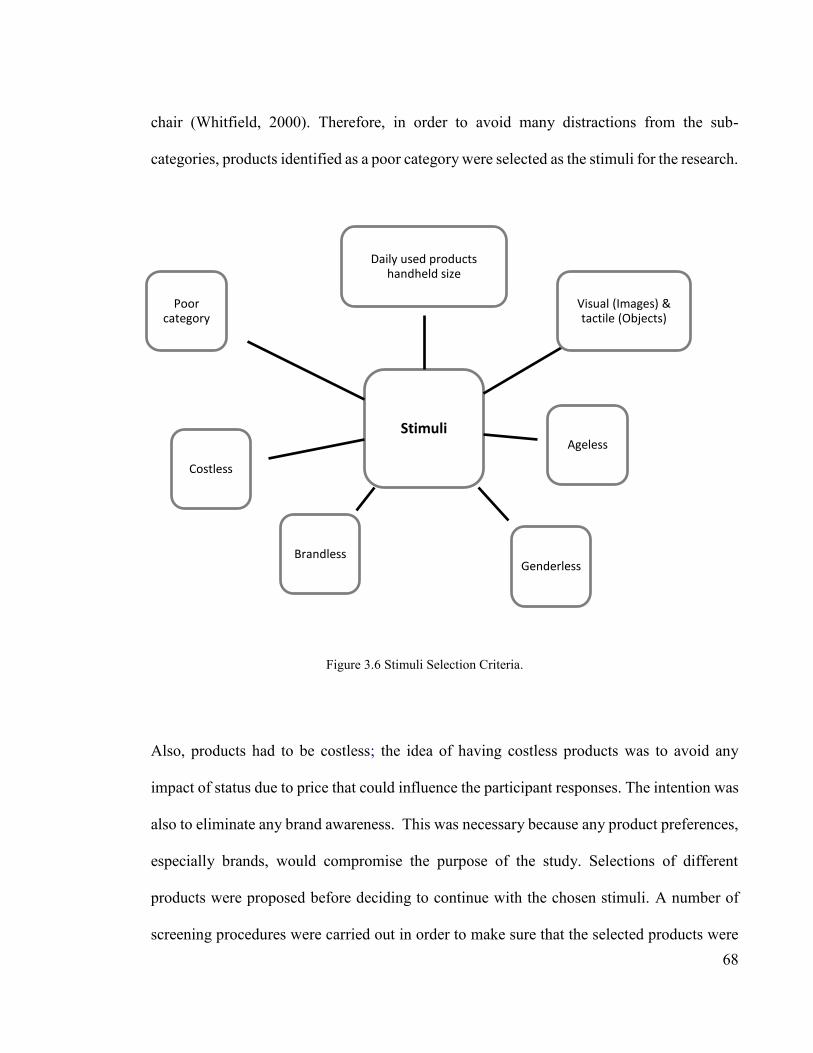
68
chair (Whitfield, 2000). Therefore, in order to avoid many distractions from the sub-
categories, products identified as a poor category were selected as the stimuli for the research.
Also, products had to be costless; the idea of having costless products was to avoid any
impact of status due to price that could influence the participant responses. The intention was
also to eliminate any brand awareness. This was necessary because any product preferences,
especially brands, would compromise the purpose of the study. Selections of different
products were proposed before deciding to continue with the chosen stimuli. A number of
screening procedures were carried out in order to make sure that the selected products were
Stimuli
Daily used products handheld size
Visual (Images) & tactile (Objects)
Ageless
GenderlessBrandless
Costless
Poor category
Figure 3.6 Stimuli Selection Criteria.
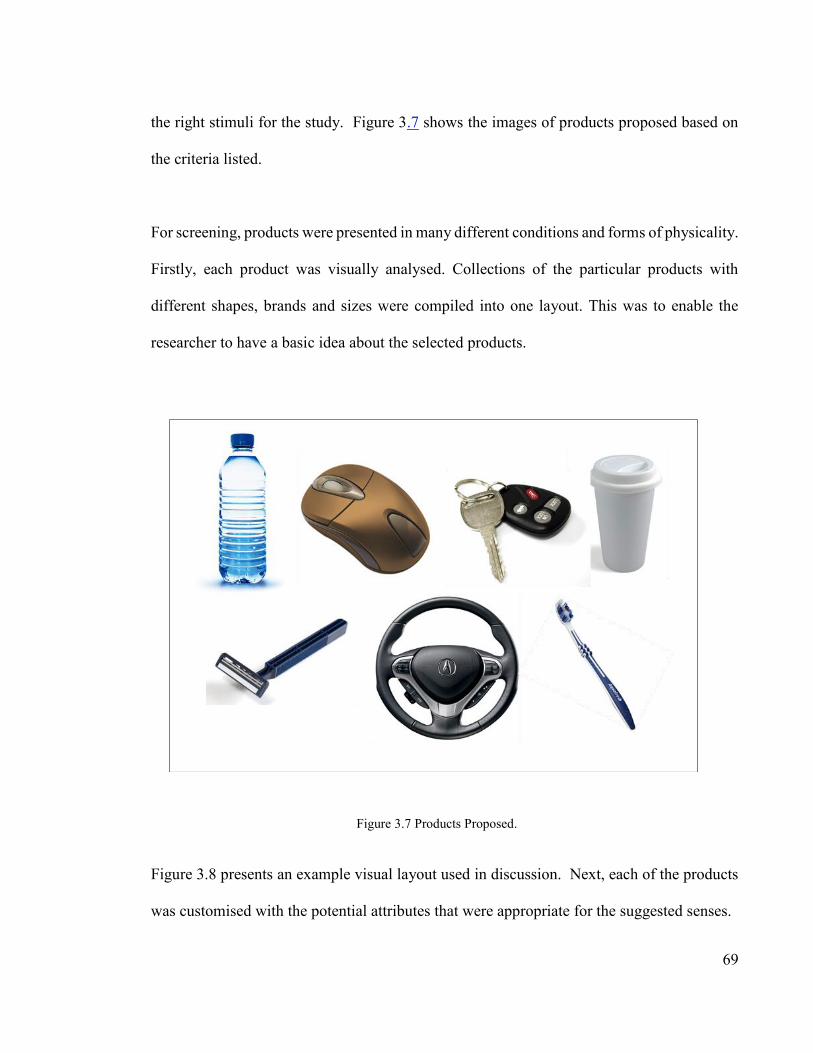
69
the right stimuli for the study. Figure 3.7 shows the images of products proposed based on
the criteria listed.
For screening, products were presented in many different conditions and forms of physicality.
Firstly, each product was visually analysed. Collections of the particular products with
different shapes, brands and sizes were compiled into one layout. This was to enable the
researcher to have a basic idea about the selected products.
Figure 3.8 presents an example visual layout used in discussion. Next, each of the products
was customised with the potential attributes that were appropriate for the suggested senses.
Figure 3.7 Products Proposed.
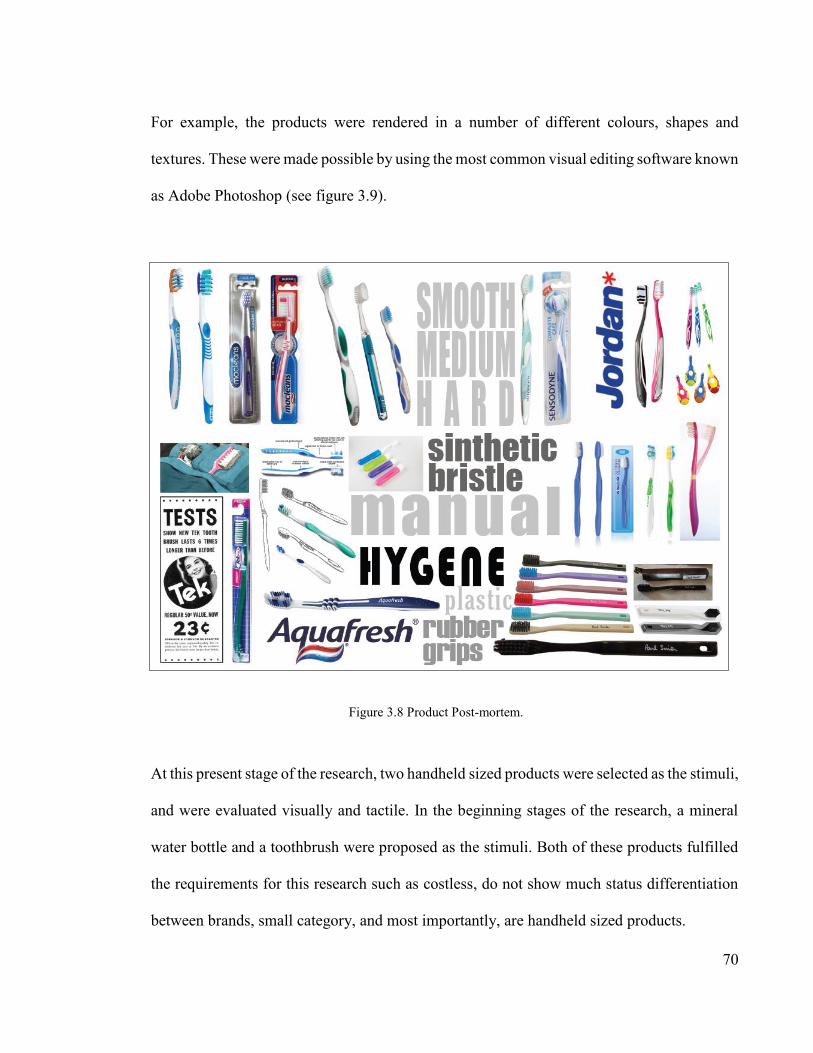
70
For example, the products were rendered in a number of different colours, shapes and
textures. These were made possible by using the most common visual editing software known
as Adobe Photoshop (see figure 3.9).
At this present stage of the research, two handheld sized products were selected as the stimuli,
and were evaluated visually and tactile. In the beginning stages of the research, a mineral
water bottle and a toothbrush were proposed as the stimuli. Both of these products fulfilled
the requirements for this research such as costless, do not show much status differentiation
between brands, small category, and most importantly, are handheld sized products.
Figure 3.8 Product Post-mortem.

71
As noted before, the stimuli were presented in a two and three-dimensional form. As this was
a time-consuming process for the researcher, before continuing with the research, a pre-
manufacturability study of both of the stimuli was carried out. This was conducted in order
to make sure that the selected stimuli could be fabricated, and were within the budget capacity
of the university. This process included the researcher's technical knowledge, machines that
were available to fabricate the stimuli, and budget constraints.
This pre-manufacturability assessment was an essential requirement for the present research;
it identified significant constraints for the mineral water bottle was proposed as one of the
stimuli at the start. There were too many constraints for the fabrication process. The cost of
Figure 3.9 Selected Products with Different Attributes (Colours and Textures).
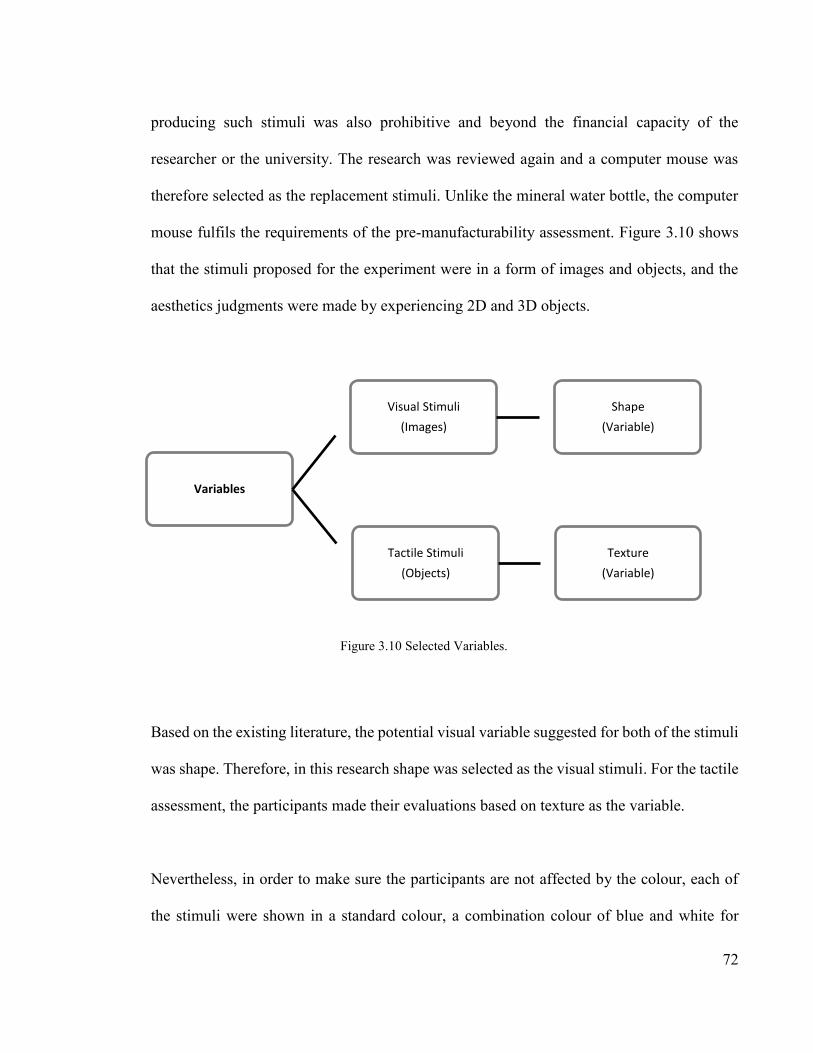
72
producing such stimuli was also prohibitive and beyond the financial capacity of the
researcher or the university. The research was reviewed again and a computer mouse was
therefore selected as the replacement stimuli. Unlike the mineral water bottle, the computer
mouse fulfils the requirements of the pre-manufacturability assessment. Figure 3.10 shows
that the stimuli proposed for the experiment were in a form of images and objects, and the
aesthetics judgments were made by experiencing 2D and 3D objects.
Based on the existing literature, the potential visual variable suggested for both of the stimuli
was shape. Therefore, in this research shape was selected as the visual stimuli. For the tactile
assessment, the participants made their evaluations based on texture as the variable.
Nevertheless, in order to make sure the participants are not affected by the colour, each of
the stimuli were shown in a standard colour, a combination colour of blue and white for
Variables
Visual Stimuli
(Images)
Shape
(Variable)
Tactile Stimuli
(Objects)
Texture
(Variable)
Figure 3.10 Selected Variables.

73
toothbrushes and black for the computer mouse. Also, product brands were removed or
hidden to avoid brand awareness among participants. During the experiment, stimuli were
presented in a form of images and real products according to the judgement conditions (visual
and tactile). A set of stimuli consisted of ten product images or ten real life products, which
meant this experiment had four sets of stimuli in total with different types of presentation,
products and variables. Table 3.4 presents an overview of the assessment for the experiment;
the stimuli, the assessment used for stimuli, the number of stimuli used with the number of
sets for each of the assessment, and in what form stimuli were presented in this experiment.
Variations in typical and novel stimuli were explored through shapes and textures of the
products. (Figure 3.11).
Table 3.4 Numbers of Stimuli.
Stimuli Assessment Numbers/Set Presentation
Toothbrush Visual 10/Set Images
Tactile 10/Set Real products
Computer Mouse Visual 10/Set Images
Tactile 10/Set Real products
Total 40/4 Set

74
In developing the stimuli, the researcher applied a function in Adobe Photoshop that enabled
him to obtain the most typical shapes for each of the stimuli. The function, known as ‘Smart
Objects’, operates by processing multiple layers of images. It then allows the user to choose
which stacking mode is needed. For this experiment, in order to obtain the most typical shape
for each of the stimuli, each of ten images was digitally stacked and processed with the
‘mean’ function as the most appropriate option. For example, see Figure 3.12.
Figure 3.11 Visual Assessment Scales.

75
For the touch assessment, actual products were proposed. As the aim was to allow
participants to physically evaluate the products, texture was chosen as the attribute variant
for this test. In order to create a variant from the most typical to the most novel products,
modifications to the products were necessary. For this particular test, stimuli were modified
by adding special textures to some of the existing products. Tactile stimuli modification was
done manually; it ranged from the regular to the most irregular textures. Regular texture is
the stimuli default outer texture. In this experiment, the most regular texture referred to
Figure 3.6. Image of the stimuli and the scales
Figure 3.12 The Most Typical Shape Using Adobe Photoshop ‘Smart Objects’ Function.

76
toothbrush and computer mouse existing surface texture. Ten textures were proposed to give
a gradual sensory experience. This was done by having from the most related texture (existing
and closes to existing), less related (rough and thick) to not related at all (furry) (Demattè et
al., 2006; Ekman et al., 1965; Wastiels et al., 2013). Textures were created by wrapping and
sticking textured materials to the products selected. Some of the materials and fabricating
process are shown in figure 3.13.
Figure 3.13 Some of the Materials.
77
As discussed, experiments for touch behaviours have usually prevented participants from
looking at the stimuli; participants were only allowed to experience the stimuli by holding
and touching. Similar procedures were adopted in this research. Further, related research
suggested a number of preventive actions to stop participants from looking at the stimuli
during assessment. Some of the proposed actions were to use blindfold goggles to cover a
participant’s eyes, some suggested using a wall made by cardboard or curtains and some also
placed the objects inside a casing like a box.
Additional preventive equipment that might be useful to minimize the chances of participants
being influenced by the other senses was also considered; for example, using earphones or a
rubber padded assessment platform to avoid participants from recognizing the object based
on sound. In order to control for participant speculation about the touch stimuli, they were
told the name of the product before taking part in the experiment. Stimuli variants for each
of the tests were divided into three categories of cognitive appraisal, most typical, medium
and most novel. Stimuli for the most typical category consisted of standard-looking products,
specifically standard-looking in their shapes and textures. The medium level category
contained moderate-looking shapes and textures of the products that were not too typical and
not too novel. Lastly, the most novel category had the most extreme, different shapes and
textures for the products. In the images of the tactile variants shown in Table 3.5, the four
most novel are (from right to left) thick fur, fine fur, abrasive sponge and rough sandpaper.
The three medium (right to left) are fine sand paper and two rubber mesh textures that are
different in size of their pattern. Lastly, the most typical (right to left) are fabric, sticky tape
(constructed) and standard.
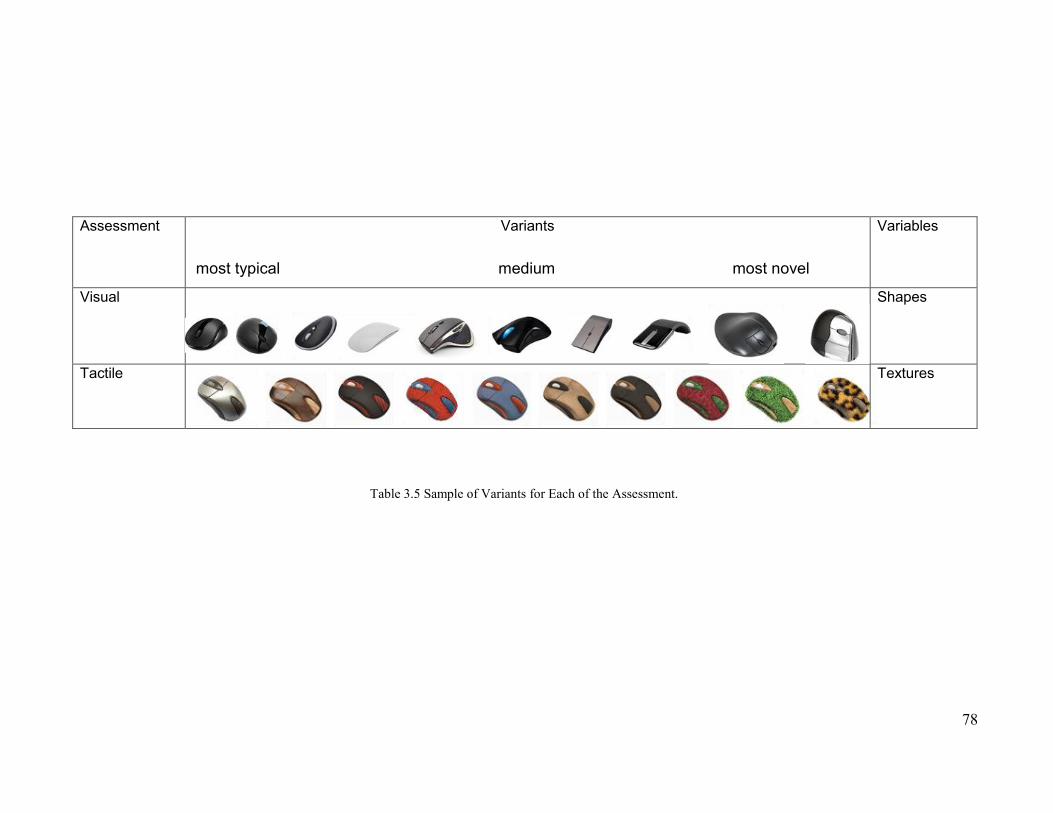
78
Assessment Variants
Variables
Visual Shapes
Tactile Textures
Table 3.5 Sample of Variants for Each of the Assessment.
most typical medium most novel

79
3.2.3. Procedures.
The first day of the survey experiment took place on Monday, May 11th 2015. As required,
participants were first asked to read and understand the research Consent Information
Statement and sign the Disclosure and Consent form before deciding to continue. The
Consent Information Statement explained the experiment in detail, the procedures, and
participant rights during the study and gave information regarding the reward for
participants once the survey was completed.
An example of the Consent Information Statement and the Disclosure and Consent form
is available in Appendix D. At the start of each of the experiment participants responded
to three demographic questions (see figure 3.14). Average age of people who participated
was between 20 to 35 years old. As noted, design students were excluded from this test.
The first and second questions helped the researcher identify the participant age range
and gender. As noted although these factors were not highlighted in this study they may
be useful for further investigation, The last question was important for the research
because it was the last check point to prevent unwanted participation by respondents who
had a knowledge of or background in design. The next two sections of the survey
proceeded with the evaluation of designed stimuli, the computer mouse and toothbrush.
Utilizing two human senses vision and touch, each of the products was evaluated using
two variables, shape and texture. Section two started with the visual assessment for both
of the stimuli sets. All questions and scales used for the first and second section of the
Experiment 1 are shown in Appendix E.

80
The variable assessed was shape. Therefore, products presented in this test were similar
in texture but variant in shapes. Each of the sets had ten product images. In order not to
distract the participant with other visual variables, each of the stimuli images was
presented with typical texture and was printed with only one color scheme, black and
white for computer mouse and blue and white for the toothbrush. Participants were asked
to rate the typicality, novelty and preferences aspects using a scale of 1-7 for each of the
stimuli by filling in blank spaces provided on the scale (See Table 3.6).
Figure 3.14 Demographic Questions in Section 1.

81
Table 3.6 Questionnaires.
Section three of the assessment was tactile assessment. Tactile inputs usually enable us
to gain information regarding object textures, hardness, shapes, weights and functions.
For this assessment, a set of stimuli consisting of ten products with typical shape but
different textures was presented in the form of real products. The stimuli ranged from the
most typical to the most novel textures.
The participants were prevented from looking at the stimuli, but before taking the test but
they were informed of the name of the product. They experienced the product only by
touching and holding it (See figure 3.15) and again indicated their responses to the test
by giving a rating on the scales provided. An example of the survey questions and scale
is provided in Appendices 5.3 and 5.4.
Theme
Question/Item
Format
Demographics What is your age? Open-ended
What is your gender? Dual choice
What are you studying? Closed
Typicality This is a typical computer
mouse/toothbrush
7-point scale
Novelty This is a typical computer
mouse/toothbrush
7-point scale
Liking I like this computer mouse 7-point scale
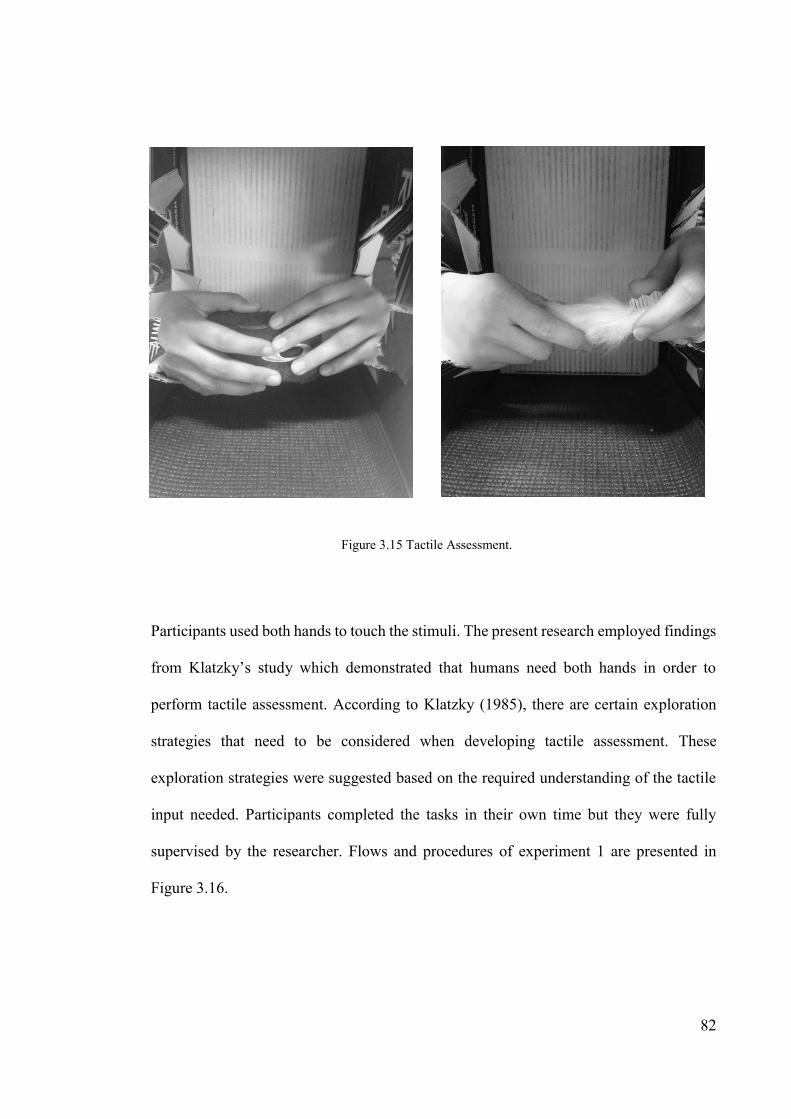
82
Participants used both hands to touch the stimuli. The present research employed findings
from Klatzky’s study which demonstrated that humans need both hands in order to
perform tactile assessment. According to Klatzky (1985), there are certain exploration
strategies that need to be considered when developing tactile assessment. These
exploration strategies were suggested based on the required understanding of the tactile
input needed. Participants completed the tasks in their own time but they were fully
supervised by the researcher. Flows and procedures of experiment 1 are presented in
Figure 3.16.
Figure 3.15 Tactile Assessment.
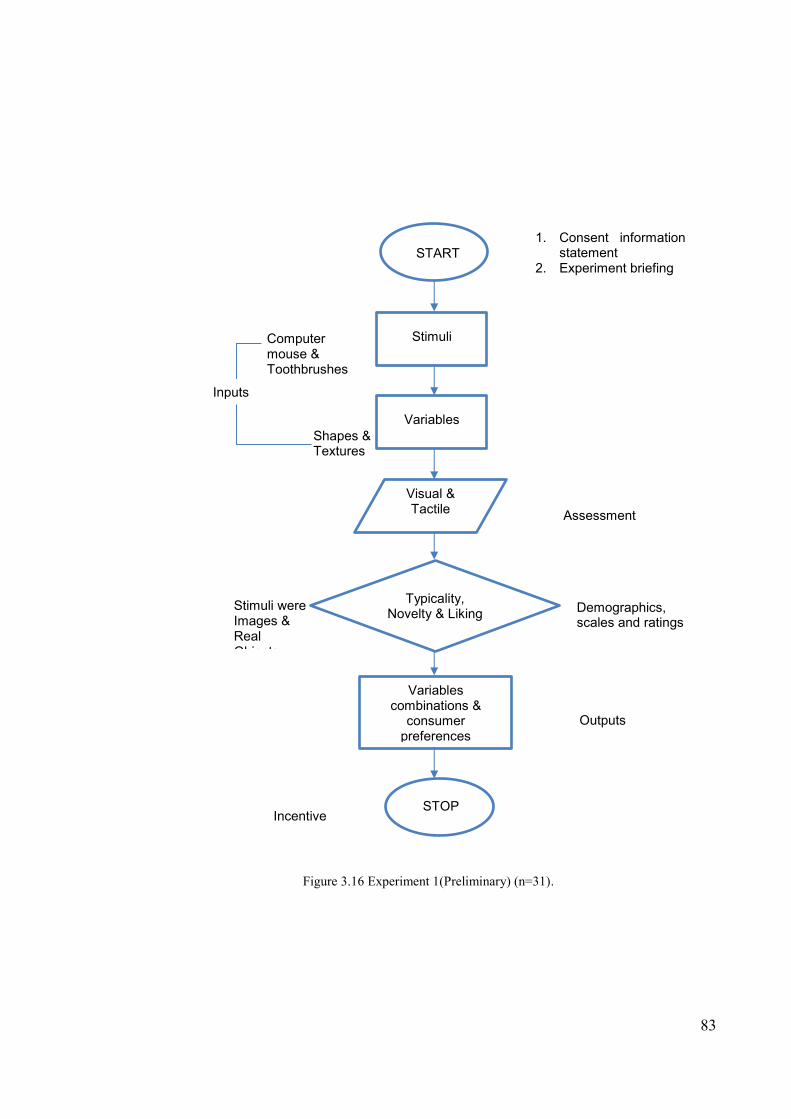
83
START
Stimuli
Variables
Typicality, Novelty & Liking
Visual & Tactile
Variables combinations &
consumer preferences
STOP
1. Consent information statement
2. Experiment briefing
Computer mouse & Toothbrushes
Shapes & Textures
Inputs
Stimuli were Images & Real Objects
Assessment
Demographics, scales and ratings
Outputs
Incentive
Figure 3.16 Experiment 1(Preliminary) (n=31).

84
3.3. Result.
The objective of the first experiment was to identify the typicality and novelty levels for
each of the stimuli (computer mouse and toothbrush). These levels ranged from the most
to the least typical or novel with shape and texture as the independent variables. As a
result of the findings from this experiment the levels were incorporated as the main
references for stimuli development in Experiment 2.
Experiment 1 consisted of two assessments, one for the toothbrush and one for the
computer mouse. In order to test for order effects, two sequences of stimuli were created
for each set: a random order and its reverse. The SPSS software package was used for the
statistical analysis. Table 3.7 displays the two sets of toothbrushes used for the first
experiment. Toothbrushes in set A represent the random sequence of stimuli presented
and set B shows the order for tactile assessment. The same sequences also applied to the
second set of stimuli, the computer mouse. A linear mixed method ANOVA was
conducted on 124 responses.

85
Stimuli Assessment Set
1 2 3 4 5 6 7 8 9 10 SEQUENCE
Table 3.7 Toothbrush Visual and Tactile Sets.
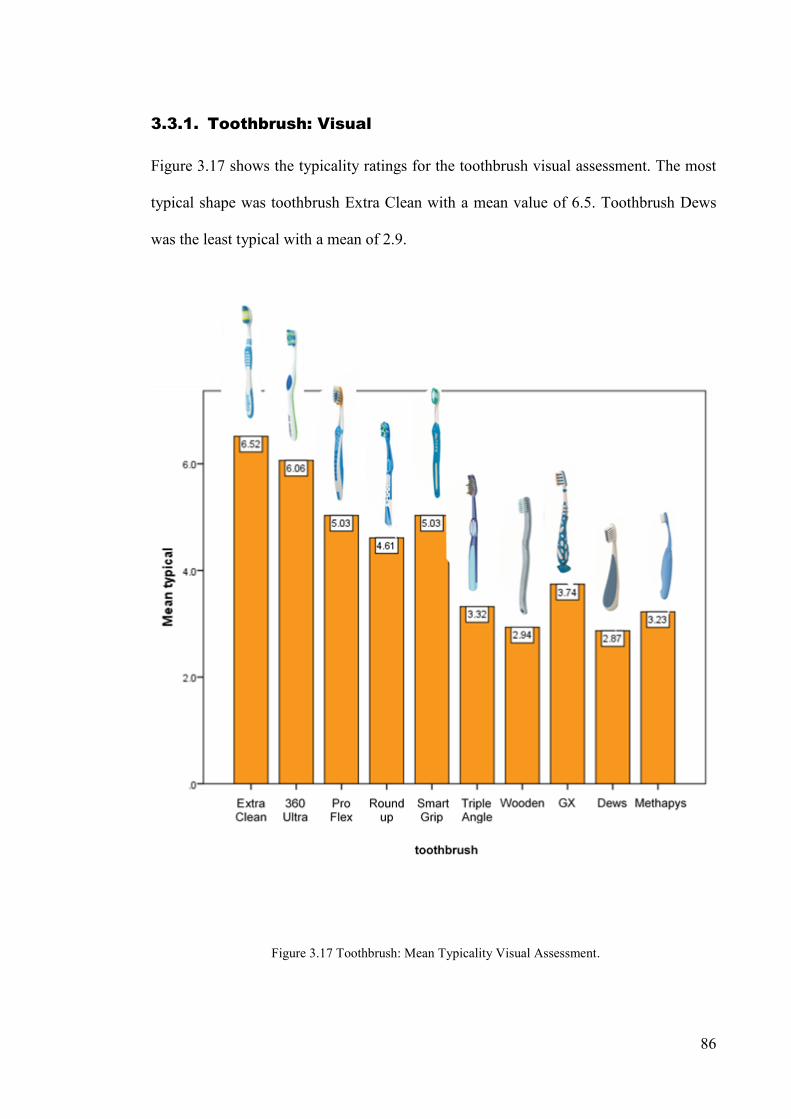
86
3.3.1. Toothbrush: Visual
Figure 3.17 shows the typicality ratings for the toothbrush visual assessment. The most
typical shape was toothbrush Extra Clean with a mean value of 6.5. Toothbrush Dews
was the least typical with a mean of 2.9.
Figure 3.17 Toothbrush: Mean Typicality Visual Assessment.

87
Figure 3.18 shows the novelty ratings for the toothbrush visual assessment. The most
novel shape was toothbrush Dews with a mean of 4.6. The least novel toothbrush was
toothbrush Extra Clean with a mean of 2.7.
Figure 3.18 Toothbrush: Mean Novelty Visual Assessment.
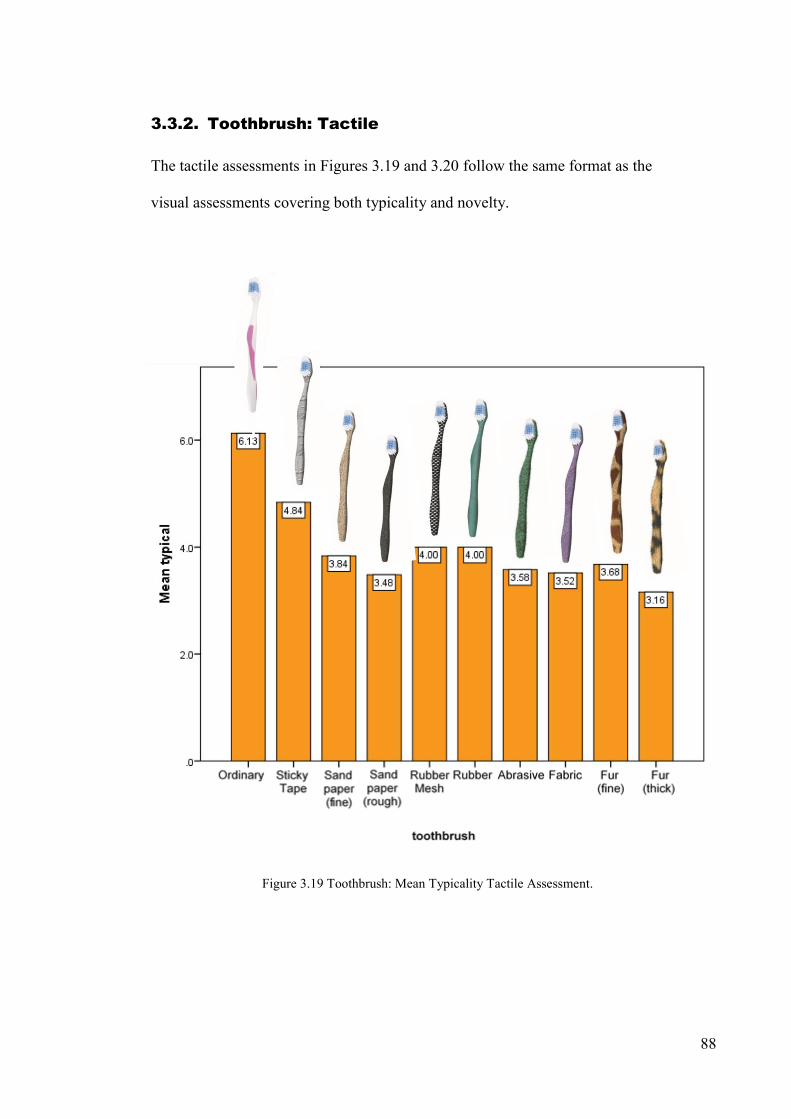
88
3.3.2. Toothbrush: Tactile
The tactile assessments in Figures 3.19 and 3.20 follow the same format as the
visual assessments covering both typicality and novelty.
Figure 3.19 Toothbrush: Mean Typicality Tactile Assessment.

89
Figure 3.20 Toothbrush: Mean Novelty Tactile Assessment.
Ordinary Sticky Tape
Sandpaper (fine)
Sand paper
(rough)
Rubber Mesh
Rubber Abrasive Fabric Fur (fine)
Fur (thick)
toothbrush

90
3.3.3. Computer Mouse: Visual
The data presented in Figures 3.21 and 3.22 show the typicality and novelty ratings for
the computer mouse visual assessment.
Figure 3.21 Computer Mouse: Mean Typicality Visual Assessment.
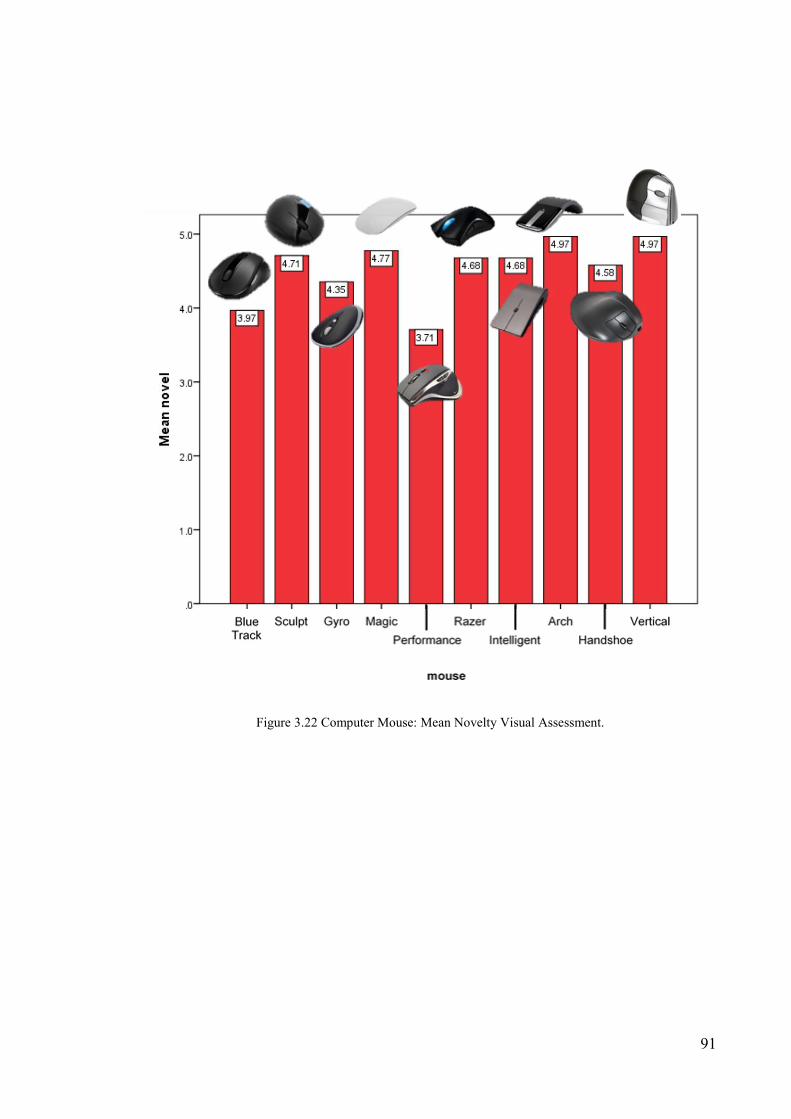
91
Figure 3.22 Computer Mouse: Mean Novelty Visual Assessment.

92
3.3.4. Computer Mouse: Tactile
Figures 3.23 and 3.24 display the typicality and novelty ratings for the computer mouse
tactile assessment.
Figure 3.23 Computer Mouse: Mean Typicality Tactile Assessment.
Ordinary Sticky Tape
Sandpaper (fine)
Sand paper
(rough)
Rubber Mesh
Rubber Abrasive Fabric Fur (fine)
Fur (thick)
mouse
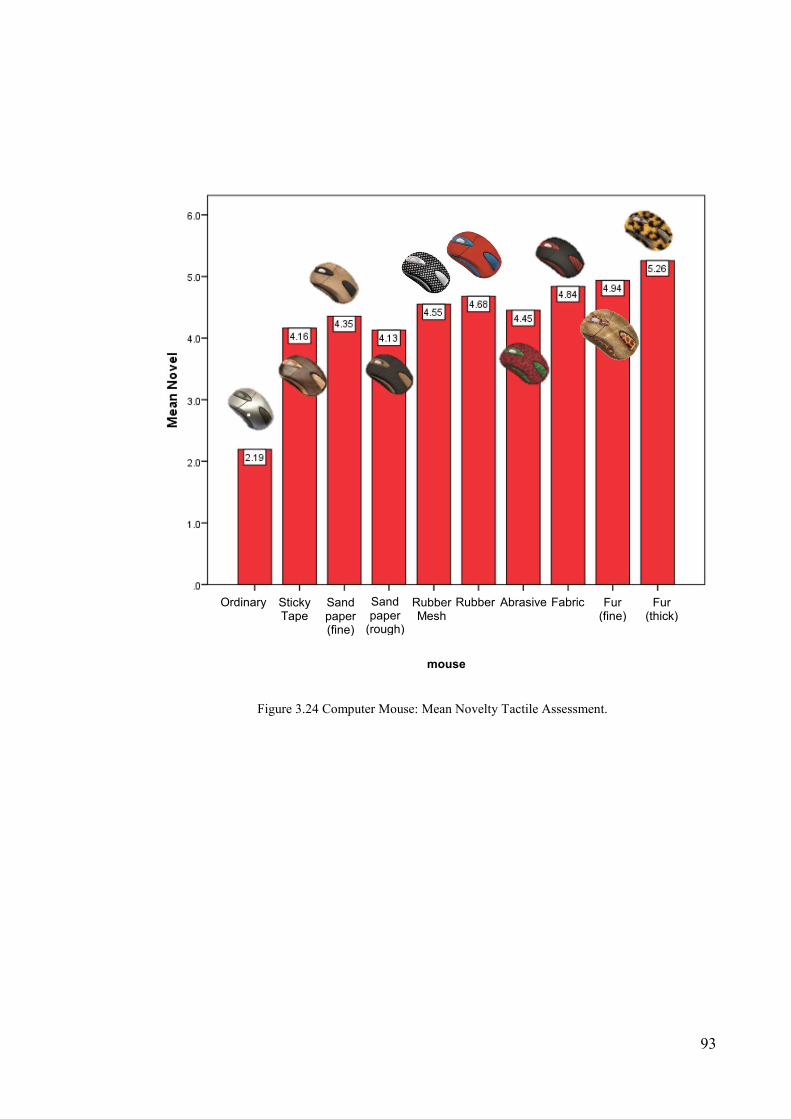
93
Figure 3.24 Computer Mouse: Mean Novelty Tactile Assessment.
Ordinary Sticky Tape
Sandpaper (fine)
Sand paper
(rough)
Rubber Mesh
Rubber Abrasive Fabric Fur (fine)
Fur (thick)
mouse

94
3.3.5. Aesthetics Affective Likings
Besides determining the stimuli for the next experiment, Experiment 1 also identified
aesthetic liking from the two assessments. This information was generated by having the
third question in the survey form. The question required participants to indicate their
liking for each stimulus using a 7 point scales.
3.3.5.1. Toothbrush: Visual and Tactile
For the visual, both typicality and novelty are significant main effects in predicting
liking. However, typicality is a much stronger main effect than novelty (typicality
F=49.55; p<.000: novelty F=8.89; p<.003). See Table 3.8.
Type III Tests of Fixed Effectsa
Source Numerator df Denominator df F Sig. Intercept 1 240.551 9.527 .002 typical 1 253.438 49.548 .000 novel 1 286.919 8.889 .003 a. Dependent Variable: like.
Table 3.8 Toothbrush Visual.
For the tactile, both typicality and novelty are significant main effects in predicting liking.
However, typicality is a much stronger main effect than novelty (typicality F=11.96;
p<.001: novelty F=.002; p<.967). See Table 3.9.

95
Type III Tests of Fixed Effectsa
Source Numerator df Denominator df F Sig. Intercept 1 132.065 21.127 .000 typical 1 196.542 11.958 .001 novel 1 252.005 .002 .967 a. Dependent Variable: like.
Table 3.9 Toothbrush Tactile.
3.3.5.2. Computer Mouse: Visual and Tactile
For the visual, both typicality and novelty are significant main effects in predicting liking.
However, typicality is a stronger main effect than novelty (typicality F=79.18; p<.000:
novelty F=41.44; p<.000). Refer Table 3.10.
Type III Tests of Fixed Effectsa
Source Numerator df Denominator df F Sig. Intercept 1 93.636 3.110 .081 typical 1 248.951 79.184 .000 novel 1 278.515 41.441 .000 a. Dependent Variable: like.
Table 3.10 Computer Mouse Visual.

96
For the tactile, there is a significant typicality (F= 60.27; p<.000). Refer Table 3.11.
Type III Tests of Fixed Effectsa
Source Numerator df Denominator df F Sig. Intercept 1 139.001 12.932 .000 Typical 1 187.036 60.269 .000 Novel 1 284.512 .578 .448 a. Dependent Variable: Like.
Table 3.11 Computer Mouse Tactile.
3.4. Discussion.
Results for both the toothbrush and the computer mouse indicate that both typicality and
novelty predict liking. For both, typicality exercises a stronger influence than novelty,
which may be expected given that both object categories could be considered ‘poor’ rather
than ‘rich’(Tyagi et al., 2013; Whitfield & Wiltshire, 1990). The one significant
interaction is negative, which suggests the independence of the typicality and novelty
scales. Interestingly, a sister study in Project UMA using the same measures and chairs
as stimuli found a highly significant positive interaction (p<.000) between typicality and
novelty in accounting for liking. Given that chairs are a rich category, this suggests that
the cognitive status of the object category mediates the effect of both variables. While
important, this is outside the scope of the present research.
As noted, a question fundamental to the present research is: do the laws pertaining to the
visual also pertain to the other senses? While limited to the tactile, the results obtained
suggest that they do. Both typicality and novelty play a significant role in accounting for

97
liking, though typicality emerges as more singularly influential for the tactile than for the
visual. Given the absence of a body of research for the tactile, unlike the visual, an
explanation is inevitably speculative. A possible reason may lie in the distal status of the
visual and the proximal status of the tactile. Given the underlying UMA model based on
safety (typicality) and risk (novelty), distal stimuli can be afforded greater risk than
proximal stimuli. After all, a tiger visually detected at a distance (distal) affords the
opportunity of escape. However, a tiger tactilely detected close up (proximal, including
taste and smell) would lead inevitably to death.
In conclusion, Experiment 1 achieved its two objectives. It demonstrated that the two
stimulus sets are clearly discriminated in terms of typicality and novelty and that both
typicality and novelty have significant roles in accounting for liking. Based upon the
typicality and novelty ratings, three-dimensional stimuli were then constructed that
incorporate different combinations of typical and novel features in both visual and tactile
modes. These three-dimensional designed objects constituted the stimuli for Experiment
2, and enabled cross-sensory effects on liking to be measured. Furthermore, these were
identified for both the visual and the tactile, using variation in shape for the visual, and
variation in texture for the tactile. Each sense modality was tested separately. For the
visual, two-dimensional images were used as stimuli. For the tactile, three-dimensional
products were used as stimuli. Importantly, for the tactile, participants could not see the
stimulus sets: they could only feel them. This demarcation of the two sense modalities
ensured that cross-contamination did not take place. In other words, the appearance of
particular textures did not influence visual judgements, and the appearance of particular
shapes did not influence tactile judgements. This therefore delivered two ‘clean’ sets of
sensory measures from which to derive the stimulus sets for Experiment 2.

98
The primary objective of Experiment 2 was to engineer a controlled confrontation
between two sense modalities. To achieve this, stimuli needed to be constructed that were
high and low in typicality, and high and low in novelty. This would enable stimuli high
in, say, tactile typicality and low in visual typicality to be judged against stimuli with the
opposite features, low tactile typicality and high visual typicality. Exactly the same
confrontation could also be engineered with regard to high and low novel features in both
sense modalities. The purpose of such confrontation was twofold: first, to measure the
contribution of each sense modality relative to the other in accounting for liking for
designed products, and secondly, to measure the contribution of typicality and novelty in
each sense modality. This would answer such questions as:
Does the visual dominate the tactile in accounting for liking?
Does high visual typicality exert a stronger influence on liking than high tactile typicality?
Does high visual novelty exert a stronger influence on liking than high tactile novelty?
It will be apparent that a major task was the construction of the two stimulus sets. Each
set - toothbrush and computer mouse had to incorporate specific combinations of visual
(shape) and tactile (texture) typicality and novelty features as identified in Experiment 1.
Such sets cannot be purchased off the shelf, had to be designed and constructed as part of
the research. As indicated in chapter 2, a shortcoming of research in this field is that
controlled, designed products are generally absent in studies. While the social sciences
do not provide the skills needed for such products, industrial design does and this is the
occupational training of the author-researcher.

99

C H A P T E R 4
100
4. METHODS: EXPERIMENT 2.
4.1. Introduction.
Experiment 1 successfully achieved the objectives of the first phase of the research.
Results from the experiment identified the most and the least typical or novel features of
the selected daily used products (stimuli). In Experiment 2, multi-sensory assessment was
applied to further justify the liking aspect in the product design. Inputs from the previous
experiment were used as a pre-requisite reference. As in the previous chapter, the
discussion starts with information about the participants. It then continues with the
explanation of the development of the stimuli. Next, the chapter describes the procedures
taken to run the experiment. Lastly, the outputs of the experiment are presented in the
results and analysis section.
4.2. Participants
50 participants took part in Experiment2. The same recruitment procedures used for
Experiment 1 were applied in Experiment 2. New participants were recruited from the
same location, and comprised students, staff and also public users of the library. As the
same participant selection criteria for Experiment 1 also applied to Experiment 2, design
students and design professionals were excluded. The university library was again used
as the experiment site.
101
Experiment 2 was conducted under the same Ethics clearance previously obtained from
the Swinburne Human Research Ethics Committee (2015/007). In addition, approval was
again obtained from Swinburne Library, and the researcher was allocated a room for the
experiment. The same layout setting as the first experiment was applied to the room.
Unlike Experiment 1, no specific recruitment week was suggested for this experiment.
Experience from the first experiment showed that even though the researcher registered
almost 50 interested candidates during the recruitment week for Experiment 1, and even
though these candidates were given preferences to select the experiment date and time
that suited them best, only four presented on the day of the experiment. This meant that
the majority of participants were recruited from library visitors on the actual day of the
experiment. Therefore, the researcher decided that participant recruitment for Experiment
2 would be conducted only on the day of the experiment. In addition, the only promotion
was posters on the library walls and posters online. Figure 4.1 shows the promotion
poster.

102
Figure 4.1 Experiment 2 Recruitment Poster.

103
4.3. Stimuli.
Figure 4.2 illustrates the detailed processes of Experiment 1 and the outputs. The latter
were used to generate typicality-novelty combinations of stimuli for experiment 2. The
purpose of these combinations was to discover which one is the most powerful in
determining consumer liking. Nine combinations of typicality-novelty were used.
Detailed explanation of the combinations were discussed in point form below.
i. The first stimuli combination is between the least typical shape with the least
novel texture. For the toothbrush, the combination is between shape number 10
and texture number 1. For the computer mouse, the combination is between shape
number 10 and texture number 1.
ii. The second combination is between the least novel shape with the least typical
texture. For the toothbrush, the combination is between shape number 1 and
Figure 4.2 Output from Experiment 1.
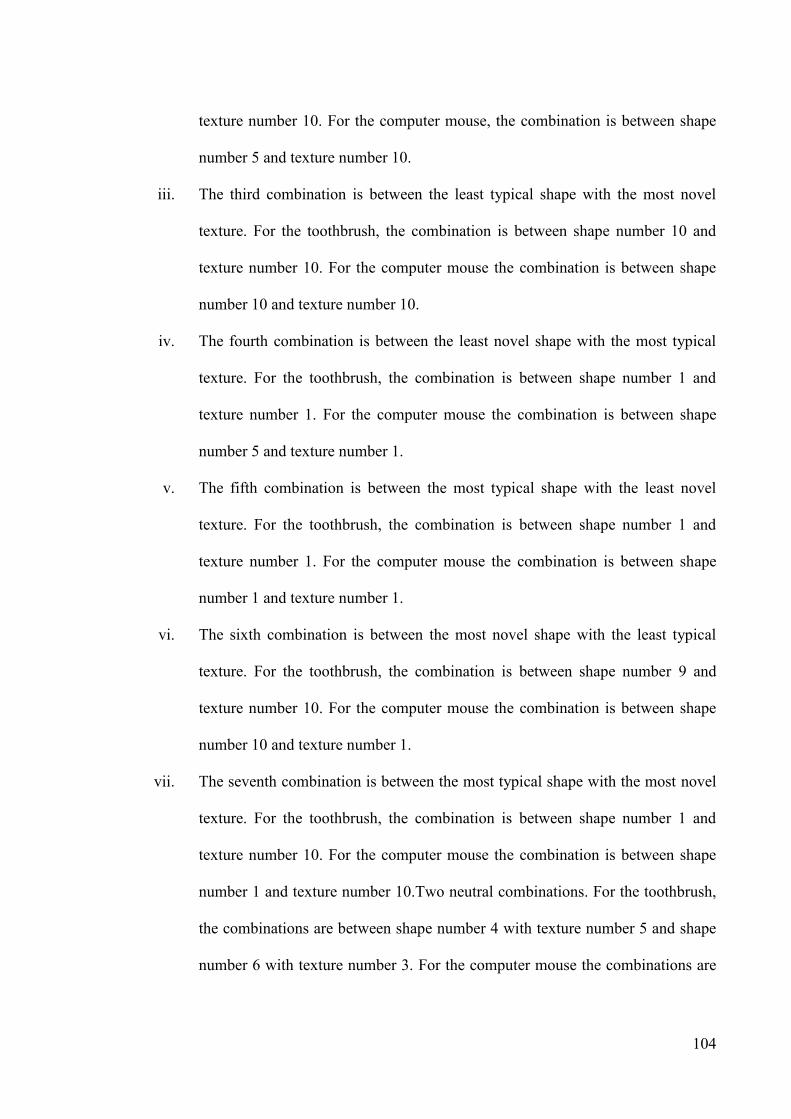
104
texture number 10. For the computer mouse, the combination is between shape
number 5 and texture number 10.
iii. The third combination is between the least typical shape with the most novel
texture. For the toothbrush, the combination is between shape number 10 and
texture number 10. For the computer mouse the combination is between shape
number 10 and texture number 10.
iv. The fourth combination is between the least novel shape with the most typical
texture. For the toothbrush, the combination is between shape number 1 and
texture number 1. For the computer mouse the combination is between shape
number 5 and texture number 1.
v. The fifth combination is between the most typical shape with the least novel
texture. For the toothbrush, the combination is between shape number 1 and
texture number 1. For the computer mouse the combination is between shape
number 1 and texture number 1.
vi. The sixth combination is between the most novel shape with the least typical
texture. For the toothbrush, the combination is between shape number 9 and
texture number 10. For the computer mouse the combination is between shape
number 10 and texture number 1.
vii. The seventh combination is between the most typical shape with the most novel
texture. For the toothbrush, the combination is between shape number 1 and
texture number 10. For the computer mouse the combination is between shape
number 1 and texture number 10.Two neutral combinations. For the toothbrush,
the combinations are between shape number 4 with texture number 5 and shape
number 6 with texture number 3. For the computer mouse the combinations are
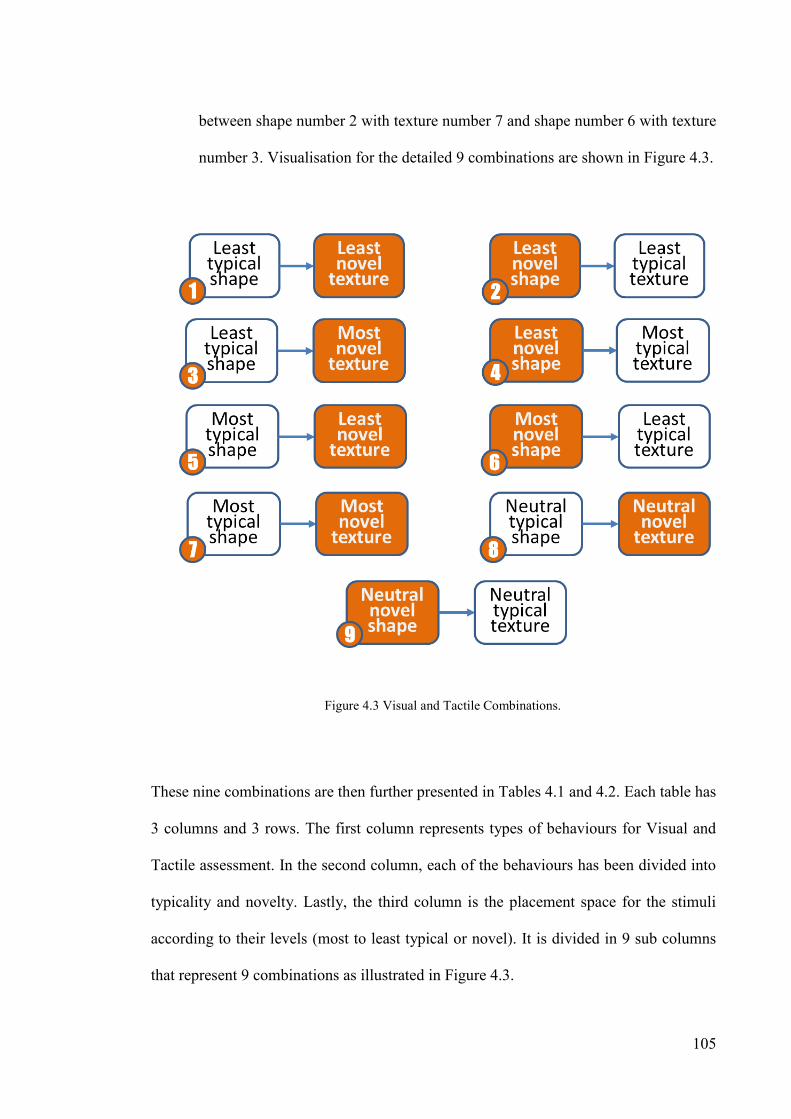
105
between shape number 2 with texture number 7 and shape number 6 with texture
number 3. Visualisation for the detailed 9 combinations are shown in Figure 4.3.
These nine combinations are then further presented in Tables 4.1 and 4.2. Each table has
3 columns and 3 rows. The first column represents types of behaviours for Visual and
Tactile assessment. In the second column, each of the behaviours has been divided into
typicality and novelty. Lastly, the third column is the placement space for the stimuli
according to their levels (most to least typical or novel). It is divided in 9 sub columns
that represent 9 combinations as illustrated in Figure 4.3.
Figure 4.3 Visual and Tactile Combinations.

106
In the tables, ‘L’ represents the lowest level (least), ‘N’ is neutral and ‘M’ is the highest
level (most). Placement of stimuli was based on the data analysis from experiment 1.
Based on these placements, new combinations of stimuli were created.
There are two different types of indication arrows in the tables; outline arrows and solid
coloured arrows. Outline arrows indicate the normal combination. There are a number of
repetitions of combination in those two tables. These repetitions of combinations are
shown in the table using solid coloured arrows and marked with R#. A repetition of a
combination refers to an identical combination that exists in the table even though it was
created from two different conditions. Further discussions of each combination for each
of the products created from the table is given in the sub section 4.3.1. Each combination
is also illustrated in the tables in section 4.3.1
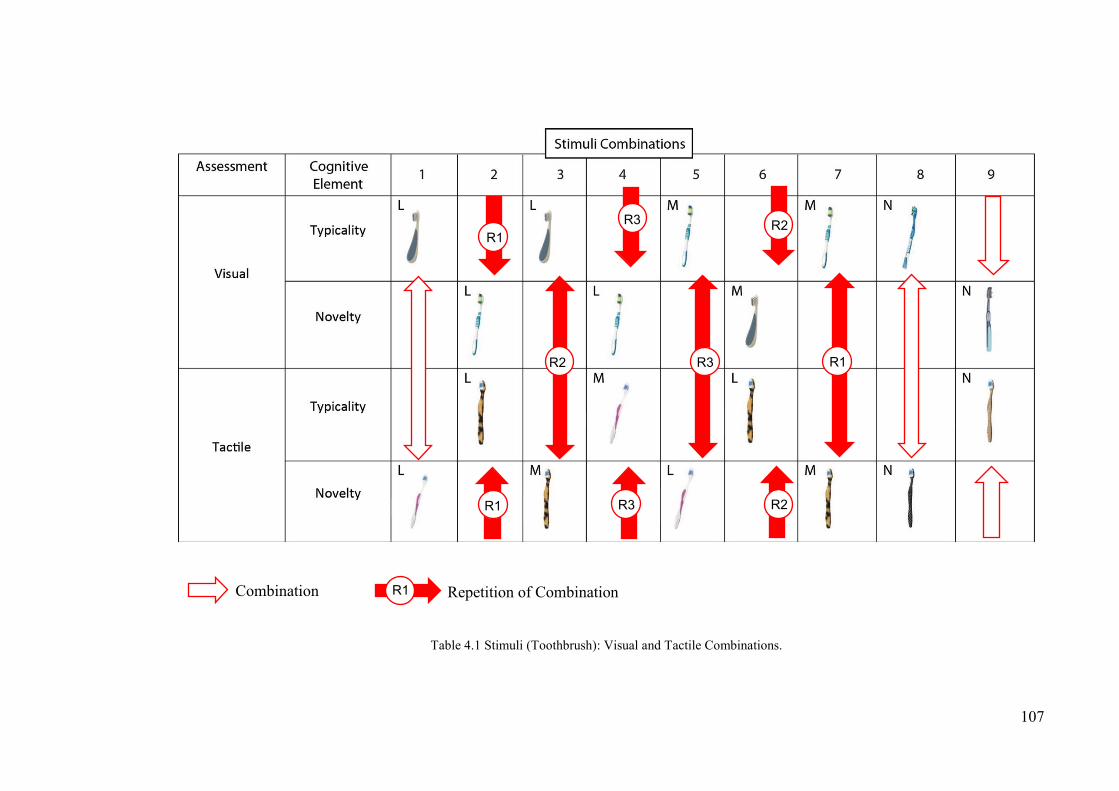
107
R1 Combination Repetition of Combination
R1
R1
R1 R2
R2
R2
R3
R3
R3
Table 4.1 Stimuli (Toothbrush): Visual and Tactile Combinations.

108
Combination Repetition of Combination R1
R1
R1
R1
Table 4.2 Stimuli (Computer Mouse): Visual and Tactile Combinations.

109
4.3.1. Combinations.
This section provides a detailed explanation of every combination created from Table 4.1
and Table 4.2. Each of the stimuli combinations was extracted from the main stimuli
combination tables and then visualised in the form of another instructive table for better
understanding. Since both products were using the same 9 stimuli combinations, the
tables will include both computer mouse and toothbrush in each of the discussions.
Combination 1 was the least typical shapes with the least novel textures. The result of this
combination is shown in Table 4.3 below.
Table.4.3 Combination 1
For the toothbrush, the least typical shape is represented by toothbrush named Dews in
the table. The shape was combined with a standard or ordinary texture as the least novel
texture. The result for this combination is shown in the toothbrush combination 1 result
column.
Combination Result Least typical shape Least novel texture Combination 1
With
Toothbrush
Vertical Computer Mouse
With
Dews Ordinary
Ordinary
ORDINARY
ORDINARY

110
For the computer mouse, the least typical shape is represented by the computer mouse
named Vertical in Table 4.3 above. The shape was combined with a standard or ordinary
texture as the least novel texture. The result for this combination is shown in the computer
mouse combination 1 result column. Combination 2 was the least novel shapes with the
least typical textures. The result for this combination is shown in Table 4.4. For the
toothbrush, the least novel shape is represented by the toothbrush named Extra Clean.
The shape was combined with a thick furry texture as the least typical texture. The result
for this combination is shown in the toothbrush combination 2 result column.
Table.4.4 Combination 2.
For the computer mouse, the least novel shape is represented by the computer mouse
named Lily Gyro. The shape was combined with a thick furry texture as the least typical
texture. The result for this combination is shown in the computer mouse combination 2
Combination Result
Least novel shape Least typical texture Combination 2
With
Toothbrush
Lily Gyro
With
Extra Clean Thick Fur
Thick Fur Computer Mouse

111
result columns. Combination 3 was the least typical shapes with the most novel texture.
The result for this combination is shown in Table 4.5 For the toothbrush, the least typical
shape is represented by the toothbrush named Dews. The shape was combined with a
thick furry texture as the most novel texture. The result for this combination is shown in
the toothbrush combination 3 result column. This combination was repeated in
combination number 6.
Table 4.5 Combination 3
For the computer mouse, the least typical shape is represented by the computer mouse
named Vertical. The shape was combined with a thick furry texture as the most novel
texture. The result for this combination is shown in the computer mouse combination 3
result column. This combination was repeated in combination number 6.
Combination Result
Least typical shape Most novel texture Combination 3
Dews
Thick fur
With
Toothbrush
With
Vertical Computer Mouse Thick Fur
Thick Fur

112
Combination 4 was the least novel shapes with the most typical texture. The result for
this combination is shown in Table 4.6. For the toothbrush, the least novel shape is
represented by the toothbrush named Extra Clean. The shape was combined with an
ordinary texture as the most typical texture. The result for this combination is shown in
the toothbrush combination 4 result column.
Table 4.6 Combination 4
For the computer mouse, the least novel shape is represented by the computer mouse
named Lily Gyro. The shape was combined with an ordinary texture as the most typical
texture. The result for this combination is shown in the computer mouse combination 4
result column.
Combination 5 was the most typical shapes with the least novel texture. The result for
this combination is shown in Table 4.7. For the toothbrush, the most typical shape is
Combination Result
Least novel shape Most typical texture Combination 4
Extra Clean
Ordinary
With
Toothbrush
With
Ordinary Gyro Computer Mouse
ORDINARY
ORDINARY

113
represented by the toothbrush named Extra Clean. It was combined with an ordinary
texture as the least novel texture. The result for this combination is shown in the
toothbrush combination 5 result column. This combination result was generated before
as a combination number 4.
Table 4.7 Combination 5.
For the computer mouse, the most typical shape is represented by the computer mouse
named Blue Track. The shape was combined with a standard texture as the least novel
texture. The result for this combination is shown in the computer mouse combination 5
result column.
Combination 6 was the most novel shapes with the least typical textures. The result for
this combination is shown in Table 4.8. For the toothbrush, the most novel shape is
represented by the toothbrush named Dews. The shape was combined with a thick furry
texture as the least typical texture. The result for this combination is shown in the
Combination Result
Most typical shape Least novel texture Combination 5
Extra Clean
Ordinary
With
Toothbrush
With
Ordinary Blue Track Computer Mouse
ORDINARY
ORDINARY
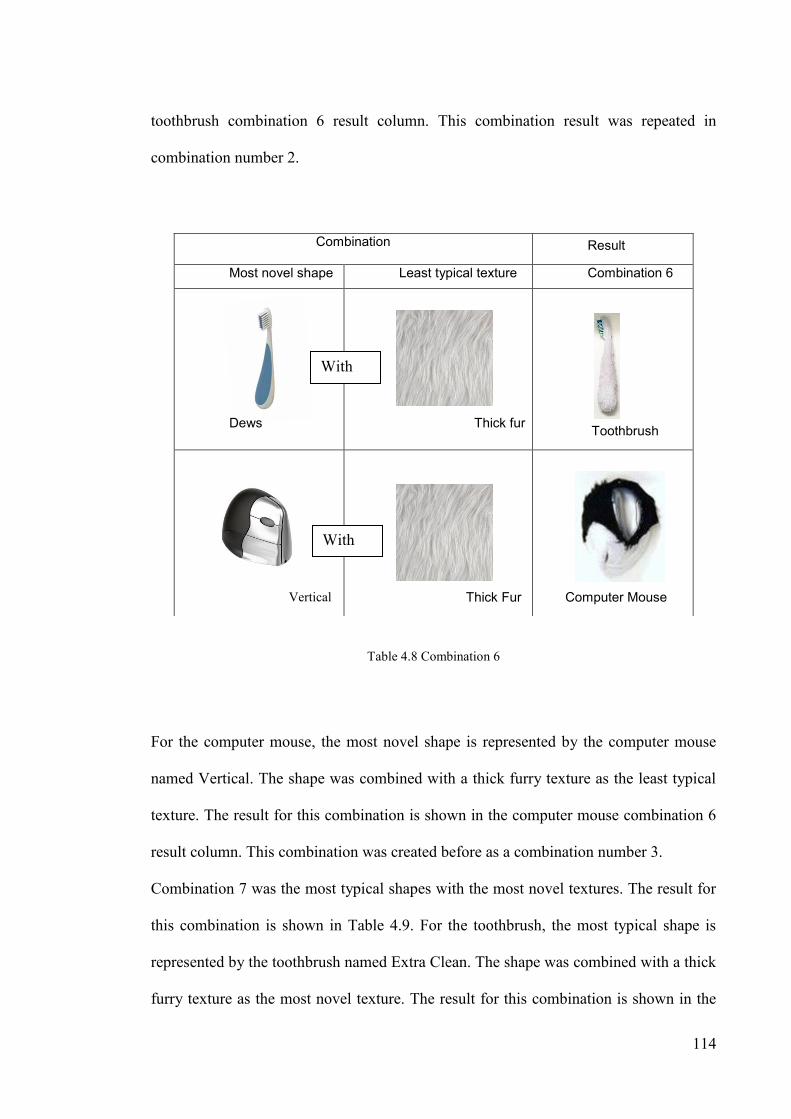
114
toothbrush combination 6 result column. This combination result was repeated in
combination number 2.
Table 4.8 Combination 6
For the computer mouse, the most novel shape is represented by the computer mouse
named Vertical. The shape was combined with a thick furry texture as the least typical
texture. The result for this combination is shown in the computer mouse combination 6
result column. This combination was created before as a combination number 3.
Combination 7 was the most typical shapes with the most novel textures. The result for
this combination is shown in Table 4.9. For the toothbrush, the most typical shape is
represented by the toothbrush named Extra Clean. The shape was combined with a thick
furry texture as the most novel texture. The result for this combination is shown in the
Combination Result
Most novel shape Least typical texture Combination 6
Dews
Thick fur
With
Toothbrush
With
Thick Fur Vertical Computer Mouse
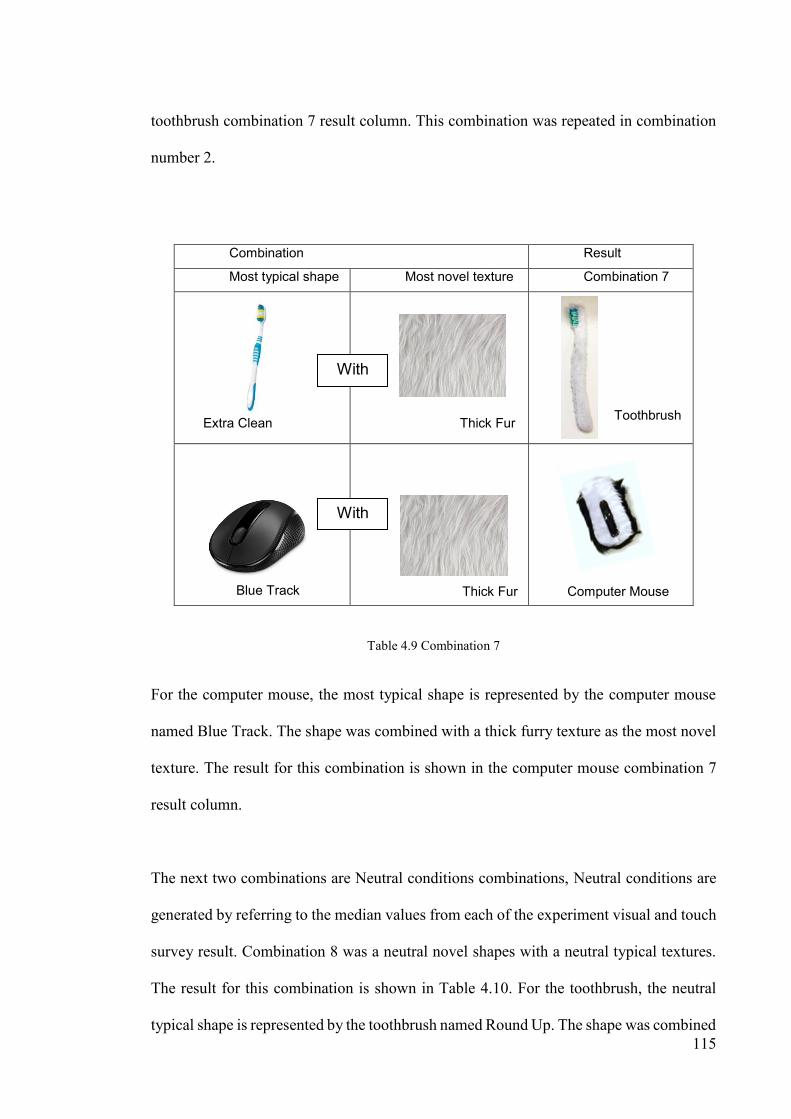
115
toothbrush combination 7 result column. This combination was repeated in combination
number 2.
Table 4.9 Combination 7
For the computer mouse, the most typical shape is represented by the computer mouse
named Blue Track. The shape was combined with a thick furry texture as the most novel
texture. The result for this combination is shown in the computer mouse combination 7
result column.
The next two combinations are Neutral conditions combinations, Neutral conditions are
generated by referring to the median values from each of the experiment visual and touch
survey result. Combination 8 was a neutral novel shapes with a neutral typical textures.
The result for this combination is shown in Table 4.10. For the toothbrush, the neutral
typical shape is represented by the toothbrush named Round Up. The shape was combined
Combination Result
Most typical shape Most novel texture Combination 7
With
Toothbrush
Blue Track Computer Mouse
With
Extra Clean Thick Fur
Thick Fur
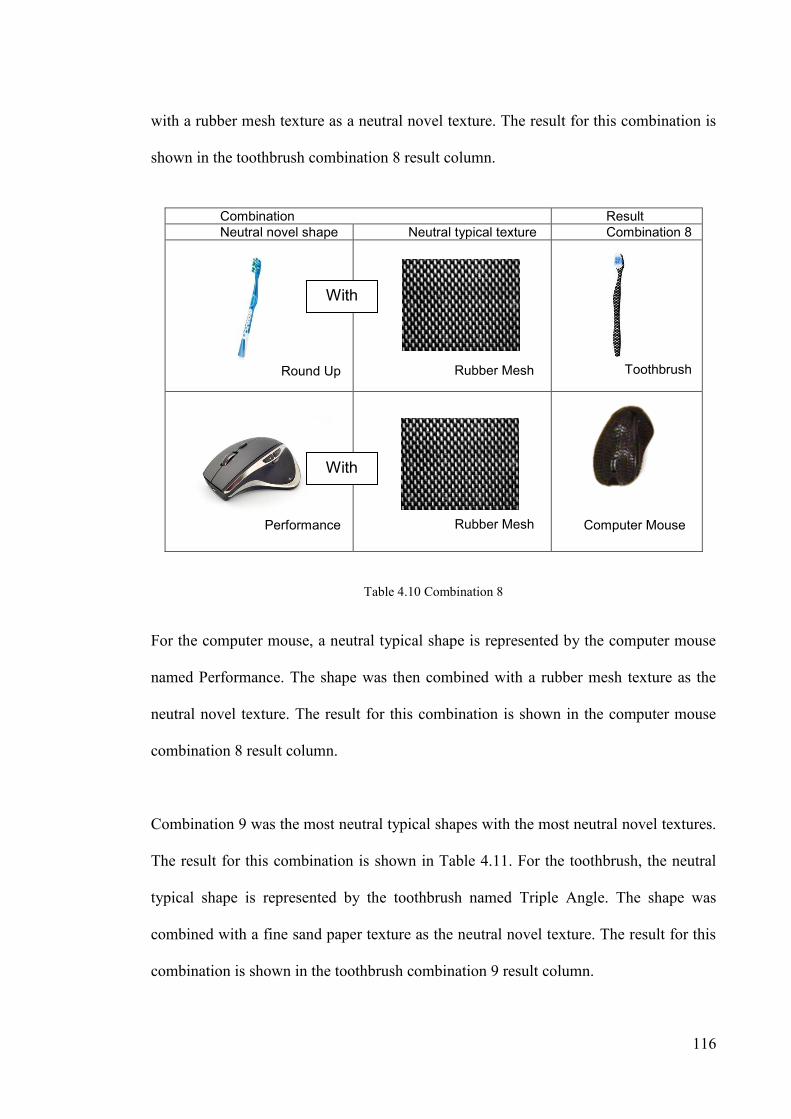
116
with a rubber mesh texture as a neutral novel texture. The result for this combination is
shown in the toothbrush combination 8 result column.
Table 4.10 Combination 8
For the computer mouse, a neutral typical shape is represented by the computer mouse
named Performance. The shape was then combined with a rubber mesh texture as the
neutral novel texture. The result for this combination is shown in the computer mouse
combination 8 result column.
Combination 9 was the most neutral typical shapes with the most neutral novel textures.
The result for this combination is shown in Table 4.11. For the toothbrush, the neutral
typical shape is represented by the toothbrush named Triple Angle. The shape was
combined with a fine sand paper texture as the neutral novel texture. The result for this
combination is shown in the toothbrush combination 9 result column.
Combination Result Neutral novel shape Neutral typical texture Combination 8
With
Toothbrush
Performance Computer Mouse
With
Round Up Rubber Mesh
Rubber Mesh
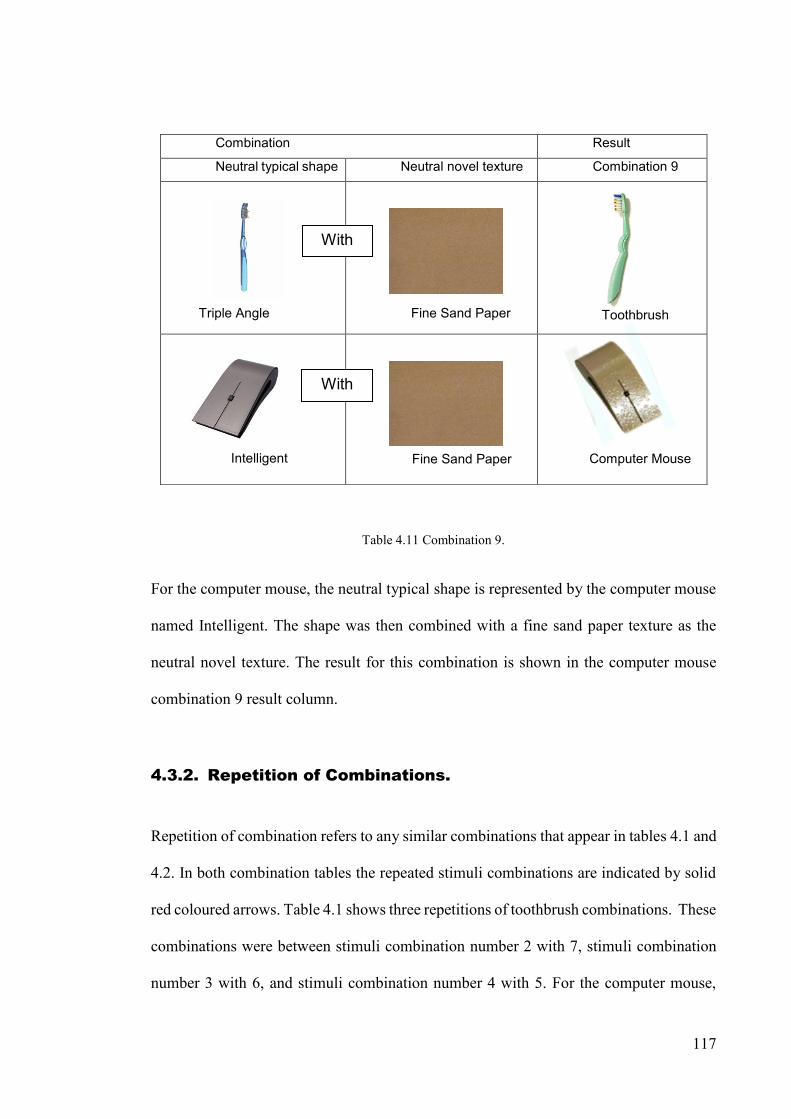
117
Table 4.11 Combination 9.
For the computer mouse, the neutral typical shape is represented by the computer mouse
named Intelligent. The shape was then combined with a fine sand paper texture as the
neutral novel texture. The result for this combination is shown in the computer mouse
combination 9 result column.
4.3.2. Repetition of Combinations.
Repetition of combination refers to any similar combinations that appear in tables 4.1 and
4.2. In both combination tables the repeated stimuli combinations are indicated by solid
red coloured arrows. Table 4.1 shows three repetitions of toothbrush combinations. These
combinations were between stimuli combination number 2 with 7, stimuli combination
number 3 with 6, and stimuli combination number 4 with 5. For the computer mouse,
Combination Result
Neutral typical shape Neutral novel texture Combination 9
With
Toothbrush
Intelligent Computer Mouse
With
Triple Angle Fine Sand Paper
Fine Sand Paper

118
there was only one repetition of combination, between stimuli combination number 3 with
number 6. Refer table 4.2.
Even though the repeated combinations created two identical stimuli, it was important not
to disregard any of the combinations by testing only one instead of two during the second
experiment. This is because each of the stimuli was made from two different product
conditions. It is unusual to present the same product more than once during testing.
Second appearances may be recognised by participants and this may lead to a bias affect.
Therefore, during the second experiment the researcher decided to test just one of any
identical stimuli. However, in order not to neglect the presence of the repeated stimuli,
the same data from the tested stimuli were used for the repeated combination.
4.3.3. Stimuli Fabrication Process.
As stated, in this experiment participants were allowed to experience the stimuli both
visually and tactile. In order to enable both interactions, 3D presentation stimuli (object)
were required. The stimuli development process for Experiment 2 was affected by budget
constraints. The priority was the least costly option that would produce maximum product
realism. First, as many similar products as possible that were available in the market were
collected. Products were sourced both locally and globally through online shopping sites
such as EBay and Amazon. Again, the variables (shapes and textures) were the main
guideline for sourcing products. However, some products took a long time to deliver and
some were very high in cost. Further, not every comparable product was available at local
stores or online sites.

119
Therefore, for the unobtainable shapes the researcher fabricated them using the Computer
Numeric Control (CNC) modelling process. This process began with 3D Computer Aided
Design (CAD) modelling. Once finished, the data from the CAD process were converted
to a transferable format for a 3D printing process such as Stereolithography (STL) or
Initial Graphics Exchange Specification (IGES). The shapes were printed using a 3D
printer machine. The printing process took place at the Industrial Design department
workshop at Swinburne University of Technology. All fabrications and machining
processes were done by the researcher himself assisted by the technical officer from the
workshop. Step by step visualisation of the 3D printing process is shown in figure 4.4.
Following fabrication of the products, texture was applied to the shapes.
Textures for the process were bought from local retail and homewares stores in
Melbourne such as Bunnings and Spotlight. Figure 4.5 shows some of the textures
obtained.
CAD Modelling Printing Outputs
Figure 4.4 CNC 3D Printing Process.

120
The same procedure used for Experiment 1 was used for Experiment 2. Stimuli were
modified by adding selected textures to selected shapes. This process was completed
manually by the researcher and the main reference for stimuli fabrication was from tables
4.1 and 4.2. Textures were created by painting, wrapping and sticking textured materials
to the selected shapes. For example, see figure 4.6.
To ensure that the participants were not influenced by colours during the experiment, both
products were made in common colours schemes. For the computer mouse the colours
ORDINARY
Fine Sand Rubber Thick Fur Ordinary
Figure 4.5 Textures.
Figure 4.6 Example of Texture Creation.

121
selected were black, silver and white. For the toothbrush, the colours scheme were blue
and white.
4.4. Procedures.
In this experiment, visual and tactile assessments were done simultaneously, and each
one of the stimuli was presented as an object. Participants were asked to look at the stimuli
while holding it. Using rating scales, they were then asked to rate the stimuli by placing
their answer on a survey form provided. Unlike Experiment 1, no preventive actions or
equipment were used in this experiment. (See figure 4.7).
After a brief overview of the research provided by the researcher, participants read and
signed the research information and consent forms. (See Appendix F). The survey form
for the experiment was divided into three sections. Similar to the survey form in the first
experiment, the survey began with three demographic questions (refer to Chapter 3 for
discussion of the survey instrument).
Figure 4.7 Experiment 2 Stimuli Assessment.

122
Scales for stimuli assessment were provided in section two (toothbrush) and section three
(computer mouse) of the survey form. Both variables, shape and texture, were assessed
at the same time. The 7 point scales ranged from 1 (not agree at all) to 7 (completely
agree). (See Appendix F). The products presented in this test were different in texture and
variant in shape. Each of the product sets had 9 stimuli. Therefore, there were 18 stimuli
altogether that each of the participants experienced.
Two sequences of stimuli were created for each set: a random order and its reverse. The
random orders were mathematically generated by using the Random Sequence Generator
from https://www.random.org/sequences/. The first 10 participants used the first
sequence while the next 10 used the second sequence. This alternating procedure
continued until the 50th participant. This process was done to avoid order effects in the
stimuli testing sequences.
Under the supervision of the researcher, participants completed the tasks in their own
time. However, most of them took an average between 10 to 15 minutes to finish the
experiment. At the end, each participant was given an AUD$10.00 shopping voucher as
a token of thanks for participation. Flows and procedures of Experiment 2 are given in
Figure 4.8.
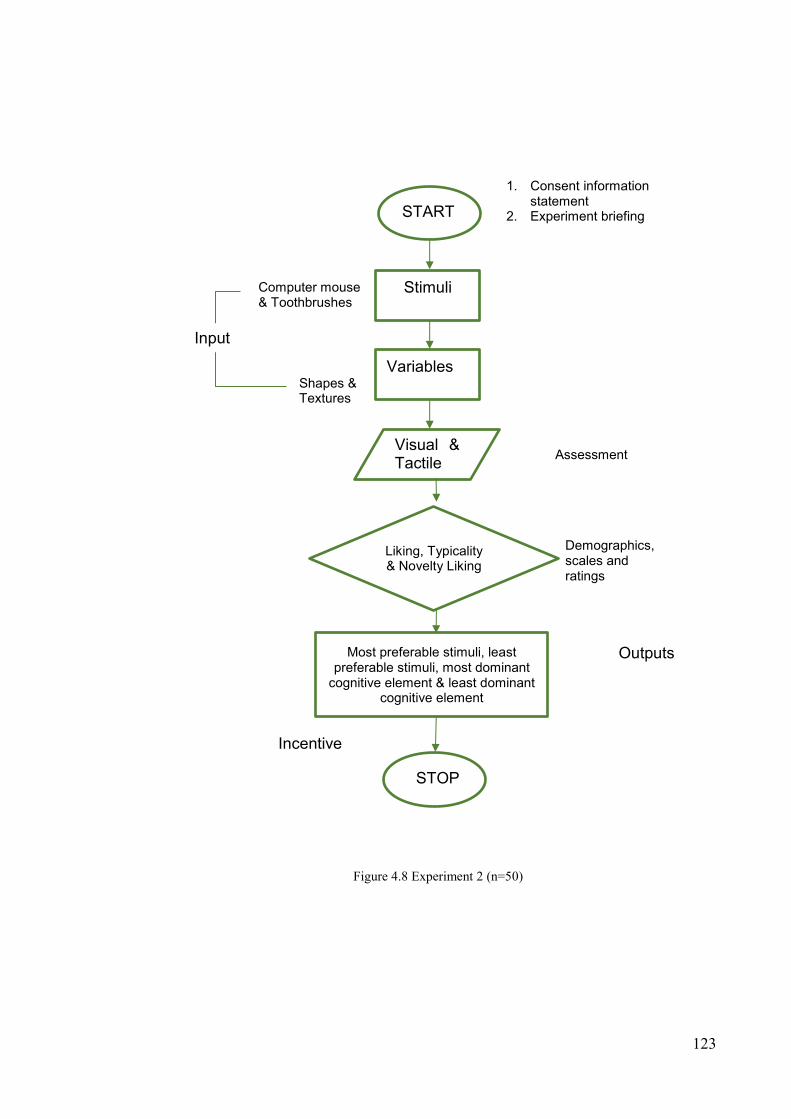
123
START
Stimuli
Variables
Liking, Typicality & Novelty Liking
Visual & Tactile
Most preferable stimuli, least preferable stimuli, most dominant
cognitive element & least dominant cognitive element
STOP
1. Consent information statement
2. Experiment briefing
Computer mouse & Toothbrushes
Input
Assessment
Demographics, scales and ratings
Outputs
Incentive
Shapes & Textures
Figure 4.8 Experiment 2 (n=50)

124
4.5. Results and Analysis
The SPSS software package was again used for the statistical analysis. In this analysis, a
linear mixed models ANOVA was conducted on 900 responses. In order to further explain
the result, multi-dimensional scaling was performed and lastly, correlation analyses was
done in order to look at relations between typicality, novelty and liking, for each of the
products. Table 4.12 shows the stimuli (toothbrush) testing sequence used for the second
experiment. The displayed toothbrushes are in a random sequence. The procedure also
applied to the second set of stimuli, the computer mouse (see Table 4.13). For each of the
assessments each participant used the scale provided as before. These were seven point
Likert scales measuring the degree of typicality, novelty, and liking.
.
Sequence Stimuli
1
2
Table 4.12 Stimuli Testing Sequences (Toothbrush).
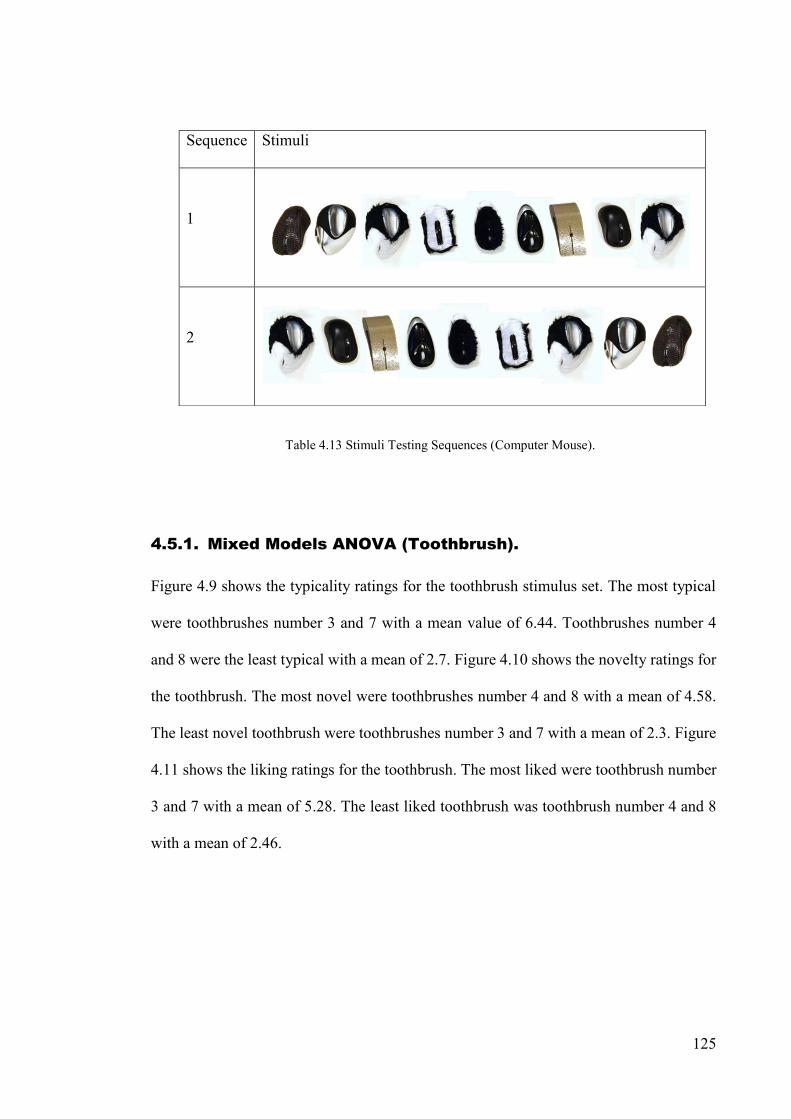
125
4.5.1. Mixed Models ANOVA (Toothbrush).
Figure 4.9 shows the typicality ratings for the toothbrush stimulus set. The most typical
were toothbrushes number 3 and 7 with a mean value of 6.44. Toothbrushes number 4
and 8 were the least typical with a mean of 2.7. Figure 4.10 shows the novelty ratings for
the toothbrush. The most novel were toothbrushes number 4 and 8 with a mean of 4.58.
The least novel toothbrush were toothbrushes number 3 and 7 with a mean of 2.3. Figure
4.11 shows the liking ratings for the toothbrush. The most liked were toothbrush number
3 and 7 with a mean of 5.28. The least liked toothbrush was toothbrush number 4 and 8
with a mean of 2.46.
Sequence Stimuli
1
2
Table 4.13 Stimuli Testing Sequences (Computer Mouse).
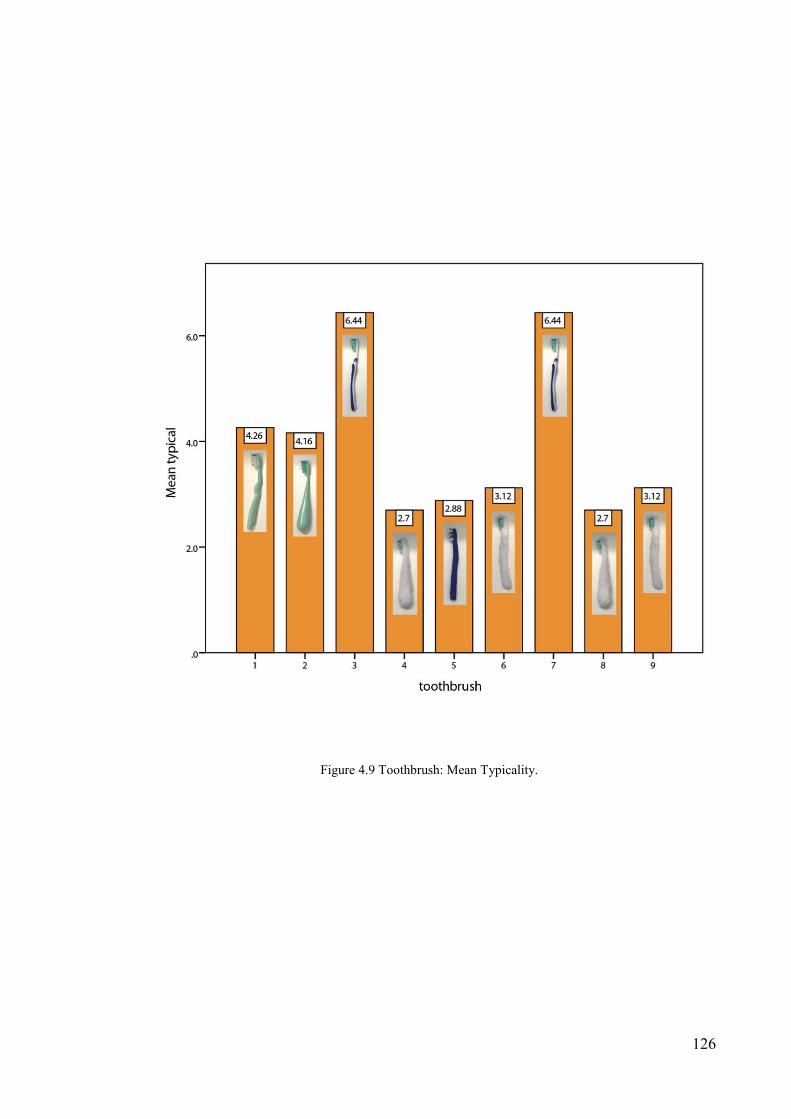
126
Figure 4.9 Toothbrush: Mean Typicality.

127
Figure 4.10 Toothbrush: Mean Novelty.

128
Figure 4.11 Toothbrush: Mean Liking.
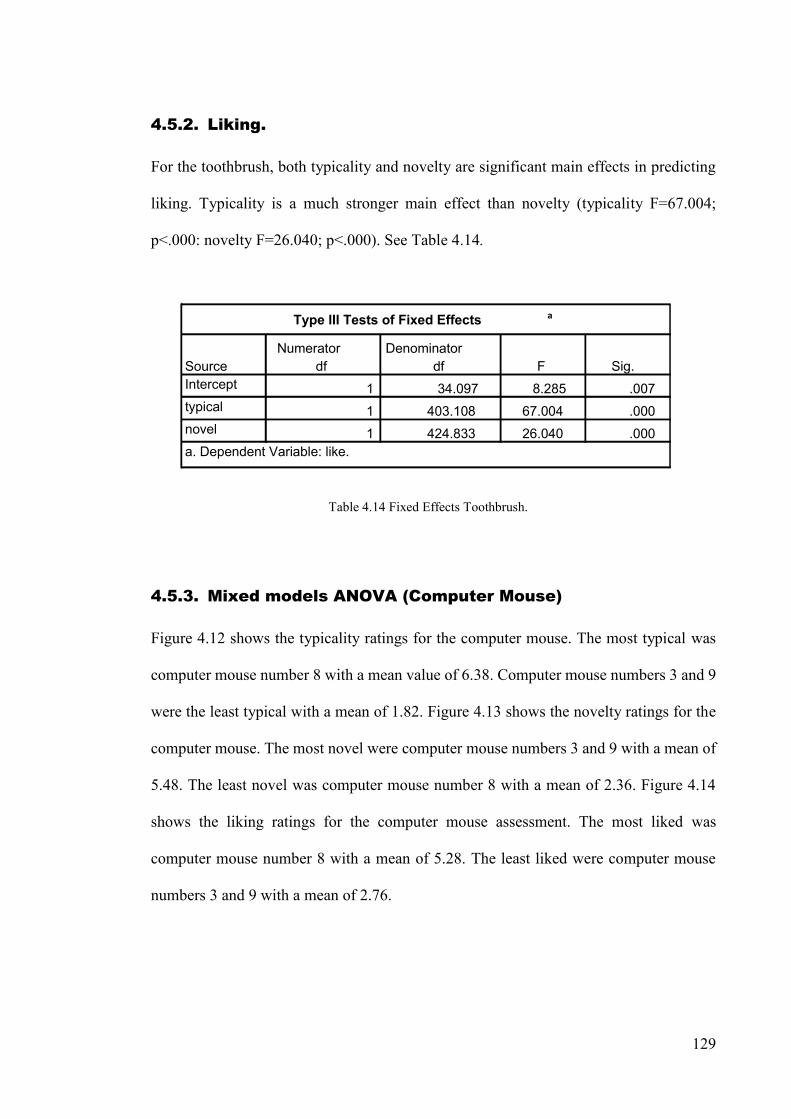
129
4.5.2. Liking.
For the toothbrush, both typicality and novelty are significant main effects in predicting
liking. Typicality is a much stronger main effect than novelty (typicality F=67.004;
p<.000: novelty F=26.040; p<.000). See Table 4.14.
4.5.3. Mixed models ANOVA (Computer Mouse)
Figure 4.12 shows the typicality ratings for the computer mouse. The most typical was
computer mouse number 8 with a mean value of 6.38. Computer mouse numbers 3 and 9
were the least typical with a mean of 1.82. Figure 4.13 shows the novelty ratings for the
computer mouse. The most novel were computer mouse numbers 3 and 9 with a mean of
5.48. The least novel was computer mouse number 8 with a mean of 2.36. Figure 4.14
shows the liking ratings for the computer mouse assessment. The most liked was
computer mouse number 8 with a mean of 5.28. The least liked were computer mouse
numbers 3 and 9 with a mean of 2.76.
Numerator df
Denominator df F Sig.
Intercept 1 34.097 8.285 .007typical 1 403.108 67.004 .000novel 1 424.833 26.040 .000
Type III Tests of Fixed Effects a
Source
a. Dependent Variable: like.
Table 4.14 Fixed Effects Toothbrush.

130
Figure 4.12 Computer Mouse: Mean Typicality.

131
Figure 4.13 Computer Mouse: Mean Novelty.
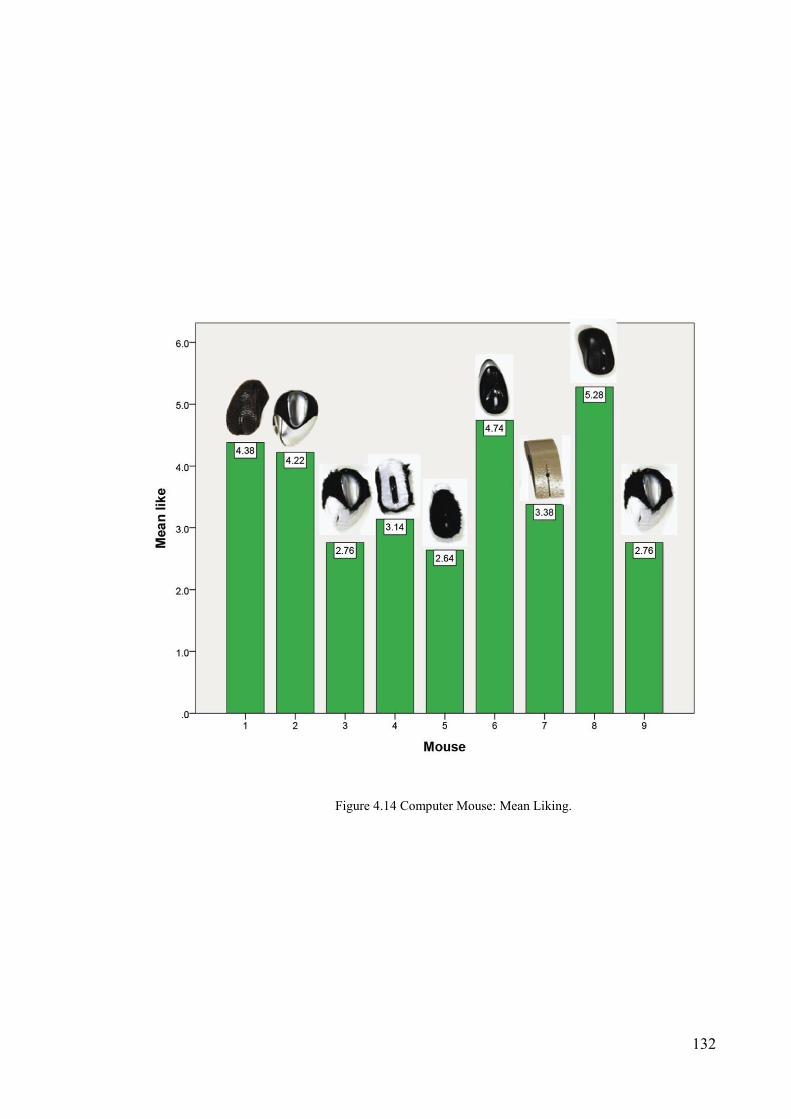
132
Figure 4.14 Computer Mouse: Mean Liking.

133
4.5.4. Liking.
Table.4.15 Fixed Effects Computer Mouse.
For the computer mouse, both typicality and novelty are significant main effects in
predicting liking. However, typicality is a much stronger main effect than novelty
(typicality F=120.422; p<.000: novelty F=35.637; p<.000) See Table 4.15.
Type III Tests of Fixed Effectsa
Source Numerator df Denominator df F Sig.
Intercept 1 99.462 2.982 .087
typical 1 250.574 120.422 .000
novel 1 442.242 35.637 .000
a. Dependent Variable: like.

134
4.5.5. MDS (Multi-Dimensional Scaling) Toothbrush
MDS (PROXSCAL) was used to look at proximities between stimuli. Initially, the MDS
model was analyzed as 2 dimensions.
Table 4.16 Toothbrush MDS 2 Dimension Stress and Fit Measures.
Table 4.16. shows the Toothbrush MDS 2 Stress and Fit measures. The Kruskal Stress-1
value (.00550a) which is < .05 indicates that 2 dimensional plot provides an adequate
representation of the proximities data. However, based on Figure 4.15, the U-Shaped plot
suggests a 1 dimensional solution may be adequate. MDS was therefore performed using
a 1 dimension space.
Stress and Fit Measures
Normalized Raw Stress .00003
Stress-I .00550a
Stress-II .01006a
S-Stress .00000b
Dispersion Accounted For (D.A.F.) .99997
Tucker's Coefficient of Congruence .99998
PROXSCAL minimizes Normalized Raw Stress.
a. Optimal scaling factor = 1.000.
b. Optimal scaling factor = 1.000.

135
Figure 4.15 Toothbrush Common Space 2 Dimension.
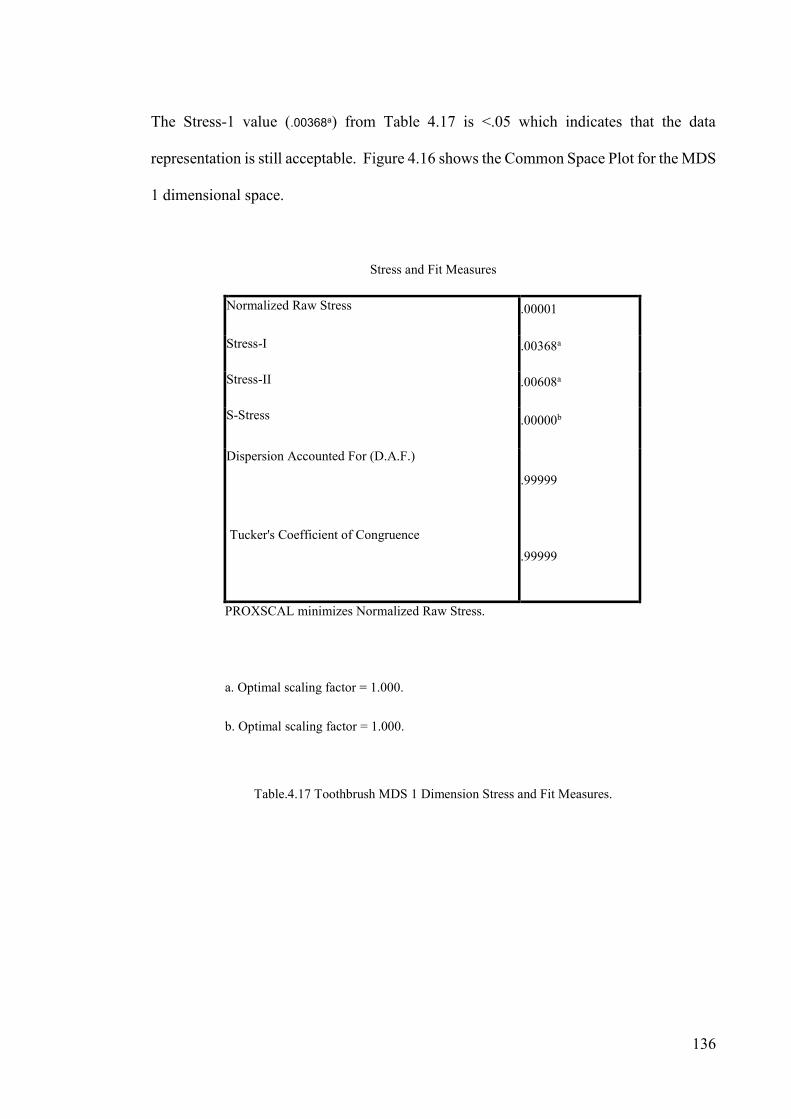
136
The Stress-1 value (.00368a) from Table 4.17 is <.05 which indicates that the data
representation is still acceptable. Figure 4.16 shows the Common Space Plot for the MDS
1 dimensional space.
Stress and Fit Measures
Normalized Raw Stress .00001
Stress-I .00368a
Stress-II .00608a
S-Stress .00000b
Dispersion Accounted For (D.A.F.)
.99999
Tucker's Coefficient of Congruence .99999
PROXSCAL minimizes Normalized Raw Stress.
a. Optimal scaling factor = 1.000.
b. Optimal scaling factor = 1.000.
Table.4.17 Toothbrush MDS 1 Dimension Stress and Fit Measures.

137
Figure 4.16 Toothbrush Common Space 1 Dimension.

138
4.5.6. MDS (Multi-Dimensional Scaling) Computer Mouse
As with the toothbrush, MDS was performed for the computer mouse. Initially, the MDS
model was analyzed as 2 dimensions..
Table 4.18 Toothbrush MDS 2 Dimension Stress and Fit Measures.
Table 4.18. shows the Computer Mouse MDS 2 Stress and Fit measures. The Kruskal
Stress-1 value (.03448a) which is <. 05 indicates that 2 dimensional plot provides an
adequate representation of the proximities data. However, based on Figure 4.17, the
inverted U-Shaped plot suggests a 1 dimensional solution may be adequate. MDS was
therefore performed using a 1 dimension space.
Stress and Fit Measures
Normalized Raw Stress .00119
Stress-I .03448a
Stress-II .07287a
S-Stress .00314b
Dispersion Accounted For (D.A.F.) .99881
Tucker's Coefficient of Congruence .99941
PROXSCAL minimizes Normalized Raw Stress.
a. Optimal scaling factor = 1.001.
b. Optimal scaling factor = .999.

139
Figure 4.17 Computer Mouse Common Space 2 Dimension.

140
The Stress-1 value (.00368a) from Table 4.19 is <.1 which indicates that the data
representation is still acceptable. Figure 4.18 shows the Common Space Plot for the MDS
1 dimensional space.
Stress and Fit Measures
Normalized Raw Stress .00001
Stress-I .00368a
Stress-II .00608a
S-Stress .00000b
Dispersion Accounted For (D.A.F.) .99999
Tucker's Coefficient of Congruence .99999
PROXSCAL minimizes Normalized Raw Stress.
a. Optimal scaling factor = 1.000.
b. Optimal scaling factor = 1.000.
Table 4.19 . Toothbrush MDS 1 Dimension Stress and Fit Measures.

141
Figure 4.18 Toothbrush Common Space 1 Dimension.

142
4.5.7. Correlation Analysis.
Finally, correlation analysis was performed to look at associations among the three
measures.
4.5.7.1. Toothbrush.
A Pearson correlation was computed to assess the relationship between each of the
measures.
Correlations
liking Typicality novelty
liking Pearson Correlation 1 .999** -.984**
Sig. (2-tailed) .000 .000
N 9 9 9
Typicality Pearson Correlation .999** 1 -.981**
Sig. (2-tailed) .000 .000
N 9 9 9
novelty Pearson Correlation -.984** -.981** 1
Sig. (2-tailed) .000 .000
N 9 9 9
**. Correlation is significant at the 0.01 level (2-tailed).
Table 4.20 Toothbrush Pearson Correlation Analysis.
Table 4.20 indicates a strong positive correlation between liking and typicality r = 0.999,
n = 9, p = 0.000. There was also a strong negative correlation between liking and novelty
r = -.984, n = 9, p = 0.000, and between typicality and novelty r = -.981, n = 9, p = 0.000.
Overall, there was a strong, positive correlation between liking and typicality. Increases

143
in typical features (shape and texture) were correlated with increases in liking towards
the toothbrush.
4.5.7.2. Computer Mouse.
A Pearson correlation was computed to assess the relationship between each of the
measures.
Correlations
liking Typicality novelty
liking Pearson Correlation 1 .852** -.729*
Sig. (2-tailed) .004 .026
N 9 9 9
Typicality Pearson Correlation .852** 1 -.968**
Sig. (2-tailed) .004 .000
N 9 9 9
novelty Pearson Correlation -.729* -.968** 1
Sig. (2-tailed) .026 .000
N 9 9 9
**. Correlation is significant at the 0.01 level (2-tailed).
*. Correlation is significant at the 0.05 level (2-tailed).
Table 4.21 Computer Mouse Pearson Correlation Analysis.
Table 4.21 indicates a strong positive correlation between liking and typicality r = 0.852,
n = 9, p = 0.004. There was also a strong negative correlation between liking and novelty
r = -.729, n = 9, p = 0.026, and between typicality and novelty r = -.968, n = 9, p = 0.000.
Overall, there was a strong, positive correlation between liking and typicality. Increases

144
in typical features (shape and texture) were correlated with increases in liking towards
the computer mouse.
4.6. Discussion.
The results for the toothbrush and computer mouse are similar in that liking can be
accounted for by the two predictor variables, typicality and novelty. Liking is positively
associated with typicality and negatively associated with novelty. Their contribution to
explaining liking is simple, as indicated by the 1-dimensional MDS solution.
Where differences lie is in the strength of each predictor’s contribution. For the
toothbrush there is an almost perfect positive association between liking and typicality
(p=.999) coupled with an almost perfect negative association between liking and novelty
(p=-.984). However, for the computer mouse those associations, though significant and
in the same directions, are not of the same magnitude.
This research was initiated by two research questions; Do the laws that pertain to the
visual also pertain to the tactile? How do these two sensory modalities interact? For
example, how does high typicality in one sensory modality interact with high novelty in
another modality? To answer the research questions two sets of data comparisons were
created. We investigated the role of the visual versus the tactile for both products by
suggesting new random typicality and novelty with visual and tactile combinations over
likings. This data comparison was based on the research findings that typicality is more
significant than novelty. The random combination selected to explain the role of visual
was between the most typical shape with the most novel texture while for the tactile it
was between the least typical shape with most typical texture. Figure 4.19 shows the role

145
of visual versus the tactile for toothbrush. The mean value for visual stimuli is 2.66. The
mean value for tactile stimuli is 3.52.
In Addition, Figure 4.20 illustrates the role of visual versus the tactile for computer
mouse. The mean value for visual stimuli is 3.14. The mean value for tactile stimuli is
4.22.
Although visual stimuli were presented by the most ordinary shape, still it is clear that for
both stimuli texture is more dominant that visual. To summarise, for both products
typicality was the main preference to appraise aesthetics. However, as figures 4.19 and
4.20 illustrate, products with novel shape and typical texture were more preferred than
Least Typical Shape
Most Typical Texture
Most Typical Shape
Most Novel Texture
Mean = 2.66 Mean = 3.52
CO
MBI
NAT
ION
CO
MBIN
ATION
Most Typical Texture
Mean = 3.14
Least Typical Shape
Most Typical Shape
Most Novel Texture
Mean = 4.22
Figure 4.19 The Role of Visual Versus the Tactile (Toothbrush).
Figure 4.20 The Role of Visual Versus the Tactile (Computer Mouse).

146
products with typical shape and novel texture. Therefore, based on the last findings the
following supports were made to the four hypotheses underpinning this study. Firstly, this
research strongly supported the first and second hypotheses that we need both typical
attributes to design the most preferable product and products with both novel features are
less preferred. However, results from this research do not support the third and fourth
hypotheses that products with the combination of typical shape and novel texture will be
more preferred and products with the combination of typical texture and novel shape will
be least preferred.

147
5. DISCUSSION AND CONCLUSION.
5.1. Introduction.
The research questions were framed within the fields of both cognitive aesthetics and
multi-sensory aesthetics. Within the former they focused upon the role of typicality and
novelty in determining liking for designed products. As previously discussed, novelty
was regarded as the primary determinant of liking, whereby intermediate levels of novelty
generated highest aesthetic preference (Berlyne, 1970). This came from the era of
Behaviourism. With the advent of Cognitivism within psychology in the 1970s, typicality
emerged as a powerful predictor (Whitfield & Slatter, 1979).
It will be apparent that typicality - that which we know - is diametrically opposed to
novelty - that which we do not know. And as empirical evidence supports both positions,
the question is how do they interact? While the weight of evidence favours typicality as
the dominant force, nonetheless, novelty needs to be accounted for. Furthermore, real-
world experience indicates that designed products change. If typicality - what we know -
entirely predicted consumer preferences, then designs for cars, clothing, and the myriad
of products that we purchase would not change. My new Ford or BMW would look
exactly the same as the 1970 vintage. Clearly, this is not the case. So, the quest to
understand how these two forces interact is a primary concern of current research. Within
multi-sensory aesthetics the fundamental question is: do the laws that pertain to one sense
modality pertain to the others? The vast majority of research in this field has been in the

148
visual, with a poor second in the aural. Therefore, our understanding of aesthetics has a
distinctly visual bias. While this may be acceptable in the fine arts, with designed products
other senses assume importance. This is particularly so for the tactile, whereby many
designed products are ‘felt’ by hand. It is worth noting that while paintings are ‘looked
at’, so are sculptures. Significant sculptures are shielded from the public. They are to be
‘looked at’ rather than ‘felt’. Think of Michelangelo’s Pieta. This places designed
products into a different category of experience. They are purchased and handled - ‘felt’.
5.2. Typicality and Novelty.
The experimental results for cognitive aesthetics are unequivocal. Typicality emerges as
the dominant predictor, with the role of novelty as marginal at best. Experiment 2 is
instructive whereby liking has an almost perfect positive correlation with typicality and
an almost perfect negative correlation with novelty. A literal interpretation of the data is
that typicality is liked and novelty is disliked.
Another interesting feature of the data in Experiment 2 is the almost perfect negative
correlation between typicality and novelty. This suggests that typicality and novelty may
be opposing poles of the same scale. However, this conflicts with results from a related
PhD project within ProjectUMA (Thai) using chairs as stimuli and the same measurement
scales. Thai’s study found that high typicality and high novelty jointly predicted high
liking. Effectively, these are two independent scales. In combination, therefore, the
unpublished results from Thai’s PhD research and the present research create a
conundrum. How can typicality and novelty be both poles of the same scale and two
independent scales?

149
The answer to this may lie in the work of another ongoing UMA PhD project. Using the
same measurement scales, Tyagi found that responses to ‘rich’ object categories were
different to responses to ‘poor’ object categories. Borrowing from the work of Whitfield
(2000), ‘rich’ object categories have many sub-categories. For example, chair has many
sub-categories, such as armchair, office chair, deckchair, dining chair, and dentist’s chair,
to name but a few. ‘Poor’ object categories have few sub-categories. For example, piano
has only upright and grande. Whitfield hypothesized that response to ‘rich’ object
categories will be more tolerant of novelty than response to ‘poor’ object categories.
Tyagi's work supported this.
The present research fits firmly into the ‘poor’ object category domain. The two designed
objects, toothbrush and computer mouse, have few, if any, sub-categories. It is difficult
to name any sub-categories of computer mouse, and toothbrush has ‘normal’ and electric,
but even they have not acquired distinguishing names such as armchair and dining chair.
The results, therefore, are consistent with Whitfield’s hypothesis: liking for ‘poor’ object
categories is almost entirely predicted by typicality. Translating this into the world of the
designer, it means that ‘poor’ object categories afford the designer few opportunities for
innovation. Imagine trying to design an innovative piano that people will actually buy. A
piano should be wood, in brown or black, and look like pianos of the 1920s and 1930s.
Contrast that with designing a chair. It can be wood, metal or plastic, and in almost any
colour. Naturally, designers favour ‘rich’ object categories that are highly tolerant of
design innovation.

150
5.3. Visual and Tactile.
Regarding the multi-sensory, the results of Experiment 2 support the position that the
laws pertaining to one sense modality pertain to the others. Clearly, Experiment 2 was
limited to the visual and the tactile; however, the same relationships emerged between
typicality and novelty in predicting liking.
An interpretation of this difference is inevitably speculative. A plausible explanation is
that for proximal stimuli involving touch, taste, and smell, safety (typicality) may be
strongly favored over risk (novelty). Whereas for distal stimuli - sight and sound - more
risk can be tolerated. From an evolutionary perspective a potentially dangerous object
detected at a distance via sight or sound can be avoided, whereas a potentially dangerous
object experienced via touch, taste or smell is much more difficult to avoid. And perhaps
the most dangerous of all will be the domain of taste, where the object is already inside
the body. A computer mouse is experienced via sight and touch, but a toothbrush actually
enters the body via the mouth. To extend the above into a formal cross-sensory
hypothesis: tolerance of novelty is inversely related to threat, which is inversely related
to proximity to the body. As such, tolerance of novelty will be greater for the distal senses,
and lesser for the proximal senses. The distal sense, vision, will tolerate most novelty,
and the proximal sense, taste, will tolerate least, with the other senses occupying
intermediate positions.
The one notable exception to this consistency across the visual and the tactile lay in the
negative response to high tactile novelty in the toothbrush. Effectively, novelty in the feel
of the toothbrush was unacceptable. As indicated in the previous chapter, this suggests a
possible difference in affective responses by the distal senses (vision and hearing) and the
151
proximal senses (taste, touch, and smell). A plausible hypothesis is that the distal senses
are more tolerant of novelty than the proximal senses. From an evolutionary standpoint,
the possible danger posed by the novel can be averted if detected at a distance by vision
or hearing. The lion visually detected in the nearby valley can be avoided. The lion
detected by touch or smell cannot, and would lead to almost certain death.
Toothbrush has an unusual status as a designed product in that it enters the body - the
mouth - as do food and drink. This therefore engages the proximal senses of touch, taste,
and smell. While the toothbrushes used in Experiment 2 were not actually placed in
participants’ mouths, nonetheless participants would be familiar with their purpose.
5.4. Suggestions for Future Research.
Two avenues for further research are to extend the range of sense modalities used, and to
use ‘rich’ object categories, as distinct from the ’poor’ object categories employed in the
present research. Extending the range of sense modalities would enable the hypothesis
framed above to be tested. Using both ‘rich’ and ‘poor’ object categories would allow the
role of the object category to be better understood.

152

153
BIBLIOGRAPHY.
Baumgarten, A. G. (1954). Reflections on Poetry Alexander Gottlieb Baumgarten's
Meditationes Philosophicae de Nonnullis Ad Poema Pertinentibus: University of California Press.
Berlyne, D. E. (1960a). Conflict, arousal, and curiosity. New York, NY, US: McGraw-Hill Book
Berlyne, D. E. (1960b). Novelty, uncertainty, conflict, complexity. In Conflict, Arousal, and Curiosity: McGraw-Hill.
Berlyne, D. E. (1970). Novelty, complexity, and hedonic value. Attention, Perception, & Psychophysics, 8(5), 279-286.
Berlyne, D. E. (1971). Aesthetics and Psychobiology New York: Appleton Century Crofts.
Blijlevens, J., Carbon, C. C., Mugge, R., & Schoormans, J. P. (2012). Aesthetic appraisal of product designs: Independent effects of typicality and arousal. Br J Psychol, 103(1), 44-57. doi:10.1111/j.2044-8295.2011.02038.x
Blijlevens, J., Gemser, G., & Mugge, R. (2011). The importance of being ‘well-placed’: The influence of context on perceived typicality and esthetic appraisal of product appearance. Acta Psychol (Amst), 178-186. doi:10.1016/j.actpsy.2011.11.004
Brattico, E., Alluri, V., Bogert, B., Jacobsen, T., Vartiainen, N., Nieminen, S., & Tervaniemi, M. (2011). A functional MRI study of happy and sad emotions in music with and without lyrics. Frontiers in psychology, 2, 308. doi:10.3389/fpsyg.2011.00308
Brattico, E., Bogert, B., & Jacobsen, T. (2013). Toward a neural chronometry for the aesthetic experience of music. Frontiers in psychology, 4, 206. doi:10.3389/fpsyg.2013.00206
Cabanac, M. (1979). Sensory pleasure. The Quarterly Review of Biology, 54(1), 1-29. doi:10.1086/410981
Cerling, T. E., Wynn, J. G., Andanje, S. A., Bird, M. I., Korir, D. K., Levin, N. E., . . . Remien, C. H. (2011). Woody cover and hominin environments in the past 6[thinsp]million years. Nature, 476(7358), 51-56. doi:http://www.nature.com/nature/journal/v476/n7358/abs/nature10306.html#supplementary-information
Cila, N., Rozendaal, M., Berghman, M., & Hekkert, P. Searching for balance in aesthetic pleasure in interaction. Design and semantics of form and movement, 19.
Demattè, M. L., Sanabria, D., Sugarman, R., & Spence, C. (2006). Cross-modal interactions between olfaction and touch. Chemical Senses, 31(4), 291-300. doi:10.1093/chemse/bjj031
Dion, K., Berscheid, E., & Walster, E. (1972). What is beautiful is good. Journal of personality and social psychology, 24(3), 285-290.
154
Ekman, G., Hosman, J., & Lindstrom, B. (1965). Roughness, smoothness, and preference: A study of quantitative relations in individual subjects. Journal of Experimental Psychology, 70(1), 18-26.
Essick, G. K., McGlone, F., Dancer, C., Fabricant, D., Ragin, Y., Phillips, N., Jones, T. & Guest, S. (2010). Quantitative assessment of pleasant touch. Neurosci Biobehav Rev, 34(2), 192-203. doi:10.1016/j.neubiorev.2009.02.003
Fechner, G. T. (1876). Preschool of aesthetics. Breitkopf & Härtel, Leipzig. Fechner, G. T. (1948). Elements of psychophysics, 1860. Gibson, J. J. (1962). Observations on active touch. PSYCHOLOGICAL REVIEW, 69(6),
477-491. Hegel, G. W. F. (1835). Hegel's Aesthetics: Lectures on Fine Art, (T. M. Knox, Trans.
1975 ed.). Clarendon: Oxford. Hekkert, P. (2006). Design aesthetics: Principles of pleasure in design. Psychology
science, 48(2), 157. Hekkert, P. (2012). Aesthetic responses to design: A battle of impulses. In J. S. P. Tinio
(Ed.), The Cambridge Handbook of the Psychology of Aesthetics and the Arts, (pp. 277-299): Cambridge: Cambridge University Press.
Hekkert, P. ( 2006 ). Design aesthetics: Principles of pleasure in design. Psychology science, 48(2), p. 157 - 172.
Hekkert, P., Snelders, D., & van Wieringen, P. (2003). 'Most advanced, yet acceptable': Typicality and novelty as joint predictors of aesthetic preference in industrial design. Br. J. Psychol., 94, 111-124.
Ho, A. G. (2010, 29.11.- 01.12.2010). Exploring the relationships between emotion and design process for designers today. In Toshiharu T., & and Yukari N. (Eds.). Paper presented at the Proceedings of the 1st International Conference on Design Creativity (ICDC 2010), Kobe, Japan.
Jansson-Boyd, C. V. (2011). Touch matters: exploring the relationship between consumption and tactile interaction. Social Semiotics, 21(4), 531-546. doi:10.1080/10350330.2011.591996
Kant, I. (1790). Critique of Judgement (J. H. Bernard, Trans. 1951 ed.). New York: Macmillan.
Kaplan, S., Kaplan, R., & Wendt, J. S. (1972). Rated preference and complexity for natural and urban visual material. Attention, Perception, & Psychophysics, 12(4), 354-356.
Karana, E., Hekkert, P., & Kandachar, P. (2009). Meanings of materials through sensorial properties and manufacturing processes. Materials & Design, 30(7), 2778-2784. doi:10.1016/j.matdes.2008.09.028
Karana, E., Pedgley, O., & Rognoli, V. (2014). Introduction to Materials Experience: In E. Karana, O. Pedgley, O., & V. Rognoli (Eds.) Materials Experience: Fundamentals of Materials and Design. Butterworth-Heinemann: Elsevier, UK.
Klatzky, R. L., Lederman, S. J. & Metzger, V. . (1985). Identifying objects by touch: An "expert system". . Perception & Psychophysics., 37(4), 299-302.
Krishna, A., Elder, R., & Caldara, C. (2010). Feminine to smell but masculine to touch? Multisensory congruence and its effect on the aesthetic experience. JOURNAL OF CONSUMER PSYCHOLOGY(20), 410-418.
Küller, R. (1972). A semantic model for describing perceived environment (Vol. Document D12). Stockholm: National Swedish Institute for Building Research, Stockholm.
Lemay, E. P., Clark, M. S., & Greenberg, A. (2010). What Is Beautiful Is Good Because What Is Beautiful Is Desired: Physical Attractiveness Stereotyping as Projection

155
of Interpersonal Goals. Personality and Social Psychology Bulletin, 36(3), 339-353. doi:10.1177/0146167209359700
Li, C., & Chen, T. (2009). Aesthetic visual quality assessment of paintings. IEEE Journal of selected topics in Signal Processing, 3(2), 236-252. doi:10.1109/JSTSP.2009.2015077
Lindberg, S., Roos, A., Kihlstedt, A., & Lindström, M. (2013). A product semantic study of the influence of the sense of touch on the evaluation of wood-based materials. Materials & Design, 52, 300-307. doi:10.1016/j.matdes.2013.05.069
Liu, S. X. (2016). Innovation design: Made in China 2025. Design Management Review, 27(1), 52-58.
Liu, X., Yue, Z., Cai, Z., Chetwynd, D. G., & Smith, S. T. (2008). Quantifying touch–feel perception: tribological aspects. Measurement Science and Technology, 19(8), 084007.
Lubbe, S. (2004). The role of aesthetics in consumers' evaluation of apparel quality: A conceptual framework. Journal of Family Ecology and Consumer Sciences= Tydskrif vir Gesinsekologie en Verbruikerswetenskappe, 32(1), 1-7.
Machotka, P. (1980). Daniel Berlyne's contributions to empirical aesthetics. Motivation and Emotion, 4(2), 113-121.
McCabe, D. B., & Nowlis, S. M. (2003). The Effect of Examining Actual Products or Product Descriptions on Consumer Preference. JOURNAL OF CONSUMER PSYCHOLOGY, 13(4), 431-439. doi:10.1207/S15327663JCP1304_10
Moles, A. A. (1966). Information theory and esthetic perception. Journal of Aesthetics and Art Criticism, 26(4), 552-554.
Mugge, R., & Dahl, D. W. (2013). Seeking the ideal level of design newness: Consumer response to radical and incremental product design. Journal of Product Innovation Management, 30, 34-47. doi:10.1111/jpim.12062
Mugge, R., & Schoormans, J. P. L. (2012a). Newer is better! The influence of a novel appearance on the perceived performance quality of products. J. Eng. Des., 23(6), 469-484. doi:10.1080/09544828.2011.618802
Mugge, R., & Schoormans, J. P. L. (2012b). Product design and apparent usability. The influence of novelty in product appearance. Appl Ergon, 43(6), 1081-1088. doi:10.1016/j.apergo.2012.03.009
Norman, D. A., & Ortony, A. (2003, 12-13 November). Designers and users: Two perspectives on emotion and design. Paper presented at the Symposium on Foundations of Interaction Design Interaction Design Institute, Ivrea, Italy.
Olds, J., & Milner, P. (1954). Positive reinforcement produced by electrical stimulation of septal area and other regions of rat brain. Journal of Comparative and Physiological Psychology, 47(6), 419-427. doi:10.1037/h0058775
Parisi, S., Rognoli, V., & Sonneveld, M. (2017). Material Tinkering. An inspirational approach for experiential learning and envisioning in product design education. The Design Journal, 20(sup1), S1167-S1184.
Peck, J., & Childers, T. L. (2006). If I touch it I have to have it: Individual and environmental influences on impulse purchasing. Journal of Business Research, 59(6), 765-769. doi:http://dx.doi.org/10.1016/j.jbusres.2006.01.014
Reber, R., Schwarz, N., & Winkielman, P. (2004). Processing fluency and aesthetic pleasure: Is beauty in the perceiver's processing experience? Personality and Social Psychology Review, 8(4), 364-382.
Rindova, V. P., & Petkova, A. P. (2007). When is a new thing a good thing? Technological change, product form design, and perceptions of value for product innovations. Organization Science, 18(2), 217-232. doi:10.1287/orsc.1060.0233
156
Rosch, E. (1975). Cognitive representations of semantic categories. Journal of Experimental Psychology: General, 104(3), 192-233.
Rosch, E. (1977). Human categorization. Studies in Cross-Cultural Psychology. 1, 1-49. Schifferstein, H. N. J. (2006). The perceived importance of sensory modalities in product
usage: A study of self-reports. Acta Psychol (Amst), 121(1), 41-64. doi:http://dx.doi.org/10.1016/j.actpsy.2005.06.004
Schifferstein, H. N. J., & Cleiren, M. P. (2005). Capturing product experiences: a split-modality approach. Acta Psychol (Amst), 118(3), 293-318. doi:10.1016/j.actpsy.2004.10.009
Schifferstein, H. N. J., & Hekkert, P. (2011). Multisensory aesthetics in product design. Art and the Senses, 43-569.
Schifferstein, H. N. J. a. (2007). Product Experience. In P. a. Hekkert & b. ProQuest issuing (Eds.), Product Experience (pp. 133-156): Oxford : Elsevier Science.
Schiller, F. (1795). On the Aesthetic Education of Man (2012 ed.). New York: Dover. Silvia, P. J. (2005a). Cognitive appraisals and interest in visual art: Exploring an appraisal
theory of aesthetic emotions. Empirical Studies of the Arts, 23(2), 119-133. doi:doi:10.2190/12AV-AH2P-MCEH-289E
Silvia, P. J. (2005b). Emotional responses to art: From collation and arousal to cognition and emotion. Review of general psychology, 9(4), 342-357.
Simonson, I., & Nowlis, S. M. (2000). The role of explanations and need for uniqueness in consumer decision making: Unconventional choices based on reasons. Journal of consumer research, 27(1), 49-68.
Sonneveld, M. H., Ludden, G. D. S., & Schifferstein, H. N. J. (2008). Multi sensory design in education. In Proceedings of the 5th International Conference on Design and Emotion. , Gothenburg, Sweden: Chalmers University of Technology.
Sparshott, F. E. (1963). The Structure of Aesthetics (Vol. 25): Toronto, University of Toronto Press.
Spence, C., & Gallace, A. (2011). Multisensory design: Reaching out to touch the consumer. Psychology & Marketing, 28(3), 267-308. doi:doi:10.1002/mar.20392
Tiest, W. M. B., & Kappers, A. M. (2006). Analysis of haptic perception of materials by multidimensional scaling and physical measurements of roughness and compressibility. Acta Psychol (Amst), 121(1), 1-20. doi:http://dx.doi.org/10.1016/j.actpsy.2005.04.005
Tractinsky, N. (1997). Aesthetics and apparent usability: Empirically assessing cultural and methodological issues. In Proceedings of the ACM SIGCHI. Paper presented at the Conference on Human factors in computing systems, Atlanta, Georgia, USA.
Tractinsky, N., Katz, A. S., & Ikar, D. (2000). What is beautiful is usable. Interacting with Computers, 13(2), 127-145. doi:http://dx.doi.org/10.1016/S0953-5438(00)00031-X
Tyagi, S., Thurgood, C., & Whitfield, T. W. A. (2013, 2013). Unravelling Novelty. Consilience and Innovation in Design: Proc of the 5th IASDR Conf. Tokyo
Veryzer Jr, R. W., & Hutchinson, J. W. (1998). The influence of unity and prototypicality
on aesthetic responses to new product designs. Journal of consumer research, 24(4), 374-394. doi:10.1086/209516
Vitruvius, a. (1998). The Ten Books on Architecture: New York : Dover Publications. Wastiels, L., Schifferstein, H. N. J., Wouters, I., & Heylighen, A. (2013). Touching
materials visually: About the dominance of vision in building material assessment. International Journal of Design, 7(2), 31-41.
157
Whitfield, T., & de Destefani, L. R. (2011). Mundane aesthetics. Psychology of Aesthetics, Creativity, and the Arts, 5(3), 291-299.
Whitfield, T. W. A. (1983). Predicting preference for familiar, everyday objects: An experimental confrontation between two theories of aesthetic behaviour. Journal of Environmental Psychology, 3(3), 221-237. doi:10.1016/S0272-4944(83)80002-4
Whitfield, T. W. A. (2000). Beyond Prototypicality: Toward a categorical-motivation model of aesthetics. Empirical Studies of the Arts, 18(1), 1-11. doi:10.2190/KM3A-G1NV-Y5ER-MR2V
Whitfield, T. W. A. (2005). Aesthetics as pre-linguistic knowledge: A psychological perspective. Design Issues, 21(1), 3-17. doi:10.1162/0747936053103002
Whitfield, T. W. A. (2007). Feeling in design - A neuroevolutionary perspective on process and knowledge. The Design Journal, 10(3), 3-15.
Whitfield, T. W. A. (2011). In praise of styling: A Neuroevolutionary perspective on visual culture. The Design Journal, 14(3), 307-322. doi:10.2752/175630611X13046972590842
Whitfield, T. W. A., & Slatter, P. E. (1979). The effects of categorization and prototypicality on aesthetic choice in a furniture selection task. British Journal of Psychology(70), 65-75.
Whitfield, T. W. A., & Wiltshire, T. J. (1990). Color psychology: A critical review. Genetic, Social & General Psychology Monographs, 116(4), 385-411.
Zhao, M., Hoeffler, S., & Dahl, D. W. (2009). The role of imagination-focused visualization on new product evaluation. Journal of Marketing Research, 46(1), 46-55. doi:10.1509/jmkr.46.1.46

158

C H A P T E R 5
159
APPENDIX.
160
A. LETTER OF ENDORSEMENT (UMA RESEARCHER).

161
B. RESEARCH ETHICS APPLICATION.
i. APPLICATION FORM.

162
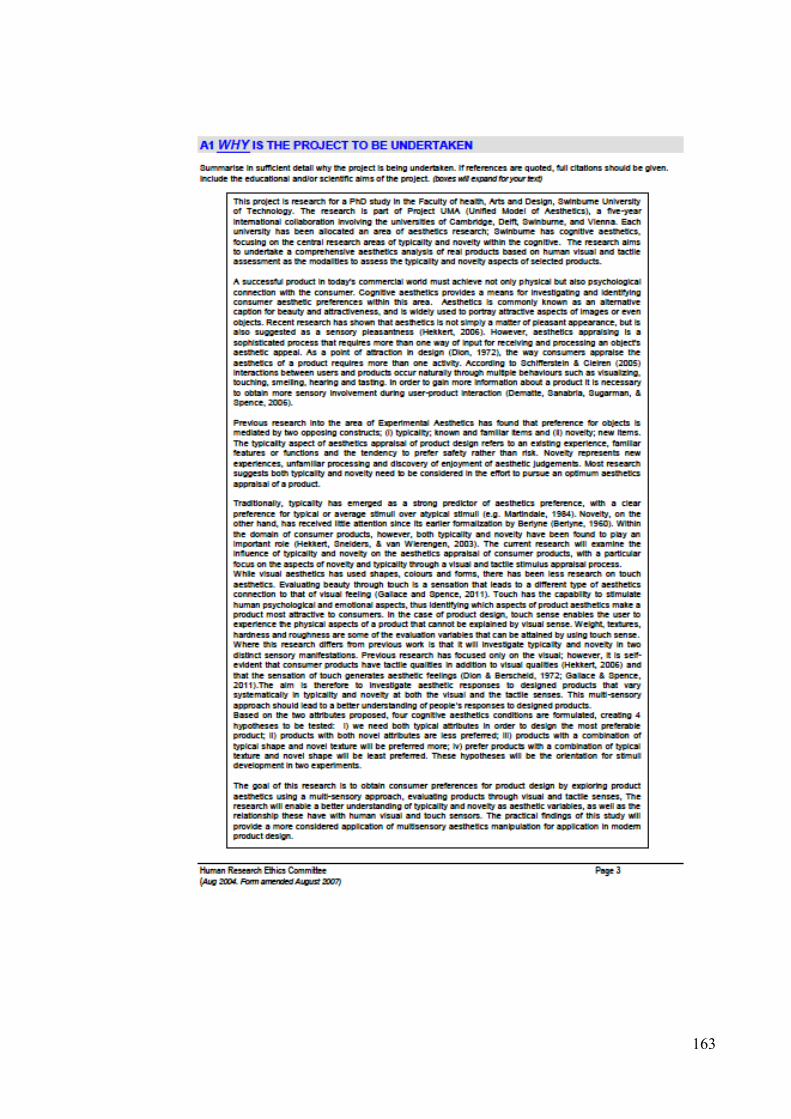
163
164

165
166

167

168

169

170

171
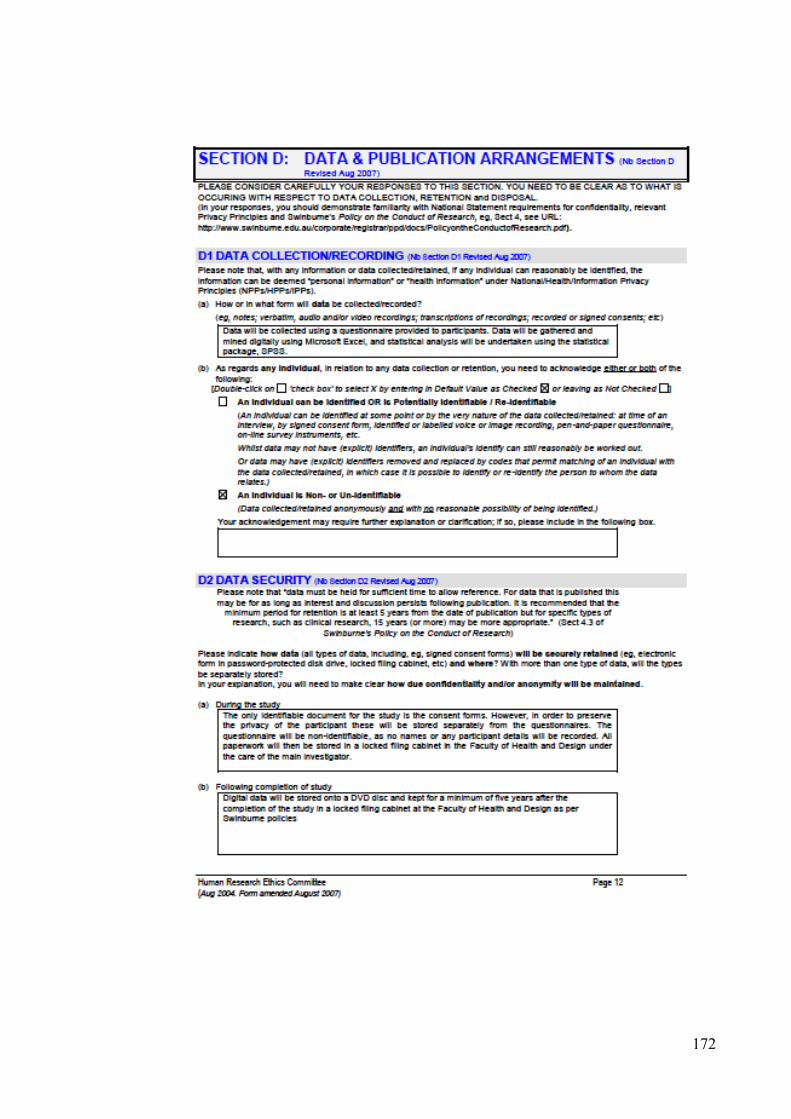
172

173

174

175

176
ii. ETHICS APPROVAL.
From: Astrid Nordmann Sent: Wednesday, 28 January 2015 8:26 AM
To: Anne Prince
Cc: RES Ethics; Mohd Yahaya; Allan Whitfield Subject: SHR Project 2015/007 - Ethical review
To: Dr Anne Prince, FHAD 2015/007 – Investigating typicality and novelty through visual and tactual stimuli Dr Anne Prince, Mr Mohd Faiz Bin Yahaya (Student), Prof. Allan Whitfield - FHAD Proposed duration: 01-12-2014 to 01-12-2015
Ethical review of the above project protocol was undertaken on behalf of Swinburne's Human Research Ethics Committee (SUHREC) by a SUHREC Subcommittee (SHESC2) at a meeting held 23 January 2015, the outcome of which as follows: The project protocol has been approved subject to the following addressed to the Chair's (or delegate's) satisfaction:
1. The box marked ‘Participation incentives, prizes or significant payments’ should be checked and explained in the box below.
2. A3: a. Should ‘Pre-luminary’ be ‘preliminary’?
b. Why does the study need to be carried out in the library rather than a classroom or tutorial room? If the study is to be conducted in the library, approval from the library will need to be obtained and submitted to the ethics committee before commencement of the study.
3. C1: Why is the age capped at 40 years? Mature-aged students may also wish to participate.
4. C5: Confirmation is requested whether participants are required to fully complete the project in order to receive the compensation or whether they will still be compensated for partial completion. This should be stated on the Consent Form also.
5. Appendix 1 (Survey Form): a. Age range should allow for participants over 40. b. Education level should not be limited to ‘Undergraduate’ and ‘Post-
Graduate’ (e.g. VET students). c. Why is the study limited to students only? Can staff or other non-
students participate?
To enable further ethical review/finalise clearance, please would you respond in the following manner: - respond to the above items point by point in a cover statement (by direct email reply if preferred) cross-referenced as applicable with any attachment - please DO NOT submit a full revised ethics clearance application in this instance

177
- queried missing, additional or revised text from the ethics application can be incorporated into your point-by-point responses or in an attachment (using ‘tracked changes’) - attach proposed or revised consent/publicity/other documentation in light of the above (converting these documents to pdf before submission if it will save on disk space) If accepted by the SUHREC delegate(s), your responses/attachments will be added to previous documentation submitted for review, superseding or supplementing as applicable the existing material/protocol on record. IMPORTANT: Please also note that human research activity (including active participant recruitment) cannot commence before proper ethics clearance is given in writing. Please contact me if you have any queries about the ethical review process undertaken. The SUHREC project number should be quoted in communication. Regards, Astrid Nordmann Secretary, SHESC2 ---------------------------------------------- Dr Astrid Nordmann Research Ethics Officer Swinburne Research (H68) Swinburne University of Technology PO Box 218, Hawthorn, VIC 3122 Tel: +613 9214 3845 Fax: +613 9214 5267 Email: [email protected]

178
iii. AMENDMENTS.

179

180
C. STUDY LOCATION PERMISSION REQUEST.
i. APPLICATION LETTER.

181
182
ii. PERMISSSION.

183
D. EXPERIMENT 1.
i. CONSENT INFORMATION STATEMENT.

184

185

186
ii. DISCLOSURE AND CONSENT FORM.

187
E. EXPERIMENT 1 QUESTION AND SCALE.
i. EXPERIMENT 1 TOOTHBRUSH (VISUAL)SCALE.
SURVEY FORM
Thank you for participating in this brief survey.
This is a survey for my PhD; the purpose of this survey is to help me understand what images are appropriate for my study. The survey is divided into two sections; the first section will require your demographic inputs and for the second section the participant will have to rate product images.
Section 1. Demographics. What is your age?
☐ 18-20 years old
☐ 21-30 years old
☐ 31- 40 years old
☐ 41 years old and above What is your gender?
☐ Male
☐ Female What are you studying?
☐ Post-Graduate, Please stated the name of the course taken: ……………………………………..
☐ Undergraduate, Please stated the name of the course taken: …………………………………….
☐ VET, Please stated the name of the course taken: ……………………………………
☐ Pre-degree (e.g ELICOS), Please stated the name of the course taken: …………………….
☐ Other, Please stated the name of the degree level taken: ………………………………………….
Please stated the name of the course taken: ………………………………………………………
SEQUENCE 1
& 3

188
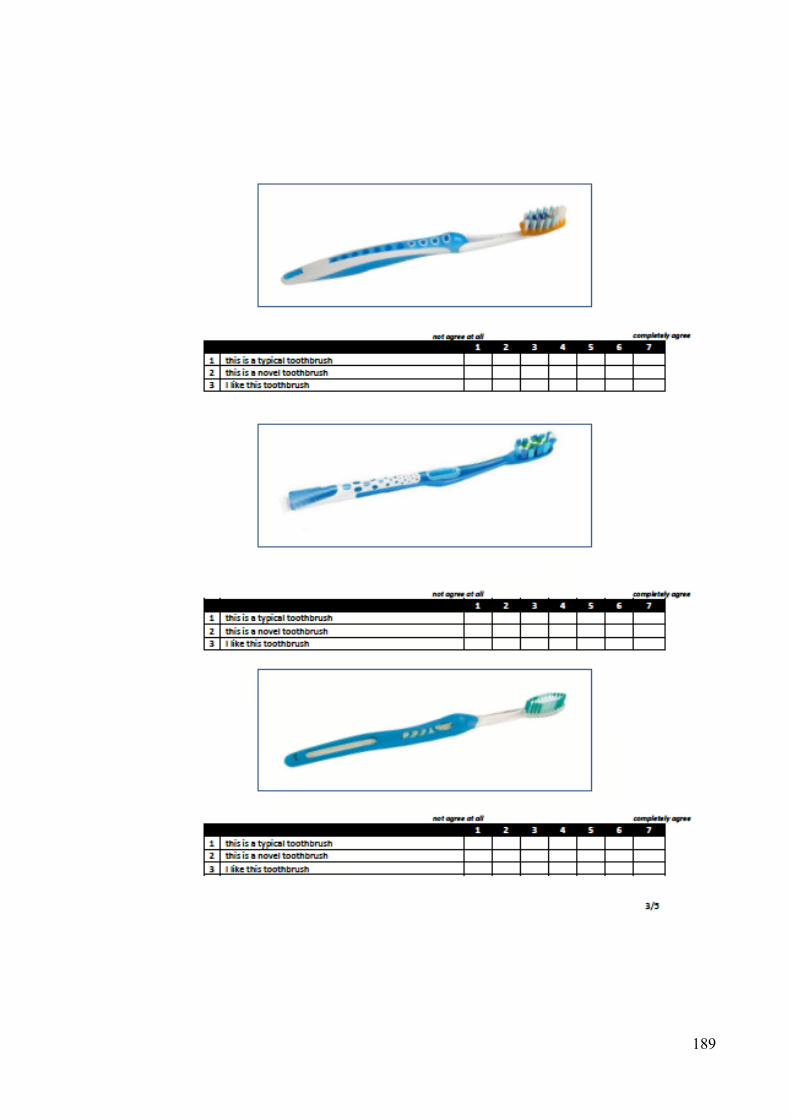
189

190
191

192
ii. EXPERIMENT 1 COMPUTER MOUSE (VISUAL) SCALE.
SURVEY FORM
Thank you for participating in this brief survey.
This is a survey for my PhD; the purpose of this survey is to help me understand what objects are appropriate for my study. The survey is divided into two sections; the first section will require your demographic inputs and for the second section the participant will have to rate the products.
Section 1. Demographics. What is your age?
☐ 18-20 years old
☐ 21-30 years old
☐ 31- 40 years old
☐ 41 years old and above What is your gender?
☐ Male
☐ Female What are you studying?
☐ Post-Graduate, Please stated the name of the course taken: ……………………………………..
☐ Undergraduate, Please stated the name of the course taken: …………………………………….
☐ VET, Please stated the name of the course taken: ……………………………………
☐ Pre-degree (e.g ELICOS), Please stated the name of the course taken: …………………….
☐ Other, Please stated the name of the degree level taken: ………………………………………….
Please stated the name of the course taken: ………………………………………………………

193

194
195
196

197
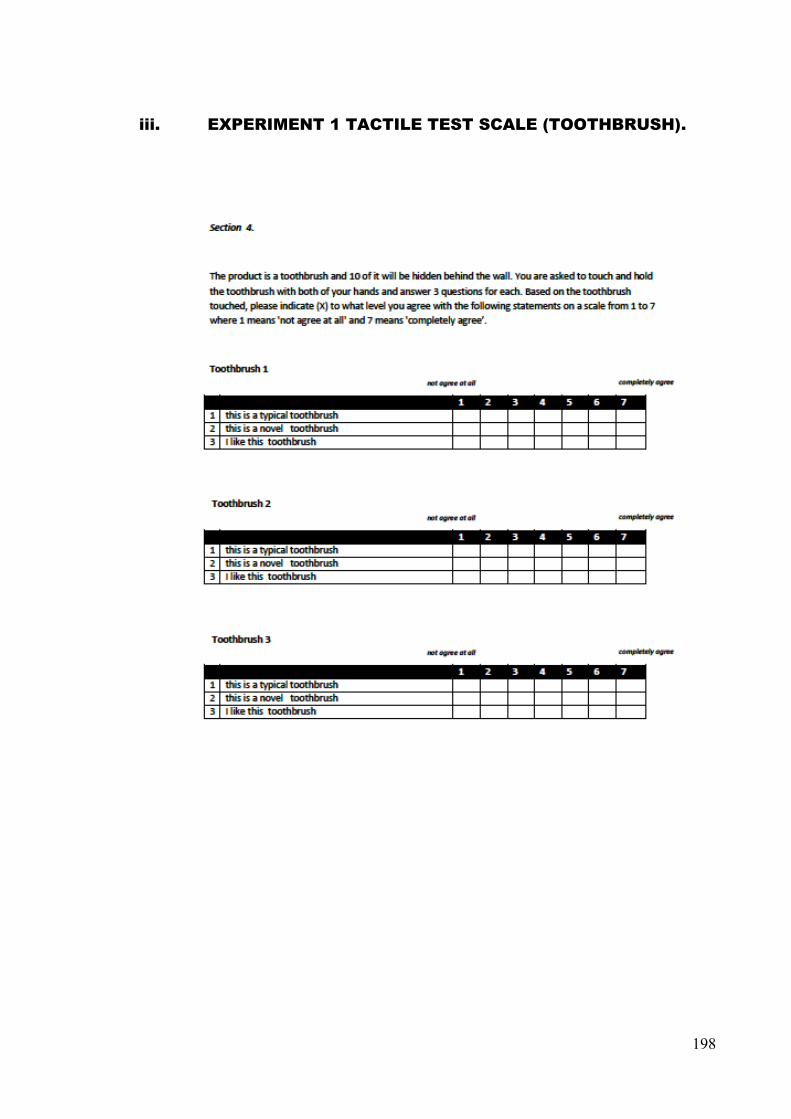
198
iii. EXPERIMENT 1 TACTILE TEST SCALE (TOOTHBRUSH).

199

200

201
iv. EXPERIMENT 1 TACTILE TEST SCALE (COMPUTER MOUSE).
Section 3. The product is a computer mouse and 10 of it will be hidden behind the wall. You are asked to
touch and hold the mouse with both of your hands and answer 3 questions for each. Based on
the computer mouse touched, please indicate (X) to what level you agree with the following
statements on a scale from 1 to 7 where 1 means 'not agree at all' and 7 means 'completely
agree’.
Computer Mouse 1
Computer Mouse 2
Computer Mouse 3
1 2 3 4 5 6 7
1 this is a typical computer mouse
2 this is a novel computer mouse
3 I like this computer mouse
1 2 3 4 5 6 7
1 this is a typical computer mouse
2 this is a novel computer mouse
3 I like this computer mouse
1 2 3 4 5 6 7
1 this is a typical computer mouse
2 this is a novel computer mouse
3 I like this computer mouse
not agree at all completely agree
not agree at all
not agree at all
not agree at all completely agree
not agree at all completely agree

202
Computer Mouse 4
Computer Mouse 5
Computer Mouse 6
Computer Mouse 7
1 2 3 4 5 6 7
1 this is a typical computer mouse
2 this is a novel computer mouse
3 I like this computer mouse
1 2 3 4 5 6 7
1 this is a typical computer mouse
2 this is a novel computer mouse
3 I like this computer mouse
1 2 3 4 5 6 7
1 this is a typical computer mouse
2 this is a novel computer mouse
3 I like this computer mouse
1 2 3 4 5 6 7
1 this is a typical computer mouse
2 this is a novel computer mouse
3 I like this computer mouse
not agree at all completely agree
not agree at all completely agree
not agree at all completely agree
not agree at all completely agree
203
Computer Mouse 8
Computer Mouse 9
Computer Mouse 10
1 2 3 4 5 6 7
1 this is a typical computer mouse
2 this is a novel computer mouse
3 I like this computer mouse
1 2 3 4 5 6 7
1 this is a typical computer mouse
2 this is a novel computer mouse
3 I like this computer mouse
1 2 3 4 5 6 7
1 this is a typical computer mouse
2 this is a novel computer mouse
3 I like this computer mouse
not agree at all completely agree
not agree at all completely agree
not agree at all completely agree
204
F. EXPERIMENT 2.
i. EXPERIMENT 2 CONSENT INFORMATION STATEMENT.

205
206

207
ii. DISCLOSURE AND CONSENT FORM.
208
iii. EXPERIMENT 1 TACTILE TEST SCALE (TOOTHBRUSH &
COMPUTER MOUSE).

209

210
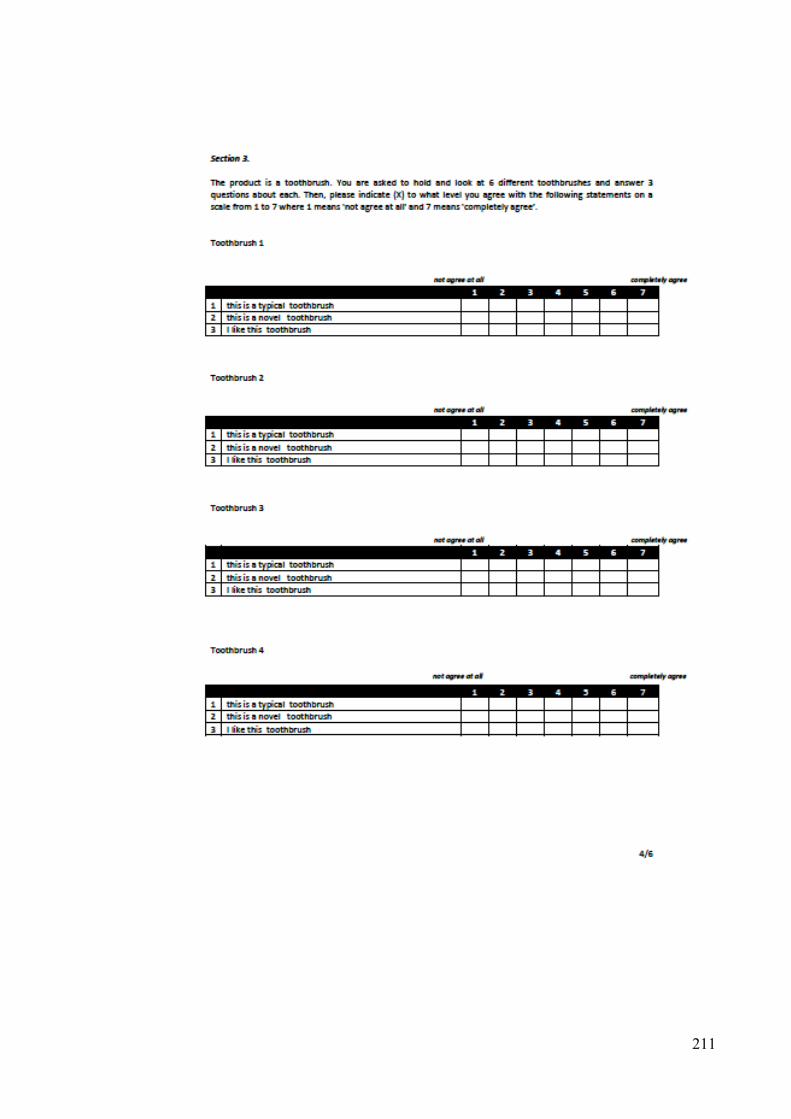
211

212
213
Publications Arising From This Thesis.
1. Author of a conference proceeding entitled: ‘Investigating Typicality and Novelty
through Visual and Tactile Stimuli.’
Conference name: XXIV. Conference of the International Association of
Empirical Aesthetics (IAEA 2016)
Conference location: Vienna, Austria
Date: August 29 to September 1, 2016