Investigating the Techno-economic Utility of Integrating ...
17
Investigating the Techno-economic Utility of Integrating an Optimized PV/diesel Hybrid System in an Entire Oil Field in the Western-dessert in Egypt Mohammad M. El-Yamany 1, * , Sameh O. Abdullatif 2 and Hani A. Ghali 2 1 Faculty of Energy and Environmental Engineering, The British University in Egypt (BUE). 2 FabLab in the Center for Emerging Learning Technologies (CELT) and Faculty of Engineering, The British University in Egypt (BUE). El-Sherouk 11837, Cairo, Egypt Abstract: - Artificial lifting is considered as the most common technique in oil and gas production industry. However, from the electrical energy consumption prospective, artificial lifting is a heavy consumer. In the absence of a grid, oil and gas stack holders are forced to utilize diesel generator for energy production. Herein, an added cost of operation and maintenance is included in the oil production cost. The purpose of this work is to develop a systematic optimization methodology for utilizing renewable energy resources, specifically Photovoltaic (PV), in Oil & Gas Industry. The study has been applied on an entire oil field in the Egyptian western dessert. The load is operated with an integrated solar-assisted system and stand-alone diesel generator. The annual energy requirements using the Levelized cost of energy (LCOE) for ten sucker rod pumping units have been evaluated. A metaheuristic optimizer (Water Cycle Optimization Technique WCOT) has been utilized to optimize the PV contribution in the hybrid PV/diesel system proposed. Moreover, centralized, and distributed generation systems have been investigated technically and economically. The results have shown that the hybrid centralized system can provide up to 62% reduction in the LCOE with respect to the running diesel generator 24/7 system. Key-Words: - PV/diesel systems, Sucker-rod pumping, LCOE, Techno-economic feasibility, Metaheuristic Optimization. 1 Introduction The recent fall in oil prices motivates oil and gas companies to optimize their production strategies and minimize their expenses while at same time, optimally extract oil in a cost-effective way [1]. One of the oil and gas industries in Egypt real challenges now is to sustain production in mature oil fields and maximize reserves [2]. In order to increase the production efficiency, applying artificial lifts is utilized to maximize petroleum resources while ensuring the most efficient use of existing stocks [3- 5]. In Egypt, there are more than 1000 sucker rod pumping systems [6]. Accordingly, optimizing the electrical consumption of these pumps can significantly attribute on the overall production cost. The rapid electrification of oil fields in remote areas – often too far to expand the grid – was achieved mainly by installing decentralized diesel generating unit (DG) [7, 8]. 100% diesel fuel systems have the benefits of using a proven and reliable technology that guarantees an electricity generation that is technically dis-patchable and available on- demand [9]. However, the capacity to operate load does not always equate to the availability of fuel for the generator in a rural setting. The isolated and often inaccessible conditions in rural areas make fuel very difficult to deliver, particularly if a system is required for several hours. It is also important to take account of local environmental impacts. For the O&G business itself, maintenance and operation are considered as the key disadvantages in DG alternative [10, 11]. Integrating renewable energy technologies in the oil and gas industry brings reduction in energy cost and reduction in greenhouse gas emissions [12-14]. Therefore, there is a global trend to shift toward the renewable energy in the oil and gas industry which appears in some of the major oil companies’ investments. The author of [15] shows that 5 of the 8 major petroleum companies already started the investment in the renewable energy. Bloomberg statics states that both BP and Eni already devoted 200 million USD in the renewable energy sector while Total already spent around 500 million USD. Statoil also devoted 600 million USD, and Shell invested the largest share with 2 Billion USD in the renewable industry [16]. Accordingly, previous attempts in literature have showed the utility of utilizing renewable energy for electrical energy production in oil and gas fields. The author of [17] was seeking to optimize an integrated hybrid PV/diesel generator system for zero load WSEAS TRANSACTIONS on POWER SYSTEMS DOI: 10.37394/232016.2021.16.11 Mohammad M. El-Yamany, Sameh O. Abdullatif, Hani A. Ghali Volume 16, 2021 104 E-ISSN: 2224-350X
Transcript of Investigating the Techno-economic Utility of Integrating ...

Investigating the Techno-economic Utility of Integrating an Optimized
PV/diesel Hybrid System in an Entire Oil Field in the Western-dessert
in Egypt
Mohammad M. El-Yamany1, *, Sameh O. Abdullatif2 and Hani A. Ghali2
1Faculty of Energy and Environmental Engineering, The British University in Egypt (BUE). 2FabLab in the Center for Emerging Learning Technologies (CELT) and Faculty of Engineering, The
British University in Egypt (BUE). El-Sherouk 11837, Cairo, Egypt
Abstract: - Artificial lifting is considered as the most common technique in oil and gas production industry.
However, from the electrical energy consumption prospective, artificial lifting is a heavy consumer. In the
absence of a grid, oil and gas stack holders are forced to utilize diesel generator for energy production. Herein,
an added cost of operation and maintenance is included in the oil production cost. The purpose of this work is to
develop a systematic optimization methodology for utilizing renewable energy resources, specifically
Photovoltaic (PV), in Oil & Gas Industry. The study has been applied on an entire oil field in the Egyptian western
dessert. The load is operated with an integrated solar-assisted system and stand-alone diesel generator. The annual
energy requirements using the Levelized cost of energy (LCOE) for ten sucker rod pumping units have been
evaluated. A metaheuristic optimizer (Water Cycle Optimization Technique WCOT) has been utilized to
optimize the PV contribution in the hybrid PV/diesel system proposed. Moreover, centralized, and distributed
generation systems have been investigated technically and economically. The results have shown that the hybrid
centralized system can provide up to 62% reduction in the LCOE with respect to the running diesel generator
24/7 system.
Key-Words: - PV/diesel systems, Sucker-rod pumping, LCOE, Techno-economic feasibility, Metaheuristic
Optimization.
1 Introduction The recent fall in oil prices motivates oil and gas
companies to optimize their production strategies and
minimize their expenses while at same time,
optimally extract oil in a cost-effective way [1]. One
of the oil and gas industries in Egypt real challenges
now is to sustain production in mature oil fields and
maximize reserves [2]. In order to increase the
production efficiency, applying artificial lifts is
utilized to maximize petroleum resources while
ensuring the most efficient use of existing stocks [3-
5]. In Egypt, there are more than 1000 sucker rod
pumping systems [6]. Accordingly, optimizing the
electrical consumption of these pumps can
significantly attribute on the overall production cost.
The rapid electrification of oil fields in remote
areas – often too far to expand the grid – was
achieved mainly by installing decentralized diesel
generating unit (DG) [7, 8]. 100% diesel fuel systems
have the benefits of using a proven and reliable
technology that guarantees an electricity generation
that is technically dis-patchable and available on-
demand [9]. However, the capacity to operate load
does not always equate to the availability of fuel for
the generator in a rural setting. The isolated and often
inaccessible conditions in rural areas make fuel very
difficult to deliver, particularly if a system is required
for several hours. It is also important to take account
of local environmental impacts. For the O&G
business itself, maintenance and operation are
considered as the key disadvantages in DG
alternative [10, 11].
Integrating renewable energy technologies in the
oil and gas industry brings reduction in energy cost
and reduction in greenhouse gas emissions [12-14].
Therefore, there is a global trend to shift toward the
renewable energy in the oil and gas industry which
appears in some of the major oil companies’
investments. The author of [15] shows that 5 of the 8
major petroleum companies already started the
investment in the renewable energy. Bloomberg
statics states that both BP and Eni already devoted
200 million USD in the renewable energy sector
while Total already spent around 500 million USD.
Statoil also devoted 600 million USD, and Shell
invested the largest share with 2 Billion USD in the
renewable industry [16].
Accordingly, previous attempts in literature have
showed the utility of utilizing renewable energy for
electrical energy production in oil and gas fields. The
author of [17] was seeking to optimize an integrated
hybrid PV/diesel generator system for zero load
WSEAS TRANSACTIONS on POWER SYSTEMS DOI: 10.37394/232016.2021.16.11
Mohammad M. El-Yamany, Sameh O. Abdullatif, Hani A. Ghali
Volume 16, 2021 104 E-ISSN: 2224-350X

rejection in Malaysia. The technical requirements of
the optimization process were not to let the blackout
time to exceed 1% from the total year supply. The
research was targeting to calculate the optimum
capacities of each power source with the energy
storage units, to supply the load efficiently. The
research used the graphical solution to solve the
optimization problem. The Author considered several
configurations and compared between them to find
the best outfit for the hybrid power supply. The result
showed that the hybrid PV/DG system was more
feasible than the stand-alone PV system or the stand-
alone DG. The stand-alone PV system cost was US$
205,135; the stand-alone DG was US$ 206,095 to
supply the same load. Meanwhile, the hybrid
PV/Diesel and battery system cost was US$ 130,129
to supply the same load which means that the total
generation cost reduced by 35%. However, the
research did not consider the system in non-tropical
areas or the harsh environment of the desert such as
in the Egyptian desert.
On the other hand, the research mentioned in [18]
discussed a real case study and implementation on
involving the solar PV system with the DG in a
remote oil field in the Egyptian western desert. The
aim of the study was to improve the efficiency of the
oil production process in the islanded system. The
integration of the PV source in the generation system
increased the robust level of the system and the
reliability level of the power supply in hard climate
conditions (sudden temperature drop at the late night,
the high temperature at the morning and the sandy
environment). All this was without any energy
storage system, and it allowed the system to
continuously produce the oil without any
disturbance. The system saved over 15000 liters of
diesel and reduced the CO2 emissions by 40 tons/yr.
(12% reduction). Despite that, the research did not
mention the total system cost, the LCOE or even the
economic parameters or terms that have been used in
the study.
The study that has been presented in [19] focused
on the economical factor of the study with sustaining
the technical term within the acceptable limits. The
hybrid system idea was to depend on the renewable
energy only without any conventional power sources.
The research main target was to develop a system that
can reduce the oil production cost to the lowest
possible limit. Sucker-rod pump artificial lift
simulators (QRod™ and PROSPER™) has been
used to calculate the energy required for the well oil
production with all the pumping production
considerations, either intermittent or continuous.
HOMER software has been used to optimize the
system components in different configurations to
decrease system costs. After comparing between the
stand-alone PV system, the stand-alone wind, the
hybrid combination between both, and the hybrid
combination with energy storage system, it has been
found that the hybrid PV/wind/battery system was
the best feasible configuration. The chosen system
used a storage capacity of 0.56 kWh/yr., NPC of US$
145,150.50, LCOE of US$ 0.51/kWh and operating
cost of US$ 3,056.04/yr. On the other hand, the work
presented theoretical calculations to design the power
system, where no real measured data were presented.
Meanwhile, the conditions and the assumptions used
to size the power system were not mentioned. The
study also did not consider applying the research
outcomes on a larger system (entire field), which may
lead to different results.
The Author of [20] applied an intelligent technique
that involves Decision Tree as an optimization tool to
create a relation between the output power and
weather conditions used for optimizing power
productions for different operation points. This study
was achieved through using real data which includes
power data from PV systems and weather data. The
results showed that the accuracy of the model is
93.425% during the validation set and 82.01% during
the training phase.
The author of [21] proposed three methods through
using different approaches such as decision tree,
linear regression algorithm, and random forest in
order to mine and predict the output power of the
renewable energy. These methods were performed to
overcome the fluctuation through optimizing the
control accuracy of solar panel position. The results
exhibited that the accuracy of predication on the data
test set through using decision tree is 39%, the
accuracy of linear regression algorithm is 61%, and
the accuracy of random forest is 66%. On the other
hand, the accuracy of predication in solar dip through
using decision tree is 55%, the accuracy of linear
regression algorithm is 48%, and the accuracy of
random forest is 67%.
All previous attempts did not show a complete
optimized techno-economic feasibility with
considering sustainability issues. Accordingly, we
consider such an optimization problem as a literature
gap.
In the current feasibility study, we are
investigating the applicability of integrating
PV/diesel hybrid system in a running oil field in the
western desert in Egypt. The feasibility considers
both technical as well as economic prospective. Real
data captured from the in-field measurements have
been used to evaluate the sucker rod pump
implemented and the liquid production rate across ten
wells in the field under test. Firstly, optimization for
WSEAS TRANSACTIONS on POWER SYSTEMS DOI: 10.37394/232016.2021.16.11
Mohammad M. El-Yamany, Sameh O. Abdullatif, Hani A. Ghali
Volume 16, 2021 105 E-ISSN: 2224-350X
the PV contribution in the hybrid system is
demonstrated. Secondly, the concluded optimum
configuration is evaluated over both distributed and
centralized systems. The presented optimization
model can be considered as a novel approach where
metaheuristic optimizer is integrated with PV sizing
model for sucker road pumping systems. This paper
would be of interest for a broad readership including
theoreticians and experimentalist dealing with
electric energy problems in oil and gas industry as
well as solar energy systems. It combines a useful
experimental data with the discussion of a new figure
of merit to evaluate the performance of sucker-rod
pumping system through well lifetime.
2 Field Under feasibility Study 2.1 Field parameters
In a remote place in the western desert of Egypt, there is an oil field represented by multiple sucker rod pumping systems (SRPs). These SRPs, which are also called “beam pumping”, provide mechanical energy to lift the oil from the bottom hole of the well to the surface. Due to its simplicity, efficiency, and easiness, it is the most common way to lift the oil in the last stage of the primary recovery phase of the well, such as our case under investigation. This stage has a very low bottom-hole pressure; therefore, the SRPs is used to pump the oil up and maximize oil production rates. It is also suitable for slim holes, multiple completions, high-temperature, and viscous oils. SRPs design varies from one well to another; therefore, there is also a difference in their power needs. Our case study field consists of 10 different wells with different specifications, and each well is operated with own SRP. In the next sub-section, a complete theoretical analysis for the SRP power consumption is presented in terms of the well specification.
2.2 Sucker rod pump power calculation To estimate the load power along with its
associated power generation system, some
parameters must be taken into consideration. These
parameters are the liquid production rate, the specific
gravity of the produced liquid, the dynamic liquid
level in the well (pump depth), the weight of sucker
rod string, the stroke length, and the pump speed
[22]. All these parameters have a direct impact on the
sucker rod energy consumption. Table 1 represents
the needed specifications for the ten wells in the field
under test. The electrical power needed to operate
SRPs is proportional to the hydraulic horsepower.
Hydraulic horsepower is defined as the theoretical
work required to lift the well fluids from the net
depth, which can be calculated by [22] :
𝐇𝐡𝐲𝐝𝐫 = 𝟕. 𝟑𝟔 × 𝟏𝟎−𝟔 × 𝐐 × 𝐆 × 𝐋𝐝𝐲𝐧 (1)
where 𝐇𝐡𝐲𝐝𝐫 is the hydraulic horsepower required for
lifting the liquid, 𝐐 is the liquid production rate, 𝐆 is
the specific gravity of the produced liquid and 𝐋𝐝𝐲𝐧
is the dynamic liquid level in the well. When the
pump is set at the working fluid level, 𝐋𝐝𝐲𝐧equals the
pumping setting depth. The main down-hole energy
losses in the SRPs are caused by the friction in the
pump and rod string.
The equation for calculating friction horsepower
losses can be illustrated by [22]:
𝐇𝐟 = 𝟔. 𝟑𝟏 × 𝟏𝟎−𝟕 × 𝐖𝐫 × 𝐒 × 𝐍 (2)
where 𝐇𝐟 is the friction horsepower to overcome
friction losses, 𝐖𝐫 is the weight of sucker rod, 𝐒 is
the stroke length, and 𝐍 is the pump speed.
Table 1. Mechanical specifications of the overall oil field
well
(Q)
Flow rate
(bbl./Day)
(G)
specific gravity
(kg/m3)
(L)
Depth to
pump (ft)
(Wr)
weight of sucker rod
string (lb.)
(S)
stroke
length (in)
(N)
pump
speed
(spm)
well 1 400 0.845 3950 8000 144 6.2
well 2 300 0.845 3645 7285 120 5.7
well 3 190 0.845 3978 8100 120 5.6
well 4 170 0.845 3650 7300 120 6.2
well 5 400 0.845 3782 7700 144 5.7
well 6 125 0.845 3925 7900 120 5.7
well 7 425 0.845 3654 7325 144 6.17
well 8 250 0.845 3995 8200 144 5.7
well 9 220 0.845 3390 7100 120 6.2
well 10 165 0.845 3500 7200 120 5.7
WSEAS TRANSACTIONS on POWER SYSTEMS DOI: 10.37394/232016.2021.16.11
Mohammad M. El-Yamany, Sameh O. Abdullatif, Hani A. Ghali
Volume 16, 2021 106 E-ISSN: 2224-350X
The prime mover should be properly sized to
provide adequate power to lift the production fluid.
Additionally, properly sized prime mover overcome
friction loss in the pump, the rod string, the polished
rod, and the pumping unit. The power required for
lifting fluid, overcoming friction losses, and any
unpredictable losses within the surface equipment is
called ‘‘Brake horsepower’’ Thus, the required prime
mover power ( Mechanical Power) can be expressed
as [22]:
𝐇𝐛 = 𝐅𝐬 (𝐇𝐡𝐲𝐝𝐫 + 𝐇𝐟) (3)
where 𝐇𝐛 is the brake horsepower of the prime mover
and 𝐅𝐬 is a safety factor of 1.25 – 1.50 based on
manufacturer decision. In the current study, a safety
factor of 1.5 was chosen to account for any surface
power losses.
For an electric motor, the nameplate rating must be
larger than the brake horsepower to account for heat
losses in the motor due to cyclic loading imposed by
rod pumping. Consequently, the motor rating 𝐏𝐌 can
be expressed by:
𝐏𝐌 =𝟎.𝟕𝟒𝟓∗𝐇𝐛∗𝐂𝐋𝐅
𝛈𝐦𝐨𝐭𝐨𝐫 (4)
where 𝐂𝐋𝐅 is the cyclic load factor, which assumed
as 1.3, and 𝛈𝐦𝐨𝐭𝐨𝐫 is the motor efficiency that
considered as 78%. The motor rating represents the
calculated electrical power in (kW) required for the
SRPS.
2.3 Calculated and actual sucker rod pump
power Following the theoretical procedure demonstrated
in the previous section, the calculated power can be
extracted for the ten given wells, with utilizing the
mechanical parameters illustrated in table 1.
Alternatively, table 2 summarizes the electrical
specifications of every well of the ten wells under
study, based on real in-field measured data. The
power of the prime movers in the field varies from 40
hp to 60 hp, while the voltage is 380 V (three-phase).
The upstroke current varies from 24 A to 67 A, while
the down-stroke current varies from 17 A to 33 A. All
the field motors have power factor range starts from
0.81 and it reaches 0.88 at the motor best condition.
The actual consumed power of the SRPs could be
estimated, where the power supply system is
designed accordingly.
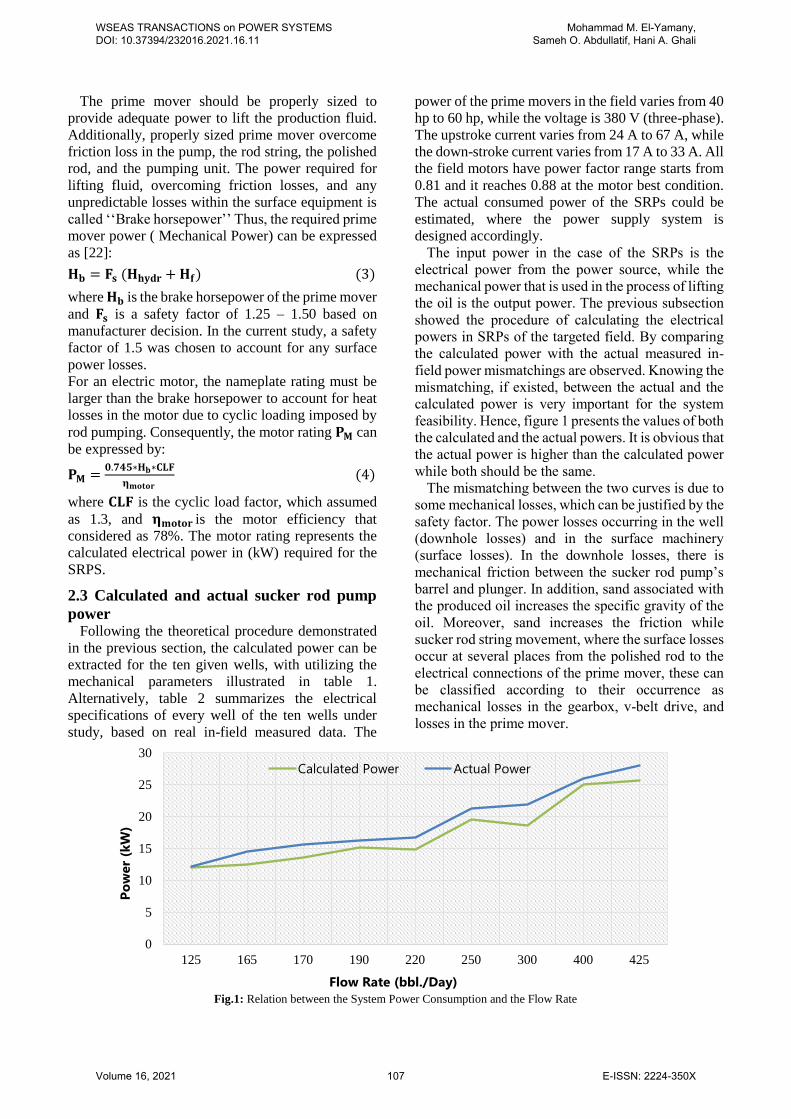
The input power in the case of the SRPs is the
electrical power from the power source, while the
mechanical power that is used in the process of lifting
the oil is the output power. The previous subsection
showed the procedure of calculating the electrical
powers in SRPs of the targeted field. By comparing
the calculated power with the actual measured in-
field power mismatchings are observed. Knowing the
mismatching, if existed, between the actual and the
calculated power is very important for the system
feasibility. Hence, figure 1 presents the values of both
the calculated and the actual powers. It is obvious that
the actual power is higher than the calculated power
while both should be the same.
The mismatching between the two curves is due to
some mechanical losses, which can be justified by the
safety factor. The power losses occurring in the well
(downhole losses) and in the surface machinery
(surface losses). In the downhole losses, there is
mechanical friction between the sucker rod pump’s
barrel and plunger. In addition, sand associated with
the produced oil increases the specific gravity of the
oil. Moreover, sand increases the friction while
sucker rod string movement, where the surface losses
occur at several places from the polished rod to the
electrical connections of the prime mover, these can
be classified according to their occurrence as
mechanical losses in the gearbox, v-belt drive, and
losses in the prime mover.
Fig.1: Relation between the System Power Consumption and the Flow Rate
0
5
10
15
20
25
30
125 165 170 190 220 250 300 400 425
Po
wer
(kW
)
Flow Rate (bbl./Day)
Calculated Power Actual Power
WSEAS TRANSACTIONS on POWER SYSTEMS DOI: 10.37394/232016.2021.16.11
Mohammad M. El-Yamany, Sameh O. Abdullatif, Hani A. Ghali
Volume 16, 2021 107 E-ISSN: 2224-350X

Table 2. Electrical specifications of the overall oil field
Well # Motor
(hp)
Voltage
(V)
Current (A) Power
factor (pf) Upstroke Downstroke
well 1 60
380
67 30 0.86
well 2 40 50 32 0.81
well 3 40 38 22 0.82
well 4 40 35 20 0.86
well 5 60 60 32 0.86
well 6 40 24 18 0.88
well 7 60 66 33 0.86
well 8 60 45 30 0.86
well 9 40 38 20 0.88
well 10 40 35 17 0.85
3 PV/diesel hybrid alternatives The enewable energy source that is considered in
this study is based on a solar PV system. The hybrid systems that depend on photovoltaic (PV) are considered the most popular renewable generation system among any other type of renewable energy systems. The main advantages of this technology are the low maintenance costs and low pollutant emissions. The schematic diagram of this system is shown in figure 2. The feasibility highlights the implementation of PV/diesel systems with various PV contributions covering from 0%-PV (stand-alone diesel generator system, see figure 2a) to 100%-PV (stand-alone off-grid PV system, see figure 2b). The 0%-PV system is considered the currently running system; accordingly, this system will be treated as the reference system in all comparisons (see figure 2a). On the other hand, two main topologies are discussed in the current study, including hybrid distributed generation system (HDGS) and hybrid centralized generation system (HCGS). In HDGS, each SRP will be supplied with an independent electric power supply, while in HCGS, a centralized system will be designed to supply the field.
3.1 Stand-alone diesel generator (0%-PV
reference system) The currently running system in the field under test
includes a 120 kW diesel generator per well. This diesel generator consumes 370 L/d of fuel with 10 EGP/L and a renting cost of 1155EGP per day. The renting cost includes the maintenance and the spare
parts change. Figure 2a shows a schematic diagram for the stand-alone diesel generator system.
3.2 Stand-alone PV system The other extreme scenario is to implement a 100%-
PV off-grid stand-alone system. As displayed in figure 2b, the proposed stand-alone PV system consists of PV modules with batteries as a storage system which is the only source of electrical energy. While solar PV array has been sized to meet the required energy demand as mentioned in the previous section. As shown in table 3, the technical specifications for the components of the proposed system have been composed of 340 W polycrystalline PV module, with open circuit voltage of 46.2 V and short circuit current of 9.4 A. It has been integrated with a battery of 12 V and 150 Ah. In an attempt to match the requirement of the three phases sucker rod pump, a 27 kW (DC/AC) inverter of 3-phases output has been used, with maximum input current of 47.7 A and AC output current of 40.9 A/39.1 A.
3.3 Hybrid PV/diesel system In between the two extremes demonstrated in the
previous two subsections, hybrid system combining the PV system (340 W) and the diesel generator system (120 kW) with various contributions for each can be implemented as exhibited in figure 2c. To select the optimum configuration between the DG and the PV system, various points over the design space have been chosen based on the operating hours of each system. The purpose of this technology is providing electricity to remote areas with unstable mains supply by reducing diesel consumption, hence, achieving the sustainability factor into the system.
WSEAS TRANSACTIONS on POWER SYSTEMS DOI: 10.37394/232016.2021.16.11
Mohammad M. El-Yamany, Sameh O. Abdullatif, Hani A. Ghali
Volume 16, 2021 108 E-ISSN: 2224-350X

Figure.2: Different generation system alternatives for SRP under test, (a) 0%-PV system (b) 100%-PV system and (c) hybrid PV/diesel
system.
Table 3. PV system specifications
Solar Panel
Type Poly Solar (Suntech)
Max. Power (W) 340
Operating Voltage (V) 37.8
Operating Current (A) 9
Module Area (m2) 1.97
Max. Voltage (V) VDC 1500
Batteries
Nominal Voltage (V) 12
Nominal Capacity (Ah) 150
Max. Capacity (Ah) 83.4
Weight (Kg) 34
Inverter
Max. input current (A) IDC 47.7
Max. array short circuit current (A) 71.6
DC input voltage range (V) 580-1000
Max. Power Input (kWp) 37.8
Max. Output Power (kW) 27
Max. Output Current (A) 40.9
3.4 PV system sizing The PV system sizing using the intuitive method is going
through some steps to approach the final system value;
thus, it is designed to cover the load needs. The main
factors that have a significant effect on the system size are
the load demand and the peak sun hours (PSH). The author
in [23] used the following equations to calculate the total
PV parameters and to get the size of the PV module in the
system:
𝑷𝑷𝑽 = 𝑬𝑳𝑺𝒇/𝜼𝒊𝒏𝒗𝜼𝑹𝑷𝑺𝑯 (5)
where 𝑬𝑳 is the total energy demand per day, 𝑺𝒇 is
safety factor that represents the losses of the dust,
cable joints and cloudy times, 𝜼𝒊𝒏𝒗 is inverter
efficiency, 𝜼𝑹 is voltage regulator efficiency, and
PSH is peak sun hours in the proposed area. 𝑷𝑺𝑯 of
the case study location can be calculated based on the
solar irradiation of its location. If there is any storage
system connected with the power system, the size of
this system could be calculated by:
𝐄𝐁 =𝐒𝐟∗𝐄𝐋
𝛈𝐁 𝐃𝐎𝐃 (6)
The following equation is being used to calculate
the ampere hour (AH) of the storage system.
𝐈𝐁 = 𝐄𝐁/𝐕𝐁 (7)
where 𝐄𝐁 is the battery storage capacity in Wh, 𝛈𝐁 is
the battery efficiency, 𝐃𝐎𝐃: depth of discharge for
the battery, 𝐈𝐁 is the battery storage ampere-hour
WSEAS TRANSACTIONS on POWER SYSTEMS DOI: 10.37394/232016.2021.16.11
Mohammad M. El-Yamany, Sameh O. Abdullatif, Hani A. Ghali
Volume 16, 2021 109 E-ISSN: 2224-350X

in Ah, and 𝐕𝐁 is the battery voltage. The system
parameters that have been used in this research are
listed in table 4.
Table 4. Parameters of the System Calculations
System Parameters Value
Safety Factor (SF) 1.25
Inverter efficiency (ηinv) 0.9
Voltage regulator efficiency (ηR) 0.9
Peak Sun Hour (h/day) PSH 5
Depth of discharge (DOD) 0.5
SPV efficiency 0.16
Battery efficiency (ηB) 0.8
Solar radiation at STC (W/m2) Gref 1000
Room temperature at STC (℃) Tref 25
Total Lifetime of the System (Year) LS 20
3.5 PV/diesel system cost analysis To estimate the system parameters cost, three cost
of every individual components must be considered.
In [24] the Annualized Total Life Cycle Cost
(ATLCC) of the system is calculated by:
𝐀𝐓𝐋𝐂𝐂 = ∑ 𝐂𝐜𝐚𝐩,𝐚 + 𝐂𝐨&𝐦,𝐚 + 𝐂𝐫𝐞𝐩,𝐚 + 𝐂𝐬,𝐚
𝐃𝐞𝐯𝐢𝐜𝐞
(8)
where, 𝐂𝐜𝐚𝐩,𝐚 is the capital costs, 𝐂𝐨&𝐦,𝐚 is the
operation and maintenance costs, 𝐂𝐫𝐞𝐩,𝐚 is the
replacement costs, and 𝐂𝐬,𝐚 is the salvage value. In
this study the 𝐂𝐫𝐞𝐩,𝐚 is counted inside the 𝐂𝐨&𝐦,𝐚
while 𝐂𝐬,𝐚 is considered to be zero. Therefore,
ATLCC has been formulated as follows:
𝐂𝐜𝐚𝐩,𝐚 =𝐂𝐜𝐚𝐩
(𝟏+𝐧𝐝𝐫)𝐋𝐬−𝟏
𝐧𝐝𝐫(𝟏+𝐧𝐝𝐫)𝐋𝐬
(9)
𝐂𝐨&𝐦,𝐚 =𝐂𝐨&𝐦
(𝟏+𝐧𝐝𝐫)𝐋𝐬−𝟏
𝐧𝐝𝐫(𝟏+𝐧𝐝𝐫)𝐋𝐬
(10)
𝐧𝐝𝐫 = [(𝟏 + 𝐢𝐧𝐭𝐞𝐫𝐞𝐬𝐭%
𝟏 + 𝐢𝐧𝐟𝐥𝐚𝐭𝐢𝐨𝐧%) − 𝟏] (11)
where 𝐂𝐜𝐚𝐩 and 𝐂𝐨&𝐦 are the total capital cost,
operating and maintenance expenses during the
expected lifespan of the system, respectively. 𝐋𝐬 is
the total lifetime of the according to the study, and
𝐧𝐝𝐫 is the net of inflation rate discount.
To calculate the ATLCC of any system, the
inflation and interest rates of the project location
must be counted. Based on [25, 26], the weighted
average inflation rate for Egypt from 1984 till 2021
is 11.45%, while the interest rate in 2019 is 5% for
the renewable energy projects based on the Central
Bank of Egypt (CBE). For the cost equations, the
inflation and the interest rates of Egypt need to be
provided. The inflation rate has been taken as the
weighted average for the 40 years as it will affect the
income of the project. Meanwhile, the interest is
using the rate of 2019 only as it is the year of the
project loan. On the other hand, total capital costs of
the system could be calculated as follows:
𝐂𝐜𝐚𝐩 = 𝐂𝐜𝐚𝐩,𝐏𝐕 + 𝐂𝐜𝐚𝐩,𝐈𝐧𝐯 + 𝐂𝐜𝐚𝐩,𝐎𝐂 + 𝐂𝐜𝐚𝐩,𝐁𝐚𝐭 +
𝐂𝐜𝐚𝐩,𝐂+ 𝐂𝐜𝐚𝐩,𝐃𝐆 (12)
where 𝐂𝐜𝐚𝐩,𝐏𝐕 , 𝐂𝐜𝐚𝐩,𝐈𝐧𝐯, 𝐂𝐜𝐚𝐩,𝐎𝐂, 𝐂𝐜𝐚𝐩,𝐁𝐚𝐭, 𝐂𝐜𝐚𝐩,𝐂
and 𝐂𝐜𝐚𝐩,𝐃𝐆 are the total capital cost for PV array,
inverter, other costs, battery, the controller and diesel
generator, respectively. The operation and the
maintenance costs of the system could be calculated
by following equation:
Co&m = Co&m,PV + Co&m,Inv + Co&m,OC +Co&m,Bat + Co&m,C + Co&m,DG (13)
where 𝐂𝐨&𝐦,𝐏𝐕, 𝐂𝐨&𝐦,𝐈𝐧𝐯, 𝐂𝐨&𝐦,𝐎𝐂, 𝐂𝐨&𝐦,𝐁𝐚𝐭, 𝐂𝐨&𝐦,𝐂
and 𝐂𝐨&𝐦,𝐃𝐆 are the total operating and maintenance
cost for PV array, inverter, other costs, battery, the
controller and diesel generator, respectively. The
maintenance cost (𝐂𝐨&𝐦) term includes some other
costs (𝐂𝐨&𝐦,𝐎), such as the dust cleaning cost. As the
system will be installed in the desert, the dust will be
deposited on the panels, which can easily affect the
PV panel performance and efficiency. Therefore, a
dust cleaner is imperative to clean the panels on a
regular basis. This cleaner has five years lifetime and
needs replacement every five years. Additionally,
there will be some other costs involved during the
lifespan of the system, including but not limited to;
the labour cost, consumables…etc. Finally, the
Levelized Cost of Energy (LCOE) (EGP/kWh) for
the system of this study over 20 years, could be
resulted from the following equation [27, 28]:
𝐋𝐂𝐎𝐄 =𝐀𝐓𝐋𝐂𝐂
𝐄𝐋 (14)
3.6 PV/diesel system optimization Seeking for an optimum operation point in terms of
the PV contribution in the hybrid system under test,
all possible design space points have been scanned
with respect to LCOE. Parametric sweep
optimization has been used based on the
mathematical equations demonstrated in the previous
sub-sections. This model investigates the relation
between the DG and the PV system over the whole
design space starting from 0%-PV system to 100%-
PV. Such parametric sweep has been scripted using
Matlab through customizing our previously
developed Matlab code in [29, 30] to fit off-grid
hybrid systems. Over and above, we introduce the
water cycle optimization technique (WCOT) to
optimize the system performance [31]. Our proposed
fitness function is defined by:
WSEAS TRANSACTIONS on POWER SYSTEMS DOI: 10.37394/232016.2021.16.11
Mohammad M. El-Yamany, Sameh O. Abdullatif, Hani A. Ghali
Volume 16, 2021 110 E-ISSN: 2224-350X

𝛇𝐋𝐂𝐎𝐄 =
√(𝐋𝐂𝐎𝐄𝐏𝐕 𝛆 )(𝛃𝟏) × (𝐋𝐂𝐎𝐄𝐃𝐆
𝛆 )(𝛃𝟐) × (𝐋𝐂𝐎𝐄𝐁−𝐃𝐂 𝛆 )(𝛃𝟑)𝟑
(15)
∑ 𝛃𝐢𝟑𝐢=𝟏 = 𝟑 (16)
where β is the weighting factor of the corresponding
elements. Herein, a geometric average for these three
parameters is introduced to optimize the proposed
system. The three parameters are the Levelized cost
of energy for the PV system, DG system and the
added battery if needed. Consequently, the root mean
square error (RMSE) [32] has been used to calculate
the error between both optimization techniques used
(parametric sweep and WCOT). The RMSE is
calculated by:
𝐑𝐌𝐒𝐄 = √𝟏
𝐧∑ (
𝐲𝐭−𝐲𝐦
𝐲𝐭)
𝟐
𝐢=𝟏
(17)
where, 𝐲𝐭 is reference output, 𝐲𝐦is model output, and
𝐧 is the number of points.
4 Results and discussions In this section, all techno-economic results are
demonstrated in two successive subsections. Firstly,
the optimization process for the PV contribution in
the hybrid system proposed is presented, reaching an
optimum PV/DG alternative. Secondly, a comparison
between HDGS and HCGS takes place in terms of the
LCOE and system utilization.
4.1 PV/diesel system optimization results As mentioned earlier, both the parametric sweep
model as well as WCOT are used in this research to
optimize the PV contribution in the PV/DG system.
As shown in figure 3, the stand-alone diesel generator
has the lowest LCOE till the PV contribution reaches
30%, then the hybrid system takes the lead in the
lowest LCOE value. This shows that the hybrid
system before 30% of the PV system has no
economic benefit to this research case study.
Furthermore, there is an overlap at the point 54% (PV
system contribution), where the LCOE reaches its
global minimum level. This concludes that the
selection of the PV system contribution at 54% is the
optimum techno-economic hybrid system
configuration.
On the other hand, RMSE given in equation (17) is
used to evaluate the two proposed optimization
techniques. Herein, an overall error less than 5% is
detected across the range of study (0%-PV to 100%-
PV). The observed error is detected more toward the
extreme left point (0%-PV system), as in this region,
two LCOE terms, in the fitting equation given in (15),
collapse while 𝐋𝐂𝐎𝐄𝐃𝐆𝛆 glows up as the main
dominating term.
Figure.3: PV contribution optimization in PV/DG hybrid system, parametric sweep and WCOT data.
WSEAS TRANSACTIONS on POWER SYSTEMS DOI: 10.37394/232016.2021.16.11
Mohammad M. El-Yamany, Sameh O. Abdullatif, Hani A. Ghali
Volume 16, 2021 111 E-ISSN: 2224-350X

4.2 Distributed and centralized PV/diesel
generation system As mentioned before, the energy share of the
optimum PV system is 54% based on the optimum
scenario result in the previous sub-section. Based on
these results, this optimum model is applied over the
ten wells in the field under both HDGS and HCGS
topologies.
4.2.1 Hybrid distributed generation system
(HDGS) By following the techno-economic procedures that
has been introduced for PV/diesel system analysis in
the previous section, technical as well as economic
outputs for the distributed generation system are
listed in table 5. Additionally, figure 4 shows the
relation between the total energy consumption and
the PV system size against the liquid production rate.
Herein, the size of the diesel generator for the 10
wells is constant. This is because the prime movers
of the ten wells need a power source with a rate of
less than 120 kW; however, this is the smallest
available generator size in the market. Therefore, 120
KW DGs are mostly oversized for the sucker rod
pumping systems, and they are rented with the fixed
rental cost. This leads to increases in the overall cost
for the small sucker rod pumping systems rather than
the large ones.
Figure 5 displays the PV system specifications for
the whole field against the liquid production rate. As
the flow rate increase, the area needs for the system
increases, and the same happen for the PV panels
number. The size of the inverter stays the same at two
inverters for each sucker rod pumping system for the
first four wells, and this is because of the fixed
inverter rate that is chosen in this study. Then the
number increased to three inverters then four based
on the rated power for the energy sourced that is
supplying the loads in the field. The total capital cost,
the diesel consumption, and the diesel cost are
directly proportional to the energy consumption of
the sucker rod pumping systems (see figure 6).
Moreover, there is a drop in the LCOE with the
increase of the flow rate while the total capital cost
and the fuel cost are rising. This shows that as much
the system size increases, the LCOE is going down.
Therefore, it could be concluded that as larger the
system size, the lower the cost of the energy
produced. In addition to that, the oversized diesel
generators that is used to supply the load has a
dramatic effect on the changes in the LCOE.
Figure.4: Technical outputs for the Whole Field using HDGS topology, total energy consumption and PV system size against oil flow
rate for the ten wells under test.
0
10
20
30
40
50
60
70
80
90
100
0
100
200
300
400
500
600
700
800
125 165 170 190 220 250 300 400 425
kW
p/k
W
kW
h/d
ay
Flow Rate (bbl./day)
Energy Consumption (kWh/day)
PV System Size (kWp)
Actual Power (kW)
WSEAS TRANSACTIONS on POWER SYSTEMS DOI: 10.37394/232016.2021.16.11
Mohammad M. El-Yamany, Sameh O. Abdullatif, Hani A. Ghali
Volume 16, 2021 112 E-ISSN: 2224-350X

Figure.5: PV system specifications for the whole Field using HDGS topology
Figure.6: Cost Analysis for the whole Field using HDGS topology.
0
0.5
1
1.5
2
2.5
3
3.5
4
4.5
0
50
100
150
200
250
300
125 165 170 190 220 250 300 400 425
m2
x 1
00
0/
No
. of
inve
rte
rs
KW
p/
No
. of
PV
pan
els
Flow Rate (bbl./day)
PV Power Output (kWp)
PV Panels No. (340 W/ unit)
Area (m^2*1000)
Inverters No. (27 kW per Unit)
0
1
2
3
4
5
6
7
8
9
0
100000
200000
300000
400000
500000
600000
700000
800000
900000
1000000
125 165 170 190 220 250 300 400 425
EG
P/k
Wh
EG
P
Flow Rate (bbl./day)
Total Capital Cost (EGP) Total Fuel Cost (EGP/y) LCOE (EGP/kWh)
WSEAS TRANSACTIONS on POWER SYSTEMS DOI: 10.37394/232016.2021.16.11
Mohammad M. El-Yamany, Sameh O. Abdullatif, Hani A. Ghali
Volume 16, 2021 113 E-ISSN: 2224-350X

Table 5. Techno-economic Parameters for the Field using HDGS topology.
Parameters Well No.
1 2 3 4 5
Flow Rate (bbl./Day) 400 300 190 170 400
Actual Power (kW) 27.45 21.86 16.19 15.57 26.04
PV Energy Production (kWh/day) 355.752 283.3056 209.8224 201.7872 337.4784
DG Production (kWh/day) 303.048 241.3344 178.7376 171.8928 287.4816
Energy Consumption kWh/day 658.8 524.64 388.56 373.68 624.96
Energy Consumption kWh/Year 240462 191494 141824 136393 228110
Solar PV (kWp) 89.2 71 53 50.6 84.6
Diesel Generator (kW) 120
PV panels (Units) 262 209 155 149 249
Area (m2) 0.892 0.71 0.53 0.506 0.846
DC/AC inverter No. (27 kW/Unit) 4 3 2 2 4
Total capital cost (EGP) 871177 703844 534711 520122 838039
Diesel consumption (L/y) 61898 49275 36500 35113 58729
Generator renting cost (EGP/day) 1155
Total fuel cost (EGP) 618980 492750 365000 351130 587290
Total Electrical Production (kWh/y) 273057 217425 161030 154863 259000
ATLCC 1287193 1134216 978730 963345 1252097
LCOE (EGP/kWh) 5.353 5.923 6.901 7.063 5.489
Parameters Well No.
6 7 8 9 10
Flow Rate (bbl./Day) 125 425 250 220 165
Actual Power (kW) 12.16 28.02 21.23 16.8 14.55
PV Energy Production (kWh/day) 157.5936 363.1392 275.1408 217.728 188.568
DG Production (kWh/day) 134.2464 309.3408 234.3792 185.472 160.632
Energy Consumption kWh/day 291.84 672.48 509.52 403.2 349.2
Energy Consumption kWh/Year 106522 245455 185975 147168 127458
Solar PV (kWp) 39.5 91.1 69 54.6 47.2
Diesel Generator (kW) 120
PV panels (Units) 117 268 203 161 139
Area (m2) 0.395 0.911 0.69 0.546 0.472
DC/AC inverter No. (27 kW/Unit) 2 4 3 2 2
Total capital cost (EGP) 440338 884504 689076 548939 496349
Diesel consumption (L/y) 27412 63182 47888 37887 32814
Generator renting cost (EGP/day) 1155
Total fuel cost (EGP) 274120 631820 478880 378870 328140
Total Electrical Production (kWh/y) 120946 278694 211159 167097 144718
ATLCC 878164 1301648 1118266 993972 937835
LCOE (EGP/kWh) 8.244 5.303 6.013 6.754 7.358
WSEAS TRANSACTIONS on POWER SYSTEMS DOI: 10.37394/232016.2021.16.11
Mohammad M. El-Yamany, Sameh O. Abdullatif, Hani A. Ghali
Volume 16, 2021 114 E-ISSN: 2224-350X

4.2.2 Hybrid centralized generation system
(HCGS) One of the main advantages of the centralized
generation systems is the possibility of utilizing
excess energy with respect to HDGS, whenever
existed. To design a centralized generation system for
this research case study, table 6 presents the overall
field parameters which are needed to run the whole
field. The flow rate is the main reference that is used
to categorize the oil well, and it is the main factor that
affects the power consumption in the system.
Therefore, the whole field requires 200 kW to
produce 2645 bbl./day. The centralized PV system
generates 2592 kWh per day, while the DG generates
2208 kWh per day. Accordingly, the energy
consumption for the whole field per day is 4800
kWh/day, which turns to 1752000 kWh per year. The
share of the energy produced in the system is set to
the optimum value of 54% for the PV side and 46%
for diesel generation. The PV system requires 6500
m2 area to establish the 650 kWp PV system that
used 1912 PV modules with a rating of 340 W to
generate 2592 kWh per day.
To design the HCGS, there are two main
parameters that affect the design settings with respect
to the model of the HDGS. These parameters are the
rating of the inverters and the rating of the diesel
generators. For the HCGS, one inverter is used with
a 200 kW rating along with one diesel generator with
a rating of 292 kW-365 kVA. The 292 kW diesel
generator consumes 659 litres per day with 10 EGP
per litter, which turn to a total cost of 2403530 EGP
per year. The running cost (renting cost) of this diesel
generator unit is 1700 EGP per day. Extra cables are
added in the HCGS, added cost with respect to
HDGS, to supply all loads from the same centralized
source. The net cables cost in the HCGS is 7360000
EGP for 20 km cables with 368000 EGP per km, and
the total capital cost of the whole system is 12333200
EGP. The cable cost in the HCGS is recorded as the
highest parameter in the capital cost of the system
with more than 59% of the total system cost. The total
Levelized cost of energy for this centralized
generation system is 2.56EGP per kWh.
The reliability of the HCGS is lower than the
HDGS as in case of system failure; the whole system
will be a blackout. To avoid the production
disturbance at any time, the backup system could be
synchronized with the existing system to increase the
HCGS reliability. By adding the backup system to the
HCGS, the extra added parameters and the new setup
configuration of the updated system is presented in
table 7. The standby system is consisting of one
inverter with a 200 kW rating and one diesel
generator with 292 kW power output. These backup
units are affecting the total capital cost with an
increase of 252400 EGP than the normal HCGS. The
new capital cost for the HCGS with the backup units
is 12,585,600 EGP, and the LCOE became 2.965
EGP/KWh.
Table 6. The Settings of the CGS for the Whole Field
Parameters Value Parameters Value
Flow Rate (bbl./Day) 2645 Total Cables Distance (km) 20
Actual Power (kW) 200 Total Cables Cost (EGP) 7360000
PV Energy Production (kWh/day) 2592 No. of Diesel Generator (Unit) 1
Diesel Generator Production (kWh/day) 2208 Diesel Generator (kW) 292
Energy Consumption kWh/day 4800 Diesel Consumption (L/day) 659
Energy Consumption kWh/Year 1752000 Diesel Consumption (L/year) 240535
Solar PV (kWp) 650 Generator Renting Cost (EGP/day) 1700
No. of PV Panels (Units) 1912 Generator Renting Cost (EGP/year) 620500
PV Panel Rating (W) 340 Total Capital Cost (EGP) 12333200
Area (m2) 6500 Total Fuel Cost (EGP/y) 2405350
DC/AC Inverters Rating (kW) 200 Total Electrical Production (kWh/y) 1989250
No. of DC/AC Inverters (/Unit) 1 ATLCC (EGP/year) 4485120
Cables cost per km (EGP) 368000 LCOE (EGP/kWh) 2.56
WSEAS TRANSACTIONS on POWER SYSTEMS DOI: 10.37394/232016.2021.16.11
Mohammad M. El-Yamany, Sameh O. Abdullatif, Hani A. Ghali
Volume 16, 2021 115 E-ISSN: 2224-350X

Table 7. Backup System Parameters
Parameters Setting
No. of Backup DC/AC Inverters (Unit) 1
Backup DC/AC Inverter Rating (kW) 200
No. of Backup Diesel Generator (Unit) 1
Backup Diesel Generator (kW) 292
New Total Capital Cost (EGP) 12,585,600
New LCOE (EGP/kWh) 2.965
4.2.3 Comparison between the HDGS and the
HCGS topologies Principally, both the HDGS and the HCGS have
pros and cons in the technical and economical sides
of this study. Both designs have been applied for the
case study, and each one of them got their own
configurations that fit SRP system needs. Table 8
lists the comparison between the HDGS, HCGS (with
the backup units), and the currently running system
(0%-PV, 100%-DG). The rental cost of both the
Hybrid Distributed Generation System (HDGS) and
the currently running system are the same, but the
diesel consumption is different.
Table 8. Comparison between the HDGS, HCGS and the Existing System
Parameters Existing System HDGS HCGS
Flow Rate (bbl./Day) 2645 2645 2645
Actual Power (kW) 200 200 200
PV Energy Production (kWh/day) - 2592 2592
Diesel Generator Production (kWh/day) 4800 2208 2208
Energy Consumption kWh/day 4800 4800 4800
Energy Consumption kWh/Year 1752000 1752000 1752000
Solar PV (kWp) - 650 650
PV panels (Units) - 1912 1912
PV Panel Rating (W) - 340 340
Area (m2) - 6500 6500
No. of DC/AC Inverters (Unit) - 28 1
DC/AC Inverter Rating (kW) - 27 200
No. of Diesel Generator (Unit) 10 10 1
Diesel Generator (kW) 120 120 292
Diesel consumption (L/day) 2684 1235 659
Diesel consumption (L/y) 979,660 450700 240535
Generator renting cost (EGP/day) 11550 11550 1700
Generator renting cost (EGP/year) 4,215,750 4215750 620500
Extra Cables cost (EGP) - - 7360000
Total capital cost (EGP) - 6,527,100 12,585,600
Total fuel cost (EGP/year) 979,6600 4506980 2405350
Total Electrical Production (kWh/year) 1987989 1987989 1989250
ATLCC (EGP/year) 13,998,480 10844880 4485120
LCOE (EGP/kWh) 7.99 6.19 2.965
WSEAS TRANSACTIONS on POWER SYSTEMS DOI: 10.37394/232016.2021.16.11
Mohammad M. El-Yamany, Sameh O. Abdullatif, Hani A. Ghali
Volume 16, 2021 116 E-ISSN: 2224-350X

This is due to that the currently running system
mainly depends on the diesel generator only;
therefore, the diesel consumption drops from 979,660
L/y in the currently running system to 450700 L/y in
the HDGS. This definitely affects the ATLCC of the
system and makes it fall from 13,998,480 EGP in the
stand-alone DG to 10844880 EGP in the HDGS.
Consequently, the LCOE of the existing system was
7.99 EGP/kWh, while it is only 6.19 EGP/kWh in the
HDGS.
By comparing the HDGS with HCGS: in HDGS,
the rate of the used inverter was 27 kW with a total
of 28 inverters that have been used to cover the
system needs. Meanwhile, in the HCGS, the inverter
rate was 200 kW with only one inverter in the system.
The HDGS needs 10-diesel generators with a 120 kW
rating to supply the 10-sucker rod pumping systems,
while the HCGS requires only one diesel generator
with 292 kW rating. The diesel consumption drops
from 1235 litres per day in the HDGS to 659 litres
per day in the HCGS due to the optimum selection of
the diesel generator size. The reduction in the number
of generators caused a drop in the yearly rental cost
from 4,215,750 EGP per year in the HDGS to
620,500 EGP per year in the HCGS. This shows
that the rental cost in the case of the HDGS is more
than six times than of the HCGS.
The capital cost of the HDGS is 6,527,100 EGP,
while it is 12,585,600 EGP for the HCGS with an
increase of 6,058,500EGP (92%) more than the
HDGS. The parameter that has the most significant
effect on the total capital cost of the HCGS than the
HDGS is the cost of cables with more than 59% of
the total system capital cost. Meanwhile, The
Operating cost has more effect than the capital cost
over the total system cost; therefore, the LCOE of the
HCGS is 2.965 EGP per kWh while it is 6.19 EGP
per kWh for the HDGS. The overall conclusion states
that the HDGS can save 22.5% in LCOE than the
currently running system, while the HCGS can save
62.8%. Accordingly, we recommend the utilization
of HCGS in such configurations.
5 Conclusion Oil & gas sites are mostly very far from national
grid; therefore, the required energy is provided by the
diesel system. It is clearly known that conventional
energy sources such as diesel generators have some
drawbacks, such as carbon dioxide emissions and the
high operating and maintenance cost. Therefore,
integrating the renewable energy with the
conventional energy sources limits its demerits.
Additionally, the integration limits the problem of
supplying fuel to the remote areas of the SRPs sites.
All these parameters will affect in the total
production cost of the oil, as well as the
environmental conditions.
Herein, we introduce a novel optimized system
based on both PV as a renewable energy resource in
addition to DG as a conventional source. The
optimization process is considered from the PV/DG
contribution percentage where 54% to 46% optimum
system was concluded. Then, two various topologies
were demonstrated with a centralized architecture
against a distributed one. LCOE was considered the
main evaluating parameter, reaching an overall
reduction of 62% with referring to the current DG
100% running system while proposing HCGS. While
still the HDGS recorded enhanced LCOE than the
running alternative but still significantly higher than
the HCGS (nearly twice).
The work implemented in this study can be
generalized either in terms of the location or the
artificial lifting systems to include a set of varieties.
Moreover, this back-stage optimizer can be
interfaced with an appropriate GUI, to be deployed as
an online pre-sizing tool.
Nomenclature Parameter Defination Unit
𝛃𝐢 Dummy weighting
factor in WCOT
fitness function
1
𝛈𝐁 The battery efficiency 1
𝛈𝐢𝐧𝐯 Inverter efficiency 1
𝛈𝐑 Voltage regulator
efficiency
1
𝛇𝐋𝐂𝐎𝐄 A geometric average
for these three LCOE
parameters is
introduced to
optimize using
WCOT
EGP/KWh
𝐀𝐓𝐋𝐂𝐂 The Annualized Total
Life Cycle Cost
EGP
𝐂𝐜𝐚𝐩 The total capital cost EGP
𝐂𝐜𝐚𝐩,𝐚 The capital costs EGP
𝐂𝐜𝐚𝐩,𝐁𝐚𝐭 The total capital cost
for battery
EGP
𝐂𝐜𝐚𝐩,𝐂 The total capital cost
for the controller
EGP
𝑪𝒄𝒂𝒑,𝑫𝑮 The total capital cost
for diesel generator
EGP
𝐂𝐜𝐚𝐩,𝐈𝐧𝐯 The total capital cost
for inverters
EGP
𝐂𝐜𝐚𝐩,𝐏𝐕 The total capital cost
for PV array
EGP
𝐂𝐜𝐚𝐩,𝐎𝐂 The total capital other
costs
EGP
WSEAS TRANSACTIONS on POWER SYSTEMS DOI: 10.37394/232016.2021.16.11
Mohammad M. El-Yamany, Sameh O. Abdullatif, Hani A. Ghali
Volume 16, 2021 117 E-ISSN: 2224-350X

𝐂𝐨&𝐦 The total operating
and maintenance
expenses
EGP
𝐂𝐨&𝐦,𝐚 The operation and
maintenance costs
EGP
𝑪𝒐&𝒎,𝑩𝒂𝒕 The total operating
and maintenance cost
for battery
EGP
𝑪𝒐&𝒎,𝑪 The total operating
and maintenance cost
for the controller
EGP
𝑪𝒐&𝒎,𝑫𝑮 The total operating
and maintenance cost
for diesel generator
EGP
𝐂𝐨&𝐦,𝐈𝐧𝐯 The total operating
and maintenance cost
for inverter
EGP
𝑪𝒐&𝒎,𝑶𝑪 The total operating
and maintenance
other costs
EGP
𝐂𝐨&𝐦,𝐏𝐕 The total operating
and maintenance cost
for PV array
EGP
𝐂𝐫𝐞𝐩,𝐚 The replacement
costs
EGP
𝐂𝐬,𝐚 The salvage value EGP
𝐃𝐎𝐃 Depth of discharge 1
𝐄𝐁 Battery storage
capacity
Wh
𝐄𝐋 The total energy
demand per day
Wh
𝑭𝒔 Safety factor 1
G Specific gravity 1
𝐈 Electric Current A
𝐈𝐁 the battery storage
ampere hour
Ah
𝐇𝐛 The brake
horsepower
Hp
𝐇𝐡𝐲𝐝𝐫 The hydraulic
horsepower required
for lifting the liquid
Hp
𝐇𝐟 The friction
horsepower
Hp
𝐋𝐝𝐲𝐧 The dynamic liquid
level in the well
Ft
𝐋𝐬 The total lifetime Years
𝑳𝑪𝑶𝑬 The Levelized Cost of
Energy
EGP/KWh
𝐋𝐂𝐎𝐄𝐃𝐆𝛆 The DG system
Levelized Cost of
Energy
EGP/KWh
(𝐋𝐂𝐎𝐄𝐁−𝐃𝐂 𝛆 The storage system
Levelized Cost of
Energy
EGP/KWh
𝐋𝐂𝐎𝐄𝐏𝐕 𝛆 The PV system
Levelized Cost of
Energy
EGP/KWh
N Pump speed spm
𝐧𝐝𝐫 The net of inflation
rate discount
1
𝐕 Voltage V
𝐕𝐁 The battery voltage V
𝐏𝐌 SRP motor rating KW
𝑷𝑷𝑽 Photovolatic power KW
𝒑𝒇 Power factor 1
𝑷𝑺𝑯 Peak sun hours hrs
Q Flow rate bbl./Day
𝐑𝐌𝐒𝐄 The root mean square
error
1
S Stroke length in
𝐒𝐟 PV system safety
factor
1
𝐖𝐫 Weight of sucker rod
string
lb.
References:
[1] K. E. Okedu, H. A. Nadabi, and A. Aziz,
“Prospects of Solar Energy in Oman:
case of oil and gas industries,”
International Journal of Smart Grid, vol.
3, no. 3, 2019, pp. 138-151.
[2] M. Ouki, "Egypt – a return to a balanced
gas market?," OIES paper: NG 131,
Oxford Institute for Energy Studies,
2018. Available from:
https://doi.org/10.26889/978178467112
9
[3] S. Levoniuk, and H. E. Taki, “Selection
strategy for the optimal artificial lift
method (on the example of Novotroitsk
field, Ukraine),” National Technical
University, 2020, pp. 6-13.
[4] B. Bintarto, R. R. Auliya, R. A. M. Putra,
A. S. Pradipta, and R. A. Kurnia,
“Production Data Analysis and Sonolog
for Determining Artificial Lift Design
and Well Characteristic,” Journal of
Petroleum Geothermal Technology, vol.
1, no. 1, 2020, pp. 28-35.
[5] C. Kandziora, “Applying artificial
intelligence to optimize oil and gas
WSEAS TRANSACTIONS on POWER SYSTEMS DOI: 10.37394/232016.2021.16.11
Mohammad M. El-Yamany, Sameh O. Abdullatif, Hani A. Ghali
Volume 16, 2021 118 E-ISSN: 2224-350X

production,” in Offshore Technology
Conference, Texas, 2019. Available
from: https://doi.org/10.4043/29384-MS
[6] E. O. a. Gas, “GE Oil & Gas and Petrojet
Mark the Manufacture of 1000th
Pumping Unit for Oil and Gas sector in
Egypt,” 2014. Available from:
https://egyptoil-gas.com/features/ge-oil-
gas-and-petrojet-mark-the-manufacture-
of-1000th-pumping-unit-for-oil-and-
gas-sector-in-egypt/
[7] A. Abdelmaksoud, H. F. Ewida, G. H. El-
Habaak, and A. T. Amin, “3D structural
modeling of the Upper Bahariya Member
in Abu Gharadig oil and gas field, North
Western Desert, Egypt,” Journal of
African Earth Sciences, vol. 150, 2019,
pp. 685-700.
[8] A. Tarshan, and S. Shimanskiy,
“Petroleum system modelling and
identification of promising oil and gas
bearing objects in the eastern part of the
Gulf of Suez, Egypt,” Russian Journal of
Earth Sciences, vol. 19, no. 4, 2019.
[9] S. Rolland, and G. Glania, “Hybrid mini-
grids for rural electrification: lessons
learned,” Alliance for Rural
Electrification, 2011. Available from:
https://www.ruralelec.org/sites/defa
ult/files/hybrid_minigrids_for_rural_el
ectrification_2014.pdf
[10] D. Grassian, and D. B. Olsen, “Practical
Applications of Net Energy Analysis of
Upstream Oil and Gas Processes,”
Journal of Energy Resources
Technology, vol. 143, no. 6, 2021.
[11] A. A.-A. M. Abdulhameed, V. Y.
Kornilov, and A. Gorodnov, “Optimal
operation of electrical power generators
for oil wells operated by artificial lifting
at Rumila field,” Известия высших
учебных заведений. ПРОБЛЕМЫ
ЭНЕРГЕТИКИ, vol. 20, no. 11-12,
2018.
[12] Y. Choi, C. Lee, and J. Song, “Review of
renewable energy technologies utilized
in the oil and gas industry,” International
Journal of Renewable Energy Research,
vol. 7, no. 2, 2017, pp. 592-598.
[13] R. Moussa, “Installing Piezoelectric tiles
in Children Outdoor Playing areas to
Create Clean & Healthy Environment;
Case Study of El-Shams Sporting Club,
Cairo_Egypt,” WSEAS Transactions on
Environment and Development, vol. 16,
05/25, 2020, pp. 471-479.
[14] R. R. Moussa, “The Effect of Piezo-
Bumps on Energy Generation and
Reduction of the Global Carbon
Emissions,” WSEAS Transactions on
Environment Development, vol. 15, no.
46, 2019, pp. 430-437.
[15] M. J. Pickl, “The renewable energy
strategies of oil majors – From oil to
energy?,” Energy Strategy Reviews, vol.
26, 2019, pp. 100370.
[16] J. Wang, J. O'Donnell, and A. R. Brandt,
“Potential solar energy use in the global
petroleum sector,” Energy, vol. 118,
2017, pp. 884-892.
[17] T. Khatib, A. Mohamed, K. Sopian, and
M. Mahmoud, “Optimal sizing of
building integrated hybrid PV/diesel
generator system for zero load rejection
for Malaysia,” Energy and Buildings,
vol. 43, no. 12, 2011, pp. 3430-3435.
[18] R. CIMINO, V. BROCCO, F.
CASTALDO, G. De GHETTO, M.
FAVARETTO, and T. AKMAL,
“Deploying a Solar Hybrid Technology
in a Remote Oil and Gas Production
Site,” Journal of the Japan Institute of
Energy, vol. 94, no. 10, 2015, pp. 1163-
1168.
[19] T. Iqbal, C. A. Osaretin, and S. Butt,
“Optimal sizing and techno-economic
analysis of a renewable power system for
a remote oil well,” AIMS Electronics
Electrical Engineering, vol. 4, no. 2,
2020, pp. 132-153.
[20] A. Mansour, J. Abdallah, and M.
Obeidat, “An efficient intelligent power
detection method for photovoltaic
system,” International Journal of
WSEAS TRANSACTIONS on POWER SYSTEMS DOI: 10.37394/232016.2021.16.11
Mohammad M. El-Yamany, Sameh O. Abdullatif, Hani A. Ghali
Volume 16, 2021 119 E-ISSN: 2224-350X

Circuits, Systems Signal Processing, vol.
14, 2020, pp. 686-699.
[21] Z. S. Yue Lin, Bai Jing, Kanae
Shunshoku, “A Multi Fusion Data
Mining Algorithm for Solar Energy
Efficiency,” International journal of
circuits, systems and signal processing,
vol. 14, 2020, pp. 499-510.
[22] B. C. Craft, W. R. Holden, and E. D.
Graves, Well Design: Drilling and
Production: Prentice-Hall, 1962.
[23] M. Atef, M. Abdullah, T. Khatib, and M.
Romlie, “Utilization of Artificial Neural
Networks to Improve the Accuracy of a
Hybrid Power System Model,” in 2019
IEEE Student Conference on Research
and Development (SCOReD), pp. 284-
288.
[24] T. Khatib, and W. Elmenreich, Modeling
of Photovoltaic Systems Using MATLAB:
Simplified Green Codes: John Wiley &
Sons, 2016.
[25] T. ECONOMICS, “Egypt: Inflation rate
from 1984 to 2021.” Available from:
https://www.statista.com/statistics/3773
54/inflation-rate-in-egypt/
[26] IRENA (2018), Renewable Energy
Outlook: Egypt, International Renewable
Energy Agency, Abu Dhabi. Available
from:https://www.irena.org//media/Files
/IRENA/Agency/Publication/2018/Oct/I
RENA_Outlook_Egypt_2018_En.pdf
[27] M. M. Zarie, P. Makeen, S. O. Abdellatif,
I. Mahmoud, and T. Abdel-Salam,
“Techno-economic Feasibility of
Photovoltaic System for an Educational
Building in Egypt:(Case Study),” in 2019
International Conference on Innovative
Trends in Computer Engineering (ITCE),
2019, pp. 521-525.
[28] N. M. Elsayed, R. A. Swief, S. O.
Abdellatif, and T. S. Abdel-Salam,
“Photovoltaic Applications for Lighting
Load Energy Saving: Case Studies,
Educational Building,” in 2019
International Conference on Innovative
Trends in Computer Engineering (ITCE),
2019, pp. 564-569.
[29] M. Sadeq, and S. Abdellatif, “PV‐ON:
An online/bilingual PV sizing tool for
grid‐connected system, case studies in
Egypt,” International Transactions on
Electrical Energy Systems, 2021, pp.
e12910.
[30] M. Sadeq, S. O. Abdellatif, W. R. Anis,
and H. A. Ghali, “Development of pre-
sizing techno-economic Matlab code for
grid-connected PV system, using four
cities in Egypt,” in New Concepts in
Solar and Thermal Radiation Conversion
III, 2020, pp. 114960R.
[31] M. Elkasrawy, P. Makeen, S. O.
Abdellatif, and H. A. Ghali, “Optimizing
electric vehicles station performance
using AI-based decision maker
algorithm,” in Emerging Topics in
Artificial Intelligence 2020, pp.
114691W.
[32] T. Chai, and R. R. J. G. m. d. Draxler,
“Root mean square error (RMSE) or
mean absolute error (MAE)?–Arguments
against avoiding RMSE in the literature,”
vol. 7, no. 3, 2014, pp. 1247-1250.
Author Contribution: All the author have made
substantive contributions to the manuscript. Sameh
O. Abdullatif has made a significant contribution to
the conception and design of the work. Mohammad
M. El-Yamany has made a substantial contribution to
the data collection, analysis, and interpretation. Hani
A. Ghali drafted the manuscript and revised it.
Creative Commons Attribution License 4.0 (Attribution 4.0 International, CC BY 4.0)
This article is published under the terms of the Creative Commons Attribution License 4.0 https://creativecommons.org/licenses/by/4.0/deed.en_US
WSEAS TRANSACTIONS on POWER SYSTEMS DOI: 10.37394/232016.2021.16.11
Mohammad M. El-Yamany, Sameh O. Abdullatif, Hani A. Ghali
Volume 16, 2021 120 E-ISSN: 2224-350X