Investigating the performance of isolation systems in ...
21
INVESTIGATING THE PERFORMANCE OF ISOLATION SYSTEMS IN IMPROVING THE SEISMIC BEHAVIOR OF URBAN BRIDGES. A CASE STUDY ON THE HESARAK BRIDGE Ali Akbar Edalati 1,2 and Hossein Tahghighi 3 ABSTRACT. This paper investigates the influence of isolation systems on the seismic behavior of urban reinforce concrete bridge. The performance of the Hesarak Bridge constructed in Karaj city, Iran with two isolation systems; i.e. the existing elastomeric rubber bearing (ERB) and a proposed lead rubber bearing (LRB) is discussed. The numerical model was implemented in the well-known FEM software CSIBridge. The isolated bridge has been analyzed using nonlinear time history analysis method with seven pairs of earthquake records and the results are compared for the two isolation systems. The LRB isolators are shown to have superior seismic performance in comparison with the existing ERB systems based on the response evaluation including force on the isolator, pier base shear, deck acceleration, bending moment, pier displacement, and energy dissipation. Keywords: RC bridge, Seismic response, LRB, ERB, Time history analysis 1. INTRODUCTION The bridges are the main parts of transportation that must be fitted to earthquake hazards. Thus, the capacity of the bridges should be higher than its demand. By increasing the ground acceleration, the force on the bridge increases and the bridge's capacity should be increased, which is to some extent acceptable and rational. In such cases, design codes allow the use of ductility to increase capacity. 1 MSc in Structural Engineering, University of Kashan, Kashan, Iran, Post Code: 8731753153, Email: [email protected] (Ali Akbar Edalati) ORCID code: https://orcid.org/0000-0002-4225-2965 2 Structural Engineer, Civil Organization, Municipality of Karaj, Karaj, Iran, Post Code: 3134851889. 3 Assisstant Prof., PhD, PE, Civil Eng. Dept., University of Kashan, Kashan, Iran, Post Code: 8731753153 ORCID code: https://orcid.org/0000-0001-6091-8815 Corresponding author Tel.: +98 31 55912430; Fax: +98 31 55912424; Postal code: 8731753153. E-mail: [email protected] (Hossein Tahghighi).
Transcript of Investigating the performance of isolation systems in ...

INVESTIGATING THE PERFORMANCE OF ISOLATION SYSTEMS
IN IMPROVING THE SEISMIC BEHAVIOR OF URBAN BRIDGES.
A CASE STUDY ON THE HESARAK BRIDGE
Ali Akbar Edalati1,2 and Hossein Tahghighi3��
ABSTRACT. This paper investigates the influence of isolation systems on the seismic behavior of urban reinforce concrete
bridge. The performance of the Hesarak Bridge constructed in Karaj city, Iran with two isolation systems; i.e. the existing
elastomeric rubber bearing (ERB) and a proposed lead rubber bearing (LRB) is discussed. The numerical model was
implemented in the well-known FEM software CSIBridge. The isolated bridge has been analyzed using nonlinear time
history analysis method with seven pairs of earthquake records and the results are compared for the two isolation systems.
The LRB isolators are shown to have superior seismic performance in comparison with the existing ERB systems based on
the response evaluation including force on the isolator, pier base shear, deck acceleration, bending moment, pier
displacement, and energy dissipation.
Keywords: RC bridge, Seismic response, LRB, ERB, Time history analysis
1. INTRODUCTION The bridges are the main parts of transportation that must be fitted to earthquake hazards. Thus, the
capacity of the bridges should be higher than its demand. By increasing the ground acceleration, the
force on the bridge increases and the bridge's capacity should be increased, which is to some extent
acceptable and rational. In such cases, design codes allow the use of ductility to increase capacity. 1MSc in Structural Engineering, University of Kashan, Kashan, Iran, Post Code: 8731753153, Email: [email protected] (Ali Akbar Edalati) ORCID code: https://orcid.org/0000-0002-4225-29652Structural Engineer, Civil Organization, Municipality of Karaj, Karaj, Iran, Post Code: 3134851889.3Assisstant Prof., PhD, PE, Civil Eng. Dept., University of Kashan, Kashan, Iran, Post Code: 8731753153 ORCID code: https://orcid.org/0000-0001-6091-8815�Corresponding author Tel.: +98 31 55912430; Fax: +98 31 55912424; Postal code: 8731753153.E-mail: [email protected] (Hossein Tahghighi).
Isolation of the structure is typically used to support the deck on the piers and the abutments and
reduce the effects of seismic loads and thermal effects on bridges [1]. Since 1970, a range of isolation
devices has been developed in aseismic design structures [2]. The LRB is most commonly used base
isolation system. The bearing is very stiff and strong in the vertical direction, but flexible in the
horizontal direction. Roy and Dash [3] observed that the response parameters significantly reduce for a
multi-span bridge seismically isolated by LRB over non-isolation bearing.
The LRB rubber isolators have a bi-linear behavior that reduces the stiffness of the second part of
the curve by yielding the lead. In other words, it is softened and produces an optimal performance
against severe and slight seismic loads [4, 5]. The lead core causes energy loss and increases the
structure damping, and the steel layers increase vertical bearing capacity. LRB isolators in combination
with elastomeric bearings distribute earthquake forces between abutments and piers [6]. Unlike the
LRB isolators, the ERBs are not able to properly distribute earthquake forces between the piers and
abutments during an earthquake ground motion, and in some cases do not work as isolators at all [7].
The LRB are multilayered, laminated elastomeric bearings that have one or more circular holes. Lead
plugs are inserted into these holes to add damping to the isolation system [8]. The occurrence of tensile
forces in isolation bearings has been reported in many reconnaissance surveys such as those following
the 2011 Tohoku earthquake and also in experimental shaking-table tests on isolated structures [9].
Mendez et al. [10] demonstrated in full-scale experiments the proper function of LRB isolators in
energy losses during cyclic loads and effective operation against displacements. The LRB isolator has
been shown to function properly under the near-and far-fault zone earthquake motions [11]. The natural
period of the structure and the isolation coefficient of friction are the most critical parameters that
control the isolator function [12].
When an isolated bridge is subjected to an earthquake, deformation occurs in the isolators instead of
the substructure elements. This greatly reduces the forces transmitted from the superstructure to the
substructure. Over the past 20 years, more than 200 bridges in the United States have been designed or
renovated using seismic isolation, and more than a thousand bridges around the world have now been
used with this affordable technology for seismic protection [13]. Seismic isolation with ERB has been
used extensively in contemporary bridge engineering in Iran as a means of mitigating the effect of
earthquake loads [14]. In this study, the application of LRB isolation system has been investigated to
evaluate the seismic responses of the Hesarak Bridge including vibration period, base shear, lateral
156 A.A. EDALATI, H. TAHGHIGHI

displacement and bending moment of the piers, deck acceleration, damping and energy dissipation in
comparison to the influence of existing ERB isolation system. Thus, first, the isolation systems and
their seismic performances are introduced. Then, a comprehensive parametric study is carried out to
investigate the effectiveness of LRB over ERB isolation systems for the multi-span urban bridge using
nonlinear modal time history analysis method.
2. BRIDGE DESCRIPTION
The Hesarak reinforce concrete bridge is located on the Karaj-Qazvin freeway along the Shahid
Beheshti Blvd. in the city of Karaj, Iran. Fig. 1 shows the aerial photo of the bridge. It has a concrete
deck and concrete walls of piers as depicted in Fig. 2. Deck section is single-cell, pre-fabricated and
pre-stressed. Figs. 3 through 5 show deck cross-section, abutment details, pier section, and longitudinal
profile of the bridge, respectively [16]. The width of the bridge is 14.2 m and the length of the spans is
variable. The bridge has wall middle columns, seven spans and a total length of 302.4 m, a width of
14.2 m, the longest span is 58.25 m and the shortest span is 25.45 m. Table 1 shows the detailed
information of the bridge.
The main components of the deck are the top slab, the cantilever segment, the web, and the bottom
slab. The tendons used in the bridge deck are of 270 GR-270 types with the ultimate resistance of
18700 kg/cm2. The type of cables is strand and they are seven wires, with a nominal diameter of 1.5
cm. The compressive strength of concrete used in the deck is considered to be 300 kg/cm2. While,
concrete used in piers, abutment, cap, and piles has a compressive strength of 250 kg/cm2. The rebars
used in the bridge are AIII grade with a yield strength of 4000 kg/cm2 [16]. According to the field test
experiments, the site soil type II (375<Vs<750 m/sec) is considered based on the Standard No. 2800
[17]. Also, the coefficient of design acceleration A=0.35, and the period values T0 and Ts are considered
to be 0.1 and 0.5 sec, respectively. The deep foundation located below the piers consists of a pile head
8.5 m by 5.5 m and a thickness of 1.5 m. Piles are single with a rectangular cross-section measuring
from 0.8 m to 3.6 m and a height of 18 m.
INVESTIGATING THE PERFORMANCE OF ISOLATION SYSTEMS IN IMPROVING THE SEISMIC... 157

Figure 1. Aerial photo of the Hesarak Bridge [15]. Figure 2. General view of the Hesarak Bridge.
Seismotectonic studies indicate that the Hesarak Bridge is located in the site with high seismic
activity [16]. The north Tehran fault is the nearest fault to the site, which is about 4 km away from the
bridge. Note that near-fault motions are considerably affected by the forward rupture directivity [18].
However, the detailed seismic assessment of the bridge due to the effects of near-fault ground motion
can be an interesting issue for further future researches. Furthermore, the effects of soil-structure
interaction are neglected in this study. In other words, it is assumed that the foundation of the bridge is
fixed against all the movements. It is worth mentioning that Tahghighi and Rabiee [19] concluded that
ignoring base flexibility may over or under predict seismic response of the structure depends mainly on
the soil–structure relative rigidity. Therefore, the soil–pile–bridge interaction should be considered as a
further study on the seismic response of the bridge. In the following, the bridge's seismic behavior has
been evaluated using the LRB isolators as of the proposed isolator system and compared with the
current status of the bridge, which includes ERB isolators.
Figure 3. Cross-section through the deck of Hesarak Bridge (uint in cm) [16].
158 A.A. EDALATI, H. TAHGHIGHI

(a) (b)
Figure 4. Details of the Hesarak Bridge (uint in cm): a) Abutment, and b) Pier section [16].
Figure 5. Longitudinal profile of the bridge [16].
Table 1. Specifications of the bridge Bridge specifications Quantity Bridge length (m) 302.4 Bridge width (m) 14.2 Piers height* (m) 5.28, 5.79, 6.64, 6.61, 6.15, 5.52 Number of spans 7 Span length** (m) 25.47, 46.28, 54.52, 58.24, 46.29, 46.28, 25.43 Piers width (m) 5.5
*: The pier's height is from the left to the right side of the bridge. **: The length of spans is from the left to the right side of the bridge.
3. FINITE ELEMENT MODEL
In order to investigate the isolated bridge response, the three-dimensional numerical modeling was
performed utilizing the finite element software CSIBridge [20]. The 3D model of the bridge is shown
in Fig. 6. According to the design codes, it is assumed that the elements of the superstructure and the
substructure remain elastic. Therefore, the substructure elements like piers and elements of the
superstructure, namely the deck, are modeled using a frame element that has linear behavior. The
A1
P3 P5P4P2P1
A2P6
25.47 46.24 54.45 58.24 46.29 46.28 25.4325.47 46.28m 54.52m 58.24m 46.29m 46.28m 25.43
INVESTIGATING THE PERFORMANCE OF ISOLATION SYSTEMS IN IMPROVING THE SEISMIC... 159

nonlinear link element is used to model the isolator bearing, which during a response history analysis is
capable of providing nonlinear behavior. The columns at the bottom end are based on a rigid
foundation and the interaction of soil and structure are neglected.
Figure 6. 3D finite element model of the bridge.
3.1. BRIDGE DECK
As shown in Fig. 3, the deck section of the bridge is a pre-stressed box girder concrete with a single-
cell and width of 14.2 m. The bridge deck was modeled with a frame element that has linear behavior.
3.2. LATERAL AND MIDDLE PIERS
Lateral piers (abutments) are reinforced wall, which interacts with the soil around. Fig. 4a illustrates
the detail of the abutments of the Hesarak Bridge. The abutments are assumed to be rigid due wing
wall, and the bottom end of the abutments is assumed to be fixed. The middle piers of the RC type wall
with a dimension of 1.2 m by 5.5 m with a variable height of 5 to 7 m are considered following Fig. 4b
and it is exerted to the numerical model as a frame element. As mentioned before, the connection of the
bottom ends of the middle piers to the foundation is fixed.
3.3. ERB ISOLATOR
The ERB isolator is a common type of supports in concrete bridges. These supports transmit the
horizontal force by means of friction, and their behavior depends very much on the initial stiffness.
ERB isolators are modeled using a linear link element. In finite element modeling, it is necessary to
determine the vertical and shear stiffness of the isolator. The shear stiffness, kH, and axial stiffness, kV,
of the ERB isolators are defined by Equations (1) and (2), respectively.
XYZ
160 A.A. EDALATI, H. TAHGHIGHI

where G is the shear modulus of the elastomer, A is the cross-sectional area of the bearing, Tr is the
total thickness of rubber layers, and Ec is the instantaneous compression modulus of the elastomer. The
value of Ec is obtained from Eq. (3) for the rectangular isolators. S is the shape factor which is defined
following the AASHTO guide specifications for isolation design [21] (Eq. (4)). In Eq. (4), B and L are
width and length of the ERB, respectively, and ti is the thickness of one rubber layer. According to the
explained procedures, the ERB specifications used in the bridge is given in Table 2.
=4GS2 (3)
Table 2. ERB isolator specifications used in the bridge
3.4. LRB ISOLATOR
The isolation design of a bridge with lead rubber bearings primarily involves the determination of
the properties of the isolators themselves. Fig. 7 shows the components of an LRB system. Where d
and H are the diameter and the total height of isolator, respectively. dL and hL are the diameter and the
height of lead core, respectively. Elastomeric LRB is considered as an ideal bi-linear hysteresis model
with nonlinear characteristics in shear freedom degrees and linear properties in other degrees of
freedom. In order to model the isolator, the spring element (Link) is used. The shear and axial
mechanical behavior of the LRB isolator is shown in Fig. 8. The nonlinear model is based on the
hysteretic behavior provided by Park et al. [22]. According to this method, the parameters required for
an LRB isolator are the initial elastic stiffness (Kel), yield strength (Fy), post-yield stiffness (Kd), and
effective stiffness (Keff). Table 3 presents the material properties of rubber used in isolator design. Gr is
the shear modulus of rubber, K is the bulk modulus of rubber, and k’ is the material constant for rubber.
KV (ton/m)
KH
(ton/m) Ec
(kg/cm2) G
(kg/cm2) ERB dimension
(mm)
487373 1373 3550 10 900×900×59 Lateral piers 302684 853 3550 10 900×900×95 Middle piers
INVESTIGATING THE PERFORMANCE OF ISOLATION SYSTEMS IN IMPROVING THE SEISMIC... 161

Figure 7. LRB isolator system (after [13]).
(a) (b)
Figure 8. Force-displacement model for LRB: a) Shear behavior, and b) Axial behavior.
Table 3. Material properties of rubber used in LRB design
Following AASHTO guideline [21], the LRB has been designed for the bridge. The properties of the
isolators which need to be determined to complete the design include lead core diameter, isolator
diameter, thickness and number of the rubber layers, thickness and number of steel reinforcing plates.
Equations (5) through (9) have been used to calculate the LRB properties.
Lead core
Bottom connecting plate
Top connecting plate
Cover rubber
Internal rubber layer
Steel reinforcing plates
H hL
d
dbdL
Kel Keff
FyQd
Kd
Dy
LateralForce
LateralDisplacement
KVt
KVc
AxialForce
Axial Displacement
K’
K
(kg/cm2) Gr
(kg/cm2) 0.73 20000 6.4
162 A.A. EDALATI, H. TAHGHIGHI
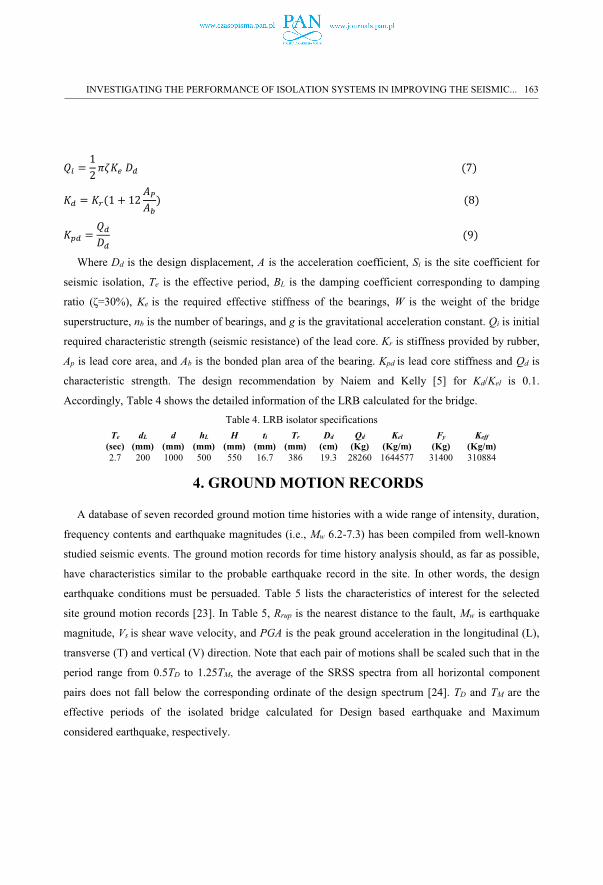
Where Dd is the design displacement, A is the acceleration coefficient, Si is the site coefficient for
seismic isolation, Te is the effective period, BL is the damping coefficient corresponding to damping
ratio (ζ=30%), Ke is the required effective stiffness of the bearings, W is the weight of the bridge
superstructure, nb is the number of bearings, and g is the gravitational acceleration constant. Qi is initial
required characteristic strength (seismic resistance) of the lead core. Kr is stiffness provided by rubber,
Ap is lead core area, and Ab is the bonded plan area of the bearing. Kpd is lead core stiffness and Qd is
characteristic strength. The design recommendation by Naiem and Kelly [5] for Kd/Kel is 0.1.
Accordingly, Table 4 shows the detailed information of the LRB calculated for the bridge. Table 4. LRB isolator specifications
4. GROUND MOTION RECORDS
A database of seven recorded ground motion time histories with a wide range of intensity, duration,
frequency contents and earthquake magnitudes (i.e., Mw 6.2-7.3) has been compiled from well-known
studied seismic events. The ground motion records for time history analysis should, as far as possible,
have characteristics similar to the probable earthquake record in the site. In other words, the design
earthquake conditions must be persuaded. Table 5 lists the characteristics of interest for the selected
site ground motion records [23]. In Table 5, Rrup is the nearest distance to the fault, Mw is earthquake
magnitude, Vs is shear wave velocity, and PGA is the peak ground acceleration in the longitudinal (L),
transverse (T) and vertical (V) direction. Note that each pair of motions shall be scaled such that in the
period range from 0.5TD to 1.25TM, the average of the SRSS spectra from all horizontal component
pairs does not fall below the corresponding ordinate of the design spectrum [24]. TD and TM are the
effective periods of the isolated bridge calculated for Design based earthquake and Maximum
considered earthquake, respectively.
Keff (Kg/m)
Fy (Kg)
Kel
(Kg/m) Qd
(Kg) Dd
(cm) Tr
(mm) ti
(mm) H
(mm) hL
(mm) d
(mm) dL
(mm) Te
(sec) 310884 31400 1644577 28260 19.3 386 16.7 550 500 1000 200 2.7
INVESTIGATING THE PERFORMANCE OF ISOLATION SYSTEMS IN IMPROVING THE SEISMIC... 163

Table 5. Specifications of the accelerograms used in the analysis [23]
5. NUMERICAL ANALYSIS
The most suitable method of analysis consistent with the physical behavior of structures subjected to
earthquake excitations is the nonlinear time history analysis. In the response history analysis, the effect
of earthquake stimulation on a structure is considered more realistic than other dynamic analysis
methods. If seven or more pairs of ground motions are used for the response history analysis, the
average value of the response parameter of interest is permitted to be used for design. If fewer than
seven pairs of ground motions are used for analysis, the maximum value of the response parameter of
interest shall be used for design. In this study, fast nonlinear analysis (FNA) has been performed for
seismic assessment of the bridge. FNA is a nonlinear modal time history analysis method useful for the
static or dynamic evaluation of linear or nonlinear structural systems [25]. Because of its
computationally efficient formulation, FNA is well-suited for time history analysis, and often
recommended over direct-integration applications. This method is primarily linear elastic but has a
limited number of predefined nonlinear elements [26]. For this nonlinear modal analysis, all
nonlinearity is restricted to the Link elements. The efficiency of FNA method is largely due to the
separation of the nonlinear-object force vector RNL(t) from the elastic stiffness matrix and the damped
equations of motion, as seen in the fundamental equilibrium equation of FNA, expressed as Eq. (10):
(10)
Where M, C, and K are the mass matrix, damping matrix and stiffness matrix, respectively. Time-
dependent vectors of , , and are relative displacements, velocities, and accelerations. R(t)
is the external vector of applied loads. Furthermore, the Newton-Raphson iteration procedure
No. Earthquake Station Year Mw Mechanism Rrup (km)
Vs (m/sec)
PGA ( g )
L T V 1 Tabas Dayhook 1978 7.30 Reverse 13.90 471.53 0.324 0.41 0.19 2 El Centro El Centro Array 1940 6.95 Strike slip 6.09 213.44 0.28 0.21 0.17 3 Cape Mendocino Petrolia 1992 7.00 Reverse 8.20 422.17 0.59 0.66 0.16 4 Northridge Pacoima Kagel 1994 6.70 Reverse 7.20 508.08 0.301 0.43 0.17
5 Kobe Nishi-Akashi 1995 6.90 Strike slip 7.10 609.00 0.483 0.46 0.38 6 Chi Chi TCU084 1999 6.20 Reverse 9.30 665.20 0.139 0.06 0.05 7 San Simeon Cambria 2003 6.50 Reverse 7.20 362.42 0.206 0.15 0.08
164 A.A. EDALATI, H. TAHGHIGHI
consisting of corrective unbalanced forces is employed within each time step until equilibrium
condition is achieved.
6. RESULTS AND DISCUSSION
The purpose of this section is to investigate and compare the influence of the LRB and the ERB
isolators on the seismic responses of the Hesarak multi-span bridge. The period of vibrations, pier base
shear, the isolator's displacement and force, the displacement and bending moment of the piers, the
deck acceleration, and the amount of energy dissipations by the isolators have been considered.
CSIBridge computing platform is adopted to perform an eigenvalue analysis and nonlinear time history
analyses using seven pairs of ground motions in the longitudinal and transverse directions. The results
of different cases are extracted, compared, and discussed as follows.
The purpose of seismic isolation is the reduction of forces in the structure and the foundation. In
which, one of the solutions is to increase the vibration period of the structure. Increasing the vibration
period reduces the structural response according to the design spectrum, which has been investigated in
many studies as the effect of structural period transitions. However, increasing the period of the
structure reduces the lateral stiffness of the bridge that increases the lateral displacement of the
structure. As expected, the isolation system increases the period of the structure in comparison with the
non-isolated state. Table 6 indicates that the LRB isolator caused an increase of approximately 6.5
times the fundamental period of vibration for the first mode of the bridge compared to the non-isolated
bridge and increased about two times compared to the bridge with the ERB isolator.
Table 6. The fundamental period for the studied bridge (sec)
Using the LRB isolator, the pier base shear is sharply decreased both in longitudinal and transverse
directions in different earthquake motions, which causes less force to enter the bridge. The reasons for
reducing the base shear are the increase in the period and damping of the bridge, which Roy and Dash
[3] also refer to it. The intended damping was assumed to be 30% for the isolator of the bridge. The
bridge is also analyzed under the 15% damping. The results show that the decrease in damping causes
an increase in the pier base shear, the magnitude of increase under the El Centro record in the
longitudinal and transverse direction is 12% and 17%, respectively. Under the Cape Mendocino record,
With LRB isolator With ERB isolator Non-isolated 2.7 1.37 0.42
INVESTIGATING THE PERFORMANCE OF ISOLATION SYSTEMS IN IMPROVING THE SEISMIC... 165

it reaches 18.8% in the longitudinal direction and up to 13.2% in the transverse direction. Table 7 and
Fig. 9 show the maximum pier base shear force of the bridge with the ERB and the LRB isolators under
given ground motions. Also, the base shear time history results of the bridge due to the three
representative earthquake motions of Tabas, Northridge, and Kobe is shown in Fig. 10. It can be seen
that the rate of reduction of the base shear in the longitudinal and transverse direction is 80% under the
Tabas earthquake, for Northridge earthquake in the longitudinal direction is 82% and in the transverse
direction is 87%, and due to the Kobe earthquake in the longitudinal direction is about 75% and in the
transverse direction is about 60%. It can be concluded that the bridge response is earthquake-dependent
and varies in different earthquake motions.
Table 7. Maximum base shear force in the bridge (ton) Earthquake ERB isolator LRB isolator
Longitudinal direction
Tabas 3127.00 583.20 El Centro 3345.00 790.63 Cape Mendocino 3522.50 1293.9 Northridge 3770.75 655.25 Kobe 2085.06 528.15 Chi Chi 3028.20 592/00 San Simeon 1919.60 769.78
Transverse direction
Tabas 2381.62 475.63 El Centro 2105.50 710.62 Cape Mendocino 3087.00 1121.0 Northridge 3377.45 413.74 Kobe 1133.40 462.93 Chi Chi 2650.00 557.00 San Simeon 1334.00 738.03
Figure 9. The maximum base shear for the bridge with LRB and ERB due to the given earthquake motions.
0500
1000150020002500300035004000
ERB (X) LRB (X) ERB (Y) LRB (Y)
Base
shea
r (to
n)
166 A.A. EDALATI, H. TAHGHIGHI

(a)
(b)
Figure 10. Base shear time history of the bridge due to the three representative earthquake motions: a) Longitudinal direction, and b) Transverse direction.
According to numerical analyses, the LRB isolator reduces the maximum pier bending moment. For
instance, the analysis results of the middle pier P4 under various earthquakes are shown in Table 8. As
seen, the pier bending moment using the LRB isolator is significantly reduced. For example, this
reduction for the Northridge earthquake is 91.5% in the transverse direction and 73.4% in the
longitudinal direction. Table 9 presents the pier head relative displacement of P4 column in the
longitudinal direction of the bridge. Also, Fig. 11 shows the displacement time history of the middle-
end P4 pier head under the three representative earthquake ground motions. As shown, the LRB
isolator reduces the pier head displacement against the ERB isolator. Generally, the displacement
reduction depends on the earthquake ground motion. According to Table 9, the maximum pier head
relative displacement of the bridge reaches: for ERB 28 cm and for LRB 0.3 cm under the El Centro
earthquake. It is noted that when bridges are subjected to near-field ground motions, they do not often
return to their initial vertical positions and may have considerable residual displacement [27]. In a
similar way, Fig. 11 indicates the residual displacement of the bridge model.
-4000-3000-2000-1000
0100020003000
0 2 4 6 8 10 12 14 16 18 20
Base
She
ar (t
on)
Time (sec)
longitidunal LRBERBTabas, x
-6000-4000-2000
0200040006000
0 20 40 60
Base
She
ar (t
on)
Time (sec)
LRBERB
Northridge, x
-1500-1000
-5000
50010001500
0 20 40 60
Base
She
ar (t
on)
Time (sec)
LRBERB
Kobe, x
-3000-2000-1000
0100020003000
0 2 4 6 8 10 12 14 16 18 20
Base
She
ar (t
on)
Time (Sec)
transvers LRBERBTabas, y
-4000
-2000
0
2000
4000
0 20 40 60
Base
She
ar (t
on)
Time (sec)
LRBERB
Northridge, y
-1500-1000-500
0500
10001500
0 20 40 60
Base
She
ar (t
on)
Time (sec)
LRBERB
Kobe, y
INVESTIGATING THE PERFORMANCE OF ISOLATION SYSTEMS IN IMPROVING THE SEISMIC... 167

Table 8. Reduction of maximum bending moment of P4 column by LRB isolator (ton.m)
Table 9. Comparison of P4 pier head relative displacement with ERB and LRB isolator (mm)
(a) (b) (c)
Figure 11. P4 pier head displacement time history of the bridge due to the three representative earthquake motions: a) Tabas, b) Northridge, and c) Kobe.
The maximum absolute deck acceleration of the bridge is shown under given earthquake motions for
the ERB and the LRB isolators in Table 10 and Fig. 12. As seen, the advantage of using an LRB
isolator is to reduce the acceleration to the deck. As indicated before, the results are corresponding to
the isolator with damping ratio ζ=30%. However, the deck acceleration will increase in the case of 15%
damping ratio. For example, the maximum deck acceleration of the bridge under the Cape Mendocino
earthquake motion for ζ=15% is 1.8 m/sec2, which shows a 28% increase compared to an isolator with
-10
-5
0
5
10
0 5 10 15 20 25Disp
lace
men
t (c
m)
Time (sec)
LRBERB
-15-10-505
1015
0 10 20 30 40 50
Disp
lace
men
t (c
m)
Time (sec)
LRBERB
-60
-40
-20
0
20
40
0 10 20 30 40 50
Disp
lace
men
t (m
m)
Time (sec)
LRBERB
Earthquake ERB isolator LRB isolator Bending moment reduction
Longitudinal direction
Tabas 2064.00 568.17 72.50% El Centro 2230.00 663.41 70.20% Cape Mendocino 2399.00 913.34 62.00% Northridge 2500.00 666.00 73.36% Kobe 1385.00 509.50 63.20% Chi Chi 3625.00 548.64 85.00% San Simeon 1291.00 641.00 50.00%
Transverse direction
Tabas 4427.00 555.00 87.50% El Centro 4322.80 1184.40 72.60% Cape Mendocino 5157.63 1645.50 68.10% Northridge 6146.20 527.16 91.50% Kobe 2168.70 818.00 62.00% Chi Chi 2021.00 897.32 55.60% San Simeon 2622.50 1049.00 60.00%
Earthquake ERB isolator LRB isolator Displacement reduction Tabas 8.17 2.25 72.50% El Centro 277.50 2.82 99.30% Cape Mendocino 9.50 3.60 62.00% Northridge 10.00 0.97 90.00% Kobe 41.60 2.018 95.00% Chi Chi 8.00 2.17 72.80% San Simeon 5.11 2.50 51.00%
168 A.A. EDALATI, H. TAHGHIGHI

30% damping ratio. Similarly to Vatanshenas et al. [11], the reason for the differences between the
deck accelerations is the frequency content of the selected earthquake ground motions. Furthermore,
Fig. 13 shows the deck acceleration time histories due to the three representative Tabas, Northridge,
and Kobe earthquake ground motions in both longitudinal and transverse directions.
Table 10. The maximum absolute deck acceleration of the bridge (m/sec2)
Figure 12. The deck acceleration of the bridge with the LRB and ERB due to the given earthquake motions.
0
2
4
6
8
Abs
Acc
el(m
/s2 )
ERB (x) LRB(x ) ERB (y ) LRB (y )
Earthquake ERB isolator LRB isolator
Longitudinal direction
Tabas 4.10 0.67 El Centro 4.38 1.08 Cape Mendocino 4.69 1.40 Northridge 4.86 0.81 Kobe 2.65 0.68 Chi Chi 4.10 0.92 San Simeon 2.62 0.99
Transverse direction
Tabas 4.80 1.36 El Centro 5.29 2.14 Cape Mendocino 7.72 2.25 Northridge 6.70 0.95 Kobe 3.03 1.06 Chi Chi 6.75 0.07 San Simeon 3.40 1.60
INVESTIGATING THE PERFORMANCE OF ISOLATION SYSTEMS IN IMPROVING THE SEISMIC... 169

(a)
(b)
Figure 13. The deck acceleration time history of the bridge due to the three representative earthquake motions: a) Longitudinal direction, and b) Transverse direction.
As shown in Fig. 14, the LRB isolator reduces the input energy of the structure and wastes a high
percentage of earthquake input energy, which shows the high separation efficiency. Mendez et al. [10]
demonstrate high energy dissipation by the LRB isolator. For the bridge with the ERB isolator, there is
no hysterical energy loss due to the lack of the damping and the input energy of the earthquake is
dissipated intrinsically. By carefully plotting energy charts and acceleration charts, energy dissipation
starts after the maximum acceleration is reached. As shown in Table 11, the maximum amount of
earthquake input energy reduction by the LRB isolator is considered to be El Centro earthquake
motion, which is 98.5%. The LRB isolator increases the energy dissipation that varies in different
earthquakes. However, the isolator of ERB, because of the hysteresis damping, amortize the input
energy as inherent damping, which increases the displacement of the ERB isolator to amortize energy,
which, in the case of severe earthquakes, does not have the expected performance. The LRB isolator
has high energy absorption due to hysterical damping due to the leakage of the lead core and its
performance under earthquake motions is well proven.
-6-4-20246
0 5 10 15 20 25
Abs
Acc
el (m
/s2 )
Time (sec)
longitidunal LRBERBTabas, x
-6-4-20246
0 10 20 30 40 50A
bs A
ccel
(m/s2 )
Time (sec)
LRBERBNorthridge, x
-4
-2
0
2
4
0 10 20 30 40 50
Abs
Acc
el (m
/s2 )
Time (sec)
LRBERBKobe, x
-6-4-20246
0 5 10 15 20 25
Abs
Acc
el (m
/s2 )
Time (sec)
transvers LRBERBTabas, y
-8-6-4-202468
0 10 20 30 40 50
Abs
Acc
el(m
/s2 )
Time (sec)
LRBERBNorthridge, y
-4
-2
0
2
4
0 10 20 30 40 50
Abs
Acc
el (m
/s2 )
Time (sec)
LRBERBKobe, y
170 A.A. EDALATI, H. TAHGHIGHI

(a) (b) (C)
Figure 14. Input and dissipation energy diagrams of the bridge due to the three representative earthquake motions: a) Tabas, b) Northridge, and c) Kobe.
Table 11. The energy dissipation by the LRB isolator (ton.m)
The hysteresis diagram describes the behavior of the member under earthquake reciprocating loads,
which is shown as a load-displacement diagram. If the produced curve has symmetry, it shows the
structural behavior is uniform against earthquake. The next feature of the hysteresis loop is the surface
area enclosed by the curve, the more the surface area, the greater the energy absorbed by the structure,
indicating that the structure is more ductile. Another feature is the number of hysteresis curve cycles,
the higher the number of cycles, the later representing the deterioration of the member. Thus, regarding
the characteristics of the hysteresis diagram, we can refer to three factors: the number of cycles, the
area enclosed by the loop, and the symmetry. According to Fig. 15, the designed LRB has a slender
diagram and fewer cycles under the Northridge, Cape Mendocino, and Tabas earthquakes, which
represents less damping, thus resulting in less energy absorption and early isolation failure. However,
the LRB isolator performance is more suitable for other earthquake motions because their hysteresis
loops are stable and have a more area enclosed by the load-displacement diagram. Fig. 16 shows, for
instance, the shear force-deformation curve of the ERB due to the Cape Mendocino earthquake motion
that does not fit the condition of an appropriate hysteresis loop.
0
10
20
30
40
0 5 10 15 20 25
En
ergy
(to
n.m
)
Time (sec)
input energyenergy dissipation
0
50
100
150
0 20 40 60E
ner
gy (
ton
.m)
Time (sec)
input energyenergy dissipation
0
50
100
150
200
0 20 40 60
En
ergy
(to
n.m
)
Time (sec)
input energyenergy dissipation
Earthquake Input energy (ton.m)
Output energy (ton.m)
Energy reduction
Tabas 31.45 26.80 85.00% El Centro 1141 1124 98.50% Cape Mendocino 728.0 671.0 92.00% Northridge 47.50 21.50 45.26% Kobe 165.7 157.0 94.70% Chi Chi 377.0 356.0 94.50% San Simeon 361.0 350.0 97.00%
INVESTIGATING THE PERFORMANCE OF ISOLATION SYSTEMS IN IMPROVING THE SEISMIC... 171

Figure 15. Hysteresis loop for the LRB isolator subjected to the given earthquake motions.
. Figure 16. Force-displacement curve for the ERB due to the Cape Mendocino earthquake motion.
7. CONCLUDING REMARKS
In this paper, the effects of LRB isolation system on improving the seismic behavior of a multi-span
pre-stressed bridge was evaluated and compared with the case of the existing ERB isolator. A 3D FEM
of the isolated bridge was developed in CSIBridge. Based on the results of the analyses, the specific
conclusions are as follows:
1. The use of an LRB isolator instead of the ERB increased the fundamental period of the bridge by a
factor of 2.
2. The base shear of the bridge using the LRB isolator is significantly reduced compared to the ERB.
The reduction reached 82.6% and 87.75% in the longitudinal and transverse directions, respectively.
3. The LRB isolator reduced the bending moment by up to 85% compared to the ERB.
4. The absolute deck acceleration of the bridge was significantly reduced using the LRB so that the
amount of this reduction is up to 70%.
-100
-50
0
50
100
-40 -20 0 20 40
Shea
r F
orce
(ton
)
Displacement (cm)
Cape Mendocino
-100
-50
0
50
100
-10 -5 0 5 10
Shea
r Fo
rce
(ton
)
Displacement (cm)
Chi Chi
-40
-20
0
20
40
-4 -2 0 2 4
Shea
r Fo
rce
(ton
)
Displacement (cm)
Northridge
-60-40-20
0204060
-15 -10 -5 0 5 10 15
Shea
r Fo
rce
(ton
)
Displacement (cm)
Kobe
-40
-20
0
20
40
-4 -2 0 2 4 6
Shea
r Fo
rce
(ton
)
Displacement (cm)
tabas
-60-40-20
02040
-30 -20 -10 0 10Shea
r Fo
rce
(ton
)
Displacement (cm)
San simeon
-40-20
02040
-10 -5 0 5 10Sh
ear
Forc
e (t
on)
Displacement (cm)
El centro
-20-10
01020
-400 -200 0 200 400Shea
r F
orce
(to
n)
Displacement (cm)
Cape Mendocino
172 A.A. EDALATI, H. TAHGHIGHI

5. The performance of the LRB isolator was significant in terms of energy dissipation capacity, the
input energy reduced up to 94% when LRB system was applied.
6. The LRB performance is suitable for reducing the pier head displacement so that the reduction is up
to 62%.
Therefore, one of the main alternatives for the seismic improvement of the Hesarak Bridge is the
replacement of the existing ERB isolators with the LRB. It must be noted that the response is ground
motion sensitive; hence designers should use a sufficient number of seismic records to carry out the
analysis for design.
ACKNOWLEDGEMENTS
The structural and geotechnical data of the Hesarak Bridge provided by the municipality of Karaj
city, Iran is gratefully acknowledged. We also thank the anonymous reviewers for their helpful
comments on the improvement of the manuscript.
REFERENCES
1. Mason, S.E. "Seismic Isolation-The Gold Standard of Seismic Protection", Structure Magazine, California, pp. 11-14 (2015).
2. Robinson, W.H. "Lead-Rubber Hystertic Bearing Suitable for Protecting Structures During Earthquakes", Earthquake Engineering and Structural Dynamics, Vol. 10, No. 4, pp. 593-604 (1982).
3. Roy, S.S., Dash, S.R. "Dynamic Behavior of the Multi Span Continuous Girder Bridge with Isolation Bearings", International Journal of Bridge Engineering (IJBE), Vol. 6, No. 2, pp. 01-23 (2018).
4. Code No. 523 "Guideline for Design and Practice of Base Isolation Systems in Buildings," Vice Presidency for Strategic Planning and Supervision, Tehran, Iran (2010).
5. Naiem, F., Kelly, J.M. "Design of Seismic Isolated Structures: From Theory to Practice," John Wiley and Sons, Inc. New York, USA (1999).
6. Turkington, D. H., Carr, A. J., Cooke, N., and Moss, P. J. "Seismic Design of Bridges on Lead-Rubber Bearings," Journal of Structural Engineering, ASCE, Vol. 115, No. 12 pp. 3000-3016 (1989).
7. Zahraei, M., Sami, H. "Seismic Performance Evaluation of Bridges with Existing Expansion Bearings," Journal of Transportation Research, Vol. 5, No. 4, pp. 319-331 (2009).
8. Asif, H., Min-Se K., Thang Dai, D., and Jin-Hoon J. "Effect of Lead Rubber Bearing Characteristics on the Response of Seismic-Isolated Bridges", KSCE Journal of Civil Engineering, Vol. 12, No. 3, pp. 187-196 (2008).
9. Tubaldi, E., Mitoulis, S., Ahmadi, A., Muh, H. A. "A parametric study on the axial behavior of elastomeric isolators in multi-span Bridges subjected to horizontal seismic excitations", Bull Earthquake Eng, Vol. 14, No. 4, pp. 1285-1310 (2016).
INVESTIGATING THE PERFORMANCE OF ISOLATION SYSTEMS IN IMPROVING THE SEISMIC... 173

10. Mendez Galindo, C., Spuler, T., Moor, G., Stirnimann, F. "Design, Full-scale Testing, and CE Certification of Anti-Seismic Devices According to the New European Standard EN 15129: Elastomeric Isolators", 15th World Conference on Earthquake Engineering, Lisbon, Portugal (2012)
11. Vatanshen, A., Sharif Bajestany, D., Aghelfard, A. "The Effect of Seismic Isolation on the Response of Bridges," International Journal of Bridge Engineering (IJBE), Vol. 6, No. 3, pp. 61-74 (2018).
12. Park, K. S., Jung, J. H., Lee, L.W. "A comparative study of A seismic performances of base isolation systems for multi-span continuous bridge", Engineering Structures, Vol. 24, No. 8, pp. 1001-1013 (2002).
13. Chauhan, K.M., Shah, B.J. "Excel spreadsheet for Design of Lead Rubber Bearings for Seismic Isolation of Bridge", International Journal of Advanced Engineering Research and Studies, Vol. 2, No. 3, pp. 60-62 (2013).
14. Edalati A.A. “Investigating the performance of seismic isolation systems in improving the behavior of urban bridges under Earthquake (A case study on the Hesarak Bridge),” MSc Thesis, University of Kashan, Iran (2019).
15. http: //www.google. Earth /.html
16. Municipality of Karaj "Report of the studies of Hesarak Bridge," University of Science and Technology, Tehran, Iran (2015) (in Persian).
17. BHRC. "Iranian code of practice for seismic resistant design of buildings (Standard No. 2800)," 4th Edition, Building and Housing Research Center, Tehran, Iran (2014).
18. Tahghighi, H. "Simulation of Strong Ground Motion using the Stochastic Method: Application and Validation for Near-Fault Region," Journal of Earthquake Engineering, Vol. 16, pp. 1230-1247 (2012).
19. Tahghighi, H., Rabiee, M. “Influence of Foundation Flexibility on the Seismic Response of Low-to-Mid-Rise Moment Resisting Frame Buildings,” International Journal of Science and Technology, SCIENTIA IRANICA, A, Vol. 24, No. 3, pp. 979-992 (2017).
20. CSIBridge "Intagrate Finite Element Analysis and Design of Bridges," User manual, Ver. 19.2, Berkley, California, USA (2017).
21. AASHTO "Guide Specifications for Seismic Isolation Design," 4th Ed., American Association of State Highway and Transportation Officials, Washington DC, USA (2014).
22. Park, Y. J., Reinhorn, A. M., Kunnath, S. K. ‘‘IDARC: Inelastic damage analysis of reinforced concrete frame-shear-wall structures,’’ Tech. Rep. NCEER-87-0008, State University of New York at Buffalo, Buffalo, NY, USA (1987).
23. PEER. "Pacific Earthquake Engineering Research center strong motion database," http://peer. berkeley.edu (2018).
24. ASCE. "Minimum Design Loads for Buildings and Other Structures (ASCE/SEI 7-10)," American Society of Civil Engineers/Structural Engineering Institute, Reston, VA, USA (2010).
25. https://wiki.csiamerica.com
26. Lee, H.H., Hur, M.W., Jiang, H., You, Y.C., Kim, K.H. "Evaluation of Dynamic Characteristics of Base Isolated Residential Building," 14th World Conference on Earthquake Engineering, Beijing, China (2008).
27. Ansari, M., Daneshjoo, F., Soltani, M. “A New Combinational Force-Displacement Hysteresis Model Presented to Estimate Seismic Residual Displacement in Single-Column Concrete Bridges,” Journal of Transportation Engineering, Vol. 7, No. 2, pp. 223-236 (2015).
174 A.A. EDALATI, H. TAHGHIGHI

LIST OF TABLES AND FIGURES Table 1. Specifications of the bridge
Table 2. ERB isolator specifications used in the bridge
Table 3. Material properties of rubber used in LRB design
Table 4. LRB isolator specifications
Table 5. Specifications of the accelerograms used in the analysis [23]
Table 6. The fundamental period for the studied bridge (sec)
Table 7. Maximum base shear force in the bridge (ton)
Table 8. Reduction of maximum bending moment of P4 column by LRB isolator (ton.m)
Table 9. Comparison of P4 pier head relative displacement with ERB and LRB isolator (mm)
Table 10. The maximum absolute deck acceleration of the bridge (m/sec2)
Table 11. The energy dissipation by the LRB isolator (ton.m)
Figure 1. Aerial photo of the Hesarak Bridge [15].
Figure 2. General view of the Hesarak Bridge.
Figure 3. Cross-section through the deck of Hesarak Bridge (uint in cm) [16].
Figure 4. Details of the Hesarak Bridge (uint in cm): a) Abutment, and b) Pier section [16].
Figure 5. Longitudinal profile of the bridge [16].
Figure 6. 3D finite element model of the bridge.
Figure 7. LRB isolator system (after [13]).
Figure 8. Force-displacement model for LRB: a) Shear behavior, and b) Axial behavior.
Figure 9. The maximum base shear for the bridge with LRB and ERB due to the given earthquake motions.
Figure 10. Base shear time history of the bridge due to the three representative earthquake motions: a)
Longitudinal direction, and b) Transverse direction.
Figure 11. P4 pier head displacement time history of the bridge due to the three representative earthquake
motions: a) Tabas, b) Northridge, and c) Kobe.
Figure 12. The deck acceleration of the bridge with the LRB and ERB due to the given earthquake motions.
Figure 13. The deck acceleration time history of the bridge due to the three representative earthquake motions: a)
Longitudinal direction, and b) Transverse direction.
Figure 14. Input and dissipation energy diagrams of the bridge due to the three representative earthquake
motions: a) Tabas, b) Northridge, and c) Kobe.
Figure 15. Hysteresis loop for the LRB isolator subjected to the given earthquake motions.
Figure 16. Force-displacement curve for the ERB due to the Cape Mendocino earthquake motion.
Received 30.06.2019, Revised 15.09.2019
INVESTIGATING THE PERFORMANCE OF ISOLATION SYSTEMS IN IMPROVING THE SEISMIC... 175