Title: Diamondoid naphthenic acids cause in vivo genetic ...

University of Calgary
PRISM: University of Calgary's Digital Repository
Graduate Studies The Vault: Electronic Theses and Dissertations
2020-05-12
Investigating the Genetics and Physiology of
Naphthenic Acid Remediation in Plants
Wong, Jeremy Jordon
Wong, J. J. (2020). Investigating the Genetics and Physiology of Naphthenic Acid Remediation in
Plants (Unpublished master's thesis). University of Calgary, Calgary, AB.
http://hdl.handle.net/1880/112053
master thesis
University of Calgary graduate students retain copyright ownership and moral rights for their
thesis. You may use this material in any way that is permitted by the Copyright Act or through
licensing that has been assigned to the document. For uses that are not allowable under
copyright legislation or licensing, you are required to seek permission.
Downloaded from PRISM: https://prism.ucalgary.ca

UNIVERSITY OF CALGARY
Investigating the Genetics and Physiology of Naphthenic Acid Remediation in Plants
by
Jeremy Jordon Wong
A THESIS
SUBMITTED TO THE FACULTY OF GRADUATE STUDIES
IN PARTIAL FULFILMENT OF THE REQUIREMENTS FOR THE
DEGREE OF MASTER OF SCIENCE
GRADUATE PROGRAM IN BIOLOGICAL SCIENCES
CALGARY, ALBERTA
MAY, 2020
© Jeremy Jordon Wong 2020

ii
Abstract
Surface mining of bitumen in the Northern Alberta oil sands produces large volumes of oil sands
process-affected water (OSPW). OSPW is toxic to many living organisms, and this toxicity is
primarily attributed to a class of organic compounds collectively known as naphthenic acids
(NAs). Remediation of NAs is required to meet future water release criteria. This thesis research
was aimed at identifying plant genes that are involved in NA tolerance using a novel genetic
screen, as well as providing insights into the physiological capacity of plants to take up and
possibly biotransform NAs. Six NA tolerant mutants were identified, and the altered region of
the genome was identified for four of the mutants. Experiments using labeled NAs were carried
out on a native grass species to determine NA uptake efficiency and distribution in roots and
shoots. This research provides a framework for identifying NA tolerance genes and quantifying
the uptake and biotransformation of NAs in plants.

iii
Acknowledgements
I would like to thank my supervisor, Dr. Douglas Muench, for his endless support in
supervising me as both an undergraduate and a graduate student. He provided me with a great
opportunity to pursue interesting research. He was always there to teach, guide and encourage
me throughout these past five years. Thanks to my committee member, Dr. Marcus Samuel for
allowing me to get my initial exposure to research, as well as guiding my graduate research.
Thanks to my committee member, Dr. Raymond Turner, for sharing his fresh insights regarding
my research direction. I would also like to thank Dr. Ed Yeung for advising me throughout my
undergraduate and graduate programs. Thank you to my external examiner, Dr. David Bird, for
taking the time to be part of my examination committee.
Thanks to all of the members of the Muench lab I have had the pleasure of working with
these past years. In particular, thanks to Mitchell Alberts for sharing his vast knowledge of this
project. His direct contributions that made this thesis possible and he was always there to talk
about anything. I would like to thank Steven Olsen for being so welcoming and having the
patience to introduce to me to the project, and Dr. Gillian Dean for her help in guiding my
undergraduate research. Thanks Dilini, Chris, Xin, Chi, Johanna, Jacob, Adam and Sylvia. I
couldn’t have asked for better lab mates.
Thanks to Abhi, Siyu, Logan, Joseph, Connor, Matija, Neil, Amy, Sabine and Jamshed
for the countless times you have all helped me throughout these years.
I would like to thank my parents, Edie and Augustine, and my brother, Christopher, for
all of their support. Lastly, thank you Belinda for always being there for me. You always knew
how to brighten my day when it got challenging and I couldn’t have done it without you.

iv
Table of Contents
Abstract ............................................................................................................................... ii
Acknowledgements ............................................................................................................ iii
Table of Contents ............................................................................................................... iv
List of Tables ..................................................................................................................... vi
List of Figures and Illustrations ........................................................................................ vii
List of Symbols, Abbreviations and Nomenclature ........................................................... ix
CHAPTER ONE: INTRODUCTION ..................................................................................1
1.1 The Northern Alberta Oil Sands ................................................................................1
1.2 Oil sands process-affected water ...............................................................................2
1.2.1 The composition of OSPW ................................................................................2
1.2.2 Toxicity of OSPW and naphthenic acids...........................................................4
1.3 Conventional non-biological NA remediation approaches ........................................7
1.4 Phytoremediation .......................................................................................................8
1.4.1 Benefits to phytoremediation ............................................................................8
1.4.2 Phytoextraction ..................................................................................................8
1.4.3 Phytodegradation/Rhizodegradation .................................................................9
1.4.4 Phytostabilization ............................................................................................11
1.4.5 Phytovolatilization ...........................................................................................11
1.4.6 Rhizofiltration/Phytofiltration .........................................................................12
1.5 Bioremediation approaches to NA degradation .......................................................13
1.5.1 Microbial and algal NA remediation ...............................................................13
1.5.2 Plant-mediated degradation .............................................................................14
1.6 Species under research .............................................................................................15
1.6.1 Arabidopsis ......................................................................................................15
1.6.2 Elymus trachycaulus ........................................................................................16
1.7 Hypothesis and objectives .......................................................................................17
CHAPTER TWO: MATERIALS AND METHODS ........................................................18
2.1 Plant material ...........................................................................................................18
2.1.1 Arabidopsis and slender wheatgrass ................................................................18
2.2 Arabidopsis genetic screen ......................................................................................18
2.2.1 NA and herbicide resistance growth plates .....................................................18
2.2.2 Genetic screen .................................................................................................19
2.3 DNA extraction methods .........................................................................................20
2.4 TAIL-PCR ...............................................................................................................22
2.5 Targeted gene sequencing for T-DNA insertion analysis ........................................26
2.6 Gene expression studies using Reverse Transcription Quantitative PCR ...............28
2.6.1 RNA extraction ................................................................................................28
2.6.2 cDNA synthesis ...............................................................................................28
2.6.3 RT-qPCR .........................................................................................................29
2.7 Sterile plant growth methodology ............................................................................31
2.7.1 Streptomycin agar plates and Falcon tube preparation ....................................31
2.7.2 Growth of sterile wheatgrass ...........................................................................31
2.7.3 Plant sterility testing using YES, TSA and LB plates .....................................33

v
2.7.4 Radiolabeled 14C-NA uptake..........................................................................33
CHAPTER THREE: CHARACTERIZATION OF NAPHTHENIC ACID TOLERANT
ARABIDOPSIS ACTIVATION-TAGGED MUTANTS.........................................36
3.1 Introduction ..............................................................................................................36
3.2 Results ......................................................................................................................39
3.2.1 Screen summary and characterization of the selected NA tolerant Arabidopsis
lines ..................................................................................................................39
3.2.2 PCR genotyping using genomic DNA ............................................................44
3.2.3 Characterization of the T-DNA insertion sites using TAIL-PCR ...................46
3.2.4 Characterization of mutants using targeted gene sequencing ..........................49
3.2.5 Reverse-Transcription Quantitative PCR analysis to determine gene expression
levels of genes flanking the T-DNA insertions................................................65
3.3 Discussion ................................................................................................................71
CHAPTER FOUR: VISUALIZATION OF RADIOACTIVELY LABELLED NA UPTAKE
IN SLENDER WHEATGRASS (ELYMUS TRACHYCAULUS) .............................77
4.1 Introduction ..............................................................................................................77
4.2 Results ......................................................................................................................78
4.2.1 Radioactive NAs used in these experiments ...................................................78
4.2.2 Generation of microbe-free slender wheatgrass seedlings ..............................79
4.2.3 Visualization of NA uptake in slender wheatgrass ..........................................81
4.2.4 Semi-quantitative analysis of NA uptake in slender wheatgrass .....................84
4.3 Discussion ................................................................................................................87
4.3.1 Acknowledgement ...........................................................................................91
CHAPTER FIVE: DISCUSSION AND FUTURE DIRECTIONS ...................................92
5.1 Overall synopsis of the research ..............................................................................92
5.2 Future Directions .....................................................................................................94
5.2.1 Mutant identification and the molecular mechanisms responsible for mutant NA
tolerance ...........................................................................................................94
5.2.2 Radioactive NA studies ...................................................................................95
REFERENCES ..................................................................................................................98
APPENDIX ......................................................................................................................111

vi
List of Tables
Table 2.1: Primers used in TAIL-PCR and heritability analysis. ................................................. 24
Table 2.2: Single Reaction for Primary TAIL-PCR ..................................................................... 25
Table 2.3: Single Reaction for Secondary TAIL-PCR ................................................................. 25
Table 2.4: Single Reaction for Tertiary TAIL-PCR ..................................................................... 25
Table 2.5: Primers used for RT-qPCR .......................................................................................... 30
Table 2.6: Half-strength Hoagland solution.................................................................................. 34
Table 3.1: Percent growth on AdCA and DH2NA of lines that passed the secondary screen ...... 41
Table 3.2: Percentage of seeds demonstrating strong growth phenotypes on NA, Basta and
0.5X MS agar plates. ............................................................................................................. 43
Table 3.3: Percentage of seeds demonstrating strong growth phenotypes on Basta and 0.5X
MS agar plates. ...................................................................................................................... 45
Table 3.4: Summary of the Basta PCR results and comparison to Basta assay. ........................... 48
Table 3.5: Primers used to estimate the location of the T-DNA truncation in CS23152 A2-1. ... 61
Table 3.6: Primers used in targeted gene sequencing to determine T-DNA insertion sites. ........ 62
Table 3.7: Summary of targeted gene sequencing data obtained from CS23152 A2-1 to
determine truncation site. ...................................................................................................... 64
Table 3.8: Summary of targeted gene sequencing data obtained from CS31166 A1-1 to
determine truncation site. ...................................................................................................... 64
Table 3.9: Summary of the T-DNA Insertion sites in NA tolerant Arabidopsis .......................... 66

vii
List of Figures and Illustrations
Figure 1.1: Examples of classical naphthenic acids........................................................................ 3
Figure 1.2: Distribution of NAs obtained from an OSPW sample. ................................................ 4
Figure 2.1: The pSKI015 vector used to generate libraries of activation-tagged lines of
Arabidopsis. .......................................................................................................................... 19
Figure 2.2: Overview of the activation-tag genetic screen procedure. ......................................... 21
Figure 2.3: Diagram illustrating TAIL-PCR. ................................................................................ 24
Figure 2.4: Diagram illustrating the targeted gene sequencing workflow to determine the T-
DNA insertion sites in selected mutant Arabidopsis lines. ................................................... 27
Figure 2.5: Schematic diagram of slender wheatgrass growth in sterile hydroponic NA uptake
experiments. .......................................................................................................................... 32
Figure 3.1: Structures of AdCA and DH2NA. .............................................................................. 38
Figure 3.2: Example of positive primary screen and secondary screens. ..................................... 40
Figure 3.3: CTAB DNA preparations carried out on 20 seedlings for each listed mutant. .......... 47
Figure 3.4: Confirmation of the presence of the Basta marker in the genomic DNA of
progeny from mutants using PCR. ........................................................................................ 48
Figure 3.5: TAIL-PCR reactions for CS23838 D1. ...................................................................... 50
Figure 3.6: Sequence of the T-DNA insertion site in the GL-2 gene intron in line CS23838
D1-3. ..................................................................................................................................... 51
Figure 3.7: Unknown TAIL-PCR products. ................................................................................. 52
Figure 3.8: CS23838 D1-3 T-DNA insertion locus determined using targeted gene
sequencing. ............................................................................................................................ 54
Figure 3.9: CS23152 A1-6 T-DNA insertion locus determined using targeted gene
sequencing. ............................................................................................................................ 55
Figure 3.10: The first of three T-DNA insertion loci in CS23127 A1-2 determined using
targeted gene sequencing. ..................................................................................................... 56
Figure 3.11: The second of three T-DNA insertion loci in CS23127 A1-2 determined using
targeted gene sequencing. ..................................................................................................... 57
Figure 3.12: The third of three T-DNA insertion loci in CS23127 A1-2 determined using
targeted gene sequencing. ..................................................................................................... 58

viii
Figure 3.13: CS23120 A3-4 T-DNA insertion locus determined using targeted gene
sequencing. ............................................................................................................................ 59
Figure 3.14: Determining the approximate location of the truncation in CS23152 A2-1. ........... 61
Figure 3.15: Map of the primers used in targeted gene sequencing to determine the truncation
site of the T-DNA in CS23152 A2-1. ................................................................................... 63
Figure 3.16: Map of the primers used in targeted gene sequencing to determine the truncation
site of the T-DNA in CS31166 A1-1. ................................................................................... 63
Figure 3.17: Schematic summary of T-DNA insertion sites in genomic DNA of NA-tolerant
mutants. ................................................................................................................................. 67
Figure 3.18: RT-qPCR analysis of genes flanking the T-DNA insertion in mutant CS23127
A1-2 ...................................................................................................................................... 69
Figure 3.19: RT-qPCR analysis of genes flanking the T-DNA insertion in mutant CS23152
A1-20-3. ................................................................................................................................ 70
Figure 3.20: RT-qPCR analysis of genes flanking the T-DNA insertion in CS23152 A1-20-3. . 71
Figure 4.1: Structures of the five NAs used in the wheatgrass uptake experiments. .................... 79
Figure 4.2: Verification of seed extract sterility using TSA and YES plates. ............................. 80
Figure 4.3: Verification of seed extract sterility using LB plates. ............................................... 81
Figure 4.4: Phosphor images depicting the uptake of 14C-HA and 14C-DA by slender
wheatgrass. ............................................................................................................................ 82
Figure 4.5: Phosphor image depicting the uptake of CPCA, CHCA and AdCA in slender
wheatgrass. ............................................................................................................................ 83
Figure 4.6: Distribution of total radioactive counts in slender wheatgrass roots, shoots and
nutrient solution. ................................................................................................................... 85
Figure 4.7: Percentage of radioisotope remaining with and without wheatgrass in the sample
tubes. ..................................................................................................................................... 86
Figure 4.8: Mean translocation factor of radiolabeled NA uptake in sterile slender
wheatgrass. ............................................................................................................................ 87

ix
List of Symbols, Abbreviations and Nomenclature
Symbol Definition
ABC ATP-Binding Cassette
AdCA 1-Adamantanecarboxylic acid
AD Arbitrary Degenerate
AEO Acid-Extractable Organic
AOP Advanced Oxidation Process
APRR2 Pseudo-Response Regulator 2
BTEX Benzene, Toluene, Ethyl Benzene, Xylene
CaMV Cauliflower Mosaic Virus
CHCA Cyclohexanecarboxylic Acid
CHWE Clark Hot Water Extraction
CML9 Calmodulin-like Protein 9
Col-2 Columbia-2
Col-7 Columbia-7
CPCA Cyclopentanecarboxylic Acid
CYP Cytochrome P450
DA Decanoic Acid
DH2NA Decadro-2-naphthoic acid
DMSO Dimethyl Sulfoxide
dNTP Deoxynucleoside triphosphate
EDTA Ethylenediaminetetraacetic acid
ESI Electrospray Ionization
FTICR-MS Fourier Transform Ion Cyclotron Resonance Mass Spectrometry
GST Glutathione S-Transferase
HA Hexanoic Acid
HIPP25 Heavy Metal Associated Isoprenylated Plant Protein 25
HMA Heavy-Metal Binding Domain
LB Left Border
LC50 Lethal Concentration
LUH Leunig Homolog
MES 2-(N-morpholino)ethanesulfonic acid
M-MLV RT Moloney Murine Leukemia Virus Reverse Transcriptase
MS Murashige and Skoog
NA Naphthenic Acid
NaOH Sodium Hydroxide
NO3- Nitrate
OSPW Oil Sands Process-Affected Water
PAH Polycyclic Aromatic Hydrocarbon
PHC Petroleum Hydrocarbon
pKa Acid Dissociation Constant
PMEI6 Pectin Methylesterase Inhibitor 6
RT-qPCR Reverse-Transcription Quantitative PCR
RB Right Border

x
RDX Hexahydro-1,3,5-trinitro-1,3,5-triazine
SAGD Steam Assisted Gravity Drainage
SAM S-adenosyl-L-methionine-dependent methyltransferases protein
SRPB S-ribonuclease binding protein family protein
TAIL-PCR Thermal Asymmetric Interlaced PCR
T-DNA Transfer-DNA
TE-8 Tris-EDTA pH 8.0
TNT 2,4,6-trinitrotoluene
TSA Tryptic Soy Agar
UGT UDP-Dependent Glycosyltransferase
UTR Untranslated Region
UV Ultraviolet
v/v Volume Percent
YES Yeast Extract Sugar

1
Chapter One: Introduction
1.1 The Northern Alberta Oil Sands
The Northern Alberta oil sands represents the third largest oil reserve in the world,
surpassed only by the reserves present in Venezuela and Saudi Arabia. The Alberta oil sands are
comprised of three regions (Athabasca, Peace River and Cold Lake) that cover an area greater
than 142,000 km2. These three deposits contain an estimated 1.7 trillion barrels of crude bitumen,
~170 billion barrels of which are extractable using current techniques (OSDC, 2016; CAPP,
2019). Two methods are used to extract bitumen from the oil sands. In situ extraction involves
steam assisted gravity drainage (SAGD), where steam is injected into reserves that are too deep
to be mined. Steam injection lowers the viscosity of bitumen, causing it to drain into the lower
wellbore. The emulsion of water and bitumen is pumped to the surface where the water is
separated from the bitumen. Roughly 80% of the extractable bitumen in the Alberta oil sands is
accessible using SAGD (CAPP, 2019). Surface mining of oil sands is another extraction process
that is used exclusively in the Alberta oil sands and is used to extract bitumen to a depth of 70
metres from the surface. Approximately 20% of Alberta oil sands bitumen is recoverable by
mining approaches (CAPP, 2019). The Clark Hot Water Extraction process is used to recover
bitumen from mined ore using hot water and caustic soda (Allen, 2008). The added salts promote
the release of surfactants and improves the release of bitumen. Surface mining is a water-
intensive process. The net use of water is approximately two barrels of water per barrel of
bitumen (CAPP, 2019). This oil sands process-affected water (OSPW) is stored in tailings
storage facilities, often referred to as tailings ponds.
Tailings ponds and their associated structures span an estimated area of 220 km2 (CAPP,
2019), and the volume of OSPW is in excess of 1 billion m3 (Mahaffey and Dubé, 2016). A strict

2
zero-discharge policy for OSPW is enforced by the Government of Alberta (OAP, 2010).
Seepage of OSPW into groundwater, erosion of soil surrounding tailings ponds, and accidental
spills have the potential to cause detrimental effects on downstream ecosystems (Fennell and
Arciszewski, 2019). Volatile organic compounds, reduced sulphur compounds, and methane can
be released from the surface tailings ponds and contribute to air pollution emissions (Small et al.,
2015).
1.2 Oil sands process-affected water
1.2.1 The composition of OSPW
OSPW contains residual bitumen, sand, clay, salts, metals, and organic components. The
organic components consist of polycyclic aromatic hydrocarbons (PAHs), BTEX (benzene,
toluene, ethyl benzene, xylenes) compounds, phenols and naphthenic acids (NAs). NAs are the
primary contributors to OSPW toxicity, though polar neutral compounds also contribute to
toxicity (Morandi et al., 2015). NAs are a class of alkyl-substituted acyclic and cyclic aliphatic
carboxylic acids that follow the general formula CnH2n+ZO2, where n represents the number of
carbon atoms and Z is a negative even integer that represents hydrogen deficiency due to cyclic
structures (Clemente and Fedorak, 2005). These classical NAs typically have molecular masses
in the range of 120-700 and contain 9 to 20 carbon atoms (Zhang et al., 2011) (Figure 1.1 and
Figure 1.2). The acid extractable organic (AEO) fraction from OSPW contains additional organic
compounds that possess sulfur and nitrogen heteroatoms and oxy-naphthenic acids (oxy-NAs)
(Grewer et al., 2010; Bowman et al., 2019). Oxy-NAs have the general formula of CnH2n+ZOx,
where X = 3, 4, or 5. These NAs have undergone mild oxidation, thus can be used as a marker

3
Figure 1.1: Examples of classical naphthenic acids. R refers to an alkyl chain, Z refers to the
hydrogen deficiency and m is the number of CH2 units. Whitby, 2010.
for partial degradation (Wang et al., 2013).
NAs likely originated from incomplete aerobic biodegradation of petroleum
hydrocarbons (Grewer et al., 2010; Kannel and Gan, 2012). The composition of the NA fraction
of OSPW is affected by the age of the tailings. The lower molecular weight NAs represent a
higher percentage of the NA fraction in fresh OSPW, compared to complex NAs that have
increased alkyl branching. Conversely, aged OSPW contains a higher ratio of complex NAs to
low molecular weight NAs (Frank et al., 2008). Low molecular weight NAs are more susceptible
to degradation by microbes, while the more complex NAs are recalcitrant. Cyclization results in
higher NA recalcitrance (Han et al., 2008).

4
Figure 1.2: Distribution of NAs obtained from an OSPW sample. GC-MS was used to
categorize NAs. The x-axis represents the carbon number; the y-axis represents the percentage of
NA in the sample; the z-axis represents the hydrogen deficiency. Clemente and Fedorak, 2005.
1.2.2 Toxicity of OSPW and naphthenic acids
NAs have chronic and acute toxicity effects on fish, plants, algae and other organisms
(Leishman et al., 2013; Marentette et al., 2015; Li et al., 2017). The concentration, complexity
and variety of NAs in OSPW varies between samples, although a higher concentration of NA
does not necessarily reflect higher toxicity. OSPW demonstrates acute toxicity to animals such as
rainbow trout (LC50 < 10% v/v) and rats (LC50 = 3.0 g/kg of body weight) (Headley and
McMartin, 2004; Whitby, 2010). Developmental changes in fathead minnow resulting from AEO
exposure range from cardiovascular abnormalities to fin wrinkling, as well as increased embryo

5
mortality rates (Marentette et al., 2015). In vitro assays have also been used to investigate the
toxicity of OSPW. Microtox bioassays, which measure bioluminescence of the bacterium Vibrio
fischeri, demonstrated that fresh OSPW is less toxic (IC50 24%-67% v/v) than naturally aged
OSPW (IC50 64%-100% v/v) (Li et al., 2017). More recently, a biomimetic assay that allows for
quantification of toxicity resulting from OSPW organic compounds has been developed
(Redman et al., 2018). These assays use solid phase microextraction fibers coated in
polydimethylsiloxane that organic compounds partition onto, thereby mimicking partitioning of
NAs into lipid membranes. In tandem with toxicity studies using aquatic organisms and known
organic acids, this assay provides an accurate measure of OSPW toxicity.
NAs also have a negative effect on plant growth. When exposed to increasing NA
concentrations that ranged from 0 mg/L to 300 mg/L, aspen seedlings demonstrated lower
photosynthetic rates, leaf chlorophyll concentration, root O2 uptake and leaf expansion ratios
(Kamaluddin and Zwiazek, 2002). Water conductance in plants, as well as germination rates of
seeds, are also negatively impacted by NAs (Apostol et al., 2004). Ionization states of NAs have
significant effects on toxicity. In a study using cattail (Typha latifolia), common reed
(Phragmites australis) and bulrush (Scirpus acutus), plants were exposed to 30 mg/L and 60
mg/L of AEO treatment at pH 5.0 or 7.8 (Armstrong et al., 2009). The pKa for NAs ranges from
5.0-6.0, making the NAs primarily nonionized at pH 5.0 and primarily ionized at pH 7.8
(Headley and McMartin, 2004). After 30 days of treatment, there was a significant decrease in
fresh weight in all three plant species at both NA concentrations for the pH 5.0 treatment
(Armstrong et al., 2009). For the pH 7.8 treatments, the only significant decrease was observed
in common reed at 60 mg/L AEO treatment. A study examining the growth effects of NAs on the
model plant Arabidopsis thaliana (Arabidopsis) also demonstrated that nonionized NAs are more

6
phytotoxic than the ionized forms (Leishman et al., 2013). Primary root length of 17 day-old
Arabidopsis seedlings was significantly impaired when grown on NA-containing plates at pH 5.0
compared to seedlings grown at pH 7.8.
The surfactant properties of NAs are thought to contribute to cellular toxicity. The
amphipathic (hydrophobic and hydrophilic) properties of NAs may allow them to disrupt the
lipid bilayer of the cell membrane in a process known as narcosis. This alters the surface tension,
fluidity and thickness of membranes (Frank et al., 2009). Increases in complexity and size of
NAs are correlated with an increase in toxicity. This may be attributed to larger regions of
hydrophobicity integrating more easily into the cellular membrane, and larger molecules being
physically more disruptive. Additionally, since the more complex NAs tend to be more
recalcitrant, the most toxic NAs are the most difficult to degrade (Johnson et al., 2011; Demeter
et al., 2015). In their nonionized form, NAs are non-polar (thus lipid-soluble) which seems to
allow them to be more readily absorbed by plant roots. Exposure of plant epidermal cells to NAs
results in a disrupted structure of several membrane-bound organelles, implying the destructive
effects of NAs on membrane integrity and function (Alberts et al., 2019). In addition, an ion-trap
mechanism (Briggs et al., 1998) may explain the increase in toxicity of NAs. In this model, non-
ionized NAs in a low pH extracellular environment can easily enter cellular membranes. At high
concentration, these membrane-associated NAs could move into the cell cytosol. The higher
cytosolic pH environment causes NAs to convert to their ionized form, thereby trapping the NAs
in the cytosol and altering internal cellular processes (Armstrong et al., 2009).

7
1.3 Conventional non-biological NA remediation approaches
Non-biological methods of NA remediation of OSPW include advanced oxidation
processes (AOP), flocculation, adsorption and membrane filtration (Quinlan and Tam, 2015).
Advanced oxidation involves the production of highly reactive organic radicals (most commonly
hydroxyl radicals) which oxidize organic compounds, including NAs and phenols (Qin et al.,
2019). Radicals can be generated by UV irradiating photocatalysts such as TiO2 and HOCl.
Ozonation and gamma irradiation provide alternative methods of producing radicals. A
disadvantage to using AOPs includes incomplete degradation of compounds, which may
potentially lead to the production of more toxic compounds. Another drawback is that UV
radiation cannot penetrate deep into OSPW (Kannel and Gan, 2012). Additionally, when
deployed on a large scale, photolysis is expensive to operate (Oller et al., 2011).
Flocculation is an industrial method that can be used to remediate OSPW. This process
involves the addition of coagulants, such as aluminium sulphate, to produce small particles that
result from electrostatic interactions between the coagulant and the NAs, which then
conglomerate into a larger floc and settle (Wu et al., 2019). Similar to AOPs, a constant supply
of costly chemicals must be provided for continuous NA remediation. Membrane filtration is an
NA remediation approach that utilizes a filter to either physically or electrostatically separate
organic compounds from OSPW (Quinlan and Tam, 2015). However, maintenance of the filters
would be intensive and challenging to use on an industrial scale. Removal of NAs using
adsorption involves the addition of small granules of activated carbon or biochar to OSPW. Due
to the high surface area of the activated carbon, this results in high NA adsorption efficiency
(Mohamed et al., 2008). Drawbacks to this approach include the large expenses required to

8
produce activated carbon with sufficiently high surface area to be effective (Quinlan and Tam,
2015).
1.4 Phytoremediation
1.4.1 Benefits to phytoremediation
Phytoremediation provides an environmentally friendly and cost-effective method of
removing contaminants. Phytoremediation of contaminated sites often involves re-vegetation
with a diverse community of native plant species resulting in the removal of contaminants
through metabolism, sequestration or volatilization. Plants provide erosion control, promote soil
fertility by providing nutrients for other plants, and enrich microbial communities with root
exudates (Doty et al., 2017; Gerhardt et al., 2017; Frédette et al., 2019). The passive nature of
phytoremediation makes it a desirable remediation approach. Once plant communities are
established, the upkeep required to maintain the system is minimal.
1.4.2 Phytoextraction
Phytoextraction is a phytoremediation process in which plants take up dissolved
contaminants surrounding their roots and sequester them in above-ground tissues such as leaves
(Touceda-González et al., 2017). Sites contaminated with metals are more commonly remediated
using phytoextraction, as the metals cannot undergo further degradation. Phytoextraction
requires harvesting of plant tissues, incineration and replanting additional material to effectively
remediate contaminated regions (Mahar et al., 2016). Hyperaccumulator plants can take up large
quantities of metals without suffering from phytotoxic effects. Naturally occurring chelating
agents, such as phytochelatins (Cobbett, 2000), are synthesized by plants in the presence of
heavy metal ions. Phytochelatins increase the availability of metal ions, though it is possible to

9
supplement soils with additional chelating agents such as EDTA to enhance this effect. Chelators
work by binding to the metal ions to form a chelate-metal complex. This reduces the electrostatic
forces between the negatively charged surface of soil particles and the positively charged metal
ion, and allows for increased uptake into the plant roots. The chelate-metal complexes are then
transported from the roots to the shoots by metal transporters, such as HEAVY METAL
ATPASE 4 (HMA4) (Hanikenne et al., 2008). HMA4 transports zinc and cadmium and is
expressed in xylem cells in the presence of heavy metals. Expression of HMA4 promotes
expression of zinc deficiency response genes such as ZIP4 and IRT3 in the roots of the plant,
which in turn promote root-to-shoot translocation of the chelate-metal complex.
1.4.3 Phytodegradation/Rhizodegradation
Phytodegradation is a phytoremediation strategy by which plants take up contaminants
from the soil and, using plant metabolic pathways, degrade the contaminants. Plants secrete
nutrients from their roots to cultivate different types of bacteria and fungi. These rhizospheric
microorganisms can also contribute to contaminant degradation in a process known as
rhizodegradation (Newman and Reynolds, 2004; Doty et al., 2017; Repas et al., 2017). Both
phytodegradation and rhizodegradation are suited for remediating sites that have been
contaminated with organic compounds. For example, both strategies can remediate areas
contaminated with petroleum hydrocarbons (PHCs) that are derived from crude oil.
Metabolism of foreign compounds (xenobiotics) in plants involves three different phases:
transformation, conjugation and compartmentalization (Reichenauer and Germida, 2008;
Abhilash et al., 2009). Transformation of xenobiotics involves oxidation, reduction or hydrolysis
to make the xenobiotic polar and more water soluble. The cytochrome P450 (CYP) enzyme
family is most commonly involved in this process. These enzymes function as monooxygenases

10
by adding an oxygen atom to hydrophobic molecules (Bernhardt, 2006). The purpose of
transformation is to increase the reactivity of the xenobiotic so it can be conjugated to other
molecules in the conjugation phase, where the xenobiotic is conjugated to a sugar or peptide.
This converts the xenobiotic to a form that is less phytotoxic and more efficiently transported
during the compartmentalization phase. Enzymes such as glutathione S-transferases (GSTs) and
UDP-dependent glycosyltransferases (UGTs) are involved in conjugation. GSTs bind
xenobiotics to the tripeptide glutathione, and UGTs bind xenobiotics to UDP-glucose (Abhilash
et al., 2009). Once conjugated, the xenobiotics are compartmentalized to either the vacuole for
storage, or can be deposited elsewhere, including the cell wall (Reichenauer and Germida, 2008).
The use of plants to remediate soils contaminated with petroleum hydrocarbons (PHCs)
may be direct through plant cellular metabolic pathways, but more often by providing an
environment for microorganisms to thrive. Plants improve soil quality by regulating soil pH, as
well as secreting amino acids and carbohydrates to promote microbial growth. They also provide
soil moisture and gas exchange. Conversely, microbes contribute symbiotically to
phytoremediation by promoting plant growth or metabolizing contaminants directly (Hall et al.,
2011). Bacterial species that are commonly associated with PAH remediation include
Pseudomonas aeruginosa and Pseudomonas fluorescens, as well as species of Mycobacterium,
Haemophilus and Rhodococcus (Bisht et al., 2015). Analysis of PAH degradation in a mesocosm
study using Orychophragmus violaceus amended with Rhodococcus ruber EM1 demonstrated
significantly higher PAH degradation (greater than 50% increase) relative to non-augmented
treatment (Kong et al., 2018). Reverse-transcription quantitative PCR (RT-qPCR) results from
this study showed that PAH ring-hydroxylating dioxygenase genes in Rhodococcus were

11
upregulated up to four times higher in the plant-associated Rhodococcus treatment compared to
Rhodococcus alone.
1.4.4 Phytostabilization
Phytostabilization is a phytoremediation strategy in which plants are used to sequester
contaminants in the environment. Here, plants immobilize the contaminants in the rhizosphere,
which can prevent contaminants from spreading in the environment (Mahar et al., 2016).
Exudates in the rhizosphere can reduce the availability of metals through adsorption, while roots
physically prevent erosion (Mendez and Maier, 2008). Species used in phytostabilization must
also tolerate harsh growth conditions and the compound(s) of interest, as sites tend to have few
nutrients, high salt levels and extreme pH levels (Mendez and Maier, 2008). Plant species that
produce large amounts of biomass, along with extensive, dense root systems are ideal
phystabilization candidates. A study examining the ability of 51 different plant species in treating
a manganese mining site via phytostabilization led to the identification of eight species
(including Alternanthera philoxeroides, Artemesia princeps, Bidens frondosa) that were ideal
candidates for phytostabilization (Yang et al., 2014). These species significantly accumulated
lower concentrations of Cd, Mn, Pb and Zn (bioconcentration factor < 1) showing that they
excluded metals from entering from the environment. These species were also able to rapidly re-
vegetate sites with poor fertility.
1.4.5 Phytovolatilization
During phytovolatilization, plants take up contaminants from the soil, and through
transpiration, release them into the air. Phytovolatilization relies on dilution of organic and
inorganic contaminants into the air. While organic compounds are more commonly remediated
with this strategy, arsenic and mercury have been volatilized from plants (Sakakibara, 2010).

12
Volatile, hydrophobic organic compounds such as chlorinated ethenes and BTEX compounds
have been efficiently removed from soil using phytovolatilization (Imfeld et al., 2009). There are
two different categories of phytovolatilization. Direct phytovolatilization occurs when
contaminants are taken up from the soil into the roots, and are eventually translocated through
vascular tissues and expelled through leaves via stomata or the trunk through lenticels and the
periderm (Limmer and Burken, 2016). Indirect phytovolatilization is the result of plant roots
increasing the flux of volatile contaminants through water movement induced by roots. This
affects soil permeability and gas flux which can allow compounds to volatilize through the soil
(Limmer and Burken, 2016). Both direct and indirect phytovolatilization are affected by
environmental factors such as pressure and precipitation.
1.4.6 Rhizofiltration/Phytofiltration
Rhizofiltration (or phytofiltration) involves the sequestration of contaminants from
aquatic environments in the root system (Vishnoi and Srivastava, 2008). Whereas
phytoextraction refers to soil-based remediation, rhizofiltration is wetlands-based. Rhizofiltration
is frequently used to remove metal contaminants from water, though it can be applied to organic
compound remediation as well (Vymazal, 2013). In constructed wetlands, macrophytes
contribute to the metabolism of contaminants as well as providing a physical infrastructure that
contributes to the remediation of water. Above-ground plant tissues can reduce wind speeds
which accelerates the rate at which sedimentation occurs, as well as providing subsurface
structures on which microorganisms can grow (Vymazal, 2013). The root tissue also physically
filters the wastewater to prevent movement of particulate matter. Species that are commonly
used in free-water surface constructed wetlands include Phragmites spp., Typha spp., Scirpus
spp. and Juncus spp. (Wu et al., 2015).

13
1.5 Bioremediation approaches to NA degradation
1.5.1 Microbial and algal NA remediation
β-oxidation, α-oxidation, and aromatization pathways are potential mechanisms that
microbes use to degrade NAs (Whitby, 2010). β-oxidation is a catabolic process whereby fatty
acid molecules are split into acetyl-CoA and a fatty acid molecule that has two fewer carbons.
While β-oxidation is primarily associated with fatty acid catabolism, the structural similarities
shared between NAs and fatty acids (both have a long carbon chain and carboxyl group) allow
NAs to be used as a substrate of β-oxidation. Removal of the two carbons yields a shorter NA
that can be further oxidized through another cycle of β-oxidation. This process continues until
the last product cannot be catabolized by β-oxidation. An alternative pathway would then be
required to further metabolize the compound. Bacteria may also use α-oxidation, which removes
a single carbon to make substrates amenable for further degradation using β-oxidation (Rontani
and Bonin, 1992). Degradation of NAs through aromatization involves the transformation of an
alicyclic ring into an aromatic intermediate, which is then cleaved, resulting in breakage of the
ring structure (Blakley, 1974). The ability of aerobic microbes to degrade model lower molecular
weight NAs has been well-documented, though larger more highly branched NAs are more
recalcitrant and therefore more difficult to degrade (Holowenko et al., 2002; Clemente et al.,
2004; Demeter et al., 2015). While NAs obtained from OSPW pose a higher degree of difficulty
to metabolize than commercial NA mixtures, these commercial mixtures have been used to
identify microbial species that have NA degradative abilities (Scott et al., 2005).
Along with bacteria, algae are also present in OSPW. Algal species have previously been
shown to tolerate NA concentrations > 100 mg/L (Quesnel et al., 2011). Algae have the ability to
degrade labile NAs such as cyclohexanebutyric acid and cyclohexanepropionic acid via the β-

14
oxidation pathway, resulting in the production of cyclohexaneacetic acid and
cyclohexanecarboxylic acid (Quesnel et al., 2011). In another study, bioreactors containing
aerobic, endogenous OSPW bacterial populations have also been used successfully to degrade a
wide variety of NAs, though failing to significantly degrade 1-adamantanecarboxylic acid
(AdCA) (Demeter et al., 2015). More recently, algal-bacterial microbial communities were
shown to degrade AdCA levels by up to 80% over 90 days (Paulssen and Gieg, 2019). The
microbial communities were primarily algae, comprising 90% of the relative sequence
abundance and only 10% was associated with bacteria. Analysis by 18S rRNA gene sequencing
indicated that Chlorellales and Acutodesmus were abundant in these communities, with each
comprising approximately half of the algal population (Paulssen and Gieg, 2019). Degradation of
AdCA using OSPW-derived bacteria (with no algal component) has recently been demonstrated,
with 50%-71% of the AdCA being degraded after 33 days (Folwell et al., 2020).
1.5.2 Plant-mediated degradation
While phytoremediation of NAs is not well characterized, reports that demonstrate its
potential have been published. Treatment of cattail plants with 60 mg/L of nonionized NA
solution demonstrated a shift in relative NA abundance after 30 days of treatment, compared to
an unplanted control (Armstrong et al., 2009). Single-ring and double-ring NA treatments of
cattail resulted in a significant difference in NA dissipation from solution. Following treatment,
the hydroponic medium showed a decrease in toxicity, as per Daphnia magna mortality assays.
This suggested that plants can detoxify NAs either directly through metabolism or sequestration,
or indirectly through associations with microbes.
Plants have a host of metabolic pathways that could be potentially be used for NA
detoxification. They can degrade herbicides through the use of cytochrome P450 enzymes

15
(Siminszky, 2006) as well as many organic compounds, such as 1,2-Dichloroethane and BTEX
compounds (Mena-Benitez et al., 2008; Mosaddegh et al., 2014). Plants could contribute to NA
degradation indirectly by providing an environment that is suitable for the growth of plant-
associated bacteria to degrade NAs. Tailings have poor nutrient availability, are highly saline and
possess high pH, thereby resulting in adverse conditions for plant growth (Lefrançois et al.,
2010). Phytomicrobial degradation of hydrocarbons has been demonstrated in several oil sands
reclamation studies. Microbes associated with sweet clover (Melilotus albus) and annual barley
(Hordeum vulgare) obtained from oil sands reclamation sites were analyzed for CYP153
(cytochrome p450 hydroxlase), alkB (alkane monooxygenase), and nah (naphthalene
dioxygenase) transcript abundance, as these are hydrocarbon degrading genes (Mitter et al.,
2020). Here, 42 culturable isolates had high expression of at least one of these genes, with the
highest number of isolates belonging to Pseudomonas, Pantoea and Enterobacter spp.
Inoculation of plants with microbes can also have positive effects on plant growth, soil quality
and ultimately, remediation efficiency. A field trial compared the hydrocarbon remediation
efficiency of Frankia-inoculated alder with non-inoculated alder grown on tailings (Lefrançois et
al., 2010). Inoculation led to increases in soil organic matter and decreases in soil pH and sodium
content. While the biomass of the two treatments was similar after two years, hydrocarbon
mineralization was higher in the Frankia treatment than the control.
1.6 Species under research
1.6.1 Arabidopsis
Arabidopsis is an ideal plant species for use in NA phytoremediation research. Its short
life cycle, diminutive size and fully sequenced genome make it amenable to genetic and

16
genomics studies. The Arabidopsis genome contains approximately 25,000 genes and is thought
to encode over 100,000 proteins through post-translational modification and alternative splicing
(Cobbett and Meagher, 2002). Arabidopsis can survive in a wide range of environmental and
geographical conditions, and the genetic basis behind its adaptability can be leveraged to
research phytoremediation (Bevan and Walsh, 2005). Arabidopsis has successfully been used for
phytoremediation research to identify genes involved in metal chelation, organic contaminant
metabolism and vacuolar transport of metal ions. The vast availability of mutant Arabidopsis
repositories (primarily with T-DNA and transposon insertions) makes forward genetics studies
possible (Bevan and Walsh, 2005). Characterization of Arabidopsis mutants that tolerate NAs
could lead to the identification of genes involved in NA metabolism or sequestration. This
knowledge could then be applied to species that are viable for field-scale phytoremediation trials
by screening for native plants that have high expression levels of these genes.
1.6.2 Elymus trachycaulus
Multiple species of native plants can be deployed to remediate NAs, as they each can
contribute to remediation in unique ways. One field species, Elymus trachycaulus (slender
wheatgrass), is a grass species native to northern Alberta that is commonly found in oil sands
reclamation sites. Slender wheatgrass is primarily used to mitigate erosion in reclaimed sites as it
can quickly revegetate soils with low fertility (Luna Wolter and Naeth, 2014). It possesses high
tolerance for salinity and PAHs and has successfully been grown on tailings (Renault et al.,
2004; Zhang and Zwiazek, 2018). Therefore, this species represents a good candidate for
implementation in NA remediation strategies.

17
1.7 Hypothesis and objectives
The central hypothesis for this research project is that plants have the ability to take up
NAs through their root systems, and once in their cells can biotransform NAs using transporter
systems and metabolic pathways that are not well characterized.
The specific objectives of this research are to:
1) Characterize activation-tagged lines of Arabidopsis with NA growth tolerance and
identify the genes that are responsible for this tolerance.
2) Establish protocols to visualize NA uptake and translocation using 14C-radiolabeled NAs.

18
Chapter Two: Materials and Methods
2.1 Plant material
2.1.1 Arabidopsis and slender wheatgrass
The wild-type Arabidopsis thaliana ecotypes Col-2 and Col-7 were used as controls.
Activation-tagged Arabidopsis lines were obtained from the Arabidopsis Biological Resource
Centre (ABRC, Ohio State University). CS21995 (86 pools of 100 lines), CS21991 (82 pools of
96 lines), CS21999 (85 pools of 10 lines) and CS23153 (62 pools of 100 lines) (Weigel et al.,
2000). CS31100 (208 pools of 100-300 lines) (Sedbrook et al., 2004). The CS21995, CS21991,
CS21999 and CS23153 pools were in the Columbia-7 (Col-7) background, while the CS31100
lines were in the Columbia-2 (Col-2) background (Weigel et al., 2000). The T-DNA region
between the left and right borders that was inserted into these lines contains the glufosinate
(Basta) resistance gene and CaMV 35S enhancer tetramer (Figure 2.1). Slender wheatgrass
(Elymus trachycaulus) seeds were a gift from Amanda Schoonmaker (Northern Alberta Institute
of Technology).
2.2 Arabidopsis genetic screen
2.2.1 NA and herbicide resistance growth plates
Agar plates contained 55-60 mg/L of AdCA or 30 mg/L of DH2NA. Petri plates
containing these NAs were prepared by mixing a 2X concentrated solution of 0.5X MS, 1%
sucrose and 0.7% phytoagar (PhytoTechnology Laboratories) (pH 5.0) with a 2X concentrated
NA solution buffered in 10 mM MES (pH 5.0). A volume of 30 mL of the combined agar and
NA mixture was poured into each plate.

19
Figure 2.1: The pSKI015 vector used to generate libraries of activation-tagged lines of
Arabidopsis. The region between the left border (LB) and right border (RB) inserts randomly
into the genome in transgenic plants. The vector encodes the Basta resistance gene and the
CaMV 35S enhancer tetramer.
Basta plates were used to determine segregation ratios for the NA tolerant phenotype.
Filter sterilized 1000x Basta stock solution was added to 0.5X MS, 1% sucrose, 0.7% phytoagar
resulting in a final Basta concentration of 15 mg/L. A volume of 30 mL of this solution was
added to each of the petri dishes. Seedlings that tested positive on the secondary NA screen were
assayed on Basta plates for 10 days with a photoperiod of 16 hours at 23°C after which the
number of tolerant and non-tolerant seedlings were tallied.
2.2.2 Genetic screen
Arabidopsis seeds were surface sterilized using a two-step ethanol wash. Seeds were
mixed in 1 mL of 70% ethanol on an orbital shaker for 10 minutes. The ethanol was decanted,
and the ethanol wash was repeated for 5 minutes. Seeds were dried in a laminar flow hood on a
sheet of filter paper sterilized with 70% ethanol. A total of 250 seeds were distributed on each

20
plate. An average of four to five seeds were screened from each transgenic line. The number of
plates used varied depending on the pool size. The seeds were stratified in the dark at 4°C for
two days. Plates were then placed horizontally in a growth chamber under a 16 hour light:8 hour
dark photoperiod at 23 °C.
The screening procedure is outlined in Figure 2.2. The primary screen on NA plates was
over a two week period. The presence of green true leaves and roots were used to identify seeds
that passed the primary screen. Seedlings that possessed only a single, green cotyledon were
considered negative. Selected seedlings were then transferred to soil and allowed to grow for an
additional four weeks to obtain mature seed. Once seeds had matured, all lines were passed
through a secondary screen on both AdCA and DH2NA agar plates as described above, and the
same criteria were used to determine if seedlings possessed naphthenic acid tolerance.
2.3 DNA extraction methods
Three methods were used to extract genomic DNA from Arabidopsis. Genomic DNA
used for TAIL-PCR was purified using the Qiagen DNeasy Plant Mini Kit. For the next
generation sequencing T-DNA insertion analysis approach (performed by Genome Quebec
Sequencing Service), the Qiagen DNeasy Plant Maxi Kit was used. CTAB DNA extraction was
used to obtain DNA for standard PCR reactions. The CTAB extraction buffer was prepared using
10% CTAB, 0.5 M NaCl, 0.5 M EDTA (pH 8.0), 1 M Tris-Cl (pH 8.0), PVP, β-
mercapthoethanol (Clarke, 2009). For each DNA preparation, a small leaf was placed in a 1.5
mL Eppendorf tube along with 250 μL of extraction buffer and was ground with a small plastic
microcentrifuge pestle attached to a hand drill. The tubes were incubated at 65°C for 30 minutes,

21
Figure 2.2: Overview of the activation-tag genetic screen procedure.

22
after which 250 μL of chloroform was added to the tube and vortexed. The tubes were
centrifuged at 12,000 rpm in a microcentrifuge for 5 minutes at 4°C and placed on ice.
Approximately 200 μL of the aqueous phase (top) of the tube was transferred into a clean 1.5 mL
microcentrifuge tube and the organic phase was discarded. The addition of 150 uL of cold
isopropanol followed, and the solution was vortexed and incubated at room temperature for 10
minutes. The samples were centrifuged at 12,000 rpm for 15 minutes at 4°C, and resulted in the
appearance of a small white pellet. The isopropanol was decanted and 300 μL of cold 75%
ethanol was added to the tube, followed by centrifugation for an additional five minutes at
12,000 rpm at 4°C. The ethanol was aspirated using a vacuum to allow the residual ethanol to
evaporate. The pellet was resuspended in 50 μL of TE pH 8 (1 M Tris-Cl and 0.5 M EDTA, pH
8.0) and stored at -20°C.
2.4 TAIL-PCR
Thermal asymmetric interlaced PCR (TAIL-PCR) was the first technique that was used to
identify the T-DNA insertion site in NA tolerant Arabidopsis lines. This technique (outlined in
Figure 2.3) uses three sequential PCR reactions, where the products of the previous reaction are
used as the template for the next reaction. TAIL-PCR uses two types of primer. Pooled arbitrary
degenerate primers (AD primers) anneal throughout in the plant genome, while left border (LB
primers) are specific to the left border of the T-DNA insertion (Table 2.1). The primary TAIL-
PCR reaction produces many non-specific products, while the subsequent reactions are used to
further select for the product associated with the T-DNA insertion. The LB primers are nested,
which results in the tertiary TAIL-PCR product being approximately 50 base pairs shorter than
the secondary TAIL-PCR product.

23
The primary TAIL-PCR program consisted of several steps: incubation at 94°C for 3
minutes; five cycles of 94°C for 30 seconds, 62°C for 1 minute and 72°C for 2 minutes and 30
seconds; two cycles of 94°C for 30 seconds, 25°C for 3 minutes, and 72°C for 2 minutes and 30
seconds; 15 cycles of 94°C for 10 seconds, 68°C for 1 minutes, 72°C for 2 minutes and 30
seconds, 94°C for 10 seconds, 68°C for 1 minutes, 72°C for 2 minutes and 30 seconds, 94°C for
10 seconds, 44°C for 1 minutes, 72°C for 2 minutes and 30 seconds; 72°C for 5 minutes.
Reagents used are documented in Table 2.2. The secondary TAIL-PCR program was: 94°C for 3
minutes, followed by five cycles of 94°C for 10 seconds, 64°C for 1 minute, and 72°C for 2
minutes and 30 seconds; 15 cycles of 94°C for 10 seconds, 64°C for 1 minute, 72°C for 2
minutes and 30 seconds, 94°C for 10 seconds, 64°C for 1 minute, 72°C for 2 minutes and 30
seconds, 94°C for 10 seconds, 44°C for 1 minute, and 72°C for 2 minutes and 30 seconds. This
was followed by five cycles of 94°C for 10 seconds, 44°C for 1 minute, and 72°C for 3 minutes;
72°C for 5 minutes. Reagents used are documented in Table 2.3. The tertiary TAIL-PCR
program was: 94°C for 3 minutes; 20 cycles of 94°C for 10 seconds, 44°C for 1 minute, and
72°C for 2 minutes; 72°C for 5 minutes. Reagents used are documented in Table 2.4.
Secondary and tertiary TAIL-PCR products were visualized on a 0.8% agarose gel in 1x
TAE. The gel was run at 110V for approximately 25 minutes and stained with Gel Red (Sigma-
Aldrich). Primary TAIL-PCR does not produce specific PCR products so they cannot normally
be visualized on an agarose gel. Selected agarose gel bands from the secondary and tertiary PCR
samples were excised, the DNA purified (QIAquick Gel Extraction Kit, Qiagen), and the DNA
sequenced at the University of Calgary Core DNA Service.

24
Figure 2.3: Diagram illustrating TAIL-PCR. Each of the three TAIL-PCR reactions uses
pooled AD primers which bind throughout the genome as well as a LB primer that binds to the
left border of the T-DNA insertion. Subsequent TAIL-PCR reactions amplify off the products
from the previous reaction using another LB primer which is closer to the left border. This
results in a PCR product that is approximately 50 bp shorter than from the previous reaction.
Table 2.1: Primers used in TAIL-PCR and heritability analysis.
Primer Name 5’ to 3’ Primer Sequence
TAIL Degen1 NGT CGA SWG ANA WGA A
TAIL Degen2 TGW GNA GSA NCA SAG A
TAIL Degen3 AGW GNA GWA NCA WAG G
TAIL Degen4 WGT GNA GWA NCA NAG A
LB1 ATACGACGGATCGTAATTTGTC
LB2 TAATAACGCTGCGGACATCTAC
LB3 TTGACC-ATCATACTCATTGCTG
BASTA 1 FWD GGGAGACGTACACGGTTGAC
BASTA 1 REV ACATCGAGACAAGCACGGTC

25
Table 2.2: Single Reaction for Primary TAIL-PCR
Reagent 1x Reaction Volume (μL) Final Concentration
ddH2O 9.4
10x PCR Buffer 2.0 1x
10 mM dNTP 0.4 0.2 mM
50 mM MgCl2 0.6 1.5 mM
10 μM LB1 Primer 0.4 0.2 μM
4x AD-Pool Primer 5.0 1x
Taq Polymerase 0.2
DNA Template 2.0
Total Volume 20 μL
Table 2.3: Single Reaction for Secondary TAIL-PCR
Reagent 1x Reaction Volume (μL) Final Concentration
ddH2O 11.4
10x PCR Buffer 2.0 1x
10 mM dNTP 0.4 0.2 mM
50 mM MgCl2 0.6 1.5 mM
10 μM LB2 Primer 0.4 0.2 μM
4x AD-Pool Primer 3.0 1x
Taq Polymerase 0.2
1:100 dilution of Primary
TAIL-PCR Product
2.0
Total Volume 20 μL
Table 2.4: Single Reaction for Tertiary TAIL-PCR
Reagent 1x Reaction Volume (μL) Final Concentration
ddH2O 10.4
10x PCR Buffer 2.0 1x
10 mM dNTP 0.4 0.2 mM
50 mM MgCl2 0.6 1.5 mM
10 μM LB3 Primer 0.4 0.2 μM
4x AD-Pool Primer 5.0 1x
Taq Polymerase 0.2
1:50 dilution of Secondary
TAIL-PCR Product
2.0
Total Volume 20 μL

26
2.5 Targeted gene sequencing for T-DNA insertion analysis
The targeted gene sequencing analysis protocol is summarized in Figure 2.4. For the
mutants of interest, Basta plates were used to identify plants that possessed the T-DNA insertion.
This enables only plants in a heterozygous or homozygous background to be identified and used
in this analysis (described in section 2.2.1). Approximately 1 gram of leaf tissue was removed
from mature plants that contained the Basta gene, and was snap-frozen in liquid nitrogen and
stored at -80°C. DNA samples were prepared from the leaf tissue were using the DNeasy Plant
Maxi Kit (Qiagen). Approximately 150 ng of each DNA sample was used to generate an
Illumina shotgun library (performed by Genome Quebec Sequencing Centre). PCR reactions
using the shotgun libraries were carried out using Illumina primer P2 and primers containing
sequences unique to the pSKI015 vector and a tag sequence. The products of this PCR reaction
were used as the template for the barcoding reaction (using sample-specific barcodes) as well as
for appending Illumina adapters. The barcoding products were then pooled in equimolar amounts
and run on the MiSeq sequencer (Illumina). The MiSeq output was processed using Galaxy to
remove the pSKI015 sequence. The read1 (R1) FASTQ files were uploaded as fastqsanger files.
The adapter sequence at the 3’ end of the fragments was removed with the Clip tool, resulting in
the removal of all sequences after the following sequence:
AGATCGGAAGAGCACACGTCTG. The Trimmomatic tool was used to trim bases belonging
to the pSKI015 vector. The number of bases trimmed was determined by comparing the
sequences of some reads with the vector. The FASTQ file was converted to a FASTA file,
removing the quality calls, and the sequences were copied into an Excel file and alphabetized. As
the Illumina shotgun library is produced by mechanically shearing the genomic DNA, the sizes

27
Figure 2.4: Diagram illustrating the targeted gene sequencing workflow to determine the
T-DNA insertion sites in selected mutant Arabidopsis lines. Clusters of related sequence are
indicative of potential insertion sites.
DNA PCR 1: Primer P2 and
T-DNA specific primer
PCR 2: Ligation of
adapters, addition of
barcodes
AB
AB
ABC
ABC
ABCD
ABCD
ABCD
ABCDE
ABCDE
ABCDEF
ABCDEFG
ABCDEFG
ABCDEFG
ABCDEFGH
ABCDEFGH
ABCDEFGHI
ABCDEFGHIJ
…
ABCDEFGHIJKLMNOPQRSTUVWXYZ
Mechanical Shearing
and Adenylation
Run on MiSeq
Process reads: Remove
pSKI015 region, trim
sequence homologous to
Illumina adapter
Sort reads in alphabetical
order to obtain clusters of
sequence

28
of the fragments vary. Clustering of similar sequences of increasing length in the Excel file
indicate the presence of an insertion site (see Appendix 1).
2.6 Gene expression studies using Reverse Transcription Quantitative PCR (RT-qPCR)
2.6.1 RNA extraction
Two methods were used to obtain mutant leaf and root tissues. For leaf tissue, to ensure
that plants used for RNA extraction contained the T-DNA insertion, seeds were screened for the
presence of the T-DNA insertion on Basta plates (as described in Section 2.2.2). This step was
required as some of the mutant Arabidopsis lines tested were heterozygous. Seedlings that passed
the Basta screen were transferred to soil and grown for two to four weeks until the leaves were
mature. For root tissue, the Basta screen was not required, as we had previously confirmed that
CS23152 A1-20-3 was homozygous for the T-DNA insertion. HIPP25 is highly expressed in root
tissues (Klepikova et al., 2016) so it was important to use root tissue from these samples.
Approximately 250 seeds were plated on 0.5X MS, 1% sucrose agar plates (pH 5.8) in a line and
were grown vertically for two weeks in the growth chamber, and the roots harvested. Upon
harvesting, plant tissues were snap-frozen and stored at -80°C. Leaf and root tissues were ground
in liquid nitrogen and processed using the Spectrum Plant Total RNA Kit (Sigma-Aldrich). The
On-Column DNAse Digestion kit (Sigma-Aldrich) was used to remove any traces of DNA. The
RNA quality was observed by gel electrophoresis to visualize the 28S and 18S rRNA. Total
RNA concentration was determined spectrophotometrically (Nanodrop 1000, Thermo-Fisher).
The RNA was aliquoted and stored at -80°C.
2.6.2 cDNA synthesis
Moloney Murine Leukemia Virus Reverse Transcriptase (M-MLV RT) was used to
generate cDNA from RNA. For each preparation, 500 ng of RNA, 2 μL of 10X random primers,

29
1 μL of 10 mM dNTP mix was added to a sterilized PCR tube, which was then topped up to 12
μL with sterile ddH2O. The tube was incubated at 65°C for 5 minutes and was chilled on ice. 4
μL of 5X First-Strand buffer, 2 μL of 0.1M DTT and 1 μL of RNaseOUT Recombinant
Ribonuclease Inhibitor (40 u/μL, Fisher Scientific) was added to the tube, which was mixed
gently by stirring with a pipette. The tube was incubated at 37°C for 2 minutes. 1 μL (or 200
units) or M-MLV RT was added to the tube and mixed gently by pipetting up and down. The
tube was incubated at 25°C for 10 minutes and was followed by an incubation at 37°C for 50
minutes. The reaction was inactivated by heating the tube to 70°C for 15 minutes. cDNA was
stored at -20°C until needed.
2.6.3 RT-qPCR
Primers were designed for genes situated on either side of the T-DNA insertion for each
mutant that was characterized (Table 2.5). NCBI Primer-BLAST was used to generate the
primers, and several criteria were used to select appropriate primers. Both primers were required
to have a melting temperature of 60°C, at least one primer must span an exon-exon junction, and
the product size should be 70-150 bp long. Actin-7 gene primers were used as the internal
control for the experiments. Before preparing the reagents for the RT-qPCR reactions, the layout
of 96 well MicroAmp fast optical reaction plate was mapped using the StepOnePlus Real-Time
PCR System (Applied Biosystems). The ΔΔCT method was used to calculate the fold changes in
the reactions. Two biological replicates were used in leaf tissue RT-qPCR assays, and one was
used in root tissue RT-qPCR. Three technical replicates were used for each reaction.
Each 20 μL RT-qPCR reaction consisted of 10 μL of Power SYBR Green Master Mix
(ThermoFisher), 0.5 μL of cDNA, 0.4 μL of forward primer, 0.4 μL of reverse primer and 8.7 μL
of sterile ddH2O. A Power SYBR Green PCR Master Mix was added to each well. Primer master

30
mixes were made for each primer pair (Table 2.5), and 0.8 μL was added to the appropriate
wells. The cDNA template (0.5 μL) was added last to the wells. MicroAmp Optical Adhesive
Film (Applied Biosystems) sealed the wells. The 96 well plate was centrifuged at 3000 RPM for
3 minutes in a swinging bucket rotor centrifuge and placed in the StepOnePlus Real-Time PCR
System (Applied Biosystems). The qPCR program used was as follows: 95°C for 20 seconds,
then 40 cycles of 95°C for 3 seconds then 60°C for 30 seconds.
A two-tailed, Welch t-test with two degrees of freedom and a 95% confidence interval
was performed on CS32152 A1-20-3 and CS23127 A1-2 leaf tissue samples to verify if gene
expression in the mutants was higher than in the Col-7 control.
Table 2.5: Primers used for RT-qPCR
Primer Name 5’ to 3’ Primer Sequence
ACT7 FWD GAACTGGAATGGTGAAGGCTGGTT
ACT7 REV AGTGTGCCTAGGACGACCAACAAT
APPR2 P1 FWD CCAGGAGCGATTCCACCTTT
APPR2 P1 REV ACCGCTCACCGTTGGATAAG
APPR2 P2 FWD CTGAAGCACTCTCTGCGGTT
APPR2 P2 REV GCACCAAGCGCTATGCATTT
SAM P1 FWD GACCGCAAACGAGGGAACAT
SAM P1 REV AGGACTCTGCGATTCCCTCT
SAM P2 FWD AACCACGAAGCACAAGTCCA
SAM P2 REV ATGTTCCCTCGTTTGCGGTC
HIPP25-1 FWD TGGGTGTTCTTGATCACGTCTCT
HIPP25-1 REV CCCTCACATCCACCGTCTGT
HIPP25-2 FWD AGTCTACAGACGGTGGATGTGA
HIPP25-2 REV TGAGCATTTGGCTCGATGGT
SRBP-1 FWD TCGGAATCGGTAACGATCAGTCT
SRBP-1 REV CACATATCTCAACCTCTCGTTCTGT
SRBP-2 FWD TCGGAATCGGTAACGATCAGTCTT
SRBP-2 REV CTCAACCTCTCGTTCTGTATTTTGA

31
2.7 Sterile plant growth methodology
2.7.1 Streptomycin agar plates and Falcon tube preparation
A 1000X stock solution of streptomycin (100 mg/mL) was filter sterilized and aliquoted
into 1.5 mL microcentrifuge tubes and stored in the -20° freezer until needed. Petri plates
containing 0.5X MS, 1% sucrose, 0.7% phytoagar (pH 5.8) and 10 mg/L streptomycin were
prepared for sterile seed germination. Using the same streptomycin agar solution, a 1-inch ring of
agar was applied to the entire circumference of 50 mL polypropylene Falcon tubes (Fisher
Scientific) using a sterile 10 mL serological pipette such that the bottom of the agar reached the
12.5 mL marker on the tube. The tubes were placed horizontally to allow the agar to pool and
set, which provided a region in which sterile, germinated wheatgrass seeds could be readily
adhered for growth under sterile conditions. The agar containing tubes were dark stored at 4°C.
2.7.2 Growth of sterile wheatgrass
Approximately 12 slender wheatgrass seeds were placed in 1.5 mL microcentrifuge tubes
and placed in a microcentrifuge rack with the lids open. In the fume hood, the rack was placed in
a large Tupperware container with a 100 mL beaker containing 80 mL of commercial bleach.
The Tupperware lid was placed ajar on the Tupperware container so that the beaker was
accessible. Using a 5 mL serological pipette and an electric pipettor, 5 mL of 12.1 M HCl
solution was dispensed into the bleach, producing chlorine gas. The container was immediately
sealed with the lid to contain the gas. After two hours of exposure (while still in the fume hood)
the lid was removed for approximately 10 seconds to allow the chlorine gas to escape and the
lids to the microcentrifuge tubes were closed to prevent contamination. The seeds were placed on
10 mg/L streptomycin agar plates, stratified for two days at 4°C, then moved to the growth
chamber with a 16-hour photoperiod and were grown at 23°C for 10 days. Once seeds had

32
germinated, five seedlings were adhered to the side of each streptomycin agar Falcon tube using
sterilized forceps. To allow the roots to grow down the side of the tube and through the agar, the
Falcon tubes were placed in a rack which was angled at 40-45° and the tubes were rotated such
that the roots would grow along the Falcon tube wall. Root growth without hydroponic solution
(i.e., growth into air) promoted root growth and root hair development. The same growth
chamber parameters were used, and the wheatgrass seedlings were grown for approximately two
weeks or until sufficient root growth was attained (Figure 2.5).
Figure 2.5: Schematic diagram of slender wheatgrass growth in sterile hydroponic NA
uptake experiments. Seeds were exposed to gas sterilization and were germinated on 0.5X MS
plates (pH 5.8) containing 100 µg/mL streptomycin for 10 days. Germinated seedlings were
transferred to sterile 50 mL Falcon Tubes containing a ring of agar (pH 5.8) containing 100
µg/mL streptomycin. Sterile 0.5X strength Hoagland solution (pH 5.0) was added to the tubes
after roots and shoots were sufficiently developed.
0.5X Strength Hoagland
Solution
(pH 5.0)
Streptomycin Agar Ring
(pH 5.0)

33
2.7.3 Plant sterility testing using YES, TSA and LB plates
Yeast extract sucrose (YES), tryptic soy agar (TSA) and LB plates were prepared to
verify whether the sterilized seeds contained microorganisms that may have survived the
sterilization process. Various microbes are culturable on different types of media, necessitating
the use of more than one type of media. YES plates contained 2 g of yeast extract, 10 g of
sucrose, 0.5 g of KH2PO4, 0.25 g MgSO4 and 7.5 g of agar pH 6.2. TSA plates contained 7.5 g of
tryptone, 2.5 g of peptic digest of soybean meal, 2.5 g of NaCl and 7.5 g of agar pH 7.3. LB
plates contained 5 g of tryptone, 5 g of NaCl, 2.5 g of yeast extract and 7.5 g of agar pH 7.0. The
plates were then stored at 4°C.
Seedlings used for sterility assays were collected at the same time as seedlings were
transferred from the streptomycin agar plates to the 50 mL Falcon tubes. Eppendorf
micropestles, 1.5 mL microcentrifuge tubes, and ddH2O were sterilized by autoclaving. In a
laminar flow hood, a seedling was placed into each microcentrifuge tube and 200 μL of sterilized
ddH2O was added. The seed was ground using the micropestle for 30 seconds, and 100 uL of the
solution was pipetted (using filtered tips) onto the YES and TSA plates. The solution was spread
over the plates using an ethanol sterilized spreader. A water control was used. For the LB assay,
serial dilutions of seed extract were plated: undiluted, 1:10, 1:100, 1:1000 and 1:10000 dilutions
were used. The plates were incubated at 30°C for 72 hours and were checked daily for growth.
2.7.4 Radiolabeled 14C-NA uptake
After approximately 10 days of seedling growth (or when roots were sufficiently
developed) in sterile Falcon tubes, 10 mL of sterile half-strength Hoagland solution (pH 5.0,
Table 2.6) was added to the tubes. 14C-NA stock solutions were added directly to the Hoagland
solution. For hexanoic acid, decanoic acid, cyclopentanecarboxylic acid and

34
Table 2.6: Half-strength Hoagland solution
Solutions Volume per 1L
1.0 M NH4H2PO4 0.5 mL
1.0 M KNO3 3 mL
1.0 M Ca(NO3)2 2 mL
1.0 M MgSO4 1 mL
Micronutrient solution (1 L)
1 mL
- 1.43 g H3BO3
- 0.905 g MnCl2·4H2O
- 0.11 g ZnSO4·7H2O
- 0.04 g CuSO4·5H2O
- 0.01 H2MoO4·H2O
100 mM Fe-EDTA 0.25 mL
cyclohexanecarboxylic acid treatments, 1 µL of 3.7 MBq/mL stock was added. 4 µL of 1.3
MBq/mL 1-adamantanecarboxylic acid stock solution was added for the AdCA treatment. Falcon
tubes were wrapped in aluminium foil at their base, placed into racks in the growth chamber, and
agitated on an orbital shaker for 11 days. After completion of the growth period, two wheatgrass
plants were removed from the Falcon tube, their roots rinsed with water, and the plants were
subsequently dried in a gel dryer (Bio-Rad) at 55°C under mild vacuum for two hours, followed
by exposure overnight to a phosphor screen. The remaining three plants were stored at -80oC.
Phosphor image signal intensity was referenced against the following radioactive CPCA
standards: 67 Bq, 33 Bq, 17 Bq, 8 Bq, 4 Bq and 2 Bq.

35
The radioactive counts in the Hoagland solution at the beginning and end of the
experiment were quantified by scintillation counting. Quantification of the radioactive counts
from the plant phosphor images was carried out using ImageJ (Schneider et al., 2012). A
spreadsheet that converts histogram readings of pixel intensities to becquerels (Bq) was provided
courtesy of Mitchell Alberts. 14C CPCA standards were used to convert the gray values into Bq.
Radioactive counts determined for shoots and roots of the wheatgrass were taken individually
and averaged to calculate the total counts for five seedlings in each 50 mL Falcon tube.

36
Chapter Three: Characterization of Naphthenic Acid Tolerant Arabidopsis Activation-
Tagged Mutants
3.1 Introduction
Genetic screens have been used to characterize genes and identify desirable phenotypes
in plants. There are two types of genetic screen. Forward genetic screens identify a specific
phenotype and then determine the genes responsible for the phenotype. Conversely, reverse
screens involve disruption of a known gene to observe a change in phenotype (Alonso and Ecker,
2006; Ajjawi et al., 2010). The model plant, Arabidopsis, has been widely used to study plant
genetics. An array of tools, such as Agrobacterium-mediated T-DNA transformation and
transposon mutagenesis have been used to create mutant libraries that can be screened for
phenotypes and mutant gene identification (Weigel et al., 2000; Sedbrook et al., 2004). Insertion
of an Agrobacterium-derived T-DNA into the plant genome does not occur uniformly, as there is
a bias towards actively transcribed regions of the genome (Schneeberger et al., 2005). Within
these gene-coding regions, T-DNA insertions are more likely to occur in intergenic regions as
opposed to within genes. However, when inserted into genes, insertions are more likely to be
found in the 5’ non-coding, 3’ non-coding and promoter regions, as opposed to within introns
and exons (Alonso et al., 2003). On average, there are 1.5 T-DNA insertions per transformed
Arabidopsis line (Alonso and Ecker, 2006). This requires that a large number of mutants be
screened to allow for sufficient coverage of the approximately 25,000 genes in the Arabidopsis
genome.
Arabidopsis T-DNA mutants can be used to study both gain-of-function or loss-of-
function mutations. In the case of loss-of-function mutants, the T-DNA typically inserts into the
coding region of gene, resulting in gene inactivation. Gain of function mutations can occur in the

37
form of enhanced gene expression. To identify gain-of-function mutants, transformation vectors
containing cauliflower mosaic virus (CaMV) 35S enhancers can be used to produce activation
tagged lines. The enhancer increases the expression of genes up to 3.6 kb away from the
integration site, both upstream and downstream from the gene (Weigel et al., 2000). Unlike the
constitutive 35S promoter which causes ectopic expression of genes that are not normally
expressed, the 35S enhancer only increases expression of genes that are endogenously expressed
(Hull et al., 2000; Weigel et al., 2000). Activation tagged libraries are publicly available through
the Arabidopsis Biological Resource Center (ABRC). The seeds of these libraries are divided
into pools to increase screening efficiency. By pooling a large number of lines collectively, this
decreases the amount of sample handling and sample tube number. Additionally, positive
mutants can be recovered by revisiting the appropriate pool if any issues arise.
Previous work conducted in the Muench lab demonstrated that wild-type Arabidopsis,
when exposed to various NAs and the AEO fraction of OSPW, exhibited reduced growth
phenotypes (Leishman et al., 2013). Impaired root and shoot growth increased with increasing
concentrations of OSPW treatment, whereas seed germination was not impaired significantly
with OSPW exposure up to 75%. At lower pH, NAs were more toxic to Arabidopsis growth, as
was shown previously in other plant species (Armstrong et al., 2009). A forward genetic screen
approach was later performed using Arabidopsis T-DNA activation tagged lines to identify
mutants that demonstrated germination and seedling growth on media containing high
concentrations of NA (J. Wong, PLBI 530 Undergraduate Research Project, University of
Calgary). The aim of this screen was to identify plant genes that confer tolerance to NAs and that
could biotransform NAs and be applied to phytoremediation strategies. In this screen, 20,000

38
activation-tagged Arabidopsis lines were exposed separately to two NA types: 1-
adamantanecarboxylic acid (AdCA) and decahydro-2-naphthoic acid (DH2NA) (Figure 3.1).
Figure 3.1: Structures of AdCA and DH2NA. 1-adamantanecarboxylic acid (left) has a
diamondoid ring arrangement. Decahydro-2-naphthoic acid (right) is a two-ring NA.
AdCA, a model NA, has been identified in the AEO fraction isolated from oil sands process-
affected water (OSPW). DH2NA, a surrogate NA, has not been confirmed as a component of
OSPW but served as a representative two-ringed NA for this screen. Tolerant lines were
identified in a primary screen, and the selfed progeny from the primary screen were subjected to
a secondary screen on both NA types to verify the NA tolerant phenotype. Six mutant lines
emerged as NA tolerant from this secondary screen.
In this chapter, results relating to the characterization of these mutants are presented. The
inheritance pattern of these mutants was studied, and several approaches were used to identify
the sites of the T-DNA insertion. The expression effects that the T-DNA insertion exerted on
adjacent genes was also analyzed.

39
3.2 Results
3.2.1 Screen summary and characterization of the selected NA tolerant Arabidopsis lines
The 20,000 activation-tagged lines of Arabidopsis that were previously screened on 0.5X
MS agar plates containing either AdCA or DH2NA yielded six lines that were NA tolerant. In
summary, AdCA screening plates contained 60 mg/L of this model NA, while DH2NA plates
contained 30 mg/L of this surrogate NA. After two weeks of growth at a photoperiod of 16
hours, enhanced growth phenotypes such as increased cotyledon growth, root growth, green
leaves and the presence of true leaves were used to identify NA tolerant mutants. Mutants were
compared to either Col-2 or Col-7 wild-type Arabidopsis ecotypes, depending on the genetic
background of a given pool. Of the 20,000 lines screened, 151 individual plants were recovered
from the primary screen. The seeds produced from the primary screen mutants were subjected to
a secondary screen to verify that the NA tolerance was genetically heritable and not the result of
leakiness through the primary screen (Figure 3.2). The criteria used in the primary screen were
also used to identify tolerant seedlings in the secondary screen. In the secondary screen, seeds
from all lines were grown on separate AdCA and DH2NA plates to determine if tolerance to one
NA also conferred tolerance to the other. Of the 151 individuals that passed the primary screen,
six NA tolerant mutant lines (CS23120 A3, CS23127 A1, CS23152 A1, CS23152 A2, CS23838
D1, CS31166 A1) were obtained. Naming of mutants was based on their corresponding pool
name, followed by the initial of the compound that they were successfully screened on (denoted
by A for AdCA and D for DH2NA), followed by a number to differentiate the identity of tolerant
individuals that were obtained from the same pool of seeds. Subsequent numbers in the code
(e.g., -1, -2, -3, etc.) identified the individual progeny line that was derived from the secondary
screened plants. Of the six NA tolerant mutant lines that were identified in this screen, four were
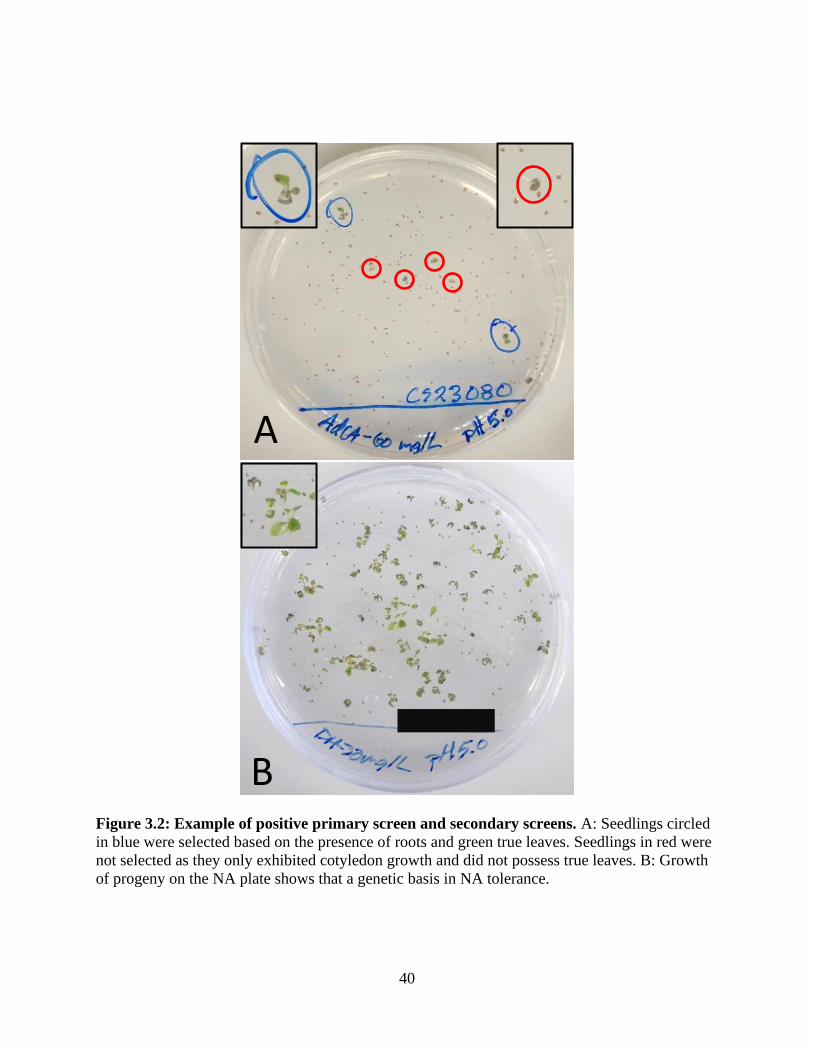
40
Figure 3.2: Example of positive primary screen and secondary screens. A: Seedlings circled
in blue were selected based on the presence of roots and green true leaves. Seedlings in red were
not selected as they only exhibited cotyledon growth and did not possess true leaves. B: Growth
of progeny on the NA plate shows that a genetic basis in NA tolerance.
B
A

41
tolerant to both NAs (Table 3.1). The two remaining mutants were tolerant for growth to only
AdCA (Table 3.1).
Table 3.1: Percent growth* on AdCA and DH2NA of lines that passed the secondary screen
Mutant Percent growth on AdCA Percent growth on DH2NA
CS23120 A3 34% 30%
CS23127 A1 10% 0%
CS23152 A1 15% 32%
CS23152 A2 27% 22%
CS23838 D1 50% 30%
CS31166 A1 14% 0%
*Percent growth refers the number of seedlings possessing cotyledons and true leaves.
These mutants were further characterized in this thesis research. The progeny of the
positive mutant lines from the secondary screen were then screened on the NA from which they
were first identified, as well as on Basta-containing agar plates to determine if the lines were
homozygous or heterozygous for the T-DNA insertion (Table 3.2). Basta was used because the
expressivity of the NA-tolerant phenotype was generally reduced on the NA plates. Basta
tolerance provided a more reliable determination of the presence or absence of the T-DNA
insertion than did NA tolerance. Wild type Col-7 seedling growth was not observed on plates
containing AdCA, DH2NA or Basta, whereas growth on control MS plates ranged from 93.9% to
97.0% (Table 3.2).
Several of the mutant progeny lines were tested on NA and Basta plates to determine the
inheritance patterns of the T-DNA insertions in these lines. All five of the tested CS23152 A2-
progeny lines demonstrated tolerance to AdCA with a range of 39.4% to 56.9% of the plants
42
showing growth phenotypes. However, these lines had a 0% survival rate on Basta plates,
indicating that the Basta gene expression within the T-DNA insertion was lost in this line. Three
of the CS23838 D1 progeny lines had DH2NA growth rates ranging from 28.6% to 34.2% and
had Basta rates of 52.9% to 63.8%, whereas CS23838 D1-1 did not demonstrate DH2NA or
Basta resistance. Three of the CS23127 A1 progeny lines showed AdCA growth rates of 30.5%
to 53.2% and Basta resistance rates of 62.1% to 66.1%, whereas CS23127 A1-3 did not tolerate
AdCA or Basta. Growth rates on MS plates were low for CS23127 A1-2 and CS23127 A1-5
likely due to seeds not being fully mature when harvested. All four of the CS23120 A3 progeny
lines had similar levels of AdCA and Basta tolerance, with growth rates of 60.6% to 69.5% and
91.5% to 98.8%, respectively. Three of the CS23152 A1 progeny lines grew on AdCa and Basta
with growth rates of 51.5% to 59.5% on AdCa and 64.7% to 71.4% on Basta. CS23152 A1-8 did
not grow on either AdCA or Basta. Three of the CS31166 A1 progeny lines tolerated AdCA and
Basta, with growth rates ranging from 46.5% to 57.8% and 64.0% to 67.9% respectively.
CS31166 A1-5 did not tolerate AdCA nor Basta as 1.9% of the seeds grew on AdCA and 0%
grew on Basta.
Additional lines were screened on Basta plates only to provide more insight into the
zygosity of the secondary screen-derived lines (Table 3.3). Of ten CS23152 A1 progeny lines,
five demonstrated high frequency of tolerance to Basta, with growth rates ranging from 93.0% to
98.6%. Three of the lines had lower tolerance frequencies, (72.3% to 75.4%), and two lines did
not demonstrate tolerance to Basta. The two CS23152 A2 progeny lines that were screened did
not tolerate growth on Basta, similar to the previous five lines that were screened (Table 3.2).
Both CS23120 A3 progeny lines showed 100% growth rates on Basta. Two of the three CS23127
A1 progeny lines showed Basta growth rates of 59.8% and 64.7%, while CS23127 A1-3 did not

43
Table 3.2: Percentage of seeds demonstrating strong growth phenotypes on NA, Basta and
0.5X MS agar plates.
Plant ID NA Positive %* Basta Positive % MS Positive % Zygosity
Col-7 (on DH) 0.00 0.00 97.00 -/-
Col-7 (on AdCA) 0.00 0.00 93.91 -/-
CS23152 A2-1** 50.68 0.00 97.17 ?
CS23152 A2-2 56.93 0.00 93.68 ?
CS23152 A2-3 44.44 0.00 92.08 ?
CS23152 A2-4 40.24 0.00 93.75 ?
CS23152 A2-9 39.44 0.00 92.55 ?
CS23838 D1-1 3.70 3.77 97.00 -/-
CS23838 D1-3 34.15 63.83 98.82 +/-
CS23838 D1-4 32.65 52.94 99.05 +/-
CS23838 D1-5 28.57 55.06 94.21 +/-
CS23127 A1-2 30.47 66.15 74.38 +/-
CS23127 A1-5 53.24 67.21 79.71 +/-
CS23127 A1-3 0.00 0.00 96.97 -/-
CS23127 A1-6 52.55 62.16 93.58 +/-
CS23120 A3-3*** 60.61 96.77 96.43 +/+
CS23120 A3-4 65.81 98.80 95.65 +/+
CS23120 A3-9 69.50 96.88 98.08 +/+
CS23120 A3-10 66.47 91.45 96.08 +/+
CS23152 A1-3 51.48 65.52 95.88 +/-
CS23152 A1-5 53.24 71.43 97.03 +/-
CS23152 A1-6 59.54 64.71 94.53 +/-
CS23152 A1-8 0.00 0.00 100.00 -/-
CS31166 A1-1 57.76 64.00 94.90 +/-
CS31166 A1-3 52.10 63.39 97.06 +/-
CS31166 A1-4 46.51 67.92 88.18 +/-
CS31166 A1-5 1.90 0.00 94.74 -/-
* Seeds were screened on the NA on which the mutant on which it was recovered from initially.
** Highlighted in yellow are lines that likely have a truncated T-DNA insertion.
*** Highlighted in green are lines that appear to be homozygous for the T-DNA insertion.

44
grow. Three of the CS23838 D1 progeny lines tolerated Basta with growth rates ranging from
90.5% to 100%. CS31166 A1-2 had a 73.1% growth rate on Basta.
Overall, the NA and Basta growth assays assisted in elucidating the relationship between
NA tolerance and genetic heritability of the T-DNA insertion. With a single exception, the
percentage of NA tolerant seeds of a line is consistently lower than the percentage that grow on
Basta. The Basta segregation ratios provide insight regarding the heritability of the T-DNA
insertion. If approximately 100% of the seeds are positive on Basta plates, then the line is
homozygous for the insertion. Heterozygous plants screened on Basta will exhibit close to a 3:1
ratio of positive to negative seeds. The only exception observed was in the CS23152 A2 progeny
lines as they failed to produce any Basta tolerant offspring but also demonstrate NA tolerance.
Based on this data, the predicted inheritance pattern of each of the lines is shown in Table 3.2
and Table 3.3.
3.2.2 PCR genotyping using genomic DNA
Amplification of the Basta resistance gene using genomic DNA templates from the
selected mutant lines was also used as a marker to determine the zygosity of the T-DNA
insertion in the mutants. The expected product size for the Basta specific primer pair was 201 bp
(see Methods, Table 2.1). Lines in which all the progeny produced this PCR product were
considered homozygous for the T-DNA insertion. If PCR products were not produced in
approximately one-quarter reactions, then the line is likely heterozygous for the T-DNA
insertion. DNA was extracted from 20 two-week old progeny seedlings from lines CS23120 A3-
4, CS23127 A1-2, CS23152 A1-20-3, CS23152 A2-1, CS23838 D1-3 and CS31166 A1-1. The

45
Table 3.3: Percentage of seeds demonstrating strong growth phenotypes on Basta and 0.5X
MS agar plates.
Plant ID Basta Positive % MS Positive % Zygosity
Col-2 0.00 97.33 -/-
Col-7 1.54 100.00 -/-
CS23152 A1-11 0.00 90.22 -/-
CS23152 A1-12 75.23 99.03 +/-
CS23152 A1-13 72.34 94.96 +/-
CS23152 A1-14 98.57 99.24 +/+
CS23152 A1-15 0.00 96.72 -/-
CS23152 A1-16 95.65 97.81 +/+
CS23152 A1-17 94.87 91.67 +/+
CS23152 A1-18 93.02 92.13 +/+
CS23152 A1-19 75.42 95.36 +/-
CS23152 A1-20 98.11 98.46 +/+
CS23152 A2-2 0.00 97.08 ?
CS23152 A2-5 0.00 100.00 ?
CS23120 A3-2 100.00 100.00 +/+
CS23120 A3-5 100.00 100.00 +/+
CS23127 A1-1 64.66 75.93 +/-
CS23127 A1-3 0.00 47.89 -/-
CS23127 A1-6 59.79 55.38 ?
CS23838 D1-1 90.54 83.33 +/+
CS23838 D1-2 100.00 98.68 +/+
CS23838 D1-4 92.68 94.38 +/+
CS31166 A1-2 73.08 100.00 +/-

46
success of DNA preparations varied between lines (Figure 3.3). PCR was performed only with
the successful DNA preparation samples.
Two of the tested mutants (CS23120 A3-4 and CS23120 A1-20-3) were determined to be
homozygous, as all of the PCR reactions showed the expected band size (Figure 3.4). This is
consistent with the results from the Basta growth assays where 98.8% and 98.1% of the
respective line demonstrated Basta resistance (Table 3.2 and Table 3.3). CS23127 A1-2,
CS31166 A1-1 and CS23838 D1-3 appeared heterozygous for the insertion. The PCR
genotyping results obtained from these matched the results obtained from the Basta screen.
CS23127 A1-2 seedlings were 78.9% positive by PCR testing, while 66.2% were positive on
Basta. CS31166 A1-1 seedlings were 75% positive with PCR genotyping, while 64.0% were
positive on Basta. Finally, CS23838 D1-3 seedlings were 88.9% positive with PCR genotyping,
while 63.8% were positive on Basta (Table 3.2 and 3.3). None of the CS23152 A2-1 seedlings
produced the PCR product, which is consistent with the Basta growth assays (Table 3.2 and
Table 3.3). A summary of the results is provided in Table 3.4.
3.2.3 Characterization of the T-DNA insertion sites using TAIL-PCR
TAIL-PCR was the first technique used to determine the T-DNA insertion sites in the
mutants. A successful TAIL-PCR reaction is characterized by an approximately 50 base pair
decrease in size of tertiary TAIL-PCR products relative to the secondary TAIL-PCR products.
This is because the tertiary TAIL-PCR reaction included a nested primer (LB3) that anneals to
the products produced by the secondary TAIL PCR reaction (see Methods, Figure 2.3). All six
mutants that were recovered from the secondary screen were characterized in the TAIL-PCR

47
Figure 3.3: CTAB DNA preparations carried out on 20 seedlings for each listed mutant.
The uppermost band is genomic DNA. The middle band is 28S rRNA and the lowest band is 18S
rRNA. Red asterisks identify samples with unsuccessful PCR reactions.
* * *
*
* * * *
* * * *
* * * *
CS23120 A3-4
CS23127 A1-2
CS23152 A2-1
CS23152 A1-20-3
CS23838 D1-3
CS31166 A1-1
-10 kbp
-10 kbp
-10 kbp
-10 kbp
-10 kbp
-10 kbp

48
Figure 3.4: Confirmation of the presence of the Basta marker in the genomic DNA of
progeny from mutants using PCR. The Basta PCR products at the expected size (201 bp) are
shown. Red asterisks identify samples that lacked the 201 bp PCR product.
Table 3.4: Summary of the Basta PCR results and comparison to Basta assay.
Plant ID Positive Negative
Percent
Positive
(PCR)
Percent
Positive
(Basta plate)
Predicted
Zygosity
CS23120 A3-4 17 0 100 98.8 Homozygous
CS23127 A1-2 14 5 73.4 66.2 Heterozygous
CS23152 A1-20-3 20 0 100 98.1 Homozygous
CS23152 A2-1 0 16 0 0 Unknown
CS31166 A1-1 12 4 75.0 64.0 Heterozygous
CS23838 D1-3 14 2 87.5 63.8 Heterozygous
* * * * *
* * * * * * * * * * * * * * * *
*
*
* * * *
*
CS23120 A3-4
CS23127 A1-2 CS23152 A1-20-3 CS23152 A2-1 CS31166 A1-1 CS23838 D1-3

49
assays. Despite multiple attempts, only one mutant (CS23838 D1) was successfully characterized
with this technique. Two distinct PCR products were amplified in the secondary and tertiary
PCR reactions using genomic DNA from this line (Figure 3.5). The pairwise band shifts of these
three pairs of products were approximately 50 nucleotides in size. Sanger sequencing of the 700
bp and 450 bp tertiary products both revealed that the T-DNA insertion in CS23838 D1 was
within intron 3 of the GLABRA2 homeobox gene (GL2, AT1G79840) (Figure 3.6).
Repeated attempts at TAIL-PCR with the other mutants were not successful. Reactions
using different lines (CS23120 A3, CS23127 A1, CS23152 A1 and CS31166 A1) resulted in the
consistent amplification of an unknown 1000 bp product (Figure 3.7). Sanger sequencing of the
product was unsuccessful. DMSO (2% and 5%) was added to the reactions to determine if any
additional products were produced in an effort to increase the binding specificity of the primers.
No additional products were found, although the unknown 1000 bp product persisted with 2%
DMSO increasing the intensity of the bands. The addition of 5% DMSO increased the specificity
of the reaction for the 1000 bp band (Figure 3.7).
3.2.4 Characterization of mutants using targeted gene sequencing
With limited success in identifying the T-DNA insertion sites in all but one mutant using
TAIL-PCR, a targeted gene sequencing technique was attempted. In summary, this approach
uses Illumina massively parallel sequencing to generate reads specific to the T-DNA insertion
and the adjacent genomic DNA. This requires the use of a custom primer that anneals to the
vector sequence and contains a tag sequence that allows for the addition of Illumina adapters.
Primers selected for this purpose are situated close to the left border of the T-DNA insertion to
allow for sequencing into the flanking genomic sequence. This results in hundreds to thousands

50
Figure 3.5: TAIL-PCR reactions for CS23838 D1. Agarose gel (2%) showing two secondary
and tertiary TAIL PCR products (red and blue bands, respectively). The red and blue labelled
bands from the tertiary sample were extracted and sequenced. Note the characteristic 50 base
pair decrease in size between the TAIL-2 and TAIL-3 reactions.
100 bp -
500 bp -
750 bp -
- -
- -

51
3’-
TTGACCTGGCGAGGGGCCAGCCCTAGTTGCTTGCTCAGCTGCTGTCTTTGCTTCTCGTCCGGATGTGGTGTCT
CTTTGAATAGCctgcaacgtcctcaaattcagacatttctaaaagatgaaaatctttacatgcaactgaaccc
taactaggcatatgtatactattactgatcagctttaattgtgatgaaacaaattaacactttattgtttaag
cctttatatacgttataacgcgcatgtacctacagtcatgtcaggagaagacggggaataataacgagtaagc
gtccgaaaccatataagcgcattgaaactaatgctggatcatatatcatcgatcggcaatatatttgtatgaa
tacatcatctaagtatatatatgtatgtgaaattaatggagaattgaaggtgcgtaattgagaattgctcttc
aacgcaagacaccttctccttcttccactaattaagtactacag...ATTACTCTTTCTTTTCCTCCATATTG
ACCATCATACTCATTGCTGATCCATGTAGATTTCCCGGACATGAAGCCATTTACAATTGAATGAAtatatacc
gaagaaagggattaaaatcataattacttataaaacatcaagaaatatgagcaccggaaaaaacaactaatga
atgtttcttgatagaagctagccctaatgaatcggaatcccctaattaagtgttttaatttgtgaagcataat
tattaagtttatacttattaaaaagtggggtggggggtttaattagttagctaggtaaggatggaataattat
atcgaacgtacGCTTCCATGTGTCTGATCTGATCGGTGGTGTGACGATGATACTTCTTCCTCTTTCTCTTATT
AGTGCCCTTGTTTCCAGCTGCGCCGTCCTCCTCTTCCTCCTCCTCATCGTCGTGATCCTCACCCTCCAAATCC
TCCTCTGATCTGGATCTCGTGGGTCCTGAGTTCTCGCTGCTCATCTCCACAGTGCGATCCTCATCGTCAACTA
CTCTTCTGCCCAGGAAATCCTCCTCAGGGTTGGTGCTGCCGGAGGATGCATTCCGGAATATCCCAGCctgtat
atattcctatctccattaaaatcaagacatatatataatatatgtttatgtgagagctagcaagtacatgtat
gtagaaaagagagagtagtatacGAGAGATAGAGAGAGGGCTGGAGAGGAGAAAAAGTCTTTGGTGGGTTGTT
TGGAAGACATGTCGACGGCCATTGACATACAAATCCTGTCCCTAGCTAGCTTCTTTGcttaattatgatctct
tccctcttctcctcgcactccttcttccttatatattatctctctttttttctttcttctttaattacttata
caccaaaatgtactttcaattaatatataagctaagatcgatatatatatatatatatatatatatagcctct
tcaattccaatgatacatatatatataagcggtcgtttttcagatatttcttccatttctctactgctcttga
cttttaggtgcttcttttataattaattagttttaattaattaatacctattatattattatatttagtcctt
ttacggttttatatattttggctatacttcaatccgacAATTGAGTAGTTTAAAACATGGCCAGCTACAGCAT
TGGCAGCCATCGATCGACTTCATttttcttcttaatattcgatttttaatatatacatatatatatgatgagc
aaaattcaaatttgaattatggaaaatatatcagccttccaatttcagctactaactttaatatgaattatgt
-5’
Legend:
T-DNA Insertion Sequence Match Translational start/end
UTR Intron Exon
Figure 3.6: Sequence of the T-DNA insertion site in the GL-2 gene intron in line CS23838
D1-3. Sequencing results from the 450 bp product read through the T-DNA sequence (red
highlight) and into the flanking GL-2 gene sequence (yellow highlight). For simplicity, the T-
DNA sequence shown is incomplete, and only shows part of the left border sequence. Introns
(purple letters), exons (orange letters), 5’ untranslated region (red letters) and the translation start
codon (blue highlight) are identified. The GL-2 sequence shown is reading off of the antisense
strand. The black arrow indicates the directionality of the sense strand.
GL2 (AT1G79840)

52
Figure 3.7: Unknown TAIL-PCR products. PCR products appear to be approximately 900-
1000 bp in size and can appear with different templates. Upon Sanger sequencing, results do not
end in discernable sequence.
H2O
CS23120 A3
CS23127 A1
- 1000 bp
- 1000 bp
- 1000 bp
CS31166 A1
CS23152 A1 - 1000 bp
- 1000 bp

53
of reads of differing lengths that have overlapping sequences. Clustering of these reads indicates
the presence of an insertion site.
The insertion sites of four of the six mutant lines were successfully identified using the
targeted gene sequencing technique. The previously characterized CS23838 D1-3 line that was
shown by TAIL-PCR to contain the insertion within the GL-2 gene was used as a positive
control to test the reliability of this method. The targeted gene sequencing approach successfully
identified the insertion site in intron 3 of GL2 as was obtained for the TAIL-PCR approach
(compare Figure 3.6 and Figure 3.8). The identification of T-DNA insertion loci using targeted
gene sequencing was also successful for lines CS23152 A1-6, CS23120 A3-4 and CS23127 A1-
2. CS23152 A1-6 contained a single T-DNA insertion in the intergenic region between the
Heavy Metal Associated Isoprenylated Plant Protein 25 (HIPP25, AT4G35060.1) gene and the
S-ribonuclease binding protein family protein gene (SRBP, AT4G35070.1) (Figure 3.9). The
insertion was situated approximately 1000 bp from the start of the 5’ UTR of the HIPP25 gene
and 6000 bp from the end of the 3’ UTR of S-ribonuclease binding protein family protein gene.
Three distinct T-DNA insertions were found in CS23127 A1-2. The first insertion was located 29
bp from the 3’ UTR of a S-adenosyl-L-methionine-dependent methyltransferase (SAM) gene
(AT4G18030.1) and 4563 bp from the 5’ UTR of, the Pseudo-Response Regulator 2 (APRR2)
gene (AT4G18020.1) (Figure 3.10). The second insertion site was situated in exon 1 of
DUF1421, or formin-like gene (AT4G28300.1) (Figure 3.11). The third T-DNA insertion
occurred in exon 13 of the ATGRIP gene (AT5G66030.1) (Figure 3.12). CS23120 A3-4
contained a single T-DNA insertion that had been integrated into the intron 11 of a Leunig
Homolog gene (AT2G32700.7) (Figure 3.13).

54
3’-
TTGACCTGGCGAGGGGCCAGCCCTAGTTGCTTGCTCAGCTGCTGTCTTTGCTTCTCGTCCGGATGTGGTGTCT
CTTTGAATAGCctgcaacgtcctcaaattcagacatttctaaaagatgaaaatctttacatgcaactgaaccc
taactaggcatatgtatactattactgatcagctttaattgtgatgaaacaaattaacactttattgtttaag
cctttatatacgttataacgcgcatgtacctacagtcatgtcaggagaagacggggaataataacgagtaagc
gtccgaaaccatataagcgcattgaaactaatgctggatcatatatcatcgatcggcaatatatttgtatgaa
tacatcatctaagtatatatatgtatgtgaaattaatggagaattgaaggtgcgtaattgagaattgctcttc
aacgcaagacaccttctccttcttccactaattaagtactacag...TGAAtatataccgaagaaagggatta
aaatcataattacttataaaacatcaagaaatatgagcaccggaaaaaacaactaatgaatgtttcttgatag
aagctagccctaatgaatcggaatcccctaattaagtgttttaatttgtgaagcataattattaagtttatac
ttattaaaaagtggggtggggggtttaattagttagctaggtaaggatggaataattatatcgaacgtacGCT
TCCATGTGTCTGATCTGATCGGTGGTGTGACGATGATACTTCTTCCTCTTTCTCTTATTAGTGCCCTTGTTTC
CAGCTGCGCCGTCCTCCTCTTCCTCCTCCTCATCGTCGTGATCCTCACCCTCCAAATCCTCCTCTGATCTGGA
TCTCGTGGGTCCTGAGTTCTCGCTGCTCATCTCCACAGTGCGATCCTCATCGTCAACTACTCTTCTGCCCAGG
AAATCCTCCTCAGGGTTGGTGCTGCCGGAGGATGCATTCCGGAATATCCCAGCctgtatatattcctatctcc
attaaaatcaagacatatatataatatatgtttatgtgagagctagcaagtacatgtatgtagaaaagagaga
gtagtatacGAGAGATAGAGAGAGGGCTGGAGAGGAGAAAAAGTCTTTGGTGGGTTGTTTGGAAGACATGTCG
ACGGCCATTGACATACAAATCCTGTCCCTAGCTAGCTTCTTTGcttaattatgatctcttccctcttctcctc
gcactccttcttccttatatattatctctctttttttctttcttctttaattacttatacaccaaaatgtact
ttcaattaatatataagctaagatcgatatatatatatatatatatatatatagcctcttcaattccaatgat
acatatatatataagcggtcgtttttcagatatttcttccatttctctactgctcttgacttttaggtgcttc
ttttataattaattagttttaattaattaatacctattatattattatatttagtccttttacggttttatat
attttggctatacttcaatccgacAATTGAGTAGTTTAAAACATGGCCAGCTACAGCATTGGCAGCCATCGAT
CGACTTCATttttcttcttaatattcgatttttaatatatacatatatatatgatgagcaaaattcaaatttg
aattatggaaaatatatcagccttccaatttcagctactaactttaatatgaattatgttggaatgatataaa
-5’
Legend:
T-DNA Insertion Sequence Match Translational start/end
UTR Intron Exon
Figure 3.8: CS23838 D1-3 T-DNA insertion locus determined using targeted gene
sequencing. Targeted gene sequencing product read through the T-DNA sequence (red
highlight) and into the flanking GL-2 gene sequence (yellow highlight). For simplicity, the T-
DNA sequence shown is incomplete, and only shows part of the left border sequence. Introns
(purple letters), exons (orange letters), 5’ untranslated region (red letters) and the translation start
codon (blue highlight) are identified. The GL-2 sequence shown is reading off of the antisense
strand. The black arrow indicates the directionality of the sense strand.
GL2 (AT1G79840)
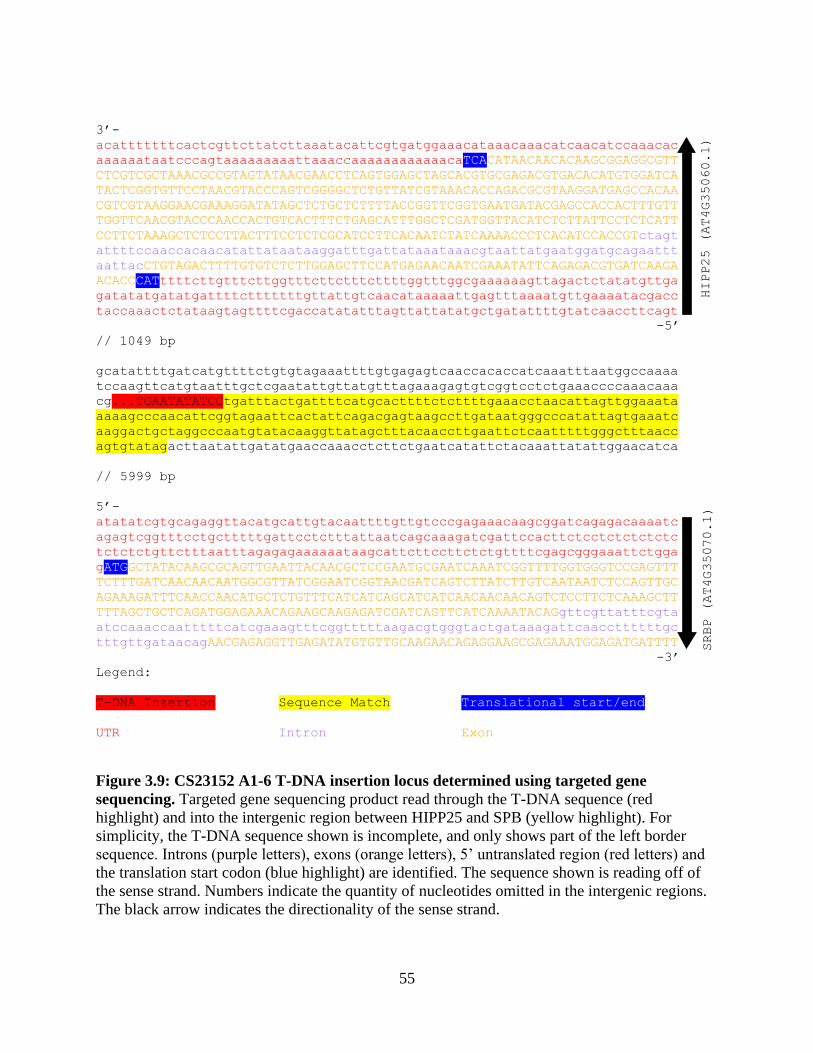
55
3’-
acatttttttcactcgttcttatcttaaatacattcgtgatggaaacataaacaaacatcaacatccaaacac
aaaaaataatcccagtaaaaaaaaattaaaccaaaaaaaaaaaacaTCACATAACAACACAAGCGGAGGCGTT
CTCGTCGCTAAACGCCGTAGTATAACGAACCTCAGTGGAGCTAGCACGTGCGAGACGTGACACATGTGGATCA
TACTCGGTGTTCCTAACGTACCCAGTCGGGGCTCTGTTATCGTAAACACCAGACGCGTAAGGATGAGCCACAA
CGTCGTAAGGAACGAAAGGATATAGCTCTGCTCTTTTACCGGTTCGGTGAATGATACGAGCCACCACTTTGTT
TGGTTCAACGTACCCAACCACTGTCACTTTCTGAGCATTTGGCTCGATGGTTACATCTCTTATTCCTCTCATT
CCTTCTAAAGCTCTCCTTACTTTCCTCTCGCATCCTTCACAATCTATCAAAACCCTCACATCCACCGTctagt
attttccaaccacaacatattataataaggatttgattataaataaacgtaattatgaatggatgcagaattt
aattacCTGTAGACTTTTGTGTCTCTTGGAGCTTCCATGAGAACAATCGAAATATTCAGAGACGTGATCAAGA
ACACCCATttttcttgtttcttggtttcttctttcttttggtttggcgaaaaaagttagactctatatgttga
gatatatgatatgattttctttttttgttattgtcaacataaaaattgagtttaaaatgttgaaaatacgacc
taccaaactctataagtagttttcgaccatatatttagttattatatgctgatattttgtatcaaccttcagt
-5’
// 1049 bp
gcatattttgatcatgttttctgtgtagaaattttgtgagagtcaaccacaccatcaaatttaatggccaaaa
tccaagttcatgtaatttgctcgaatattgttatgtttagaaagagtgtcggtcctctgaaaccccaaacaaa
cg...TGAATATATCCtgatttactgattttcatgcacttttctcttttgaaacctaacattagttggaaata
aaaagcccaacattcggtagaattcactattcagacgagtaagccttgataatgggcccatattagtgaaatc
aaggactgctaggcccaatgtatacaaggttatagctttacaaccttgaattctcaatttttgggctttaacc
agtgtatagacttaatattgatatgaaccaaacctcttctgaatcatattctacaaattatattggaacatca
// 5999 bp
5’-
atatatcgtgcagaggttacatgcattgtacaattttgttgtcccgagaaacaagcggatcagagacaaaatc
agagtcggtttcctgctttttgattcctctttattaatcagcaaagatcgattccacttctcctctctctctc
tctctctgttctttaatttagagagaaaaaataagcattcttccttctctgttttcgagcgggaaattctgga
gATGGCTATACAAGCGCAGTTGAATTACAACGCTCCGAATGCGAATCAAATCGGTTTTGGTGGGTCCGAGTTT
TCTTTGATCAACAACAATGGCGTTATCGGAATCGGTAACGATCAGTCTTATCTTGTCAATAATCTCCAGTTGC
AGAAAGATTTCAACCAACATGCTCTGTTTCATCATCAGCATCATCAACAACAACAGTCTCCTTCTCAAAGCTT
TTTAGCTGCTCAGATGGAGAAACAGAAGCAAGAGATCGATCAGTTCATCAAAATACAGgttcgttatttcgta
atccaaaccaatttttcatcgaaagtttcggtttttaagacgtgggtactgataaagattcaaccttttttgc
tttgttgataacagAACGAGAGGTTGAGATATGTGTTGCAAGAACAGAGGAAGCGAGAAATGGAGATGATTTT
-3’
Legend:
T-DNA Insertion Sequence Match Translational start/end
UTR Intron Exon
Figure 3.9: CS23152 A1-6 T-DNA insertion locus determined using targeted gene
sequencing. Targeted gene sequencing product read through the T-DNA sequence (red
highlight) and into the intergenic region between HIPP25 and SPB (yellow highlight). For
simplicity, the T-DNA sequence shown is incomplete, and only shows part of the left border
sequence. Introns (purple letters), exons (orange letters), 5’ untranslated region (red letters) and
the translation start codon (blue highlight) are identified. The sequence shown is reading off of
the sense strand. Numbers indicate the quantity of nucleotides omitted in the intergenic regions.
The black arrow indicates the directionality of the sense strand.
HIPP25 (AT4G35060.1)
SRBP (AT4G35070.1)

56
3’- GGATGAGGTTGATGTTTTGAATGATGTGAGGAAGATCGTTGATGGAATGAGATGGGATACTAAGTTAATGGAT
CATGAAGACGGTCCTCTCGTGCCGGAGAAGATTCTTGTCGCCACGAAGCAGTATTGGGTAGCCGGCGACGATG
GAAACAATTCTCCGTCGTCTTCTAATAGTGAAGAAGAATAAaacaaaaacaaaaaactcctcaggtattgtag
ttacagtccctgtactttacattttttaccagatttgactacgaacttttgttaagatcaattaaacccaaat
tccttctttttcctttgttactcttatgattgagtttgttttttctttctttctttcaggttactaagcttga
agtgtagatctattttacaacatctggaaaattcttatcaaaaaaggaaggaatcagaatttccattaaagaa
aggtgtcaaaaaaaagttgtaaaactatatagtagtgatcaagacgaatatgtgcatttatgttttatttttg
ttccctagtttttaattttatttttttgaaggaagaaaaaattagttccatgtgtttttgcaagatagttgaa
accttggacgcttgttatgtatgatgcgatcttgacattttttaataacagttattttaaataaatttatgat
ataaacggaaacttctagatagttttaaataacataaaattagtagaa...TGAATATATCCTGCAAAACCaa
tatcaataacagttcgatgacattattgtagggaaattgattcatatgtgggtcgctattgtacgtaaatgga
tactactgttttggaagaaagctatagttgtcatgggtcaccttttgtctcatgactctcatcatacatttat
agattacatatttacattatcataacattttacacatattgatataactatctctaataaaaaaaaaacacaa
tctaactttatagcacataagtattaaacataatgaatttatccccaacagt
-5’
// 4312 bp
5’-
Aggtttagattttttcttgtattgttataggaaattaatcctatatattgattaataaagacaaaaataataa
ttaatccttatctcttttttcctctaacctcagttaacctttatcttagtaagactttttattctctttatct
ctgtgcataacccaatgacaagaacaacactagtcaccaacttattataactcttcatccattttctctctct
caaagtcaccccccaaatttttttatttttttttttaactttgaatgtgactcaggatagagagagggcgaga
cagataaagagagcttgaggaaggatttaagcagatctgcaagaaacactctctcaggtaaggtgagaactct
aaaatatgaatttactcatttgacttctgaattgtgaaagtttgtttgtttggttttaaatttccaaagcttt
tcttttgatcaattacatgttcattgcatgtgatgtgagcatgatctcttatctggatataagatcttctcct
tcttctgcttatggaaagaaaaaaacatcagttttatcgaaagtgcaacttatgatttgatcacaattctttt
tctctctgggtatatatctctctctcaatttccctaaattctagggatttgcctttctccttcattagttgtc
ataagcctatgttttagtatttgttaaaggtcattagtctgtgttgttaagttaactaatcactgcatgcacg
agttaaacaacactaaactaataatatattcactcttaaatgattcaaaagctttgttagatttcatggcatg
gtggtccactctttataaataacaaaatcaagttcctcatgaattattcttatctcatcaataatacacacac
cttttgaatatttacttttcttgtatctttattctgtctaatttttttgtttattctattcatttcccctttt
tttattaataaaatctagccagtgtttactttttttccgtagaatcaaaccggcggcgacagtgacggcggcg
aaaagcggcggtgttggccgcaaaaacgatgcaaaaccagctATGGTCATTACCGCTAACGATTTATCAAAAT
GGGAAAATTTTCCTAAAGGACTTAAGGTTCTTCTTCTCCTCAACGGCTGTGACAGCGACG
-3’
Legend:
T-DNA Insertion Sequence Match Translational start/end
UTR Intron Exon
Figure 3.10: The first of three T-DNA insertion loci in CS23127 A1-2 determined using
targeted gene sequencing. Targeted gene sequencing product read through the T-DNA
sequence (red highlight) and into the intergenic region between APRR2 and SAM (yellow
highlight). For simplicity, the T-DNA sequence shown is incomplete, and only shows part of the
left border sequence. Introns (purple letters), exons (orange letters), 5’ untranslated region (red
letters) and the translation start codon (blue highlight) are identified. The sequence shown is
reading off of the antisense strand. Numbers indicate the quantity of nucleotides omitted in the
intergenic regions. The black arrow indicates the directionality of the sense strand.
SAM (AT4G18030.1)
APRR2 (AT4G18020.1)

57
3’-
attaattttcacaatctatataaaacaaaagtgaagtaaagaaagcagcaaatcattgataagagattttggg
ttcaagaaaaacattgaaagtaacacatacacaaataataaggctttttaaagaaatataaattgagtcttat
aacaatacacaacagacccaatctattgggcccaataaaactagggcctctatagagtaacgcaaagaggagg
aggaagaggaagcacagttttattttgaaagatacacaagtagaggggagccatggcaTCACCATCCTCTGGG
AGGTCCTCCTGAGGACTGCCCACTCAATCTGTCGAGGAGGGTGTTGAAGTCGATGGGTTGGCCACTCTCTTCC
ATCCGCTGAATAACAGCCATGACATGGTCTCCTCTGAAACCCATGCTCACTAGCTTCTCTATCAGTTCACCGT
ATTTTGATCTCAACACAGGTGGTGCACCAATGTTACCGCCACCTGCCTGGTGCGGCTGGGGAGAGTATCCACC
ACCTTGTGGACCTTGCAAGTAATGGGCTTGCTGCTGCTGCTGCTGCGGCTGAGGTGGTGGGTATTGCATTCGC
CCACCTTCATACATGGCATTGGCATACCCGGAAGGAGGAGGAGGTCCTGAGGGTAGATACCCATCGCCAGTCT
GGGGGCTGTAAGACATCTTTGTCTGCTGAGGAGGAGCCTGTGGTGGTGGTGCAGCACCGTATCCGTAAGCTTG
CATAGACTGTTGAGGAGGTCCAGAGTATGGTGATTGCATCTGCATGCTGCTTGGCAACGATTCTACTGGCGGT
TGGTTGCCTGGTGGTGCAGGCGAGTATGTTGGGTAGCCTCCACTTGACTGTGGCCTGGCTTGTGGTTGGGGTG
GCCAGTTTTGCTGGTACTGCGGGAATGACTGAGTTTGGGCTGAGCTTGGGTGAGATGGAGCAGGAGGTGGGGG
CATGAACTGACTCTGCGCTGGTGGTGCTTGAAGTTGTGATGGTGGAGTAGAAACGGGCACCGGTGCAGGTGTG
TTTTGAAGCTGTGTAGGAGGAGGAGGCATGTAATACTGATGTTGTTGTGGCTGTGGCTGCGGCTGCACCTGTG
GCTGTGGGGCTATTTGGTGAGGCAAAGCAAGTGCAAGCTGCTGGTTGTGTGCATCAGAGGTGTTCTCGCTCTT
CTTAGGCTCTGGAACAGGAGTGGCGACACGGTCCTCACCATGTTGAGAGTGAGACGACGAAGATGACTCTTTC
TGCACAAGTTGTAGCTTCGCTAGCTCTTTCTGAGTATCTGCTAGCTCTTGTTTGTCTCTAAGAATCTGGACAG
ACCTATGCACctacaacagaacatccatggtcaattactgatcagagttttacaaactaaaattaacaaaaag
gattaaaaacattgcataacaataacaaacCTCTTGAAGATGTTTGTCGAGAGATCTAAGCTTCACATCGGCA
TCCTCATGTGCATGAGTCAACTCCGATCTCATTTCTCCAATGGTCTTATCAAGGTTGTAGCAGTAGAGTTCAA
GCTGAGACAAGCGTGAACTGAGGCCTTCAAGAAAGCGCATCATGTTATCAGCATACATCTTCATGGTCCTTTC
GACAGTGTCAGTAATGTCTTGGCTCAAAGAATCCTCTGGTGGACTGTAAGAGCTTGTAGGGAAAACCGAAGAC
CTTGCCATCCTTGTTTTATGGAATTCctacaagcaaaaaaatgaaacaataaacaaagactcgctcagtatat
ctgatcaaaagtggatgaaattttcttccaattgaaaataaggaggacaagcacagcttaacaagctctagtt
ccaagtcagattcatagctaaggcgtttccacagaacatagctcctcataagtcacaaccaacatagaaataa
ctagctaaattagctcaacactaagaggactagttcgatattgactcctcgaaattgtttttacacgtatctc
tgagcaaaccacaaatcaaaactctagattcccaaaaatcaaacaaaaatcgccgatcgagcaaaatacccga
acctaaaaaaaggaagaaaagggtaaatcagtgtggttaacCTTGTTGGAGTTGGAAGCAGCGATCGCAGGAT
CGGAGTGAG...TGAATATATCCTGACCATTAGAGGAGTCTTGGTTGGTGTAGTCATCATAAGAGCAAAGGAT
ATCATCGGAGCCAAAATCGAAACCTTTGGATCCTGAGTTGACCCGACCCGAAGATCCAGACGCCATtgaatcc
gaagactgaaaaccagattgagaaaaaagaatcgaaagaaggaaatctcgctttttagattaagtcttgggaa
aaaagcaaaagcgtggttcttcgttttcttcgaacctttgagaaaacgcaagcaaagagagaagcaagcagga
aaaaaacgtttgttttctctttattatatttttgctttttaatttgtttattacatattatatttttgctttt
-5’
Legend:
T-DNA Insertion Sequence Match Translational start/end
UTR Intron Exon
Figure 3.11: The second of three T-DNA insertion loci in CS23127 A1-2 determined using
targeted gene sequencing. Targeted gene sequencing product read through the T-DNA
sequence (red highlight) and into exon 1 of DUF1421 (yellow highlight). For simplicity, the T-
DNA sequence shown is incomplete, and only shows part of the left border sequence. Introns
(purple letters), exons (orange letters), 5’ untranslated region (red letters) and the translation start
codon (blue highlight) are identified. The sequence shown is reading off of the antisense strand.
Numbers indicate the quantity of nucleotides omitted in the intergenic regions. The black arrow
indicates the directionality of the sense strand.
DUF1421 (AT4G28300.1)

58
3’-
Tgagacccgttcaaattgattccgtacataacggttgaccaataacaacaagtcgacgaccgttattattata
ctatctttgtagttaattttgcgttgacttttttagtttcattaattccgataatcagcggttttctgcatga
ttacaatagactccattaaaaatggcccaacaactcaattcagtggcttatcctttctttacatctggacaaa
aagtgttttcttgacttttagtgttcattacacaaaaacgaaggacttaaacacaatgtcgtatgtatgtgta
tgtatcttggcccaaaagaatgtgtccagtgcccacccgaCTATGAAAACGAGAATCTTGAGAAGACTGATAG
ACCTGAACCCTCACTTGCCGGACTTGGAGTCGCCTCTGTTGTTGTTGCCGCTGTTGTTGAGCTATGGTAGGCT
TGCTGACACTTCTGGATCTCCTCTGGACTGAACTGCAGCAACATCCCCACTACAGGTAGTAAAGCCTCCACTT
CACctgcaattatcacaagttaatttac
// 2079 bp
agaaccaaaagaaaactatgtacCTCTTCTCTTGCACCTTTGAGTTCCGCATCTTTTGTGCTTAGTATCTGGG
TCTGCATGGACATTTCAGATCCCAGCTGACctgacaatttatatgaatgaaatgtctatagtccatagacaaa
agtaaaacataactagattagttcaacgtttatgaactccgtcaattacTTCTCATTT...TGAATATAGCCA
CTTCGATTTCGGCCTGTAAGTAGTTGCTTTCAGCGATTTCCAGTTTAGATTTAAGGGCATCGCATGAAGCTTC
CCAAGTCTCCTTTTCCTTTTCctaaaggaacaaaaaaaaatcatggcttctatgaattacaacaaaagaaaat
agaggaatttatatggccaaacaaatagaaactctaaacatgctgtctgatgacagactgacgccttagatca
tgtttacaattatctatacgcactcctatattcattccctggttaaaaccatgctagtaaatctgctaaatga
tggaaatcatttgacgagtagtatgcaaaacaatgtcttagaatatacgaatgggcaacaataacgaaggaca
aatgacagttggcatcagagagtcctgcgaatccatctttaaacattccacttacATTCTCTGATTTAAGGTG
// 1268 bp
GTCCAGGTCGGCATATTTCTCGTCGCGCTCTTTGATTTCCTGGTCCAGTTTCTGTTCAActacaccaacaatg
taatagcacaagttgagaaaaggcaaacactggttccggtcaatgaatgagcaaatagaaaagatggcttctg
acCTTGGGAAAACTTAGAGGAGTATTCTTGGGATTTAGCATCAGCCTCAGAGTATGCTTCCCTTAGATGCTCA
AGAGCTTGCTCAGCTGCAACTCGAGTTTGTTTTTCCACATCAATTTCTCTGCTCAATGATGCGACCTGTTCTT
GAAGTTGTTTCAGCTGAGCAGAGTCCGCTTCCACTTGCTCAGCTTTCTGGAGAGACCTACCTTGCGCTACCTC
ATCCTTGAGTCCCTCAAATTGGGATCTGAGAAAGTCATTTTCTAATCTCAGTTCAGCAATCATTTGGAGTAGC
TGATCACCATTTTCTGTCAGAGTCTCGTTGGAGGCATCATTTAACTCTTTATCTTCTTTGATCACATGGCTCT
CCTCTTCTTCTCCAACCACATCAGATTCCTTGTCTTCGGACATcttggcagagcagatgtcagaaagatgaac
ccagacactcaagagagcgacgacaactagtaagcgcaaaatcgggatttgaatcaacaatcaaaagagaaag
gagtcaagtcgtgaaattcgaataaaccagcaaaagcaacgcaaggagaagagagatttgaatgtaatcagtg
ccagagaagaagcttaccttgaggtgagggattagagaagagtgtggaggcagagagagagaggtcacaaaca
-5’
Legend:
T-DNA Insertion Sequence Match Translational start/end
UTR Intron Exon
Figure 3.12: The third of three T-DNA insertion loci in CS23127 A1-2 determined using
targeted gene sequencing. Targeted gene sequencing product read through the T-DNA
sequence (red highlight) and into exon 13 of ATGRIP (yellow highlight). For simplicity, the T-
DNA sequence shown is incomplete, and only shows part of the left border sequence. Introns
(purple letters), exons (orange letters), 5’ untranslated region (red letters) and the translation start
codon (blue highlight) are identified. The sequence shown is reading off of the sense strand.
Numbers indicate the quantity of nucleotides omitted in the intergenic regions. The black arrow
indicates the directionality of the sense strand.
ATGRIP (AT5G66030.1)

59
3’-
Aatgtatgcagtgtcattataagatattcgtaaagagaccttaaaaacaagcgtttggctgattataagaaat
tattattcaacaatgtagttggtctagagaaattacttacatctctctttcactctaaacactagagatcaaa
acaacgaagtaaagaagtaggatcattagacaaagattggaaatatcacaagtctctttgcttttgacataaa
caaacccaatttaaaaaaaaaaccaacttattaatgtaacattaaaaaaaaaaaaaaaattagacccaaaaaa
agtcctgagctctctgctatttcttcttttttccttttcttttcagacgaacatagaaatatttCTACTTCCA
AATCTTTACGGATTTGTCATGACTTGCAGACGCAACCACTCCCGTCGAAGGCGACTGAGCCAAGGCAGAGATC
ACACACTCGTGGCCTGCTACCGTCATACATTTGTTCTCCATTGTGTTCCACAGCTCTATAGCctgtcacagat
tcgtttaccaaagttaaaacaactgaga
// 1463 bp
CTCCATCATCTTGGGACAAAAATGATTCTACATTATCTTCTAGAGCTCCCACATCTCCAAACTGGTCCATGTC
ATCCTGCAGctattaattcttgtcataagaaagctgaaagaaacacggccccatgggatataaaaaaaatatt
caagctgctaagaaagca...ATATcttgtttcacacaacacaactgcatgctgtatccagatgttattggag
gaaaactagattgtcgttatcattcttctgagaaattaagaaacatacCAGTTGATTTGCTGATGATGCAAGA
CCACCGATCCCATCAGAACCATACATCATTGGCCCTTTTGGCATGCTATTCACATGGTGCATGTTACCAGCTA
TAGCAACTCCATCAACAGGGGTATGCGTTGACGGAGTCGATGGCTGTGAGTTGGATGGGCCAACAGTGTTTCC
TGTCCCTGTGCTGTTAGCAGGACCAGAAGAGGAAGGCCCTTTTCTTTTGCGGTTGTTctatcagatacacgaa
aaggaagttgtggctcaatcatctcagacactaaagaatatattcagttggttaaaaccacatgcttgataag
acttgagggattggatccacataaaagtacCT
// 2233 bp
TATGTAAACATCAAGCctacaaaaacacaaagatatcaaagtaaggaattgaaaaaaaataagcttttattga
atacaaaattaacttacATCTTGTCAGCTTCCCAATTACTCTGAGCCATagcttcagcccaagatcgagctgc
tataaaaggaattcaaatcttcaatccaaagaaatgatatgaactcagaataattcgattgttttaataaaca
gacactaacctgaataaaagcccaaacaaataaatatcaagtagatcagaaccctaattcgatcttcagatat
cagtaaatttaaagatcaagcattgctgctacacatacagagaaaatataaagaaatcgacaaggttaaattg
cttatacgcgaacatgacttttggaattcgttgaattgatatagaaagtaatcgaattcacatacctgacgga
tcacaattgaaaaggaaaaaaaagaatctagggttcttgagagattacagtgaattgtaatcagctgtaagtt
aagagtaaatcgatcatgaaacagctggaagagagagatagatcagattgatgagtttggagagatcatcgga
tgtttggtttgatgcttagctttaggattcga
-5’
Legend:
T-DNA Insertion Sequence Match Translational start/end
UTR Intron Exon
Figure 3.13: CS23120 A3-4 T-DNA insertion locus determined using targeted gene
sequencing. Targeted gene sequencing product read through the T-DNA sequence (red
highlight) and into intron 10 of LUH (yellow highlight). For simplicity, the T-DNA sequence
shown is incomplete, and only shows part of the left border sequence. Introns (purple letters),
exons (orange letters), 5’ untranslated region (red letters) and the translation start codon (blue
highlight) are identified. The sequence shown is reading off of the antisense strand. Numbers
indicate the quantity of nucleotides omitted in the intergenic regions. The black arrow indicates
the directionality of the sense strand.
LUH (AT2G32700.7)

60
Multiple attempts were made at identifying the CS23152 A2-1 and CS31166 A1-1 T-DNA
insertion sites, without success. Both mutants appear to have truncations in the T-DNA insertion,
as primers closer to the left border of the T-DNA did not yield any Arabidopsis sequence reads.
The CS23152 A2-1 mutant lacked Basta resistance (Table 3.2, Table 3.3 and Figure 3.4),
indicating that a portion of the T-DNA sequence was deleted.
A series of PCR primer pairs were produced in an attempt to identify the boundary of the
truncation in CS23152 A2-1 (Table 3.5). These primer pairs were used in PCR reactions using
the CS23152 A2-1 genomic DNA as a template. Primers were designed to anneal downstream
from where the Basta resistance gene would normally have been located. The presence of a PCR
product would indicate that the region spanned by the primers was still present in the T-DNA
sequence. L1 and L2 primer pairs would anneal approximately 600 bp downstream of where the
Basta gene would have been located, M1 and M2 primer pairs would anneal approximately 2000
bp downstream, and S1 and S2 primer pairs would anneal approximately 3300 bp downstream
(Table 3.5). CS23152 A1-6 was used as the positive control (Figure 3.14). All three regions
successfully produced a PCR product under at least one of the Mg2+ conditions. Reactions with
2.5 mM Mg2+ allowed for the production of M1, M2 and S2 products, though there was an
unknown 1100 bp PCR product produced with primer pair S1. Increasing the concentration of
Mg2+ to 3.5 mM led to the amplification of the expected product with primers L1 and M1. With
CS23152 A2-1, only the region 2000 bp downstream was successfully amplified while the 600
bp and 3300bp downstream products were not. Both M1 and M2 primer pairs produced the
expected product at 2.5 mM Mg2+ and 3.5 mM Mg2+. Amplification of the 2000 bp region
downstream of Basta confirms that this segment of genomic DNA had not been lost indicating

61
Table 3.5: Primers used to estimate the location of the T-DNA truncation in CS23152 A2-1.
Primer Name 5’ to 3’ sequence
L1 FWD GACCGTGCTTGTCTCGATGTA
L2 FWD TAGTGGTTGACGATGGTGCAG
L REV TTTTCTTGTGGCCGTCTTTGTT
M1 FWD GTGTAGGTCGTTCGCTCCAA
M1 REV GCGTCAGACCCCGTAGAAAA
M2 FWD AGTTCGGTGTAGGTCGTTCG
M2 REV GTTCCACTGAGCGTCAGACC
S1 FWD AGTGCCACCTGGGAAATTGT
S1 REV TCGCCCTTTGACGTTGGAG
S2 FWD AGGGTTATTGTCTCATGAGCGG
S2 REV GCCGATTTCGGCCTATTGGT
Figure 3.14: Determining the approximate location of the truncation in CS23152 A2-1.
Panels A and B used CS23152 A1-6 as a template as a positive control. Panels C and D used
CS23152 A2-1 as the template. L1 and L2 primers anneal approximately 600 bp from the Basta
resistance gene, M1 and M2 primers roughly 2000 bp downstream, and S1 and S2 roughly 3300
bp downstream. Expected product sizes were as follows: L1 - 613 bp, L2 - 594 bp, M1 - 401 bp,
M2 - 417 bp, S1 - 207 bp and S2 - 184 bp.
B
C D
CS23152 A1-6
CS23152 A2-1
3.5 mM Mg2+ 2.5 mM Mg2+
L2 M1 M2 S1 S2 L1
L2 M1 M2 S1 S2 L1
L2 M1 M2 S1 S2 L1
L2 M1 M2 S1 S2 L1
A
500 bp -
200 bp -
500 bp -
200 bp -

62
that the truncation had likely occurred between the Basta resistance gene and the region 2000 bp
downstream.
Targeted gene sequencing was revisited once the approximate region of the truncations
were identified. Five primers annealing between the Basta resistance gene and the region 2000
bp downstream (confirmed by primers M1 and M2) were designed to identify the truncation in
CS23152 A2-1 (Table 3.6 and Figure 3.15). Conversely, most CS31166 A1-1 progeny do
possess Basta resistance, demonstrating that the Basta resistance gene is still part of the T-DNA
insertion. Five additional primers annealing between the left border and Basta resistance gene
were designed to identify the region where the truncation had occurred in CS31166 A1-1 (Table
3.6 and Figure 3.16). A summary of targeted gene sequencing data obtained from CS23152 A2-1
and CS31166 A1-1 to determine truncation site is found in Table 3.7 and 3.8.
Table 3.6: Primers used in targeted gene sequencing to determine T-DNA insertion sites.
Primer Name 5’ to 3’ Primer Sequence
pSKI015LB ACACTGACGACATGGTTCTACATGTAGATTTCCCGGACATGA
A2-1 P1 ACACTGACGACATGGTTCTACACGTGACGTAAGTATCCGAGTCA
A2-1 P2 ACACTGACGACATGGTTCTACATGGCGTTCCCCTTTTGCATT
A2-1 P3 ACACTGACGACATGGTTCTACATACCGCCTTTGAGTGAGCTG
A2-1 P4 ACACTGACGACATGGTTCTACATTCGCCACCTCTGACTTGAG
A2-1 P5 ACACTGACGACATGGTTCTACATTACCGGATAAGGCGCAGC
A1-1 P1 ACACTGACGACATGGTTCTACACGCCTATAAATACGACGGATCG
A1-1 P2 ACACTGACGACATGGTTCTACAGCAGGCATGCAAGCTTATCG
A1-1 P4 ACACTGACGACATGGTTCTACAGGCAGAACCGGTCAAACCTA
A1-1 P5 ACACTGACGACATGGTTCTACATCCGTTCAATTTACTGATTGTACCC
A1-1 P6 ACACTGACGACATGGTTCTACATCACCGAGATGTGATGACCC

63
Figure 3.15: Map of the primers used in targeted gene sequencing to determine the
truncation site of the T-DNA in CS23152 A2-1. Basta has been truncated in this mutant and
the missing region highlighted in red. Primer pSKI015LB was used as a negative control (not
depicted in diagram). Illumina primer P2 was used for each reaction. M1 PCR product was
amplified using CS23152 A2-1 as a template to establish boundaries where the truncation may
have occurred.
Figure 3.16: Map of the primers used in targeted gene sequencing to determine the
truncation site of the T-DNA in CS31166 A1-1. Illumina primer P2 was used for each reaction.

64
To analyze the read data produced by these primers, the number of reads containing the
primer sequence and the expected downstream sequence were compared (Tables 3.7 and 3.8).
Reads were categorized into four different groups; those with the primer sequence, reads with the
primer sequence and the next two expected nucleotides, reads with the primer sequence and the
next four expected nucleotides and reads with the primer sequence and the next six nucleotides
We would expect to see a similar number of sequences in each category if sequencing was
successful.
Table 3.7: Summary of targeted gene sequencing data obtained from CS23152 A2-1 to
determine truncation site.
Primer Primer Sequence # of Reads
with Primer
# of Reads
with Primer
+ next 2 bp
# of Reads
with Primer
+ next 4 bp
# of Reads
with Primer
+ next 6 bp
pSKI015LB TGTAGATTTCCCGGACATGA 61967 4745 56 16
Primer 1 CGTGACGTAAGTATCCGAGTCA 43143 582 53 43
Primer 2 TGGCGTTCCCCTTTTGCATT N/A N/A N/A N/A
Primer 3 TACCGCCTTTGAGTGAGCTG 13748 1888 16 9
Primer 4 TTCGCCACCTCTGACTTGAG 12201 136 37 35
Primer 5 TTACCGGATAAGGCGCAGC 30067 1051 341 126
Table 3.8: Summary of targeted gene sequencing data obtained from CS31166 A1-1 to
determine truncation site.
Primer Primer Sequence # of Reads
with Primer
# of Reads
with Primer
+ next 2 bp
# of Reads
with Primer
+ next 4 bp
# of Reads
with Primer
+ next 6 bp
pSKI015LB TGTAGATTTCCCGGACATGA 6816 185 2 0
Primer 1 CGCCTATAAATACGACGGATCG 70773 310 9 0
Primer 2 GCAGGCATGCAAGCTTATCG 28468 497 1 0
Primer 4 GGCAGAACCGGTCAAACCTA N/A N/A N/A N/A
Primer 5 TCCGTTCAATTTACTGATTGTACCC 54065 518 4 0
Primer 6 TCACCGAGATGTGATGACCC 89716 216 25 0

65
Due to the decrease in the number of reads with the expected primer and downstream
sequence, this attempt at determining the truncation sites for both mutants was not successful.
For CS23152 A1-2, we should not obtain any sequence with primer pSKI015LB, as that region
has been removed in this mutant. Results obtained with the other primers yielded a similar
quantity of reads containing the primer and the next six expected base pairs. With CS31166 A1-
1, none of the primer pairs were able to produce any reads containing the primer and the next six
expected base pairs.
Overall, the T-DNA insertion locations for four of the six mutants that we had identified in
the screen using targeted gene sequencing were determined (Table 3.9 and Figure 3.17). Of
those, three homozygous lines were obtained (CS23120 A3-4, CS23152 A1-20-3 and CS23838
D1-2). The Basta resistance assay, TAIL PCR and targeted gene sequencing were carried out on
heterozygous mutant CS23838 D1-3, though we later found CS23838 D1-2, which is a
homozygous sibling. CS23152 A1-2 and CS31166 A1-1, were not successfully characterized
with this technique. The targeted gene sequencing data is presented in Appendix 1.
3.2.5 Reverse-Transcription Quantitative PCR analysis to determine gene expression levels of
genes flanking the T-DNA insertions
Reverse-transcription quantitative PCR (RT-qPCR) was performed to determine if the
expression of genes flanking the T-DNA insertions were upregulated by the CaMV enhancer
tetramer. Primers annealing to Actin-7 mRNA were used as the endogenous control. HIPP25 and
SRBP mRNA levels were quantified in two-week old root and four-week old leaf tissues
obtained from homozygous CS23152 A1-20-3 plants compared to wild type plants. For

66
Table 3.9: Summary of the T-DNA Insertion sites in NA tolerant Arabidopsis
Plant ID
Number of
Predicted
Insertions
Genes Nearby Insertion Zygosity of
Insertions
CS23838
D1-2 1 Intron 3 of Glabra 2 (GL2) (AT1G79840) Homozygous
CS23120
A3-4 1 Intron 10 of Leunig Homolog (LUH) (AT2G32700.7) Homozygous
CS23152
A1-20-3 1
Insertion in intergenic region between HIPP25 and S-
ribonuclease binding protein family protein
Homozygous - ~1000 bp from 5’ UTR of HIPP25
(AT4G35060.1)
- ~ 6000 bp from 3’ UTR of SRBP
(AT4G35070.1)
CS23127
A1-2 3
Insertion 1:
Undetermined
- 29 bp from 3’ UTR of S-adenosyl-L-
methionine-dependent methyltransferases
superfamily protein (SAM) (AT4G18030.1)
- 4563 bp from 5’ UTR of Pseudo-Response
Regulator 2 (APRR2) (AT4G18020.1)
Insertion 2:
- Exon 1 of Arabidopsis thaliana formin-like
protein (DUF1421) (AT4G28300.1)
Insertion 3:
- Exon 13 of ATGRIP (AT5G66030.1)
CS23152
A2-1 Unknown Unknown Undetermined
CS31166
A1-1 Unknown Unknown Heterozygous

67
Figure 3.17: Schematic summary of T-DNA insertion sites in genomic DNA of NA-tolerant
mutants. T-DNAs (red triangles) are shown as insertions into an individual gene or intergenic
region. Introns (I) and exons (E) are shown for intragenic insertions. Arrows show gene
orientation. Linear distance is not equivalent between lines.
heterozygous CS23127 A1-2 plants, APRR2 and SAM gene expression was quantified in four-
week old leaf tissues as well as in Col-7.
Expression of APRR2 and SAM in leaf tissues of CS23127 A1-2 mutants did not appear
higher than in the Col-7 controls (Figure 3.18). The first mutant had APRR2 fold changes of
0.590 (P1) and 0.725 (P2) while the second mutant had fold changes of 0.773 (P1) and 0.739
(P2). Regarding SAM gene expression, the first mutant had fold changes of 0.675 (P1) and 0.567
(P2) while the second mutant had fold changes of 0.611 (P1) and 0.498 (P2). There did not
appear to be any differences in HIPP25 or SRBP gene expression between leaf samples obtained
from Col-7 and two CS23152 A1-20-3 mutants (Figure 3.19). Both the HIPP25 and SRBP
primers yielded extremely similar fold-changes within each individual plant sample. The first

68
CS23152 A1-20-3 mutant had HIPP25 fold changes of 1.589 (P1) and 1.459 (P2) while the
second CS23152 A1-20-3 mutant had fold changes of 1.151 (P1) and 1.065 (P2). In terms of
SRBP gene expression the first mutant had fold changes of 0.677 (P1) and 0.665 (P2) and the
second mutant had fold changes of 2.052 (P1) and 1.514 (P2). In the root tissues HIPP25
expression was lower than in the Col-7 control with fold changes of 0.622 (P1) and 0.534 (P2)
(Figure 3.20). However, there appeared to be a slight downregulation in SRPB in both tested
mutants as fold changes of 0.400 (P1) and 0.360 (P2) were obtained.
It was expected that the presence of the T-DNA insertion in mutant lines would lead to
significant upregulation of genes upstream and downstream of the insertion site when compared
to the wild-type control. This was not the case for either CS23152 A1-20-3 and CS23127 A1-2.
The t-values for APRR2-1, APRR2-2, SAM-1 and SAM-2 were -3.41, -10.74, -3.41 and -3.04,
respectively. These values were lower than t0.05,2 (4.303), indicating that here was no significant
difference in APRR2 and SAM expression between Col-7 and CS23127 A1-2. The t-values for
HIPP25-1, HIPP25-2, SRBP-1 and SRBP-2 were -0.11, 0.03, 0.37 and 0.57, respectively. These
values were lower than t0.05,2 (4.303). There was also no significant difference in HIPP25 and
SRBP expression between Col-7 and CS23152 A1-20-3. Expression of HIPP25 and SRPB in the
root tissues of two-week old homozygous CS23152 A1-20-3 plants appeared to be lower than
what was observed in Col-7, but there were insufficient biological replicates to carry out any
statistical analysis. In general, genes that flanked the T-DNA insertions in our mutants were not
upregulated relative to Col-7, contrary to the expected outcome. The CaMV enhancer tetramer
does not drive gene expression constitutively, but rather increases the endogenous expression of
genes (Weigel et al., 2000). While the plant tissues were selected at developmental stages where
expression of these genes was expected to be elevated, it is possible that gene induction requires

69
stimulus from NA exposure. Additional gene expression analyses with several biological
replicates could be carried out on plants that have been exposed to NAs to determine if elevated
gene expression occurs when exposed to NAs.
Figure 3.18: RT-qPCR analysis of genes flanking the T-DNA insertion in mutant CS23127
A1-2. cDNA was synthesized from four-week old CS23127 A1-2 leaf tissue. Results were
standardized to the endogenous control gene (Actin-7) with Col-7 as the wild-type control. Three
technical replicates were carried out for each sample. Error bars are represented by RQmin and
RQmax, which are the upper and lower limits of the RQ values based on the standard error of the
ΔCt values.
0
0.2
0.4
0.6
0.8
1
1.2
1.4
1.6
1.8
APRR2 P1 APRR2 P2 SAM P1 SAM P2
Rel
ativ
e m
RN
A (
log2
)
Col-7 #1 Col-7 #2 CS23127 A1-2 #1 CS23127 A1-2 #2

70
Figure 3.19: RT-qPCR analysis of genes flanking the T-DNA insertion in mutant CS23152
A1-20-3. cDNA was synthesized from four-week old CS23127 A1-2 leaf tissue. Results were
standardized to the endogenous control Actin-7, and Col-7 was used as the wild-type control.
Three technical replicates were carried out for each sample. Error bars are represented by RQmin
and RQmax which are the upper and lower limits of the RQ values based on the standard error of
the ΔCt values.
0
1
2
3
4
5
6
HIPP25 P1 HIPP25 P2 SRBP P1 SRBP P2
Rel
ativ
e m
RN
A (
log2
)
Col-7 #1 Col-7 #2 152 A1-20-3 #1 152 A1-20-3 #2

71
Figure 3.20: RT-qPCR analysis of genes flanking the T-DNA insertion in CS23152 A1-20-3.
cDNA was synthesized from two-week old root tissue from 200 homozygous CS23152 A1-20-3
seedlings. Results were standardized to the endogenous control Actin-7, and Col-7 was used as
the wild-type control. Three technical replicates were carried out for each sample. Error bars are
represented by RQmin and RQmax, which are the upper and lower limits of the RQ values based on
the standard error of the ΔCt values.
3.3 Discussion
The activation-tagged screen in Arabidopsis successfully identified six mutants that
possessed tolerance to AdCA, five of which were initially identified on AdCA, and one
identified on DH2NA. Three of the five mutants identified on AdCA also showed tolerance to
DH2NA. Phenotypic ratios for NA tolerance were tested to determine the heredity of the T-DNA
insertion. The results of the NA and Basta growth assay (Table 3.2) showed that seedling growth
on AdCA or DH2NA is not effective in determining the presence of the T-DNA insertion. The
0
0.2
0.4
0.6
0.8
1
1.2
1.4
HIPP25 P1 HIPP25 P2 SRBP P1 SRBP P2
Rel
ativ
e m
RN
A (
log2
)
Col-7 152 A1-20-3

72
percentage of plants showing the NA tolerance phenotype appears to be lower than that of
seedlings shown to contain the T-DNA insertion, as determined by PCR. Screening on Basta
plates provided a more accurate representation of the T-DNA insertion, as the Basta selection
efficiency was comparable to the PCR results. Homozygous progeny lines for CS23120 A3,
CS23152 A1 and CS23838 D1 were identified by their high (~95% or higher) Basta growth
percentages. All of the CS23152 A2 progeny lines possessed AdCA tolerance, yet were not able
to grow on Basta plates, presumably due to the loss of the Basta gene in these lines. This was
supported by the inability to obtain targeted gene sequencing data or using standard sequencing
primers. Targeted gene sequencing revealed that CS23127 A1-2 had three insertion sites, yet
both the PCR and screen suggest that this mutant is heterozygous. If each T-DNA insertion were
segregating independently, we would have expected to see Basta resistance close to 100%.
CS23127 A1 progeny lines had the lowest viability on 0.5X MS plates (Table 3.2 and Table 3.3).
While it is possible that the seeds may have been prematurely harvested, one of the three T-DNA
insertions may have a negative effect on seed viability.
TAIL-PCR assays demonstrated that the T-DNA insertion site in CS23838 D1-3 was in
intron 3 of GL2, suggesting that normal splicing would be impaired, thereby resulting in a
knockout mutant. GL2 is a homeodomain transcription factor that is involved in the
differentiation of epidermal cells into trichomes and seed coat epidermal cells (Tominaga-Wada
et al., 2009; Shi et al., 2012; Khosla et al., 2014). GL2 is also required for mucilage biosynthesis,
as gl2 mutants fail to produce mucilage yet possesses higher levels of oil in the seed (Shi et al.,
2012). Mucilage is produced from the accumulation of polysaccharides such as pectin, celluloses
and hemicelluloses in the apoplast of epidermal cells (Saez-Aguayo et al., 2013). When water is
taken up by the seed, the cell wall ruptures and releases these polysaccharides. CS23120 A3-4

73
showed a T-DNA insertion into an intron of the LUH gene, which encodes a transcriptional co-
repressor. Similar to gl2 mutants, release of mucilage in luh mutant seeds is inhibited (Saez-
Aguayo et al., 2013). GL2 and LUH both play key roles in mucilage production and interact with
Pectin Methylesterase Inhibitor6 (PMEI6), a gene that is required for mucilage release ( Saez -
Aguayo et al., 2013). Although not clearly evident, the NA tolerant phenotypes of CS23838 D1-
3 and CS23120 A3-4 may involve one of two mechanisms. Mucilage is an acidic
polysaccharide-rich gel that can increase the water-holding potential of seeds. It is possible that
mucilage enhances NA interactions with the seed, which may lead to an increased effective
dosage. Conversely, mucilage-deficient mutants would have lower effective NA dosage.
Alternatively, since NAs in their nonionized form are more phytotoxic (Headley and McMartin,
2004; Armstrong et al., 2009; Leishman et al., 2013), the low pH of mucilage would result in a
more toxic environment for wild type seeds.
Although the enhancer effect on the expression of adjacent genes was not conclusive in the
mutant lines that had their T-DNA insertion sites identified, discussion on the function of the
genes located nearby the insertion sites is warranted. The T-DNA insertion in CS23152 A1-20-3
was flanked by HIPP25 and SRBP genes, and located ~1050 bp from the 5’ UTR of HIPP25 and
~6000 bp from the 5’ UTR of SRBP. HIPP25 is a plant-specific metallochaperone that is likely
involved in heavy-metal homeostasis (Tehseen et al., 2010). The HIPP family of proteins is
characterized by the presence of an HMA (heavy-metal binding domain) as well as an
isoprenylation motif that allows this protein to modify other proteins through the addition of a
hydrophobic farnesyl unit (De Abreu-Neto et al., 2013). While the exact function of HIPP25 is
unknown, related proteins in the same family have been better characterized. HIPP26 and
HIPP27 have been shown to confer Cd2+ tolerance when overexpressed in planta as well as when

74
engineered in Cd2+ sensitive yeast (Suzuki et al., 2001; Tehseen et al., 2010). The enhanced Cd2+
tolerance is the result of HIPP protein binding to cytosolic Cd2+, thereby preventing its binding to
essential proteins (De Abreu-Neto et al., 2013). Cd2+ toxicity in plants is likely due to its
chemical similarity to Zn2+ and Ca2+, which results in aberrant Cd2+ binding to proteins which, in
turn, inhibits essential cellular processes (De Abreu-Neto et al., 2013). HIPP25p:GUS was highly
expressed in root vasculature, trichomes and flower buds (Tehseen et al., 2010). A metal
transporter could potentially be involved in NA tolerance by co-transporting an NA-metal
complex resulting in the sequestration of NAs in the vacuole, target of NAs for degradation, or
export of NAs out of the cell. Phytochelatins, which are involved in heavy metal tolerance in
plants, are an example of organic compounds that form a complex with metals (Cobbett, 2000).
Perhaps a similar mechanism exists for the HIPP protein in a complex with NAs. The other T-
DNA flanking gene in this mutant, SRBP, has not yet been characterized, although high-
throughput transcriptome sequencing reveals that it is highly expressed early in seed germination
(Klepikova et al., 2016).
Of the three insertions events in CS23127 A1-2, two were in the exons of ATGRIP and
DUF1421, and the third was in the intergenic region between APRR2 and SAM. AtGRIP is a
protein that localizes itself and other proteins to the trans-Golgi network (Zhao and Li, 2014). It
is highly expressed at many developmental stages and in mature roots and leaves. DUF1421
encodes a formin-like protein with unknown function. As the insertion events occurred in the
exons of ATGRIP and DUF1421, we would expect a loss of function in both genes. It is
unknown how these knockouts could contribute NA tolerance in plants. Secretory processes play
an important role in polysaccharide synthesis. Synthesis of cellulose occurs at the plasma
membrane via cellulose synthase which is transported in secretory vesicles from the trans-Golgi

75
network. A knockout in AtGRIP may cause disruption of some components of the secretory
pathway, which could alter the composition of the cell wall and possibly change the way that the
cell perceives NAs.
Many cellular responses are dependent on intracellular calcium levels to regulate microbial
defense, and biotic and abiotic stress. Fluctuations in cytosolic Ca2+ levels, known as calcium
signatures, are detected by Ca2+ sensors and activate specific signalling cascades to induce the
appropriate physiological responses (Lecourieux et al., 2006). APRR2 is a pseudo-response
regulator that interacts with Calmodulin-like Protein 9 (CML9). CML9 expression increases
significantly in plants exposed to salt stress as well as in the presence of abscisic acid (ABA).
Upregulation of APRR2 in CS23127 A1-2 could potentially lead to an expected increase in
resistance in response to abiotic stressors (Leba et al., 2012), although in the CS23127 A1-2 RT-
qPCR analysis, expression of APRR2 was found to be slightly downregulated.
The attempt at designing internal PCR primers to narrow down the possible truncation sites
using targeted gene sequencing was not successful for CS23152 A2-1 and CS31166 A1-1. There
was a high number of reads containing only the primer sequence in both data sets. These reads
likely resulted from the primers annealing to regions with similar nucleotide sequences
throughout the genome, but not the T-DNA insertion. For both CS23152 A2-1 and CS31166 A1-
1, designing other sets of internal T-DNA primers spanning a larger region may be required to
re-establish boundaries for the truncation. This would be followed up by targeted gene
sequencing to identify the truncation site.
Degradation of xenobiotics in plants has been commonly attributed to transformation using
reduction and/or oxidation reactions, conjugation to an endogenous compound, and
compartmentalization into the vacuole or removal from the cell (Reichenauer and Germida,

76
2008; Abhilash et al., 2009). Genes that are commonly involved in this process encode CYPs,
GSTs, UGTs and ABC transporters. Previous microarray work shows that these genes are
upregulated in response to AEO exposure (Widdup et al., 2015). β-oxidation has demonstrated to
degrade linear NAs in algae due to the similarity of these molecules to fatty acids (Quesnel et al.,
2011). However, the genes flanking the T-DNA insertions in each of the characterized mutants
do not appear to be involved in any of these pathways. The identification of mutants and the
insertion sites reported in this thesis chapter suggest that other uncharacterized pathways are
involved in NA tolerance in plants.

77
Chapter Four: Visualization of radioactively labelled NA Uptake in slender wheatgrass
(Elymus trachycaulus)
4.1 Introduction
Establishing phytoremediation as a reliable method of removing contaminants from the
environment is dependent on remediation efficiency as well as understanding how plants process
the contaminants. Plants possess metabolic pathways that degrade, sequester or volatilize many
contaminants (Reichenauer and Germida, 2008). While there is evidence that supports plant
uptake of NAs through the root system (Armstrong et al., 2009), definitive evidence is lacking.
Visualization and semi-quantitative analysis of radioactively labelled contaminant uptake is
possible using phosphor imager autoradiography. This technique visualizes the extent of uptake
into the root system and can to determine if the compounds or their derivatives are translocated
to shoot tissues. This method was previously applied in a study that determined where TNT
(2,4,6-trinitrotoluene) and RDX (hexahydro-1,3,5-trinitro-1,3,5-triazine) and/or their metabolites
were translocated into poplar and switchgrass plants (Brentner et al., 2010).
Degradation of organic compounds by the plant rhizosphere has been well-documented
(Newman and Reynolds, 2004; Doty et al., 2017). Roots can promote microbial growth by
secreting amino acids and organic molecules, as well as regulating soil pH for optimal microbial
growth (Hall et al., 2011). In addition, endophytic microbes found within the roots and stems of
plants can also contribute to the remediation of toxic compounds. Microbes can either directly
metabolize contaminants or may promote plant growth to allow for higher levels of uptake and
metabolism. In one example, in planta degradation of trichloroethylene was significantly
improved by the addition of native endophyte Enterobacter sp. to the poplar tree rhizosphere
(Doty et al., 2017). Treated poplar also had increased trunk diameter, indicating that plant growth

78
was improved. Degradation of NAs by free-living microbes has been documented using -
oxidation and β-oxidation as metabolic pathways to degrade aliphatic and alicyclic carboxylic
acids (Whitby, 2010). In order to determine the extent to which NAs and/or their metabolic
derivatives are taken up and translocated directly by plants without the assistance of microbes, a
sterile hydroponic growth protocol using slender wheatgrass (Elymus trachycaulus) was used in
this thesis research.
4.2 Results
4.2.1 Radioactive NAs used in these experiments
Microbe-free slender wheatgrass seedlings were exposed to one of five radiolabeled NAs
(HA, Hexanoic Acid; DA, Decanoic Acid; CPCA, Cyclopentanecarboxylic acid; CHCA,
Cyclohexanecarboxylic acid; AdCA, Adamantanecarboxylic acid) by exposing their roots to
these isotopes for 11 days in a sterile hydroponic system (see Methods, Figure 2.5). These
compounds were chosen for their structural differences (Figure 4.1). HA and DA are linear NAs
that differ in carbon chain length, while CPCA and CHCA are single-ringed NAs that differ in
ring carbon number. AdCA has a distinct, more complex diamondoid ring structure. Microbial
degradation studies using these compounds has been studied previously (Lai et al., 1996; Del Rio
et al., 2006; Demeter et al., 2015). Linear and single ring NAs have been shown to be efficiently
degraded by bacteria (Smith et al., 2008; Demeter et al., 2015), whereas AdCA was shown to be
recalcitrant to microbial degradation until only recently (Folwell et al., 2020). An algal-bacterial
system was also successful at degrading AdCA over a 90 day period (Paulssen and Gieg, 2019).
Comparing the uptake within and between linear, single-ringed and diamondoid compounds

79
could elucidate which molecules are more easily taken up by the plant, as well as to provide
insight into the ability of the plant to translocate the NA and/or its associated metabolites.
Figure 4.1: Structures of the five NAs used in the wheatgrass uptake experiments. (A)
Hexanoic acid (HA) and (B) decanoic acid (DA) are linear NAs. (C) Cyclopentanecarboxylic
acid and (D) cyclohexanecarboxylic acid are single-ring NAs. (E) 1-adamantanecarboxylic acid
is a diamondoid NA. The carbons associated with the carboxylic acid functional group (indicated
with a red asterisk) are radiolabeled.
4.2.2 Generation of microbe-free slender wheatgrass seedlings
The process of generating sterile wheatgrass seedlings involved gas sterilization of the
seeds followed by germination on agar plates containing 100 µg/mL streptomycin. The
germinated seeds were tested for the absence of microbes using growth assays by plating extracts
on YES, TSA and LB plates (Figure 4.2 and Figure 4.3).
A B
C D E
* *
*
* *

80
Figure 4.2: Verification of seed extract sterility using TSA and YES plates. Seed extract was
obtained from gas sterilized slender wheatgrass seeds grown on 100 µg/mL streptomycin agar
plates (pH 5.8). The mock water (H2O) treatment served as a control to demonstrate that
handling did not result in contamination.
TSA (pH 7.3) YES (pH 6.2)
H2O
Seed Extract

81
Figure 4.3: Verification of seed extract sterility using LB plates. Seed extract was obtained
from gas sterilized slender wheatgrass seeds grown on 100 µg/mL streptomycin agar plates (pH
5.8). The seed extract was plated (A) undiluted or diluted with a ratio of (B) 1:10, (C) 1:100, (D)
1:1000, (E) 1:10000.
4.2.3 Visualization of NA uptake in slender wheatgrass
Phosphor images of slender wheatgrass plants were obtained after 11 days of exposure of
the seedling roots to individual 14C-labelled NAs. Two seedlings were imaged for each of the
replicated 14C-NA treatments. Control seedlings did not receive NAs treatment and did not
display any phosphor image signal (Figure 4.4). Seedlings exposed to the linear NAs (14C-HA
and 14C-DA) showed extensive signal in the roots and shoots, with more extensive labelling in
shoot tissue (Figure 4.4). The youngest and most rapidly growing leaves located near the base of
A B
C D E

82
Figure 4.4: Phosphor images depicting the uptake of 14C-HA and 14C-DA by slender
wheatgrass. The dried plants (left panel) demonstrate the organization of the phosphor imaged
scan of plants grown in liquid medium in the absence or presence of 14C labelled NA (right
panel). Plants were treated without 14C radioactive NA (Control), 14C-hexanoic acid (HA) and 14C-decanoic acid (DA) over a period of 11 days. 14C CPCA reference standards were used to
quantify the radioactive signal in plants. Radioactive measurements were based on the average of
three plants per replicate.
Control
HA
DA

83
Figure 4.5: Phosphor image depicting the uptake of CPCA, CHCA and AdCA in slender
wheatgrass. The dried plants (left panel) demonstrate the organization of the phosphor image
scan of plants grown in liquid medium in the absence or presence of 14C labelled NA (right
panel). Plants were treated with 14C-CPCA, 14C-CHCA and 14C-AdCA over a period of 11 days. 14C CPCA reference standards were used to quantify the radioactive signal in plants. Radioactive
measurements were based on the average of three plants per replicate.
CPCA
CHCA
AdCA

84
the shoot showed the highest level of labelling. In contrast, seedlings treated with the single
ringed NAs (14C-CPCA and 14C-CHCA) showed much higher 14C labelling in root tissue
compared to leaf tissue (Figure 4.5). In AdCA treated seedlings, most of the label accumulated in
root tissue, with only faint signal observed in leaves (Figure 4.5).
4.2.4 Semi-quantitative analysis of NA uptake in slender wheatgrass
Radioactivity counts were estimated for roots and leaves of plants by obtaining pixel
values using ImageJ and converting these values into becquerels based on the radioactive
standards included on each phosphor image scan (see Methods and Materials, Section 2.7.4).
The estimated radioactive counts in roots, shoots, and the portion that remained in the nutrient
solution were compared for all five NA treatments (Figure 4.6). In the single ringed (HA and
DA) treated seedlings, essentially all of the radioisotope was dissipated from the nutrient
solution, while a greater amount of signal was observed in shoots (39% and 33%, respectively)
compared to roots (7% and 8%). More than half (54% and 58%, respectively) of the initial
amount of radioactivity added was unaccounted for. In contrast, the single ringed NA (CPCA
and CHCA) treated seedlings showed most of the radioisotope signal in roots (36% and 44%,
respectively) compared to shoots (13% and 5%), while there was a slight amount of radioactivity
remaining in the nutrient solution (6% and 5%). Similar to the linear NA samples, a large portion
of the radioactive signal in the single ring samples was unaccounted for (45% and 57%). The
AdCA treated seedlings showed an average of 29% of the signal in roots and only a small
amount in shoots (0.2%). A greater amount of radioactivity remained in the nutrient solution
(15%) when compared to the other treatments.

85
Figure 4.6: Distribution of total radioactive counts in slender wheatgrass roots, shoots and
nutrient solution. The unaccounted fraction value was the difference between the total counts
added to the solution at the start of the experiment and the total counts estimated in roots, shoots
and remaining in solution.
To establish a baseline for spontaneous NA loss from the hydroponic solutions over the 11
day treatment period, the percent of isotope remaining in sterile solution was quantified from
treatment systems that did not contain plant material (Figure 4.7). HA, CPCA, CHCA and AdCA
radioactive signal was not substantial, though there was a large decrease in the amount of DA
(38% loss). This dissipation may have resulted from a higher volatilization rate of DA from
solution. These observations were in contrast with the significant decrease in the amount of NA
remaining in the solution in the planted treatments (Figure 4.7).
0
10
20
30
40
50
60
70
80
90
100
HA DA CPCA CHCA AdCA
Act
ivit
y (%
)
Root Shoot Remaining in Solution Unaccounted

86
Figure 4.7: Percentage of radioisotope remaining with and without wheatgrass in the
sample tubes. Radioactivity was measured after 11 days. Three replicates were used for the no
plant treatment. Two replicates were used for the plant treatment. Error bars are ± the standard
error.
The translocation factor metric represents the ability of a plant to distribute compounds
between the root and the shoot. Here, the translocation factor provides information about the
movement of the radioactively labelled carbon without assigning the radioactivity to a specific
compound should the labelled NA be transformed prior to translocation. The mean translocation
factors of HA and DA were high (5.23 and 4.15, respectively), whereas CPCA, CHCA and
AdCA had translocation factors lower than 1 (0.38, 0.13 and 0.003, respectively) (Figure 4.8).
0
20
40
60
80
100
No PlantHA
No PlantDA
No PlantCPCA
No PlantCHCA
No PlantAdCA
HA DA CPCA CHCA AdCA
% Is
oto
pe
Rem
ain
ing

87
Figure 4.8: Mean translocation factor of radiolabeled NA uptake in sterile slender
wheatgrass. Mean values were obtained using data from three replicates and determined as the
ratio of leaf radioactivity divided by root radioactivity. Error bars are +/- the standard error
obtained from three biological replicates.
4.3 Discussion
Water, nutrients and organic compounds are largely taken up by plants through root hair
cells. From there, transport to the central vascular system occurs via apoplastic or symplastic
pathways (Steudle and Frensch, 1996). Apoplastic transport involves movement of molecules
within the extracellular space, passing between the epidermal and cortical cells until these
molecules reach the endodermis. Adjacent endodermal cells are sealed by the Casparian strip
which prevents further apoplastic transport. Thus, entry into the vascular cylinder requires
symplastic transport, where molecules must enter endodermal cells via the plasma membrane.
0
1
2
3
4
5
6
HA DA CPCA CHCA AdCA
Tran
slo
cati
on
Fac
tor

88
Molecules can then move from cell to cell through cytoplasmic connections called
plasmodesmata. Transport of nonpolar organic compounds (e.g., PAHs) from root hairs to the
endodermal layer occurs primarily through the apoplast, while more polar organic compounds
(e.g., dinitrobenzene) are more likely to be transported symplastically (Su and Zhu, 2007).
In this study, five 14C-labelled NAs were added individually to nutrient solution exposed to
roots of sterile slender wheatgrass seedlings. Radioactive signal accumulated in the roots and
shoots in different proportions, depending on the class of NA added. Linear NA (HA and DA)
radioactive signal accumulated primarily in shoot tissues, whereas, the distribution of signal in
the singled-ringed NA (CPCA and CHCA) treated seedlings was higher in the roots than the
shoots. Seedlings treated with the diamondoid NA, AdCA, showed almost exclusive root
labelling.
HA and DA are both linear NAs that share similar structural qualities to fatty acids,
including the carboxyl group and long carbon chain that could allow them to be degraded using
multiple rounds of β-oxidation (Whitby, 2010). Although the single-ring NAs are less suitable
for degradation by β-oxidation due to their short side chains, microbial degradation of CPCA and
CHCA has been well-documented (Demeter et al., 2015; Ahad et al., 2018). Microbes are
equipped to use α-oxidation to remove single carbons from the NAs, allowing for β-oxidation to
further degrade the compound (Rontani and Bonin, 1992). The alicyclic ring structures in NAs
can be opened by transforming these structures into an aromatic intermediate, followed by
cleavage (Blakley, 1974; Koma et al., 2004). The ring structure of AdCA is unlikely to be
degraded using β-oxidation due to its complex diamondoid structure. AdCA is known to be
highly recalcitrant and only recently has it been shown to degrade using microbial approaches
under extended time periods (Paulssen and Gieg, 2019; Folwell et al., 2020).

89
Each of the radiolabeled NAs used in the uptake experiments contained a single
radiolabeled carbon in the carboxyl functional group (Figure 4.2). As such, if the radiolabelled
carbon is removed from the carboxyl group, it would enter other metabolic pathways within the
cell. Linear NAs such as HA and DA are more labile than ringed NAs such as CPCA and CHCA
(Demeter et al., 2015), which could allow higher quantities of newly formed radiolabeled
products to travel to the shoot. This could potentially explain the higher translocation factors
observed in HA and DA treated seedlings. HA and DA are both cellular metabolites, so it is not
surprising that they are metabolized when presented exogenously. HA is a cannabinoid precursor
in Cannabis sativa, where hexanoyl-CoA synthetase converts HA to hexanoyl-CoA (and
eventually into THC and CBDA) in the trichomes (Stout et al., 2012). HA was also shown to be
a priming agent involved in rapid plant defense responses (Llorens et al., 2016).The more stable
CPCA and CHCA likely are not degraded with the same efficiency as HA and DA, potentially
resulting in greater accumulation in the root system. AdCA, may be minimally degraded due to
the more stable diamondoid ring structure, resulting in even higher accumulation in the root
compared to the single-ring compounds.
If the labelled NAs that have entered root cells are degraded, the resulting products may be
more amenable to transport to the shoot. For example, β-oxidation of NAs in microbes results in
the production of acetyl-CoA (Whitby, 2010). In the HA and DA treated seedlings, the
accumulation of radioactivity in the shoot tissues appeared to be higher in newly developing
leaves as opposed to older, established leaves (Figure 4.4). Nutrients are preferentially directed
to these newer leaves to promote their rapid growth, and could explain the high radioactive
signal in these young leaves. Evidence for the metabolism of HA in roots was demonstrated in

90
citrus plants, where 13C labeled HA was localized exclusively in the roots (Llorens et al., 2016).
This suggests that only the degradation products of HA can be translocated into the shoot system.
Approximately 45% - 58% of the radioactive signal was unaccounted for at the end of each
treatment. This could be attributed to several factors. First, while the NA solution was only in
contact with the wheatgrass roots, a portion of the NAs could have been taken up by the agar
ring rather than the roots. Alternatively, because the 14C signal is weak, the signal from cells that
were overlaid by other cells could have been blocked from activating the phosphor screen, due to
the low energy of the 14C isotope. Another, more likely reason for this reduced signal is that a
significant amount of the 14C signal may have been lost through transpiration. If complete
metabolism of the NA was taking place, the 14C associated with the degraded NA may have
ended up in carbon dioxide that was dissipated from the tissue or released through the
transpiration stream.
While this experiment provides novel information regarding the uptake and translocation
of NAs or NA metabolites throughout the plant, the mechanisms behind uptake are currently
unknown. Previous work conducted in the Muench lab has demonstrated that NAs have
significant impacts on the subcellular structure and dynamics of plant cells (Alberts et al., 2019).
The morphology of several membrane-bound organelles (i.e., mitochondria, peroxisomes,
endoplasmic reticulum and Golgi bodies) were also drastically altered in their structure when
exposed to NAs. For instance, Golgi stacks lose their characteristic disc-like shape and instead
become punctate. These organelle changes are likely due to the integration of NAs in their
boundary membranes. Plant cell organelles are all in close proximity, thereby potentially
allowing the movement of NAs between organelle membranes. Normal membrane turnover in
the cell would liberate the associated NAs, allowing them to become substrates for degradation.

91
Also, a high concentration gradient of NAs in the surrounding environment would result in an
influx of NAs into the cytosol of the cell, entering through the disrupted regions of the
membrane where they become trapped inside the plant cell. Cytosolic biochemical pathways
may function in NA degradation in this scenario as well.
4.3.1 Acknowledgement
Mitchell Alberts contributed significantly to the results in this chapter by handling all of
the radioactive steps in this research. Mitchell also developed a spreadsheet that converts
histogram readings of pixel intensities to becquerels (Bq), which allowed for semi-quantitative
analysis of radioactive counts in planta. He also tested wheatgrass seedlings for sterility on LB.

92
Chapter Five: Discussion and Future Directions
5.1 Overall synopsis of the research
The remediation of OSPW is an important issue for the oil sands mining industry. While
OSPW contains heavy metals and salts, the primary contributor to its toxicity are NAs, a diverse
class of organic compounds. While more simple, labile NAs can be degraded using microbial
approaches, recalcitrant NAs pose a greater challenge for remediation methods. Plants, being
sessile organisms, have vast biochemical pathways that can be used to adapt to their environment
when exposed to toxic compounds. Phytoremediation provides an attractive, passive method for
removing contaminants from the soil while simultaneously providing benefits such as erosion
protection to the ecosystem and dewatering (El-Gendy et al., 2009; Gerhardt et al., 2017;
Frédette et al., 2019). Because plants have many biochemical pathways to degrade xenobiotics,
this thesis project sought to identify genes that may be involved in NA degradation using the
model plant Arabidopsis, as well as to gain knowledge regarding the uptake and translocation of
NAs using phosphor imager autoradiography of 14C-labelled NAs.
In Chapter Three, six previously identified NA tolerant activation-tagged lines of
Arabidopsis were characterized and their T-DNA insertion loci analyzed. Homozygous lines
were obtained for three mutants (CS23120 A3-4, CS23152 A1-20-3, CS23838 D1-2) and
heterozygous lines for two mutants (CS23127 A1-2, CS31166 A1-1). The zygosity of the
remaining mutant, CS23152 A2-1, was not confirmed as a result of the lost Basta resistance
gene. TAIL-PCR had successfully identified the insertion site for one mutant (CS23838 D1-3).
However, this approach was not successful in identifying the insertion sites in the remaining five
mutant lines. Targeted gene sequencing using massively parallel sequencing was successful in
identifying the T-DNA insertion locations of three additional mutants (CS23120 A3-4, CS23127

93
A1-2 and CS23152 A1-20-3) and was also used to verify the insertion site for CS23838 D1-3.
The insertion sites in CS23152 A2-1 and CS31166 A1-1 were not identified, as the T-DNA
insertions themselves appeared to be truncated. Internal T-DNA primers were used in an attempt
to determine where the truncations occurred, although this was not successful. As the T-DNA
contains an enhancer tetramer which increases endogenous expression of genes upstream and
downstream of the insertion, RT-qPCR was carried out to quantify the changes in expression
found for genes flanking the T-DNA insertions in leaf and root tissues. Expression of APRR2,
SAM, HIPP25 and SRBP in their respective mutants did not show significant differences. Since
the RT-qPCR analysis did not involve sufficient replication, these gene expression assays will
need to be repeated.
In Chapter Four, the uptake of NAs into slender wheatgrass seedlings was visualized using
radiolabeled NAs and phosphor imager autoradiography. These experiments were conducted
under sterile hydroponic conditions to determine the ability of plants alone to take up NAs
without the intervention of microbes. Plant rhizosphere and endophytic microbes are known to
play an important role in the remediation of certain types of organic compounds (Doty et al.,
2017). All of the radiolabelled NAs that were used in this study were removed from solution by
the plant. However, there were visible differences in the localization of the three groups of NAs
or their derived metabolites in these experiments. Exposure to the linear NAs (HA and DA)
resulted in high levels of radioactivity in shoot tissues. Conversely, radioactive signal was more
concentrated in root tissues when seedlings were treated with single-ringed NAs (CPCA and
CHCA) and the diamondoid NA, AdCA. Translocation factors of HA and DA were significantly
higher than the three other NAs. Nearly all of the radioactivity had been removed from the
nutrient solution when seedlings were grown in linear NAs. In contrast, radioactivity remaining

94
in solution in CPCA and CHCA treatments was approximately 5%, whereas AdCA treatments
resulted in approximately 15% of the radioisotope remaining in solution.
This thesis research provided insight into the identification of genes involved in NA
tolerance or degradation in plants. Additionally, with little being known about NA uptake in
plants, phosphor imager autoradiography has allowed us to produce novel information about the
uptake and translocation of NAs within plants. The use of NAs that were structurally variable
allowed us to correlate structural features with rate of uptake and movement throughout the
plant. Alongside previous work conducted in the Muench laboratory on the effect of NAs on the
dynamics of membrane bound organelles in plant cells, this research has provided additional
insight into the mechanisms responsible for plant mediated remediation of OSPW.
5.2 Future Directions
5.2.1 Mutant identification and the molecular mechanisms responsible for mutant NA
tolerance
Further investigation into identifying the genes responsible for conferring NA tolerance
using RT-qPCR expression analysis is required. Additionally, the mutant plants were not
exposed to NAs, which may affect the expression of genes of interest. The enhancer tetramer in
the T-DNA is not constitutive, but rather increases endogenous gene expression (Weigel et al.,
2000). To observe increased expression may require an NA stress response. Carrying out similar
gene expression studies using the AEO fraction, which contains a wide variety of organic and
inorganic contaminants, instead of a single NA, could allow for more accurate expression
responses. Once the affected genes are identified and the T-DNA insertion response is
determined, validation of the enhancer effect could be performed. For example, if the enhancer

95
was shown to significantly elevate the level of expression of the target gene, then validation
would involve producing transgenic plants that overexpress the gene to determine if these plants
also display the NA tolerance phenotype. The ultimate goal of this research is to identify
functional genes for NA tolerance that can be used as marker genes to select native plant
remediation species with enhanced levels of expression for increased remediation ability.
The six mutants that were studied here were identified from a screen of approximately
20,000 independent activation tagged lines. There remains an additional 80,000 lines in the
ABRC repository that could be screened for the identification of additional NA tolerance genes.
This type of extended screen could uncover NA degrading genes that have yet to be identified.
However, screening these additional lines would require a large body of work.
Screening mutants of genes that are involved in the same pathways as one of the six
mutants could provide additional research direction. For example, we could screen a CML9
overexpressor on NAs to determine if the same NA tolerant phenotype we observed in CS23127
A1-2 is present, as APRR2 interacts with CML9 in abiotic stress responses (Leba et al., 2012).
Another potential avenue would be to obtain mutants of genes involved in the mucilage
biosynthesis, such as PMEI6, pathways as two of our mutants had loss-of-function mutants due
to insertions in the introns of LUH and GL2 (Saez-Aguayo et al., 2013).
5.2.2 Radioactive NA studies
There are many different aspects of the phosphor imager autoradiography experiments that
could be explored to gain further knowledge regarding NA uptake in plants. Further research
using radioactive (14C) isotopes of NAs are ongoing or planned in the Muench laboratory.
Increasing the pH of the hydroponic solution would cause the NAs to be primarily in their

96
ionized form, which could potentially have effects on the ability of NAs to enter the root system
and subsequently translocate to the shoot (Headley and McMartin, 2004). Another modification
is to add radiolabeled NAs to the AEO fraction as part of the hydroponic solution. This may
trigger some physiological changes in the plant due to the presence of other non-NA components
of the AEO fraction. This, and performing experiments in soil, would provide a more accurate
representation of NA uptake in the field. Carrying out this experiment under non-sterile
conditions would allow us to see the effect of rhizospheric bacteria on NA degradation. An
extension of this work would be to inoculate the plants with bacterial species that thrive by
tailings ponds. These species are more likely to have adaptations that allow them to metabolize
NAs. Expanding the species of plants, such as willow, could contribute to understanding how
different species can remediate NAs.
Complementary experiments using heavy isotope (13C) labelled NAs would assist in
determining whether the NAs are biotransformed into other compounds upon uptake into plant
cells. This requires the use of high-resolution mass spectrometry approaches to resolve the
labelled NA against the extensive pool of organics that are present in plant cells. Also,
combining the isotopic NA analysis with the NA activation tagged mutants could provide insight
into the metabolic mechanisms for the NA tolerant phenotype in the mutants. While it would be
ideal from a remediation perspective that the mutants are taking up and biotransforming the NAs,
it is also possible that the NAs are not taken up in these mutants.
Successful development of phytoremediation systems to detoxify OSPW in tailings ponds
requires in-depth, fundamental knowledge about NA uptake, transformation, translocation and
storage. This involves metabolic, genetic, genomic, cell biological and physiological approaches
to study NA remediation by plants. The model plant Arabidopsis provides a valuable tool to

97
study the molecular genetic and genomic aspects of remediation that cannot be offered in
effectively in any other plant species. In addition, other creative approaches will provide
additional insight into NA phytoremediation, ultimately contributing to the selection of naturally
occurring native plant species that will perform maximally in the field.

98
References
Abhilash PC, Jamil S, Singh N (2009) Transgenic plants for enhanced biodegradation and
phytoremediation of organic xenobiotics. Biotechnol Adv 27: 474–488
De Abreu-Neto JB, Turchetto-Zolet AC, De Oliveira LFV, Bodanese Zanettini MH,
Margis-Pinheiro M (2013) Heavy metal-associated isoprenylated plant protein (HIPP):
Characterization of a family of proteins exclusive to plants. FEBS J 280: 1604–1616
Ahad JME, Pakdel H, Gammon PR, Siddique T, Kuznetsova A, Savard MM (2018)
Evaluating in situ biodegradation of 13C-labelled naphthenic acids in groundwater near oil
sands tailings ponds. Sci Total Environ 643: 392–399
Ajjawi I, Lu Y, Savage LJ, Bell SM, Last RL (2010) Large-scale reverse genetics in
Arabidopsis: Case studies from the Chloroplast 2010 project. Plant Physiol 152: 529–540
Alberts ME, Chua G, Muench DG (2019) Exposure to naphthenic acids and the acid
extractable organic fraction from oil sands process-affected water alters the subcellular
structure and dynamics of plant cells. Sci Total Environ 651: 2830–2844
Alonso JM, Ecker JR (2006) Moving forward in reverse: Genetic technologies to enable
genome-wide phenomic screens in Arabidopsis. Nat Rev Genet 7: 524–536
Alonso JM, Stepanova AN, Leisse TJ, Kim CJ, Chen H, Shinn P, Stevenson DK,
Zimmerman J, Barajas P, Cheuk R, et al (2003) Genome-wide insertional mutagenesis
of Arabidopsis thaliana. Science 301: 653–657
Apostol KG, Zwiazek JJ, MacKinnon MD (2004) Naphthenic acids affect plant water
conductance but do not alter shoot Na + and Cl - concentrations in jack pine (Pinus
banksiana) seedlings. Plant Soil 263: 183–190

99
Armstrong SA, Headley J V., Peru KM, Germida JJ (2009) Differences in phytotoxicity and
dissipation between ionized and nonionized oil sands naphthenic acids in wetland plants.
Environ Toxicol Chem 28: 2167–2174
Bernhardt R (2006) Cytochromes P450 as versatile biocatalysts. J Biotechnol 124: 128–145
Bevan M, Walsh S (2005) The Arabidopsis genome: a foundation for plant research. Genome
Res 15: 1632–42
Bisht S, Pandey P, Bhargava B, Sharma S, Kumar V, Krishan D (2015) Bioremediation of
polyaromatic hydrocarbons (PAHs) using rhizosphere technology. Brazilian J Microbiol 46:
7–21
Blakley ER (1974) The microbial degradation of cyclohexanecarboxylic acid: a pathway
involving aromatization to form p-hydroxybenzoic acid. Can J Microbiol 20: 1297–1306
Bowman DT, Warren LA, McCarry BE, Slater GF (2019) Profiling of individual naphthenic
acids at a composite tailings reclamation fen by comprehensive two-dimensional gas
chromatography-mass spectrometry. Sci Total Environ 649: 1522–1531
Brentner LB, Mukherji ST, Walsh SA, Schnoor JL (2010) Localization of hexahydro-1,3,5-
trinitro-1,3,5-triazine (RDX) and 2,4,6-trinitrotoluene (TNT) in poplar and switchgrass
plants using phosphor imager autoradiography. Environ Pollut 158: 470–475
Briggs GG, Rigitano RLO, Bromilow RH (1998) Physicochemical factors affecting the uptake
by roots and translocation to shoots of amine bases in Barley. Pestic Sci 54: 8–21
CAPP (2019) Canada’s Oil Sands Fact Book. Accessed from: https://www.capp.ca/wp-
content/uploads/2019/11/Oil_Sands_Fact_Book-349657.pdf.
Clarke J (2009) Cetyltrimethyl ammonium bromide (CTAB) DNA miniprep for plant DNA
isolation. Cold Spring Harb Protoc. doi: 10.1101/pdb.prot5177

100
Clemente JS, Fedorak PM (2005) A review of the occurrence, analyses, toxicity, and
biodegradation of naphthenic acids. Chemosphere 60: 585–600
Clemente JS, Mackinnon MD, Fedorak PM (2004) Aerobic Biodegradation of Two
Commercial Naphthenic Acids Preparations. Environ Sci Technol 38: 1009–1016
Cobbett CS (2000) Phytochelatins and Their Roles in Heavy Metal Detoxification. Plant Physiol
123: 825–832
Cobbett CS, Meagher RB (2002) Arabidopsis and the Genetic Potential for the
Phytoremediation of Toxic Elemental and Organic Pollutants. Arab B 1: e0032
Demeter MA, Lemire JA, Yue G, Ceri H, Turner RJ (2015) Culturing oil sands microbes as
mixed species communities enhances ex situ model naphthenic acid degradation. Front
Microbiol 6: 1–13
Doty SL, Freeman JL, Cohu CM, Burken JG, Firrincieli A, Simon A, Khan Z, Isebrands
JG, Lukas J, Blaylock MJ (2017) Enhanced Degradation of TCE on a Superfund Site
Using Endophyte-Assisted Poplar Tree Phytoremediation. Environ Sci Technol 51: 10050–
10058
El-Gendy AS, Svingos S, Brice D, Garretson JH, Schnoor J (2009) Assessments of the
Efficacy of a Long-Term Application of a Phytoremediation System Using Hybrid Poplar
Trees at Former Oil Tank Farm Sites. Water Environ Res 81: 486–498
Fennell J, Arciszewski TJ (2019) Current knowledge of seepage from oil sands tailings ponds
and its environmental influence in northeastern Alberta. Sci Total Environ 686: 968–985
Folwell BD, McGenity TJ, Whitby C (2020) Diamondoids are not forever: microbial
biotransformation of diamondoid carboxylic acids. Microb Biotechnol 13: 495–508
Frank RA, Fischer K, Kavanagh R, Kent Burnison B, Arsenault G, Headley J V., Peru
101
KM, Van Glen Kraak DER, Solomon KR (2009) Effect of carboxylic acid content on the
acute toxicity of oil sands naphthenic acids. Environ Sci Technol 43: 266–271
Frank RA, Kavanagh R, Kent Burnison B, Arsenault G, Headley J V., Peru KM, Van Der
Kraak G, Solomon KR (2008) Toxicity assessment of collected fractions from an
extracted naphthenic acid mixture. Chemosphere 72: 1309–1314
Frédette C, Labrecque M, Comeau Y, Brisson J (2019) Willows for environmental projects:
A literature review of results on evapotranspiration rate and its driving factors across the
genus Salix. J Environ Manage 246: 526–537
Gerhardt KE, Gerwing PD, Greenberg BM (2017) Opinion: Taking phytoremediation from
proven technology to accepted practice. Plant Sci 256: 170–185
Grewer DM, Young RF, Whittal RM, Fedorak PM (2010) Naphthenic acids and other acid-
extractables in water samples from Alberta: What is being measured? Sci Total Environ
408: 5997–6010
Hall J, Soole K, Bentham R (2011) Hydrocarbon phytoremediation in the family Fabaceae - a
review. Int J Phytoremediation 13: 317–332
Han X, Scott AS, Fedorak PM, Bataineh M, Martin JW (2008) Influence of Molecular
Structure on the Biodegradability of Naphthenic Acids. Environ Sci Technol 40: 1290–1295
Hanikenne M, Talke IN, Haydon MJ, Lanz C, Nolte A, Motte P, Kroymann J, Weigel D,
Krämer U (2008) Evolution of metal hyperaccumulation required cis-regulatory changes
and triplication of HMA4. Nature 453: 391–395
Headley J V., McMartin DW (2004) A review of the occurrence and fate of naphthenic acids in
aquatic environments. J Environ Sci Heal - Part A Toxic/Hazardous Subst Environ Eng 39:
1989–2010

102
Holowenko FM, MacKinnon MD, Fedorak PM (2002) Characterization of naphthenic acids in
oil sands wastewaters by gas chromatography-mass spectrometry. Water Res 36: 2843–
2855
Hull R, Covey SN, Dale P (2000) Genetically modified plants and the 35S promoter: Assessing
the risks and enhancing the debate. Microb Ecol Health Dis 12: 1–5
Imfeld G, Braeckevelt M, Kuschk P, Richnow HH (2009) Monitoring and assessing processes
of organic chemicals removal in constructed wetlands. Chemosphere 74: 349–362
Johnson RJ, Smith BE, Sutton PA, McGenity TJ, Rowland SJ, Whitby C (2011) Microbial
biodegradation of aromatic alkanoic naphthenic acids is affected by the degree of alkyl side
chain branching. ISME J 5: 486–496
Kamaluddin M, Zwiazek JJ (2002) Naphthenic acids inhibit root water transport, gas exchange
and leaf growth in aspen (Populus tremuloides) seedlings. Tree Physiol 22: 1265–1270
Kannel PR, Gan TY (2012) Naphthenic acids degradation and toxicity mitigation in tailings
wastewater systems and aquatic environments: A review. J Environ Sci Heal - Part A
Toxic/Hazardous Subst Environ Eng 47: 1–21
Khosla A, Paper JM, Boehler AP, Bradley AM, Neumann TR, Schrick K (2014) HD-Zip
proteins GL2 and HDG11 have redundant functions in Arabidopsis trichomes, and GL2
activates a positive feedback loop via MYB23. Plant Cell 26: 2184–2200
Kindzierski W, Jin J (2012) Review of Health Effects of Naphthenic Acids: Data Gaps and
Implications for Understanding Human Health Risk. Oil Sands Res. Inf. Netw.
Klepikova A V., Kasianov AS, Gerasimov ES, Logacheva MD, Penin AA (2016) A high
resolution map of the Arabidopsis thaliana developmental transcriptome based on RNA-seq
profiling. Plant J 88: 1058–1070

103
Koma D, Sakashita Y, Kubota K, Fujii Y, Hasumi F, Chung SY, Kubo M (2004)
Degradation pathways of cyclic alkanes in Rhodococcus sp. NDKK48. Appl Microbiol
Biotechnol 66: 92–99
Kong F xin, Sun G dong, Liu Z pei (2018) Degradation of polycyclic aromatic hydrocarbons in
soil mesocosms by microbial/plant bioaugmentation: Performance and mechanism.
Chemosphere 198: 83–91
Lai JWS, Pinto LJ, Kiehlmann E, Bendell-Young LI, Moore MM (1996) Factors that affect
the degradation of naphthenic acids in oil sands wastewater by indigenous microbial
communities. Environ Toxicol Chem 15: 1482–1491
Leba LJ, Perochon A, Cheval C, Ranty B, Galaud JP, Aldon D (2012) CML9, a
multifunctional Arabidopsis thaliana calmodulin-like protein involved in stress responses
and plant growth? Plant Signal Behav 7: 1121–1124
Lecourieux D, Ranjeva R, Pugin A (2006) Calcium in plant defence-signalling pathways:
Tansley review. New Phytol 171: 249–269
Lefrançois E, Quoreshi A, Khasa D, Fung M, Whyte LG, Roy S, Greer CW (2010) Field
performance of alder-Frankia symbionts for the reclamation of oil sands sites. Appl Soil
Ecol 46: 183–191
Leishman C, Widdup EE, Quesnel DM, Chua G, Gieg LM, Samuel MA, Muench DG
(2013) The effect of oil sands process-affected water and naphthenic acids on the
germination and development of Arabidopsis. Chemosphere 93: 380–387
Li C, Fu L, Stafford J, Belosevic M, Gamal El-Din M (2017) The toxicity of oil sands
process-affected water (OSPW): A critical review. Sci Total Environ 601–602: 1785–1802
Limmer M, Burken J (2016) Phytovolatilization of Organic Contaminants. Environ Sci

104
Technol 50: 6632–6643
Limmer MA, Burken JG (2014) Plant Translocation of Organic Compounds: Molecular and
Physicochemical Predictors. Environ Sci Technol Lett 1: 156–161
Llorens E, Camañes G, Lapeña L, García-Agustín P (2016) Priming by hexanoic acid induce
activation of mevalonic and linolenic pathways and promotes the emission of plant
volatiles. Front Plant Sci 7: 1–12
Luna Wolter GL, Naeth MA (2014) Dry Mature Fine Tailings as Oil Sands Reclamation
Substrates for Three Native Grasses. J Environ Qual 43: 1510
Mahaffey A, Dubé M (2016) Review of the composition and toxicity of oil sands process-
affected water. Environ Rev 25: 97–114
Mahar A, Wang P, Ali A, Awasthi MK, Lahori AH, Wang Q, Li R, Zhang Z (2016)
Challenges and opportunities in the phytoremediation of heavy metals contaminated soils:
A review. Ecotoxicol Environ Saf 126: 111–121
Marentette JR, Frank RA, Bartlett AJ, Gillis PL, Hewitt LM, Peru KM, Headley J V.,
Brunswick P, Shang D, Parrott JL (2015) Toxicity of naphthenic acid fraction
components extracted from fresh and aged oil sands process-affected waters, and
commercial naphthenic acid mixtures, to fathead minnow (Pimephales promelas) embryos.
Aquat Toxicol 164: 108–117
Marmiroli M, Pietrini F, Maestri E, Zacchini M, Marmiroli N, Massacci A (2011) Growth,
physiological and molecular traits in Salicaceae trees investigated for phytoremediation of
heavy metals and organics. Tree Physiol 31: 1319–1334
Mena-Benitez GL, Gandia-Herrero F, Graham S, Larson TR, McQueen-Mason SJ, French
CE, Rylott EL, Bruce NC (2008) Engineering a Catabolic Pathway in Plants for the
105
Degradation of 1,2-Dichloroethane. Plant Physiol 147: 1192–1198
Mendez MO, Maier RM (2008) Phytostabilization of mine tailings in arid and semiarid
environments - An emerging remediation technology. Environ Health Perspect 116: 278–
283
Mitter EK, de Freitas JR, Germida JJ (2020) Hydrocarbon-degrading genes in root
endophytic communities on oil sands reclamation covers. Int J Phytoremediation 22: 703–
712
Mohamed MH, Wilson LD, Headley J V., Peru KM (2008) Novel materials for environmental
remediation of tailing pond waters containing naphthenic acids. Process Saf Environ Prot
86: 237–243
Morandi GD, Wiseman SB, Pereira A, Mankidy R, Gault IGM, Martin JW, Giesy JP
(2015) Effects-Directed Analysis of Dissolved Organic Compounds in Oil Sands Process-
Affected Water. Environ Sci Technol 49: 12395–12404
Mosaddegh MH, Jafarian A, Ghasemi A, Mosaddegh A (2014) Phytoremediation of benzene,
toluene, ethylbenzene and xylene contaminated air by D. deremensis and O. microdasys
plants. J Environ Heal Sci Eng 12: 1–7
Newman LA, Reynolds CM (2004) Phytodegradation of organic compounds. Curr Opin
Biotechnol 15: 225–230
OAP (Oil Sands Advisory Panel) (2010) A foundation for the future: building an
environmental monitoring system for the oil sands. Report submitted to the Minister of the
Environment.
Oller I, Malato S, Sánchez-Pérez JA (2011) Combination of Advanced Oxidation Processes
and biological treatments for wastewater decontamination-A review. Sci Total Environ 409:

106
4141–4166
OSDC (2016) Facts about Alberta’s oil sands and its industry. Accessed from:
https://open.alberta.ca/publications/facts-about-alberta-s-oil-sands-and-its-industry
Paulssen JM, Gieg LM (2019) Biodegradation of 1-adamantanecarboxylic acid by algal-
bacterial microbial communities derived from oil sands tailings ponds. Algal Res 41:
101528
Purdy BG, Macdonald SE, Lieffers VJ (2005) Naturally saline boreal communities as models
for reclamation of saline oil sand tailings. Restor Ecol 13: 667–677
Qin R, How ZT, Gamal El-Din M (2019) Photodegradation of naphthenic acids induced by
natural photosensitizer in oil sands process water. Water Res 164: 114913
Quesnel DM, Bhaskar IM, Gieg LM, Chua G (2011) Naphthenic acid biodegradation by the
unicellular alga Dunaliella tertiolecta. Chemosphere 84: 504–511
Quinlan PJ, Tam KC (2015) Water treatment technologies for the remediation of naphthenic
acids in oil sands process-affected water. Chem Eng J 279: 696–714
Redman AD, Parkerton TF, Butler JD, Letinski DJ, Frank RA, Hewitt LM, Bartlett AJ,
Gillis PL, Marentette JR, Parrott JL, et al (2018) Application of the Target Lipid Model
and Passive Samplers to Characterize the Toxicity of Bioavailable Organics in Oil Sands
Process-Affected Water. Environ Sci Technol 52: 8039–8049
Reichenauer TG, Germida JJ (2008) Phytoremediation of organic contaminants in soil and
groundwater. ChemSusChem 1: 708–717
Renault S, Qualizza C, MacKinnon M (2004) Suitability of altai wildrye (Elymus angustus)
and slender wheatgrass (Agropyron trachycaulum) for initial reclamation of saline
composite tailings of oil sands. Environ Pollut 128: 339–349

107
Repas TS, Gillis DM, Boubakir Z, Bao X, Samuels GJ, Kaminskyj SGW (2017) Growing
plants on oily, nutrient-poor soil using a native symbiotic fungus. PLoS One 12: 1–15
Del Rio LF, Hadwin AKM, Pinto LJ, MacKinnon MD, Moore MM (2006) Degradation of
naphthenic acids by sediment micro-organisms. J Appl Microbiol 101: 1049–1061
Rontani JF, Bonin P (1992) Utilization of n-alkyl-substituted cyclohexanes by a marine
Alcaligenes. Chemosphere 24: 1441–1446
Saez-Aguayo S, Ralet MC, Berger A, Botran L, Ropartz D, Marion-Poll A, Northa HM
(2013) PECTIN METHYLESTERASE INHIBITOR6 promotes Arabidopsis mucilage
release by limiting methylesterification of homogalacturonan in seed coat epidermal cells.
Plant Cell 25: 308–323
Sakakibara M (2010) Phytoextraction And Phytovolatilization Of Arsenic From As-
Contaminated Soils By Pteris vittata. Proc. Annu. Int. Conf. Soils, Sediments, Water
Energy 12:
Schneeberger RG, Zhang K, Tatarinova T, Troukhan M, Kwok SF, Drais J, Klinger K,
Orejudos F, Macy K, Bhakta A, et al (2005) Agrobacterium T-DNA integration in
Arabidopsis is correlated with DNA sequence compositions that occur frequently in gene
promoter regions. Funct Integr Genomics 5: 240–253
Schneider CA, Rasband WS, Eliceiri KW (2012) NIH Image to ImageJ: 25 years of image
analysis. Nat Methods 9: 671–675
Scott AC, MacKinnon MD, Fedorak PM (2005) Naphthenic acids in athabasca oil sands
tailings waters are less biodegradable than commercial naphthenic acids. Environ Sci
Technol 39: 8388–8394
Sedbrook JC, Ehrhardt DW, Fisher SE, Scheible WR, Somerville CR (2004) The

108
Arabidopsis SKU6/SPIRAL1 gene encodes a plus end-localized microtubule-interacting
protein involved in directional cell expansion. Plant Cell 16: 1506–1520
Shi L, Katavic V, Yu Y, Kunst L, Haughn G (2012) Arabidopsis glabra2 mutant seeds
deficient in mucilage biosynthesis produce more oil. Plant J 69: 37–46
Siminszky B (2006) Plant cytochrome P450-mediated herbicide metabolism. Phytochem Rev 5:
445–458
Small CC, Cho S, Hashisho Z, Ulrich AC (2015) Emissions from oil sands tailings ponds:
Review of tailings pond parameters and emission estimates. J Pet Sci Eng 127: 490–501
Smith BE, Lewis CA, Belt ST, Whitby C, Rowland SJ (2008) Effects of alkyl chain branching
on the biotransformation of naphthenic acids. Environ Sci Technol 42: 9323–9328
Steudle E, Frensch J (1996) Water transport in plants: Role of the apoplast. Plant Soil 187: 67–
79
Stout JM, Boubakir Z, Ambrose SJ, Purves RW, Page JE (2012) The hexanoyl-CoA
precursor for cannabinoid biosynthesis is formed by an acyl-activating enzyme in Cannabis
sativa trichomes. Plant J 71: 353–365
Su YH, Zhu YG (2007) Transport mechanisms for the uptake of organic compounds by rice
(Oryza sativa) roots. Environ Pollut 148: 94–100
Suzuki N, Koizumi N, Sano H (2001) Screening of cadmium-responsive genes in Arabidopsis
thaliana. Plant, Cell Environ 24: 1177–1188
Tehseen M, Cairns N, Sherson S, Cobbett CS (2010) Metallochaperone-like genes in
Arabidopsis thaliana. Metallomics 2: 556–564
Tominaga-Wada R, Iwata M, Sugiyama J, Kotake T, Ishida T, Yokoyama R, Nishitani K,
Okada K, Wada T (2009) The GLABRA2 homeodomain protein directly regulates CESA5

109
and XTH17 gene expression in Arabidopsis roots. Plant J 60: 564–574
Touceda-González M, Prieto-Fernández, Renella G, Giagnoni L, Sessitsch A, Brader G,
Kumpiene J, Dimitriou I, Eriksson J, Friesl-Hanl W, et al (2017) Microbial community
structure and activity in trace element-contaminated soils phytomanaged by Gentle
Remediation Options (GRO). Environ Pollut 231: 237–251
Vervaeke P, Luyssaert S, Mertens J, Meers E, Tack FMG, Lust N (2003) Phytoremediation
prospects of willow stands on contaminated sediment: A field trial. Environ Pollut 126:
275–282
Vishnoi SR, Srivastava PN (2008) Phytoremediation - Green for environmental clean.
Taal2007 12th World Lake Conf 342005: 1016–1021
Vymazal J (2013) Emergent plants used in free water surface constructed wetlands: A review.
Ecol Eng 61: 582–592
Wang B, Wan Y, Gao Y, Yang M, Hu J (2013) Determination and characterization of oxy-
naphthenic acids in oilfield wastewater. Environ Sci Technol 47: 9545–9554
Weigel D, Ahn JH, Blázquez MA, Borevitz JO, Christensen SK, Fankhauser C, Ferrándiz
C, Kardailsky I, Malancharuvil EJ, Neff MM, et al (2000) Activation Tagging in
Arabidopsis. Plant Physiol 122: 1003–1014
Whitby C (2010) Microbial naphthenic Acid degradation., 1st ed. Adv Appl Microbiol. doi:
10.1016/S0065-2164(10)70003-4
Widdup EE, Chatfield-Reed K, Henry D, Chua G, Samuel MA, Muench DG (2015)
Identification of detoxification pathways in plants that are regulated in response to treatment
with organic compounds isolated from oil sands process-affected water. Chemosphere 139:
47–53

110
Wu C, De Visscher A, Gates ID (2019) On naphthenic acids removal from crude oil and oil
sands process-affected water. Fuel 253: 1229–1246
Wu H, Zhang J, Ngo HH, Guo W, Hu Z, Liang S, Fan J, Liu H (2015) A review on the
sustainability of constructed wetlands for wastewater treatment: Design and operation.
Bioresour Technol 175: 594–601
Yang S, Liang S, Yi L, Xu B, Cao J, Guo Y, Zhou Y (2014) Heavy metal accumulation and
phytostabilization potential of dominant plant species growing on manganese mine tailings.
Front Environ Sci Eng 8: 394–404
Zhang W-Q, Zwiazek J (2018) Hydraulic Redistribution in Slender Wheatgrass (Elymus
trachycaulus Link Malte) and Yellow Sweet Clover (Melilotus officinalis L.): Potential
Benefits for Land Reclamation. Agronomy 8: 308
Zhang X, Wiseman S, Yu H, Liu H, Giesy JP, Hecker M (2011) Assessing the toxicity of
naphthenic acids using a microbial genome wide live cell reporter array system. Environ Sci
Technol 45: 1984–1991
Zhao L, Li Y (2014) The C-terminus of AtGRIP is crucial for its self-association and for
targeting to golgi stacks in Arabidopsis. PLoS One 9: 1–6

111
Appendix
Appendix 1:
Processed and sorted sequence reads for Illumina targeted gene sequencing. See attached Excel
and Word files for sequence data.
Mutant Source
CS23120 A3-4 A3-4-4p1.xlsx
A3-4-4p2.xlsx
CS23127 A1-2 A1-2.xlsx
CS23152 A1-6 Index_1.A1-6_B.xlsx
CS23152 A2-1 CS23152 A2-1 Truncation.docx
CS23838 D1-3 Index_4.D1-3_B.xlsx
CS31166 A1-1 CS31166 A1-1 Truncation.docx

ELSEVIER LICENSE
TERMS AND CONDITIONS
Apr 29, 2020
This Agreement between University of Calgary -- Jeremy Wong ("You") and Elsevier
("Elsevier") consists of your license details and the terms and conditions provided by
Elsevier and Copyright Clearance Center.
License Number 4815551201561
License date Apr 24, 2020
Licensed Content Publisher Elsevier
Licensed Content Publication Elsevier Books
Licensed Content Title Advances in Applied Microbiology
Licensed Content Author Corinne Whitby
Licensed Content Date Jan 1, 2010
Licensed Content Pages 33
Start Page 93
End Page 125
Type of Use reuse in a thesis/dissertation
Portion figures/tables/illustrations
Number of figures/tables/illustrations 1
Format both print and electronic
Are you the author of this Elsevier
chapter? No
Will you be translating? No
Title Investigating the Genetics and Physiology of
Naphthenic Acid Remediation in Plants
Institution name University of Calgary
Expected presentation date Apr 2020
Portions Figure 3.2
Requestor Location
University of Calgary
2500 University Dr NW
Calgary, AB T2N 1N4
Canada
Attn: University of Calgary
Publisher Tax ID GB 494 6272 12
Total 0.00 USD
Terms and Conditions

INTRODUCTION
1. The publisher for this copyrighted material is Elsevier. By clicking "accept" in
connection with completing this licensing transaction, you agree that the following terms
and conditions apply to this transaction (along with the Billing and Payment terms and
conditions established by Copyright Clearance Center, Inc. ("CCC"), at the time that you
opened your Rightslink account and that are available at any time at
http://myaccount.copyright.com).
GENERAL TERMS
2. Elsevier hereby grants you permission to reproduce the aforementioned material subject
to the terms and conditions indicated.
3. Acknowledgement: If any part of the material to be used (for example, figures) has
appeared in our publication with credit or acknowledgement to another source, permission
must also be sought from that source. If such permission is not obtained then that material
may not be included in your publication/copies. Suitable acknowledgement to the source
must be made, either as a footnote or in a reference list at the end of your publication, as
follows:
"Reprinted from Publication title, Vol /edition number, Author(s), Title of article / title of
chapter, Pages No., Copyright (Year), with permission from Elsevier [OR APPLICABLE
SOCIETY COPYRIGHT OWNER]." Also Lancet special credit - "Reprinted from The
Lancet, Vol. number, Author(s), Title of article, Pages No., Copyright (Year), with
permission from Elsevier."
4. Reproduction of this material is confined to the purpose and/or media for which
permission is hereby given.
5. Altering/Modifying Material: Not Permitted. However figures and illustrations may be
altered/adapted minimally to serve your work. Any other abbreviations, additions, deletions
and/or any other alterations shall be made only with prior written authorization of Elsevier
Ltd. (Please contact Elsevier at [email protected]). No modifications can be made
to any Lancet figures/tables and they must be reproduced in full.
6. If the permission fee for the requested use of our material is waived in this instance,
please be advised that your future requests for Elsevier materials may attract a fee.
7. Reservation of Rights: Publisher reserves all rights not specifically granted in the
combination of (i) the license details provided by you and accepted in the course of this
licensing transaction, (ii) these terms and conditions and (iii) CCC's Billing and Payment
terms and conditions.
8. License Contingent Upon Payment: While you may exercise the rights licensed
immediately upon issuance of the license at the end of the licensing process for the

transaction, provided that you have disclosed complete and accurate details of your
proposed use, no license is finally effective unless and until full payment is received from
you (either by publisher or by CCC) as provided in CCC's Billing and Payment terms and
conditions. If full payment is not received on a timely basis, then any license preliminarily
granted shall be deemed automatically revoked and shall be void as if never
granted. Further, in the event that you breach any of these terms and conditions or any of
CCC's Billing and Payment terms and conditions, the license is automatically revoked and
shall be void as if never granted. Use of materials as described in a revoked license, as
well as any use of the materials beyond the scope of an unrevoked license, may constitute
copyright infringement and publisher reserves the right to take any and all action to protect
its copyright in the materials.
9. Warranties: Publisher makes no representations or warranties with respect to the licensed
material.
10. Indemnity: You hereby indemnify and agree to hold harmless publisher and CCC, and
their respective officers, directors, employees and agents, from and against any and all
claims arising out of your use of the licensed material other than as specifically authorized
pursuant to this license.
11. No Transfer of License: This license is personal to you and may not be sublicensed,
assigned, or transferred by you to any other person without publisher's written permission.
12. No Amendment Except in Writing: This license may not be amended except in a
writing signed by both parties (or, in the case of publisher, by CCC on publisher's behalf).
13. Objection to Contrary Terms: Publisher hereby objects to any terms contained in any
purchase order, acknowledgment, check endorsement or other writing prepared by you,
which terms are inconsistent with these terms and conditions or CCC's Billing and
Payment terms and conditions. These terms and conditions, together with CCC's Billing
and Payment terms and conditions (which are incorporated herein), comprise the entire
agreement between you and publisher (and CCC) concerning this licensing transaction. In
the event of any conflict between your obligations established by these terms and
conditions and those established by CCC's Billing and Payment terms and conditions, these
terms and conditions shall control.
14. Revocation: Elsevier or Copyright Clearance Center may deny the permissions
described in this License at their sole discretion, for any reason or no reason, with a full
refund payable to you. Notice of such denial will be made using the contact information
provided by you. Failure to receive such notice will not alter or invalidate the denial. In
no event will Elsevier or Copyright Clearance Center be responsible or liable for any costs,
expenses or damage incurred by you as a result of a denial of your permission request,
other than a refund of the amount(s) paid by you to Elsevier and/or Copyright Clearance
Center for denied permissions.

LIMITED LICENSE
The following terms and conditions apply only to specific license types:
15. Translation: This permission is granted for non-exclusive world English rights only
unless your license was granted for translation rights. If you licensed translation rights you
may only translate this content into the languages you requested. A professional translator
must perform all translations and reproduce the content word for word preserving the
integrity of the article.
16. Posting licensed content on any Website: The following terms and conditions apply
as follows: Licensing material from an Elsevier journal: All content posted to the web site
must maintain the copyright information line on the bottom of each image; A hyper-text
must be included to the Homepage of the journal from which you are licensing at
http://www.sciencedirect.com/science/journal/xxxxx or the Elsevier homepage for books at
http://www.elsevier.com; Central Storage: This license does not include permission for a
scanned version of the material to be stored in a central repository such as that provided by
Heron/XanEdu.
Licensing material from an Elsevier book: A hyper-text link must be included to the
Elsevier homepage at http://www.elsevier.com . All content posted to the web site must
maintain the copyright information line on the bottom of each image.
Posting licensed content on Electronic reserve: In addition to the above the following
clauses are applicable: The web site must be password-protected and made available only
to bona fide students registered on a relevant course. This permission is granted for 1 year
only. You may obtain a new license for future website posting.
17. For journal authors: the following clauses are applicable in addition to the above:
Preprints:
A preprint is an author's own write-up of research results and analysis, it has not been peer-
reviewed, nor has it had any other value added to it by a publisher (such as formatting,
copyright, technical enhancement etc.).
Authors can share their preprints anywhere at any time. Preprints should not be added to or
enhanced in any way in order to appear more like, or to substitute for, the final versions of
articles however authors can update their preprints on arXiv or RePEc with their Accepted
Author Manuscript (see below).
If accepted for publication, we encourage authors to link from the preprint to their formal
publication via its DOI. Millions of researchers have access to the formal publications on
ScienceDirect, and so links will help users to find, access, cite and use the best available

version. Please note that Cell Press, The Lancet and some society-owned have different
preprint policies. Information on these policies is available on the journal homepage.
Accepted Author Manuscripts: An accepted author manuscript is the manuscript of an
article that has been accepted for publication and which typically includes author-
incorporated changes suggested during submission, peer review and editor-author
communications.
Authors can share their accepted author manuscript:
• immediately
o via their non-commercial person homepage or blog
o by updating a preprint in arXiv or RePEc with the accepted manuscript
o via their research institute or institutional repository for internal institutional
uses or as part of an invitation-only research collaboration work-group
o directly by providing copies to their students or to research collaborators for
their personal use
o for private scholarly sharing as part of an invitation-only work group on
commercial sites with which Elsevier has an agreement
• After the embargo period
o via non-commercial hosting platforms such as their institutional repository
o via commercial sites with which Elsevier has an agreement
In all cases accepted manuscripts should:
• link to the formal publication via its DOI
• bear a CC-BY-NC-ND license - this is easy to do
• if aggregated with other manuscripts, for example in a repository or other site, be
shared in alignment with our hosting policy not be added to or enhanced in any way
to appear more like, or to substitute for, the published journal article.
Published journal article (JPA): A published journal article (PJA) is the definitive final
record of published research that appears or will appear in the journal and embodies all
value-adding publishing activities including peer review co-ordination, copy-editing,
formatting, (if relevant) pagination and online enrichment.
Policies for sharing publishing journal articles differ for subscription and gold open access
articles:
Subscription Articles: If you are an author, please share a link to your article rather than
the full-text. Millions of researchers have access to the formal publications on
ScienceDirect, and so links will help your users to find, access, cite, and use the best
available version.

Theses and dissertations which contain embedded PJAs as part of the formal submission
can be posted publicly by the awarding institution with DOI links back to the formal
publications on ScienceDirect.
If you are affiliated with a library that subscribes to ScienceDirect you have additional
private sharing rights for others' research accessed under that agreement. This includes use
for classroom teaching and internal training at the institution (including use in course packs
and courseware programs), and inclusion of the article for grant funding purposes.
Gold Open Access Articles: May be shared according to the author-selected end-user
license and should contain a CrossMark logo, the end user license, and a DOI link to the
formal publication on ScienceDirect.
Please refer to Elsevier's posting policy for further information.
18. For book authors the following clauses are applicable in addition to the
above: Authors are permitted to place a brief summary of their work online only. You are
not allowed to download and post the published electronic version of your chapter, nor may
you scan the printed edition to create an electronic version. Posting to a repository:
Authors are permitted to post a summary of their chapter only in their institution's
repository.
19. Thesis/Dissertation: If your license is for use in a thesis/dissertation your thesis may
be submitted to your institution in either print or electronic form. Should your thesis be
published commercially, please reapply for permission. These requirements include
permission for the Library and Archives of Canada to supply single copies, on demand, of
the complete thesis and include permission for Proquest/UMI to supply single copies, on
demand, of the complete thesis. Should your thesis be published commercially, please
reapply for permission. Theses and dissertations which contain embedded PJAs as part of
the formal submission can be posted publicly by the awarding institution with DOI links
back to the formal publications on ScienceDirect.
Elsevier Open Access Terms and Conditions
You can publish open access with Elsevier in hundreds of open access journals or in nearly
2000 established subscription journals that support open access publishing. Permitted third
party re-use of these open access articles is defined by the author's choice of Creative
Commons user license. See our open access license policy for more information.
Terms & Conditions applicable to all Open Access articles published with Elsevier:

Any reuse of the article must not represent the author as endorsing the adaptation of the
article nor should the article be modified in such a way as to damage the author's honour or
reputation. If any changes have been made, such changes must be clearly indicated.
The author(s) must be appropriately credited and we ask that you include the end user
license and a DOI link to the formal publication on ScienceDirect.
If any part of the material to be used (for example, figures) has appeared in our publication
with credit or acknowledgement to another source it is the responsibility of the user to
ensure their reuse complies with the terms and conditions determined by the rights holder.
Additional Terms & Conditions applicable to each Creative Commons user license:
CC BY: The CC-BY license allows users to copy, to create extracts, abstracts and new
works from the Article, to alter and revise the Article and to make commercial use of the
Article (including reuse and/or resale of the Article by commercial entities), provided the
user gives appropriate credit (with a link to the formal publication through the relevant
DOI), provides a link to the license, indicates if changes were made and the licensor is not
represented as endorsing the use made of the work. The full details of the license are
available at http://creativecommons.org/licenses/by/4.0.
CC BY NC SA: The CC BY-NC-SA license allows users to copy, to create extracts,
abstracts and new works from the Article, to alter and revise the Article, provided this is
not done for commercial purposes, and that the user gives appropriate credit (with a link to
the formal publication through the relevant DOI), provides a link to the license, indicates if
changes were made and the licensor is not represented as endorsing the use made of the
work. Further, any new works must be made available on the same conditions. The full
details of the license are available at http://creativecommons.org/licenses/by-nc-sa/4.0.
CC BY NC ND: The CC BY-NC-ND license allows users to copy and distribute the
Article, provided this is not done for commercial purposes and further does not permit
distribution of the Article if it is changed or edited in any way, and provided the user gives
appropriate credit (with a link to the formal publication through the relevant DOI),
provides a link to the license, and that the licensor is not represented as endorsing the use
made of the work. The full details of the license are available at
http://creativecommons.org/licenses/by-nc-nd/4.0. Any commercial reuse of Open Access
articles published with a CC BY NC SA or CC BY NC ND license requires permission
from Elsevier and will be subject to a fee.
Commercial reuse includes:
• Associating advertising with the full text of the Article
• Charging fees for document delivery or access
• Article aggregation
• Systematic distribution via e-mail lists or share buttons

Posting or linking by commercial companies for use by customers of those companies.
20. Other Conditions:
v1.9
Questions? [email protected] or +1-855-239-3415 (toll free in the US) or
+1-978-646-2777.

ELSEVIER LICENSE
TERMS AND CONDITIONS
Apr 29, 2020
This Agreement between University of Calgary -- Jeremy Wong ("You") and Elsevier
("Elsevier") consists of your license details and the terms and conditions provided by
Elsevier and Copyright Clearance Center.
License Number 4815551104567
License date Apr 24, 2020
Licensed Content Publisher Elsevier
Licensed Content Publication Chemosphere
Licensed Content Title A review of the occurrence, analyses, toxicity, and
biodegradation of naphthenic acids
Licensed Content Author Joyce S. Clemente,Phillip M. Fedorak
Licensed Content Date Jul 1, 2005
Licensed Content Volume 60
Licensed Content Issue 5
Licensed Content Pages 16
Start Page 585
End Page 600
Type of Use reuse in a thesis/dissertation
Portion figures/tables/illustrations
Number of figures/tables/illustrations 1
Format both print and electronic
Are you the author of this Elsevier
article? No
Will you be translating? No
Title Investigating the Genetics and Physiology of
Naphthenic Acid Remediation in Plants
Institution name University of Calgary
Expected presentation date Apr 2020
Portions Figure 3
Requestor Location
University of Calgary
2500 University Dr NW
Calgary, AB T2N 1N4
Canada
Attn: University of Calgary

Publisher Tax ID GB 494 6272 12
Total 0.00 USD
Terms and Conditions
INTRODUCTION
1. The publisher for this copyrighted material is Elsevier. By clicking "accept" in
connection with completing this licensing transaction, you agree that the following terms
and conditions apply to this transaction (along with the Billing and Payment terms and
conditions established by Copyright Clearance Center, Inc. ("CCC"), at the time that you
opened your Rightslink account and that are available at any time at
http://myaccount.copyright.com).
GENERAL TERMS
2. Elsevier hereby grants you permission to reproduce the aforementioned material subject
to the terms and conditions indicated.
3. Acknowledgement: If any part of the material to be used (for example, figures) has
appeared in our publication with credit or acknowledgement to another source, permission
must also be sought from that source. If such permission is not obtained then that material
may not be included in your publication/copies. Suitable acknowledgement to the source
must be made, either as a footnote or in a reference list at the end of your publication, as
follows:
"Reprinted from Publication title, Vol /edition number, Author(s), Title of article / title of
chapter, Pages No., Copyright (Year), with permission from Elsevier [OR APPLICABLE
SOCIETY COPYRIGHT OWNER]." Also Lancet special credit - "Reprinted from The
Lancet, Vol. number, Author(s), Title of article, Pages No., Copyright (Year), with
permission from Elsevier."
4. Reproduction of this material is confined to the purpose and/or media for which
permission is hereby given.
5. Altering/Modifying Material: Not Permitted. However figures and illustrations may be
altered/adapted minimally to serve your work. Any other abbreviations, additions, deletions
and/or any other alterations shall be made only with prior written authorization of Elsevier
Ltd. (Please contact Elsevier at [email protected]). No modifications can be made
to any Lancet figures/tables and they must be reproduced in full.
6. If the permission fee for the requested use of our material is waived in this instance,
please be advised that your future requests for Elsevier materials may attract a fee.
7. Reservation of Rights: Publisher reserves all rights not specifically granted in the
combination of (i) the license details provided by you and accepted in the course of this

licensing transaction, (ii) these terms and conditions and (iii) CCC's Billing and Payment
terms and conditions.
8. License Contingent Upon Payment: While you may exercise the rights licensed
immediately upon issuance of the license at the end of the licensing process for the
transaction, provided that you have disclosed complete and accurate details of your
proposed use, no license is finally effective unless and until full payment is received from
you (either by publisher or by CCC) as provided in CCC's Billing and Payment terms and
conditions. If full payment is not received on a timely basis, then any license preliminarily
granted shall be deemed automatically revoked and shall be void as if never
granted. Further, in the event that you breach any of these terms and conditions or any of
CCC's Billing and Payment terms and conditions, the license is automatically revoked and
shall be void as if never granted. Use of materials as described in a revoked license, as
well as any use of the materials beyond the scope of an unrevoked license, may constitute
copyright infringement and publisher reserves the right to take any and all action to protect
its copyright in the materials.
9. Warranties: Publisher makes no representations or warranties with respect to the licensed
material.
10. Indemnity: You hereby indemnify and agree to hold harmless publisher and CCC, and
their respective officers, directors, employees and agents, from and against any and all
claims arising out of your use of the licensed material other than as specifically authorized
pursuant to this license.
11. No Transfer of License: This license is personal to you and may not be sublicensed,
assigned, or transferred by you to any other person without publisher's written permission.
12. No Amendment Except in Writing: This license may not be amended except in a
writing signed by both parties (or, in the case of publisher, by CCC on publisher's behalf).
13. Objection to Contrary Terms: Publisher hereby objects to any terms contained in any
purchase order, acknowledgment, check endorsement or other writing prepared by you,
which terms are inconsistent with these terms and conditions or CCC's Billing and
Payment terms and conditions. These terms and conditions, together with CCC's Billing
and Payment terms and conditions (which are incorporated herein), comprise the entire
agreement between you and publisher (and CCC) concerning this licensing transaction. In
the event of any conflict between your obligations established by these terms and
conditions and those established by CCC's Billing and Payment terms and conditions, these
terms and conditions shall control.
14. Revocation: Elsevier or Copyright Clearance Center may deny the permissions
described in this License at their sole discretion, for any reason or no reason, with a full
refund payable to you. Notice of such denial will be made using the contact information
provided by you. Failure to receive such notice will not alter or invalidate the denial. In
no event will Elsevier or Copyright Clearance Center be responsible or liable for any costs,

expenses or damage incurred by you as a result of a denial of your permission request,
other than a refund of the amount(s) paid by you to Elsevier and/or Copyright Clearance
Center for denied permissions.
LIMITED LICENSE
The following terms and conditions apply only to specific license types:
15. Translation: This permission is granted for non-exclusive world English rights only
unless your license was granted for translation rights. If you licensed translation rights you
may only translate this content into the languages you requested. A professional translator
must perform all translations and reproduce the content word for word preserving the
integrity of the article.
16. Posting licensed content on any Website: The following terms and conditions apply
as follows: Licensing material from an Elsevier journal: All content posted to the web site
must maintain the copyright information line on the bottom of each image; A hyper-text
must be included to the Homepage of the journal from which you are licensing at
http://www.sciencedirect.com/science/journal/xxxxx or the Elsevier homepage for books at
http://www.elsevier.com; Central Storage: This license does not include permission for a
scanned version of the material to be stored in a central repository such as that provided by
Heron/XanEdu.
Licensing material from an Elsevier book: A hyper-text link must be included to the
Elsevier homepage at http://www.elsevier.com . All content posted to the web site must
maintain the copyright information line on the bottom of each image.
Posting licensed content on Electronic reserve: In addition to the above the following
clauses are applicable: The web site must be password-protected and made available only
to bona fide students registered on a relevant course. This permission is granted for 1 year
only. You may obtain a new license for future website posting.
17. For journal authors: the following clauses are applicable in addition to the above:
Preprints:
A preprint is an author's own write-up of research results and analysis, it has not been peer-
reviewed, nor has it had any other value added to it by a publisher (such as formatting,
copyright, technical enhancement etc.).
Authors can share their preprints anywhere at any time. Preprints should not be added to or
enhanced in any way in order to appear more like, or to substitute for, the final versions of
articles however authors can update their preprints on arXiv or RePEc with their Accepted
Author Manuscript (see below).

If accepted for publication, we encourage authors to link from the preprint to their formal
publication via its DOI. Millions of researchers have access to the formal publications on
ScienceDirect, and so links will help users to find, access, cite and use the best available
version. Please note that Cell Press, The Lancet and some society-owned have different
preprint policies. Information on these policies is available on the journal homepage.
Accepted Author Manuscripts: An accepted author manuscript is the manuscript of an
article that has been accepted for publication and which typically includes author-
incorporated changes suggested during submission, peer review and editor-author
communications.
Authors can share their accepted author manuscript:
• immediately
o via their non-commercial person homepage or blog
o by updating a preprint in arXiv or RePEc with the accepted manuscript
o via their research institute or institutional repository for internal institutional
uses or as part of an invitation-only research collaboration work-group
o directly by providing copies to their students or to research collaborators for
their personal use
o for private scholarly sharing as part of an invitation-only work group on
commercial sites with which Elsevier has an agreement
• After the embargo period
o via non-commercial hosting platforms such as their institutional repository
o via commercial sites with which Elsevier has an agreement
In all cases accepted manuscripts should:
• link to the formal publication via its DOI
• bear a CC-BY-NC-ND license - this is easy to do
• if aggregated with other manuscripts, for example in a repository or other site, be
shared in alignment with our hosting policy not be added to or enhanced in any way
to appear more like, or to substitute for, the published journal article.
Published journal article (JPA): A published journal article (PJA) is the definitive final
record of published research that appears or will appear in the journal and embodies all
value-adding publishing activities including peer review co-ordination, copy-editing,
formatting, (if relevant) pagination and online enrichment.
Policies for sharing publishing journal articles differ for subscription and gold open access
articles:
Subscription Articles: If you are an author, please share a link to your article rather than
the full-text. Millions of researchers have access to the formal publications on

ScienceDirect, and so links will help your users to find, access, cite, and use the best
available version.
Theses and dissertations which contain embedded PJAs as part of the formal submission
can be posted publicly by the awarding institution with DOI links back to the formal
publications on ScienceDirect.
If you are affiliated with a library that subscribes to ScienceDirect you have additional
private sharing rights for others' research accessed under that agreement. This includes use
for classroom teaching and internal training at the institution (including use in course packs
and courseware programs), and inclusion of the article for grant funding purposes.
Gold Open Access Articles: May be shared according to the author-selected end-user
license and should contain a CrossMark logo, the end user license, and a DOI link to the
formal publication on ScienceDirect.
Please refer to Elsevier's posting policy for further information.
18. For book authors the following clauses are applicable in addition to the
above: Authors are permitted to place a brief summary of their work online only. You are
not allowed to download and post the published electronic version of your chapter, nor may
you scan the printed edition to create an electronic version. Posting to a repository:
Authors are permitted to post a summary of their chapter only in their institution's
repository.
19. Thesis/Dissertation: If your license is for use in a thesis/dissertation your thesis may
be submitted to your institution in either print or electronic form. Should your thesis be
published commercially, please reapply for permission. These requirements include
permission for the Library and Archives of Canada to supply single copies, on demand, of
the complete thesis and include permission for Proquest/UMI to supply single copies, on
demand, of the complete thesis. Should your thesis be published commercially, please
reapply for permission. Theses and dissertations which contain embedded PJAs as part of
the formal submission can be posted publicly by the awarding institution with DOI links
back to the formal publications on ScienceDirect.
Elsevier Open Access Terms and Conditions
You can publish open access with Elsevier in hundreds of open access journals or in nearly
2000 established subscription journals that support open access publishing. Permitted third
party re-use of these open access articles is defined by the author's choice of Creative
Commons user license. See our open access license policy for more information.
Terms & Conditions applicable to all Open Access articles published with Elsevier:

Any reuse of the article must not represent the author as endorsing the adaptation of the
article nor should the article be modified in such a way as to damage the author's honour or
reputation. If any changes have been made, such changes must be clearly indicated.
The author(s) must be appropriately credited and we ask that you include the end user
license and a DOI link to the formal publication on ScienceDirect.
If any part of the material to be used (for example, figures) has appeared in our publication
with credit or acknowledgement to another source it is the responsibility of the user to
ensure their reuse complies with the terms and conditions determined by the rights holder.
Additional Terms & Conditions applicable to each Creative Commons user license:
CC BY: The CC-BY license allows users to copy, to create extracts, abstracts and new
works from the Article, to alter and revise the Article and to make commercial use of the
Article (including reuse and/or resale of the Article by commercial entities), provided the
user gives appropriate credit (with a link to the formal publication through the relevant
DOI), provides a link to the license, indicates if changes were made and the licensor is not
represented as endorsing the use made of the work. The full details of the license are
available at http://creativecommons.org/licenses/by/4.0.
CC BY NC SA: The CC BY-NC-SA license allows users to copy, to create extracts,
abstracts and new works from the Article, to alter and revise the Article, provided this is
not done for commercial purposes, and that the user gives appropriate credit (with a link to
the formal publication through the relevant DOI), provides a link to the license, indicates if
changes were made and the licensor is not represented as endorsing the use made of the
work. Further, any new works must be made available on the same conditions. The full
details of the license are available at http://creativecommons.org/licenses/by-nc-sa/4.0.
CC BY NC ND: The CC BY-NC-ND license allows users to copy and distribute the
Article, provided this is not done for commercial purposes and further does not permit
distribution of the Article if it is changed or edited in any way, and provided the user gives
appropriate credit (with a link to the formal publication through the relevant DOI),
provides a link to the license, and that the licensor is not represented as endorsing the use
made of the work. The full details of the license are available at
http://creativecommons.org/licenses/by-nc-nd/4.0. Any commercial reuse of Open Access
articles published with a CC BY NC SA or CC BY NC ND license requires permission
from Elsevier and will be subject to a fee.
Commercial reuse includes:
• Associating advertising with the full text of the Article
• Charging fees for document delivery or access
• Article aggregation
• Systematic distribution via e-mail lists or share buttons

Posting or linking by commercial companies for use by customers of those companies.
20. Other Conditions:
v1.9
Questions? [email protected] or +1-855-239-3415 (toll free in the US) or
+1-978-646-2777.