INVESTIGATING THE CAPACITY OF CRACKING … 22 (2) February 2015 Filmy beams
16
IJRRAS 22 (2) ● February 2015 www.arpapress.com/Volumes/Vol22Issue2/IJRRAS_22_2_04.pdf 65 INVESTIGATING THE CAPACITY OF CRACKING TORSION OF CONCRETE PRISMATIC AND FILMY BEAMS WITH TRANSVERSE SPIRAL BARS Hadi Barghlame 1 & M.A. Lotfollahi-Yaghin 2 1 Department of Civil Engineering, Islamic Azad University, Ilkhchi Branch, Ilkhchi, Iran 2 Civil Engineering Faculty, University of Tabriz, Tabriz 51664, Iran Email: [email protected]; [email protected] ABSTRACT In this paper, the torsion capacity of cracking point on rectangular and shell like beams with spiral reinforcements in the torsion direction and its anti-direction are investigated. Also, the behavior of spirally-reinforced prismatic beams has been assessed. Therefore, models of above-mentioned beams have been numerically analyzed under various loads using ANSYS software. In this research, the operation of rectangular reinforced concrete beam is compared with the shell reinforced concrete beam. It was observed that, spirally-reinforced prismatic beam and beam with spiral links, show lower torsion capacity than beam with normal links also in anti-direction. 1. INTRODUCTION Torsion happens because of integrity and continuity of members and also under the effect of external loads in concrete structure. In the past, concrete designers didn't pay more attention to the effect of torsion in concrete structure. But lately, most of the researchers investigated the effect of torsion on different kinds of structures using the best method of numerical analyses like finite element method. This led to the advent of realistic standard design and methods. Taking into consideration different torsion and stresses happening in the structures, methods are found for torsion strength such as theory of bent buckle, theory of spatial trusses and etc. For the first time, the theory of spatial truss was mentioned by Rausch in 1929 and the theory of bent buckle was mentioned by Lessing in 1985 and Yudin in 1962 (Ameli 2007, Wang 1997). By extending the theory of spatial truss Collins found interesting results about angles of torsion cracking in reinforced concrete beams in 1980 (Collins 1980). Also, Hsu investigated the behavior of reinforced concrete beams after cracking according to the theory of softened-truss and also the final moment of torsion in 1985 (Hsu 1985, Hsu 1993). Many numerical methods were suggested and investigated by different researchers. Also, we can mention the researches done by Wang & Thomas in 1997 (Wang 1997), Csikos & Hegedus in 1998 (Csikos 1998), and also Wafa and colleagues in 1995 (Wafa 1995) in the field of finite analyses of reinforced concrete beams under the effect of torsion. The investigation of torsion behavior in reinforced concrete beam in order to create the behavior and analysis model of reinforced concrete beams versus torsion used combination of theories for reinforced and without reinforced concrete (Hsu 1985, Hsu 1993, Chalioris 2006). In order to resist reinforced concrete members versus torsion, we should use two different kinds of bars: 1) longitudinal bars, 2) Transverse bars. According to the cod ACI-318R-99 thin wall box method by ignoring central concrete core, resistance happens by external wall of section with approximately central links (ACI 318-99 1999). In this paper, torsion capacity and shaping of two different kinds of beams with concrete filled core (prismatic beam) as well as without-concrete filled core (shell beam) with three different kinds of ties, spirally positive and spirally negative were compared with each other. We used ANSYS in order to achieve the point with non-linear analysis. Behavior of reinforced concrete beams under torsion in torsion- turning diagram is presented in Fig. 1. In this diagram, torsion limitation Tcr which is not related to cracking concrete, shows the function is linear between torsion and turning. In T=Tcr concrete cracks, with constant T, it increases like stairs then bars used according to in order to absorb additional torsion. Also, researches in a field of torsion which made crack on concrete beams have been done by extending crack analysis and it shows affirmation of increasing in stair case at the time of cracking (Karayannis 2000). Extending crack analysis for concrete without reinforcement under the effect of torsion which was suggested by Karaynins (Karayannis 2000) approved successfully for reinforced concrete beams in order to predict elastic behavior before cracking (Chalioris 2006). Hsu and Mitchell found the same result in different researches where in torsion member of reinforced concrete, diagonal cracks which are created is a kind of shear cracks (Hsu 1984, Mitchell 1974). During the experiment done also spiral cracks can be noticed in torsion members (Panchacharam 2002).
Transcript of INVESTIGATING THE CAPACITY OF CRACKING … 22 (2) February 2015 Filmy beams
IJRRAS 22 (2) ● February 2015 www.arpapress.com/Volumes/Vol22Issue2/IJRRAS_22_2_04.pdf
65
INVESTIGATING THE CAPACITY OF CRACKING TORSION OF
CONCRETE PRISMATIC AND FILMY BEAMS WITH TRANSVERSE
SPIRAL BARS
Hadi Barghlame1 & M.A. Lotfollahi-Yaghin2 1Department of Civil Engineering, Islamic Azad University, Ilkhchi Branch, Ilkhchi, Iran
2Civil Engineering Faculty, University of Tabriz, Tabriz 51664, Iran
Email: [email protected]; [email protected]
ABSTRACT
In this paper, the torsion capacity of cracking point on rectangular and shell like beams with spiral reinforcements in
the torsion direction and its anti-direction are investigated. Also, the behavior of spirally-reinforced prismatic beams
has been assessed. Therefore, models of above-mentioned beams have been numerically analyzed under various
loads using ANSYS software. In this research, the operation of rectangular reinforced concrete beam is compared
with the shell reinforced concrete beam. It was observed that, spirally-reinforced prismatic beam and beam with
spiral links, show lower torsion capacity than beam with normal links also in anti-direction.
1. INTRODUCTION
Torsion happens because of integrity and continuity of members and also under the effect of external loads in
concrete structure. In the past, concrete designers didn't pay more attention to the effect of torsion in concrete
structure. But lately, most of the researchers investigated the effect of torsion on different kinds of structures using
the best method of numerical analyses like finite element method. This led to the advent of realistic standard design
and methods. Taking into consideration different torsion and stresses happening in the structures, methods are found
for torsion strength such as theory of bent buckle, theory of spatial trusses and etc. For the first time, the theory of
spatial truss was mentioned by Rausch in 1929 and the theory of bent buckle was mentioned by Lessing in 1985 and
Yudin in 1962 (Ameli 2007, Wang 1997). By extending the theory of spatial truss Collins found interesting results
about angles of torsion cracking in reinforced concrete beams in 1980 (Collins 1980). Also, Hsu investigated the
behavior of reinforced concrete beams after cracking according to the theory of softened-truss and also the final
moment of torsion in 1985 (Hsu 1985, Hsu 1993). Many numerical methods were suggested and investigated by
different researchers. Also, we can mention the researches done by Wang & Thomas in 1997 (Wang 1997), Csikos
& Hegedus in 1998 (Csikos 1998), and also Wafa and colleagues in 1995 (Wafa 1995) in the field of finite analyses
of reinforced concrete beams under the effect of torsion. The investigation of torsion behavior in reinforced concrete
beam in order to create the behavior and analysis model of reinforced concrete beams versus torsion used
combination of theories for reinforced and without reinforced concrete (Hsu 1985, Hsu 1993, Chalioris 2006).
In order to resist reinforced concrete members versus torsion, we should use two different kinds of bars: 1)
longitudinal bars, 2) Transverse bars. According to the cod ACI-318R-99 thin wall box method by ignoring central
concrete core, resistance happens by external wall of section with approximately central links (ACI 318-99 1999). In
this paper, torsion capacity and shaping of two different kinds of beams with concrete filled core (prismatic beam) as
well as without-concrete filled core (shell beam) with three different kinds of ties, spirally positive and spirally
negative were compared with each other. We used ANSYS in order to achieve the point with non-linear analysis.
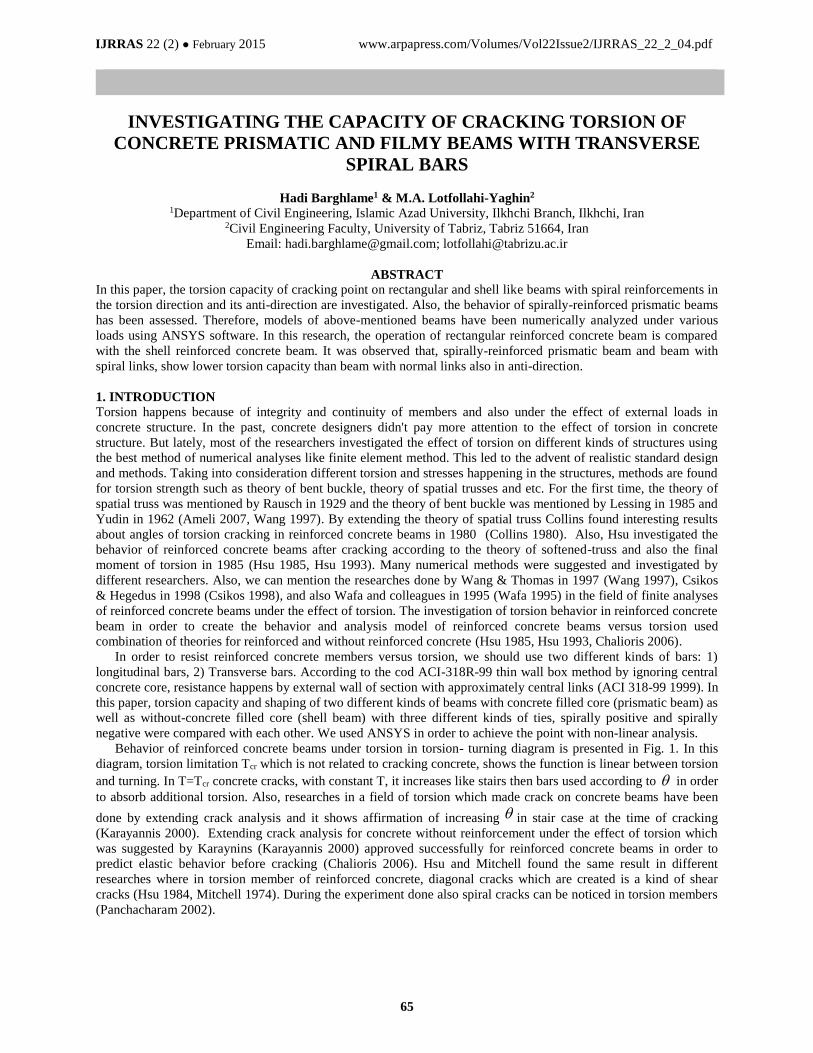
Behavior of reinforced concrete beams under torsion in torsion- turning diagram is presented in Fig. 1. In this
diagram, torsion limitation Tcr which is not related to cracking concrete, shows the function is linear between torsion
and turning. In T=Tcr concrete cracks, with constant T, it increases like stairs then bars used according to in order
to absorb additional torsion. Also, researches in a field of torsion which made crack on concrete beams have been
done by extending crack analysis and it shows affirmation of increasing in stair case at the time of cracking
(Karayannis 2000). Extending crack analysis for concrete without reinforcement under the effect of torsion which
was suggested by Karaynins (Karayannis 2000) approved successfully for reinforced concrete beams in order to
predict elastic behavior before cracking (Chalioris 2006). Hsu and Mitchell found the same result in different
researches where in torsion member of reinforced concrete, diagonal cracks which are created is a kind of shear
cracks (Hsu 1984, Mitchell 1974). During the experiment done also spiral cracks can be noticed in torsion members
(Panchacharam 2002).
IJRRAS 22 (2) ● February 2015 Barghlame & Yaghin ● The Capacity of Cracking Torsion
66
Fig. 1. Torsion- Turning diagram for torsional reinforced concrete beam
2. CONCRETE REINFORCED MIXTURE
The cable element, derived by using the concept of an equivalent modulus of elasticity and Reinforced concrete
combined with two kinds of materials namely steel and concrete. These two materials have two different kinds of
characteristics. Steel is a kind of material which is homogenous, whereas concrete is not a homogenous material.
Homogeneity of steel versus concrete mechanical attribute of this material depends on time and environment.
Mechanical attribute of pressure and tensile of steel can be found due to stress and strain diagram which is related to
tensile experiment (Lundgren 1999).
Behavior of reinforced concrete members versus torsion can be divided into 3 different phases: 1)The time
before cracking which is assumed to be homogenous. 2) The time of cracking where we use the theory of spatial
truss. 3) The time of yielding steel (plastic) (Csikos 1998).
3. MODELING STEEL AND CONCRETE IN ANSYS
In order to model concrete used SOLID65 element which has three nods and each nod has three degrees of freedom
in X, Y, Z direction. This element has the ability of plasticity and also an inclusive ability to crack and squash in
three directions (ACI 318-99 1999, Ansys Manual 1998, Bangash 1989, Chansawat 2000, William 1975). LINK8
element which is used to model bars in concrete has 2 knots in the beginning and the end of this element and each
knot has three degrees of freedom in X, Y, Z directions and also has the capacity of plastic shaping (Swanson 1995).
We can use two different ways in order to model reinforced concrete members in ANSYS. The first method in
SOLID65 element has the ability to show the ratio between steel and concrete area (smeared reinforcement), so we
can apply steel to concrete area for SOLID65 element. However it is impossible to measure accurate forces
occurring in bars. In another method which is used to model reinforced concrete members, first, reinforced concrete
members are modeled with SOLID65 (ratio between steel and concrete area is zero) then bars are applied by LINK8
between nods which are made by meshes on SOLID65 element. In this way, we should create meshes in SOLID65
element in a way to model bars at the start and end point of LINK8. In this way, we can easily measure stress and
strain of bars (Barbosa 1998).
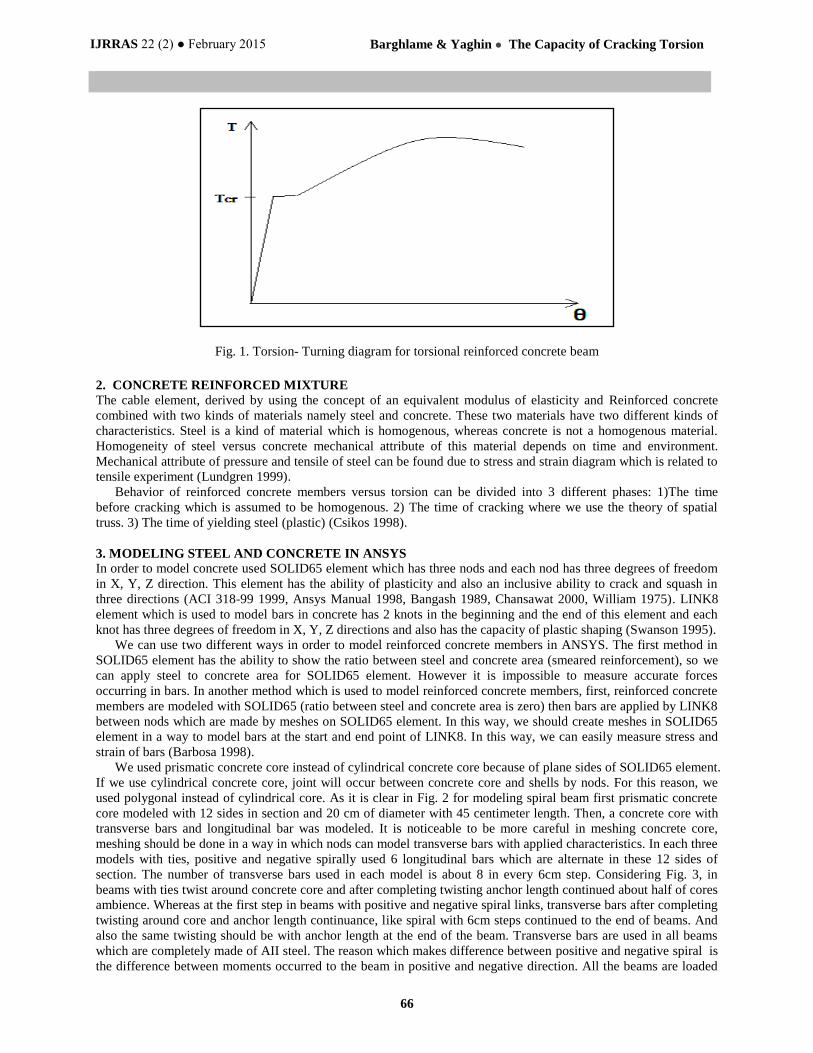
We used prismatic concrete core instead of cylindrical concrete core because of plane sides of SOLID65 element.
If we use cylindrical concrete core, joint will occur between concrete core and shells by nods. For this reason, we
used polygonal instead of cylindrical core. As it is clear in Fig. 2 for modeling spiral beam first prismatic concrete
core modeled with 12 sides in section and 20 cm of diameter with 45 centimeter length. Then, a concrete core with
transverse bars and longitudinal bar was modeled. It is noticeable to be more careful in meshing concrete core,
meshing should be done in a way in which nods can model transverse bars with applied characteristics. In each three
models with ties, positive and negative spirally used 6 longitudinal bars which are alternate in these 12 sides of
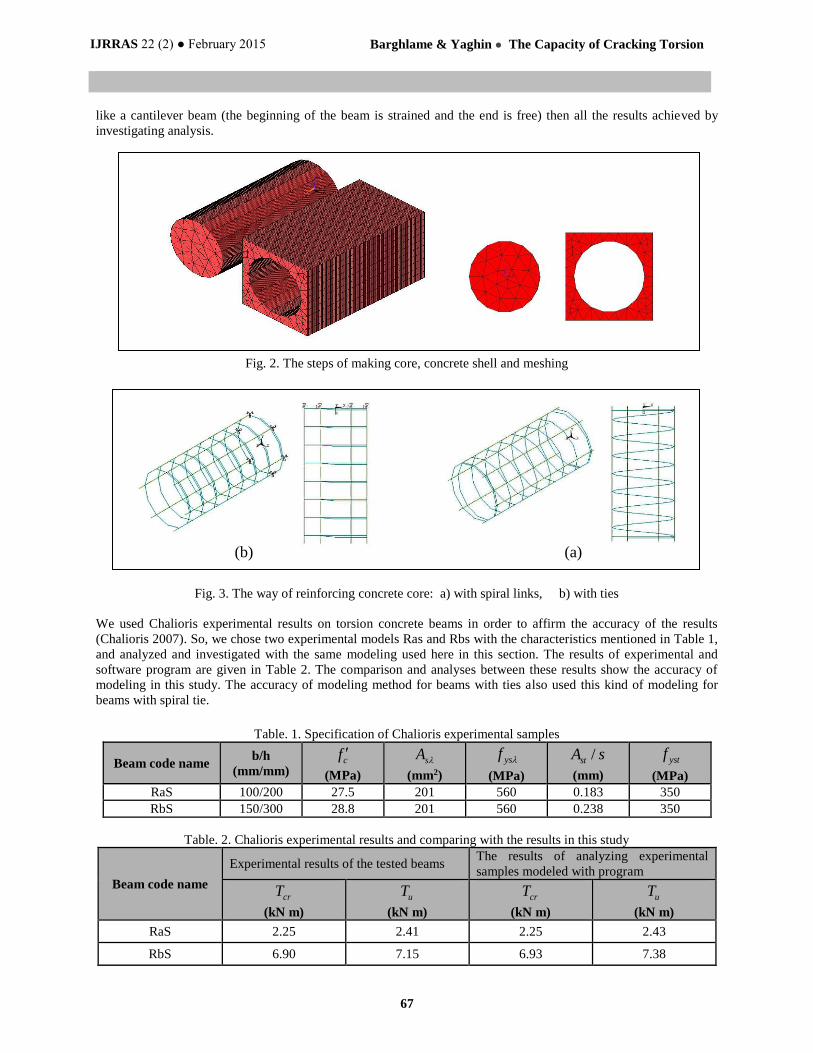
section. The number of transverse bars used in each model is about 8 in every 6cm step. Considering Fig. 3, in
beams with ties twist around concrete core and after completing twisting anchor length continued about half of cores
ambience. Whereas at the first step in beams with positive and negative spiral links, transverse bars after completing
twisting around core and anchor length continuance, like spiral with 6cm steps continued to the end of beams. And
also the same twisting should be with anchor length at the end of the beam. Transverse bars are used in all beams
which are completely made of AII steel. The reason which makes difference between positive and negative spiral is
the difference between moments occurred to the beam in positive and negative direction. All the beams are loaded
IJRRAS 22 (2) ● February 2015 Barghlame & Yaghin ● The Capacity of Cracking Torsion
67
like a cantilever beam (the beginning of the beam is strained and the end is free) then all the results achieved by
investigating analysis.
Fig. 2. The steps of making core, concrete shell and meshing
Fig. 3. The way of reinforcing concrete core: a) with spiral links, b) with ties
We used Chalioris experimental results on torsion concrete beams in order to affirm the accuracy of the results
(Chalioris 2007). So, we chose two experimental models Ras and Rbs with the characteristics mentioned in Table 1,
and analyzed and investigated with the same modeling used here in this section. The results of experimental and
software program are given in Table 2. The comparison and analyses between these results show the accuracy of
modeling in this study. The accuracy of modeling method for beams with ties also used this kind of modeling for
beams with spiral tie.
Table. 1. Specification of Chalioris experimental samples
ystf
(MPa)
sAst /
(mm)
ysf
(MPa)
sA
(mm2)
cf
(MPa)
b/h
(mm/mm) Beam code name
350 0.183 560 201 27.5 100/200 RaS
350 0.238 560 201 28.8 150/300 RbS
Table. 2. Chalioris experimental results and comparing with the results in this study
The results of analyzing experimental
samples modeled with program Experimental results of the tested beams
Beam code name uT
(kN m)
crT
(kN m)
uT
(kN m)
crT
(kN m)
2.43 2.25 2.41 2.25 RaS
7.38 6.93 7.15 6.90 RbS
(b) (a)
IJRRAS 22 (2) ● February 2015 Barghlame & Yaghin ● The Capacity of Cracking Torsion
68
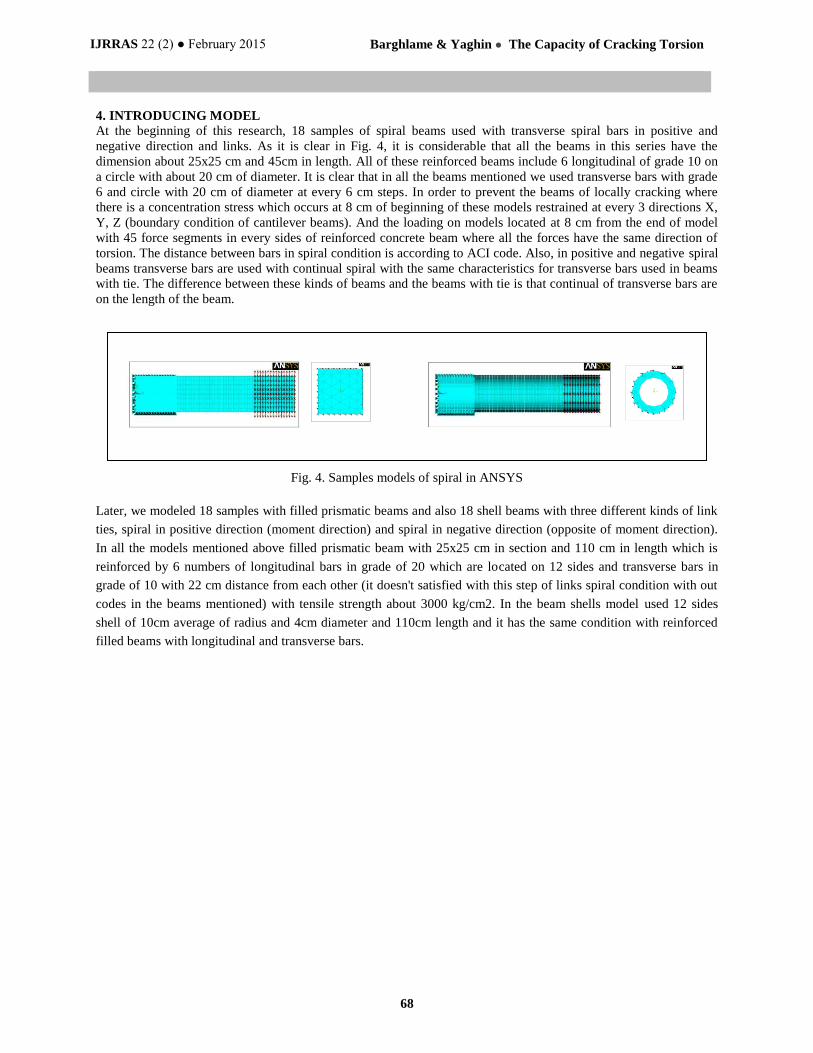
4. INTRODUCING MODEL
At the beginning of this research, 18 samples of spiral beams used with transverse spiral bars in positive and
negative direction and links. As it is clear in Fig. 4, it is considerable that all the beams in this series have the
dimension about 25x25 cm and 45cm in length. All of these reinforced beams include 6 longitudinal of grade 10 on
a circle with about 20 cm of diameter. It is clear that in all the beams mentioned we used transverse bars with grade
6 and circle with 20 cm of diameter at every 6 cm steps. In order to prevent the beams of locally cracking where
there is a concentration stress which occurs at 8 cm of beginning of these models restrained at every 3 directions X,
Y, Z (boundary condition of cantilever beams). And the loading on models located at 8 cm from the end of model
with 45 force segments in every sides of reinforced concrete beam where all the forces have the same direction of
torsion. The distance between bars in spiral condition is according to ACI code. Also, in positive and negative spiral
beams transverse bars are used with continual spiral with the same characteristics for transverse bars used in beams
with tie. The difference between these kinds of beams and the beams with tie is that continual of transverse bars are
on the length of the beam.
Fig. 4. Samples models of spiral in ANSYS
Later, we modeled 18 samples with filled prismatic beams and also 18 shell beams with three different kinds of link
ties, spiral in positive direction (moment direction) and spiral in negative direction (opposite of moment direction).
In all the models mentioned above filled prismatic beam with 25x25 cm in section and 110 cm in length which is
reinforced by 6 numbers of longitudinal bars in grade of 20 which are located on 12 sides and transverse bars in
grade of 10 with 22 cm distance from each other (it doesn't satisfied with this step of links spiral condition with out
codes in the beams mentioned) with tensile strength about 3000 kg/cm2. In the beam shells model used 12 sides
shell of 10cm average of radius and 4cm diameter and 110cm length and it has the same condition with reinforced
filled beams with longitudinal and transverse bars.
IJRRAS 22 (2) ● February 2015 Barghlame & Yaghin ● The Capacity of Cracking Torsion
69
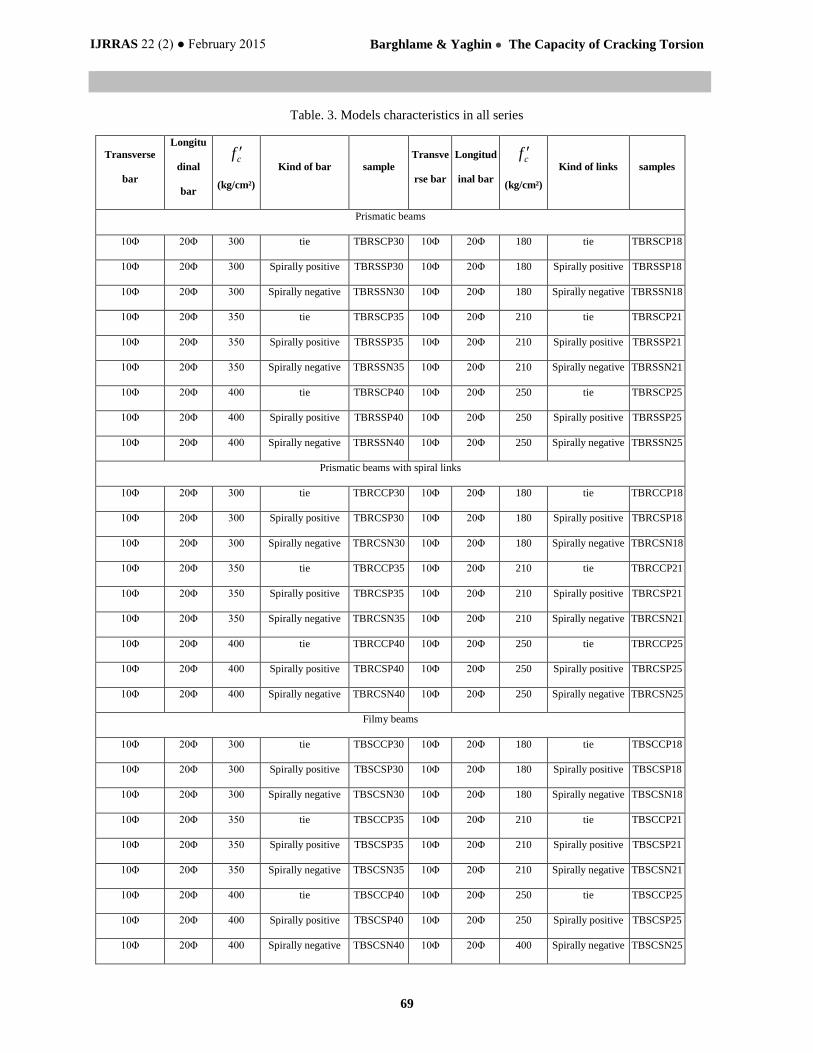
Table. 3. Models characteristics in all series
samples Kind of links cf
(kg/cm²)
Longitud
inal bar
Transve
rse bar
sample Kind of bar cf
(kg/cm²)
Longitu
dinal
bar
Transverse
bar
Prismatic beams
TBRSCP18 tie 180 20Φ 10Φ TBRSCP30 tie 300 20Φ 10Φ
TBRSSP18 Spirally positive 180 20Φ 10Φ TBRSSP30 Spirally positive 300 20Φ 10Φ
TBRSSN18 Spirally negative 180 20Φ 10Φ TBRSSN30 Spirally negative 300 20Φ 10Φ
TBRSCP21 tie 210 20Φ 10Φ TBRSCP35 tie 350 20Φ 10Φ
TBRSSP21 Spirally positive 210 20Φ 10Φ TBRSSP35 Spirally positive 350 20Φ 10Φ
TBRSSN21 Spirally negative 210 20Φ 10Φ TBRSSN35 Spirally negative 350 20Φ 10Φ
TBRSCP25 tie 250 20Φ 10Φ TBRSCP40 tie 400 20Φ 10Φ
TBRSSP25 Spirally positive 250 20Φ 10Φ TBRSSP40 Spirally positive 400 20Φ 10Φ
TBRSSN25 Spirally negative 250 20Φ 10Φ TBRSSN40 Spirally negative 400 20Φ 10Φ
Prismatic beams with spiral links
TBRCCP18 tie 180 20Φ 10Φ TBRCCP30 tie 300 20Φ 10Φ
TBRCSP18 Spirally positive 180 20Φ 10Φ TBRCSP30 Spirally positive 300 20Φ 10Φ
TBRCSN18 Spirally negative 180 20Φ 10Φ TBRCSN30 Spirally negative 300 20Φ 10Φ
TBRCCP21 tie 210 20Φ 10Φ TBRCCP35 tie 350 20Φ 10Φ
TBRCSP21 Spirally positive 210 20Φ 10Φ TBRCSP35 Spirally positive 350 20Φ 10Φ
TBRCSN21 Spirally negative 210 20Φ 10Φ TBRCSN35 Spirally negative 350 20Φ 10Φ
TBRCCP25 tie 250 20Φ 10Φ TBRCCP40 tie 400 20Φ 10Φ
TBRCSP25 Spirally positive 250 20Φ 10Φ TBRCSP40 Spirally positive 400 20Φ 10Φ
TBRCSN25 Spirally negative 250 20Φ 10Φ TBRCSN40 Spirally negative 400 20Φ 10Φ
Filmy beams
TBSCCP18 tie 180 20Φ 10Φ TBSCCP30 tie 300 20Φ 10Φ
TBSCSP18 Spirally positive 180 20Φ 10Φ TBSCSP30 Spirally positive 300 20Φ 10Φ
TBSCSN18 Spirally negative 180 20Φ 10Φ TBSCSN30 Spirally negative 300 20Φ 10Φ
TBSCCP21 tie 210 20Φ 10Φ TBSCCP35 tie 350 20Φ 10Φ
TBSCSP21 Spirally positive 210 20Φ 10Φ TBSCSP35 Spirally positive 350 20Φ 10Φ
TBSCSN21 Spirally negative 210 20Φ 10Φ TBSCSN35 Spirally negative 350 20Φ 10Φ
TBSCCP25 tie 250 20Φ 10Φ TBSCCP40 tie 400 20Φ 10Φ
TBSCSP25 Spirally positive 250 20Φ 10Φ TBSCSP40 Spirally positive 400 20Φ 10Φ
TBSCSN25 Spirally negative 400 20Φ 10Φ TBSCSN40 Spirally negative 400 20Φ 10Φ
IJRRAS 22 (2) ● February 2015 Barghlame & Yaghin ● The Capacity of Cracking Torsion
70
Characteristics of two different kinds of beams are given in Table 3. In these models, in order to prevent local
cracking as it is shown in Fig. 5, in all beams mentioned all nodes are located at 27cm at the beginning of models
where they were restrained in all three directions of x, y, z (cantilever beam boundary condition) and also loadings
are located at the end of 27cm of the model which has 112 force segments at each sides where all of them are in the
same direction of torsion. Shear transition coefficient for all models taken as 0.7 for analyzing (Lotfollahi 2005).
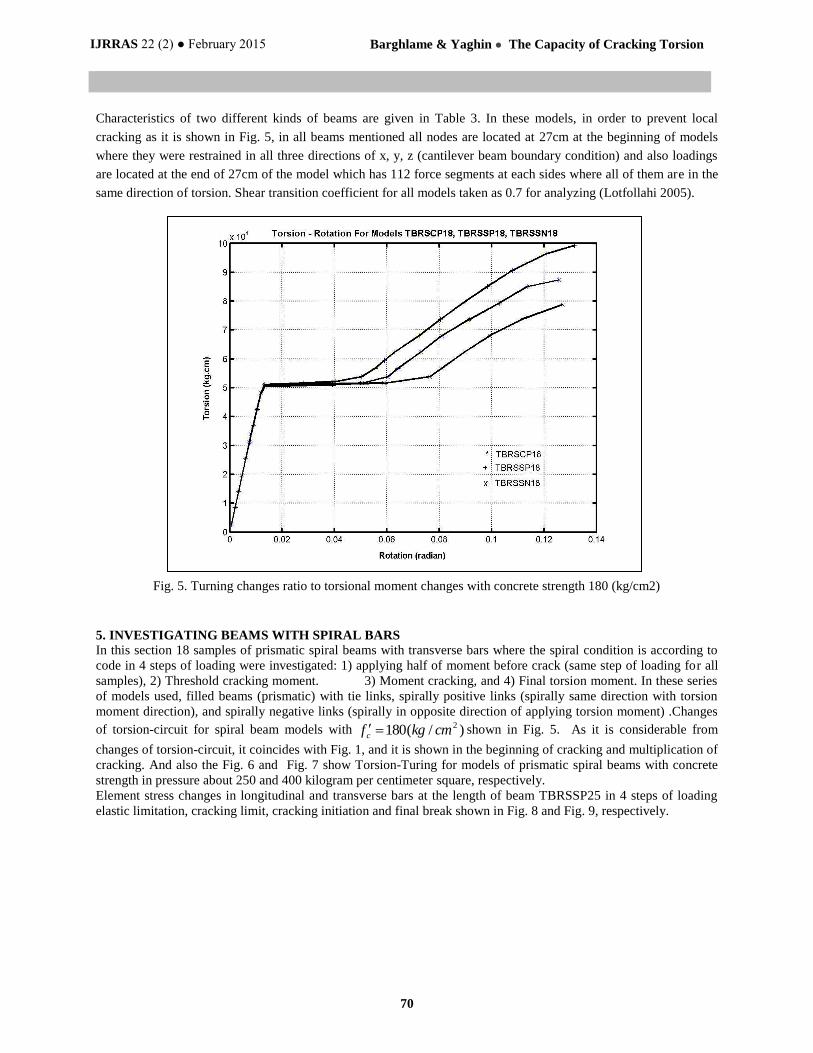
Fig. 5. Turning changes ratio to torsional moment changes with concrete strength 180 (kg/cm2)
5. INVESTIGATING BEAMS WITH SPIRAL BARS
In this section 18 samples of prismatic spiral beams with transverse bars where the spiral condition is according to
code in 4 steps of loading were investigated: 1) applying half of moment before crack (same step of loading for all
samples), 2) Threshold cracking moment. 3) Moment cracking, and 4) Final torsion moment. In these series
of models used, filled beams (prismatic) with tie links, spirally positive links (spirally same direction with torsion
moment direction), and spirally negative links (spirally in opposite direction of applying torsion moment) .Changes
of torsion-circuit for spiral beam models with )/(180 2cmkgf c shown in Fig. 5. As it is considerable from
changes of torsion-circuit, it coincides with Fig. 1, and it is shown in the beginning of cracking and multiplication of
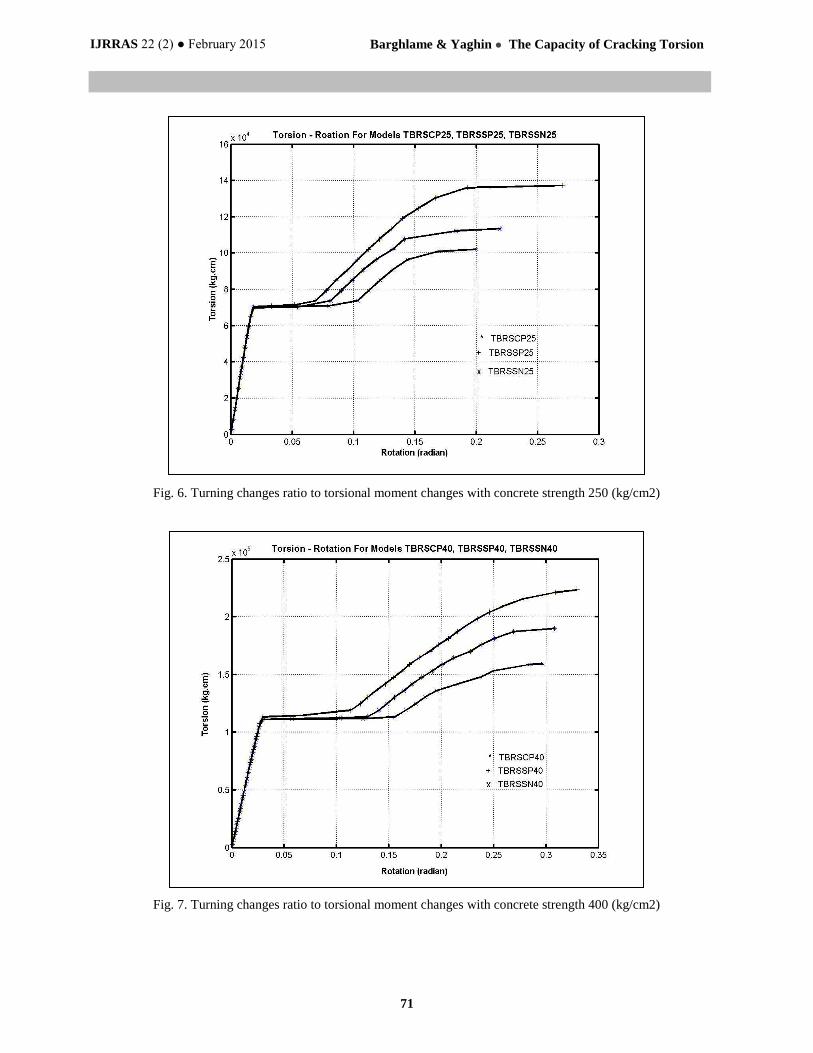
cracking. And also the Fig. 6 and Fig. 7 show Torsion-Turing for models of prismatic spiral beams with concrete
strength in pressure about 250 and 400 kilogram per centimeter square, respectively.
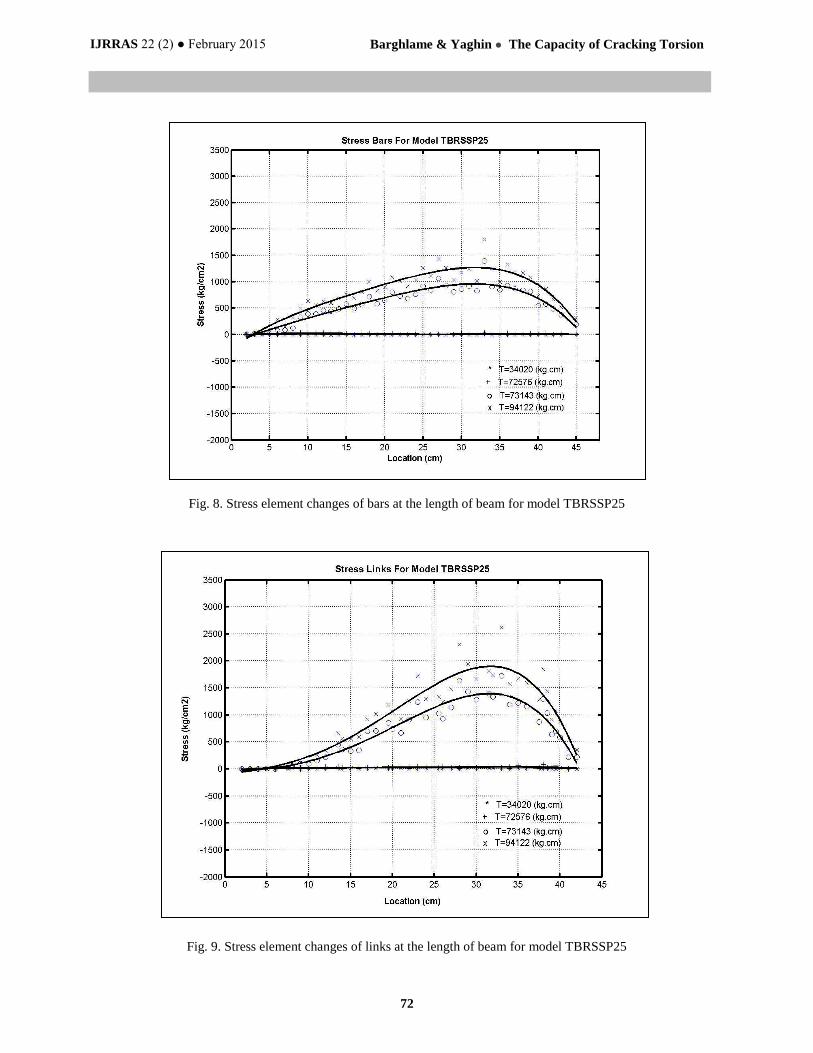
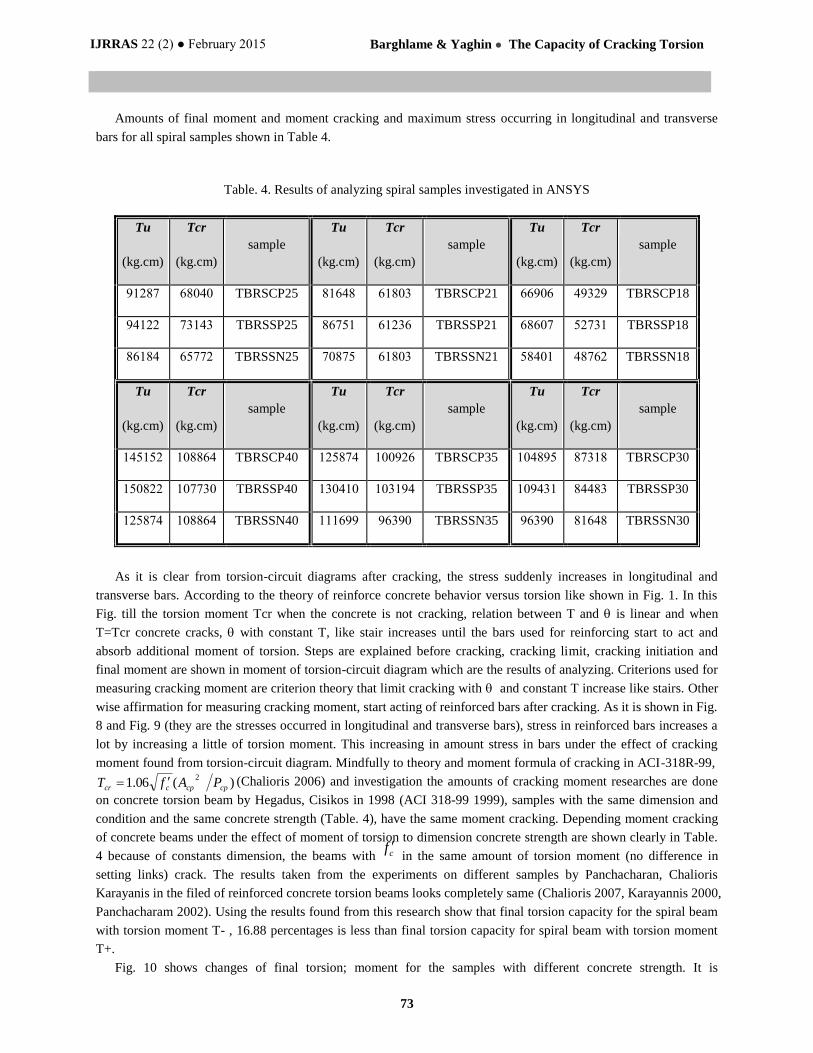
Element stress changes in longitudinal and transverse bars at the length of beam TBRSSP25 in 4 steps of loading
elastic limitation, cracking limit, cracking initiation and final break shown in Fig. 8 and Fig. 9, respectively.
IJRRAS 22 (2) ● February 2015 Barghlame & Yaghin ● The Capacity of Cracking Torsion
71
Fig. 6. Turning changes ratio to torsional moment changes with concrete strength 250 (kg/cm2)
Fig. 7. Turning changes ratio to torsional moment changes with concrete strength 400 (kg/cm2)
IJRRAS 22 (2) ● February 2015 Barghlame & Yaghin ● The Capacity of Cracking Torsion
72
Fig. 8. Stress element changes of bars at the length of beam for model TBRSSP25
Fig. 9. Stress element changes of links at the length of beam for model TBRSSP25
IJRRAS 22 (2) ● February 2015 Barghlame & Yaghin ● The Capacity of Cracking Torsion
73
Amounts of final moment and moment cracking and maximum stress occurring in longitudinal and transverse
bars for all spiral samples shown in Table 4.
Table. 4. Results of analyzing spiral samples investigated in ANSYS
sample
Tcr
(kg.cm)
Tu
(kg.cm)
sample
Tcr
(kg.cm)
Tu
(kg.cm)
sample
Tcr
(kg.cm)
Tu
(kg.cm)
TBRSCP18 49329 66906 TBRSCP21 61803 81648 TBRSCP25 68040 91287
TBRSSP18 52731 68607 TBRSSP21 61236 86751 TBRSSP25 73143 94122
TBRSSN18 48762 58401 TBRSSN21 61803 70875 TBRSSN25 65772 86184
sample
Tcr
(kg.cm)
Tu
(kg.cm)
sample
Tcr
(kg.cm)
Tu
(kg.cm)
sample
Tcr
(kg.cm)
Tu
(kg.cm)
TBRSCP30 87318 104895 TBRSCP35 100926 125874 TBRSCP40 108864 145152
TBRSSP30 84483 109431 TBRSSP35 103194 130410 TBRSSP40 107730 150822
TBRSSN30 81648 96390 TBRSSN35 96390 111699 TBRSSN40 108864 125874
As it is clear from torsion-circuit diagrams after cracking, the stress suddenly increases in longitudinal and
transverse bars. According to the theory of reinforce concrete behavior versus torsion like shown in Fig. 1. In this
Fig. till the torsion moment Tcr when the concrete is not cracking, relation between T and is linear and when
T=Tcr concrete cracks, with constant T, like stair increases until the bars used for reinforcing start to act and
absorb additional moment of torsion. Steps are explained before cracking, cracking limit, cracking initiation and
final moment are shown in moment of torsion-circuit diagram which are the results of analyzing. Criterions used for
measuring cracking moment are criterion theory that limit cracking with and constant T increase like stairs. Other
wise affirmation for measuring cracking moment, start acting of reinforced bars after cracking. As it is shown in Fig.
8 and Fig. 9 (they are the stresses occurred in longitudinal and transverse bars), stress in reinforced bars increases a
lot by increasing a little of torsion moment. This increasing in amount stress in bars under the effect of cracking
moment found from torsion-circuit diagram. Mindfully to theory and moment formula of cracking in ACI-318R-99,
)(06.12
cpcpccr PAfT (Chalioris 2006) and investigation the amounts of cracking moment researches are done
on concrete torsion beam by Hegadus, Cisikos in 1998 (ACI 318-99 1999), samples with the same dimension and
condition and the same concrete strength (Table. 4), have the same moment cracking. Depending moment cracking
of concrete beams under the effect of moment of torsion to dimension concrete strength are shown clearly in Table.
4 because of constants dimension, the beams with cf in the same amount of torsion moment (no difference in
setting links) crack. The results taken from the experiments on different samples by Panchacharan, Chalioris
Karayanis in the filed of reinforced concrete torsion beams looks completely same (Chalioris 2007, Karayannis 2000,
Panchacharam 2002). Using the results found from this research show that final torsion capacity for the spiral beam
with torsion moment T- , 16.88 percentages is less than final torsion capacity for spiral beam with torsion moment
T+.
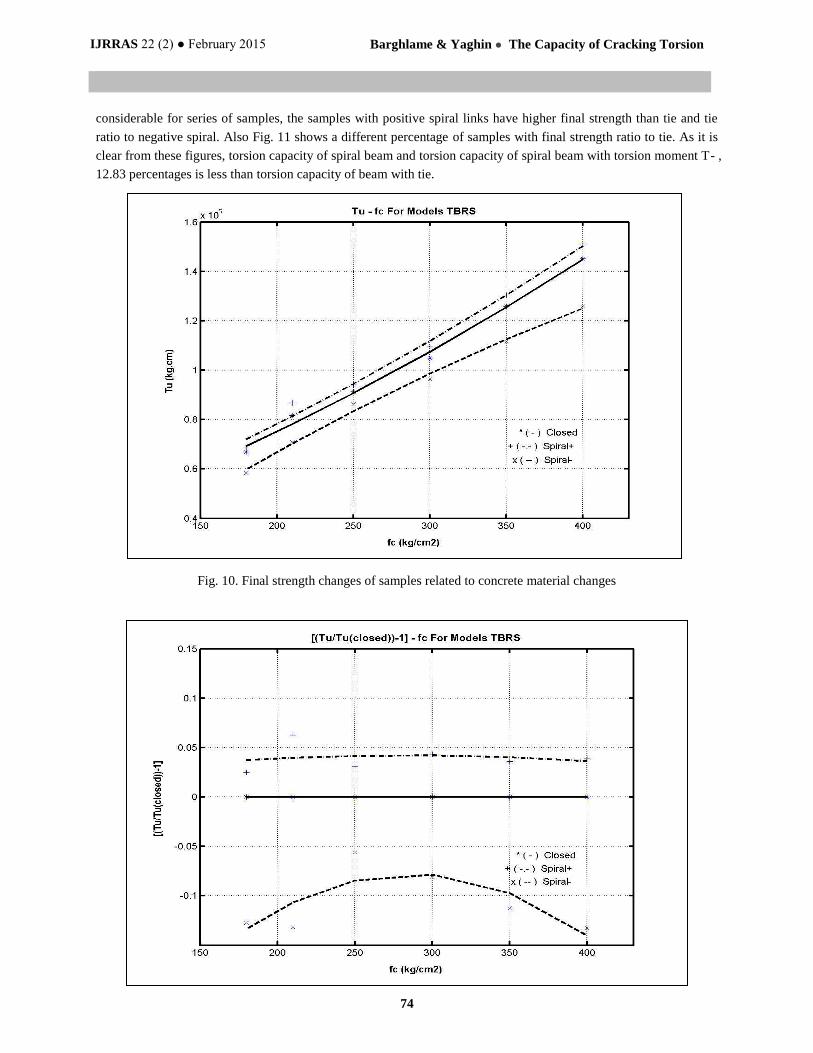
Fig. 10 shows changes of final torsion; moment for the samples with different concrete strength. It is
IJRRAS 22 (2) ● February 2015 Barghlame & Yaghin ● The Capacity of Cracking Torsion
74
considerable for series of samples, the samples with positive spiral links have higher final strength than tie and tie
ratio to negative spiral. Also Fig. 11 shows a different percentage of samples with final strength ratio to tie. As it is
clear from these figures, torsion capacity of spiral beam and torsion capacity of spiral beam with torsion moment T- ,
12.83 percentages is less than torsion capacity of beam with tie.
Fig. 10. Final strength changes of samples related to concrete material changes
IJRRAS 22 (2) ● February 2015 Barghlame & Yaghin ● The Capacity of Cracking Torsion
75
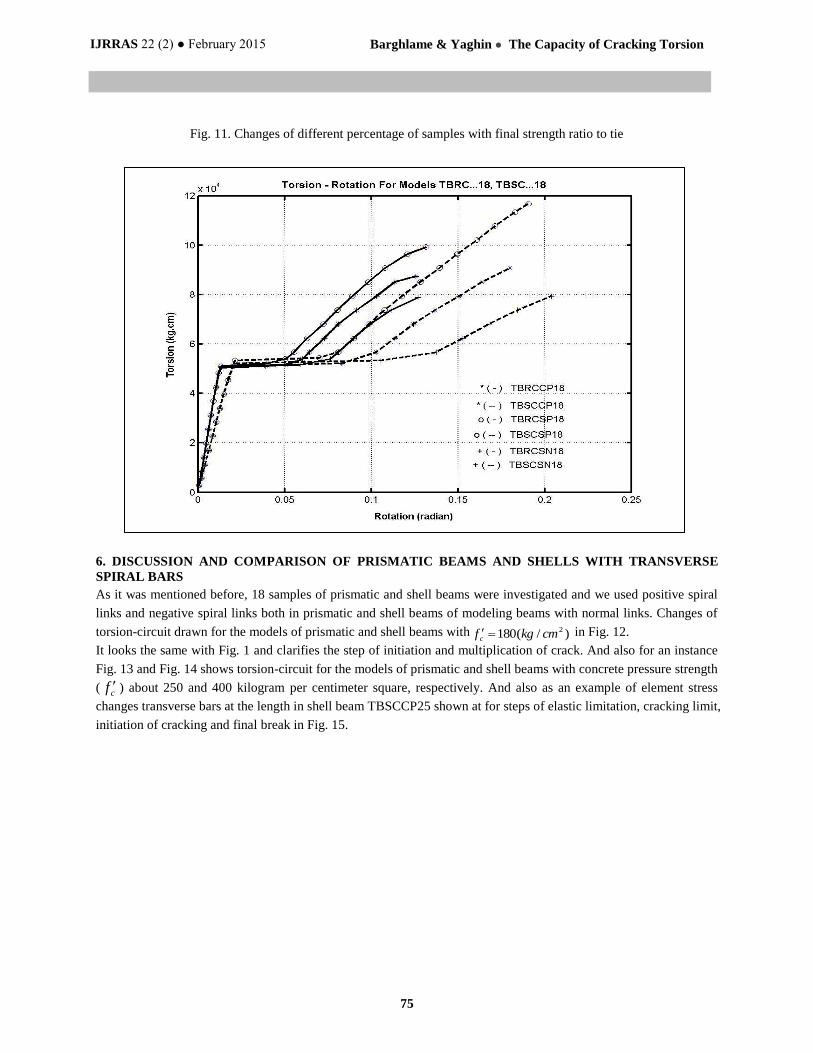
Fig. 11. Changes of different percentage of samples with final strength ratio to tie
Fig. 12. Changes of turning for torsional moment for prismatic and shell beams 180(kg/cm2)
6. DISCUSSION AND COMPARISON OF PRISMATIC BEAMS AND SHELLS WITH TRANSVERSE
SPIRAL BARS
As it was mentioned before, 18 samples of prismatic and shell beams were investigated and we used positive spiral
links and negative spiral links both in prismatic and shell beams of modeling beams with normal links. Changes of
torsion-circuit drawn for the models of prismatic and shell beams with )/(180 2cmkgf c in Fig. 12.
It looks the same with Fig. 1 and clarifies the step of initiation and multiplication of crack. And also for an instance
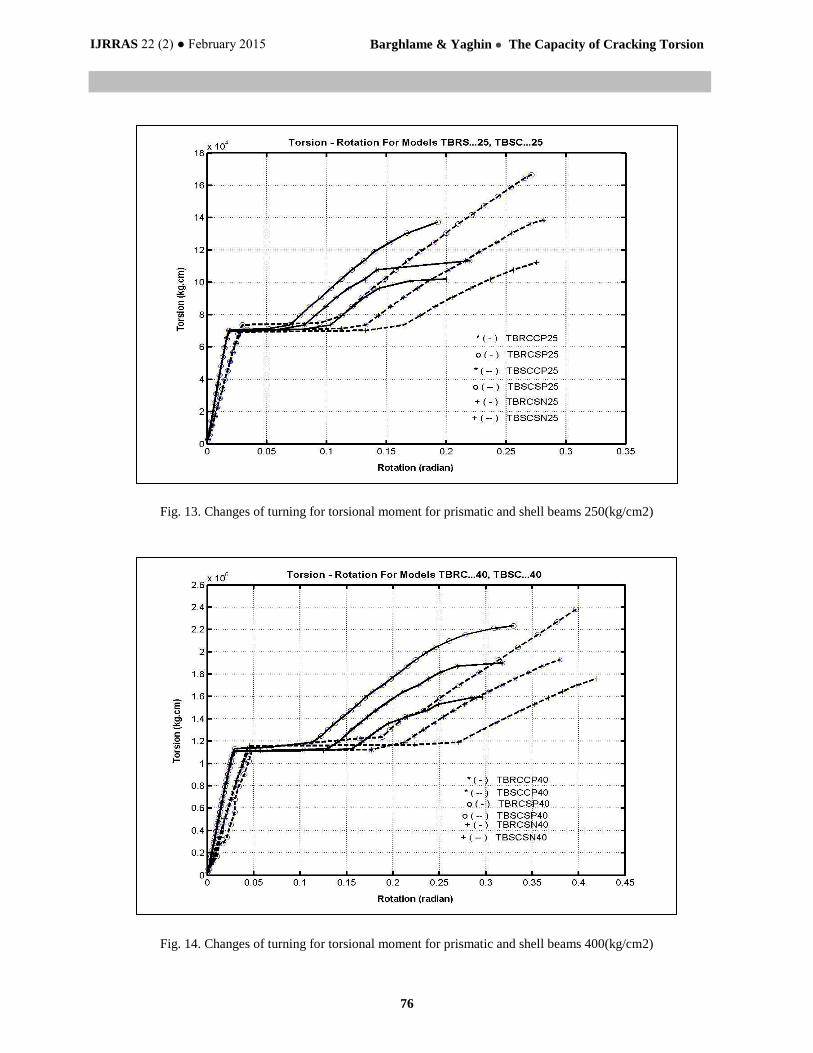
Fig. 13 and Fig. 14 shows torsion-circuit for the models of prismatic and shell beams with concrete pressure strength
( cf ) about 250 and 400 kilogram per centimeter square, respectively. And also as an example of element stress
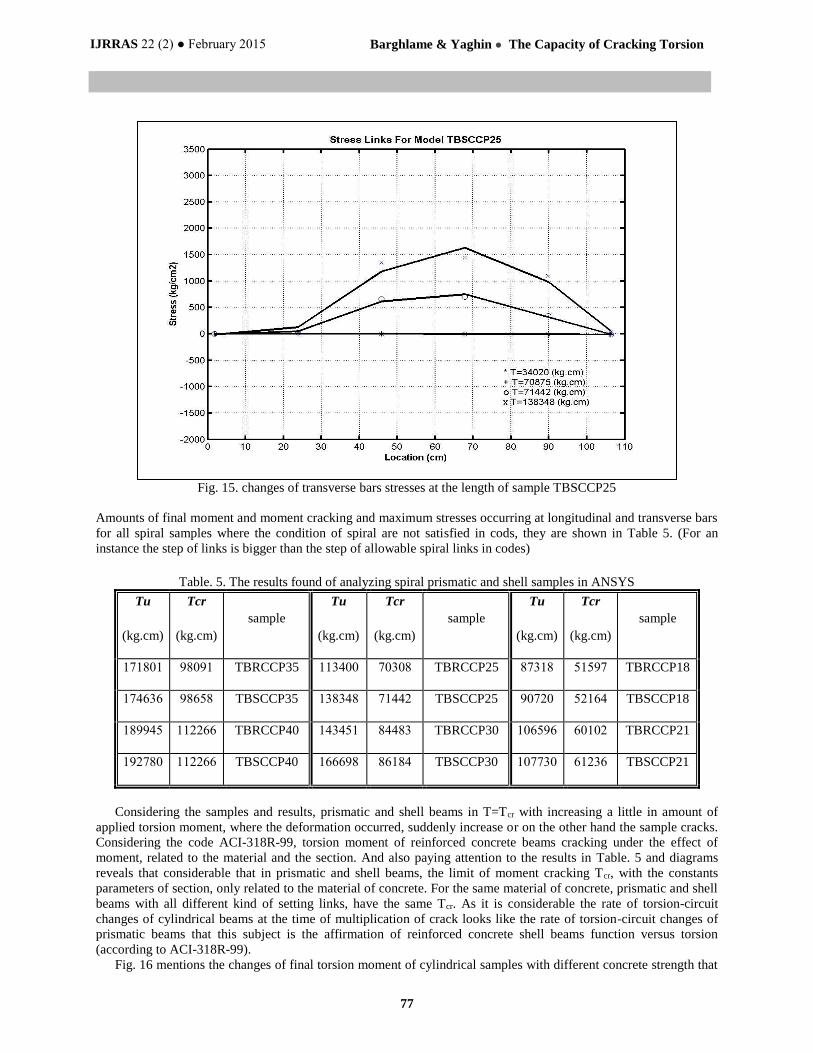
changes transverse bars at the length in shell beam TBSCCP25 shown at for steps of elastic limitation, cracking limit,
initiation of cracking and final break in Fig. 15.
IJRRAS 22 (2) ● February 2015 Barghlame & Yaghin ● The Capacity of Cracking Torsion
76
Fig. 13. Changes of turning for torsional moment for prismatic and shell beams 250(kg/cm2)
Fig. 14. Changes of turning for torsional moment for prismatic and shell beams 400(kg/cm2)
IJRRAS 22 (2) ● February 2015 Barghlame & Yaghin ● The Capacity of Cracking Torsion
77
Fig. 15. changes of transverse bars stresses at the length of sample TBSCCP25
Amounts of final moment and moment cracking and maximum stresses occurring at longitudinal and transverse bars
for all spiral samples where the condition of spiral are not satisfied in cods, they are shown in Table 5. (For an
instance the step of links is bigger than the step of allowable spiral links in codes)
Table. 5. The results found of analyzing spiral prismatic and shell samples in ANSYS
sample
Tcr
(kg.cm)
Tu
(kg.cm)
sample
Tcr
(kg.cm)
Tu
(kg.cm)
sample
Tcr
(kg.cm)
Tu
(kg.cm)
TBRCCP18 51597 87318 TBRCCP25 70308 113400 TBRCCP35 98091 171801
TBSCCP18 52164 90720 TBSCCP25 71442 138348 TBSCCP35 98658 174636
TBRCCP21 60102 106596 TBRCCP30 84483 143451 TBRCCP40 112266 189945
TBSCCP21 61236 107730 TBSCCP30 86184 166698 TBSCCP40 112266 192780
Considering the samples and results, prismatic and shell beams in T=Tcr with increasing a little in amount of
applied torsion moment, where the deformation occurred, suddenly increase or on the other hand the sample cracks.
Considering the code ACI-318R-99, torsion moment of reinforced concrete beams cracking under the effect of
moment, related to the material and the section. And also paying attention to the results in Table. 5 and diagrams
reveals that considerable that in prismatic and shell beams, the limit of moment cracking Tcr, with the constants
parameters of section, only related to the material of concrete. For the same material of concrete, prismatic and shell
beams with all different kind of setting links, have the same Tcr. As it is considerable the rate of torsion-circuit
changes of cylindrical beams at the time of multiplication of crack looks like the rate of torsion-circuit changes of
prismatic beams that this subject is the affirmation of reinforced concrete shell beams function versus torsion
(according to ACI-318R-99).
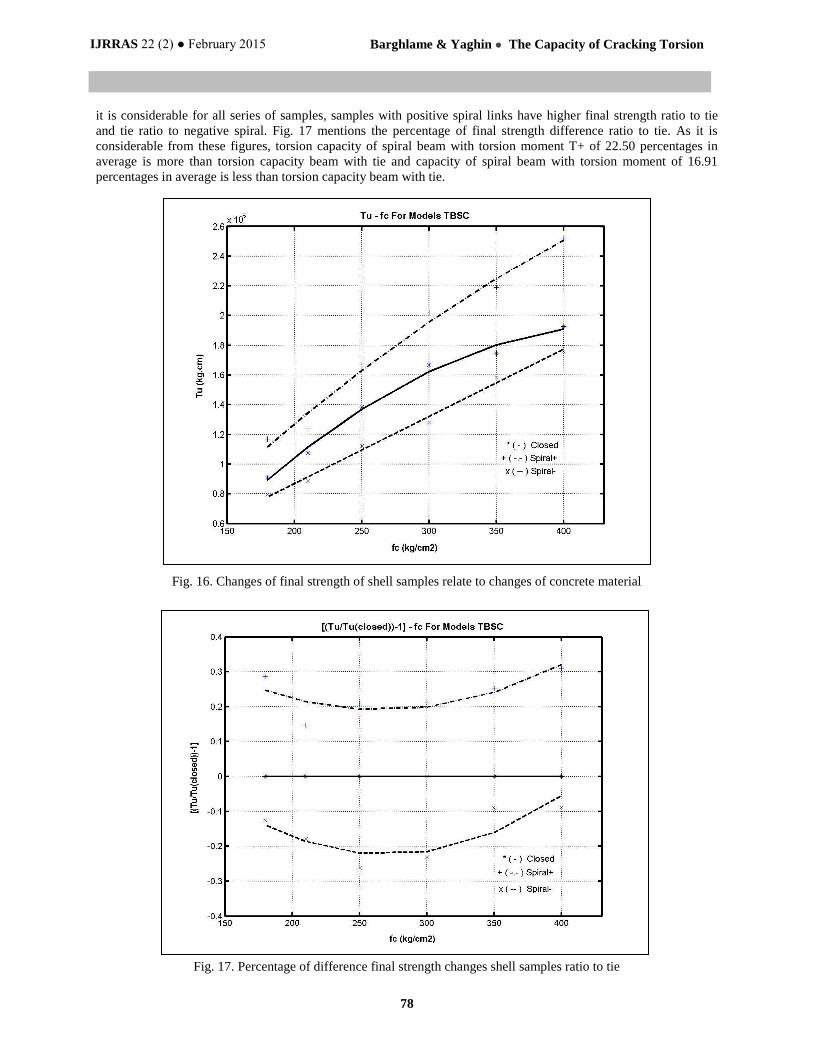
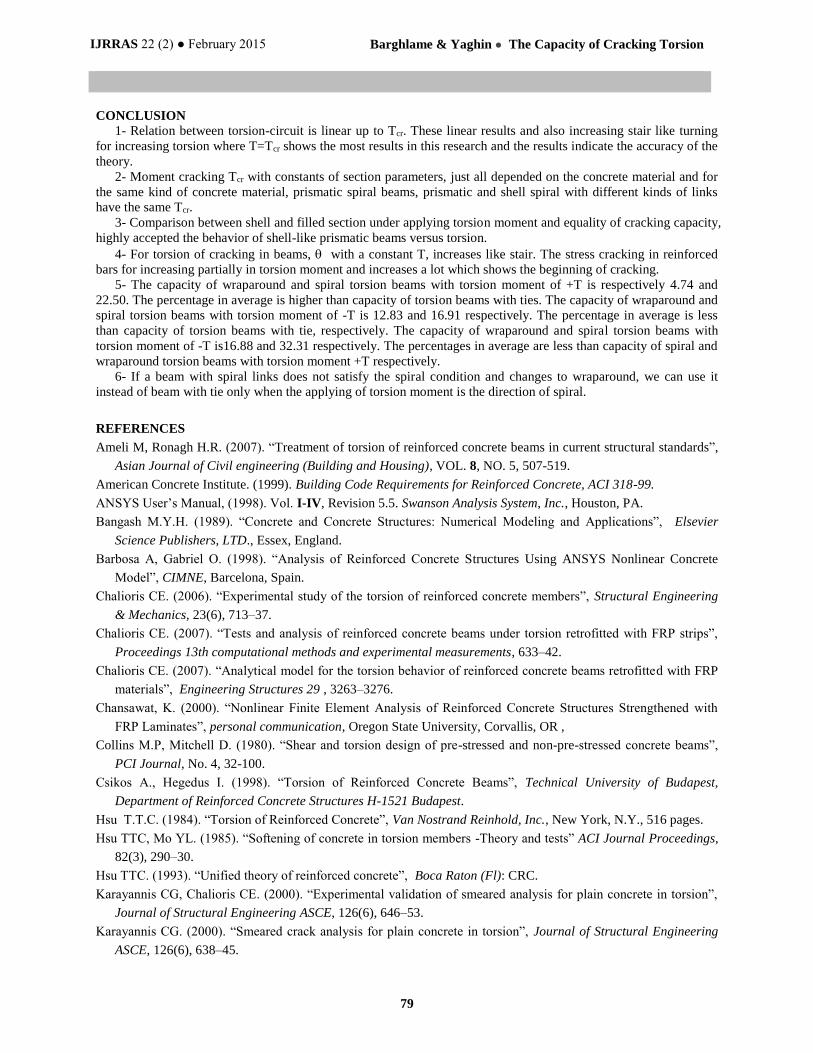
Fig. 16 mentions the changes of final torsion moment of cylindrical samples with different concrete strength that
IJRRAS 22 (2) ● February 2015 Barghlame & Yaghin ● The Capacity of Cracking Torsion
78
it is considerable for all series of samples, samples with positive spiral links have higher final strength ratio to tie
and tie ratio to negative spiral. Fig. 17 mentions the percentage of final strength difference ratio to tie. As it is
considerable from these figures, torsion capacity of spiral beam with torsion moment T+ of 22.50 percentages in
average is more than torsion capacity beam with tie and capacity of spiral beam with torsion moment of 16.91
percentages in average is less than torsion capacity beam with tie.
Fig. 16. Changes of final strength of shell samples relate to changes of concrete material
Fig. 17. Percentage of difference final strength changes shell samples ratio to tie
IJRRAS 22 (2) ● February 2015 Barghlame & Yaghin ● The Capacity of Cracking Torsion
79
CONCLUSION
1- Relation between torsion-circuit is linear up to Tcr. These linear results and also increasing stair like turning
for increasing torsion where T=Tcr shows the most results in this research and the results indicate the accuracy of the
theory.
2- Moment cracking Tcr with constants of section parameters, just all depended on the concrete material and for
the same kind of concrete material, prismatic spiral beams, prismatic and shell spiral with different kinds of links
have the same Tcr.
3- Comparison between shell and filled section under applying torsion moment and equality of cracking capacity,
highly accepted the behavior of shell-like prismatic beams versus torsion.
4- For torsion of cracking in beams, with a constant T, increases like stair. The stress cracking in reinforced
bars for increasing partially in torsion moment and increases a lot which shows the beginning of cracking.
5- The capacity of wraparound and spiral torsion beams with torsion moment of +T is respectively 4.74 and
22.50. The percentage in average is higher than capacity of torsion beams with ties. The capacity of wraparound and
spiral torsion beams with torsion moment of -T is 12.83 and 16.91 respectively. The percentage in average is less
than capacity of torsion beams with tie, respectively. The capacity of wraparound and spiral torsion beams with
torsion moment of -T is16.88 and 32.31 respectively. The percentages in average are less than capacity of spiral and
wraparound torsion beams with torsion moment +T respectively.
6- If a beam with spiral links does not satisfy the spiral condition and changes to wraparound, we can use it
instead of beam with tie only when the applying of torsion moment is the direction of spiral.
REFERENCES
Ameli M, Ronagh H.R. (2007). “Treatment of torsion of reinforced concrete beams in current structural standards”,
Asian Journal of Civil engineering (Building and Housing), VOL. 8, NO. 5, 507-519.
American Concrete Institute. (1999). Building Code Requirements for Reinforced Concrete, ACI 318-99.
ANSYS User’s Manual, (1998). Vol. I-IV, Revision 5.5. Swanson Analysis System, Inc., Houston, PA.
Bangash M.Y.H. (1989). “Concrete and Concrete Structures: Numerical Modeling and Applications”, Elsevier
Science Publishers, LTD., Essex, England.
Barbosa A, Gabriel O. (1998). “Analysis of Reinforced Concrete Structures Using ANSYS Nonlinear Concrete
Model”, CIMNE, Barcelona, Spain.
Chalioris CE. (2006). “Experimental study of the torsion of reinforced concrete members”, Structural Engineering
& Mechanics, 23(6), 713–37.
Chalioris CE. (2007). “Tests and analysis of reinforced concrete beams under torsion retrofitted with FRP strips”,
Proceedings 13th computational methods and experimental measurements, 633–42.
Chalioris CE. (2007). “Analytical model for the torsion behavior of reinforced concrete beams retrofitted with FRP
materials”, Engineering Structures 29 , 3263–3276.
Chansawat, K. (2000). “Nonlinear Finite Element Analysis of Reinforced Concrete Structures Strengthened with
FRP Laminates”, personal communication, Oregon State University, Corvallis, OR ,
Collins M.P, Mitchell D. (1980). “Shear and torsion design of pre-stressed and non-pre-stressed concrete beams”,
PCI Journal, No. 4, 32-100.
Csikos A., Hegedus I. (1998). “Torsion of Reinforced Concrete Beams”, Technical University of Budapest,
Department of Reinforced Concrete Structures H-1521 Budapest.
Hsu T.T.C. (1984). “Torsion of Reinforced Concrete”, Van Nostrand Reinhold, Inc., New York, N.Y., 516 pages.
Hsu TTC, Mo YL. (1985). “Softening of concrete in torsion members -Theory and tests” ACI Journal Proceedings,
82(3), 290–30.
Hsu TTC. (1993). “Unified theory of reinforced concrete”, Boca Raton (Fl): CRC.
Karayannis CG, Chalioris CE. (2000). “Experimental validation of smeared analysis for plain concrete in torsion”,
Journal of Structural Engineering ASCE, 126(6), 646–53.
Karayannis CG. (2000). “Smeared crack analysis for plain concrete in torsion”, Journal of Structural Engineering
ASCE, 126(6), 638–45.
IJRRAS 22 (2) ● February 2015 Barghlame & Yaghin ● The Capacity of Cracking Torsion
80
Lotfolahi yagin M.A, Barghlame H. (2005). “Comparison between the capacity of spiral torsion beam with tie”,
Second national civil congress, Elmo sanat university, Iran.
Lundgren, K. (1999). “Three-Dimensional Modeling of Bond in Reinforced Concrete”, PhD Thesis, Publication
99:1, Divisions of Concrete Structures, Chalmers University of Technology, Göteborg, Sweden.
Mitchell D, Collins M.P. (1974). “Diagonal Compression Field Theory – A Rational Model for Structural Concrete
in Pure Torsion”, Structural Journal of the American Concrete Institute, Vol. 71, No.8: 396-408.
Panchacharam S, Belarbi A. (2002). “Torsion Behavior of Reinforced Concrete Beams Strengthened with FRP
Composites”, First FIB Congress, Osaka, Japan, October 13-19.
Panchacharam, S. (2002), “Torsion Behavior of Reinforced Concrete Beams Strengthened with GFRP Laminates”,
M.S. Thesis, department of Civil Engineering, The University of Missouri – Rolla, 123 Pages.
Swanson. (1995). “Analysis Systems, Engineering Analysis System”, Theoretical Manual for ANSYS Revision 5.4,
Swanson Analysis systems.
Wafa W., et al (1995). “Pre-stressed High-Strength Concrete Beams Under Torsion”, Journal of Structural
Engineering, September, Vol.121, No.9.
Wang, W, Thomas H. (1997). “Limit Analysis of Reinforced Concrete Beams Subjected To Pure Torsion”, Journal
of Structural Engineering, January, 86-94.
William K.J, Warnke E.P. (1975). “Constitutive Model for the Triaxial Behavior of Concrete”, Proceedings,
International Association for Bridge and Structural Engineering, ISMES, Bergamo, Italy, Vol. 19 ,174.