
Investigating populations A critical appreciation of some of the ways in which the numbers and...
29
Investigating populations •A critical appreciation of some of the ways in which the numbers and distribution of organisms may be investigated. • Random sampling with quadrats and counting along transects to obtain quantitative data. • The use of percentage cover and frequency as measures of abundance. • The use of mark–release–recapture for more mobile species.
-
Upload
justin-weaver -
Category
Documents
-
view
215 -
download
0
Transcript of Investigating populations A critical appreciation of some of the ways in which the numbers and...
Investigating populations
• A critical appreciation of some of the ways in which the numbers and distribution of organisms may be investigated.
• Random sampling with quadrats and counting along transects to obtain quantitative data.
• The use of percentage cover and frequency as measures of abundance.
• The use of mark–release–recapture for more mobile species.
Investigating populations 2
• In the context of investigating populations, candidates should
• carry out experimental and investigative activities, including appropriate risk management
• consider ethical issues arising when carrying out fieldwork, particularly those relating to the organisms involved and their environment
• analyse and interpret data relating to the distribution of organisms, recognising correlations and causal relationships
• appreciate the tentative nature of conclusions that may be drawn from such data.
Variation inpopulation size
• Population size may vary as a result of the effect of abiotic factors
• interactions between organisms: interspecific and intraspecific competition and predation.

In relation to exam questions
Population • Lots of 2 mark questions looking at the
definitions of the key terms.• Look out for graph questions on predator prey
relationships and competition.• Be ready to analyses graphs and relate your
knowledge to the situation presented for the longer data questions.
A B
CD
E
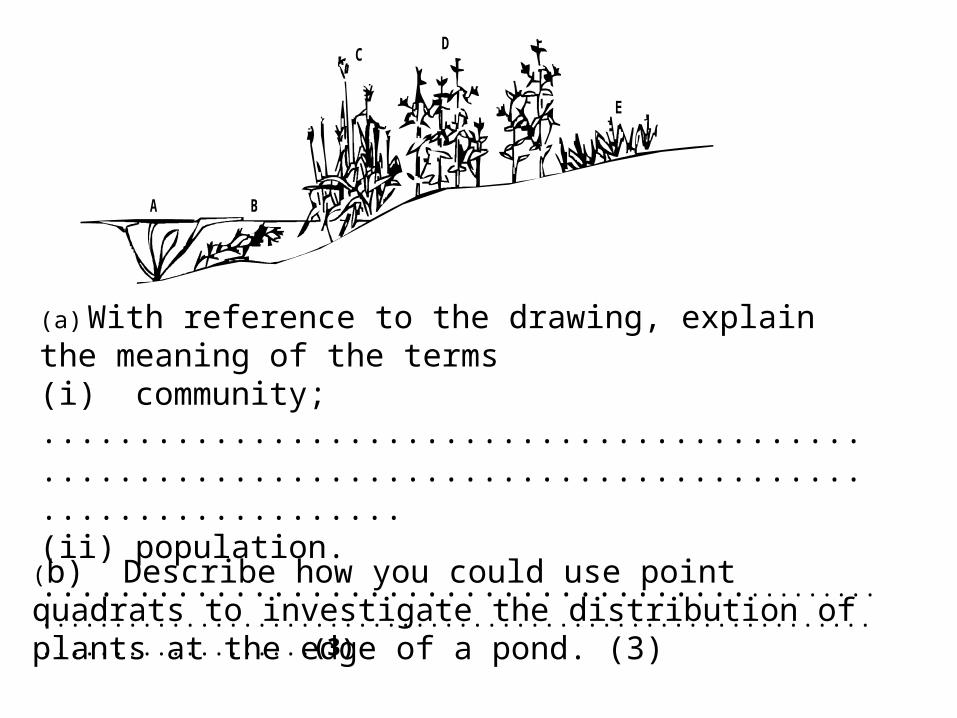
(a) With reference to the drawing, explain the meaning of the terms(i) community;.........................................................................................................(ii) population............................................................................................................................(3)
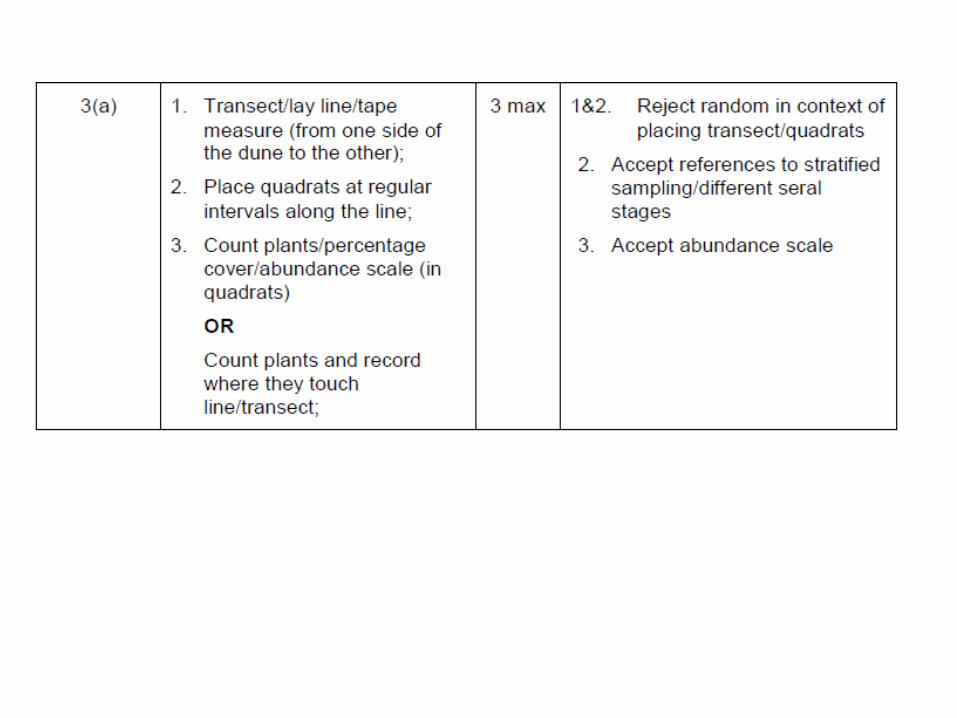
(b) Describe how you could use point quadrats to investigate the distribution of plants at the edge of a pond. (3)
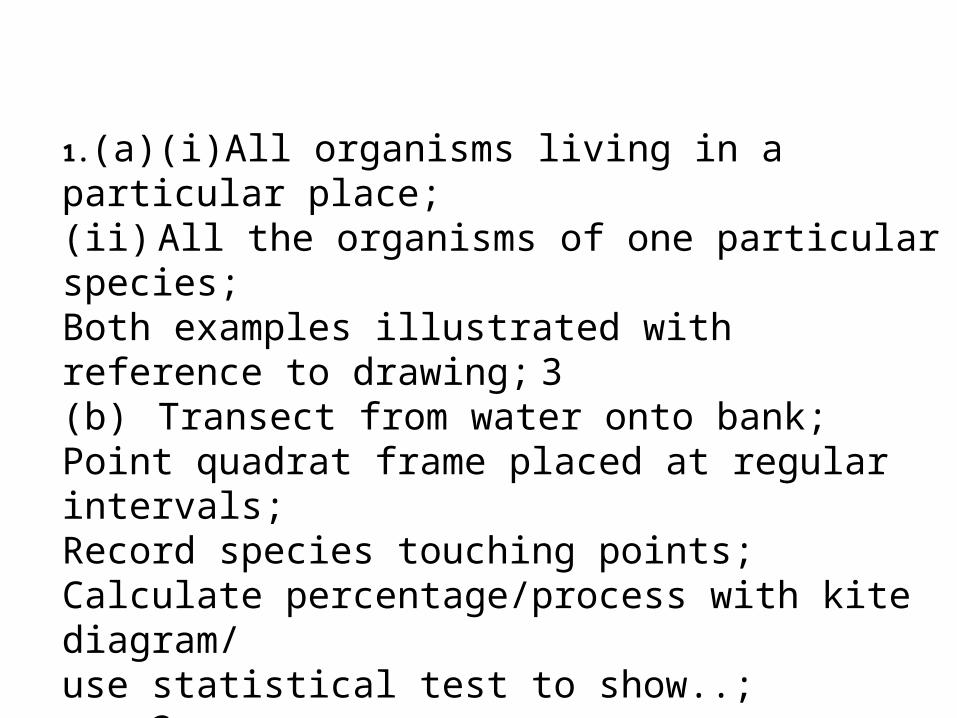
1.(a)(i)All organisms living in a particular place;(ii) All the organisms of one particular species;Both examples illustrated with reference to drawing; 3(b) Transect from water onto bank;Point quadrat frame placed at regular intervals;Record species touching points;Calculate percentage/process with kite diagram/use statistical test to show..; max 3
Investigating populations
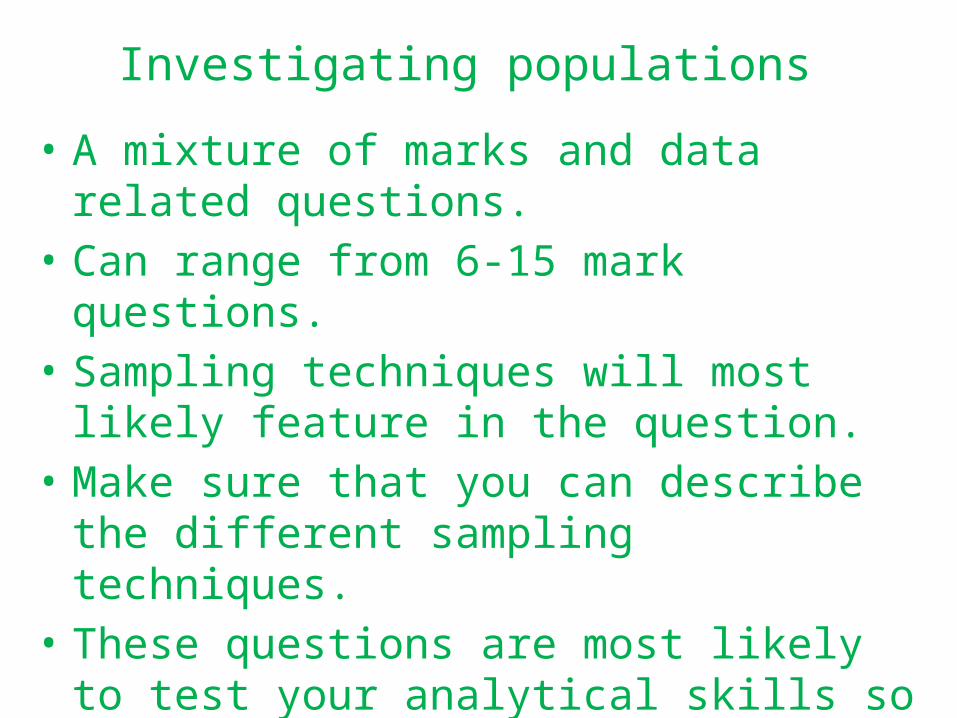
• A mixture of marks and data related questions.• Can range from 6-15 mark questions.• Sampling techniques will most likely feature in
the question. • Make sure that you can describe the different
sampling techniques.• These questions are most likely to test your
analytical skills so get ready to draw a conclusion.
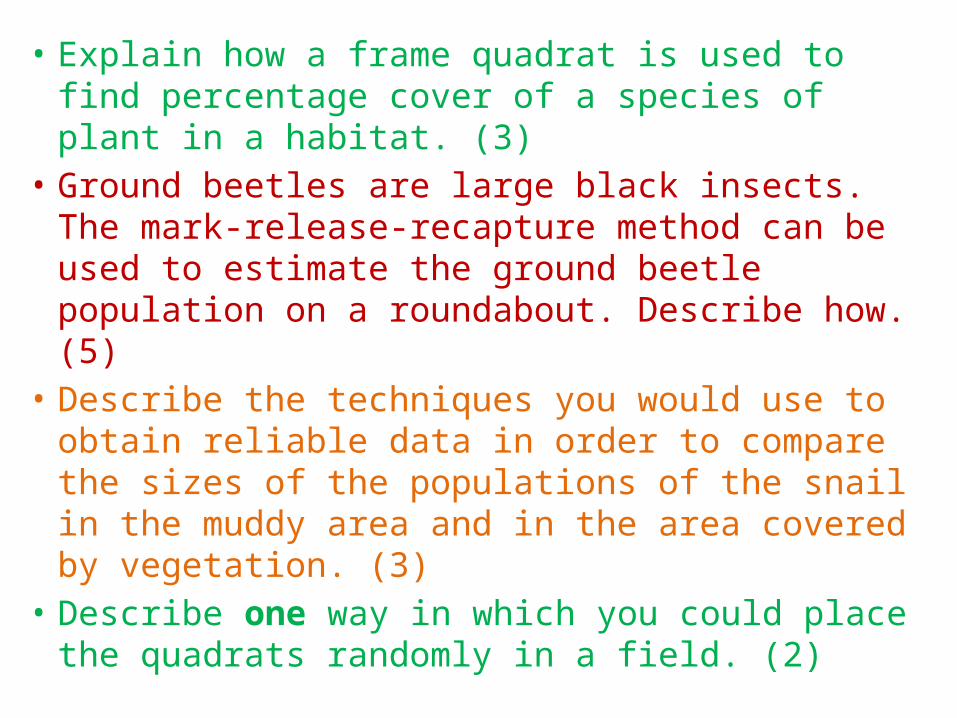
• Explain how a frame quadrat is used to find percentage cover of a species of plant in a habitat. (3)
• Ground beetles are large black insects. The mark-release-recapture method can be used to estimate the ground beetle population on a roundabout. Describe how. (5)
• Describe the techniques you would use to obtain reliable data in order to compare the sizes of the populations of the snail in the muddy area and in the area covered by vegetation. (3)
• Describe one way in which you could place the quadrats randomly in a field. (2)
Answer
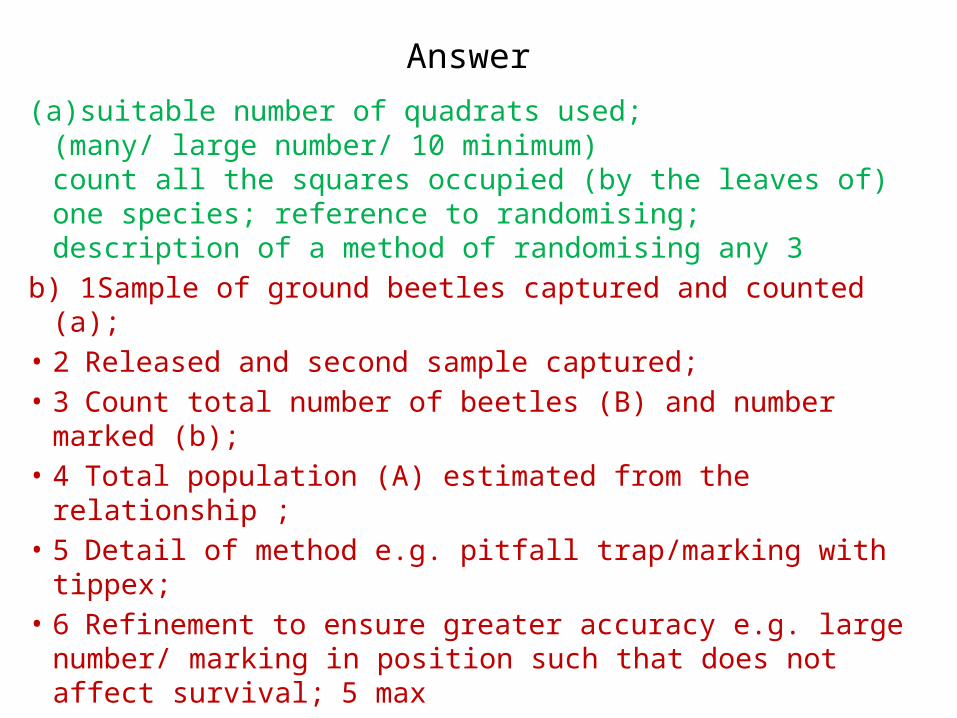
(a)suitable number of quadrats used;(many/ large number/ 10 minimum)count all the squares occupied (by the leaves of) one species; reference to randomising;description of a method of randomising any 3
b) 1Sample of ground beetles captured and counted (a);• 2 Released and second sample captured;• 3 Count total number of beetles (B) and number marked
(b);• 4 Total population (A) estimated from the relationship ;• 5 Detail of method e.g. pitfall trap/marking with tippex;• 6 Refinement to ensure greater accuracy e.g. large
number/ marking in position such that does not affect survival; 5 max
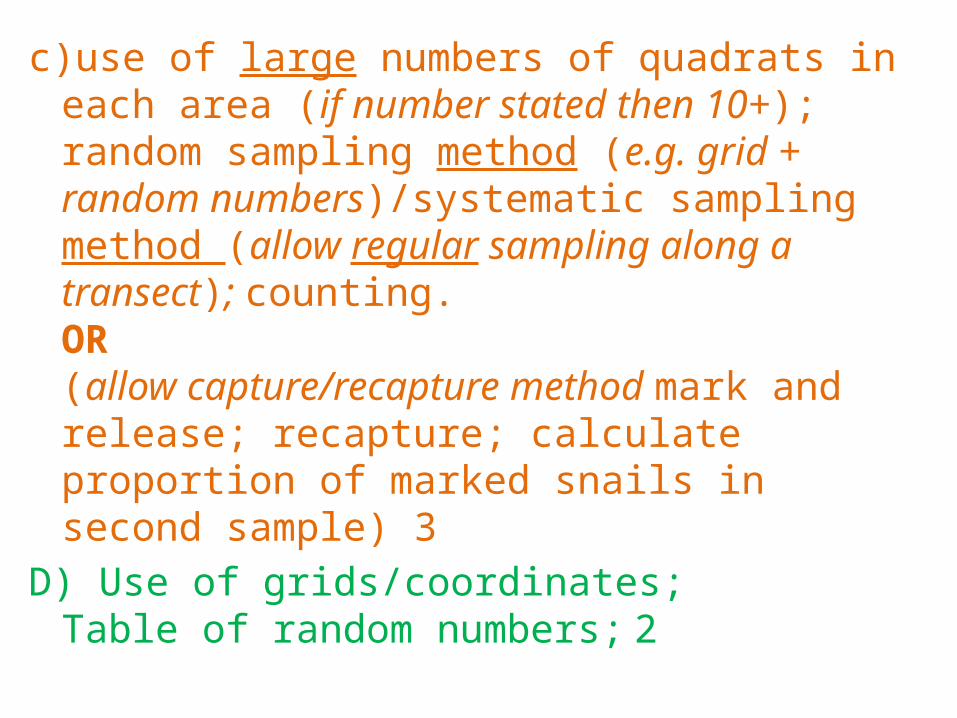
c)use of large numbers of quadrats in each area (if number stated then 10+);random sampling method (e.g. grid + random numbers)/systematic sampling method (allow regular sampling along a transect); counting.OR(allow capture/recapture method mark and release; recapture; calculate proportion of marked snails in second sample) 3
D) Use of grids/coordinates;Table of random numbers; 2
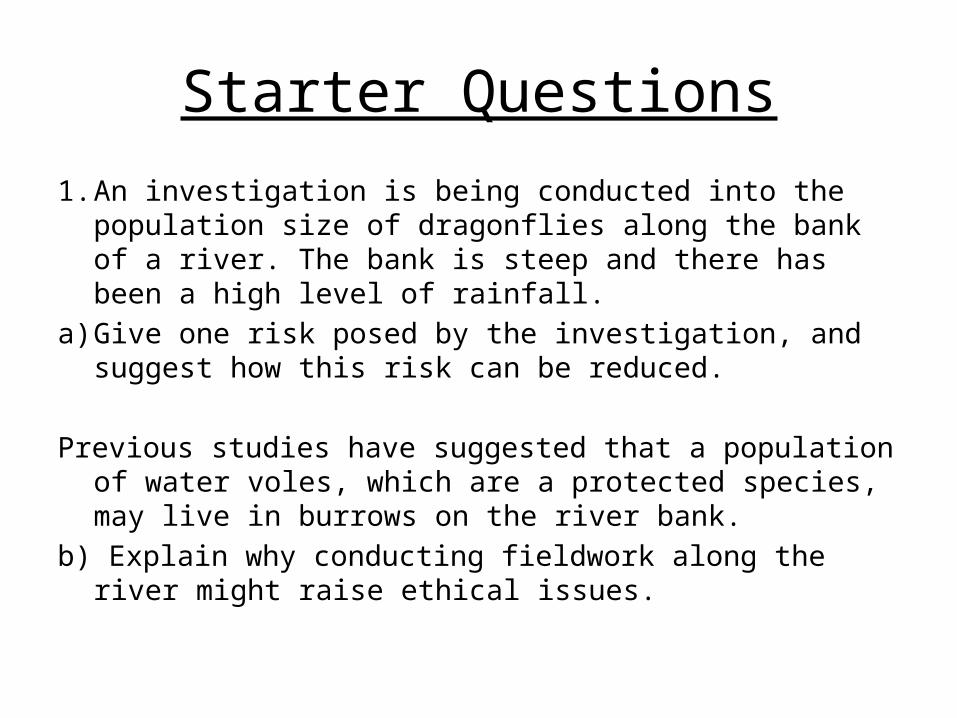
Starter Questions
1. An investigation is being conducted into the population size of dragonflies along the bank of a river. The bank is steep and there has been a high level of rainfall.
a) Give one risk posed by the investigation, and suggest how this risk can be reduced.
Previous studies have suggested that a population of water voles, which are a protected species, may live in burrows on the river bank.
b) Explain why conducting fieldwork along the river might raise ethical issues.
Analysing and Interpreting Distribution Data
Specification Link• Analyse and interpret data relating to
the distribution of organisms, recognising correlations and causal relationships
• Appreciate the tentative nature of conclusions that may be drawn from such data.

Task
Answer the questions on page 20 in the text book.
Human Populations
• Population size and structure, population growth rate, age-population pyramids, survival rates and life expectancy.
Candidates should be able to:• interpret growth curves, survival curves and age-
population pyramids• calculate population growth rates from data on
birth rate and death rate.• relate changes in the size and structure of human
populations to different stages in demographic transition.
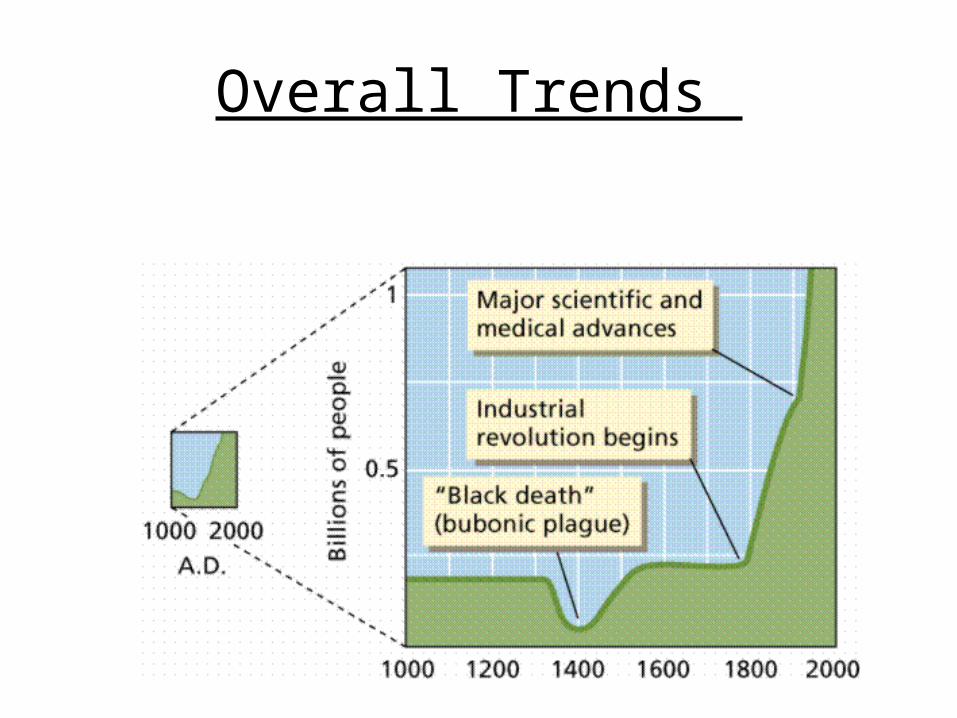
Overall Trends

Why?
• For most of history – kept in check by food availability, disease, predators and climate.
• Recent history – population explosion due to the agricultural revolution, industrial revolution and development of medicine.
Factors which now affect human population
• Birth rate• Death rate• Immigration• Emigration
Key Terms
The birth rate is the number of live births each year for every 1000 people in the population.
A death rate is the number of people that die each year for every 1000 people in the population.
Equations
• Pop growth = (births + immigrations) – (deaths + emigration).
• You may not get the immigration or emigration numbers, therefore just minus birth rate by death rate.
Factors affecting birth rates
• Economic conditions• Cultural and religious backgrounds• Social pressures and conditions• Birth control• Political factorsBirth rate = no births per year x1000 total pop. In the same year
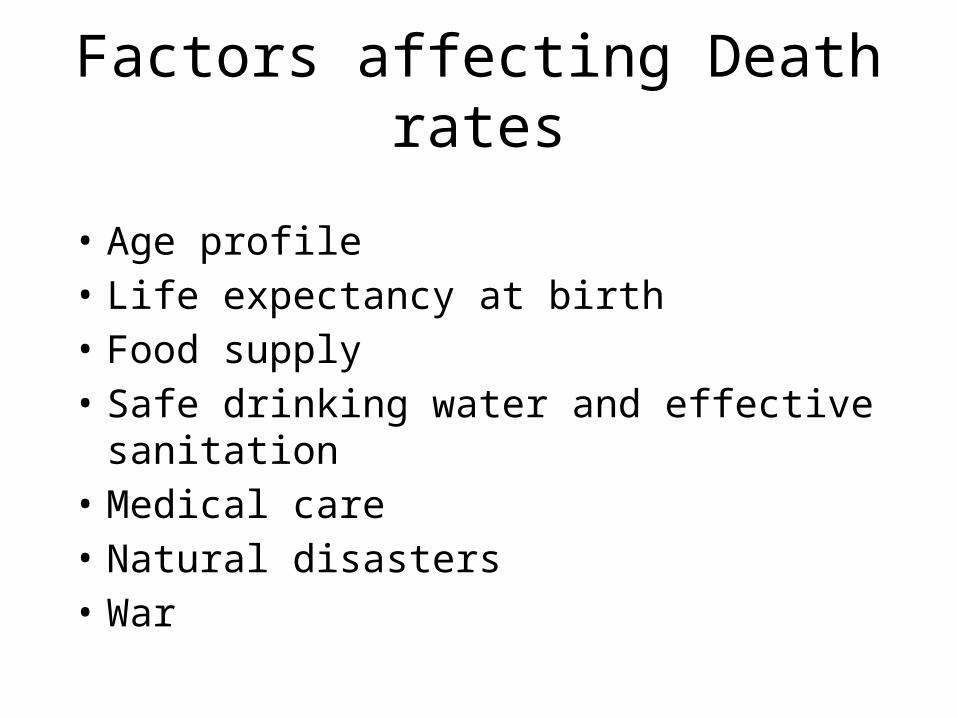
Factors affecting Death rates
• Age profile• Life expectancy at birth• Food supply• Safe drinking water and effective
sanitation• Medical care• Natural disasters• War
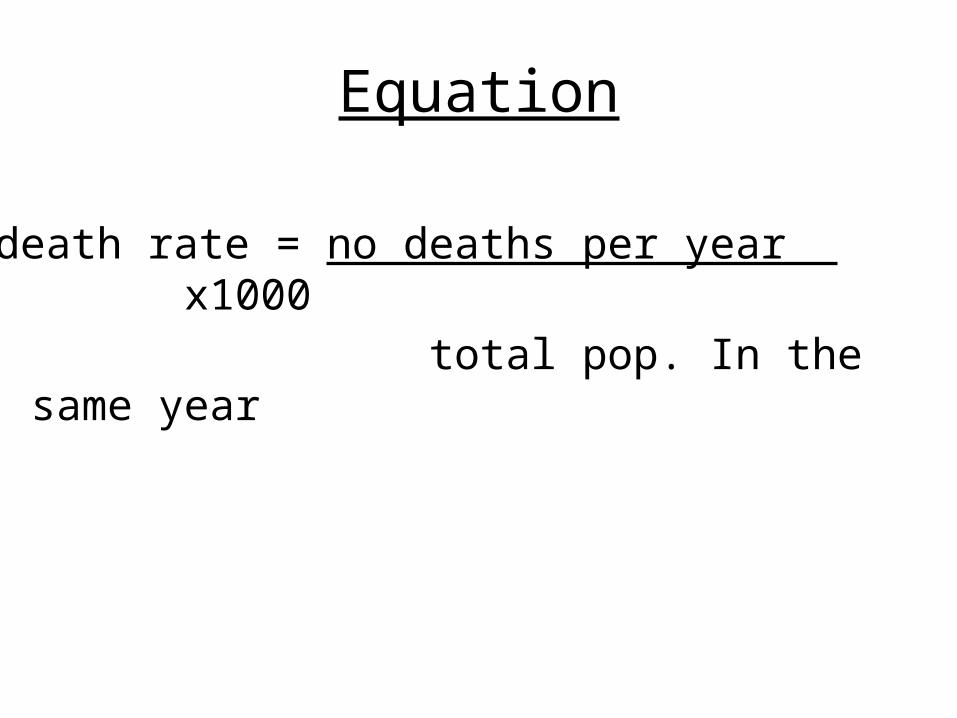
Equation
death rate = no deaths per year x1000
total pop. In the same year
Learning Check
• calculate population growth rates from data on birth rate and death rate.
• interpret growth curves, survival curves and age-population pyramids
• relate changes in the size and structure of human populations to different stages in demographic transition.
Tasks
Read through notes on demographic transition model, survival curves and population pyramids.
Attempt questions in booklet.
Make note of any patterns in types of questions.
Highlight any misconceptions
Independent Study
• Complete all the questions in booklet.
• Bring your weekly revision plan, all unit 4 notes (Inheritance and Selection, Ecosystems and populations).
• Revise for ecosystems and populations test.


![INVESTIGATING THE NON-LINEAR BEHAVIOR OF RC FRAMED ...€¦ · K braced frame. [5] Investigated the behavior of RC beam-column connection using finite element analysis. Separate finite](https://static.fdocuments.in/doc/165x107/605faa960f9bec1b2d32278a/investigating-the-non-linear-behavior-of-rc-framed-k-braced-frame-5-investigated.jpg)


![Research Article Mechanical Bed for Investigating …downloads.hindawi.com/journals/jhe/2017/2364659.pdf2017/02/24 · sleep-inducing effect [6, 7]. The authors have investigated](https://static.fdocuments.in/doc/165x107/5fdfabd7ba72075a6a21fbc4/research-article-mechanical-bed-for-investigating-20170224-sleep-inducing-eiect.jpg)


![Investigating a Small Oil-Flooded Twin-Screw Expander for ......expander without timing gears in [12,13]. Kliem [14] investigated a screw expander application in a trilateral flash](https://static.fdocuments.in/doc/165x107/5f40f88392a7a5666c2afab0/investigating-a-small-oil-flooded-twin-screw-expander-for-expander-without.jpg)