
Pretreatment of microcrystalline cellulose in organic electrolyte

ORIGINAL RESEARCH
Investigating microcrystalline cellulose crystallinity usingRaman spectroscopy
Ana Luiza P. Queiroz . Brian M. Kerins . Jayprakash Yadav .
Fatma Farag . Waleed Faisal . Mary Ellen Crowley . Simon E. Lawrence .
Humphrey A. Moynihan . Anne-Marie Healy . Sonja Vucen .
Abina M. Crean
Received: 24 September 2020 / Accepted: 24 June 2021 / Published online: 27 July 2021
� The Author(s) 2021
Abstract Microcrystalline cellulose (MCC) is a
semi-crystalline material with inherent variable crys-
tallinity due to raw material source and variable
manufacturing conditions. MCC crystallinity variabil-
ity can result in downstream process variability. The
aim of this study was to develop models to determine
MCC crystallinity index (%CI) from Raman spectra of
30 commercial batches using Raman probes with spot
sizes of 100 lm (MR probe) and 6 mm (PhAT probe).
A principal component analysis model separated
Raman spectra of the same samples captured using
the different probes. The %CI was determined using a
previously reported univariate model based on the
ratio of the peaks at 380 and 1096 cm-1. The
univariate model was adjusted for each probe. The
%CI was also predicted from spectral data from each
probe using partial least squares regression models
(where Raman spectra and univariate %CI were the
dependent and independent variables, respectively).
Both models showed adequate predictive power. For
these models a general reference amorphous spectrum
was proposed for each instrument. The development
of the PLS model substantially reduced the analysis
time as it eliminates the need for spectral deconvolu-
tion. A web application containing all the models was
developed.
Supplementary Information The online version containssupplementary material available at https://doi.org/10.1007/s10570-021-04093-1.
A. L. P. Queiroz � B. M. Kerins � F. Farag �W. Faisal � M. E. Crowley � S. Vucen � A. M. Crean (&)
SSPC Pharmaceutical Research Centre, School of
Pharmacy, University College Cork, Cork, Ireland
e-mail: [email protected]
J. Yadav � A.-M. Healy
SSPC Pharmaceutical Research Centre, School of
Pharmacy, Trinity College Dublin, Dublin, Ireland
S. E. Lawrence � H. A. Moynihan
SSPC Pharmaceutical Research Centre, School of
Chemistry, University College Cork, Cork, Ireland
123
Cellulose (2021) 28:8971–8985
https://doi.org/10.1007/s10570-021-04093-1(0123456789().,-volV)( 0123456789().,-volV)

Graphic abstract
30 batches of commercial microcrystalline cellulose
gradesRaman Analysis
PhAT probe MR probe
Ball milled to create amorphous references
% Crystallinity 380-method model
% Crystallinity Par�al Least Square Regression
model
Web app McCrystal – crystallinity
research
Keywords Microcrystalline cellulose � Raman
spectroscopy � Crystallinity � Partial least square
regression � R Shiny
Introduction
Microcrystalline cellulose is widely used and has
diverse applications across different industry sectors.
MCC is used as a binder and filler in pharmaceutical
formulations, a fat replacement and stabilizer in food
products, a rheology control agent in cosmetics, and as
a component of biodegradable polymers and wooden
products (Gibis et al. 2015; Terinte et al. 2011;
Thoorens et al. 2014; Vonbehren et al. 2010; Yang
et al. 2018). The most common source of MCC is
wood. Cellulose chains are present in wood pulp in the
form of packed layers that are held together by lignin,
and strong hydrogen bonds (Thoorens et al. 2014).
MCC is obtained by purification of wood using
mineral acid solution, i.e. acid hydrolysis, followed
by rinsing and drying. The presence of hydroxyl
groups in the product of this purification process and
the relatively large surface to volume ratio of micro
fibrils give rise to MCC’s hygroscopic character (Sun
2008).
MCC has an atypical semi-crystalline structure and
its attributes can vary between suppliers and batches.
Batch to batch variability can be caused by different
factors, such as wood source (hard or soft wood),
climate differences from region to region, harvesting
time, the process of pulp delignification, hydrolysis
reaction time, and the process of drying (O’Regan
2018; Rowe et al. 1994). The term crystallinity index
(%CI) refers to the percentage by weight occupied by
the crystallites (Foster et al. 2018). During depoly-
merization (hydrolysis) the acid preferentially attacks
the amorphous regions of the pulp (Landın et al. 1993).
MCC crystallinity has been reported to influence its
behaviour during processing. Tabletability was inves-
tigated with differences observed between batches
with substantial differences in crystallinity. Suzuki
and Nakagami used a rod mill to reduce crystallinity of
a MCC batch from an initial %CI of 65%. A reduction
in tabletability was observed for batches with a %CI
below 12%, and an increase in dissolution rate was
observed for acetaminophen tablets produced with
MCC that had a %CI less than 26% (Suzuki and
Nakagami 1999). The crystallinity of MCC has also
123
8972 Cellulose (2021) 28:8971–8985
been shown to influence water sorption (Amidon and
Houghton 1995; Bolhuis and Chowhan 1996;
Nokhodchi 2005). Increased water sorption was
observed with decreased MCC crystallinity, as mois-
ture sorption occurs predominately in amorphous
regions which are more hydrophilic than the crys-
talline regions (Mihranyan et al. 2004; Segal et al.
1959; Suzuki and Nakagami 1999).
A range of techniques has been utilised to deter-
mine MCC crystallinity. Diffraction techniques are
most widely reported, employing the Segal peak
height method (Segal et al. 1959), peak decomposition
or deconvolution (Lanson 1997; Park et al. 2010;
Ahvenainen et al. 2016; Yao et al. 2020), and Rietveld
refinement based methods (Madsen et al. 2011; Ling
et al. 2019). Other spectroscopic techniques proposed
include Fourier transform infrared (Liu and Kim
2015), solid state NMR (Atalla and Vanderhart 1984;
Harris et al. 2012; Wickholm et al. 1998), and Sum
frequency generation (Ling et al. 2019). Raman
spectroscopy, the focus of this study, has been
investigated to determine cellulose crystallinity
(Agrawal et al. 2010; Agarwal et al. 2018; Agarwal
2019). An initial Raman approach for quantifying
MCC crystallinity employed relatively weak bands at
1462 and 1481 cm-1 (CH2 bending modes) in con-
junction with spectral deconvolution (Schenzel et al.
2005). Two further methods were proposed employing
bands at 380 and 93 cm-1 (Agarwal et al. 2018, 2010).
The 93 cm-1 method is advantageous compared to the
380 cm-1 method as it differentiates crystalline and
organized cellulose and an aggregated form which is
not crystalline. However, the 93 cm-1 method
requires an FT-Raman instrument with 1064 nm
excitation to avoid Rayleigh scattering that masks
the sample Raman scattering at 93 cm-1.
The quantification of cellulose crystallinity using
Raman spectroscopic analysis has primarily employed
instruments with laser spot sizes between 50 lm and
1 mm and limited depth of penetration (Agarwal et al.
2018, 2010; Foster et al. 2018). The irradiation area of
such instrumental setups results in a limited area being
sampled. Therefore, analysis requires the acquisition
of multiple spectra at a number of locations to obtain a
representative profile of the sample. Reduced depth of
penetration also results in spectra that focus on surface
spectral features. To date Raman probes with larger
laser spot sizes and depth penetration, designed for
non-contact analysis of solids, have not been applied
to the quantification of cellulose crystallinity. The
larger sample volume irradiated using these probes
would reduce the requirement for multiple spectra
acquisition and surface mapping.
The objective of this study was to demonstrate the
capability of Raman spectra acquired using non-
contact Raman probes to predict the crystallinity index
of commercial MCC batches. The %CI in this study
refers to the ratio between the amount of crystalline
cellulose and the total amount of sample. Raman
spectra acquired for 30 commercial MCC batches,
using two probes with spot sizes of 100 lm (MR
probe) and 6 mm (PhAT probe), were used to develop
models to determine %CI.
Materials
Thirty batches of commercial microcrystalline cellu-
lose were studied (Table S1 supplemental data).
Samples comprised MCC manufactured by 3 different
suppliers; 25 batches from Dupont Nutrition &
Biosciences, 4 batches from JRS Pharma, and 1 batch
from Asahi Kasei Corporation. All MCC samples
analysed compiled with USP/NF, Ph.Eur and JP
pharmacopeia. Samples analysed encompassed a
range of different MCC grades which varied in
average particle size distribution, bulk density and
moisture content; PH101, PH102, PH200, 90 M.
Wood pulp was confirmed as the botanical source
for 29 of the 30 batches analysed, for one batch the
botanical source could not be confirmed whether it
came for a cotton or wood source.
Methods
Milling standards to produce reference amorphous
samples
Milling was performed in order to obtain amorphous
reference spectra. Prior to milling, the samples were
kept in the oven at 40 �C for 24 h. To produce
amorphous reference materials for each batch 1 g of
MCC was milled at 25 Hz in an oscillatory ball mill,
Mixer Mill MM400 (Retsch GmbH, Germany), in
order to decrease the crystallinity (Mattonai et al.
2018). All samples were milled for 90 min to replicate
the methodology of previous studies (Agarwal et al.
123
Cellulose (2021) 28:8971–8985 8973

2010). A break of 15 min was performed after every
30 min of milling operation. Samples were confirmed
to be amorphous after 90 min milling by powder
X-Ray diffraction (PXRD). A representative PXRD
diffractogram of a batch before and after ball milling is
included Fig. S2 in the supplemental material.
Powder X-ray diffraction
Powder X-Ray diffraction (PXRD) analysis was
performed using a Stoe Stadi MP diffractometer
operating in transmission mode, with a tube voltage
of 40 kV and current of 40 mA, using Cu Ka1
monochromated radiation (1.5406 A) and a gas-filled
PSD detector. MCC powder samples were held
between acetate foils and the diffractogram was
collected between 10� and 30� 2h. Environmental
background was removed by subtracting a blank
diffractogram (2 acetate films with no sample) from all
spectra.
Preparation of MCC pellets for Raman
spectroscopy
Cylindrical, flat, 13 mm diameter, 250 mg pellets
were produced using an Atlas 15 T Manual Hydraulic
Press (Specac Ltd, Orpington, UK). Three tonnes were
applied for a duration of 30 s. Two pellets were
produced for each batch; one from the powder ‘as
received’ and one from the corresponding ball milled
sample.
Raman spectroscopy
Raman spectra for each pellet were acquired using two
different probes. The first was a MR probe connected
to a RamanRxnTM instrument (Kaiser Optical Sys-
tems Inc., Ann Arbor, USA), with nominal laser beam
diameter at a focal position of 100 lm. The exposure
time set was 60 s, using a laser power of 785 mW, over
the range 200–1500 cm-1, and analysis was per-
formed in triplicate. The second was a PhAT probe
connected to a RamanRxn2PhATTM instrument (Kai-
ser Optical Systems Inc., Ann Arbor, USA), with
nominal laser beam diameter at a focal position of
6 mm. The exposure time was set to 15 s, using a laser
power of 785 mW, over the range 200–1500 cm-1,
and analysis was performed in duplicate. Moreover,
while the MR probe is primarily a surface technique,
the PhAT probe has a collection zone depth of around
2 mm.
In addition to the sample Raman fingerprint, the
spectra obtained contained a background contribution
that may be caused by fluorescence or thermal
fluctuations on the Charge Coupled Device (CCD
detector) (Bocklitz et al. 2011; Gautam et al. 2015).
The fluorescence background was removed by pre-
processing. The spectra underwent a baseline subtrac-
tion of an interpolated linear fit between the anchor
points fixed on the X axis: 1500, 1200, 952, 857, 743,
632, 550, 260, and 200 cm-1. The intensity differ-
ences observed between the spectra were removed by
standard normal variate (SNV). This normalization
consisted of subtracting each spectrum from the mean
and dividing the result by the spectrum standard
deviation.
Univariate determination of crystallinity index
Crystallinity index was calculated according to the
method proposed by Agarwal et al., which is based on
the ratio between the intensity of the peaks at
380 cm-1 and 1096 cm-1 deconvoluted from a refer-
ence amorphous spectrum (referred to henceforth as
the ‘‘380-method’’) (Eq. 1) (Agarwal et al. 2010).
Deconvolution in this study refer to the extraction of
the amorphous and the crystalline spectral contribu-
tions from the actual measured spectrum. Deconvolu-
tion is required because cellulose Raman spectra are
composed of the amorphous and crystalline spectra
superimposed (Agarwal et al. 2010). The ratio of these
peaks was compared to other peaks ratios and showed
efficiency and great sensitivity to cellulose crys-
tallinity changes (Agarwal et al. 2018, 2010).
%CI ¼I380 � I380 am=I1096 � I1096 am
� �� 0:0286
0:0065
ð1Þ
I380 and I380_am are the intensities at the Raman shift
380 cm-1 of the commercial batch as received and its
amorphous corresponding sample, respectively. I1096
and I1096_am are the intensities at the Raman shift
1096 cm-1 of the commercial batch as received and its
amorphous corresponding sample, respectively.
The spectra of corresponding amorphous samples
were obtained by ball milling a sample of the batch,
pressing the powder into a pellet, and acquiring
123
8974 Cellulose (2021) 28:8971–8985

spectra of the pellet. Each Raman spectrum was then
pre-processed and peak normalized by equalizing the
intensity values at Raman shifts above 857 cm-1 to
the intensity at 857 cm-1, following the method
previously reported by Agarwal et al. (Agarwal et al.
2010). The resulting spectrum was considered to
represent the amorphous contribution to the Raman
spectra of the sample as received (Agarwal et al.
2010). Thus, in Eq. 1, I380_am and I1096_am are equal to
the intensity of the peaks at 380 cm-1 and 857 cm-1
in the spectrum of the milled sample, respectively.
Correction of 380-method due to Raman
instrument-dependence
The 380-method was originally developed using a
Raman instrument RFS-100 (Bruker Inc.) and the
coefficients in Eq. 1 (used to calculate %CI) are
specific to the study’s instrumental setup (Agarwal
et al. 2010). Equation 1 was established by plotting the
intensity ratios of interest from the Raman spectra
against %CI of a calibration set samples determined
using a PXRD peak intensity methodology (Segal
et al. 1959). It is important to note that the %CI values
determined by the 380-method show instrument-
dependence and therefore it is recommended that a
calibration be performed should the instrumental set-
up alter (Foster et al. 2018). Therefore. It was
necessary to perform a calibration study to correct
this methodology for the specific Raman instruments
used in the this study, i.e. the MR and the PhAT probes
connected to a RamanRxnTM and a RamanRxn2-
PhATTM (Kaiser Optical Systems Inc., Ann Arbor,
USA), respectively.
A single MCC batch (batch #7) was selected to
create a series of MCC samples with a range of
crystallinity values for the calibration study. To create
samples with varying crystallinity, binary mixtures
MCC prior to ball milling and MCC after ball milling
(amorphous) were prepared at a total mass of
0.20 ± 0.03 g. The blends prepared contained
100%, 83%, 72%, 58%, 44%, 33%, and 22% w/w
MCC prior to ball milling. The crystallinity index
(%CIPXRD) of each blend was determined from its
PXRD diffractogram (Eq. 2)
%CIPXRD ¼ I200 � Iamð ÞI200
ð2Þ
I200 is the averaged intensity in the range 22.55–22.65�2h representing the crystalline peak, and I18.7 is the
averaged intensity in the range 18.0.65–18.75� 2hcorresponding to the amorphous scatter (Segal et al.
1959). PXRD diffractograms for individual blends are
shown in Fig S2 (supplemental data).
%CIPXRD determined for each blend from the
PXRD data was plotted against the peak ratio of the
Raman wavenumbers 380/1096 cm-1 after amor-
phous contribution subtraction. The amorphous con-
tribution subtraction was described in ‘‘Raman
spectroscopy’’ section. A linear regression between
the theoretical %CI and the ratio 380/1096 cm-1 was
obtained for each instrument and the linear equation
obtained was used to determine the %CI by
380-method (‘‘Raman spectroscopy’’ section) for all
other batches.
Principal component analysis
Principal component analysis (PCA) was performed in
order to identify differences between the Raman
spectra obtained for the 30 commercial batches of
MCC investigated. Unscrambler� X 11.0 software
(CAMO software, Norway) was used to perform the
analysis on the pre-treated (baseline and SNV) Raman
spectra. The algorithm NIPALS and cross validation
were performed with 29 segments determined so that
spectra of the same batch acquired using both probes
were kept within the same segment to avoid overfit-
ting. A total of 145 spectra were used to build the PCA
model.
Partial least square regression
Two partial least square regression models were built
using Unscrambler� X 11.0 software (CAMO soft-
ware, Norway) aiming to predict crystallinity index
from Raman spectral analysis of the 30 commercial
MCC batches. One model was built using the pre-
treated (baseline and SNV) Raman spectra acquired
using the MR probe and another model using the pre-
treated spectra acquired using the PhAT probe. The
intensity of the pre-treated Raman spectra between
1500 and 250 cm-1 were used as X variables. For both
models, the Y variable was the %CI determined by the
380-method. The algorithm Kernel was used. A total
of 24 batches were used to calibrate the model and 6
123
Cellulose (2021) 28:8971–8985 8975

batches were used to validate the model. The number
of spectra used were 85 and 60 for MR probe and
PhAT probe models, respectively.
Shiny web application
A web application, McCrystal–crystallinity research�,
was built using ‘shiny’ (Chang et al. 2019) version
1.4.0 in R (R Core Team 2019) using the development
environment RStudio (RStudio Team 2019). This
application was built to facilitate the dissemination of
the models developed in this study. The web applica-
tion framework for R was developed in tab set panels
using the package ‘shinydashboard’ (Chang and
Borges Ribeiro 2018) version 0.7.1. The package
‘RcppArmadillo’ (Eddelbuettel and Sanderson 2014)
version 0.9.800.3.0 was used to manipulate matrices,
graphics were built using the package ‘ggplot2’
(Wickham 2016) version 3.2.1, the spectra were
normalized using the package ‘prospectr’ (Stevens
and Ramirez-Lopez 2013) 0.1.3, and manipulated
using the package ‘spectrolab’ (Meireles et al. 2018)
version 0.0.8. Spectra baseline, i.e. linear interpolation
between predetermined points, was performed using
the package ‘spftir’ (Pozo Valenzuela and Rodriguez-
Llamazares 2016) version 0.1.0 and ‘pracma’ (Borch-
ers 2019) version 2.2.9. After the PCA analysis,
samples were clustered in 2-D scores plots using the
package ‘cluster’ (Maechler et al. 2019) version 2.1.0.
The package ‘basicTrendline’ (Mei and Yu 2018)
version 2.0.3 was used to plot the trendline between
scores and crystallinity index. This web application
can be accessed at https://sspc.ie/mccrystal-
registration/. The design code is available in the sup-
plementary material.
Results
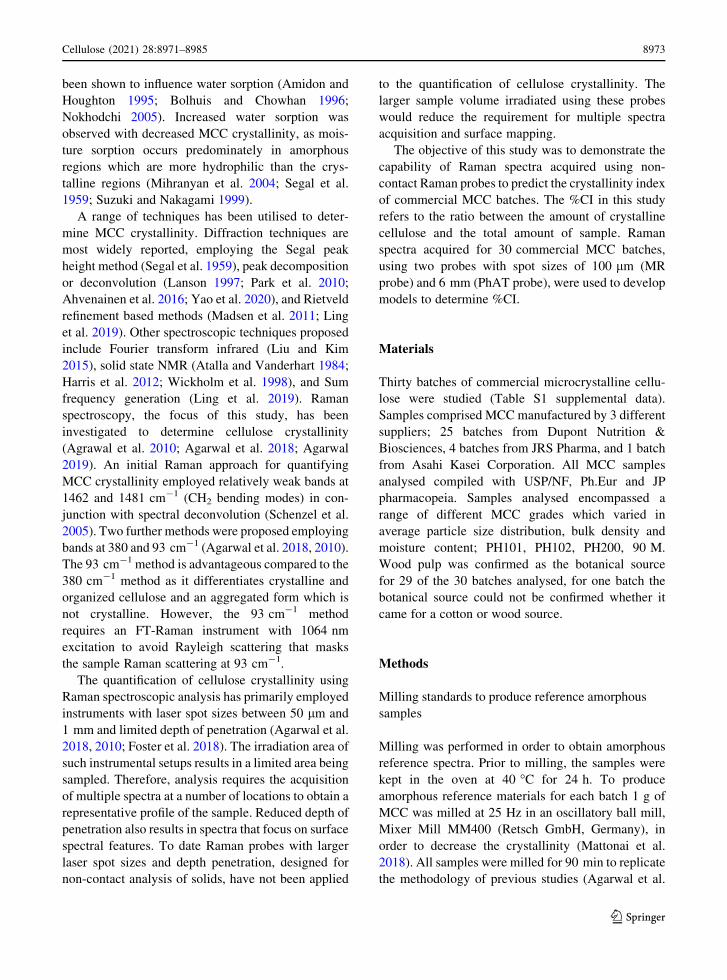
Raman spectra fluorescence background removal
Prior to establishing the crystallinity models from
Raman spectra, it was necessary to remove spectral
interference. Fluorescence background and intensity
shifts were observed (Fig. 1). The baseline subtraction
method developed (‘‘Raman spectroscopy’’ section)
eliminated the fluorescence background and standard
normal variate (SNV) eliminated intensity differences
observed between the spectra. The SNV normalization
consisted of subtracting each spectrum by its mean and
dividing the result by the spectrum standard deviation.
All spectra used in this study were baselined and SNV
normalized accordingly.
Principal component analysis of spectra
A PCA model was used to explore spectral differences
due to the probe set-up used. For this purpose, the
model was built from treated spectra (baseline and
SNV) acquired using both, MR and PhAT probes. The
scores plot (Fig. 2a) show a clear separation of the
samples into two groups based on the spectra acquired
using either the MR probe or the PhAT probe. The
Raman shifts that lie within the upper and lower
bounds of the correlation loadings plot are the regions
where the variability was modelled by that principal
component (Fig. 2b and 2c). Variability in the regions
containing the peaks at 380 and 1096 cm-1 are
captured by the PCA model. Spectral comparisons
showed that the peak intensity at 1096 cm-1 is higher
and at 380 cm-1 is lower for the PhAT probe in
comparison to the MR probe. Figure 3 provides
representative spectra for a single batch highlighting
that differences in intensities were observed for
spectra acquired using the different probes, and these
differences could not be removed by baseline correc-
tion or SNV. This is a strong indication that the
crystallinity index determined using spectral data from
a MR probe cannot be compared to the crystallinity
index determined using spectra data from a PhAT
probe.
Development of specific 380-method equations
for MR and PhAT Raman instruments
Linear regression plots of %CIPXRD determined from
PXRD diffractograms for the calibration sample set
(‘‘Correction of 380-method due to Raman instru-
ment-dependence’’ section) and the ratio between the
Raman intensities at 380 and 1096 cm-1 showed
correlation for spectra acquired using both the MR and
PhAT probes. Pearson’s r values of 0.895 and 0.969
for the MR probe and PhAT probe, respectively were
obtained (Fig. 4). Differences in the linear relation-
ship can be explained by the capacity of each probe to
capture the intrinsic crystallinity heterogeneity of
MCC samples. A PhAT probe averages a larger area
(12.57 mm2) in comparison to a MR probe
123
8976 Cellulose (2021) 28:8971–8985
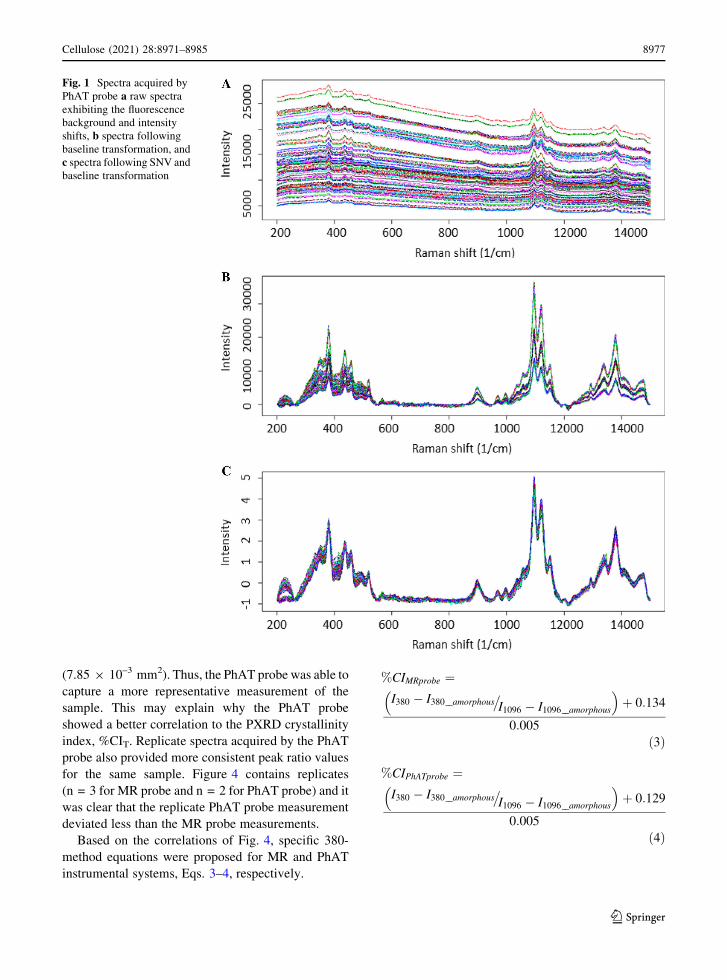
(7.85 9 10–3 mm2). Thus, the PhAT probe was able to
capture a more representative measurement of the
sample. This may explain why the PhAT probe
showed a better correlation to the PXRD crystallinity
index, %CIT. Replicate spectra acquired by the PhAT
probe also provided more consistent peak ratio values
for the same sample. Figure 4 contains replicates
(n = 3 for MR probe and n = 2 for PhAT probe) and it
was clear that the replicate PhAT probe measurement
deviated less than the MR probe measurements.
Based on the correlations of Fig. 4, specific 380-
method equations were proposed for MR and PhAT
instrumental systems, Eqs. 3–4, respectively.
%CIMRprobe ¼I380 � I380 amorphous
�I1096 � I1096 amorphous
� �þ 0:134
0:005
ð3Þ
%CIPhATprobe ¼I380 � I380 amorphous
�I1096 � I1096 amorphous
� �þ 0:129
0:005
ð4Þ
Fig. 1 Spectra acquired by
PhAT probe a raw spectra
exhibiting the fluorescence
background and intensity
shifts, b spectra following
baseline transformation, and
c spectra following SNV and
baseline transformation
123
Cellulose (2021) 28:8971–8985 8977

Determination of MCC crystallinity indexes
for commercial batches
The %CI for a set of 30 commercial batches was
determined using the corrected 380-method (Eqs. 3
and 4) applied to spectral data acquired using the MR
and PhAT probes, respectively. Amorphous spectra
were obtained for each MCC batch with both probes.
From the processed amorphous spectra from each
batch obtained using the MR probe (n = 70) and PhAT
probe (n = 55), an averaged amorphous spectrum was
generate for both probes. The averaged intensities and
standard deviations for the peaks of interest for the MR
probe averaged amorphous spectrum were I380_am
(0.627 ± 0.246) and I1096_am (2.745 ± 0.489) and for
the PhAT probe averaged amorphous spectrum were
A
B
C
Fig. 2 a PCA Scores plot, b correlation loadings of the first
principal component and c correlation loadings of the second
principal component of the model built using spectra of
30 MCC batches acquired with MR (n = 85 spectra) and PhAT
(n = 60 spectra) probes
Fig. 3 Spectra acquired using a MR and a PhAT probe after
baseline correction and SNV normalization for a sample of
single batch
30 40 50 60 70 80 90
0.0
0.1
0.2
0.3
0.4
PhAT probe
MR probe
Ram
an p
eak
Rat
io 3
80/1
096
Crystallinity Index (%)
Fig. 4 Correlation between the ratio of the Raman intensities at
380 and 1096 cm-1, and the crystallinity index determined for
PXRD data using the Segal method (Segal et al. 1959). Pre-
treated deconvoluted spectra obtained for blends using MR and
PhAT probes were used
123
8978 Cellulose (2021) 28:8971–8985

I380_am (1.194 ± 0.277) and I1096_am (2.607 ± 0.277).
These averaged amorphous spectra were used in the
determination of %CI for each batch. The %CI values
obtained for all MCC batches investigated are shown
in Fig. 5.
Partial least square regression models
A PLS model was built as an alternative to the
380-method in order to avoid having to undertake
milling and spectra deconvolution. Agarwal et al. also
used a PLS model to determine %CI (Agarwal et al.
2010). However, the present study involved a greater
number of MCC batches and reflects the variability
across commercial batches, while the study published
by Agarwal et al. included several blends including
commercial batches as received and their reference
milled sample, at different mass fractions.
Statistically significant PLS models were deter-
mined for both probes (Table 1, Figs. 6 and 7). The
optimal number of factors for both models was
considered to be three, which represented 97.47% of
variance for the MR probe data and 97.16% of the
variance for PhAT probe data. The variability captured
by the first factor of both models included the Raman
shifts known to be correlated to MCC crystallinity
(also used to calculate MCC crystallinity by the
380-method), which was not surprising because the
independent variable used to build the model was the
%CI from the 380-method. This can be seen in the
correlation loadings where the Raman shifts that fall
within the upper or lower outer lines are the Raman
shifts used by that factor to build the model (Figs. 6b–
d and 7b–d).
The scores plot of the PLS models was used to
investigate spectral differences between batches of
different average particle size and grades. However,
the model was not able to separate the batches by
average particle size nor grade, i.e. the PLS model was
not able to identify patterns in the Raman spectra to
cluster the batches in groups of the same average
particle size nor groups of the same grade (Fig. 8).
Discussion
It is challenging to determine the properties of
microcrystalline cellulose compared to other materi-
als. MCC shows great variability due to its natural
source, i.e. wood pulp, and the different processes
from which the commercial grades are produced,
especially different drying processes. In this study the
application of two models to determine the crys-
tallinity index of MCC commercial batches was
investigated. Both models showed predictive power.
The crystallinity of MCC was firstly determined
using the 380-method proposed by Agarwal et al.
(Agarwal et al. 2010). A calibration curve was
developed using %CI values of a calibration set of
blends determined by PXRD and used to correct the
model for each instrument employed in this study (MR
and PhAT probes, Kaiser Optical Systems Inc., USA).
This modification was previously performed for a
different instrument (Foster et al. 2018). Reference
amorphous spectra for each batch were produced and
an averaged spectrum (n = 30 batches) was deter-
mined for each probe. As a result, the production of a
reference amorphous material and spectral subtraction
for new batches are no longer required for future
analysis. The time for analysis was shortened and
milling and PXRD analysis steps (required to confirm
that the sample is indeed amorphous) can be elimi-
nated from the analytical procedure.
Crystallinity of MCC was also determined by
partial least squares regression models. The crys-
tallinity values used in this regression analysis were
those determined using the established 380-method.
The ability of the models to predict crystallinity from
0 5 10 15 20 25 30
50
60
70
80
90
100
PhATMR
% C
I
Batch
Fig. 5 Crystallinity index (%CI) determined for commercial
batches using spectra obtained for pellets and different probes
(MR probe n = 3, and PhAT probe n = 2, using Eq. 3 and 4,
respectively). Individual %CI values reported are included in
supplemental material, Table S1
123
Cellulose (2021) 28:8971–8985 8979

Table 1 Summary statistics of the partial least square regression models
MR probe PhAT probe
Number of calibration samples 67 48
Number of validation samples 18 12
Optimal number of factors 3 3
N 1 2 3 1 2 3
RMSEC 1.339 0.978 0.703 1.132 1.026 0.612
RMSEP 1.346 0.597 0.460 1.212 1.1843 0.790
Explained variance (Calibration) (%) 86.97 93.05 96.40 93.84 94.94 98.20
Explained variance (validation) (%) 78.31 95.73 97.47 93.32 93.62 97.16
Bias - 1.092 - 0.065 0.015 - 0.543 - 0.457 - 0.068
N is the Number of factors, RMSEC is the Root Mean Square Error of Calibration, RMSEP is the Root Mean Square Error of
Prediction
A B
C D
Fig. 6 a Values of crystallinity index (%CI) predicted by the
Partial Least Square Regression model vs Reference values for
the MR probe and considering three factors, and b, c,
d correlation loadings of factors 1, 2, and 3, respectively,
obtained from the model designed using baselined and
normalized spectra. The further the correlation loading is from
the zero, the stronger the Raman shift contributed to explain the
variability encountered by the factor. In blue are the calibration
and in red the validation sets
123
8980 Cellulose (2021) 28:8971–8985

Raman spectra were 97.47% for MR and 97.16% for
PhAT probes and the predicted values for the test set
showed a small prediction error (RSMEP equal to
0.4596 and 0.7900 for MR and PhAT probe, respec-
tively). The correlation loadings showed that the main
wavenumbers used to build the model were 380, 437,
458, 521, 1,096, 1,120, 1,330, 1,340, 1,380, and
1,475 cm-1. Those wavenumbers were correlated to a
change in cellulose crystallinity due to contributions
from OH rocking and bending, CH and CH2 bending,
CO and COC stretching, CH wagging, and anhy-
droglucose ring stretching, twisting, and torsion
modes (Agarwal et al. 2010). The models built may
be used to rapidly determine crystallinity for future
MCC batches without the necessity to produce an
amorphous reference spectrum. A PLS model had
been previously used to predict crystallinity (Agarwal
2019; Agarwal et al. 2010), however, the model was
built with only ten samples (a control, 4 mixtures, 3
samples milled during different times and 2 commer-
cial MCC grades). The present study investigated
thirty MCC commercial batches including ones with
different particle sizes (from 50 to 180 lm average
particle size) and MCC grades. Thus, the present study
confirmed the finding of the previous study reported
by Agarwal et al. and enriched the validation of the
models by investigating the variability encountered in
commercial grades of MCC.
In this study Raman probes that can scan large
surface areas and give an averaged spectrum in a short
A
B
C D
Fig. 7 a Values of crystallinity index (%CI) predicted by the
Partial Least Square Regression model vs Reference values for
the PhAT probe and considering three factors, and b, c,
d correlation loadings of factors 1, 2, and 3, respectively,
obtained from the model designed using baselined and
normalized spectra. The further the correlation loading is from
the zero, the stronger the Raman shift contributed to explain the
variability encountered by the factor. In blue are the calibration
and in red the validation sets
123
Cellulose (2021) 28:8971–8985 8981

time were used (1 min for MR probe and 15 s for
PhAT probe). Previous studies used Raman spectra of
microscopic surface areas (Agarwal 2019; Agarwal
et al. 2010; Foster et al. 2018). The PhAT probe used
in the present study acquires spectra from an area of
12.57 mm2 and the MR probe from an area of
7.85 9 10–3 mm2. A PhAT probe also has a depth of
analysis of approximately 2 mm. Thus, less replicates
are necessary to achieve a representative sample when
a PhAT probe is used. As a result, Raman spectrum
containing more averaged information of the overall
semi-crystalline structure of MCC samples is
obtained. Comparing the PhAT and the MR probes,
the larger coverage area of the PhAT probe resulted in
better fits for both the 380-method and PLS models.
This was quantified by Pearson’s coefficients obtained
from the calibration of the 380-method (Fig. 7,
Pearson’s-r of 0.969 and 0.895 for PhAT and MR
probes, respectively) and the PLS model (correlation
of 0.982 and 0.964 for PhAT and MR probes,
respectively). The variability observed between dupli-
cate values determined using the PhAT probe was
greater than when using the MR probe, for a number of
the commercial samples. A possible explanation may
be due to spectra being acquired on the same surface of
the pellet (top surface) for the MR probe, while for the
PhAT probe one spectrum was acquired on the top
surface and another was acquired on the bottom
surface of the pellet. The difference in %CI due to the
differences in the positions from which the Raman
spectra were may be due to the characteristic of
uniaxial compression, which does not hold a homo-
geneous stress distribution in the interior of the pellet
(Takeuchi et al. 2004).
It is important to also emphasis the limitations of
quantifying the %CI of cellulose materials, including
MCC, using the Raman spectroscopy. Key limitations
include the lack of 100% crystalline or amorphous
A B
C D
Fig. 8 Scores plots of factors one and two highlighted by a and b average particle size in lm, and c and d manufacturer for the
calibration test sets of the MR and PhAT probes, respectively
123
8982 Cellulose (2021) 28:8971–8985
cellulose standards or references and the need to adjust
model parameters for each instrumental set-up by
calibration against diffraction data. Therefore, the
%CI determined by Raman analysis is dependent on
the diffraction analysis methodology. In this study, a
simplistic approach was undertaken which mimicked
that of Agarwal et al. (2010). The %CI of calibration
set samples were determined using the Segal peak
height method and theoretical %CI values were
determined based on the %CI of a single MCC batch.
It is proposed that an improvement to this approach
should include a wider calibration set of samples in the
calibration study to improve model robustness. It is
also important recognize the limitations of the Segal
peak height method employed. Driemeier and Calli-
garis (2011) highlighted that peak area is more
representative of the crystalline fraction and French
Santiago Cintron (2013) demonstrated that the use of
the Segal method to determine MCC %CI is influ-
enced by sample crystallite size. The respective
strengths and limitations of more commonly diffrac-
tion method discussed by French (2020), as are
standards for conducting crystallographic work to
study cellulose crystallinity (French 2020). Advance-
ment from the Segal peak height method during
calibration, towards other methods such as decompo-
sition or deconvolution of peak area during calibration
(Lanson 1997; Park et al. 2010; Ahvenainen et al.
2016; Yao et al. 2020), and Rietveld refinement based
methods (Madsen et al. 2011; Ling et al. 2019) could
further improve the models proposed in this study.
A R Shiny web application (McCrystal–crys-
tallinity research�), was designed (i) to perform
baseline correction and SNV normalization, (ii) to
predict MCC crystallinity using the 380-method for
the MR and the PhAT probes, (iii) to predict MCC
crystallinity from PLS models, and (iv) to perform
PCA analysis from Raman spectra within the range of
1500–250 cm-1. This application was developed
based on the knowledge generated in this study. Thus,
baseline correction, SVN normalization, and the PCA
model can be applied to Raman spectra of microcrys-
talline cellulose obtained using different Raman
instruments. However, the prediction of the crys-
tallinity index can only be undertaken if a MR or a
PhAT probe was used to acquire the Raman spectra.
Even if those instruments are used, results should be
evaluated with caution since different units of a same
instrument design might require instrument-specific
correction of the model.
Conclusions
Crystallinity index was determined for 30 commercial
batches of microcrystalline cellulose using two dif-
ferent models, i.e. 380-method and PLS regression.
Both models showed adequate predictive power.
However, the development of the PLS model takes
substantially less time for analysis because it elimi-
nates the need for milling and deconvolution of the
spectra of the milled sample into amorphous and
crystalline contributions before the actual %CI deter-
mination. For these models a general reference
amorphous Raman spectrum was proposed for each
instrument. Spectral comparison and principal com-
ponent analysis showed that values of crystallinity
index were relative to the instrument used to acquire
the Raman spectra. Also, larger laser spot sizes give
more reproducible and representative information on
the overall crystallinity of the sample. The crys-
tallinity index values obtained with either model
depend on the XRD methodology and calibration
sample set employed during calibration. The method-
ology presented can be further advanced by employing
a broader sample set and more advanced XRD
methodologies to measure microcrystalline cellulose
crystallinity during calibration of the model. A web
application (McCrystal–crystallinity research�) was
developed which facilitates the use of the predictive
models developed in this study to measure MCC
crystallinity.
Acknowledgments Raman spectroscopy analysis using a
PhAT probe head were performed at APC Ltd (Ireland) and
Trinity College Dublin (Ireland). Raman spectroscopy analysis
using a MR probe head was performed at the University of
Limerick (Ireland).
Funding Open Access funding provided by the IReL
Consortium. This publication has emanated from research
supported in part by a research grant from Science Foundation
Ireland (SFI) and is co-funded under the European Regional
Development Fund [grant number 12/RC/2275].
Declarations
Conflict of interest Authors declare no conflicts or competing
interests.
123
Cellulose (2021) 28:8971–8985 8983

Human or animal rights This article does not contain any
studies involving human participants performed by any of the
authors.
Open Access This article is licensed under a Creative Com-
mons Attribution 4.0 International License, which permits use,
sharing, adaptation, distribution and reproduction in any med-
ium or format, as long as you give appropriate credit to the
original author(s) and the source, provide a link to the Creative
Commons licence, and indicate if changes were made. The
images or other third party material in this article are included in
the article’s Creative Commons licence, unless indicated
otherwise in a credit line to the material. If material is not
included in the article’s Creative Commons licence and your
intended use is not permitted by statutory regulation or exceeds
the permitted use, you will need to obtain permission directly
from the copyright holder. To view a copy of this licence, visit
http://creativecommons.org/licenses/by/4.0/.
References
Agarwal UP (2019) Analysis of cellulose and lignocellulose
materials by Raman spectroscopy: a review of the current
status. Molecules. https://doi.org/10.3390/
molecules24091659
Agarwal UP, Reiner RS, Ralph SA (2010) Cellulose I crys-
tallinity determination using FT-Raman spectroscopy:
univariate and multivariate methods. Cellulose
17:721–733. https://doi.org/10.1007/s10570-010-9420-z
Agarwal UP, Ralph SA, Reiner RS, Baez C (2018) New cellu-
lose crystallinity estimation method that differentiates
between organized and crystalline phases. Carbohydr
Polym 190:262–270. https://doi.org/10.1016/j.carbpol.
2018.03.003
Ahvenainen P, Kontro I, Svedstrom K (2016) Comparison of
sample crystallinity determination methods by X-ray
diffraction for challenging cellulose I materials. Cellulose
23:1073–1086. https://doi.org/10.1007/s10570-016-0881-
6
Amidon GE, Houghton ME (1995) The effect of moisture on the
mechanical and powder flow properties of microcrystalline
cellulose. Pharm Res 12:923–929. https://doi.org/10.1023/
A:1016233725612
Atalla RH, Vanderhart DL (1984) Native cellulose: a composite
of two distinct crystalline forms. Science 223:283–285.
https://doi.org/10.1126/science.223.4633.283
Bocklitz T, Walter A, Hartmann K, Rosch P, Popp J (2011) How
to pre-process Raman spectra for reliable and stable mod-
els? Anal Chim Acta 704:47–56. https://doi.org/10.1016/j.
aca.2011.06.043
Bolhuis GK, Chowhan ZT (1996) Materials for direct com-
paction. Drugs Pharm Sci 71:419–500. https://doi.org/10.
1016/j.jsps.2020.04.013
Borchers HW (2019). pracma: Practical numerical math func-
tions. https://cran.r-project.org/web/packages/pracma/
index.html
Chang W, Borges Ribeiro B (2018) Shinydashboard: create
dashboards with’Shiny’. https://cran.r-project.org/web/
packages/shinydashboard/index.html
Chang W, Cheng J, Allaire J, Xie Y, McPherson J (2019) shiny:
Web Application Framework for R. https://cran.r-project.
org/web/packages/shiny/index.html
Driemeier C, Calligaris GA (2011) Theoretical and experi-
mental developments for accurate determination of crys-
tallinity of cellulose I materials. J Appl Crystallogr
44:184–192. https://doi.org/10.1107/S0021889810043955
Eddelbuettel D, Sanderson C (2014) RcppArmadillo: acceler-
ating R with high-performance C?? linear algebra.
Comput Stat Data Anal 71:1054–1063. https://doi.org/10.
1016/j.csda.2013.02.005
Foster EJ, Moon RJ, Agarwal UP, Bortner MJ, Bras J, Camar-
ero-Espinosa S, Chan KJ, Clift MJD, Cranston ED, Eich-
horn SJ, Fox DM, Hamad WY, Heux L, Jean B, Korey M,
Nieh W, Ong KJ, Reid MS, Renneckar S, Roberts R,
Shatkin JA, Simonsen J, Stinson-Bagby K, Wanasekara N,
Youngblood J (2018) Current characterization methods for
cellulose nanomaterials. Chem Soc Rev 47:2609–2679.
https://doi.org/10.1039/c6cs00895j
French AD (2020) Correction to: Increment in evolution of
cellulose crystallinity analysis. Cellulose 27:9135–9136.
https://doi.org/10.1007/s10570-020-03377-2
French AD, Santiago Cintron M (2013) Cellulose polymorphy,
crystallite size, and the segal crystallinity index. Cellulose
20:583–588. https://doi.org/10.1007/s10570-012-9833-y
Gautam R, Vanga S, Ariese F, Umapathy S (2015) Review of
multidimensional data processing approaches for Raman
and infrared spectroscopy. EPJ Tech Instrum 2:1–38.
https://doi.org/10.1140/epjti/s40485-015-0018-6
Gibis M, Schuh V, Weiss J (2015) Effects of carboxymethyl
cellulose (CMC) and microcrystalline cellulose (MCC) as
fat replacers on the microstructure and sensory character-
istics of fried beef patties. Food Hydrocoll 45:236–246.
https://doi.org/10.1016/j.foodhyd.2014.11.021
Harris DM, Corbin K, Wang T, Gutierrez R, Bertolo AL, Petti C,
Smilgies D-M, Estevez JM, Bonetta D, Urbanowicz BR,
Ehrhardt DW, Somerville CR, Rose JKC, Hong M, Debolt
S (2012) Cellulose microfibril crystallinity is reduced by
123 cellulose (2019) 26:305–328 325 mutating C-terminal
transmembrane region residues CESA1A903V and
CESA3T942I of cellulose synthase. Proc Natl Acad Sci
109:4098–4103. https://doi.org/10.1073/pnas.1200352109
Landın M, Martınez-Pacheco R, Gomez-Amoza JL, Souto C,
Concheiro A, Rowe RC (1993) Effect of batch variation
and source of pulp on the properties of microcrystalline
cellulose. Int J Pharm 91:133–141. https://doi.org/10.1016/
0378-5173(93)90332-A
Lanson B (1997) Decomposition of experimental X-ray
diffraction patterns (profile fitting); a convenient way to
study clay minerals. Clays Clay Miner
45(132–146):132–146. https://doi.org/10.1346/CCMN.
1997.0450202
Ling Z, Wang T, Makarem M, Santiago Cintron M, Cheng HN,
Kang X, Bacher M, Potthast A, Rosenau T, King H, Del-
hom CD, Nam S, Vincent Edwards J, Kim SH, Xu F,
French AD (2019) Effects of ball milling on the structure of
cotton cellulose. Cellulose 26(1):305–328. https://doi.org/
10.1007/s10570-018-02230-x
123
8984 Cellulose (2021) 28:8971–8985
Liu Y, Kim HJ (2015) Use of attenuated total reflection fourier
transform infrared (ATR FT-IR) spectroscopy in direct,
nondestructive, and rapid assessment of developmental
cotton fibers grown in planta and in culture. Appl Spectrosc
69:1004–1010. https://doi.org/10.1366/15-07876
Madsen IC, Scarlett NVY, Kern A (2011) Description and
survey of methodologies for the determination of amor-
phous content via X-ray powder diffraction. Z Fur Krist
Cryst Mater 226:944–955. https://doi.org/10.1524/zkri.
2011.1437
Maechler, M., Rousseeuw, P., Struyf, A., Hubert, M., Hornik,
K., 2019. cluster: Cluster Analysis Basics and Extensions.
https://cran.r-project.org/web/packages/cluster/cluster.pdf
Mattonai M, Pawcenis D, del Seppia S, Łojewska J, Ribechini E
(2018) Effect of ball-milling on crystallinity index, degree
of polymerization and thermal stability of cellulose.
Bioresour Technol 270:270–277. https://doi.org/10.1016/j.
biortech.2018.09.029
Mei W, Yu G (2018) basicTrendline: Add Trendline and Con-
fidence Interval of Basic Regression Models to Plot. https://
cran.r-project.org/web/packages/basicTrendline/
basicTrendline.pdf
Meireles JE, Schweiger AK, Cavender-Bares J (2018) spectro-
lab: Class and Methods for Hyperspectral Data. https://rdrr.
io/cran/spectrolab/
Mihranyan A, Llagostera AP, Karmhag R, Strømme M, Ek R
(2004) Moisture sorption by cellulose powders of varying
crystallinity. Int J Pharm 269:433–442. https://doi.org/10.
1016/j.ijpharm.2003.09.030
Nokhodchi A (2005) An overview of the effect of moisture on
compaction and compression. Pharm. Technol. 6, 46–66.
https://api.semanticscholar.org/CorpusID:38884972
O’Regan C (2018) Study of acid hydrolysis based synthesis of
microcrystalline cellulose. University College Cork.
https://cora.ucc.ie/handle/10468/6814
Park S, Baker JO, Himmel ME, Parilla PA, Johnson DK (2010)
Cellulose crystallinity index: measurement techniques and
their impact on interpreting cellulase performance.
Biotechnol Biofuels 3:10. https://doi.org/10.1186/1754-
6834-3-10
Pozo Valenzuela, C., Rodriguez-Llamazares, S., 2016. spftir:
Pre-Processing and Analysis of Mid-Infrared Spectral
Region. https://cran.r-project.org/web/packages/spftir/
spftir.pdf
R Core Team (2019) R: A language and environment for sta-
tistical computing. https://doi.org/10.1016/j.dendro.2008.
01.002
Rowe RC, McKillop AG, Bray D (1994) The effect of batch and
source variation on the crystallinity of microcrystalline
cellulose. Int J Pharm 101:169CCo172. https://doi.org/10.
1016/0378-5173(94)90087-6
RStudio Team (2019) RStudio: Integrated Development Envi-
ronment for R. https://rstudio.com/products/rstudio/
Schenzel K, Fischer S, Brendler E (2005) New method for
determining the degree of cellulose I crystallinity by means
of FT Raman spectroscopy. Cellulose 12:223–231. https://
doi.org/10.1007/s10570-004-3885-6
Segal L, Creely JJ, Martin AE, Conrad CM (1959) An empirical
method for estimating the degree of crystallinity of native
cellulose using the X-ray diffractometer. Text Res J
29:786–794. https://doi.org/10.1177/
004051755902901003
Stevens A, Ramirez-Lopez L (2013) An introduction to the
prospectr package. https://cran.r-project.org/web/
packages/prospectr/prospectr.pdf
Sun CC (2008) Mechanism of moisture induced variations in
true density and compaction properties of microcrystalline
cellulose. Int J Pharm 346:93–101. https://doi.org/10.1016/
j.ijpharm.2007.06.017
Suzuki T, Nakagami H (1999) Effect of crystallinity of micro-
crystalline cellulose on the compactability and dissolution
of tablets. Eur J Pharm Biopharm 47:225–230. https://doi.
org/10.1016/S0939-6411(98)00102-7
Takeuchi H, Nagira S, Yamamoto H, Kawashima Y (2004) Die
wall pressure measurement for evaluation of compaction-
property of pharmaceutical materials. Int J Pharm
274:131–138. https://doi.org/10.1016/j.ijpharm.2004.01.
008
Terinte N, Ibbett R, Schuster KC (2011) Overview on native
cellulose and microcrystalline cellulose I structure studied
by X-ray diffraction ( Waxd ): comparison between mea-
surement techniques. Lenzinger Berichte 89:118–131.
https://doi.org/10.1163/156856198X00740
Thoorens G, Krier F, Leclercq B, Carlin B, Evrard B (2014)
Microcrystalline cellulose, a direct compression binder in a
quality by design environment - a review. Int J Pharm
473:64–72. https://doi.org/10.1016/j.ijpharm.2014.06.055
Vonbehren, D., Lynch, M.G., Miranda, A.C., 2010. Cosmetic
composition containing microcrystalline cellulose. United
States Pat. https://patents.google.com/patent/
US20060115438A1/en
Wickham H (2016) ggplot2: Elegant graphics for data analysis.
Springer-Verlag, New York
Wickholm K, Larsson PT, Iversen T (1998) Assignment of
noncrystalline forms in cellulose I by CP/MAS 13C NMR
spectroscopy. Carbohydr Res 312:123–129. https://doi.
org/10.1016/S0008-6215(98)00236-5
Yang W, Ping P, Wang L-L, Bo-Yuan Chen T, Chun-Yin Yuen
A, Zhu S-E, Wang N-N, Hu Y-L, Yang P-P, Sun C, Zhang
C-Y, Lu H-D, Chan QN, Yeoh G-H (2018) Fabrication of
fully bio-based aerogels via microcrystalline cellulose and
hydroxyapatite nanorods with highly effective flame-re-
tardant properties. ACS Appl Nano Mater 1:1921–1931.
https://doi.org/10.1021/acsanm.8b00312
Yao W, Weng Y, Catchmark JM (2020) Improved cellulose
X-ray diffraction analysis using fourier series modeling.
Cellulose 27:5563–5579. https://doi.org/10.1007/s10570-
020-03177-8
Publisher’s Note Springer Nature remains neutral with
regard to jurisdictional claims in published maps and
institutional affiliations.
123
Cellulose (2021) 28:8971–8985 8985


![[Product Monograph Template - Standard] · hydroxypropyl cellulose, magnesium stearate, mannitol, and microcrystalline cellulose, and red ferric oxide. granules/ 4 mg. 4 mg packet](https://static.fdocuments.in/doc/165x107/5d480f1b88c99311688bb951/product-monograph-template-standard-hydroxypropyl-cellulose-magnesium-stearate.jpg)


