Investigating in vitro digestion of food models to explain ...
17
HAL Id: hal-02100429 https://hal.archives-ouvertes.fr/hal-02100429 Submitted on 2 Jun 2020 HAL is a multi-disciplinary open access archive for the deposit and dissemination of sci- entific research documents, whether they are pub- lished or not. The documents may come from teaching and research institutions in France or abroad, or from public or private research centers. L’archive ouverte pluridisciplinaire HAL, est destinée au dépôt et à la diffusion de documents scientifiques de niveau recherche, publiés ou non, émanant des établissements d’enseignement et de recherche français ou étrangers, des laboratoires publics ou privés. Investigating in vitro digestion of food models to explain in vivo micronutrient bioavailability Manon Hiolle, Beatrice Gleize, N. Meunier, B. Pereira, R. Richard, Isabelle Savary-Auzeloux, Marie-Agnès Peyron, Catherine Veyrat, Olivia Ménard, Caroline Buffère, et al. To cite this version: Manon Hiolle, Beatrice Gleize, N. Meunier, B. Pereira, R. Richard, et al.. Investigating in vitro digestion of food models to explain in vivo micronutrient bioavailability. 6.International Conference on Food Digestion, Apr 2019, Grenade, Spain. 2019. hal-02100429
Transcript of Investigating in vitro digestion of food models to explain ...

HAL Id: hal-02100429https://hal.archives-ouvertes.fr/hal-02100429
Submitted on 2 Jun 2020
HAL is a multi-disciplinary open accessarchive for the deposit and dissemination of sci-entific research documents, whether they are pub-lished or not. The documents may come fromteaching and research institutions in France orabroad, or from public or private research centers.
L’archive ouverte pluridisciplinaire HAL, estdestinée au dépôt et à la diffusion de documentsscientifiques de niveau recherche, publiés ou non,émanant des établissements d’enseignement et derecherche français ou étrangers, des laboratoirespublics ou privés.
Investigating in vitro digestion of food models to explainin vivo micronutrient bioavailability
Manon Hiolle, Beatrice Gleize, N. Meunier, B. Pereira, R. Richard, IsabelleSavary-Auzeloux, Marie-Agnès Peyron, Catherine Veyrat, Olivia Ménard,
Caroline Buffière, et al.
To cite this version:Manon Hiolle, Beatrice Gleize, N. Meunier, B. Pereira, R. Richard, et al.. Investigating in vitrodigestion of food models to explain in vivo micronutrient bioavailability. 6.International Conferenceon Food Digestion, Apr 2019, Grenade, Spain. 2019. �hal-02100429�

Investigating in vitro digestion of food modelsto explain in vivo micronutrient bioavailability
Speaker : Manon Hiolle

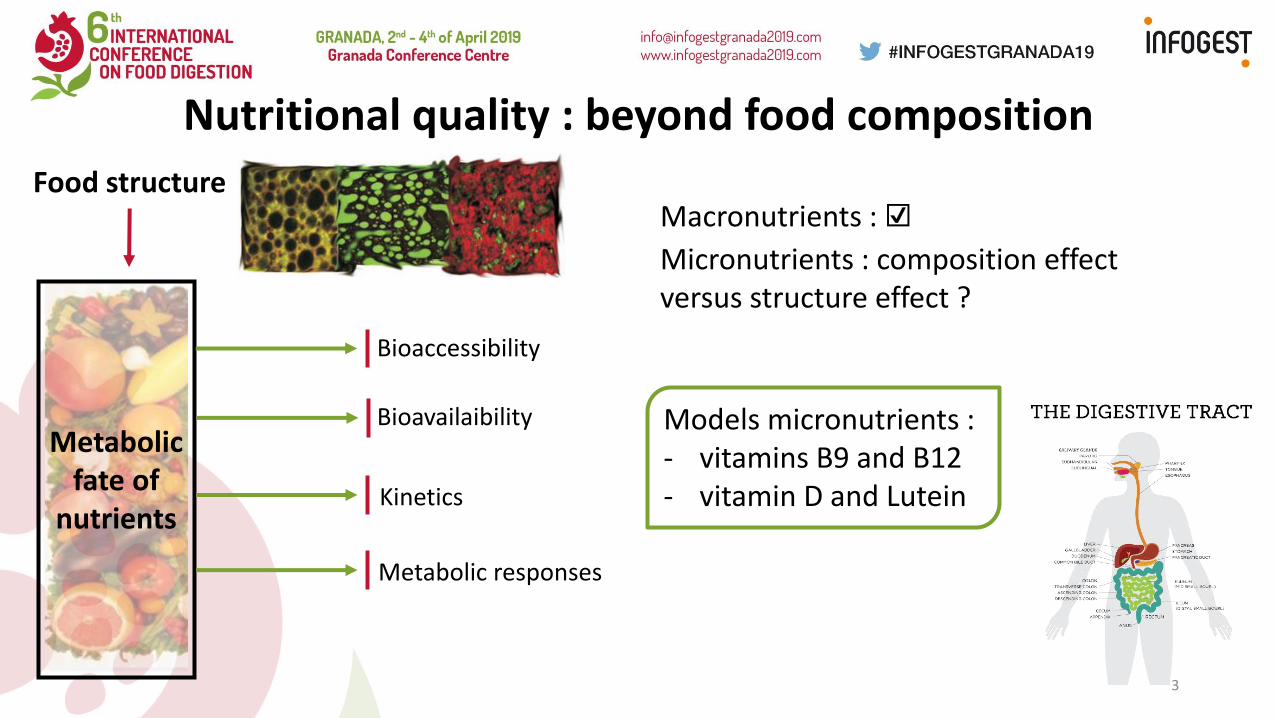
Nutritional quality : beyond food composition
2
FOOD
Blo
od
stream
DIGESTION :Complex processing of
food disintegrationfor delivery of nutrients
Interactions
A composition A structure
« Food, not nutrients, is the fundamentalunit in nutrition »
Jacobs & Tapsell (2007)
3
Nutritional quality : beyond food composition
Food structure
Metabolic fate of
nutrients
Models micronutrients : - vitamins B9 and B12- vitamin D and Lutein
Bioaccessibility
Metabolic responses
Kinetics
Bioavailaibility
Macronutrients : ☑
Micronutrients : composition effectversus structure effect ?

4
Strategy : clinical study conduct
Four productswithidenticalcomposition
Custard
Pudding
Sponge cake
Biscuit
Water content
+
-
Clinical study
• 12 healthy male subjects• 20 to 30 years old• Cross-over experimental design
Enriched with the fourmicronutrients studied
• 8 hours postprandial follow-up
• Hourly blood samples and plasma separation by centrifugation
Bioavailability
• Absorption kinetics: quantitative analysis of micronutrients in plasma or chylomicrons
Liquid
Soft gel
Foamy solid
Hard solid Results for B9 : poster n°378/214, session 2
Products characterization• Microstructure : confocal microscopy• Macrostructure : texture analysis

5
Strategy : development of food models
Matrices Biscuit Sponge cake Pudding Custard
Photo
Water content 6 % 38 % 48 % 68 %
Heatingtreatment
180 °C/18 min 180 °C/30 min 180 °C/20 min110 °C/20 min
80 °C/7 min
Portion size 135 g 206 g 242 g 512 g
Same composition on dry matter :
- 17 % proteins- 52 % carbohydrates- 30 % lipids
: lipids (Red Nile): proteins (Fast Green)
Enriched in (per portion) : - Lutein : 20 mg- Vitamin D : 1,25 mg- B9 : 1 mg- B12 : 12 µg

6
Results - clinical study
0
5
10
15
20
25
30
35
40
45
50
0 60 120 180 240 300 360 420 480
Dco
nte
nt
of
lute
in (
nm
ol/
L)
Time after meal ingestion (min)
Mean ± SEM
0
2
4
6
8
10
12
0 60 120 180 240 300 360 420 480
Dco
nte
nt
of
vita
min
D3
(nm
ol/
L)
Time after meal ingestion (min)
Mean ± SEM
→ Extraction of 2 parameters from the curves : - TAmax : Time of
maximal absorption
- AUC : Area under the curve
Lutein Vitamin D

7
Results - clinical study
Later TAmax for harder texture
0
50
100
150
200
250
300
350
TAm
ax (
min
)
Time of maximal concentration
a
b b b
a
b bb
0
200
400
600
800
1000
1200
1400
1600
Biscuit Spongecake
Pudding Custard
AU
C
Area under the curve
Hardness
+-
aa,b
a,b
b
a,b
a b
a
Hardness+
-
Vitamin D Lutein
Tendency to higher total bioavailability for softer matrices

8
Research question and strategy
Food structure impacts kinetics of matrix disintegration during digestion
Can we explain in vivo digestion mechanismsby using an in vitro digestion model ?
Following INFOGEST in vitro protocol with special conditions : Use of human saliva in oral phase (mix 1:1) Constant water content between matrices
(difference adjustment with water)
Focus point : Matrix disintegration
ProteolysisLipolysisAmylolysis
Release of micronutrients (lutein and vitamin B9)
(Minekus, 2014)
Digestion kinetics
(S0, G0, G30, G120, I0, I30, I120)
9
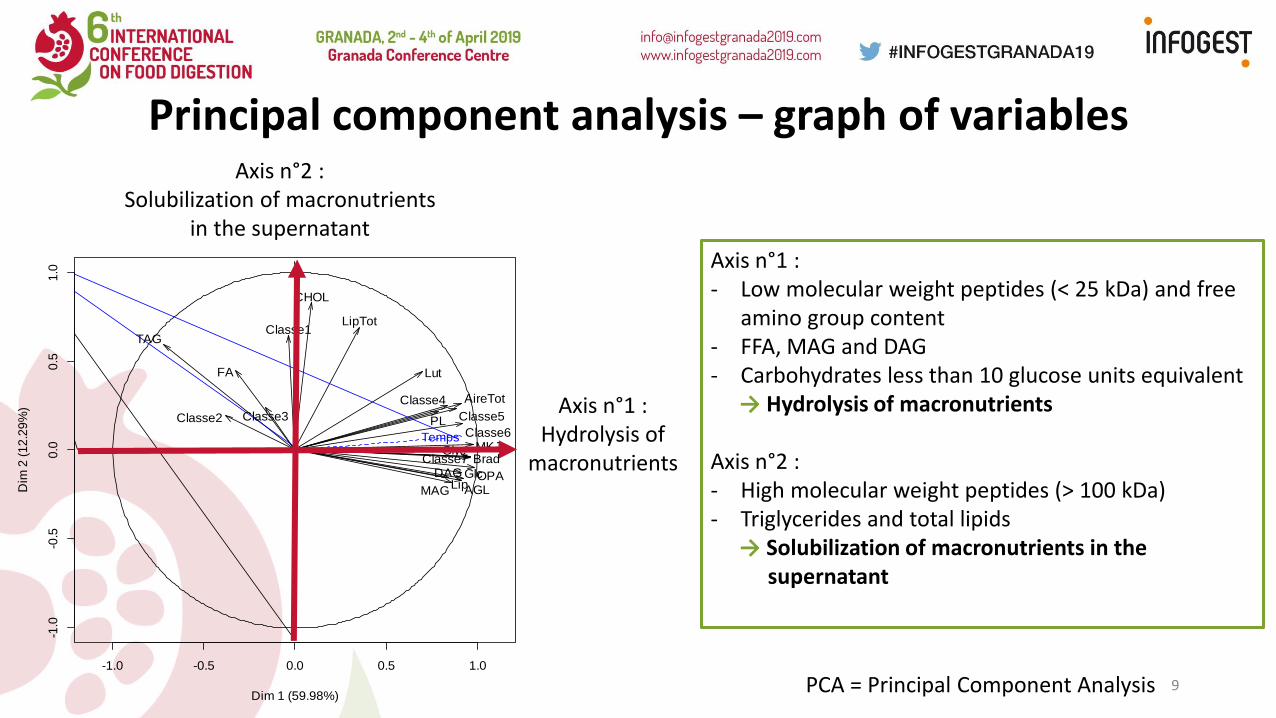
Principal component analysis – graph of variables
-1.0 -0.5 0.0 0.5 1.0
-1.0
-0.5
0.0
0.5
1.0
ACP n°1 : Graphe des variables
Dim 1 (59.98%)
Dim
2 (
12
.29
%)
GlcLip
LutFA
Brad
AireTot
MKJ
OPA
Classe1
Classe2 Classe3
Classe4
Classe5
Classe6
Classe7Glyc
TAG
AGL
CHOL
DAG
MAG
PL
LipTot
Temps
Axis n°2 : Solubilization of macronutrients
in the supernatant
Axis n°1 : Hydrolysis of
macronutrients
Axis n°1 : - Low molecular weight peptides (< 25 kDa) and free
amino group content- FFA, MAG and DAG- Carbohydrates less than 10 glucose units equivalent
→ Hydrolysis of macronutrients
Axis n°2 : - High molecular weight peptides (> 100 kDa)- Triglycerides and total lipids
→ Solubilization of macronutrients in the supernatant
PCA = Principal Component Analysis

10
Principal component analysis – map of individualsAxis n°2 :
Solubilization of macronutrients in the supernatant
Axis n°1 : Hydrolysis of
macronutrients
-6 -4 -2 0 2 4 6 8
-50
51
0
ACP n°1 : Graphe des individus
Dim 1 (59.98%)
Dim
2 (
12
.29
%)
22
36
57
23
3758
24
38
59
25
3960
26
4061
27
41
62 28
42
63
1
50
712
51
72
352
73
4
5374 554
75 6
5576 7
56
77
15
43
64
16
4465
17
4566
1846
67
19
47 68
2048
69
2149 70
8
29
78
9
30
79
10
31
801132
81
12
33
82
133483 14
3584
BCA
F
G
G0
G120
G30 I0
I120
I30S0
BCA
FG
1°) Grouped by matrix : no matrix effect highlighted
2°) Grouped by digestion time : evidence of a strong "digestion time" effect on individuals→ Samples split according to digestion time
Oral phase
Gastric phase
Intestinal phase

11
-4 -2 0 2 4 6
-4-2
02
4
Dim 1 (49.30%)
Dim
2 (
28
.44
%)
B.S0
B.G0
B.G30
B.G120B.I0
B.I30
B.I120
CA.S0
CA.G0CA.G30
CA.G120
CA.I0CA.I30
CA.I120
F.S0
F.G0
F.G30
F.G120
F.I0
F.I30
F.I120
G.S0
G.G0
G.G30G.G120
G.I0G.I30
G.I120
B
CA
F
G
S0G0
G30G120
I0I30I120
Multiple factor analysis – map of individuals
Axis n°2 : Solubilization of macronutrients
in the supernatant
Axis n°1 : Hydrolysis of
macronutrients
Matrix effect highlighted by this analysis- Axis n°1 isolates biscuit- The 3 softer matrices are separated along the axis n°2
Focus on custard behavior during in vitro digestion :
- Oral phase : macronutrients solubilized in the supernatant
- Gastric phase : drop in pH leads to macronutrients aggregation
- Intestinal phase : re-solubilization and hydrolysis of macronutrients
Water content
Heat treatment
-4 -2 0 2 4 6
-4-2
02
4
Dim 1 (49.30%)
Dim
2 (
28
.44
%)
B.S0
B.G0
B.G30
B.G120B.I0
B.I30
B.I120
CA.S0
CA.G0CA.G30
CA.G120
CA.I0CA.I30
CA.I120
F.S0
F.G0
F.G30
F.G120
F.I0
F.I30
F.I120
G.S0
G.G0
G.G30G.G120
G.I0G.I30
G.I120
B
CA
F
G
S0G0
G30G120
I0I30I120

12
AGL > 100 kDa 50 kDa 25 kDa 10 kDa 5 kDa 1 kDa < 1 kDa DAG B9 Glc Glyc Lip Lut MAG MKJ OPA TAG
AGL 0.1752 0.0505 0.6405 <.0001 <.0001 <.0001 <.0001 <.0001 0.0131 <.0001 <.0001 <.0001 <.0001 <.0001 <.0001 <.0001 <.0001
> 100 kDa 0.1752 0.7055 0.4193 0.2575 0.1624 0.2762 0.5820 0.1630 0.0032 0.0627 0.4111 0.3951 0.0758 0.2104 0.5493 0.1655 0.0103
50 kDa 0.0505 0.7055 <.0001 0.2164 0.6387 <.0001 <.0001 0.0923 0.6511 0.1283 0.0338 0.0200 0.1880 0.1097 0.0260 0.0166 0.0162
25 kDa 0.6405 0.4193 <.0001 0.4850 0.0662 0.0197 0.0117 0.9289 0.5243 0.9186 0.7120 0.2819 0.6995 0.8595 0.6308 0.4731 0.4055
10 kDa <.0001 0.2575 0.2164 0.4850 <.0001 <.0001 <.0001 <.0001 0.1846 <.0001 <.0001 0.0002 <.0001 0.0007 <.0001 <.0001 0.0057
5 kDa <.0001 0.1624 0.6387 0.0662 <.0001 <.0001 <.0001 <.0001 0.2743 <.0001 <.0001 <.0001 <.0001 <.0001 <.0001 <.0001 0.0002
1 kDa <.0001 0.2762 <.0001 0.0197 <.0001 <.0001 <.0001 <.0001 0.3762 <.0001 <.0001 <.0001 <.0001 <.0001 <.0001 <.0001 <.0001
< 1 kDa <.0001 0.5820 <.0001 0.0117 <.0001 <.0001 <.0001 <.0001 0.0172 <.0001 <.0001 <.0001 <.0001 <.0001 <.0001 <.0001 <.0001
DAG <.0001 0.1630 0.0923 0.9289 <.0001 <.0001 <.0001 <.0001 0.0074 <.0001 <.0001 <.0001 <.0001 <.0001 <.0001 <.0001 <.0001
B9 0.0131 0.0032 0.6511 0.5243 0.1846 0.2743 0.3762 0.0172 0.0074 0.0278 0.0240 0.0325 0.1914 0.0385 0.0308 0.0034 0.0017
Glc <.0001 0.0627 0.1283 0.9186 <.0001 <.0001 <.0001 <.0001 <.0001 0.0278 <.0001 <.0001 0.0001 <.0001 <.0001 <.0001 <.0001
Glyc <.0001 0.4111 0.0338 0.7120 <.0001 <.0001 <.0001 <.0001 <.0001 0.0240 <.0001 <.0001 <.0001 <.0001 <.0001 <.0001 <.0001
Lip <.0001 0.3951 0.0200 0.2819 0.0002 <.0001 <.0001 <.0001 <.0001 0.0325 <.0001 <.0001 <.0001 <.0001 <.0001 <.0001 <.0001
Lut <.0001 0.0758 0.1880 0.6995 <.0001 <.0001 <.0001 <.0001 <.0001 0.1914 0.0001 <.0001 <.0001 0.0005 <.0001 <.0001 0.1704
MAG <.0001 0.2104 0.1097 0.8595 0.0007 <.0001 <.0001 <.0001 <.0001 0.0385 <.0001 <.0001 <.0001 0.0005 <.0001 <.0001 <.0001
MKJ <.0001 0.5493 0.0260 0.6308 <.0001 <.0001 <.0001 <.0001 <.0001 0.0308 <.0001 <.0001 <.0001 <.0001 <.0001 <.0001 <.0001
OPA <.0001 0.1655 0.0166 0.4731 <.0001 <.0001 <.0001 <.0001 <.0001 0.0034 <.0001 <.0001 <.0001 <.0001 <.0001 <.0001 <.0001
TAG <.0001 0.0103 0.0162 0.4055 0.0057 0.0002 <.0001 <.0001 <.0001 0.0017 <.0001 <.0001 <.0001 0.1704 <.0001 <.0001 <.0001
Matrix of Pearson correlations – p-values

13
Matrix of Pearson correlations – p-values
Vitamin B9 correlates with : - Solubilization of macronutrients (TAG, total lipids,
high weight class of proteins)- Markers of matrix disintegration (lipolysis,
proteolysis, amylolysis)
Lutein correlates with : - Markers of matrix disintegration
(lipolysis, proteolysis, amylolysis)
Hydrolysis of all macronutrient classes has an impact on micronutrients release from the matrix
→ The key factor of micronutrients bioaccessibility seems to be matrix disintegration
TAGTotallipids
FFA DAG MAGFFA/
tot lipTotal
nitrogen> 100 kDa
50 kDa 25 kDa 10 kDa 5 kDa 1 kDa < 1 kDaFree
aminoGlc B9 Lut
B9 0.0017 0.0240 0.0131 0.0074 0.0385 0.0325 0.0308 0.0032 0.6511 0.5243 0.1846 0.2743 0.3762 0.0172 0.0034 0.0278 0.1914
Lut 0.1704 <.0001 <.0001 <.0001 0.0005 <.0001 <.0001 0.0758 0.1880 0.6995 <.0001 <.0001 <.0001 <.0001 <.0001 0.0001 0.1914
Lipolysis Proteolysis Amylolysis
Lipids in supernatant
Proteins in supernatant

14
Lutein is released continuously during digestion → driven by proteolysis ?
Release of B9 mainly during gastric step: impacted by solubilization of macronutrient
Drop in B9 bioaccessibility in intestinal phase : low solubility at neutral pH
0
50
100
150
200
250
0
20
40
60
80
100
120
140
B9
bio
acce
ssib
ility
(µ
g)
Lute
in b
ioac
cess
ibili
ty (
%)
LuteinB9
S0 G0 G30 G120 I0 I30 I120
Oral phasepH 6,5
amylase
Gastric phasepH 3
protease
Intestinal phasepH 7
proteaselipase
amylase
15
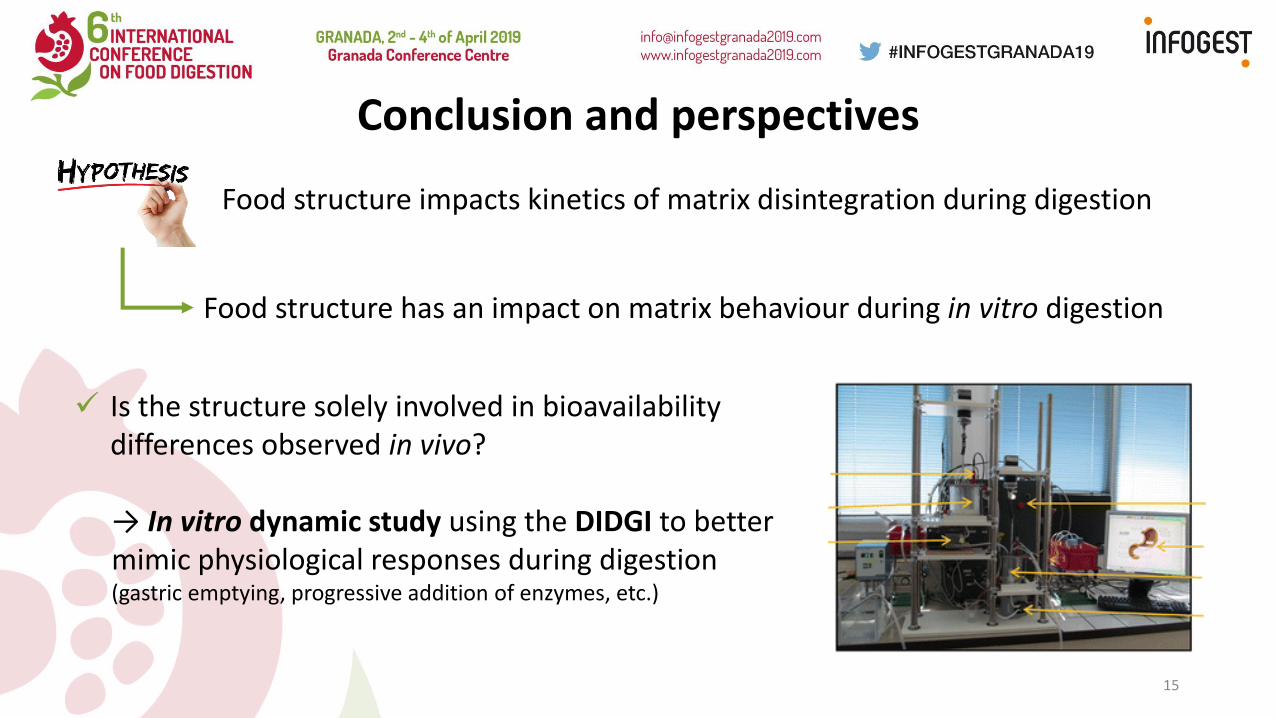
Conclusion and perspectives
Is the structure solely involved in bioavailability differences observed in vivo?
→ In vitro dynamic study using the DIDGI to better mimic physiological responses during digestion (gastric emptying, progressive addition of enzymes, etc.)
Food structure impacts kinetics of matrix disintegration during digestion
Food structure has an impact on matrix behaviour during in vitro digestion

Béatrice Gleize
Catherine Caris-VeyratEmmanuelle Reboul
Isabelle Savary-Auzeloux
Caroline Buffière
Nathalie Meunier
Ruddy Richard
Bruno Pereira
Françoise Nau
Didier Dupont
Olivia Menard
Nathalie Boulier-Monthean
Jordane Ossemond
Thank you for your
attention
If you want more information :
Poster n°378/214, session 2