INVESTIGATING DEPENDENCIES OF RAS MUTANT LUNG...
94
UNIVERSIDADE DE LISBOA Faculdade de Ciências Departamento de Química e Bioquímica INVESTIGATING DEPENDENCIES OF RAS MUTANT LUNG CANCER CELLS Nádia Sofia de Carvalho Lima Dissertação orientada por Prof. Doutor Julian Downward e Prof. Doutor Carlos Farinha MESTRADO EM BIOQUÍMICA Bioquímica Médica Dissertação 2015
Transcript of INVESTIGATING DEPENDENCIES OF RAS MUTANT LUNG...
UNIVERSIDADE DE LISBOA
Faculdade de Ciências
Departamento de Química e Bioquímica
INVESTIGATING DEPENDENCIES OF
RAS MUTANT LUNG CANCER CELLS
Nádia Sofia de Carvalho Lima
Dissertação orientada por Prof. Doutor Julian Downward
e Prof. Doutor Carlos Farinha
MESTRADO EM BIOQUÍMICA
Bioquímica Médica
Dissertação
2015


Acknowledgements
First, above all and everyone I am grateful to Prof. Doctor Julian
Downward. For the incomparable and unique opportunity he gave me when I
joined his Lab. I was blessed to get to grow at many levels in such environment,
full of great and intense debates with the most intelligent and admirable
scientists, promptly helpful people with infinite good characters. I will always
and ever feel flattered to deserve your confidence since the first minute. My life
would not have the same value without this experience.
To Alice Zhou, my closer supervisor. She shared with me all her
knowledge, helped me since the first moment and made me always believe that
sometimes what seems to be impossible can be turned into something real. We
were truly a team! Her friendship and care about me were beyond my
expectations. Thank you Alice for being part of my life this year.
To all my lab colleagues, a special acknowledgement to Miriam, the "brain
and expertise" of the lab. With her wide knowledge, in a blink of an eye, she
always knows how to carry on in science, I truly respect you. To Clare, the most
funny and wise lady in the entire world, a friend that never let me down and
always carried me. We shared great moments! To Davide, the listener and the
most working-hard scientist with the best taste in music. And to all the others a
big thank you for sharing 9 months of your life with me. For all those Fridays I
was dragged from the lab to share "happy pints" as the British style while
having interesting conversations...
To my friends in London, Julie and Juliana. We shared not only a house but
a life. For all those nights I arrived home completely brainless and you still
managed to put a smile on my face... Thanks for listening to my stories about
spheres, tumors and stubborn western blots very patiently and for making me
believe in myself. Also, a special thank you to my dear friends in Portugal,
Maguiezita, Catarinazinha, Marlene and Cris.
Finally, to my mother, the one who was always there, unconditionally
every minute of my life. To my father who never says a word but I know that
he is deeply proud of me! And to my brother that always find a way of
explaining my scientific achievements with an artistic touch.
Because of all the questions I still want to explain and because "if you can't
explain it simply, you don't understand it well enough" (Albert Einstein), I will
always be an excited and ambitious scientist.


To myself and to my mother...
i
Abstract
Lung cancer is a leading cause of death worldwide. Genetic features like
KRAS mutations are known to be a risk factor. The GTPase switcher RAS takes
part on many aspects of the cell pathway and signal transduction. Example of
that is its recognized involvement in cell survival, proliferation, metabolism,
motility, immune response and many others. RAS constitutive activation driven
by the common G12D KRAS mutation is responsible for numerous cancer
hallmarks.
To date, direct target of the mutant KRAS is still poorly efficient. Despite
all the efforts and continuous advances in targeting either upstream and
downstream KRAS effectors, there is still a long path to be taken with dubious
questions to be answered. Several inhibitors are already in clinic, however the
ability of RAS to compensate targeted pathways, and activate other effector
kinases reduces their efficiency in the clinical setting. Other difficulty in the
drug development field is to extrapolate the in vitro results to in vivo
predictions. In this regard, 3D cultures are known to better model the in vivo
situation than the frequently used 2D cultures. In vivo morphologic,
physiologic, pathologic and functional environmental features of the tumor
biology are aspects that can be simulated by 3D models, better predicting and
evaluating therapeutic outcomes.
In this work, 3D culture models of NSCLC (non-small cell lung cancer) cell
lines have been developed along with an appropriate method to monitor cell
viability in spheroids. The presence of an artificial extracellular matrix is shown
to support proliferation and survival of NSCLC, promoting a non-anchorage
independent multicellular growth. 3D models are also shown here to encourage
cell structural organization and differentiation. Besides, the activity of p-ERK is
especially elevated in these systems. A metabolic ATP-based viability test
integrated with an efficient cell lysis is described as being an efficient, sensitive
and accurate tool to evaluate the viability of spheroids. It is also shown that 2D
and 3D culture cells have different sensitivities to drug treatments. Whereas 3D
cultures are mostly vulnerable to structural stability disruption and PKC
inhibition, 2D cultures show increased sensitivity upon MEK inhibition.
ii
Nevertheless, vulnerabilities and KRAS dependency is cell line dependent and
variability can be found between 2D and 3D models. However, results do not
diminish the importance of using 3D cultures as valuable platforms to get better
in vivo therapeutic predictions. It can eventually be the tool we are lacking to
find new target therapies. It is therefore still a work in progress awaiting for a
large-scale drug screen in order to highlight potential 3D exclusive drug
candidates.
Keywords: 3D cell culture; spheroid viability assay; lung cancer; NSCLC; KRAS
pathway inhibition; drug screening.

iii
iv
Resumo
O cancro do pulmão é uma das principais causas de morte no mundo. Só
em 2012 na Europa cerca de 388.000 mortes foram registadas. Apesar da
existência de algumas drogas eficazes para o tratamento do cancro do pulmão,
o reaparecimento da doença é frequente após o tratamento. A aquisição de
mutações pontuais que causam resistência e aparecimento de vias de
sinalização alternativas e compensatórias é a principal causa.
Apesar da conhecida associação do cancro do pulmão com o tabagismo,
outros fatores de risco são conhecidos. Entre os principais, conta-se a história
familiar. Alterações genéticas incluem na maioria dos casos mutações nos genes
p53, Bcl2, Rb, FHIT e p16INK. Perda de heterozigotia, mudanças em telomerases e
a ativação constitutiva do oncogene KRAS são também evidentes fatores de
risco.
Dentro do vasto painel de mutações para KRAS, pode contar-se como mais
comum a G12D, responsável pelo desenvolvimento do subtipo cancro do
pulmão de células não-pequenas (NSCLC), um dos mais agressivos.
A proteína RAS é codificada pelo gene KRAS. Pertence à família das
GTPases e tem como função molecular a ativação e desativação por fosforilação
de GDP a GTP e vice-versa. Está envolvida numa longa cascata de transdução
do sinal responsável pela proliferação e sobrevivência celular. As mutações em
KRAS têm portanto um papel fundamental no aparecimento e desenvolvimento
do cancro. A sua ativação constitutiva leva à continua estimulação das vias de
sinalização a jusante promovendo a constante proliferação e sobrevivência,
reprogramação metabólica, reorganização do citoesqueleto, inflamação e
remodelação do microambiente para adaptação tumoral.
Até à data, a direta inibição do mutante KRASG12D tem-se revelado
impossível. Contudo, a proteína RAS encontra-se no topo de uma bifurcação de
sinalização, tendo como principais alvos cinases como RAF, MEK, AKT e PI3K.
Deste modo, alguns inibidores têm sido desenvolvidos nos últimos anos com o
objetivo de bloquear alguns destes efetores tanto a montante como a jusante das
vias de sinalização RAS. Inibidores das proteínas MEK e PI3K são dois casos já
v
clinicamente aprovados. Contudo, os progressos têm sido frequentemente
atenuados devido à enorme capacidade da proteína RAS em alcançar inúmeras
vias de sinalização alternativas e compensatórias, apontando para a
necessidade do uso de terapias combinadas.
O laboratório de Julian Downward, tem reunido esforços valiosos para a
identificação de dependências exclusivas do mutante KRAS. A título de
exemplo foi demonstrado que os inibidores MEK são seletivamente tóxicos para
o mutante KRAS, enquanto o mesmo já não acontece para os inibidores de
PI3K. Complementarmente, foram identificadas algumas dependências
seletivas do mutante KRAS para atividades que não são diretamente reguladas
pelo oncogene RAS. O mutante KRAS é por exemplo dependente da cinase de
ligação 1 (TBK1), da cinase-1 ativada pelo fator de crescimento transformador β
(TAK1), do fator de transcrição GATA2, da ciclina dependente de cinases
CDK4, de alguns reguladores mitoticos, componentes do proteassoma entre
outros.
A grande maioria do conhecimento científico adquirido nesta área foi
desenvolvido em culturas celulares em mono-camada com linhas celulares
originárias de tumores de pacientes. Contudo, a sua manutenção prolongada
em cultura conduz a um inevitável estado de adaptação e dependência gerados
pela adição continua de suplementos ao meio de cultura. Este ambiente
artificial leva à acumulação de mutações, e quando comparadas com células in
situ, diferenças a nível molecular como diferentes expressões de marcadores de
diferenciação, adesão e recetores de fatores de crescimento, podem ser
encontradas. A credibilidade destes métodos em representar o tumor original e
a confiança com que podem fornecer informações acerca de previsões clinicas
começa então a ser posta em causa.
O desenvolvimento de novos fármacos requer modelos que possam
simular exatamente as condições in vivo e que possam ter relevância clínica.
Desta forma, os modelos de cultura tridimensionais (3D) têm ganhado ênfase
dentro da comunidade científica devido à sua capacidade em reproduzir a
situação in vivo. Estas são conhecidas por manter o fenótipo de células tumorais
funcional e copiar características morfológicas, fisiológicas, patológicas e
ambientais do tumor. A organização de uma estrutura multicelular e o
microambiente envolventes têm um impacto notório na sobrevivência e
progressão tumoral. Estes têm também um papel fundamental na expressão
genética, fenótipo e resposta/sensibilidade a diferentes inibidores terapêuticos.
As culturas 3D são capazes de abranger todas estas características, eliminando
vi
algumas das desvantagens presentes nas culturas bidimensionais (2D). São
portanto uma ferramenta bastante promissora no que diz respeito ao
desenvolvimento rápido de novas terapias, diminuindo custos de estudos
preliminares e indo de encontro ao progresso farmacêutico e clínico.
Neste projeto, dado as descritas vantagens dos modelos 3D, foi
desenvolvido um método 3D que permita o crescimento e sobrevivência celular
de NSCLC conjuntamente com um método que permita a monitorização da
viabilidade celular em esferoides. Seguidamente, tendo em conta as
vulnerabilidades da mutação KRAS e as suas dependências já mencionadas
anteriormente, foram realizados testes de comparação 2D e 3D com o intuito de
averiguar quão dependente a via de sinalização RAS é do método de cultura
implementado. Pretendeu-se estudar que tipo de diferenças morfológicas, de
sinalização e sensibilidade a inibidores existiam que pudessem conferir maior
sensibilidade a culturas 2D ou 3D.
Vários métodos de cultura celular 3D já são conhecidos. Suspensões
celulares podem ser usadas principalmente para formar simples aglomerados
celulares. Superfícies antiaderentes são uma opção, assim como a técnica da
hanging-drop, onde suspensões celulares são cultivadas em pequenas gotas
invertidas num meio especificamente viscoso e controlado. Forças
gravitacionais induzem a formação de esferas de colónias celulares.
Alternativamente, culturas envoltas em componentes da matriz extracelular,
como matrigel, metilcelulose, fibronectina, laminina e colagénio formam
esferoides com características específicas do tumor original. Este tipo de método
permite a interação célula-célula e célula-matriz, permitindo inclusive o
crescimento e sobrevivência de células dependentes de ancoragem.
Resultados demonstraram que culturas em matrizes com componentes da
matriz extracelular, no caso testado em 2.5% (v/v) de matrigel, são
fundamentais para a sobrevivência celular de NSCLC, determinando em certos
casos uma definida organização estrutural e diferenciação celular.
Métodos para o controlo da viabilidade celular também se encontram
disponíveis no mercado, contudo a exata determinação da viabilidade em
esferas está limitado à capacidade de penetração dos reagentes indicadores nas
mesmas. Propriedades de lise são fundamentais para uma maior sensibilidade,
atribuindo as maiores vantagens ao ensaio CellTiter-Glo cujo sinal de
fluorescência é proporcional à quantidade de ATP as células.
Resultados demonstram ainda que os níveis de actividade de p-ERK estão
especialmente elevados quando as células são cultivadas em 3D, mas que as
vii
demais proteínas envolvidas nas vias de transdução do sinal RAS como p-AKT
e p-MLC, não se encontram particularmente alteradas entre os dois métodos de
cultura celular.
Diferenças entre 2D e 3D relativamente a dependências do mutante KRAS,
foram também estudadas. Primeiramente, um teste com uma biblioteca de 384
inibidores de cinases foi corrido automaticamente em esferas e comparado
diretamente com um ensaio independente em 2D para uma linha celular
diferente mas com a mesma mutação KRAS. A análise dos dados salientou 10
inibidores como tendo um efeito citotóxico nos esferoides e um efeito oposto de
crescimento celular nas culturas 2D. A partir deste ponto novos testes em escala
mais pequena foram realizados e novos inibidores, conhecidos por conferir
vulnerabilidade às células com a mutação KRAS foram usados. A respetiva
viabilidade celular foi monitorizada em 2D e 3D para concentrações crescentes
de inibidor.
Dentro da lista de inibidores candidatos usados podem contar-se
inibidores das proteínas MEK, PI3K, IKK, PKC, CDK, mTOR, TGF-β, LDH-A, c-
Met, Rho e FAK, assim como inibidores do proteassoma e destabilizadores
estruturais como a Latrunculina e Paclitaxel. Resultados sugerem que em
comparação com culturas 2D, as 3D são especialmente sensíveis a drogas que
interferem com a organização da estrutura celular, como é o caso de
estabilizadores da tubulina e inibidores da actina. Culturas 3D demonstram
também maior sensibilidade perante inibidores da proteína cinase C (PKC)
enquanto que culturas 2D são mais vulneráveis a inibidores MEK. Contudo, os
resultados indicam ainda que a dependência KRAS é especifica de cada
linhagem celular, uma vez que variabilidades entre 2D e 3D podem ser
encontradas de caso para caso.
Tentativas preliminares de recriar um modelo knockdown especificamente
para o mutante KRAS, com RNA de interferência (siRNA), tiveram pouco
sucesso. No entanto o desenho deste modelo geneticamente modificado terá
significância para futuros testes com culturas 3D. O knockdown dum oncogene
importante como KRAS torna as células bastante sensíveis. Um modelo estável
funcionará como controlo em novos ensaios e determinará a especificidade e
atribuição dos resultados à mutação KRAS.
Os resultados alcançados não desvalorizam a importância do uso de
plataformas 3D como forma de obter melhores previsões terapêuticas. Pode
eventualmente ser a ferramenta indicada para encontrar novos alvos
terapêuticos melhorando as perspetivas de tratamento. É porém um trabalho

viii
ainda em progresso que espera novos testes automáticos com largas gamas de
inibidores de forma a expor potenciais drogas com exclusiva vulnerabilidade
KRAS em culturas 3D.
Palavras-chave: cultura celular 3D; Teste de viabilidade em esferoides; Cancro
do pulmão; NSCLC; Inibição da via KRAS; drug screening.

ix
x
Table of contents
Abstract ........................................................................................................................... i
Resumo ......................................................................................................................... iv
Terminology and Abbreviations ............................................................................. xiv
1 Introduction ................................................................................................................ 1
1.1- Lung cancer ................................................................................................ 1
1.1.1- RAS oncogene and signalling pathway ................................... 2
1.2- 3D cultures .................................................................................................. 4
1.2.1- 3D culture systems ...................................................................... 5
1.3- 2D vs 3D differences .................................................................................. 7
1.3.1- Targeting KRAS effectors .......................................................... 7
1.3.1.1- Candidate inhibitors .................................................... 8
1.3.2- KRAS knockdown .................................................................... 10
1.4- Aim of the work ....................................................................................... 11
2 Materials and Methods ........................................................................................... 12
2.1- 3D culture methods ................................................................................. 12
2.1.1- Soft agar ...................................................................................... 12
2.1.1.1- Giemsa staining .......................................................... 13
2.1.2- Non-adherent round bottom plates ....................................... 13
2.1.3- Non-adherent coated plates .................................................... 13
2.1.3.1- Agar coating ................................................................ 14
2.1.3.2- Polyhema coating ....................................................... 14
2.1.4- Hanging drops .......................................................................... 14
2.1.5- Matrice embedding ................................................................... 15
2.1.5.1- Matrigel ....................................................................... 15
2.1.5.1- Methylcellulose .......................................................... 16
2.2- Viability methods .................................................................................... 17
2.2.1- CellTiter-Blue assay .................................................................. 17
xi
2.2.2- CellTiter-Blue with EDTA treatment ..................................... 17
2.2.3- Tryphan blue staining .............................................................. 18
2.2.4- Integrated density of the GFP fluorescence .......................... 18
2.2.5- Acumen - GFP fluorescence signal ......................................... 19
2.2.6- CellTiter-Glo assay ................................................................... 19
2.3- Morphology of spheres ........................................................................... 20
2.3.1- TEM and EM .............................................................................. 20
2.3.2- H&E and E-cadherin staining ................................................. 20
2.4- Western blotting ...................................................................................... 20
2.4.1- Protein extraction ...................................................................... 20
2.4.2- Blotting ....................................................................................... 21
2.5- Preliminary drug screen ......................................................................... 22
2.5.1- Determination of hit drugs ...................................................... 22
2.6- Drug assays .............................................................................................. 23
2.6.1- Dose curve and IC50 .................................................................. 23
2.7- MEK inhibition resistance ...................................................................... 23
2.8- KRAS knockdown spheres ..................................................................... 23
2.9- Data analysis ............................................................................................ 25
3 Results and Discussion ........................................................................................... 26
3.1- Design of a 3D culture method .............................................................. 26
3.1.1- Soft agar cultures ...................................................................... 26
3.1.2- Non-adherent surfaces ............................................................. 27
3.1.2.1- Non-adherent round bottom plates ........................ 27
3.1.2.2- Non-adherent coated plates ..................................... 28
3.1.3- Hanging drops technique ........................................................ 29
3.1.4- Matrix embedding (Extracellular Matrix Proteins) .............. 30
3.2- Viability methods .................................................................................... 32
3.2.1- CellTiter-Blue assays ................................................................ 32
3.2.2- CellTiter-Blue with EDTA treatment ..................................... 33
xii
3.2.3- Tryphan blue staining .............................................................. 34
3.2.4- Integrated density of the GFP fluorescence .......................... 34
3.2.5- Acumen - GFP fluorescence signal ......................................... 35
3.2.6- CellTiter-Glo assay ................................................................... 36
3.3- Outlook – viability of 3D culture ........................................................... 37
3.4- Morphology of the spheres .................................................................... 41
3.4.1- Transmission electron microscopy (TEM) ............................ 41
3.4.2- Electron microscopy (EM) ....................................................... 44
3.4.3- H&E and E-cadherin marker ................................................... 45
3.5- Signalling Pathway .................................................................................. 47
3.6- KRAS sensitivity – 2D vs 3D .................................................................. 48
3.6.1- Preliminary drug screen .......................................................... 48
3.6.2- KRAS target drugs .................................................................... 53
3.6.2.1- MEK and PI3K inhibitors .......................................... 53
3.6.2.2- Other inhibitors .......................................................... 56
3.6.2.3- Structural stability inhibitors .................................... 58
3.6.2.4- KRAS sensitivity to combined targeted therapies. 60
3.7- MEK inhibition resistance ...................................................................... 62
3.8- KRAS knockdown spheres ..................................................................... 63
4 Concluding Remarks ............................................................................................... 65
References ................................................................................................................... 67
Supplementary Information .................................................................................... 73

xiii
xiv
Terminology and Abbreviations
2D - two dimensional
3D - three dimensional
AKT - Protein kinase B
CDK - Cyclin-dependent kinase
CSCs - Cancer stem cells
CTB - CellTiter-Blue
CTG - CellTiter-Glo
DAPI - 4',6-diamidino- 2phenylindole
DMEM - Dulbecco's modified eagle medium
DMSO - Dimethyl sulfoxide
EDTA - Ethylenediamine tetraacetic acid
EGFR - epidermal growth factor receptor
EHS - Engelbreth-Holm-Swarm
EM - Electron microscopy
ERK - extracellular signal regulated kinase
FACS - Fluorescence activated cell sorting
FAK - Focal adhesion kinase
FBS - Fetal bovine serum
FITC - Fluorescein isothiocyanate
GAPs - GTPase activating proteins
GATA2 - Gene encoding for GATA binding
protein 2
GEFs - Guanine nucleotide exchange factors
GFP - Green fluorescent protein
H&E - Hematoxylin and eosin
HRAS - Harvey rat sarcoma viral oncogene
homolog
ICx - x% of inhibitory concentration
IKK - IκB kinase
KRAS - Kirsten rat sarcoma viral oncogene
homolog
LDH-A - Lactate dehydrogenase A
MAPK - Mitogen-activated protein kinase
MEK - Mitogen-activated protein kinase
kinase
mTOR - Mammalian target of rapamicyn
NRAS - Neuroblastoma RAS viral (v-ras)
oncogene homolog
PBS - Phosphate-buffered saline
PI3K - Phosphatidylinositide 3-kinase
PKC - Protein kinase C
PMSF - phenylmethylsulfonyl fluoride
PVDF - Polyvinylidene difluoride
qPCR - quantitative polimerase chain reaction
RAF - effector of RAS
RAS - Family of GTPases
RB - Retinoblastoma protein
Rho - GTPase
SDS-PAGE - Sodium dodecyl sulfate
polyacrylamide gel electrophoresis
SNAIL2 - Tanscriptional repressor
TBST - Tris-Buffered Saline and Tween 20
TCA - Tricarboxylic acid cycle
TEM - Transmission electron microscopy
TGF-β - Transforming growth factor beta
TICs - Tumor initiating cells
1
Chapter 1
Introduction 1.1- Lung cancer
Lung cancer is a leading cause of death being the most frequent malignant
disease worldwide [1].
Only in the Europe, in 2012, around 388.000 people died from this disease
[2]. The restricted early detection along with the low therapeutic improvements
is considered the major cause for the low survival rate, around 15% [3]. Despite
the existence of several efficient drugs approved for the lung cancer treatment,
the recurrence after treatment is very frequent, due to the acquisition of
resistant point mutations and alternative compensatory pathways beyond the
targets of therapy [4], [5].
Thus, the need for the discovery of new targets, allowing the development
of new therapies is urgent. Advances in this area will hopefully bring further
insights to help clinicians curing patients battling with this disease, providing
them a longer lifespan and quality of life.
However, in these days, lung cancer is still a disease with a poor prognosis
for patients. Among lung cancer, we can distinguish three types
morphologically different: The carcinoids that are neoplasms of neuroendocrine
origin [6]; The small cell lung cancer (SCLC), which is less prevalent, is
characterized by the microscopic presence of round small cells with limited
cytoplasm mostly filled with the nucleus [7]; And the non-small cell lung cancer
2
(NSCLC), which is the most common type affecting more than 80% of the
diagnosed patients with lung cancer. This type is generally subdivided into
three main groups comprehending squamous cell carcinoma, adenocarcinoma
and large cell carcinoma [8], [9]. The first, being the most frequent, develops
from the squamous cells that line the airways and it is often found near the
centre of the lung in the bronchus. Adenocarcinoma grows slowly and is arising
from the cells that usually secrete substances like mucus and it is found in the
outer areas of the lungs. Large cell carcinoma can appear in any part of the lung
and tends to grow and spread quickly [10].
Apart from the well known association of lung cancer with smoking, other
risk factors arise from a positive family history of the disease. Genetic
alterations include, in most of the cases, mutations in the p53, Bcl2, Rb, FHIT or
p16INK genes. Moreover, telomerase changes, lost of heterozygosity and
mutations that activate the KRAS oncogene have also been described as risk
factors [1], [10].
1.1.1- RAS oncogene and signalling pathway
The most prevalent drivers of human cancer are the 3 isoforms of RAS
proteins, encoded by KRAS, NRAS and HRAS genes. KRAS activating
mutations were described as being the most frequent in cancers [11]. The
distribution of mutations for this particular oncogene points out the importance
of G12D, the most recurrent mutation [12].
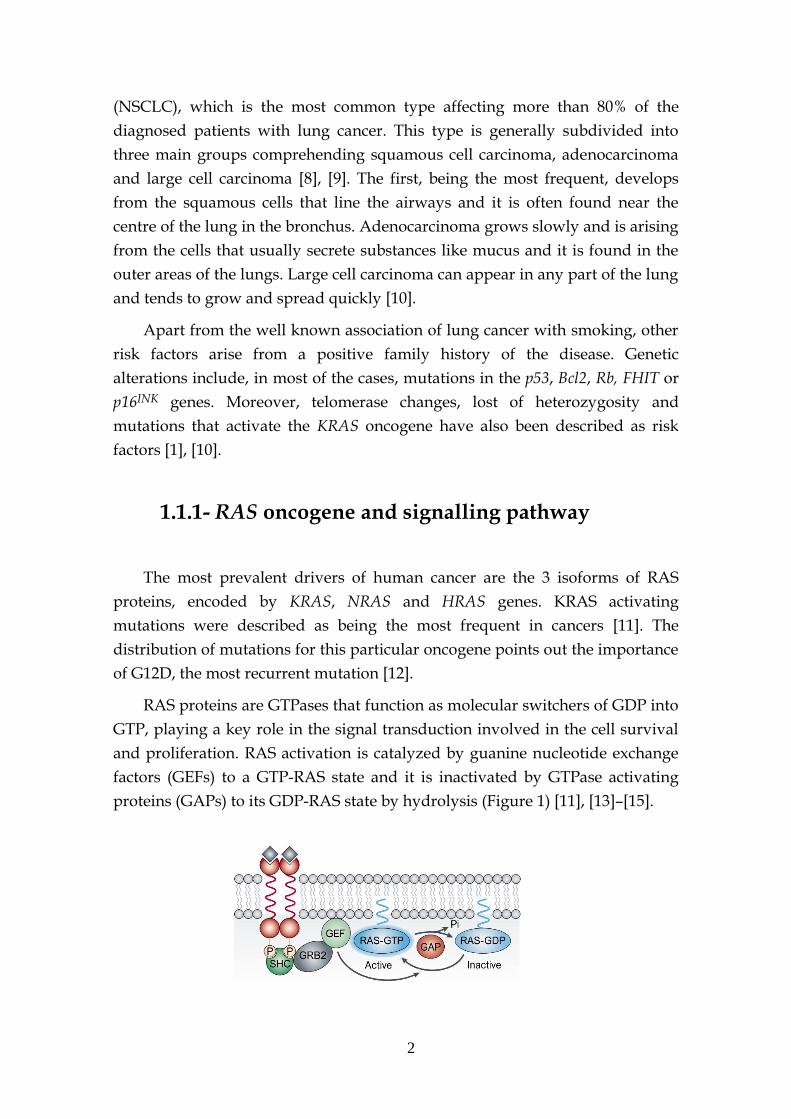
RAS proteins are GTPases that function as molecular switchers of GDP into
GTP, playing a key role in the signal transduction involved in the cell survival
and proliferation. RAS activation is catalyzed by guanine nucleotide exchange
factors (GEFs) to a GTP-RAS state and it is inactivated by GTPase activating
proteins (GAPs) to its GDP-RAS state by hydrolysis (Figure 1) [11], [13]–[15].
3
Figure 1. Ras upstream signalling. RAS is activated by GEFs and inactivated by GAPs. When
RAS is mutated these interactions are broken compromising the normal cell signalling. (Julian
Downward 2002)
KRAS mutations are known to impair GTPase activity blocking the
interaction between KRAS and GAPs leading to its constitutive activation [16].
KRAS proteins are thus important players in the cancer development. Its
mutation leads to the persistent downstream signalling pathway stimulation,
promoting therefore many cancer hallmarks such as uncontrolled cell
proliferation, enhanced survival, metabolic reprogramming, cytoskeletal
reorganization, increased motility, inflammation and microenvironment
remodelling for tumor adaptation [14], [16].
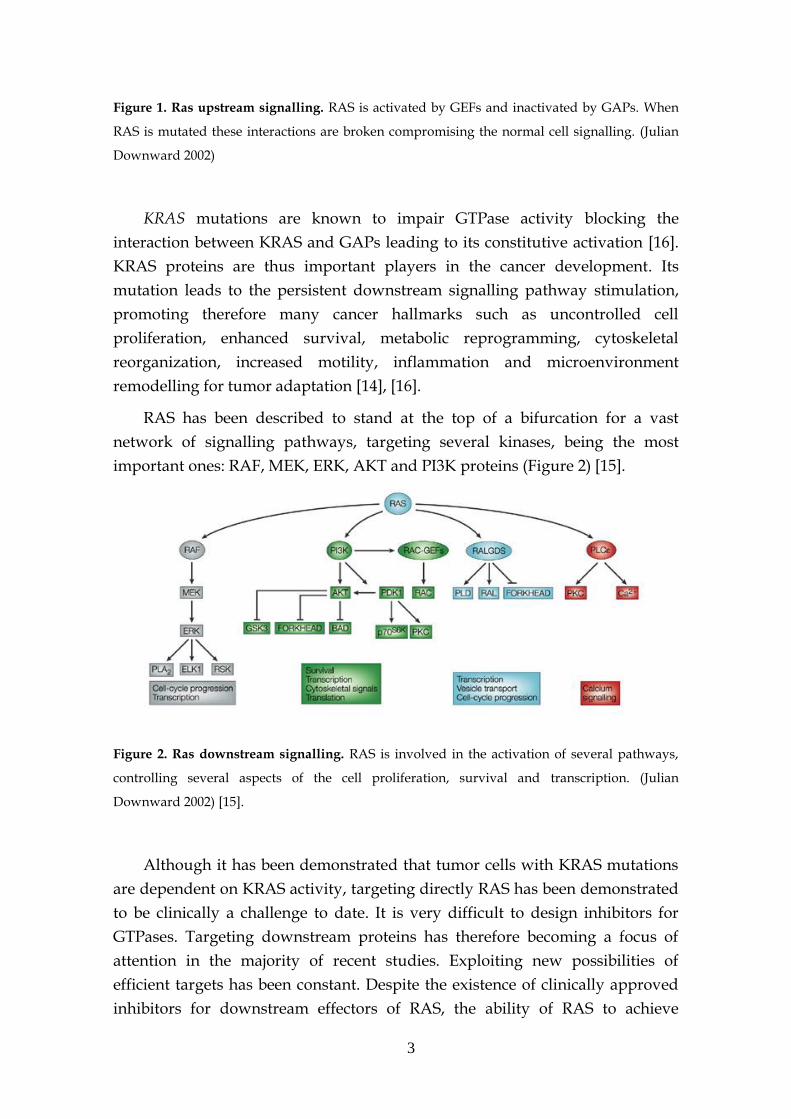
RAS has been described to stand at the top of a bifurcation for a vast
network of signalling pathways, targeting several kinases, being the most
important ones: RAF, MEK, ERK, AKT and PI3K proteins (Figure 2) [15].
Figure 2. Ras downstream signalling. RAS is involved in the activation of several pathways,
controlling several aspects of the cell proliferation, survival and transcription. (Julian
Downward 2002) [15].
Although it has been demonstrated that tumor cells with KRAS mutations
are dependent on KRAS activity, targeting directly RAS has been demonstrated
to be clinically a challenge to date. It is very difficult to design inhibitors for
GTPases. Targeting downstream proteins has therefore becoming a focus of
attention in the majority of recent studies. Exploiting new possibilities of
efficient targets has been constant. Despite the existence of clinically approved
inhibitors for downstream effectors of RAS, the ability of RAS to achieve
4
multiple pathways at different stages has also unveiled the importance of using
combined therapies [12], [16], [17].
MAPK pathway, commonly activated in many cancers, leads to RAS
activation via adaptor proteins that consequently activate the RAF/MEK/ERK
kinase cascade. AKT/PI3K pathway is a parallel pathway that regulates the
same functional transcription factors as ERK pathway. Indeed, there are
multiple points of crosstalk between these two pathways. They have been
described to influence each other at different stages of the signal propagation,
determining together the cell fate in a complex and dynamic range of positive
and negative loops. This crossed network is a very robust system that shows
poor vulnerability to external perturbations [18]–[20].
However, several inhibitory molecules against either MEK or PI3K have
been developed with favorable clinic significance and are now under clinical
trial. Combination of inhibitory drugs for both targets are also in early-phase
clinical trials, with still unclear efficacy and toxicity [21]. Importantly, MEK
inhibitors were shown to be selectively toxic for the KRAS mutant genotype
whereas PI3K inhibitors did not. Moreover tumors with KRAS mutations were
also shown to be selectively dependent on activities that are not directly
regulated by RAS. The identification of those factors and pathways that are
particularly essential only for cells bearing an activated RAS oncogene, have
already been approached with lethal RNA interference screens. The binding
kinase 1 (TBK1), the transforming growth factor β–activated kinase 1 (TAK1),
the transcription factor GATA2, the CDK4, mitotic regulators and proteasome
components appeared as prominent good candidates [21], [22]. Particular
dependencies can also be attributed to SNAIL2 in case of the cells that have
undergone epithelial mesenchymal transition [23], [24], and MEK, that brings
dependencies on RAS mutant cells, along with the insulin-like growth factor
receptor (IGF1-R) tyrosine kinase input signal [21].
1.2- 3D cultures
Most of the knowledge brought into light over the past few years has been
achieved by pre-clinical cancer therapy research in several cancer cell lines.
These cell lines often arise from patient tumors and undergo long term
cultivation under specific circumstances. This drags them into a serum-supplied
adaptive state, environmentally artificial, known to enhance the accumulation
5
of genetic alterations. Comparing to in situ cells, differences at the molecular
level have also been identified, including different expressions in differentiation
markers, adhesion and growth factor receptors. Questions come up about the
reliability of these models regarding its accuracy in representing the tumors of
origin and about its ability to be loyally correlated with clinical predictions [4],
[25].
Furthermore, cancer drug development and testing requires relevant cell-
based models that can simulate very closely the in vivo situation when comes to
the point of detecting rapidly the best active drug candidates from large pools
of prospective effectors. In this sense, three-dimensional (3D) culture models
have been gaining recognition among the scientific community due to its ability
to better mimic the in vivo conditions, keeping the functional phenotype of
tumor cells, and better evaluate therapeutic clinical interventions [26], [27].
3D platforms are valuable tools able to restore morphologic, physiologic,
pathologic and functional environmental features of the tumor biology. They
bring further insight about tumor organization, homeostasis and cellular
differentiation. Moreover, the microenvironment and the surrounding
extracellular matrix have been described to play a notorious role into the tumor
survival and progression. It also has an impact in the phenotype, gene
expression and responsiveness/sensitiveness towards different therapeutic
drugs [28]–[30]. Along with these characteristics, 3D cultures are also known to
present stronger cell-cell interactions and have a nutrients and oxygen delivery
gradient system more similar to in vivo. This has thus been contributing to the
understanding of altered responses comparing to 2D cultures [26], [27].
In this sense, 3D cultures are promising tools that can improve clinical
efficacy predictions, bringing faster results and new anticancer therapeutic
strategies. It may also reduce experimental costs, avoid unnecessary
preliminary trials and replace some animal tests, which is undoubtedly a step
forward for the researchers and pharmaceutical industry [31], [32].
1.2.1- 3D culture systems
Currently there are several 3D in vitro culture methods. Not all of them
work for all the cell lines and some require very specific instruments, being
hardly reproducible. Among others, 3D cultures include shaking-based
approaches, non-adherent round surfaces, microfluidic systems, hanging-drop
techniques, scaffold-based models, cell printing and matrix embedding. The
6
latter uses extracellular matrix proteins like matrigel, methylcellulose,
fibronectin, laminin and collagen.
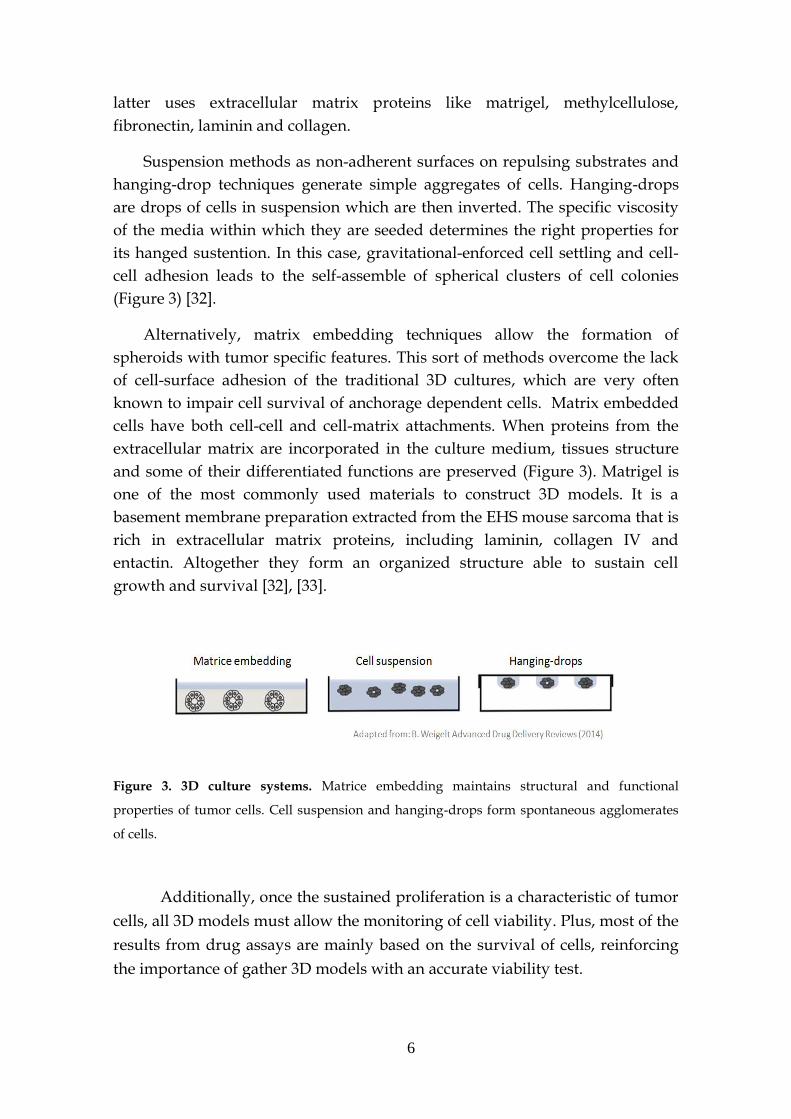
Suspension methods as non-adherent surfaces on repulsing substrates and
hanging-drop techniques generate simple aggregates of cells. Hanging-drops
are drops of cells in suspension which are then inverted. The specific viscosity
of the media within which they are seeded determines the right properties for
its hanged sustention. In this case, gravitational-enforced cell settling and cell-
cell adhesion leads to the self-assemble of spherical clusters of cell colonies
(Figure 3) [32].
Alternatively, matrix embedding techniques allow the formation of
spheroids with tumor specific features. This sort of methods overcome the lack
of cell-surface adhesion of the traditional 3D cultures, which are very often
known to impair cell survival of anchorage dependent cells. Matrix embedded
cells have both cell-cell and cell-matrix attachments. When proteins from the
extracellular matrix are incorporated in the culture medium, tissues structure
and some of their differentiated functions are preserved (Figure 3). Matrigel is
one of the most commonly used materials to construct 3D models. It is a
basement membrane preparation extracted from the EHS mouse sarcoma that is
rich in extracellular matrix proteins, including laminin, collagen IV and
entactin. Altogether they form an organized structure able to sustain cell
growth and survival [32], [33].
Figure 3. 3D culture systems. Matrice embedding maintains structural and functional
properties of tumor cells. Cell suspension and hanging-drops form spontaneous agglomerates
of cells.
Additionally, once the sustained proliferation is a characteristic of tumor
cells, all 3D models must allow the monitoring of cell viability. Plus, most of the
results from drug assays are mainly based on the survival of cells, reinforcing
the importance of gather 3D models with an accurate viability test.
7
There exist viability tests based on the metabolic activity of cells, the
presence of ATP or other redox metabolites. Cells' ability to metabolize and
react with certain products are afterwards detected mostly by spectroscopy and
correctly quantified, being the results correlated with the amount of live cells.
Other methods are based on investigating cells' integrity or the presence of
certain molecules or markers well known to trigger apoptosis [34].
1.3- 2D vs 3D differences
Bearing in mind the advantages of 3D culture models, efforts to recreate
this kind of platforms with NSCLC cells appear to be a new priority. Such
efforts will definitely bring more reliable results either on drug screens or in the
understanding of simple signalling pathways.
In this sense, comparing 2D and 3D cultures is essential to understand
whether it can convey major differences that may underestimate 2D culture
experiments.
Specifically, understanding how dependent RAS pathway is from the
culture method and how different the already observed characteristics of
mutant KRAS cell lines are from the culture system, can surely bring new
insights and perhaps, change the way assays should be done in order to get
closer approaches to the in vivo situation.
Comparisons involve then morphologic features, signalling pathway
aspects and examination of the different sensitivities and vulnerabilities
towards drug treatments.
1.3.1- Targeting KRAS effectors
As has already been described before, Julian Downward’s lab has
investigated unique dependencies of RAS mutant cancer cells over the past
years, highlighting a number of vulnerabilities of RAS mutant cells [21], [22].
One term of comparison between 2D and 3D cultures was therefore the use of a
selection of effectors that have already been demonstrated to be essential for the
survival of KRAS mutant cells.
8
The urgent need to test several of these established effective inhibitors on
3D cultures in an attempt to find divergences that would eventually refute
previous results made in 2D cultures was subject of study for NSCLC cell lines.
1.3.1.1- Candidate inhibitors
In order to compare KRAS dependencies in 2D and 3D settings, several
inhibitors were tested. That includes drugs targeting KRAS downstream
effectors or other pathways that have been demonstrated to be important for
the survival of cells harboring KRAS mutations [15].
- MEK inhibitors - Permanent active forms of MEK are implicated in the
development of several human cancers [35]. Targeting the mitogen activated
protein kinase (MAPK) pathway with highly selective inhibitors of MEK has
been proved to inhibit efficiently ERK activation. Therefore blocking
proliferation, survival and motility of in vitro tumor cell lines under certain
circumstances. It has also been proved to be effective on the growth inhibition
of tumors in immunodeficient mice [15], [36].
- PI3K inhibitors - KRAS mutations also lead to growth stimulation
through AKT activation, because of the crosstalk between ERK and PI3K/AKT
activation. Consequently, regulation of each other determines the efficacy of
MEK inhibitors [3], [18]. Breaking down this ERK/PI3K interaction seems then
to be a good target, as was already observed in vivo assays [16], [37].
- Proteasome inhibitors - Along with the previous kinase inhibitors (MEK
and PI3K inhibitors), there is also a clear need to interfere with the largely
studied kinase/protease crosstalk, which can be achieved by proteasome
inhibition. Many kinases are regulated by proteolytic cleavage and in turn,
many other proteases activity can be switched on or off by phosphorylation
[38].
- IKK inhibitors - NF-kB proteins are transcription factors that have been
described as having an important role in inflammatory diseases. Abnormal
9
regulation of these proteins can lead to autoimmune diseases and several types
of cancer. Regulation of NF-kB is carried out in part by IKK. Moreover, IKK-β
activity is required for protection from apoptosis. Efforts to inhibit IKK have
then been matter of interest. IKK inhibition has also been proven to be effective
in reducing lung cancer cell proliferation in vitro and blocking tumor growth in
vivo especially for patients with KRAS mutation [17], [39].
- PKC inhibitors - Protein kinase C family regulates a diverse set of cell
processes such as cell survival, proliferation, migration and apoptosis, being
ultimately involved in malignant transformation when cooperating with RAS.
Different isozymes are responsible for the activation of AKT and ERK,
increasing anchorage-independent growth, metastasis and tumorigenicity. Its
inhibition was then a target for the NSCLC cells 3D models [40], [41].
- CDK inhibitors - Cyclin-dependent kinases are important cell-cycle
regulators. CDK4/CDK6 are activated by cyclin D1, which in turn is regulated
by many signalling intermediates including RAS-MEK-ERK and PI3K-AKT
pathways. Increased activation of cyclin D1-CDK4/CDK6 leads to the
phosphorylation of RB (retinoblastoma protein), which induces the
transcription of E2F-responsive genes increasing proliferation. Therefore,
abrogation of CDKs activity is thought to be an effective therapeutic approach
[42].
- mTOR inhibitors - mTOR is activated by PI3K, an effector of RAS
pathway, which in turn is able to activate AKT and consequently the
downstream pathway contributing to proliferation and cell survival. Its
inhibition in vitro and in vivo pre-clinical models has been shown to inhibit
proliferation [43].
- TGF-β inhibitors - In cancer cells, the MAPK upstream TGF-β regulator
has been seen to be activated simultaneously with RAS-MAPK, acting
synergistically in tumorigenesis [44], [45].
- LDH-A inhibitors - Chemical compounds such as lactate dehydrogenase
A (LDH-A) inhibitors, were seen to decrease tumorigenesis in NSCLC driven
10
by KRAS or EGFR oncogenes. Researchers have also seen that abrogation of
LDH-A in tumors that rely on hypoxic niches reduces the Warburg effect in
NSCLC in vivo and ex vivo. However reactivation of the TCA cycle happens in
vitro reinforcing the microenvironment importance in the tumor metabolic
reprogramming and consequent cells survival [5].
- c-Met inhibitors - Literature has recently shown a Met indispensable
dependency for anchorage-independent cell growth on KRAS mutants [46].
- Rho inhibitors - Rho GTPases are a family of RAS oncogenes that
promote signal transduction upon binding to GTP, controlling cell morphology
and actin cytoskeleton. Its inhibition would then attenuate the constitutive
effectors from generating a cellular response. However the spatiotemporal
control of Rho-GTPases might restrict its activity [47]–[49].
- FAK inhibitors - The nonreceptor Focal Adhesion Kinase (FAK) can bind
an activate signalling proteins such as PI3-K, many times activated in KRAS
mutant cancer. Its inhibition has also been identified as a promising anti-
tumorigenic agent [20], [50].
- Latrunculin and Paclitaxel - Other approaches may also be effective when
interfering with the structural organization of the spheres, or hamper its
morphologic stability. In theory this strategy might bring little or no major
harm to monolayer cells, that do not present a well defined structural
multicellular organization, while in 3D cultures it should already been taken in
consideration. In this same way, cytoskeleton interfering drugs such as
Paclitaxel and Latrunculin appear to be worth trying and analyzed between
both, 2D and 3D culture systems.
1.3.2- KRAS knockdown
Despite the efforts, the direct inhibition of KRAS is still not possible.
However advances in selectively knocking down the oncogenic KRAS is known
to be therapeutically effective and to suppress tumor growth in NSCLC.
11
Although, in certain cases targeting KRAS by itself might not be sufficient but
leastwise it sensitizes tumor cells, opening possibilities of combining this
strategy with other target therapies [14], [51].
The use of small interfering RNA (siRNA) in spheroid cultures, in order to
genetically manipulate the expression of an important oncogene like KRAS is
valuable. Cells are very sensitive to its knockdown and effects on cell viability
are already known. A stable model can work as a control for drug assays,
showing specific and unique KRAS dependencies and vulnerabilities.
1.4- Aim of the work
3D culture models are known to better predict therapeutic outcomes due
to its ability to better simulate the in vivo morphologic, physiologic, pathologic
and functional environmental features of the tumor biology. Targeted
anticancer therapies with 3D tools are still barely explored and further insights
into this field would definitely benefit in vivo treatments. Based on that, the aim
of this study is:
- To set up a method that allow the survival and growth of RAS mutant
lung cancer cells in 3D cultures;
- To identify an accurate method to monitor cell viability in 3D cultures,
suitable for large-scale screening;
- To compare the dependencies of RAS mutant cells and drug
vulnerabilities in 2D and 3D cultures.
12
Chapter 2
Materials and Methods
The aim of this work was to develop a three-dimensional culture method
that would allow the survival and growth of KRAS mutant cell lines. The
purpose of this methodology is to guarantee a closer approach to the in vivo
situation of non-small cell lung cancer, providing a more effective tool to test
clinical antitumor drugs.
2.1- 3D culture methods
NSCLC cell lines were previously generated in the lab and were obtained
from KRAS mutant alone and KRAS mutant plus p53 deleted mice lung tumors
and metastasis. All cell lines were initially grown in monolayer at 37ºC in 5%
CO2 with normal media: Dulbecco's Modified Eagle's Medium (DMEM) with
10% (v/v) fetal bovine serum (FBS), 1% (v/v) glutamine and 1% (v/v)
penicillin-streptomycin antibiotic.
2.1.1- Soft agar
6 well plates were initially coated with equal volumes of 1.2% (w/v)
agarose at 42ºC in distilled water and 2x normal media to give 0.6% (w/v)
agarose in 1x media.
13
Cells were previously washed in Phosphate-buffered saline (PBS) and
trypsinized with 1x trypsin solution. After its collection with normal media and
centrifugation at 1200rpm for 4min, the pellet was re-suspended in normal
media and filtered through a standard FACS filter (70µm pore size) to
guarantee that cells would be plate as single cells.
Cells were counted and 40000 cells were then plated in triplicate with 0.3%
(w/v) agarose in 1x media at 42ºC over the previous base layer.
After set down, normal media was dropped onto surface and repeated
every 3 days during 3weeks. Cells were kept on 37ºC in 5% CO2.
2.1.1.1- Giemsa staining
After 3 weeks on culture, colonies from soft agar cultures have been stained
with Giemsa, a modified solution Fluka 48900: 1 part Giemsa + 5 parts
glycerol:methanol (5:24 parts).
Media was removed from agarose surface and 1mL of Giemsa was added
and kept 20min under gentle agitation. Afterwards, several washes were
carried out with water under gentle agitation, including one wash overnight.
2.1.2- Non-adherent round bottom plates
Trypsinized cells were centrifuged, re-suspended and filtered to avoid
agglomerates.
Triplicates of 5000 cells were then platted, in Corning® 96 Well Clear
Round Bottom Ultra Low Attachment Microplates, either with normal media or
with media without FBS, followed by incubation at 37ºC in 5% CO2. Cells were
kept in culture for 7 days with regular feeding.
2.1.3- Non-adherent coated plates
Flat bottom Corning® 96 Well plates were coated before the seeding of 5000
cells per well.
14
2.1.3.1- Agar coating
Plates were coated with the same base layer used on soft agar protocol. 50µl
of 0.6% (w/v) agarose (at 42ºC) in 1x normal media was added to each well and
set down.
2.1.3.2- Polyhema coating
Poly(2-hydroxyethyl methacrylate) was dissolved with ethanol in a hot
water bath with stirring to a final concentration of 0.12g/ml (10x). The solution
was filtered to remove impurities in a sterile syringe filter with 0,2µm pore size.
100µl of a 10 times diluted solution was added to each well and evaporation
happened upon incubation of the plate at 65ºC. The process was repeated once
more before loading cells.
2.1.4- Hanging drops
There are available on the market a set of plates that allow to perform
this technique easily, however it was made inverting normal 10cm dishes.
A 1.25% (w/v) methylcellulose stock solution was pre-made in normal
media, corresponding to 5x of the desired final concentration, which is 0.25%
(w/v) methylcellulose. The solution was then diluted to 2x with normal media
and filtered with a 0,44µm pore size syringe filter to remove impurities.
Cells were trypsinized and after centrifugation at 1200rpm for 4min, the
pellet was re-suspended and filtered through a standard FACS tube to avoid
agglomerates. Cells were then counted and a stock cells solution made with the
amount of desire loaded cells per 10µl of normal media. Equal volume of 2x
methylcellulose was afterwards pipetted to the stock cells solution and drops of
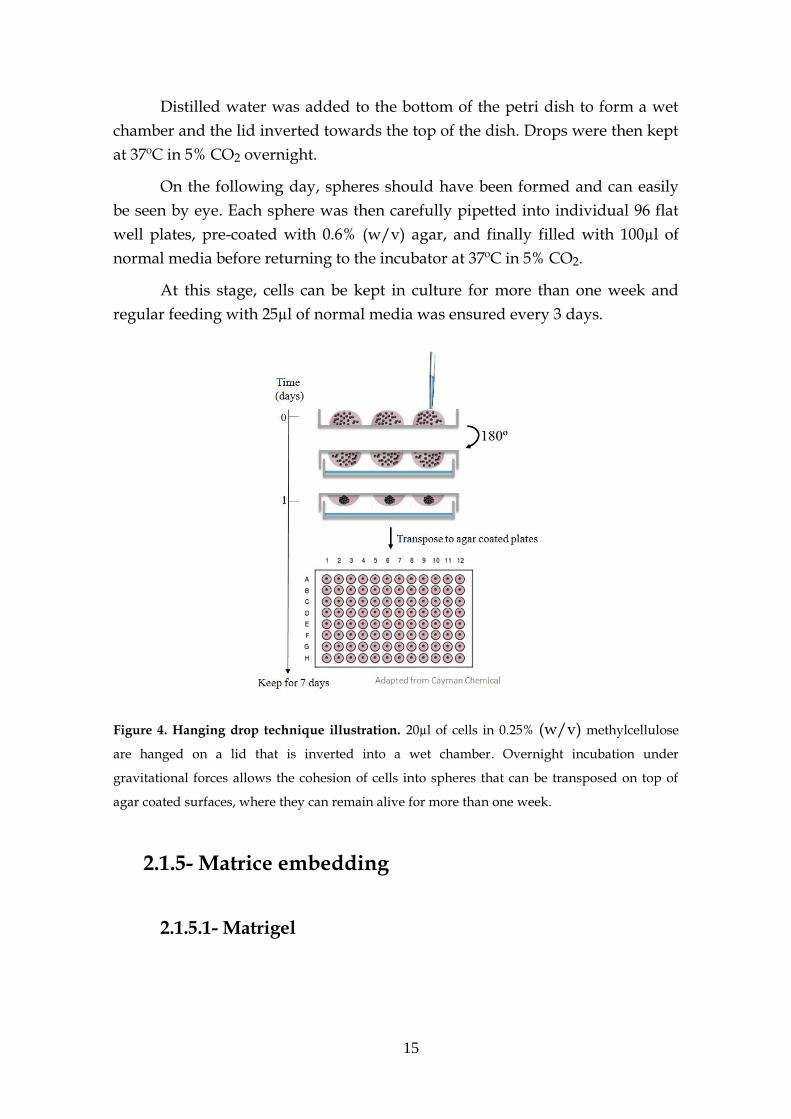
20µl plated in triplicate into the lid of a 10cm petri dish (Figure 4).
Ex.: For 10 drops with 5000 cells each, around 110µl with 55000 cells will make
the stock cells solution. Then 110µl of 2x methylcellulose is added giving a final
solution of 220µl of 0.25% (w/v) methylcellulose with 55000 cells. In this way,
each 20µl drop will have 5000 cells.
15
Distilled water was added to the bottom of the petri dish to form a wet
chamber and the lid inverted towards the top of the dish. Drops were then kept
at 37ºC in 5% CO2 overnight.
On the following day, spheres should have been formed and can easily
be seen by eye. Each sphere was then carefully pipetted into individual 96 flat
well plates, pre-coated with 0.6% (w/v) agar, and finally filled with 100µl of
normal media before returning to the incubator at 37ºC in 5% CO2.
At this stage, cells can be kept in culture for more than one week and
regular feeding with 25µl of normal media was ensured every 3 days.
Figure 4. Hanging drop technique illustration. 20µl of cells in 0.25% (w/v) methylcellulose
are hanged on a lid that is inverted into a wet chamber. Overnight incubation under
gravitational forces allows the cohesion of cells into spheres that can be transposed on top of
agar coated surfaces, where they can remain alive for more than one week.
2.1.5- Matrice embedding
2.1.5.1- Matrigel
16
For this procedure Matrigel® matrix basement membrane with growth
factor reduced was supplied by Corning®. It was perform on ice and all used
materials were properly pre-cooled at 4ºC to avoid matrigel solidification.
Cells in 2D cultures (10cm plates) were washed in PBS and trypsinized.
Cells were collected with normal media (10% (v/v) FBS) to a falcon tube
and centrifuged for 4min at 1200rpm.
The supernatant was discarded and the pellet was re-suspend in normal
media. It was filtered through a standard FACS tube (70µm pore size) to
remove potential clumps.
Cells were then counted and diluted to have 2x the amount of cells to be
plated (solution A). Ex.: For 96 wells with 2500 cells per sphere/well, solution A
have around 265.000 cells in 5.3ml.
On ice a 2x matrigel solution was made in normal media (solution B).
Matrigel was gradually dissolved, pipetting up and down, with little cold
amounts of normal media in order to achieve an homogenous solution.
On ice, solutions A and B were mixed together in a 1:1 proportion.
On ice, the cell-matrigel mixture was poured into disposable reservoir
liners and with a multichannel pipet, 100μL of the content was pipetted into the
wells.
Afterwards, the plate was centrifuged at 1000 rpm at 4°C during 15-20secs.
Plates were then kept at 37°C in 5% CO2.
48h later a compact sphere should have been formed. Spheres can be kept
in culture for more than one week with every three days feedings with 25µl of
normal media.
2.1.5.2- Methylcellulose
This procedure follows the main guides from the matrigel embedding
spheres protocol described above, but it is carried out at room temperature.
A 1.25% (w/v) methylcellulose stock solution (5x) was pre-made in normal
media. Before being used it is diluted with normal media into 2x and properly
filtered with a 0,44µm pore size syringe filter to remove impurities.
17
2.2- Viability methods
2.2.1- CellTiter-Blue assay
This is a light sensitive end-point assay. Direct light sources were avoided
during all the procedure.
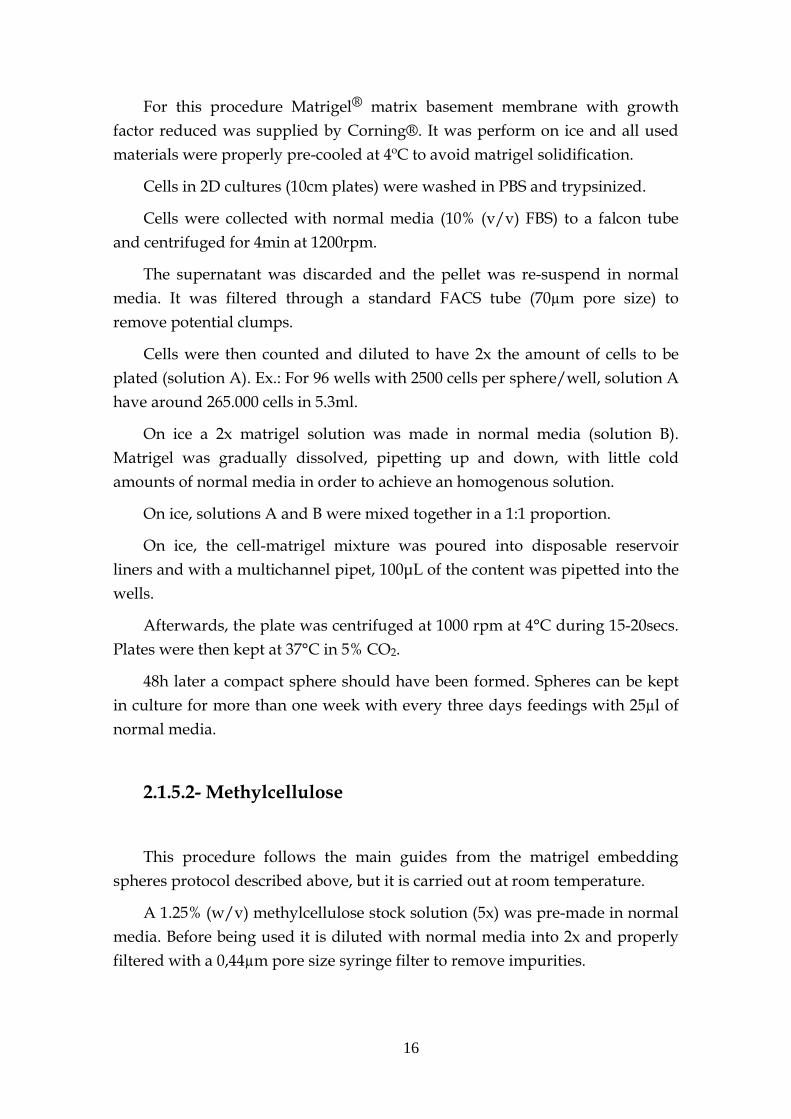
5µl of CellTiter-Blue was added to each well of 3D or 2D cultures including
the respective blanks and incubated at 37ºC for 2h. In this period viable cells
were able to convert by reduction resazurin to the fluorescent resorufin product
(Figure 5). Plates were then read in the PHERASTAR Plus microplate reader, set
up to read the fluorescence emition signal at 590nm.
Figure 5. Redution of resazurin in resorufin. Fluorescence signal should be proportional to the
number of metabolically active cells.
2.2.2- CellTiter-Blue with EDTA treatment
In this end-point viability assay for 3D cultures, 10µl from a 50mM EDTA
solution was added to each well, having as final EDTA concentration 5mM.
Plates were briefly stirred and incubated at 37ºC for 45min to allow spheres
disruption. Therefore, 5µl of CTB was added to the wells followed by 2h
incubation and 590nm fluorescence reading with the PHERASTAR Plus
microplate reader.
18
2.2.3- Tryphan blue staining
The use of this method is wide spread in 2D cultures for routine cell culture
counting. To be used in 3D cultures, spheres were first disrupted with 5mM
EDTA (final concentration) at 37ºC for 45min. Next, 10µl of the sample was
mixed with 10µl of tryphan blue and pipetted into a cell counting slide. It was
then inserted in a cell counting instrument and the concentration of live cells
was automatically displayed.
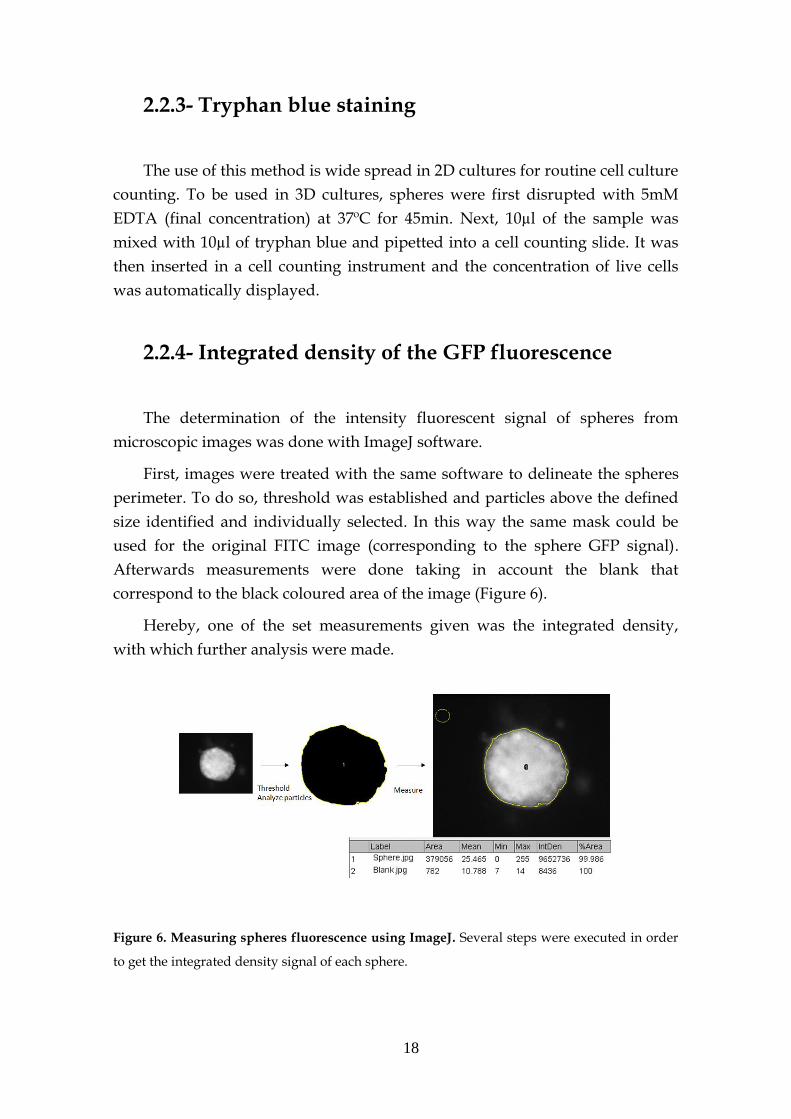
2.2.4- Integrated density of the GFP fluorescence
The determination of the intensity fluorescent signal of spheres from
microscopic images was done with ImageJ software.
First, images were treated with the same software to delineate the spheres
perimeter. To do so, threshold was established and particles above the defined
size identified and individually selected. In this way the same mask could be
used for the original FITC image (corresponding to the sphere GFP signal).
Afterwards measurements were done taking in account the blank that
correspond to the black coloured area of the image (Figure 6).
Hereby, one of the set measurements given was the integrated density,
with which further analysis were made.
Figure 6. Measuring spheres fluorescence using ImageJ. Several steps were executed in order
to get the integrated density signal of each sphere.
19
2.2.5- Acumen - GFP fluorescence signal
The area of GFP positive cells could be automatically determined with
the Acumen Explorer eX3 laser scanning microplate cytometer (TTPLabtech),
allowing the size monitorization of spheres through time.
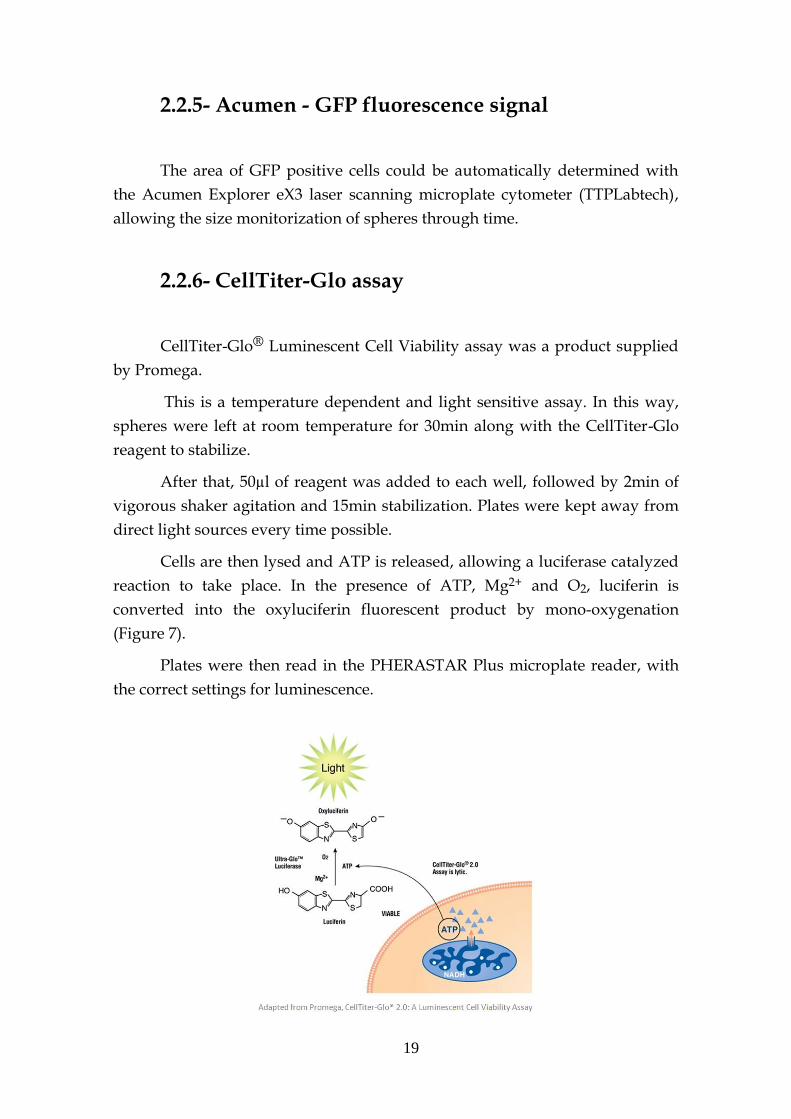
2.2.6- CellTiter-Glo assay
CellTiter-Glo® Luminescent Cell Viability assay was a product supplied
by Promega.
This is a temperature dependent and light sensitive assay. In this way,
spheres were left at room temperature for 30min along with the CellTiter-Glo
reagent to stabilize.
After that, 50µl of reagent was added to each well, followed by 2min of
vigorous shaker agitation and 15min stabilization. Plates were kept away from
direct light sources every time possible.
Cells are then lysed and ATP is released, allowing a luciferase catalyzed
reaction to take place. In the presence of ATP, Mg2+ and O2, luciferin is
converted into the oxyluciferin fluorescent product by mono-oxygenation
(Figure 7).
Plates were then read in the PHERASTAR Plus microplate reader, with
the correct settings for luminescence.

20
Figure 7. Conversion of luciferin into oxyluciferin. This mono-oxygenation reaction is just
carried out in the presence of ATP that is released by lysed live cells. The signal is thereby
proportional to the number of live cells.
2.3- Morphology of spheres
2.3.1- TEM and EM
Images of the spheres by Transmission electron microscopy (TEM) and
Electron microscopy (EM) was a part of the project performed by the Electron
Microscopy facility of the Francis Crick Institute. They provided the equipment
and expertise necessary to get high resolution images.
Spheres were cultured under the desired conditions, 2.5% (v/v) matrigel,
and plates were taken to the Electron Microscopy facility which took care of the
following steps until image acquisition.
2.3.2- H&E and E-cadherin staining
These assays were carried out by the Experimental Histopathology facility
of the Francis Crick Institute.
Spheres were cultured for one week in 2.5% (v/v) matrigel. The following
procedures for Hematoxylin and eosin stain (H&E) and E-cadherin staining
were elaborated by the facility which provided the final images.
2.4- Western blotting
2.4.1- Protein extraction
Cell lysis buffer supplied by Cell Signaling was used for protein
extraction. This 1% triton lysis buffer was prepared being previously diluted to
1x with distilled water. 25mM of NaF and 1mM of PMSF (dissolved in ethanol)
21
as final concentrations were also added, along with 10% (v/v) of protease
inhibitors and 1% (v/v) of the phosphatase inhibitor cocktail.
For protein extraction on 2D cells, 24 wells from the 96 well plates were
used for the same conditions. 2D cells were washed twice with cold PBS,
scraped and solubilized in cell lysis buffer. The samples were kept on ice during
20min for better lysis. Eppendorfs were then centrifuged at 4ºC for 10min at
13000rpm and the pellet discarded. Samples were kept at -20ºC until blotting.
3D protein extraction required 48 spheres with 10000 cells each for each
condition. 3D cells were carefully taken from the plate and transferred to an
eppendorf where they were washed three times with cold PBS to dilute the
matrigel and remove FBS. Cells were then solubilized with cell lysis buffer and
kept on ice for 1h pipetting up and down every 15min to disrupt spheres. They
were then centrifuged at 4ºC for 10min at 13000rpm and the pellet discarded.
Samples were kept at -20ºC until blotting.
2.4.2- Blotting
Protein concentration of the aliquots with cell lysates was quantified with
the bradford assay. Samples were then prepared to load into gels with 1x
Laemly buffer plus 10% (v/v) β-mercaptoethanol. The low amount of extracted
protein from the spheres just allowed to load 2µg of protein.
Aliquots were sonicated for 10sec, boiled 5min and subject of SDS-PAGE.
Proteins were then transferred to PVDF membranes and immunoblotted with
different antibodies.
For chemioluminescent detection, 5% (v/v) BSA in TBST-0.05% (v/v)
(Tris-Buffered Saline and Tween 20) was used to block the membranes against
nonspecific epitopes. Whereas for the LI-COR system, which is an infrared
fluorescent detection method, the especific Odyssey® Blocking Buffer was used.
Primary antibodies were prepared in the corresponding blocking
solutions in a concentration of 1:2000, apart from the p-Akt(T308) and p-
Akt(S473) which concentration was 1:750. Secondary antibodies were prepared
as 1:5000 in blocking buffer. Vinculin is a housekeeping protein used as loading
control. All washes were made with TBST-0.05% (v/v).
Re-probing membranes entailed the use of stripping buffer.
22
Variations in protein expression levels were quantified with ImageJ
software using densiometry values.
2.5- Preliminary drug screen
Drug screen was performed by the High Throughput Screening facility
of the Francis Crick Institute that was provided with the desired 3D cells, in this
case MetA cell line.
Cells were monitored with the acumen, as already described above, and
spheres' area measured before treatments and at 24h, 48h, 72h and 6 days after
treatment with a kinase library drug screen for 384 wells. Single spheres
treatment was applied and no replicates were used. Every drug was used with
a standard concentration of 10µM.
2.5.1- Determination of hit drugs
Comparisons were made between 3D cultures of MetA line and 2D
cultures from other cell line of a previous kinase library drug screen.
First the fold change size of DMSO control spheres were measured
comparing the day 6 of treatment with pre-treated spheres. A median of 424%
fold change was found with a standard deviation of 107%. These values were
taken into account to classify the drug effect on treated spheres. In this sense, 6
days after treatment, drugs that produced a spheres' fold change of 317-531%
were classified as cytostatic drugs, with null effect. Drugs that lead to fold
changes between -100% (minimum value) and 107% were considered cytotoxic.
Finally, fold changes above 531% categorized the drug as having a positive
growth effect.
A drug cytotoxic effect was then search for 3D cultures. Taking in
account the found drugs, a simultaneous cytostatic or growth effect was tracked
for the available screen on 2D cultures. In this case, cells' confluence was
measured and drugs with values above 10 were assumed to have enhanced cell
growth.
Thereby, 10 different inhibitors were selected and subject of further
analysis.
23
2.6- Drug assays
For all drug assays, 2500 cells in 2.5% (v/v) matrigel were used for 3D
cultures and 1000 cells were used for 2D cultures. 50µl of the desired diluted
drugs were added in a 3x concentration upon 48h to each well of the 96 well
plates. Viability assays were performed for all samples upon 72h of treatments.
Drug treatments for protein extraction required shorter incubation periods
and final drug concentration met the correspondent IC30.
2.6.1- Dose curve and IC50
Dose curves were based on the viability of cells, either on 2D or 3D
cultures, upon 72h of drug treatments with gradual dilutions. CellTiter-Blue
was used to measure 2D viability, whereas CellTiter-Glo was the preferred
method for 3D cultures.
The percentage of viability was calculated against the DMSO control and
values plotted on a graph with GraphPad Prism software. A non-linear
regression with an equation for dose inhibitory response with four parameters
was then drawn and the IC50 was determined with the displayed curve values.
2.7- MEK inhibition resistance
3D cultures of LKR and D lines were treated for 10 days with a
correspondent IC70 dose of the MEK inhibitor Trametinib. 50µl of Trametinib
was added new every 3 days.
Trametinib survival cells were trypsinized and transferred to monolayer
into 10cm petri dishes. Afterwards, cells were assayed again for Trametinib
response in 2D and 3D cultures and IC50 determined as described in the
previous subsection.
2.8- KRAS knockdown spheres
24
For all experiments cells were plated in the absence of antibiotics and
usually cells were starved the day before with no serum.
siRNA was performed in 3 different ways:
1- Transfection took place at the same time as cells were plated into 3D
cultures:
In this assay 2500 cells were used in 2.5% (v/v) matrigel.
Oligonucleotides (siRNA KRAS pool, RISC-free and scramble) were used
at 25nM as final concentration and DharmaFECTTM transfection reagent
supplied by Dharmacon TM was used.
To do so, for each well, 2x solutions were made. 1µl of 5µM
oligonucleotides was added to 9µl of DMEM and 0.4µl of DharmaFECT
reagent was added to 9.6µl of DMEM. Both solutions were mixed and
incubated for 20min at room temperature. Then 80µl of antibiotic-free
normal media were added to a final volume of 100µl (solution A).
The preparation of cells in matrigel was also made with 2x
concentrations. Thereby, for each well, 25ul with 2500 cells were mixed
with 25µl of 10% (v/v) matrigel.
Finally, equal volumes of solution A and cells were mixed, plated
and centrifuged (as described in section 2.1.5.1) to give 2500 cells in 2.5%
(v/v) matrigel transfected with 25nM of oligonucleotides.
2- Transfection was made 2 days after platting cells into spheres:
In this case, 3D cells in 2.5% (v/v) matrigel were transfected with
oligonucleotides for a final concentration of 125nM. 5µM siRNA stock
solution and DharmaFECT reagent were used. Spheres were carefully
washed with cold PBS to remove matrigel before transfected with 100µl.
3- Transfection was done in 2D cultures.
For this assay, 15000 cells were plated in 6 well plates for two
days. Low confluence cells (30-50%) were transfected with
OligofectamineTM reagent supplied by InvitrogenTM with 200nM of
oligonucleotides as final concentration.
25
To do so, for each well, 4µl of Oligofectamine reagent was diluted
with 11µl of DMEM and incubated for 10min at room temperature. Then,
40µl of 5µM stock oligonucleotides were diluted with 145µl of DMEM,
mixed and incubated with the previous solution for 20min at room
temperature. Finally 800µl of DMEM was added to the mixture and 1ml
was poured into the cells. After 4h of incubation at 37ºC in 5% CO2,
normal media with 3x FBS was added.
On the following day 2D transfected cells were transferred into 3D
cultures as described in the procedure of section 2.1.5.1.
Lysates were collected after transfection from 2D and 3D cultures
to confirm the efficiency of the procedure by qPCR.
Cells were monitored after 48h for viability with CTB assay.
2.9- Data analysis
Data was in part analysed with Microsoft excel to determinate triplicate
average, standard deviation, to subtract blank, calculate fold changes and
viability percentages as well as to calculate new standard deviations
accordingly to the analysis made.
Worked data was then plotted with GraphPad Prism which allowed the
determination of several parameters.
26
Chapter 3
Results and Discussion 3.1- Design of a 3D culture method
The first aim of this project was to develop a method that will allow the
growth and survival of lung cancer cell lines into 3 dimensional conditions. For
that purpose, seven different established cell lines of non-small cell lung cancer
cells were used. Six of them are established from NSCLC tumors with KRAS
mutant and p53 deleted (KRASG12D/+; Trp53F/F; Rosa26mTmG/+ mouse
model): B, D, F, E, MetA and MetB lines; the latter two coming from a
metastatic site. The seventh cell line is LKR line that has been established from
NSCLC with KRAS mutant but wild-type p53 (KRASG12D/+; Rosa26mTmG/+
mouse model). Additionally, all cell lines express the green fluorescent protein
(GFP) apart from LKR.
3.1.1- Soft agar cultures
At the first place, a simple and fast method was used to check which cells
would have a positive growth under non-anchorage independent conditions.
As described in the materials and methods section, cells were kept in soft
agar plates for three weeks, generating agglomerates in only four cell lines:
LKR, D, E and MetA lines (Figure 8). Sphere formation in these specific cell
lines points for the existence of a bigger population of cancer stem cells (CSCs)
27
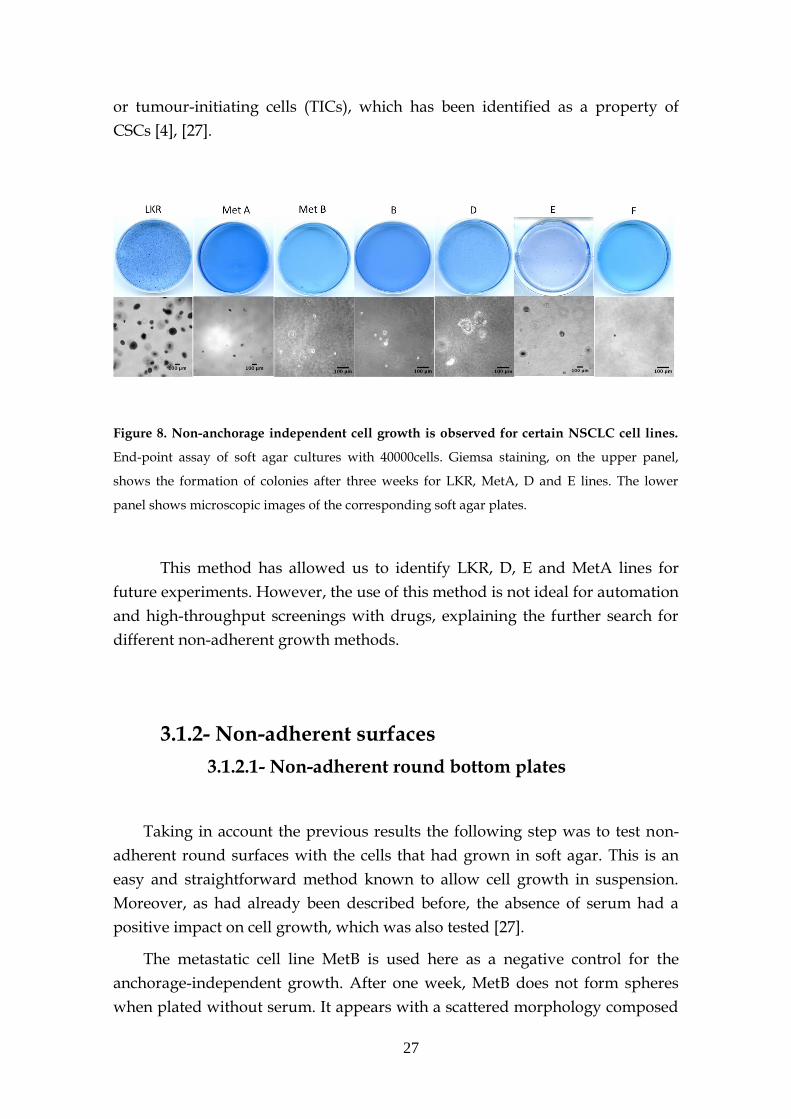
or tumour-initiating cells (TICs), which has been identified as a property of
CSCs [4], [27].
Figure 8. Non-anchorage independent cell growth is observed for certain NSCLC cell lines.
End-point assay of soft agar cultures with 40000cells. Giemsa staining, on the upper panel,
shows the formation of colonies after three weeks for LKR, MetA, D and E lines. The lower
panel shows microscopic images of the corresponding soft agar plates.
This method has allowed us to identify LKR, D, E and MetA lines for
future experiments. However, the use of this method is not ideal for automation
and high-throughput screenings with drugs, explaining the further search for
different non-adherent growth methods.
3.1.2- Non-adherent surfaces
3.1.2.1- Non-adherent round bottom plates
Taking in account the previous results the following step was to test non-
adherent round surfaces with the cells that had grown in soft agar. This is an
easy and straightforward method known to allow cell growth in suspension.
Moreover, as had already been described before, the absence of serum had a
positive impact on cell growth, which was also tested [27].
The metastatic cell line MetB is used here as a negative control for the
anchorage-independent growth. After one week, MetB does not form spheres
when plated without serum. It appears with a scattered morphology composed
28
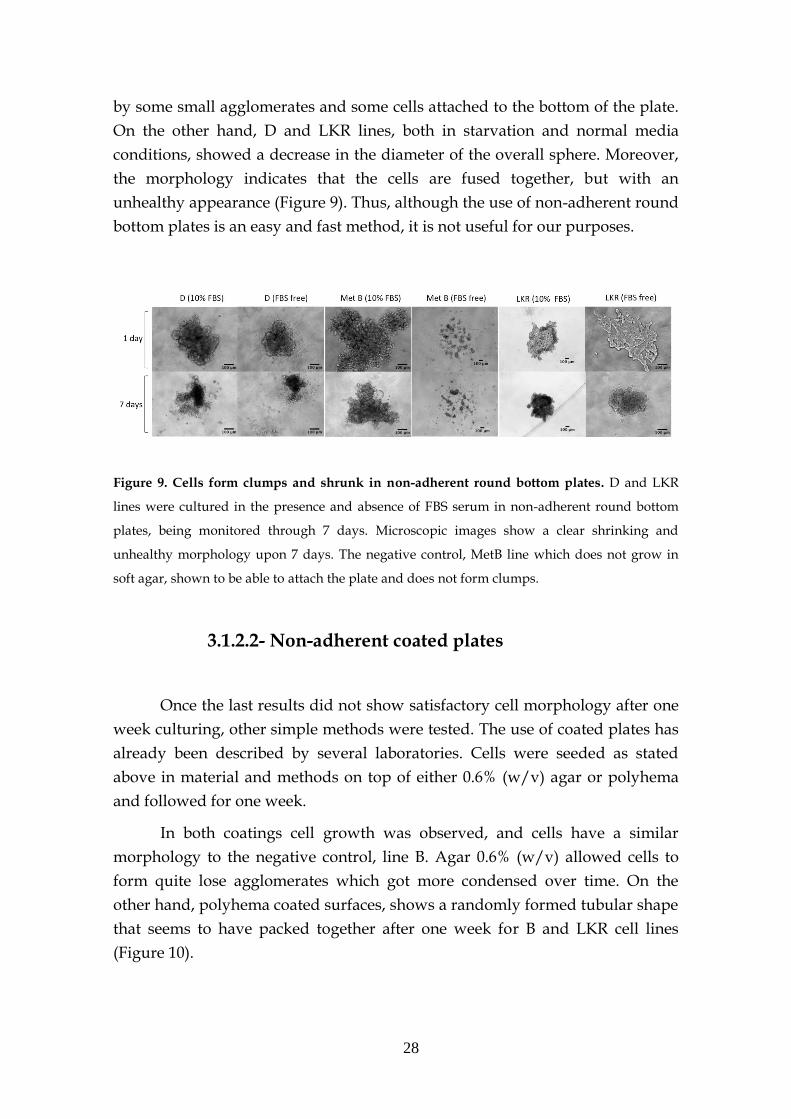
by some small agglomerates and some cells attached to the bottom of the plate.
On the other hand, D and LKR lines, both in starvation and normal media
conditions, showed a decrease in the diameter of the overall sphere. Moreover,
the morphology indicates that the cells are fused together, but with an
unhealthy appearance (Figure 9). Thus, although the use of non-adherent round
bottom plates is an easy and fast method, it is not useful for our purposes.
Figure 9. Cells form clumps and shrunk in non-adherent round bottom plates. D and LKR
lines were cultured in the presence and absence of FBS serum in non-adherent round bottom
plates, being monitored through 7 days. Microscopic images show a clear shrinking and
unhealthy morphology upon 7 days. The negative control, MetB line which does not grow in
soft agar, shown to be able to attach the plate and does not form clumps.
3.1.2.2- Non-adherent coated plates
Once the last results did not show satisfactory cell morphology after one
week culturing, other simple methods were tested. The use of coated plates has
already been described by several laboratories. Cells were seeded as stated
above in material and methods on top of either 0.6% (w/v) agar or polyhema
and followed for one week.
In both coatings cell growth was observed, and cells have a similar
morphology to the negative control, line B. Agar 0.6% (w/v) allowed cells to
form quite lose agglomerates which got more condensed over time. On the
other hand, polyhema coated surfaces, shows a randomly formed tubular shape
that seems to have packed together after one week for B and LKR cell lines
(Figure 10).
29
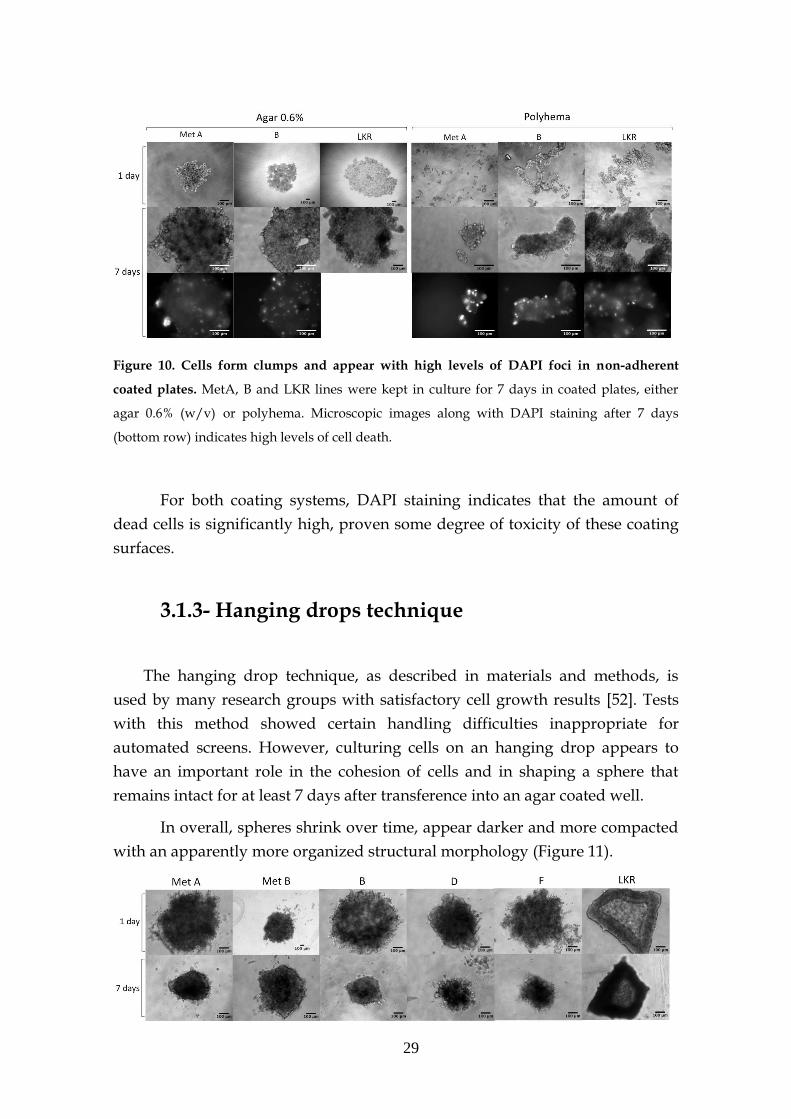
Figure 10. Cells form clumps and appear with high levels of DAPI foci in non-adherent
coated plates. MetA, B and LKR lines were kept in culture for 7 days in coated plates, either
agar 0.6% (w/v) or polyhema. Microscopic images along with DAPI staining after 7 days
(bottom row) indicates high levels of cell death.
For both coating systems, DAPI staining indicates that the amount of
dead cells is significantly high, proven some degree of toxicity of these coating
surfaces.
3.1.3- Hanging drops technique
The hanging drop technique, as described in materials and methods, is
used by many research groups with satisfactory cell growth results [52]. Tests
with this method showed certain handling difficulties inappropriate for
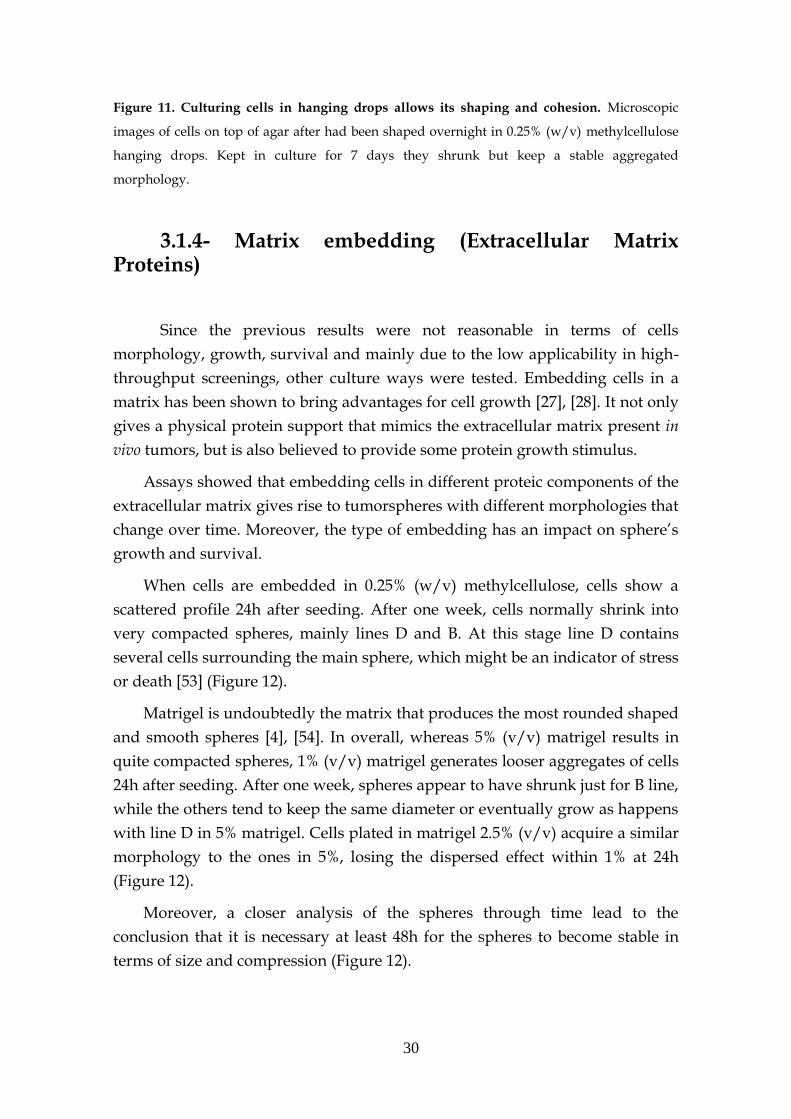
automated screens. However, culturing cells on an hanging drop appears to
have an important role in the cohesion of cells and in shaping a sphere that
remains intact for at least 7 days after transference into an agar coated well.
In overall, spheres shrink over time, appear darker and more compacted
with an apparently more organized structural morphology (Figure 11).
30
Figure 11. Culturing cells in hanging drops allows its shaping and cohesion. Microscopic
images of cells on top of agar after had been shaped overnight in 0.25% (w/v) methylcellulose
hanging drops. Kept in culture for 7 days they shrunk but keep a stable aggregated
morphology.
3.1.4- Matrix embedding (Extracellular Matrix Proteins)
Since the previous results were not reasonable in terms of cells
morphology, growth, survival and mainly due to the low applicability in high-
throughput screenings, other culture ways were tested. Embedding cells in a
matrix has been shown to bring advantages for cell growth [27], [28]. It not only
gives a physical protein support that mimics the extracellular matrix present in
vivo tumors, but is also believed to provide some protein growth stimulus.
Assays showed that embedding cells in different proteic components of the
extracellular matrix gives rise to tumorspheres with different morphologies that
change over time. Moreover, the type of embedding has an impact on sphere’s
growth and survival.
When cells are embedded in 0.25% (w/v) methylcellulose, cells show a
scattered profile 24h after seeding. After one week, cells normally shrink into
very compacted spheres, mainly lines D and B. At this stage line D contains
several cells surrounding the main sphere, which might be an indicator of stress
or death [53] (Figure 12).
Matrigel is undoubtedly the matrix that produces the most rounded shaped
and smooth spheres [4], [54]. In overall, whereas 5% (v/v) matrigel results in
quite compacted spheres, 1% (v/v) matrigel generates looser aggregates of cells
24h after seeding. After one week, spheres appear to have shrunk just for B line,
while the others tend to keep the same diameter or eventually grow as happens
with line D in 5% matrigel. Cells plated in matrigel 2.5% (v/v) acquire a similar
morphology to the ones in 5%, losing the dispersed effect within 1% at 24h
(Figure 12).
Moreover, a closer analysis of the spheres through time lead to the
conclusion that it is necessary at least 48h for the spheres to become stable in
terms of size and compression (Figure 12).
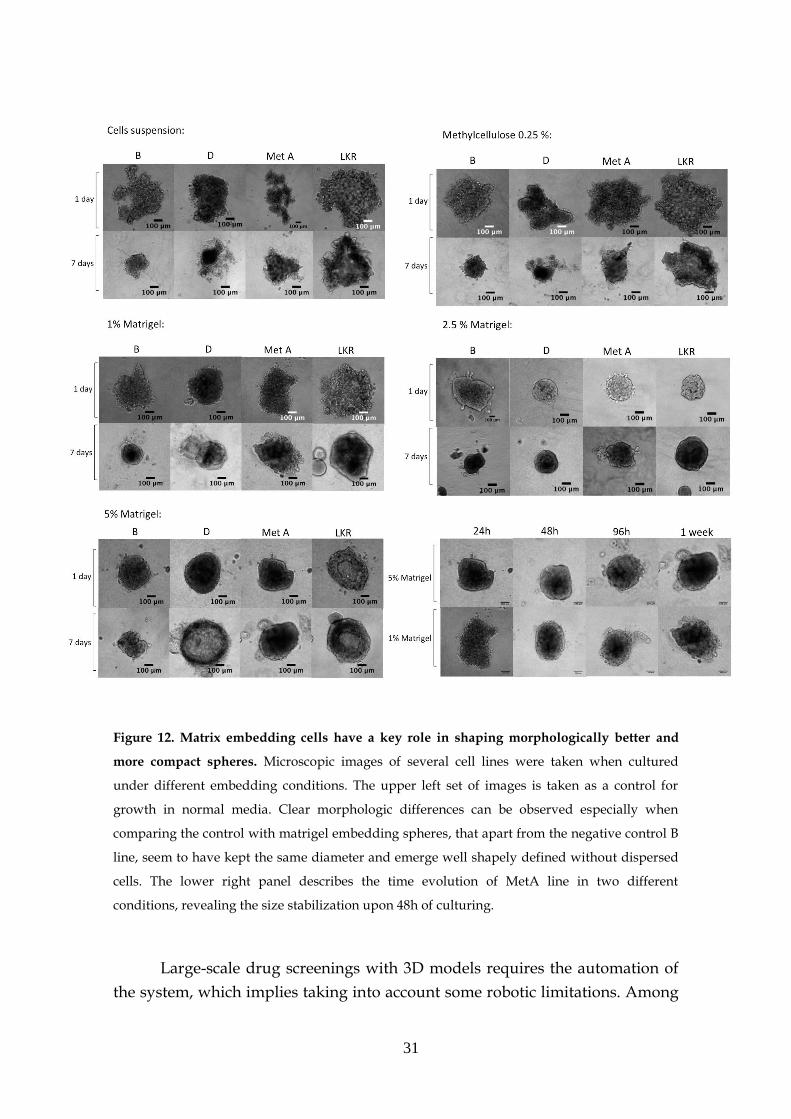
31
Figure 12. Matrix embedding cells have a key role in shaping morphologically better and
more compact spheres. Microscopic images of several cell lines were taken when cultured
under different embedding conditions. The upper left set of images is taken as a control for
growth in normal media. Clear morphologic differences can be observed especially when
comparing the control with matrigel embedding spheres, that apart from the negative control B
line, seem to have kept the same diameter and emerge well shapely defined without dispersed
cells. The lower right panel describes the time evolution of MetA line in two different
conditions, revealing the size stabilization upon 48h of culturing.
Large-scale drug screenings with 3D models requires the automation of
the system, which implies taking into account some robotic limitations. Among
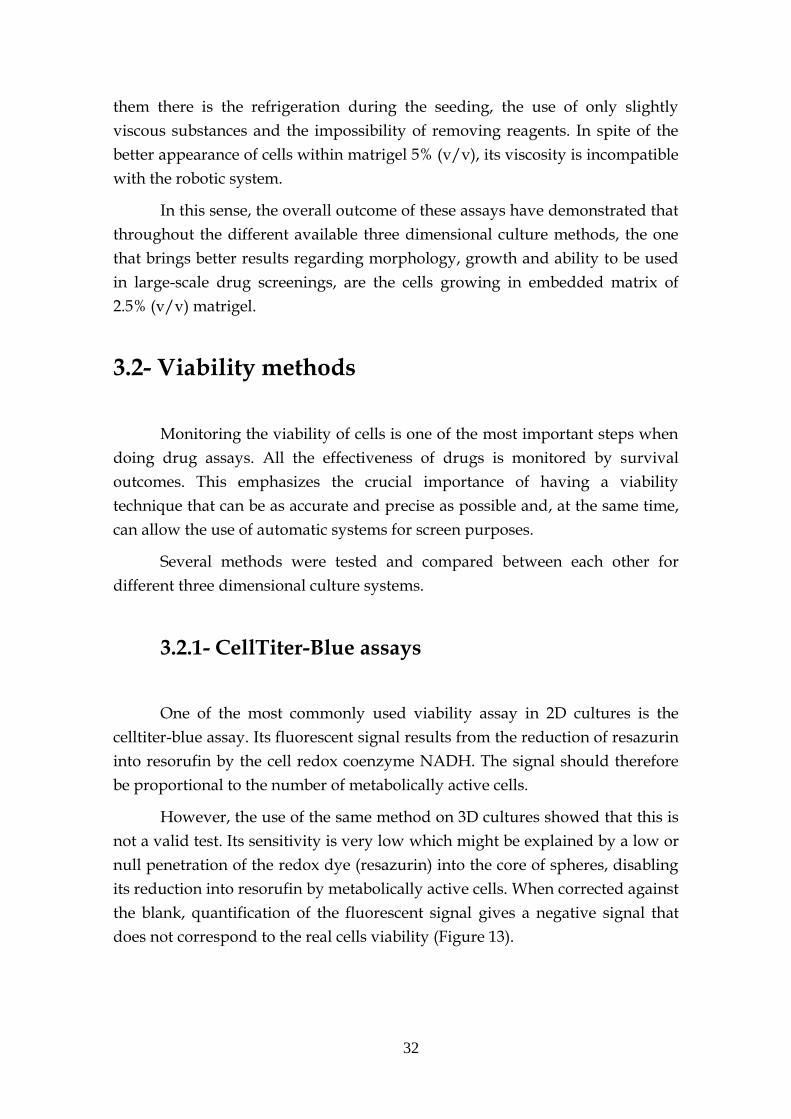
32
them there is the refrigeration during the seeding, the use of only slightly
viscous substances and the impossibility of removing reagents. In spite of the
better appearance of cells within matrigel 5% (v/v), its viscosity is incompatible
with the robotic system.
In this sense, the overall outcome of these assays have demonstrated that
throughout the different available three dimensional culture methods, the one
that brings better results regarding morphology, growth and ability to be used
in large-scale drug screenings, are the cells growing in embedded matrix of
2.5% (v/v) matrigel.
3.2- Viability methods
Monitoring the viability of cells is one of the most important steps when
doing drug assays. All the effectiveness of drugs is monitored by survival
outcomes. This emphasizes the crucial importance of having a viability
technique that can be as accurate and precise as possible and, at the same time,
can allow the use of automatic systems for screen purposes.
Several methods were tested and compared between each other for
different three dimensional culture systems.
3.2.1- CellTiter-Blue assays
One of the most commonly used viability assay in 2D cultures is the
celltiter-blue assay. Its fluorescent signal results from the reduction of resazurin
into resorufin by the cell redox coenzyme NADH. The signal should therefore
be proportional to the number of metabolically active cells.
However, the use of the same method on 3D cultures showed that this is
not a valid test. Its sensitivity is very low which might be explained by a low or
null penetration of the redox dye (resazurin) into the core of spheres, disabling
its reduction into resorufin by metabolically active cells. When corrected against
the blank, quantification of the fluorescent signal gives a negative signal that
does not correspond to the real cells viability (Figure 13).
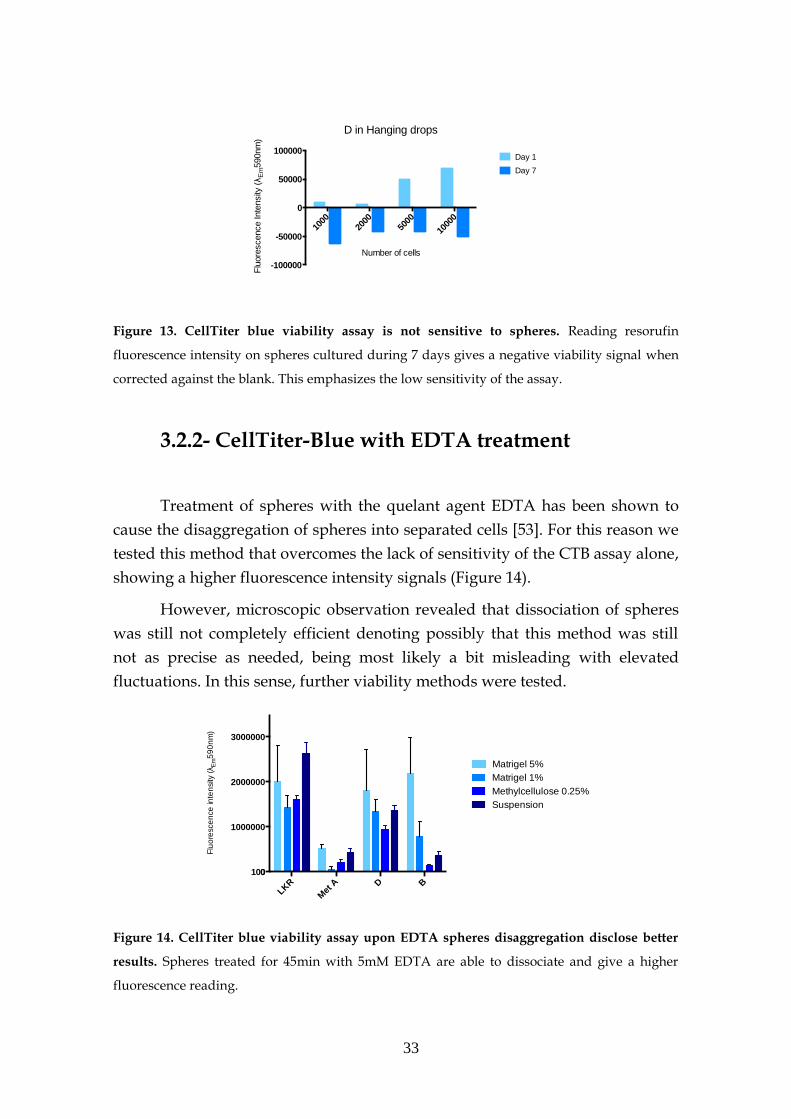
33
Figure 13. CellTiter blue viability assay is not sensitive to spheres. Reading resorufin
fluorescence intensity on spheres cultured during 7 days gives a negative viability signal when
corrected against the blank. This emphasizes the low sensitivity of the assay.
3.2.2- CellTiter-Blue with EDTA treatment
Treatment of spheres with the quelant agent EDTA has been shown to
cause the disaggregation of spheres into separated cells [53]. For this reason we
tested this method that overcomes the lack of sensitivity of the CTB assay alone,
showing a higher fluorescence intensity signals (Figure 14).
However, microscopic observation revealed that dissociation of spheres
was still not completely efficient denoting possibly that this method was still
not as precise as needed, being most likely a bit misleading with elevated
fluctuations. In this sense, further viability methods were tested.
Figure 14. CellTiter blue viability assay upon EDTA spheres disaggregation disclose better
results. Spheres treated for 45min with 5mM EDTA are able to dissociate and give a higher
fluorescence reading.
LKR
Met
A D B
0
1000000
2000000
3000000
100
Flu
ore
sce
nce
inte
nsity
(λ
Em
59
0n
m)
1week spheres viability (CTB + EDTA)
Matrigel 5%
Matrigel 1%
Methylcellulose 0.25%
Suspension
1000
2000
5000
1000
0
-100000
-50000
0
50000
100000
Number of cellsF
luore
scence Inte
nsity
(λ
Em
590nm
)
D in Hanging drops
Day 1
Day 7
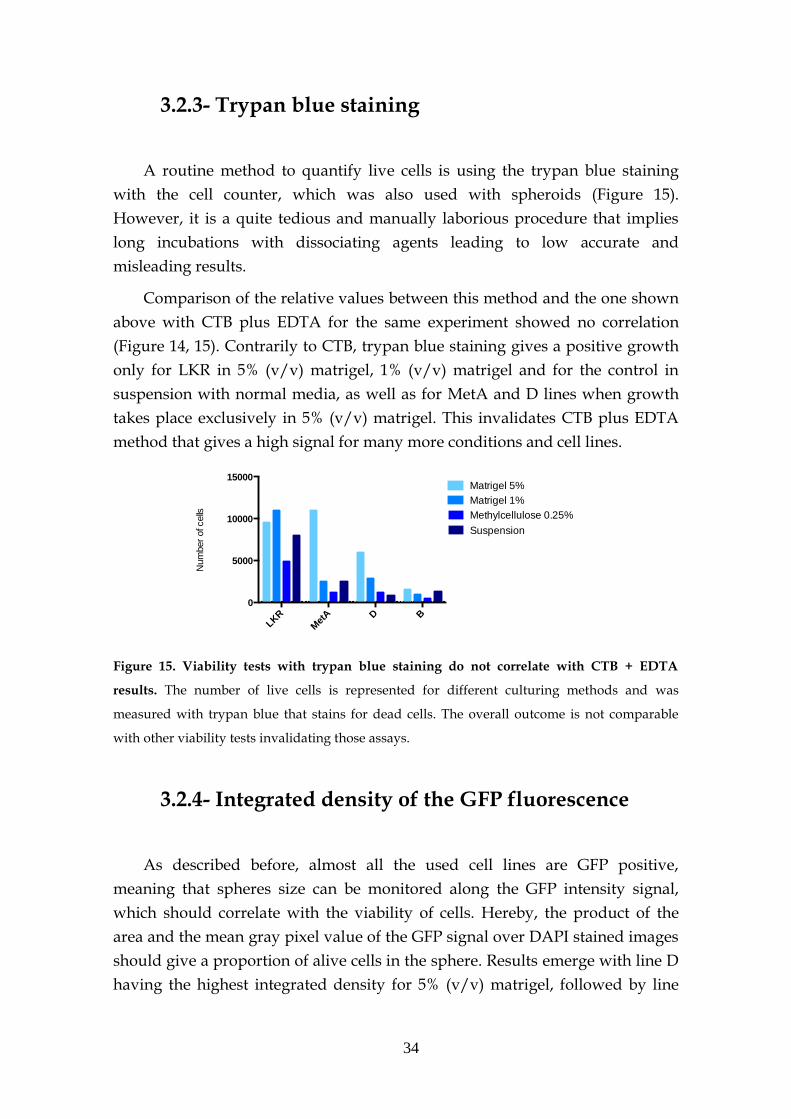
34
3.2.3- Trypan blue staining
A routine method to quantify live cells is using the trypan blue staining
with the cell counter, which was also used with spheroids (Figure 15).
However, it is a quite tedious and manually laborious procedure that implies
long incubations with dissociating agents leading to low accurate and
misleading results.
Comparison of the relative values between this method and the one shown
above with CTB plus EDTA for the same experiment showed no correlation
(Figure 14, 15). Contrarily to CTB, trypan blue staining gives a positive growth
only for LKR in 5% (v/v) matrigel, 1% (v/v) matrigel and for the control in
suspension with normal media, as well as for MetA and D lines when growth
takes place exclusively in 5% (v/v) matrigel. This invalidates CTB plus EDTA
method that gives a high signal for many more conditions and cell lines.
Figure 15. Viability tests with trypan blue staining do not correlate with CTB + EDTA
results. The number of live cells is represented for different culturing methods and was
measured with trypan blue that stains for dead cells. The overall outcome is not comparable
with other viability tests invalidating those assays.
3.2.4- Integrated density of the GFP fluorescence
As described before, almost all the used cell lines are GFP positive,
meaning that spheres size can be monitored along the GFP intensity signal,
which should correlate with the viability of cells. Hereby, the product of the
area and the mean gray pixel value of the GFP signal over DAPI stained images
should give a proportion of alive cells in the sphere. Results emerge with line D
having the highest integrated density for 5% (v/v) matrigel, followed by line
LKR
Met
A D B
0
5000
10000
15000
Num
ber
of cells
Matrigel 5%
Matrigel 1%
Methylcellulose 0.25%
Suspension
Livecellspersphere(Tryphanbluestaining)
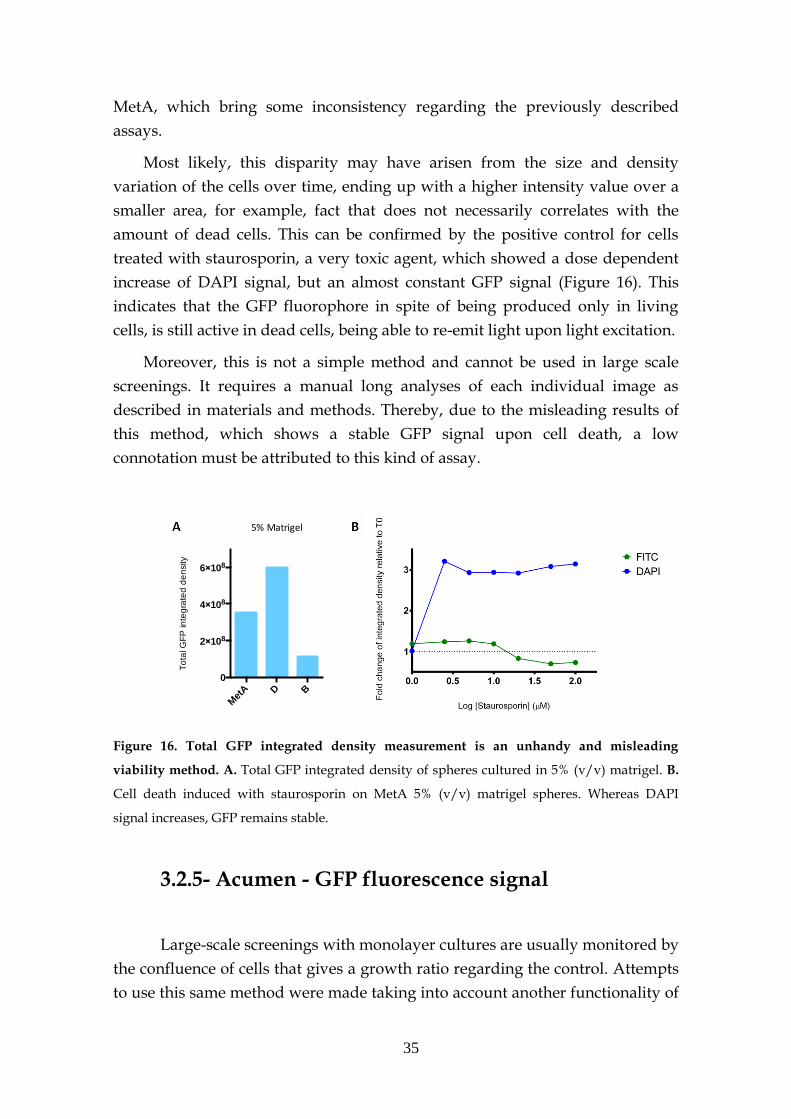
35
MetA, which bring some inconsistency regarding the previously described
assays.
Most likely, this disparity may have arisen from the size and density
variation of the cells over time, ending up with a higher intensity value over a
smaller area, for example, fact that does not necessarily correlates with the
amount of dead cells. This can be confirmed by the positive control for cells
treated with staurosporin, a very toxic agent, which showed a dose dependent
increase of DAPI signal, but an almost constant GFP signal (Figure 16). This
indicates that the GFP fluorophore in spite of being produced only in living
cells, is still active in dead cells, being able to re-emit light upon light excitation.
Moreover, this is not a simple method and cannot be used in large scale
screenings. It requires a manual long analyses of each individual image as
described in materials and methods. Thereby, due to the misleading results of
this method, which shows a stable GFP signal upon cell death, a low
connotation must be attributed to this kind of assay.
Figure 16. Total GFP integrated density measurement is an unhandy and misleading
viability method. A. Total GFP integrated density of spheres cultured in 5% (v/v) matrigel. B.
Cell death induced with staurosporin on MetA 5% (v/v) matrigel spheres. Whereas DAPI
signal increases, GFP remains stable.
3.2.5- Acumen - GFP fluorescence signal
Large-scale screenings with monolayer cultures are usually monitored by
the confluence of cells that gives a growth ratio regarding the control. Attempts
to use this same method were made taking into account another functionality of
Met
A D B
0
2×10⁸
4×10⁸
6×10⁸
To
tal G
FP
inte
gra
ted
de
nsity
5%Matrigel
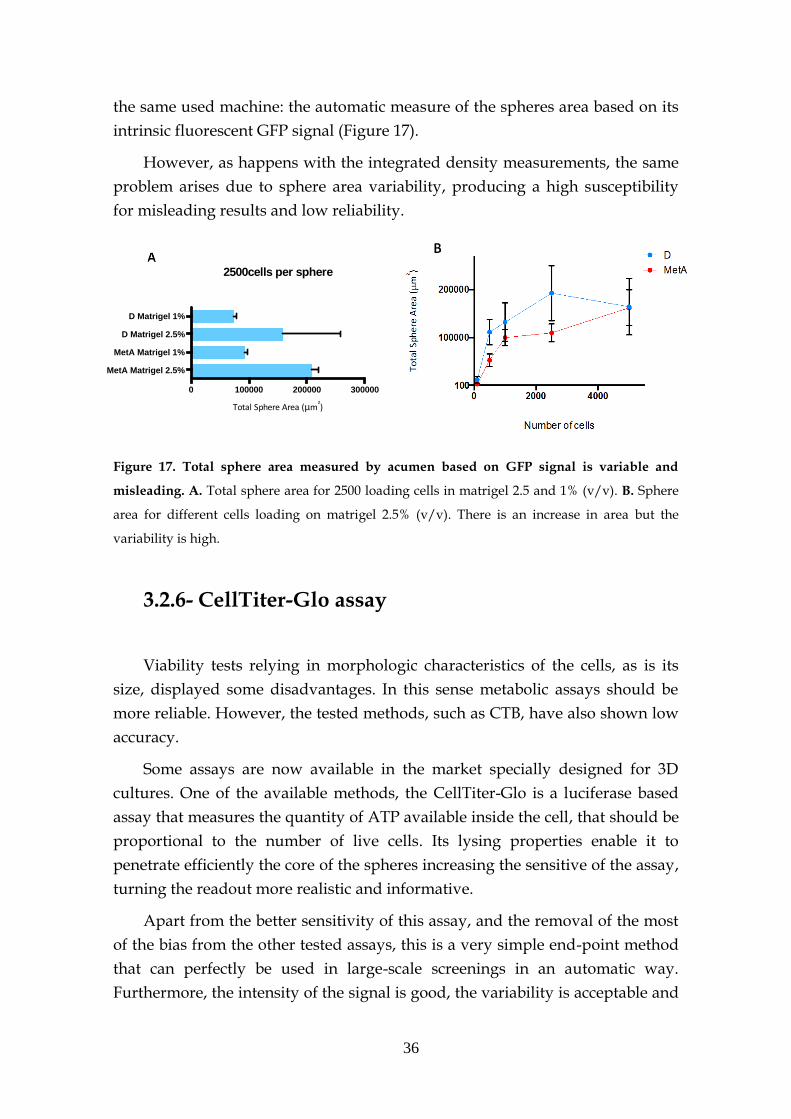
36
the same used machine: the automatic measure of the spheres area based on its
intrinsic fluorescent GFP signal (Figure 17).
However, as happens with the integrated density measurements, the same
problem arises due to sphere area variability, producing a high susceptibility
for misleading results and low reliability.
Figure 17. Total sphere area measured by acumen based on GFP signal is variable and
misleading. A. Total sphere area for 2500 loading cells in matrigel 2.5 and 1% (v/v). B. Sphere
area for different cells loading on matrigel 2.5% (v/v). There is an increase in area but the
variability is high.
3.2.6- CellTiter-Glo assay
Viability tests relying in morphologic characteristics of the cells, as is its
size, displayed some disadvantages. In this sense metabolic assays should be
more reliable. However, the tested methods, such as CTB, have also shown low
accuracy.
Some assays are now available in the market specially designed for 3D
cultures. One of the available methods, the CellTiter-Glo is a luciferase based
assay that measures the quantity of ATP available inside the cell, that should be
proportional to the number of live cells. Its lysing properties enable it to
penetrate efficiently the core of the spheres increasing the sensitive of the assay,
turning the readout more realistic and informative.
Apart from the better sensitivity of this assay, and the removal of the most
of the bias from the other tested assays, this is a very simple end-point method
that can perfectly be used in large-scale screenings in an automatic way.
Furthermore, the intensity of the signal is good, the variability is acceptable and
0 100000 200000 300000
MetA Matrigel 2.5%
MetA Matrigel 1%
D Matrigel 2.5%
D Matrigel 1%
TotalSphereArea(mm²)
2500cells per sphere
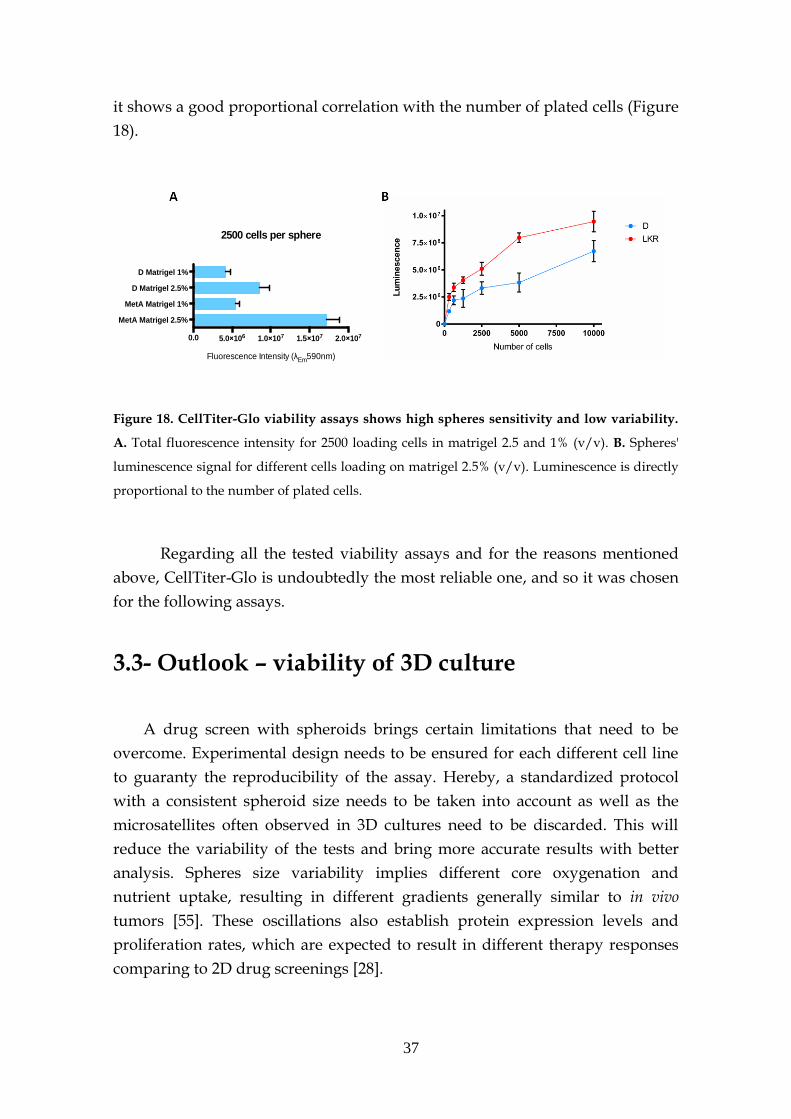
37
it shows a good proportional correlation with the number of plated cells (Figure
18).
Figure 18. CellTiter-Glo viability assays shows high spheres sensitivity and low variability.
A. Total fluorescence intensity for 2500 loading cells in matrigel 2.5 and 1% (v/v). B. Spheres'
luminescence signal for different cells loading on matrigel 2.5% (v/v). Luminescence is directly
proportional to the number of plated cells.
Regarding all the tested viability assays and for the reasons mentioned
above, CellTiter-Glo is undoubtedly the most reliable one, and so it was chosen
for the following assays.
3.3- Outlook – viability of 3D culture
A drug screen with spheroids brings certain limitations that need to be
overcome. Experimental design needs to be ensured for each different cell line
to guaranty the reproducibility of the assay. Hereby, a standardized protocol
with a consistent spheroid size needs to be taken into account as well as the
microsatellites often observed in 3D cultures need to be discarded. This will
reduce the variability of the tests and bring more accurate results with better
analysis. Spheres size variability implies different core oxygenation and
nutrient uptake, resulting in different gradients generally similar to in vivo
tumors [55]. These oscillations also establish protein expression levels and
proliferation rates, which are expected to result in different therapy responses
comparing to 2D drug screenings [28].
0.0 5.0×10⁶ 1.0×10⁷ 1.5×10⁷ 2.0×10⁷
MetA Matrigel 2.5%
MetA Matrigel 1%
D Matrigel 2.5%
D Matrigel 1%
Fluorescence Intensity (λEm590nm)
2500 cells per sphere
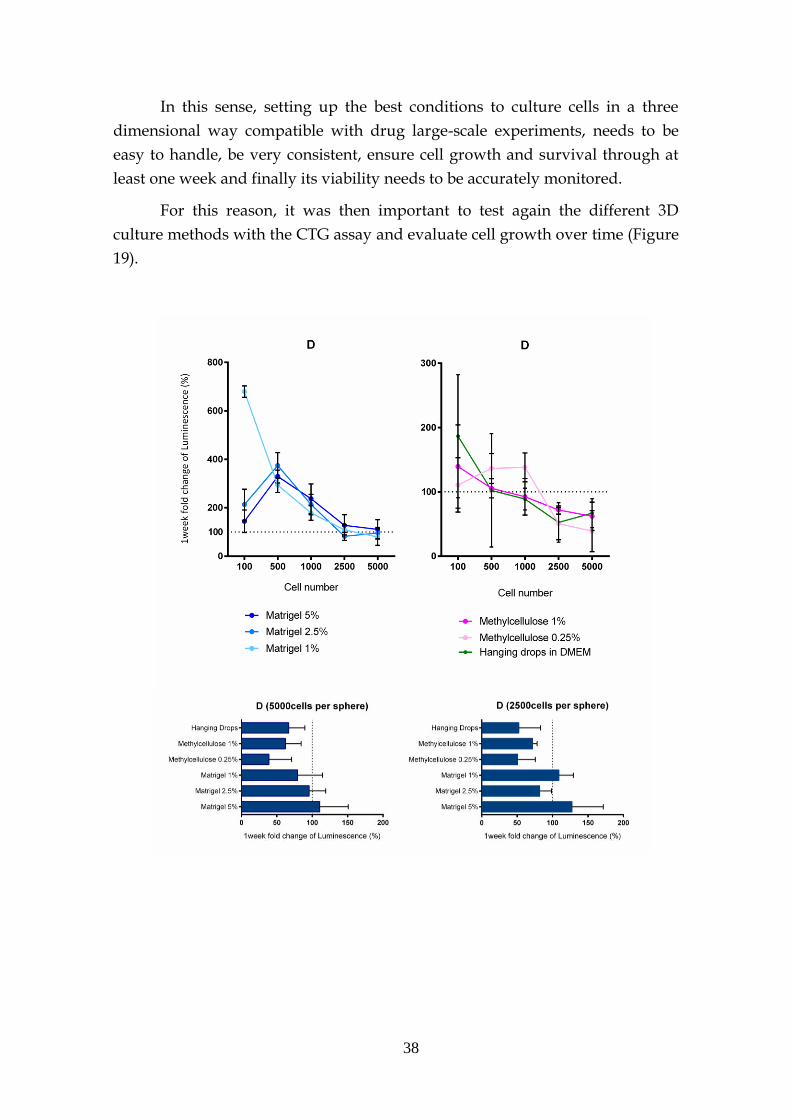
38
In this sense, setting up the best conditions to culture cells in a three
dimensional way compatible with drug large-scale experiments, needs to be
easy to handle, be very consistent, ensure cell growth and survival through at
least one week and finally its viability needs to be accurately monitored.
For this reason, it was then important to test again the different 3D
culture methods with the CTG assay and evaluate cell growth over time (Figure
19).
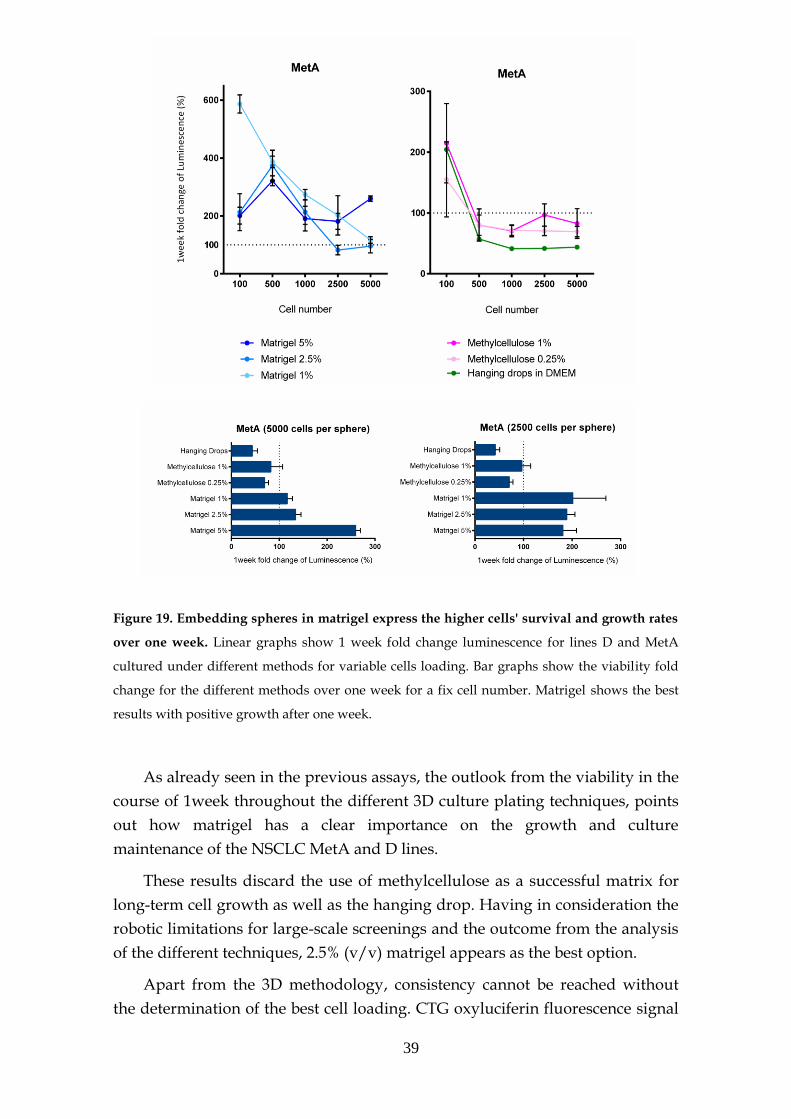
39
Figure 19. Embedding spheres in matrigel express the higher cells' survival and growth rates
over one week. Linear graphs show 1 week fold change luminescence for lines D and MetA
cultured under different methods for variable cells loading. Bar graphs show the viability fold
change for the different methods over one week for a fix cell number. Matrigel shows the best
results with positive growth after one week.
As already seen in the previous assays, the outlook from the viability in the
course of 1week throughout the different 3D culture plating techniques, points
out how matrigel has a clear importance on the growth and culture
maintenance of the NSCLC MetA and D lines.
These results discard the use of methylcellulose as a successful matrix for
long-term cell growth as well as the hanging drop. Having in consideration the
robotic limitations for large-scale screenings and the outcome from the analysis
of the different techniques, 2.5% (v/v) matrigel appears as the best option.
Apart from the 3D methodology, consistency cannot be reached without
the determination of the best cell loading. CTG oxyluciferin fluorescence signal
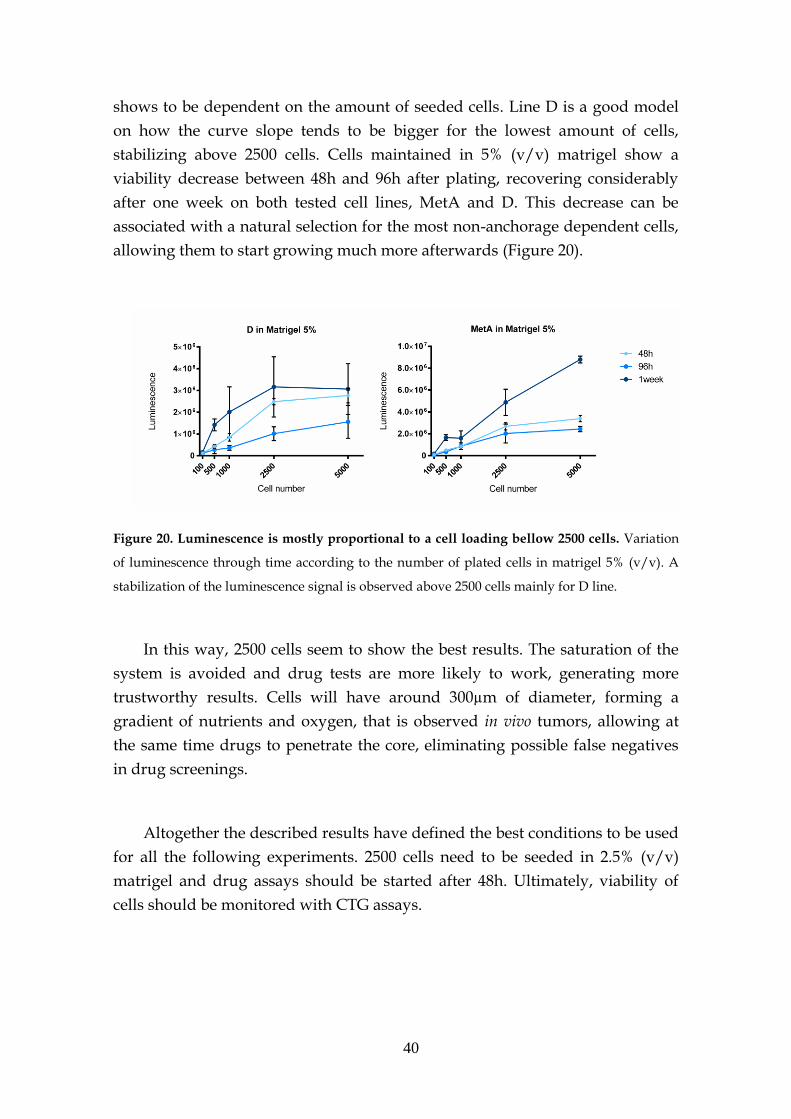
40
shows to be dependent on the amount of seeded cells. Line D is a good model
on how the curve slope tends to be bigger for the lowest amount of cells,
stabilizing above 2500 cells. Cells maintained in 5% (v/v) matrigel show a
viability decrease between 48h and 96h after plating, recovering considerably
after one week on both tested cell lines, MetA and D. This decrease can be
associated with a natural selection for the most non-anchorage dependent cells,
allowing them to start growing much more afterwards (Figure 20).
Figure 20. Luminescence is mostly proportional to a cell loading bellow 2500 cells. Variation
of luminescence through time according to the number of plated cells in matrigel 5% (v/v). A
stabilization of the luminescence signal is observed above 2500 cells mainly for D line.
In this way, 2500 cells seem to show the best results. The saturation of the
system is avoided and drug tests are more likely to work, generating more
trustworthy results. Cells will have around 300µm of diameter, forming a
gradient of nutrients and oxygen, that is observed in vivo tumors, allowing at
the same time drugs to penetrate the core, eliminating possible false negatives
in drug screenings.
Altogether the described results have defined the best conditions to be used
for all the following experiments. 2500 cells need to be seeded in 2.5% (v/v)
matrigel and drug assays should be started after 48h. Ultimately, viability of
cells should be monitored with CTG assays.

41
3.4- Morphology of the spheres
The all purpose of growing cells in a three dimensional way, lays on the
total surface interaction between cells alike the in vivo situation. The
morphology of cells was analyzed by several resources to understand the
general organization of the spheres and to get further insights about the
existence of connections between cells.
3.4.1- Transmission electron microscopy (TEM)
The spatial organization of the spheres was monitored by TEM either after
48h or one week upon seeding. Cells in 3D cultures display a very healthy
morphology, with normal organelles, especially plenty of mitochondria, golgi
apparatus and lysosomes (Figure 21A).
Indeed, in one week, structural modifications and connecting interactions
are evident especially in D line spheres. It shows a curious particular
phenotype: Cells differentiate into other cells with different organelles and
structures, that may be important for nutrient uptake; they specifically form
structures similar to acini characterized by the presence of microvilli cells with
tight junctions only at the top of the cells facing the lumen of the acinus; gaps
are certainly fulfilled with matrix secreted by these microvilli cells, probably
playing a role on their survival; Numerous linkage structures like adhesion
junctions and desmosomes are also present (Figure 21).
This interesting organizational fact is just present in 3D culture, whereas in
2D they have just cells with very short and rare microvilli (Supplementary
Information 1). This denotes the exclusive potential of 3D culture cells to
differentiate and change its structural organization.
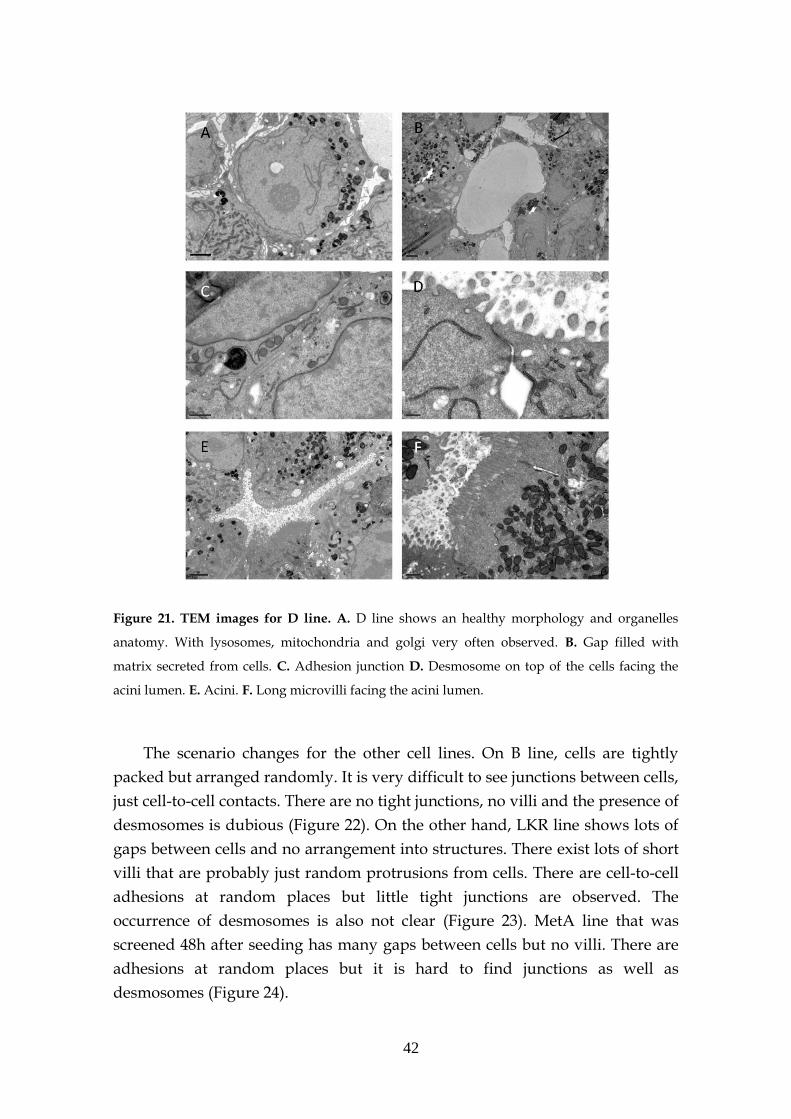
42
Figure 21. TEM images for D line. A. D line shows an healthy morphology and organelles
anatomy. With lysosomes, mitochondria and golgi very often observed. B. Gap filled with
matrix secreted from cells. C. Adhesion junction D. Desmosome on top of the cells facing the
acini lumen. E. Acini. F. Long microvilli facing the acini lumen.
The scenario changes for the other cell lines. On B line, cells are tightly
packed but arranged randomly. It is very difficult to see junctions between cells,
just cell-to-cell contacts. There are no tight junctions, no villi and the presence of
desmosomes is dubious (Figure 22). On the other hand, LKR line shows lots of
gaps between cells and no arrangement into structures. There exist lots of short
villi that are probably just random protrusions from cells. There are cell-to-cell
adhesions at random places but little tight junctions are observed. The
occurrence of desmosomes is also not clear (Figure 23). MetA line that was
screened 48h after seeding has many gaps between cells but no villi. There are
adhesions at random places but it is hard to find junctions as well as
desmosomes (Figure 24).
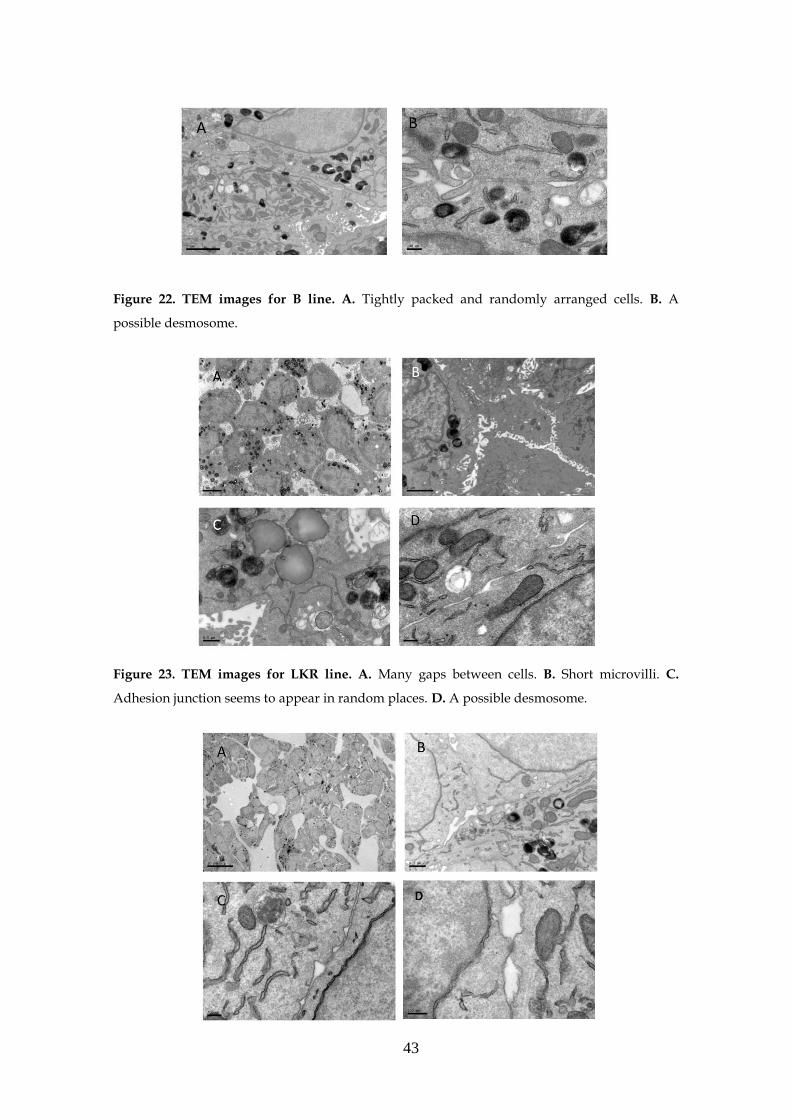
43
Figure 22. TEM images for B line. A. Tightly packed and randomly arranged cells. B. A
possible desmosome.
Figure 23. TEM images for LKR line. A. Many gaps between cells. B. Short microvilli. C.
Adhesion junction seems to appear in random places. D. A possible desmosome.
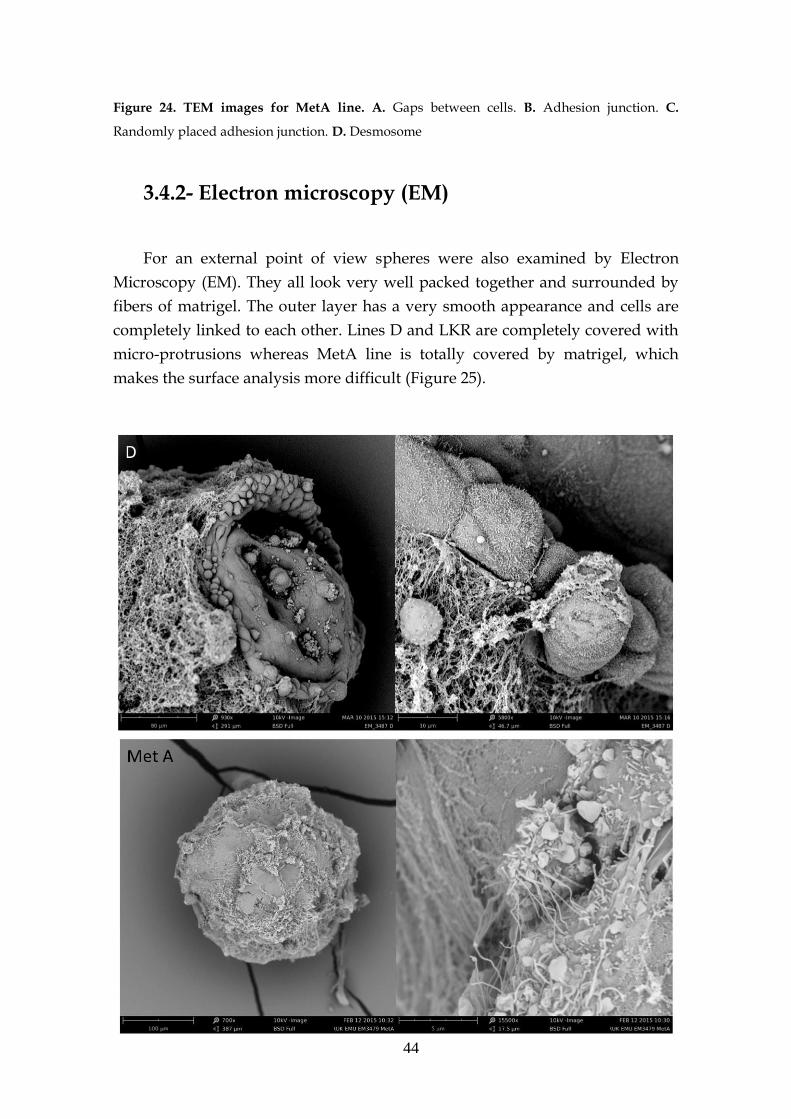
44
Figure 24. TEM images for MetA line. A. Gaps between cells. B. Adhesion junction. C.
Randomly placed adhesion junction. D. Desmosome
3.4.2- Electron microscopy (EM)
For an external point of view spheres were also examined by Electron
Microscopy (EM). They all look very well packed together and surrounded by
fibers of matrigel. The outer layer has a very smooth appearance and cells are
completely linked to each other. Lines D and LKR are completely covered with
micro-protrusions whereas MetA line is totally covered by matrigel, which
makes the surface analysis more difficult (Figure 25).
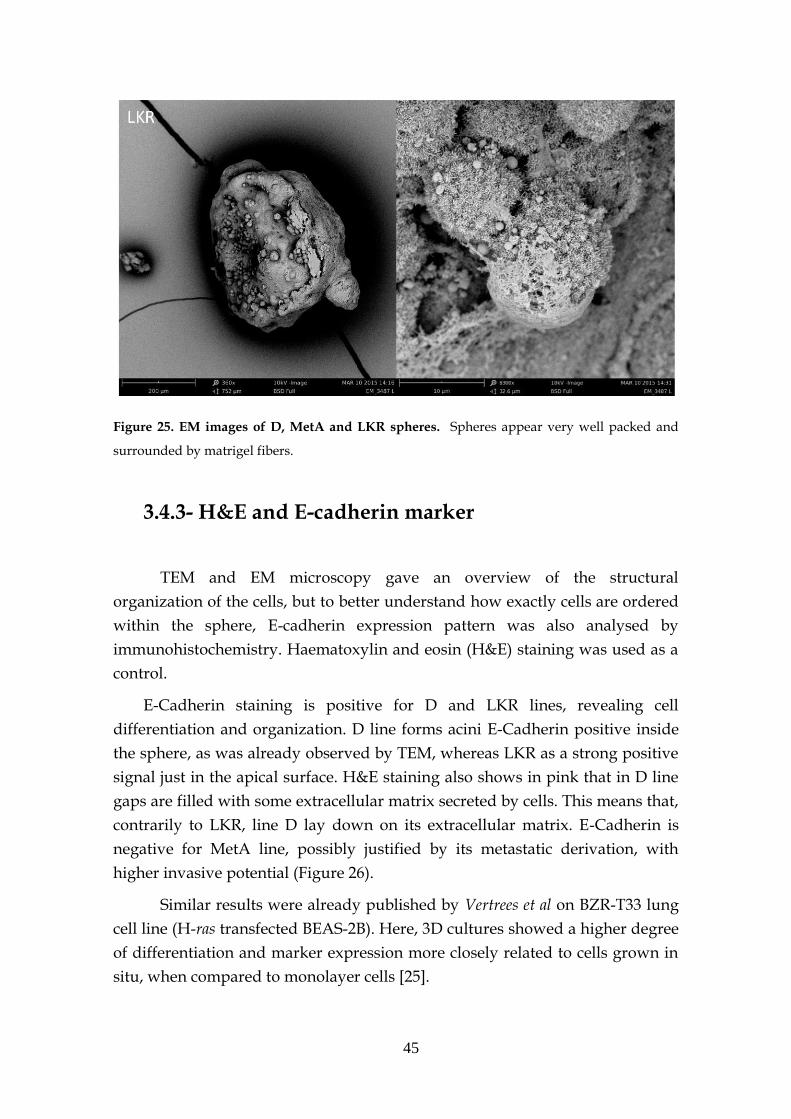
45
Figure 25. EM images of D, MetA and LKR spheres. Spheres appear very well packed and
surrounded by matrigel fibers.
3.4.3- H&E and E-cadherin marker
TEM and EM microscopy gave an overview of the structural
organization of the cells, but to better understand how exactly cells are ordered
within the sphere, E-cadherin expression pattern was also analysed by
immunohistochemistry. Haematoxylin and eosin (H&E) staining was used as a
control.
E-Cadherin staining is positive for D and LKR lines, revealing cell
differentiation and organization. D line forms acini E-Cadherin positive inside
the sphere, as was already observed by TEM, whereas LKR as a strong positive
signal just in the apical surface. H&E staining also shows in pink that in D line
gaps are filled with some extracellular matrix secreted by cells. This means that,
contrarily to LKR, line D lay down on its extracellular matrix. E-Cadherin is
negative for MetA line, possibly justified by its metastatic derivation, with
higher invasive potential (Figure 26).
Similar results were already published by Vertrees et al on BZR-T33 lung
cell line (H-ras transfected BEAS-2B). Here, 3D cultures showed a higher degree
of differentiation and marker expression more closely related to cells grown in
situ, when compared to monolayer cells [25].
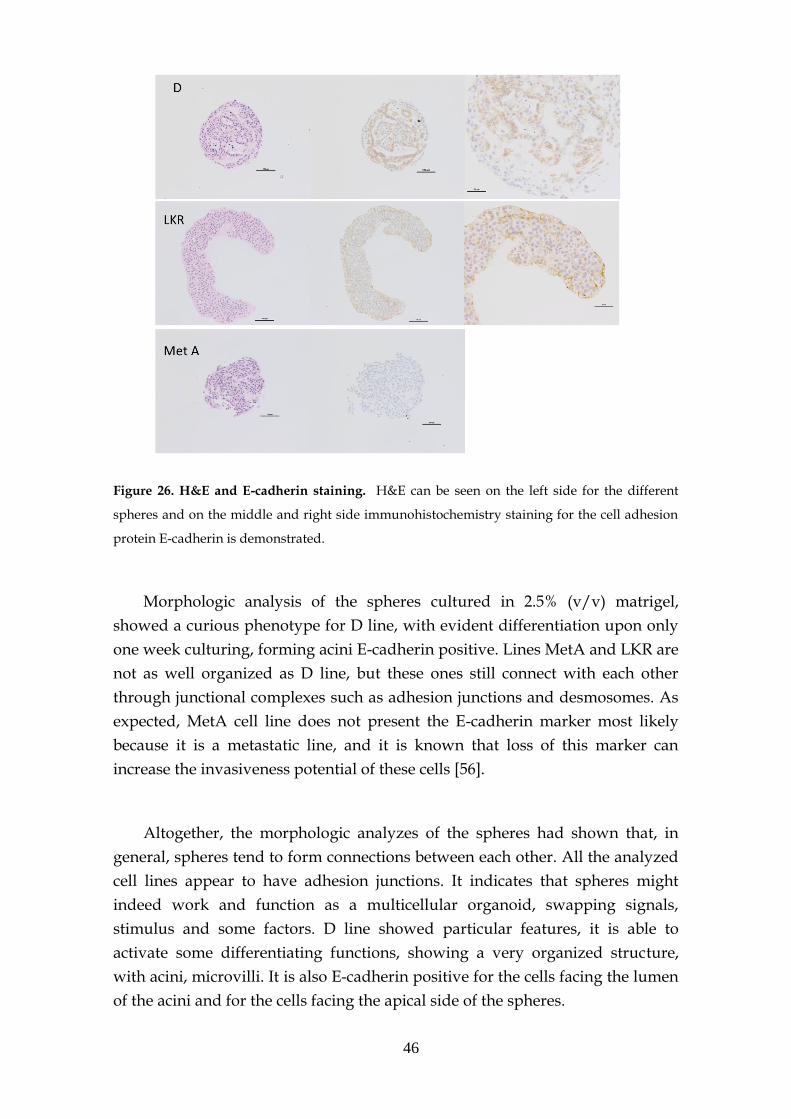
46
Figure 26. H&E and E-cadherin staining. H&E can be seen on the left side for the different
spheres and on the middle and right side immunohistochemistry staining for the cell adhesion
protein E-cadherin is demonstrated.
Morphologic analysis of the spheres cultured in 2.5% (v/v) matrigel,
showed a curious phenotype for D line, with evident differentiation upon only
one week culturing, forming acini E-cadherin positive. Lines MetA and LKR are
not as well organized as D line, but these ones still connect with each other
through junctional complexes such as adhesion junctions and desmosomes. As
expected, MetA cell line does not present the E-cadherin marker most likely
because it is a metastatic line, and it is known that loss of this marker can
increase the invasiveness potential of these cells [56].
Altogether, the morphologic analyzes of the spheres had shown that, in
general, spheres tend to form connections between each other. All the analyzed
cell lines appear to have adhesion junctions. It indicates that spheres might
indeed work and function as a multicellular organoid, swapping signals,
stimulus and some factors. D line showed particular features, it is able to
activate some differentiating functions, showing a very organized structure,
with acini, microvilli. It is also E-cadherin positive for the cells facing the lumen
of the acini and for the cells facing the apical side of the spheres.
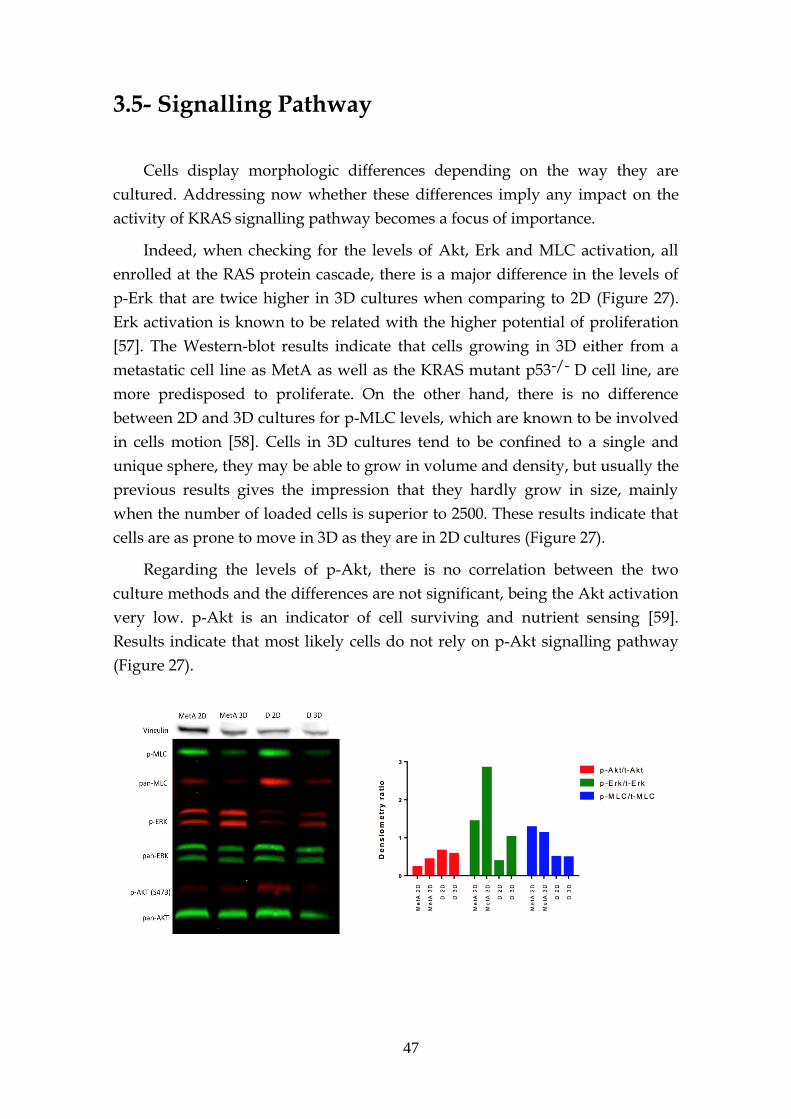
47
3.5- Signalling Pathway
Cells display morphologic differences depending on the way they are
cultured. Addressing now whether these differences imply any impact on the
activity of KRAS signalling pathway becomes a focus of importance.
Indeed, when checking for the levels of Akt, Erk and MLC activation, all
enrolled at the RAS protein cascade, there is a major difference in the levels of
p-Erk that are twice higher in 3D cultures when comparing to 2D (Figure 27).
Erk activation is known to be related with the higher potential of proliferation
[57]. The Western-blot results indicate that cells growing in 3D either from a
metastatic cell line as MetA as well as the KRAS mutant p53-/- D cell line, are
more predisposed to proliferate. On the other hand, there is no difference
between 2D and 3D cultures for p-MLC levels, which are known to be involved
in cells motion [58]. Cells in 3D cultures tend to be confined to a single and
unique sphere, they may be able to grow in volume and density, but usually the
previous results gives the impression that they hardly grow in size, mainly
when the number of loaded cells is superior to 2500. These results indicate that
cells are as prone to move in 3D as they are in 2D cultures (Figure 27).
Regarding the levels of p-Akt, there is no correlation between the two
culture methods and the differences are not significant, being the Akt activation
very low. p-Akt is an indicator of cell surviving and nutrient sensing [59].
Results indicate that most likely cells do not rely on p-Akt signalling pathway
(Figure 27).
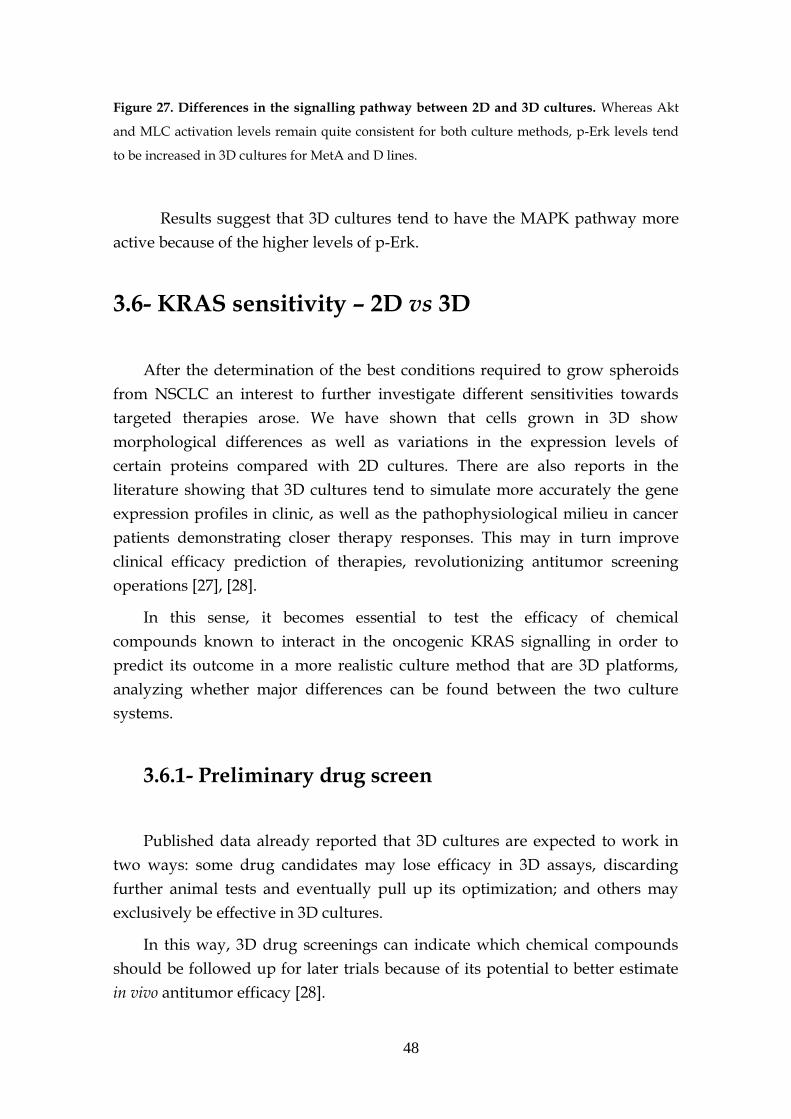
48
Figure 27. Differences in the signalling pathway between 2D and 3D cultures. Whereas Akt
and MLC activation levels remain quite consistent for both culture methods, p-Erk levels tend
to be increased in 3D cultures for MetA and D lines.
Results suggest that 3D cultures tend to have the MAPK pathway more
active because of the higher levels of p-Erk.
3.6- KRAS sensitivity – 2D vs 3D
After the determination of the best conditions required to grow spheroids
from NSCLC an interest to further investigate different sensitivities towards
targeted therapies arose. We have shown that cells grown in 3D show
morphological differences as well as variations in the expression levels of
certain proteins compared with 2D cultures. There are also reports in the
literature showing that 3D cultures tend to simulate more accurately the gene
expression profiles in clinic, as well as the pathophysiological milieu in cancer
patients demonstrating closer therapy responses. This may in turn improve
clinical efficacy prediction of therapies, revolutionizing antitumor screening
operations [27], [28].
In this sense, it becomes essential to test the efficacy of chemical
compounds known to interact in the oncogenic KRAS signalling in order to
predict its outcome in a more realistic culture method that are 3D platforms,
analyzing whether major differences can be found between the two culture
systems.
3.6.1- Preliminary drug screen
Published data already reported that 3D cultures are expected to work in
two ways: some drug candidates may lose efficacy in 3D assays, discarding
further animal tests and eventually pull up its optimization; and others may
exclusively be effective in 3D cultures.
In this way, 3D drug screenings can indicate which chemical compounds
should be followed up for later trials because of its potential to better estimate
in vivo antitumor efficacy [28].
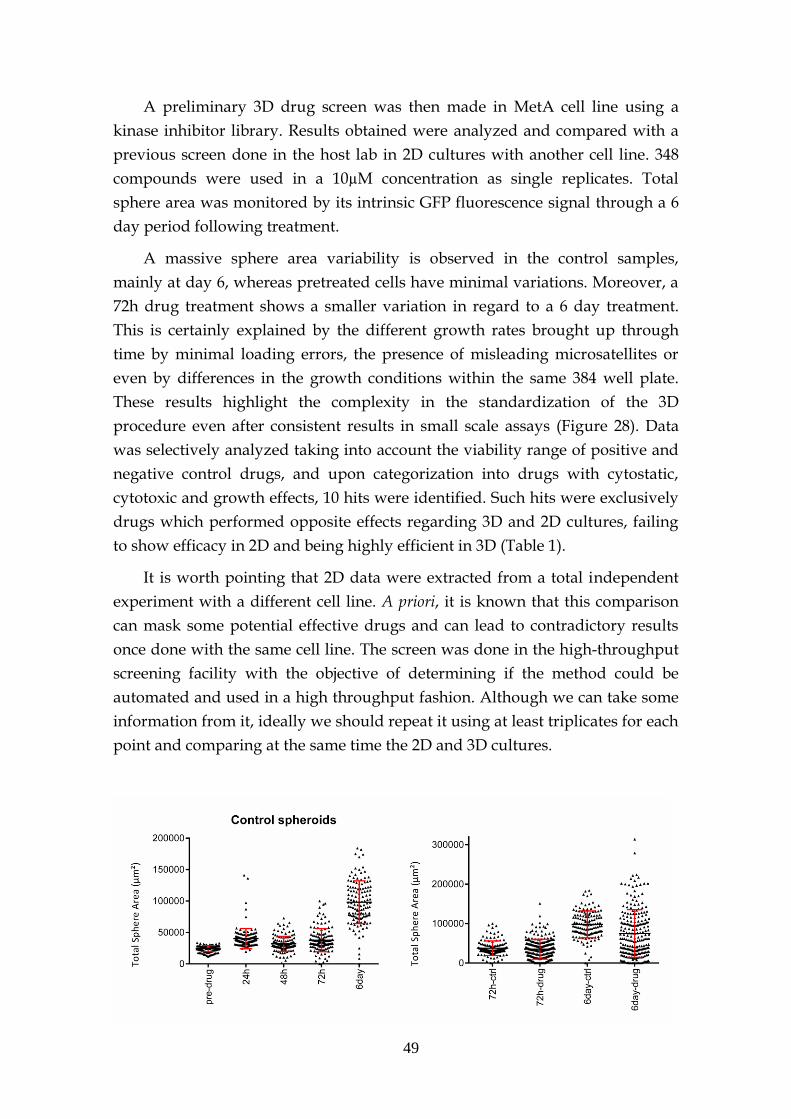
49
A preliminary 3D drug screen was then made in MetA cell line using a
kinase inhibitor library. Results obtained were analyzed and compared with a
previous screen done in the host lab in 2D cultures with another cell line. 348
compounds were used in a 10µM concentration as single replicates. Total
sphere area was monitored by its intrinsic GFP fluorescence signal through a 6
day period following treatment.
A massive sphere area variability is observed in the control samples,
mainly at day 6, whereas pretreated cells have minimal variations. Moreover, a
72h drug treatment shows a smaller variation in regard to a 6 day treatment.
This is certainly explained by the different growth rates brought up through
time by minimal loading errors, the presence of misleading microsatellites or
even by differences in the growth conditions within the same 384 well plate.
These results highlight the complexity in the standardization of the 3D
procedure even after consistent results in small scale assays (Figure 28). Data
was selectively analyzed taking into account the viability range of positive and
negative control drugs, and upon categorization into drugs with cytostatic,
cytotoxic and growth effects, 10 hits were identified. Such hits were exclusively
drugs which performed opposite effects regarding 3D and 2D cultures, failing
to show efficacy in 2D and being highly efficient in 3D (Table 1).
It is worth pointing that 2D data were extracted from a total independent
experiment with a different cell line. A priori, it is known that this comparison
can mask some potential effective drugs and can lead to contradictory results
once done with the same cell line. The screen was done in the high-throughput
screening facility with the objective of determining if the method could be
automated and used in a high throughput fashion. Although we can take some
information from it, ideally we should repeat it using at least triplicates for each
point and comparing at the same time the 2D and 3D cultures.
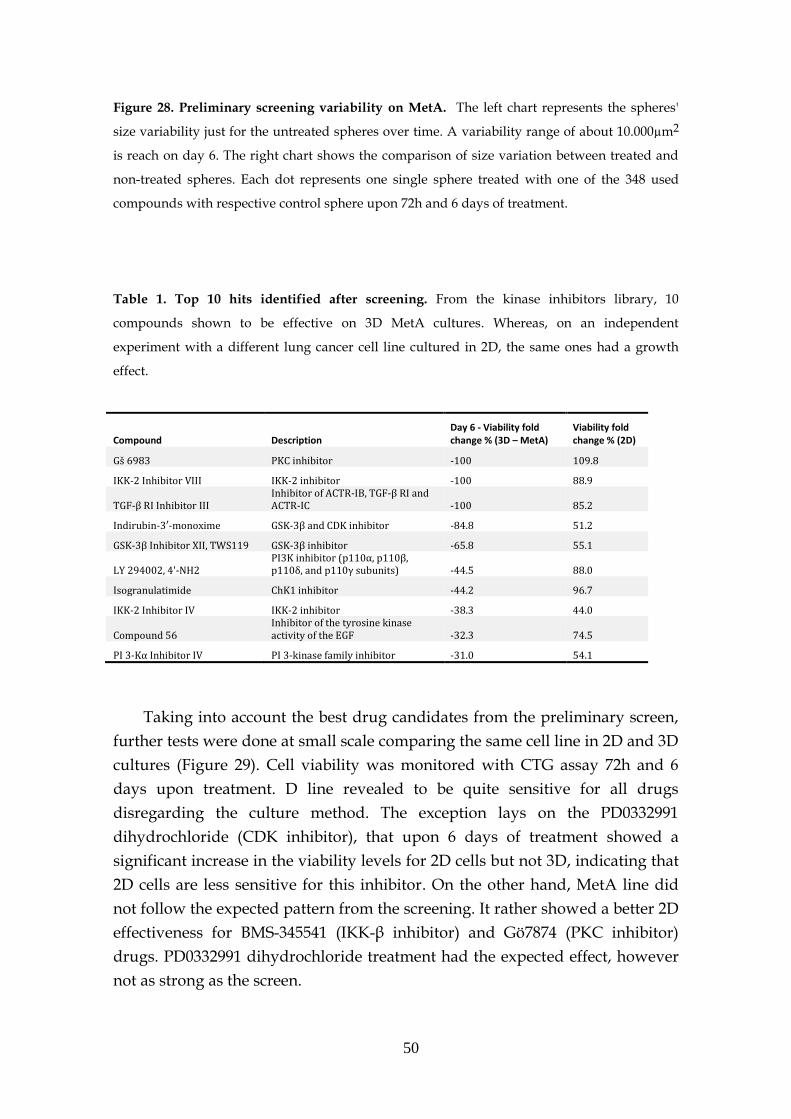
50
Figure 28. Preliminary screening variability on MetA. The left chart represents the spheres'
size variability just for the untreated spheres over time. A variability range of about 10.000µm2
is reach on day 6. The right chart shows the comparison of size variation between treated and
non-treated spheres. Each dot represents one single sphere treated with one of the 348 used
compounds with respective control sphere upon 72h and 6 days of treatment.
Table 1. Top 10 hits identified after screening. From the kinase inhibitors library, 10
compounds shown to be effective on 3D MetA cultures. Whereas, on an independent
experiment with a different lung cancer cell line cultured in 2D, the same ones had a growth
effect.
Compound Description Day 6 - Viability fold change % (3D – MetA)
Viability fold change % (2D)
Gš 6983 PKC inhibitor -100 109.8
IKK-2 Inhibitor VIII IKK-2 inhibitor -100 88.9
TGF-β RI Inhibitor III Inhibitor of ACTR-IB, TGF-β RI and ACTR-IC -100 85.2
Indirubin-3′-monoxime GSK-3β and CDK inhibitor -84.8 51.2
GSK-3β Inhibitor XII, TWS119 GSK-3β inhibitor -65.8 55.1
LY 294002, 4'-NH2 PI3K inhibitor (p110α, p110β, p110δ, and p110γ subunits) -44.5 88.0
Isogranulatimide ChK1 inhibitor -44.2 96.7
IKK-2 Inhibitor IV IKK-2 inhibitor -38.3 44.0
Compound 56 Inhibitor of the tyrosine kinase activity of the EGF -32.3 74.5
PI 3-Kα Inhibitor IV PI 3-kinase family inhibitor -31.0 54.1
Taking into account the best drug candidates from the preliminary screen,
further tests were done at small scale comparing the same cell line in 2D and 3D
cultures (Figure 29). Cell viability was monitored with CTG assay 72h and 6
days upon treatment. D line revealed to be quite sensitive for all drugs
disregarding the culture method. The exception lays on the PD0332991
dihydrochloride (CDK inhibitor), that upon 6 days of treatment showed a
significant increase in the viability levels for 2D cells but not 3D, indicating that
2D cells are less sensitive for this inhibitor. On the other hand, MetA line did
not follow the expected pattern from the screening. It rather showed a better 2D
effectiveness for BMS-345541 (IKK-β inhibitor) and Gö7874 (PKC inhibitor)
drugs. PD0332991 dihydrochloride treatment had the expected effect, however
not as strong as the screen.
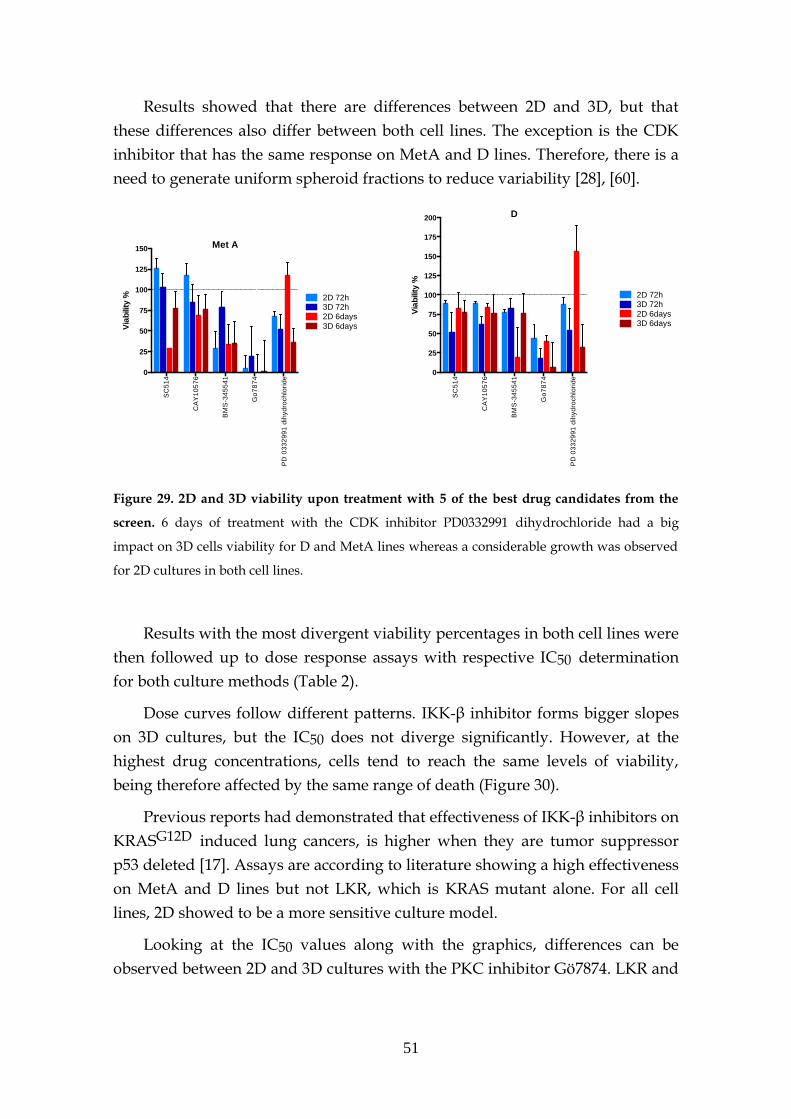
51
Results showed that there are differences between 2D and 3D, but that
these differences also differ between both cell lines. The exception is the CDK
inhibitor that has the same response on MetA and D lines. Therefore, there is a
need to generate uniform spheroid fractions to reduce variability [28], [60].
Figure 29. 2D and 3D viability upon treatment with 5 of the best drug candidates from the
screen. 6 days of treatment with the CDK inhibitor PD0332991 dihydrochloride had a big
impact on 3D cells viability for D and MetA lines whereas a considerable growth was observed
for 2D cultures in both cell lines.
Results with the most divergent viability percentages in both cell lines were
then followed up to dose response assays with respective IC50 determination
for both culture methods (Table 2).
Dose curves follow different patterns. IKK-β inhibitor forms bigger slopes
on 3D cultures, but the IC50 does not diverge significantly. However, at the
highest drug concentrations, cells tend to reach the same levels of viability,
being therefore affected by the same range of death (Figure 30).
Previous reports had demonstrated that effectiveness of IKK-β inhibitors on
KRASG12D induced lung cancers, is higher when they are tumor suppressor
p53 deleted [17]. Assays are according to literature showing a high effectiveness
on MetA and D lines but not LKR, which is KRAS mutant alone. For all cell
lines, 2D showed to be a more sensitive culture model.
Looking at the IC50 values along with the graphics, differences can be
observed between 2D and 3D cultures with the PKC inhibitor Gö7874. LKR and
SC
51
4
CA
Y1
05
76
BM
S-3
45
54
1
Go
78
74
PD
03
32
99
1 d
ihyd
roch
lori
de
0
25
50
75
100
125
150
Via
bili
ty %
Met A
2D 72h3D 72h2D 6days
3D 6days
SC
51
4
CA
Y1
05
76
BM
S-3
45
54
1
Go
78
74
PD
03
32
99
1 d
ihyd
roch
lori
de
0
25
50
75
100
125
150
175
200
Via
bili
ty %
D
2D 72h3D 72h2D 6days3D 6days
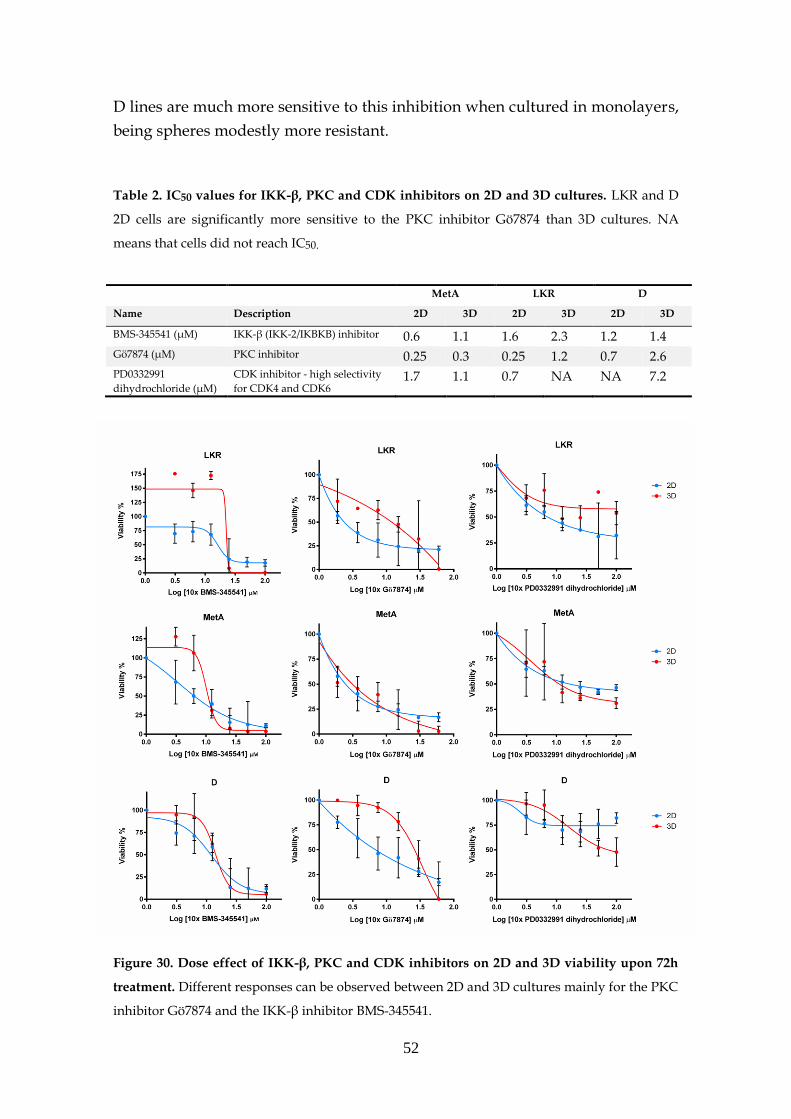
52
D lines are much more sensitive to this inhibition when cultured in monolayers,
being spheres modestly more resistant.
Table 2. IC50 values for IKK-β, PKC and CDK inhibitors on 2D and 3D cultures. LKR and D
2D cells are significantly more sensitive to the PKC inhibitor Gö7874 than 3D cultures. NA
means that cells did not reach IC50.
MetA LKR D
Name Description 2D 3D 2D 3D 2D 3D
BMS-345541 (µM) IKK-β (IKK-2/IKBKB) inhibitor 0.6 1.1 1.6 2.3 1.2 1.4
Gö7874 (µM) PKC inhibitor 0.25 0.3 0.25 1.2 0.7 2.6
PD0332991
dihydrochloride (µM)
CDK inhibitor - high selectivity
for CDK4 and CDK6 1.7 1.1 0.7 NA NA 7.2
Figure 30. Dose effect of IKK-β, PKC and CDK inhibitors on 2D and 3D viability upon 72h
treatment. Different responses can be observed between 2D and 3D cultures mainly for the PKC
inhibitor Gö7874 and the IKK-β inhibitor BMS-345541.
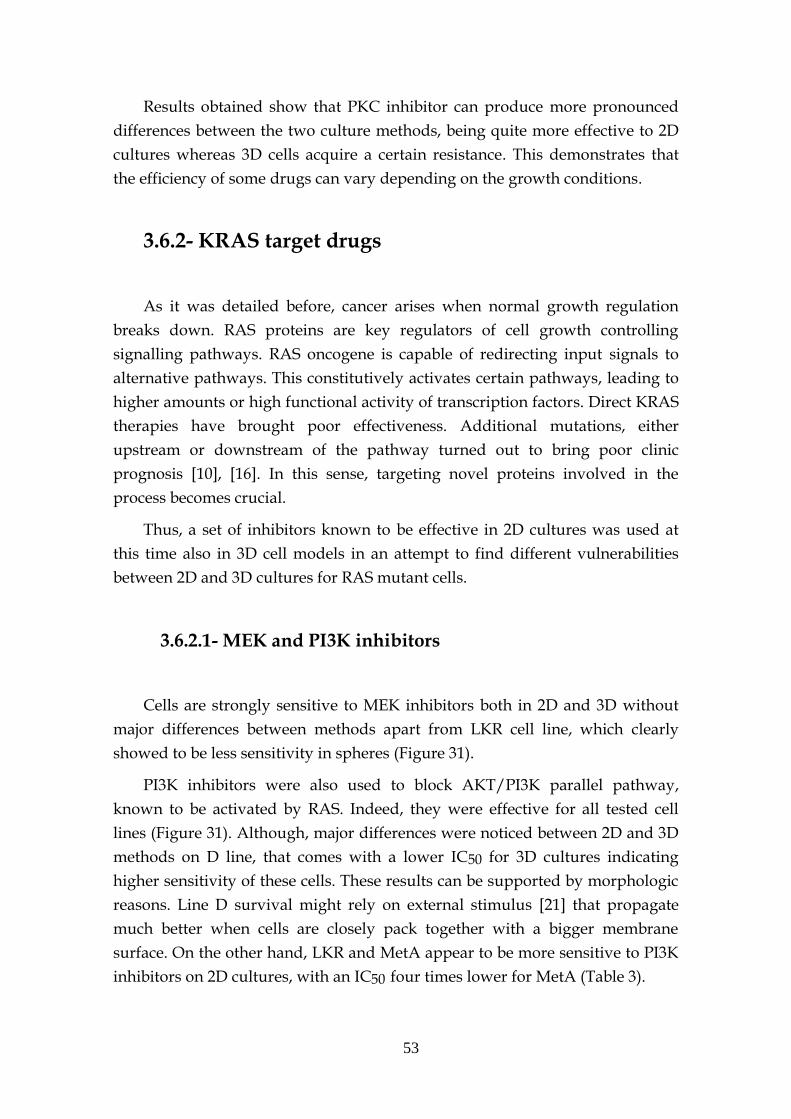
53
Results obtained show that PKC inhibitor can produce more pronounced
differences between the two culture methods, being quite more effective to 2D
cultures whereas 3D cells acquire a certain resistance. This demonstrates that
the efficiency of some drugs can vary depending on the growth conditions.
3.6.2- KRAS target drugs
As it was detailed before, cancer arises when normal growth regulation
breaks down. RAS proteins are key regulators of cell growth controlling
signalling pathways. RAS oncogene is capable of redirecting input signals to
alternative pathways. This constitutively activates certain pathways, leading to
higher amounts or high functional activity of transcription factors. Direct KRAS
therapies have brought poor effectiveness. Additional mutations, either
upstream or downstream of the pathway turned out to bring poor clinic
prognosis [10], [16]. In this sense, targeting novel proteins involved in the
process becomes crucial.
Thus, a set of inhibitors known to be effective in 2D cultures was used at
this time also in 3D cell models in an attempt to find different vulnerabilities
between 2D and 3D cultures for RAS mutant cells.
3.6.2.1- MEK and PI3K inhibitors
Cells are strongly sensitive to MEK inhibitors both in 2D and 3D without
major differences between methods apart from LKR cell line, which clearly
showed to be less sensitivity in spheres (Figure 31).
PI3K inhibitors were also used to block AKT/PI3K parallel pathway,
known to be activated by RAS. Indeed, they were effective for all tested cell
lines (Figure 31). Although, major differences were noticed between 2D and 3D
methods on D line, that comes with a lower IC50 for 3D cultures indicating
higher sensitivity of these cells. These results can be supported by morphologic
reasons. Line D survival might rely on external stimulus [21] that propagate
much better when cells are closely pack together with a bigger membrane
surface. On the other hand, LKR and MetA appear to be more sensitive to PI3K
inhibitors on 2D cultures, with an IC50 four times lower for MetA (Table 3).
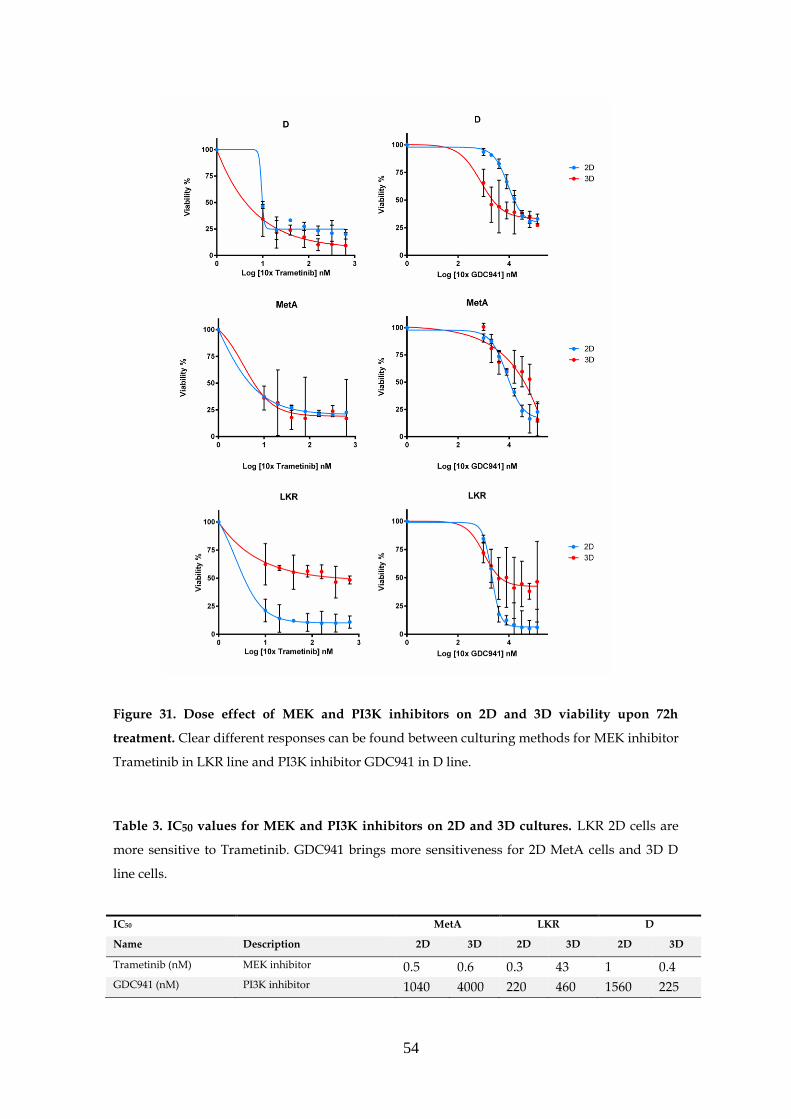
54
Figure 31. Dose effect of MEK and PI3K inhibitors on 2D and 3D viability upon 72h
treatment. Clear different responses can be found between culturing methods for MEK inhibitor
Trametinib in LKR line and PI3K inhibitor GDC941 in D line.
Table 3. IC50 values for MEK and PI3K inhibitors on 2D and 3D cultures. LKR 2D cells are
more sensitive to Trametinib. GDC941 brings more sensitiveness for 2D MetA cells and 3D D
line cells.
IC50 MetA LKR D
Name Description 2D 3D 2D 3D 2D 3D
Trametinib (nM) MEK inhibitor 0.5 0.6 0.3 43 1 0.4
GDC941 (nM) PI3K inhibitor 1040 4000 220 460 1560 225
55
These results bring to light that the LKR line is less sensitive to the main
pathway MEK and PI3K inhibitors when cultured in spheres. PI3K inhibitor is
more effective on 3D cultures for the D line, but the opposite happens for MetA,
indicating a cell line response dependency. Once more we see here that
differences between 2D and 3D do exist, but they are dependent on the cell line.
Taking into account the different sensitivities upon MEK inhibition, the
respective signalling pathways were analysed (Figure 32). The reduced levels of
p-ERK upon treatment indicate that Trametinib is working on spheroids. P-ERK
is not detectable on non-treated 2D cells, but increasing levels of p-MEK after 8h
treatment confirms a positive feedback loop due to MEK inhibition.
Conclusions about the different sensitivities between 2D and 3D cannot be
made with this western blot assay, once it does not display major differences
between both cell lines and the signal for p-AKT was too low. However, the
lower levels of NF-kB upon 8h treatment of D line in 3D may be responsible for
the higher sensitivity of these cells towards Trametinib, as it is also confirmed
by its lower IC50. The D line is then probably relying more on NF-kB pathway
when it is cultured in 3D conditions.
Figure 32. Effect of MEK inhibitor on signalling pathway for 2D and 3D cells over time. 72h
upon treatment with the correspondent IC30 dose, lysates were blotted against the indicated
proteins. As expected, Trametinib is having an effect on p-ERK levels but no differences
between D and LKR lines are able to explain the observed different drug sensitivities. NF-kB
(p65) levels are shown for D line. The decreasing levels upon 8h for 3D cultures indicate a
higher dependency of this type of cultures from this signalling pathway.
Further studies are needed in order to understand how differently these
inhibitors may affect the pathway accordingly to cells morphology and spatial
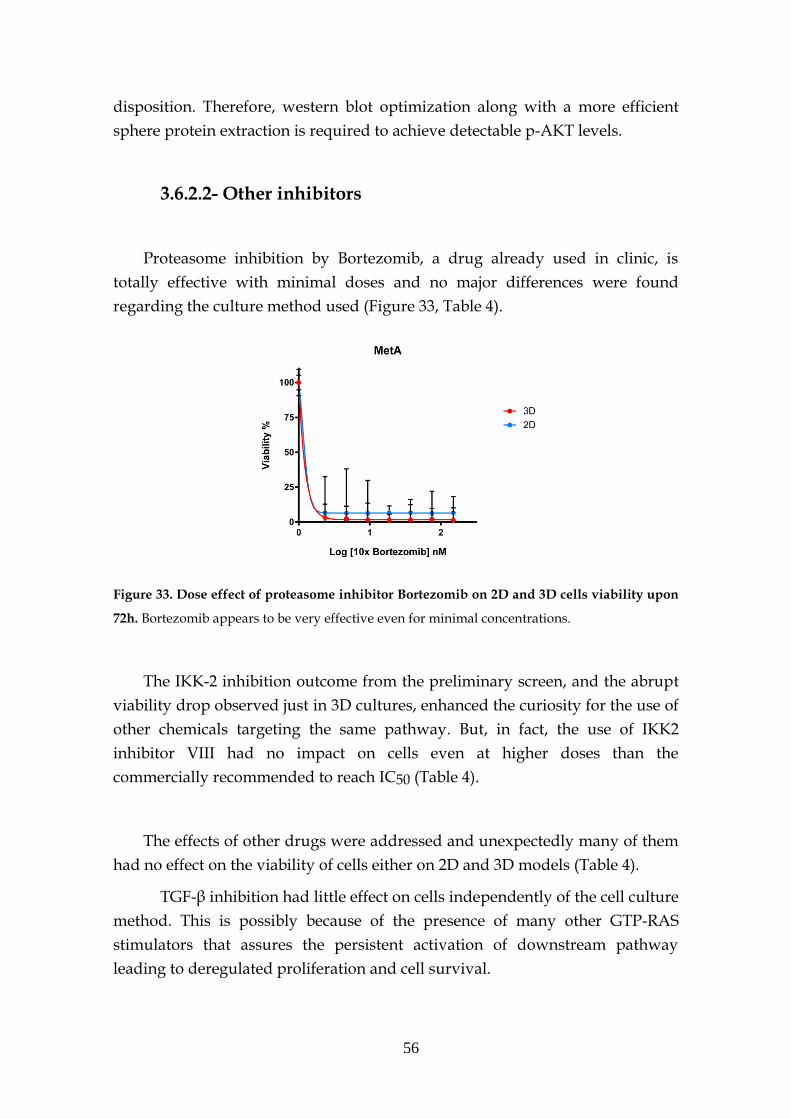
56
disposition. Therefore, western blot optimization along with a more efficient
sphere protein extraction is required to achieve detectable p-AKT levels.
3.6.2.2- Other inhibitors
Proteasome inhibition by Bortezomib, a drug already used in clinic, is
totally effective with minimal doses and no major differences were found
regarding the culture method used (Figure 33, Table 4).
Figure 33. Dose effect of proteasome inhibitor Bortezomib on 2D and 3D cells viability upon
72h. Bortezomib appears to be very effective even for minimal concentrations.
The IKK-2 inhibition outcome from the preliminary screen, and the abrupt
viability drop observed just in 3D cultures, enhanced the curiosity for the use of
other chemicals targeting the same pathway. But, in fact, the use of IKK2
inhibitor VIII had no impact on cells even at higher doses than the
commercially recommended to reach IC50 (Table 4).
The effects of other drugs were addressed and unexpectedly many of them
had no effect on the viability of cells either on 2D and 3D models (Table 4).
TGF-β inhibition had little effect on cells independently of the cell culture
method. This is possibly because of the presence of many other GTP-RAS
stimulators that assures the persistent activation of downstream pathway
leading to deregulated proliferation and cell survival.
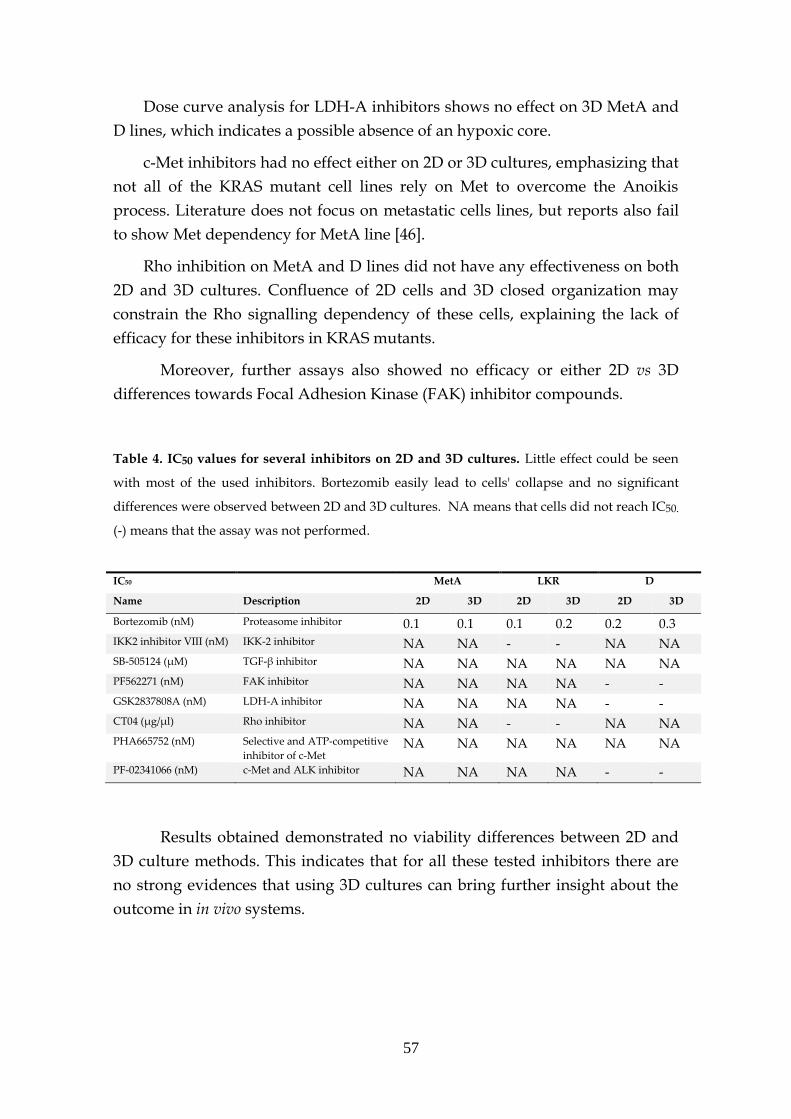
57
Dose curve analysis for LDH-A inhibitors shows no effect on 3D MetA and
D lines, which indicates a possible absence of an hypoxic core.
c-Met inhibitors had no effect either on 2D or 3D cultures, emphasizing that
not all of the KRAS mutant cell lines rely on Met to overcome the Anoikis
process. Literature does not focus on metastatic cells lines, but reports also fail
to show Met dependency for MetA line [46].
Rho inhibition on MetA and D lines did not have any effectiveness on both
2D and 3D cultures. Confluence of 2D cells and 3D closed organization may
constrain the Rho signalling dependency of these cells, explaining the lack of
efficacy for these inhibitors in KRAS mutants.
Moreover, further assays also showed no efficacy or either 2D vs 3D
differences towards Focal Adhesion Kinase (FAK) inhibitor compounds.
Table 4. IC50 values for several inhibitors on 2D and 3D cultures. Little effect could be seen
with most of the used inhibitors. Bortezomib easily lead to cells' collapse and no significant
differences were observed between 2D and 3D cultures. NA means that cells did not reach IC50.
(-) means that the assay was not performed.
IC50 MetA LKR D
Name Description 2D 3D 2D 3D 2D 3D
Bortezomib (nM) Proteasome inhibitor 0.1 0.1 0.1 0.2 0.2 0.3
IKK2 inhibitor VIII (nM) IKK-2 inhibitor NA NA - - NA NA
SB-505124 (µM) TGF-β inhibitor NA NA NA NA NA NA
PF562271 (nM) FAK inhibitor NA NA NA NA - -
GSK2837808A (nM) LDH-A inhibitor NA NA NA NA - -
CT04 (µg/µl) Rho inhibitor NA NA - - NA NA
PHA665752 (nM) Selective and ATP-competitive
inhibitor of c-Met NA NA NA NA NA NA
PF-02341066 (nM) c-Met and ALK inhibitor NA NA NA NA - -
Results obtained demonstrated no viability differences between 2D and
3D culture methods. This indicates that for all these tested inhibitors there are
no strong evidences that using 3D cultures can bring further insight about the
outcome in in vivo systems.
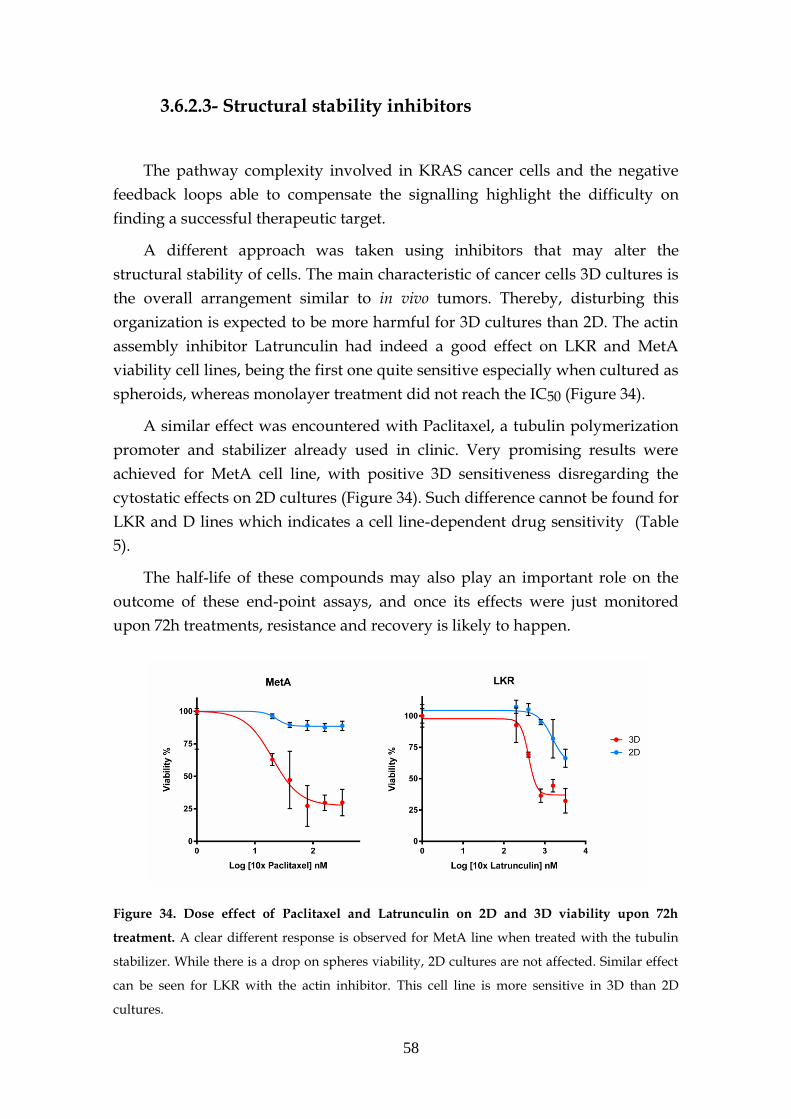
58
3.6.2.3- Structural stability inhibitors
The pathway complexity involved in KRAS cancer cells and the negative
feedback loops able to compensate the signalling highlight the difficulty on
finding a successful therapeutic target.
A different approach was taken using inhibitors that may alter the
structural stability of cells. The main characteristic of cancer cells 3D cultures is
the overall arrangement similar to in vivo tumors. Thereby, disturbing this
organization is expected to be more harmful for 3D cultures than 2D. The actin
assembly inhibitor Latrunculin had indeed a good effect on LKR and MetA
viability cell lines, being the first one quite sensitive especially when cultured as
spheroids, whereas monolayer treatment did not reach the IC50 (Figure 34).
A similar effect was encountered with Paclitaxel, a tubulin polymerization
promoter and stabilizer already used in clinic. Very promising results were
achieved for MetA cell line, with positive 3D sensitiveness disregarding the
cytostatic effects on 2D cultures (Figure 34). Such difference cannot be found for
LKR and D lines which indicates a cell line-dependent drug sensitivity (Table
5).
The half-life of these compounds may also play an important role on the
outcome of these end-point assays, and once its effects were just monitored
upon 72h treatments, resistance and recovery is likely to happen.
Figure 34. Dose effect of Paclitaxel and Latrunculin on 2D and 3D viability upon 72h
treatment. A clear different response is observed for MetA line when treated with the tubulin
stabilizer. While there is a drop on spheres viability, 2D cultures are not affected. Similar effect
can be seen for LKR with the actin inhibitor. This cell line is more sensitive in 3D than 2D
cultures.
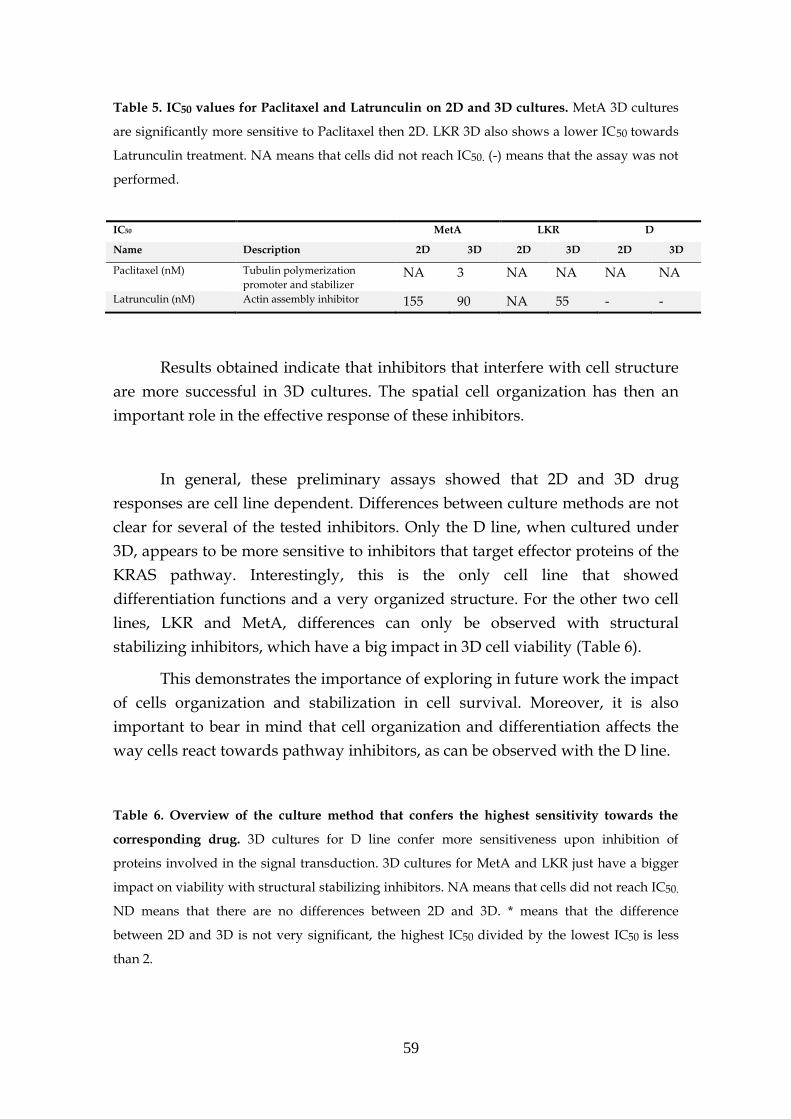
59
Table 5. IC50 values for Paclitaxel and Latrunculin on 2D and 3D cultures. MetA 3D cultures
are significantly more sensitive to Paclitaxel then 2D. LKR 3D also shows a lower IC50 towards
Latrunculin treatment. NA means that cells did not reach IC50. (-) means that the assay was not
performed.
IC50 MetA LKR D
Name Description 2D 3D 2D 3D 2D 3D
Paclitaxel (nM) Tubulin polymerization
promoter and stabilizer NA 3 NA NA NA NA
Latrunculin (nM) Actin assembly inhibitor 155 90 NA 55 - -
Results obtained indicate that inhibitors that interfere with cell structure
are more successful in 3D cultures. The spatial cell organization has then an
important role in the effective response of these inhibitors.
In general, these preliminary assays showed that 2D and 3D drug
responses are cell line dependent. Differences between culture methods are not
clear for several of the tested inhibitors. Only the D line, when cultured under
3D, appears to be more sensitive to inhibitors that target effector proteins of the
KRAS pathway. Interestingly, this is the only cell line that showed
differentiation functions and a very organized structure. For the other two cell
lines, LKR and MetA, differences can only be observed with structural
stabilizing inhibitors, which have a big impact in 3D cell viability (Table 6).
This demonstrates the importance of exploring in future work the impact
of cells organization and stabilization in cell survival. Moreover, it is also
important to bear in mind that cell organization and differentiation affects the
way cells react towards pathway inhibitors, as can be observed with the D line.
Table 6. Overview of the culture method that confers the highest sensitivity towards the
corresponding drug. 3D cultures for D line confer more sensitiveness upon inhibition of
proteins involved in the signal transduction. 3D cultures for MetA and LKR just have a bigger
impact on viability with structural stabilizing inhibitors. NA means that cells did not reach IC50.
ND means that there are no differences between 2D and 3D. * means that the difference
between 2D and 3D is not very significant, the highest IC50 divided by the lowest IC50 is less
than 2.
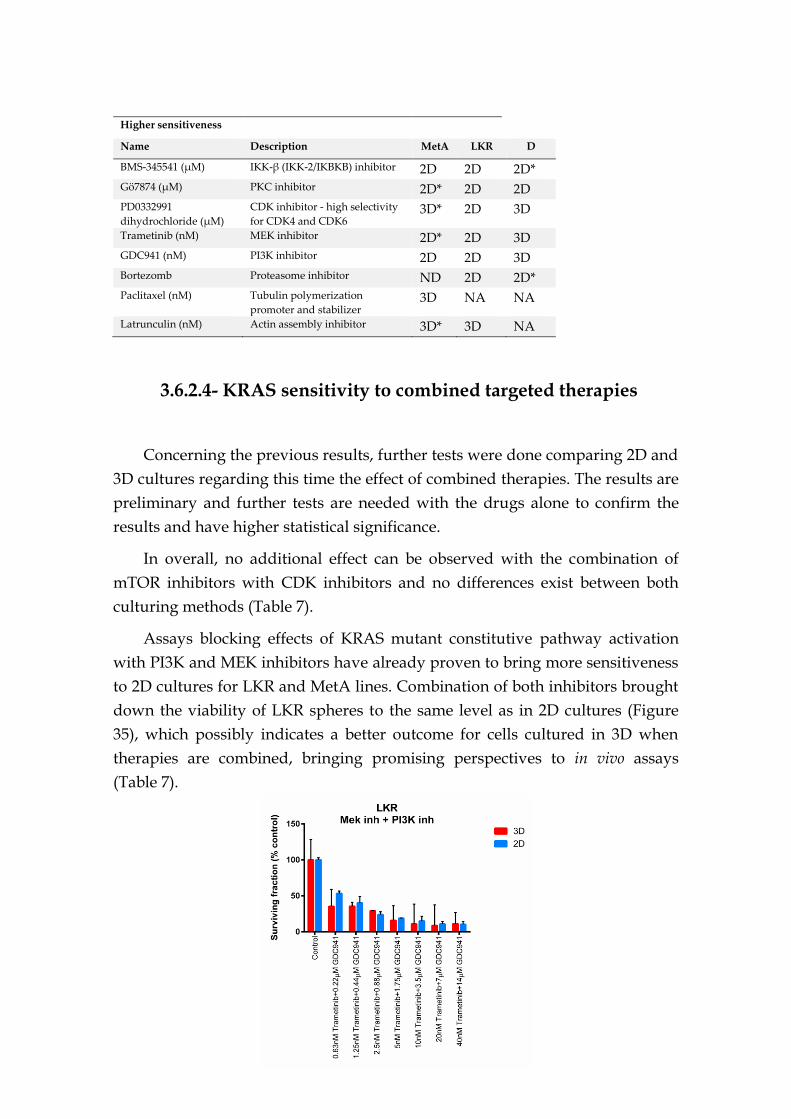
60
Higher sensitiveness
Name Description MetA LKR D
BMS-345541 (µM) IKK-β (IKK-2/IKBKB) inhibitor 2D 2D 2D*
Gö7874 (µM) PKC inhibitor 2D* 2D 2D
PD0332991
dihydrochloride (µM)
CDK inhibitor - high selectivity
for CDK4 and CDK6 3D* 2D 3D
Trametinib (nM) MEK inhibitor 2D* 2D 3D
GDC941 (nM) PI3K inhibitor 2D 2D 3D
Bortezomb Proteasome inhibitor ND 2D 2D*
Paclitaxel (nM) Tubulin polymerization
promoter and stabilizer 3D NA NA
Latrunculin (nM) Actin assembly inhibitor 3D* 3D NA
3.6.2.4- KRAS sensitivity to combined targeted therapies
Concerning the previous results, further tests were done comparing 2D and
3D cultures regarding this time the effect of combined therapies. The results are
preliminary and further tests are needed with the drugs alone to confirm the
results and have higher statistical significance.
In overall, no additional effect can be observed with the combination of
mTOR inhibitors with CDK inhibitors and no differences exist between both
culturing methods (Table 7).
Assays blocking effects of KRAS mutant constitutive pathway activation
with PI3K and MEK inhibitors have already proven to bring more sensitiveness
to 2D cultures for LKR and MetA lines. Combination of both inhibitors brought
down the viability of LKR spheres to the same level as in 2D cultures (Figure
35), which possibly indicates a better outcome for cells cultured in 3D when
therapies are combined, bringing promising perspectives to in vivo assays
(Table 7).
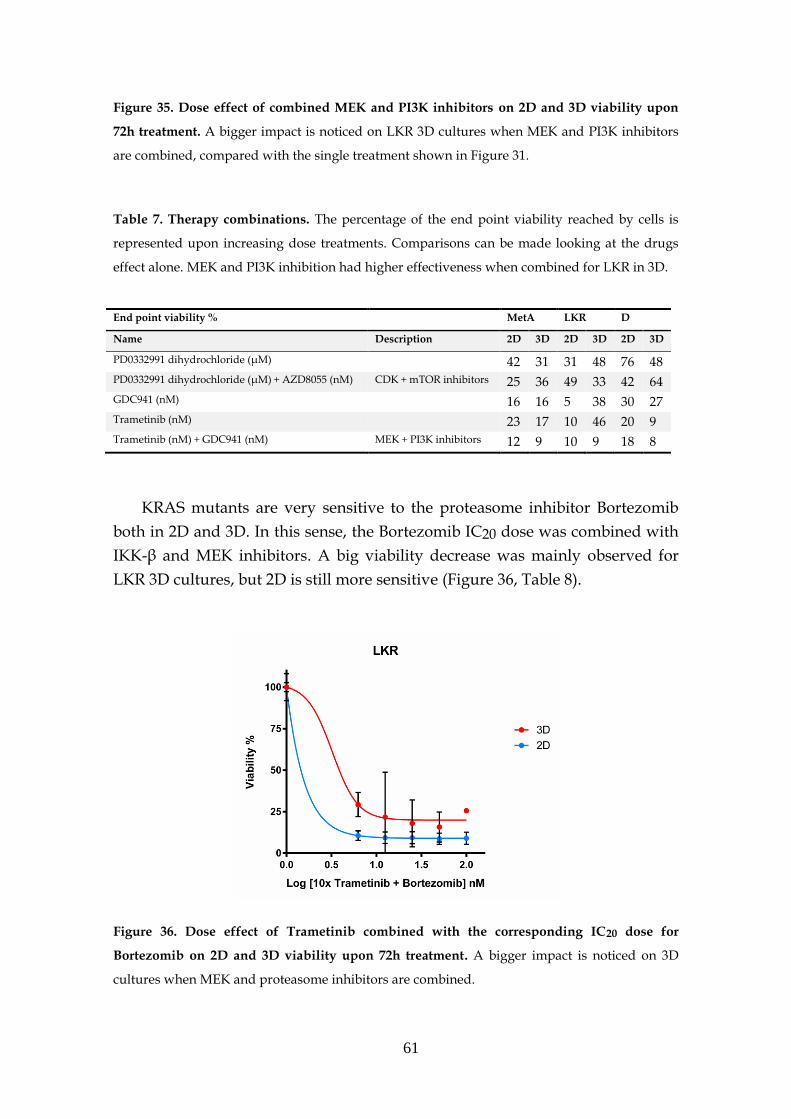
61
Figure 35. Dose effect of combined MEK and PI3K inhibitors on 2D and 3D viability upon
72h treatment. A bigger impact is noticed on LKR 3D cultures when MEK and PI3K inhibitors
are combined, compared with the single treatment shown in Figure 31.
Table 7. Therapy combinations. The percentage of the end point viability reached by cells is
represented upon increasing dose treatments. Comparisons can be made looking at the drugs
effect alone. MEK and PI3K inhibition had higher effectiveness when combined for LKR in 3D.
End point viability % MetA LKR D
Name Description 2D 3D 2D 3D 2D 3D
PD0332991 dihydrochloride (µM) 42 31 31 48 76 48
PD0332991 dihydrochloride (µM) + AZD8055 (nM) CDK + mTOR inhibitors 25 36 49 33 42 64
GDC941 (nM) 16 16 5 38 30 27
Trametinib (nM) 23 17 10 46 20 9
Trametinib (nM) + GDC941 (nM) MEK + PI3K inhibitors 12 9 10 9 18 8
KRAS mutants are very sensitive to the proteasome inhibitor Bortezomib
both in 2D and 3D. In this sense, the Bortezomib IC20 dose was combined with
IKK-β and MEK inhibitors. A big viability decrease was mainly observed for
LKR 3D cultures, but 2D is still more sensitive (Figure 36, Table 8).
Figure 36. Dose effect of Trametinib combined with the corresponding IC20 dose for
Bortezomib on 2D and 3D viability upon 72h treatment. A bigger impact is noticed on 3D
cultures when MEK and proteasome inhibitors are combined.
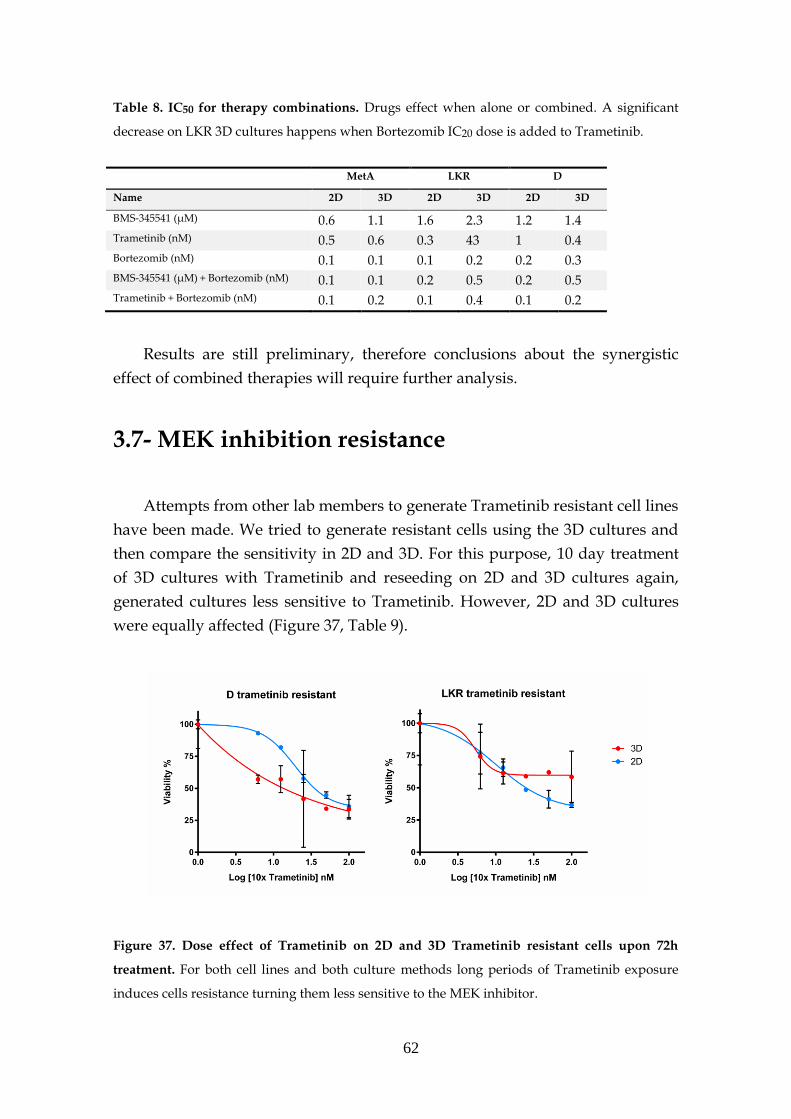
62
Table 8. IC50 for therapy combinations. Drugs effect when alone or combined. A significant
decrease on LKR 3D cultures happens when Bortezomib IC20 dose is added to Trametinib.
Results are still preliminary, therefore conclusions about the synergistic
effect of combined therapies will require further analysis.
3.7- MEK inhibition resistance
Attempts from other lab members to generate Trametinib resistant cell lines
have been made. We tried to generate resistant cells using the 3D cultures and
then compare the sensitivity in 2D and 3D. For this purpose, 10 day treatment
of 3D cultures with Trametinib and reseeding on 2D and 3D cultures again,
generated cultures less sensitive to Trametinib. However, 2D and 3D cultures
were equally affected (Figure 37, Table 9).
Figure 37. Dose effect of Trametinib on 2D and 3D Trametinib resistant cells upon 72h
treatment. For both cell lines and both culture methods long periods of Trametinib exposure
induces cells resistance turning them less sensitive to the MEK inhibitor.
MetA LKR D
Name 2D 3D 2D 3D 2D 3D
BMS-345541 (µM) 0.6 1.1 1.6 2.3 1.2 1.4
Trametinib (nM) 0.5 0.6 0.3 43 1 0.4
Bortezomib (nM) 0.1 0.1 0.1 0.2 0.2 0.3
BMS-345541 (µM) + Bortezomib (nM) 0.1 0.1 0.2 0.5 0.2 0.5
Trametinib + Bortezomib (nM) 0.1 0.2 0.1 0.4 0.1 0.2
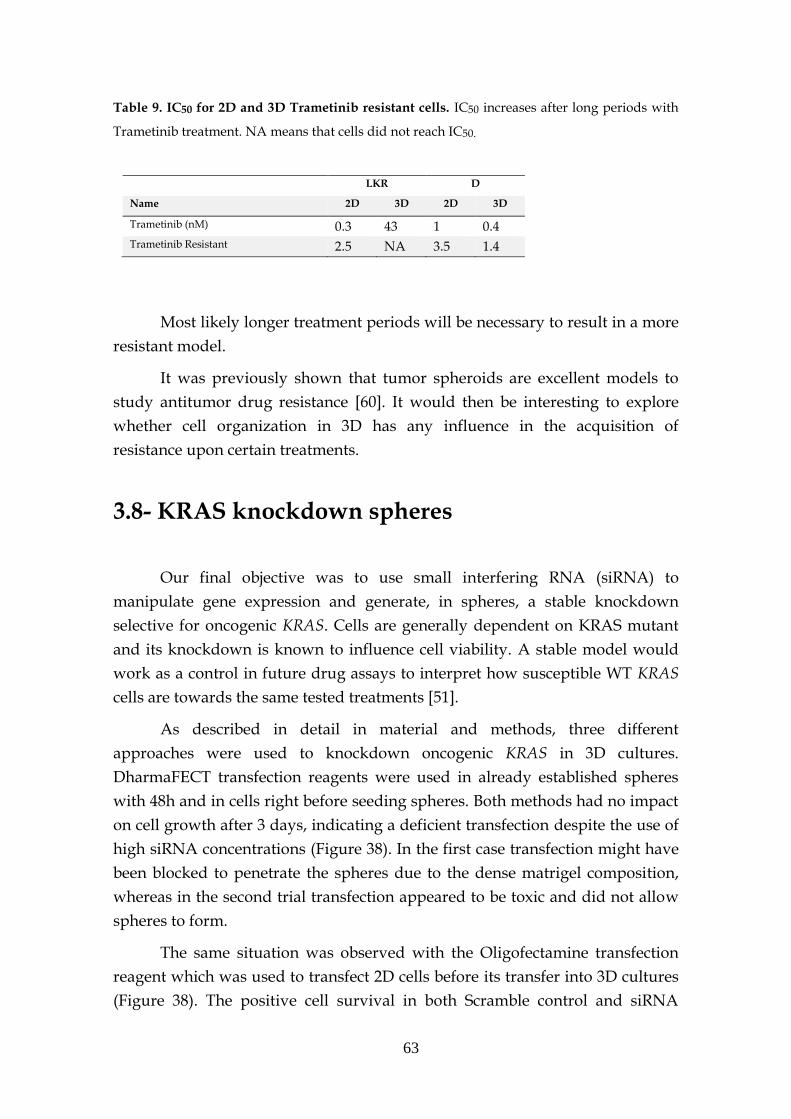
63
Table 9. IC50 for 2D and 3D Trametinib resistant cells. IC50 increases after long periods with
Trametinib treatment. NA means that cells did not reach IC50.
Most likely longer treatment periods will be necessary to result in a more
resistant model.
It was previously shown that tumor spheroids are excellent models to
study antitumor drug resistance [60]. It would then be interesting to explore
whether cell organization in 3D has any influence in the acquisition of
resistance upon certain treatments.
3.8- KRAS knockdown spheres
Our final objective was to use small interfering RNA (siRNA) to
manipulate gene expression and generate, in spheres, a stable knockdown
selective for oncogenic KRAS. Cells are generally dependent on KRAS mutant
and its knockdown is known to influence cell viability. A stable model would
work as a control in future drug assays to interpret how susceptible WT KRAS
cells are towards the same tested treatments [51].
As described in detail in material and methods, three different
approaches were used to knockdown oncogenic KRAS in 3D cultures.
DharmaFECT transfection reagents were used in already established spheres
with 48h and in cells right before seeding spheres. Both methods had no impact
on cell growth after 3 days, indicating a deficient transfection despite the use of
high siRNA concentrations (Figure 38). In the first case transfection might have
been blocked to penetrate the spheres due to the dense matrigel composition,
whereas in the second trial transfection appeared to be toxic and did not allow
spheres to form.
The same situation was observed with the Oligofectamine transfection
reagent which was used to transfect 2D cells before its transfer into 3D cultures
(Figure 38). The positive cell survival in both Scramble control and siRNA
LKR D
Name 2D 3D 2D 3D
Trametinib (nM) 0.3 43 1 0.4
Trametinib Resistant 2.5 NA 3.5 1.4
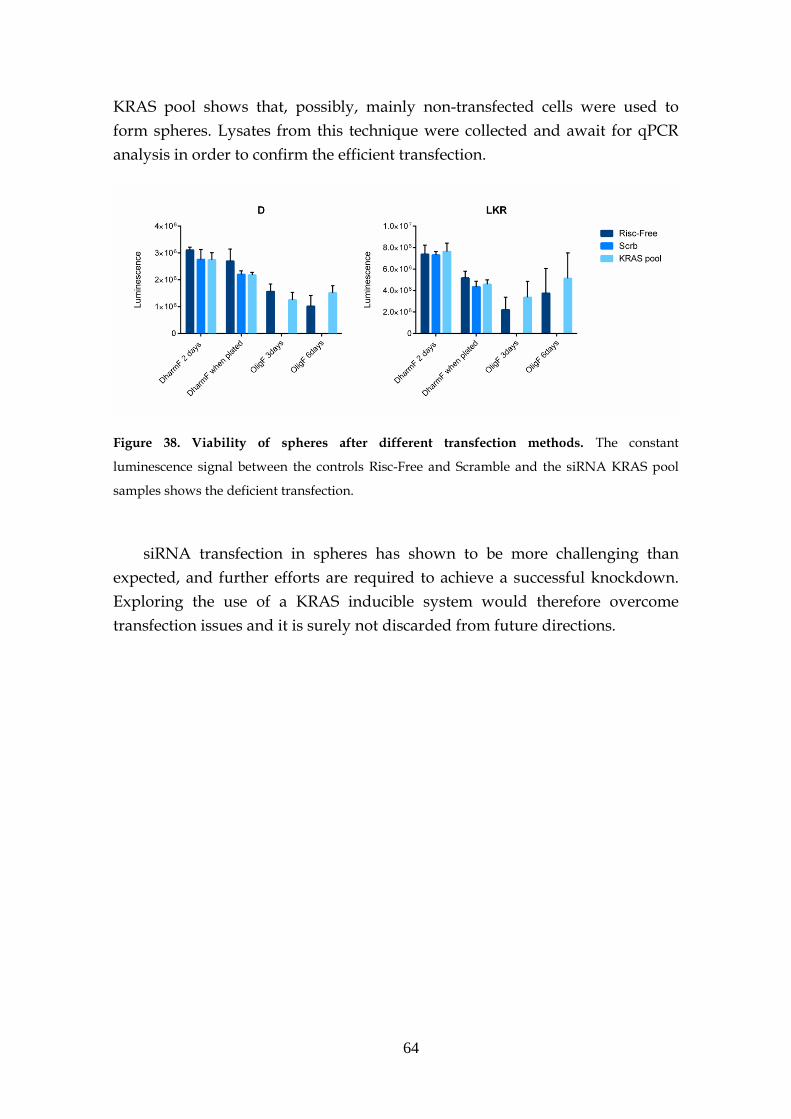
64
KRAS pool shows that, possibly, mainly non-transfected cells were used to
form spheres. Lysates from this technique were collected and await for qPCR
analysis in order to confirm the efficient transfection.
Figure 38. Viability of spheres after different transfection methods. The constant
luminescence signal between the controls Risc-Free and Scramble and the siRNA KRAS pool
samples shows the deficient transfection.
siRNA transfection in spheres has shown to be more challenging than
expected, and further efforts are required to achieve a successful knockdown.
Exploring the use of a KRAS inducible system would therefore overcome
transfection issues and it is surely not discarded from future directions.
65
Chapter 4
Concluding Remarks
3D culture systems are well known for their ability to better mimic in vivo
conditions. They are able to recreate features of the tumor biology, better
predicting therapeutic outcomes. However, the use of this kind of platform for
NSCLC cells driven by the mutant KRAS, has not been much explored to the
date.
Here we show that KRAS mutant cells from a mouse model are able to
grow and survive particularly better in matrix embedded systems. Matrigel
2.5% (v/v) confers the appropriate conditions to culture these cells and is
simultaneously suitable for large-scale high throughput screenings, as was also
shown by a preliminary screen. CellTiter-Glo assay also showed to be an
accurate and sensitive method to monitor cell viability. Its lysing properties are
indicated to penetrate the spheres.
Morphologically, spheroids have a very smooth out-layer and tend to
form adhesion complexes between cells. Cell cross communication with factors
or stimulus may then occur at a higher level in 3D cultures. TEM images
showed particular differentiation features in the D cell line. It is a very well
organized structure that forms defined acini and is positive for E-cadherin.
Evaluation of the pathway activation showed a persistent increase in the
activity of p-ERK on 3D cultures for all of the tested cell lines. However, the
culture system does not seem to have an influence on the activity of other
proteins such as p-AKT and p-MLC, which showed no apparent variation.
Differences on KRAS dependencies between 2D and 3D cultures were also
subject of study. We targeted KRAS downstream effectors or other pathways
66
that have been shown to play a role on the survival of cells harboring KRAS
mutations. Results showed that there are some differences in drug sensitivity
between both 2D and 3D settings, but that they are usually cell line dependent.
Differences are especially evident for the D line. This cell is apparently
more sensitive to inhibitors like CDK, MEK and PI3K when cultured in 3D,
whereas the opposite happens for the MetA and LKR lines, which are more
responsive in 2D for the same targets of the KRAS pathway.
On the other hand, MetA and LKR spheroids showed a good response
towards structural stability inhibitors like Paclitaxel and Latrunculin, while it
was ineffective for 2D cultures and the D line both in 2D and 3D settings.
The results obtained also suggest that it may be an important link between
spheroid structural organization and its responsiveness and that this link is
worth to be explored further. Interestingly, the D line, which displayed the
most well organized 3D structure, is the only one that is more vulnerable to
KRAS pathway targets in a 3D setting. On the other side, MetA and LKR lines,
which showed to be 3D randomly organized, are the most sensitive to
structural stability inhibitors.
In summary, we have developed a method to grow NSCLC cell lines in 3D
and quantify cell viability after drug treatment. Results demonstrate that 2D
and 3D cultures show different sensitivity to certain inhibitors. Therefore,
testing automatically large sets of drugs may eventually highlight new
exclusive 3D targets that will reflect better the drug response in an in vivo
setting. 3D cultures are then promising tools with potential to contribute for the
development of new anti-cancer agents in the future.
67
References
[1] S. Luo, M. Sun, R. Jiang, G. Wang, and X. Zhang, “Establishment of primary mouse lung adenocarcinoma cell culture,” Oncol. Lett., vol. 2, pp. 629–632, 2011.
[2] F. Ferlay J, Soerjomataram I, Ervik M, Dikshit R, Eser S, Mathers C, Rebelo M, Parkin DM, Forman D, Bray, “Lung Cancer Estimated Incidence, Mortality and Prevalence Worldwide in 2012,” GLOBOCAN 2012 v1.0, Cancer Incid. Mortal. Worldw. IARC CancerBase No. 11 [Internet]., pp. 1–6, 2013.
[3] J. M. Fritz, L. D. Dwyer-Nield, and A. M. Malkinson, “Stimulation of neoplastic mouse lung cell proliferation by alveolar macrophage-derived, insulin-like growth factor-1 can be blocked by inhibiting MEK and PI3K activation.,” Mol. Cancer, vol. 10, no. 1, p. 76, 2011.
[4] J. O. Hiroko Endo, “Spheroid Culture of Primary Lung Cancer Cells with Neuregulin 1/HER3 Pathway Activation,” vol. 8, no. 2, pp. 131–139, 2013.
[5] H. Xie, J. I. Hanai, J. G. Ren, L. Kats, K. Burgess, P. Bhargava, S. Signoretti, J. Billiard, K. J. Duffy, A. Grant, X. Wang, P. K. Lorkiewicz, S. Schatzman, M. Bousamra, A. N. Lane, R. M. Higashi, T. W. M. Fan, P. P. Pandolfi, V. P. Sukhatme, and P. Seth, “Targeting lactate dehydrogenase-A inhibits tumorigenesis and tumor progression in mouse models of lung cancer and impacts tumor-initiating cells,” Cell Metab., vol. 19, no. 5, pp. 795–809, 2014.
[6] A. Naalsund, H. Rostad, E. H. Strøm, M. B. Lund, and T.-E. Strand, “Carcinoid lung tumors--incidence, treatment and outcomes: a population-based study.,” Eur. J. Cardiothorac. Surg., vol. 39, no. 4, pp. 565–569, 2011.
[7] W. D. Travis, “Update on small cell carcinoma and its differentiation from squamous cell carcinoma and other non-small cell carcinomas,” Mod. Pathol., vol. 25, no. S1, pp. S18–S30, 2012.
[8] G. C. Jones, J. D. Kehrer, J. Kahn, B. N. Koneru, R. Narayan, T. O. Thomas, K. Camphausen, M. P. Mehta, and A. Kaushal, “Primary Treatment Options for High-Risk/Medically Inoperable Early Stage NSCLC Patients,” Clin. Lung Cancer, 2015.
[9] S. Rothschild, “Targeted Therapies in Non-Small Cell Lung Cancer—Beyond EGFR and ALK,” Cancers (Basel)., vol. 7, no. 2, pp. 930–949, 2015.
[10] M. W. R. Roger J. B. King, Cancer Biology, Third. Harlow, England: Pearson Education, 2006.
68
[11] I. a. Prior, P. D. Lewis, and C. Mattos, “A comprehensive survey of ras mutations in cancer,” Cancer Res., vol. 72, pp. 2457–2467, 2012.
[12] J. Downward, “RAS’s cloak of invincibility slips at last?,” Cancer Cell, vol. 25, no. 1, pp. 5–6, 2014.
[13] M. Schwartz, “Rho signalling at a glance,” J Cell Sci, vol. 117, pp. 5457–5458, 2004.
[14] C. V. Pecot, S. Y. Wu, S. Bellister, J. Filant, R. Rupaimoole, T. Hisamatsu, R. Bhattacharya, a. Maharaj, S. Azam, C. Rodriguez-Aguayo, a. S. Nagaraja, M. P. Morelli, K. M. Gharpure, T. a. Waugh, V. Gonzalez-Villasana, B. Zand, H. J. Dalton, S. Kopetz, G. Lopez-Berestein, L. M. Ellis, and a. K. Sood, “Therapeutic Silencing of KRAS Using Systemically Delivered siRNAs,” Mol. Cancer Ther., vol. 13, no. 12, pp. 2876–2885, 2014.
[15] J. Downward, “Targeting RAS signalling pathways in cancer therapy.,” Nat. Rev. Cancer, vol. 3, no. January, pp. 11–22, 2003.
[16] S. Eser, a Schnieke, G. Schneider, and D. Saur, “Oncogenic KRAS signalling in pancreatic cancer.,” Br. J. Cancer, vol. 111, no. 5, pp. 1–6, 2014.
[17] D. S. Bassères, A. Ebbs, P. C. Cogswell, and A. S. Baldwin, “IKK is a therapeutic target in KRAS-Induced lung cancer with disrupted p53 activity.,” Genes Cancer, vol. 5, no. 1–2, pp. 41–55, 2014.
[18] J. K. Won, H. W. Yang, S. Y. Shin, J. H. Lee, W. Do Heo, and K. H. Cho, “The crossregulation between ERK and PI3K signaling pathways determines the tumoricidal efficacy of MEK inhibitor,” J. Mol. Cell Biol., vol. 4, no. 3, pp. 153–163, 2012.
[19] E. J. Haagensen, S. Kyle, G. S. Beale, R. J. Maxwell, and D. R. Newell, “The synergistic interaction of MEK and PI3K inhibitors is modulated by mTOR inhibition.,” Br. J. Cancer, vol. 106, no. 8, pp. 1386–94, 2012.
[20] E. Aksamitiene, A. Kiyatkin, and B. N. Kholodenko, “Cross-talk between mitogenic Ras / MAPK and survival PI3K / Akt pathways : a fine balance,” Biochem. Soc. Trans., pp. 139–146, 2012.
[21] M. Molina-Arcas, D. C. Hancock, C. Sheridan, M. S. Kumar, and J. Downward, “Coordinate direct input of both KRAS and IGF1 receptor to activation of PI3 kinase in KRAS -mutant lung cancer,” Cancer Discov., vol. 3, no. 5, pp. 548–563, 2013.
[22] J. Downward, “RAS Synthetic Lethal Screens Revisited: Still Seeking the Elusive Prize?,” Clin. Cancer Res., vol. 21, no. 8, pp. 1802–1809, 2015.
69
[23] M. Steckel, M. Molina-Arcas, B. Weigelt, M. Marani, P. H. Warne, H. Kuznetsov, G. Kelly, B. Saunders, M. Howell, J. Downward, and D. C. Hancock, “Determination of synthetic lethal interactions in KRAS oncogene-dependent cancer cells reveals novel therapeutic targeting strategies,” Cell Res., vol. 22, no. 8, pp. 1227–1245, 2012.
[24] Y. Wang, V. N. Ngo, M. Marani, Y. Yang, G. Wright, L. M. Staudt, and J. Downward, “Critical role for transcriptional repressor Snail2 in transformation by oncogenic RAS in colorectal carcinoma cells.,” Oncogene, vol. 29, no. 33, pp. 4658–4670, 2010.
[25] R. a Vertrees, M. McCarthy, T. Solley, V. L. Popov, J. Roaten, M. Pauley, X. Wen, and T. J. Goodwin, “Development of a three-dimensional model of lung cancer using cultured transformed lung cells.,” Cancer Biol. Ther., vol. 8, no. January 2015, pp. 356–365, 2009.
[26] R. & K.-S. Friedrich, J., Ebner, “Experimental anti-tumor therapy in 3-D: spheroids - old hat or new challenge?,” Int. J. Radiat. Biol, vol. 83, pp. 849–871, 2007.
[27] F. Hirschhaeuser, H. Menne, C. Dittfeld, J. West, W. Mueller-Klieser, and L. a. Kunz-Schughart, “Multicellular tumor spheroids: An underestimated tool is catching up again,” J. Biotechnol., vol. 148, no. 1, pp. 3–15, 2010.
[28] J. Friedrich, C. Seidel, R. Ebner, and L. a Kunz-Schughart, “Spheroid-based drug screen: considerations and practical approach.,” Nat. Protoc., vol. 4, no. 3, pp. 309–324, 2009.
[29] S. Schmidt, I. Messner, A. C. Luca, S. Mersch, S. E. Baldus, W. Huckenbeck, R. P. Piekorz, W. T. Knoefel, A. Krieg, and N. H. Stoecklein, “Impact of the 3D Microenvironment on Phenotype , Gene Expression , and EGFR Inhibition of Colorectal Cancer Cell Lines,” vol. 8, no. 3, 2013.
[30] J. E. Ekert, K. Johnson, B. Strake, J. Pardinas, S. Jarantow, R. Perkinson, and D. C. Colter, “Three-dimensional lung tumor microenvironment modulates therapeutic compound responsiveness in vitro - Implication for drug development,” PLoS One, vol. 9, no. 3, pp. 1–14, 2014.
[31] R. Lama, L. Zhang, J. M. Naim, J. Williams, A. Zhou, and B. Su, “Development, validation and pilot screening of an in vitro multi-cellular three-dimensional cancer spheroid assay for anti-cancer drug testing,” Bioorganic Med. Chem., vol. 21, no. 4, pp. 922–931, 2013.
[32] C. Wang, Z. Tang, Y. Zhao, R. Yao, L. Li, and W. Sun, “Three-dimensional in vitro cancer models: a short review.,” Biofabrication, vol. 6, p. 022001, 2014.
70
[33] M. J. Weigelt, B., Ghajar, C. M., & Bissell, “The need for complex 3D culture models to unravel novel pathways and identify accurate biomarkers in breast cancer.,” Adv. Drug Deliv. Rev., vol. 69–70, pp. 42–51, 2014.
[34] Promega corporation, “Protocols and applications guide: Cell viability,” vol. 23, pp. 1–23.
[35] J. S. Sebolt-Leopold and R. Herrera, “Targeting the mitogen-activated protein kinase cascade to treat cancer.,” Nat. Rev. Cancer, vol. 4, no. 12, pp. 937–947, 2004.
[36] J. S. et al. Sebolt-Leopold, “Blockade of the MAP kinase pathway suppresses growth of colon tumors in vivo,” Nat. Med., vol. 5, pp. 810–816, 1999.
[37] A. Carnero and J. M. Paramio, “The PTEN/PI3K/AKT Pathway in vivo, Cancer Mouse Models,” Front. Oncol., vol. 4, no. September, pp. 1–10, 2014.
[38] C. López-Otín and T. Hunter, “The regulatory crosstalk between kinases and proteases in cancer.,” Nat. Rev. Cancer, vol. 10, no. 4, pp. 278–292, 2010.
[39] M. Karin, Y. Yamamoto, and Q. M. Wang, “The IKK NF-kappa B system: a treasure trove for drug development.,” Nat. Rev. Drug Discov., vol. 3, no. 1, pp. 17–26, 2004.
[40] E. M. Griner and M. G. Kazanietz, “Protein kinase C and other diacylglycerol effectors in cancer.,” Nat. Rev. Cancer, vol. 7, no. 4, pp. 281–294, 2007.
[41] H. J. Mackay and C. J. Twelves, “Targeting the protein kinase C family: are we there yet?,” Nat. Rev. Cancer, vol. 7, no. 7, pp. 554–562, 2007.
[42] E. a Musgrove, C. E. Caldon, J. Barraclough, A. Stone, and R. L. Sutherland, “Cyclin D as a therapeutic target in cancer.,” Nat. Rev. Cancer, vol. 11, no. 8, pp. 558–572, 2011.
[43] J. D. B Weigelt, PH Warne, “PIK3CA mutation, but not PTEN loss of function, determines the sensitivity of breast cancer cells to mTOR inhibitory drugs,” Oncogene, vol. 30, pp. 3222–3233, 2011.
[44] T. Gui, Y. Sun, A. Shimokado, and Y. Muragaki, “The Roles of Mitogen-Activated Protein Kinase Pathways in TGF- β -Induced Epithelial-Mesenchymal Transition,” vol. 2012, no. type I, 2012.
71
[45] D. A. Chapnick, L. Warner, J. Bernet, T. Rao, and X. Liu, “Partners in crime : the TGF b and MAPK pathways in cancer progression,” Cell Biosci., vol. 1, no. 1, p. 42, 2011.
[46] S. Fujita-Sato, J. Galeas, M. Truitt, C. Pitt, a. Urisman, S. Bandyopadhyay, D. Ruggero, and F. McCormick, “Enhanced MET translation and signaling sustains K-Ras driven proliferation under anchorage-independent growth conditions,” Cancer Res., vol. 184624, 2015.
[47] A. Hall, “Rho family GTPases.,” Biochem. Soc. Trans., vol. 40, pp. 1378–82, 2012.
[48] E. Sahai and C. J. Marshall, “RHO-GTPases and cancer.,” Nat. Rev. Cancer, vol. 2, no. February, pp. 133–142, 2002.
[49] D. R. Croft and M. F. Olson, “The Rho GTPase effector ROCK regulates cyclin A, cyclin D1, and p27Kip1 levels by distinct mechanisms.,” Mol. Cell. Biol., vol. 26, no. 12, pp. 4612–4627, 2006.
[50] K. B. Dunn, M. Heffler, and V. Golubovskaya, “Evolving Therapies and FAK Inhibitors for the Treatment of Cancer,” vol. 10, no. 10, pp. 722–734, 2012.
[51] N. Sunaga, D. S. Shames, L. Girard, M. Peyton, J. E. Larsen, H. Imai, J. Soh, M. Sato, N. Yanagitani, K. Kaira, and Y. Xie, “Knockdown of Oncogenic KRAS in Non – Small Cell Lung Cancers Suppresses Tumor Growth and Sensitizes Tumor Cells to Targeted Therapy,” AACR, vol. 10, no. February, pp. 336–347, 2011.
[52] L. K. N. Nicholas E., Timmins, “Generation of Multicellular Tumor Spheroids by Hanging-Drop Method,” pp. 141–151.
[53] et al. Walzl A., Unger C., Kramer N., Unterleuthner D., Scherzer M., “The Resazurin Reduction Assay Can Distinguish Cytotoxic from Cytostatic Compounds in Spheroid Screening Assays,” J Biomol Screen., vol. 19, no. 7, pp. 1047–1059, 2014.
[54] A. Ivascu and M. Kubbies, “Rapid generation of single-tumor spheroids for high-throughput cell function and toxicity analysis.,” J. Biomol. Screen. Off. J. Soc. Biomol. Screen., vol. 11, pp. 922–932, 2006.
[55] W. Mueller-klieser, “Three-dimensional cell cultures: from molecular mechanisms to clinical applications,” Am. Physiol. Soc., 1997.
[56] A. V. P. Rajeev Singhai, Vinayak W Patil, Sanjog R Jaiswal, Shital D Patil, Mukund B Tayade, “E-Cadherin as a diagnostic biomarker in breast cancer,” N Am J Med Sci., vol. 3, no. 5, pp. 227–233, 2011.
72
[57] G. Hatzivassiliou, B. Liu, C. O’Brien, J. M. Spoerke, K. P. Hoeflich, P. M. Haverty, R. Soriano, W. F. Forrest, S. Heldens, H. Chen, K. Toy, C. Ha, W. Zhou, K. Song, L. S. Friedman, L. C. Amler, G. M. Hampton, J. Moffat, M. Belvin, and M. R. Lackner, “ERK Inhibition Overcomes Acquired Resistance to MEK Inhibitors,” Mol. Cancer Ther., vol. 11, no. 5, pp. 1143–1154, 2012.
[58] a L. Bishop and a Hall, “Rho GTPases and their effector proteins.,” Biochem. J., vol. 348, pp. 241–255, 2000.
[59] B. J. Altman and J. C. Rathmell, “Metabolic Stress in Autophagy and Cell Death Pathways,” Cold Spring Harb. Perspect. Biol., vol. 4, pp. a008763–a008763, 2012.
[60] W. Mueller-klieser, “Tumor biology and experimental therapeutics,” Elsevier - Crit. Rev. Oncol. Hematol., vol. 36, pp. 123–139, 2000.

73
Supplementary Information
Supplementary Information 1. D line does not show villi in 2D cultures. Contrarily to 3D
cultures, TEM images show the absence of microvilli in the D cell line.
Supplementary Information 2. Drug dose assays. Differences can be observed between 2D and
3D for some inhibitors. However the differences are cell line dependent.
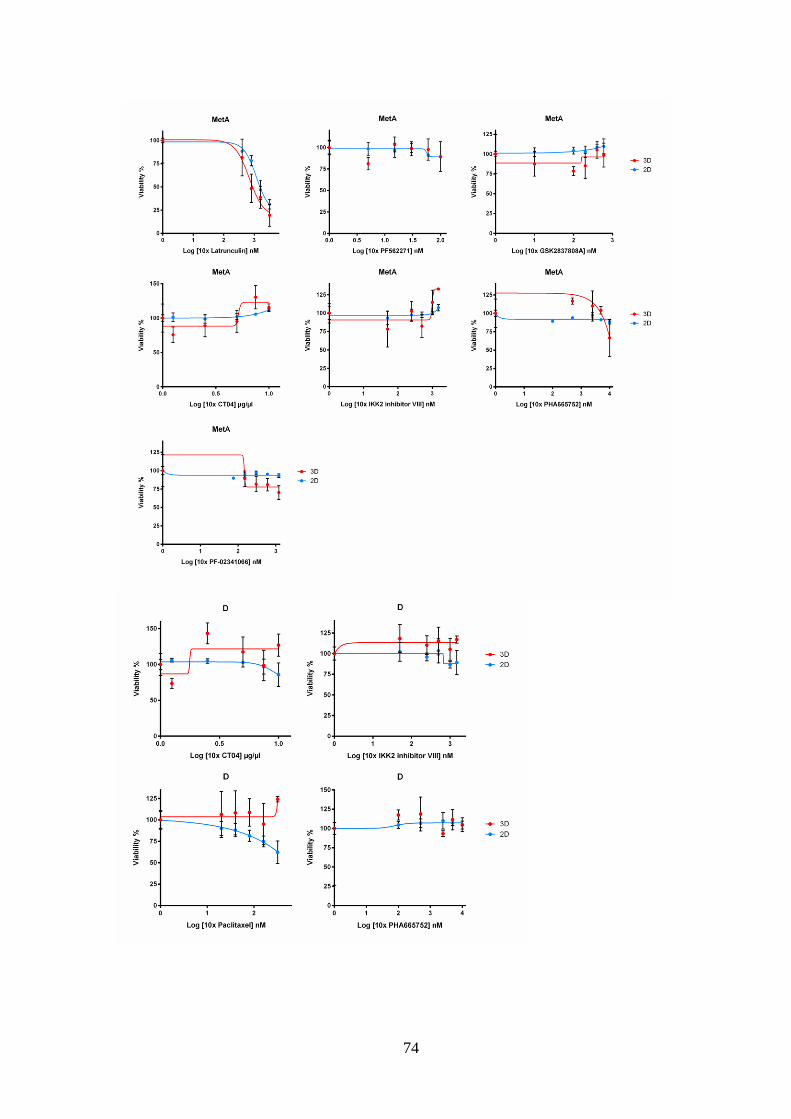
74
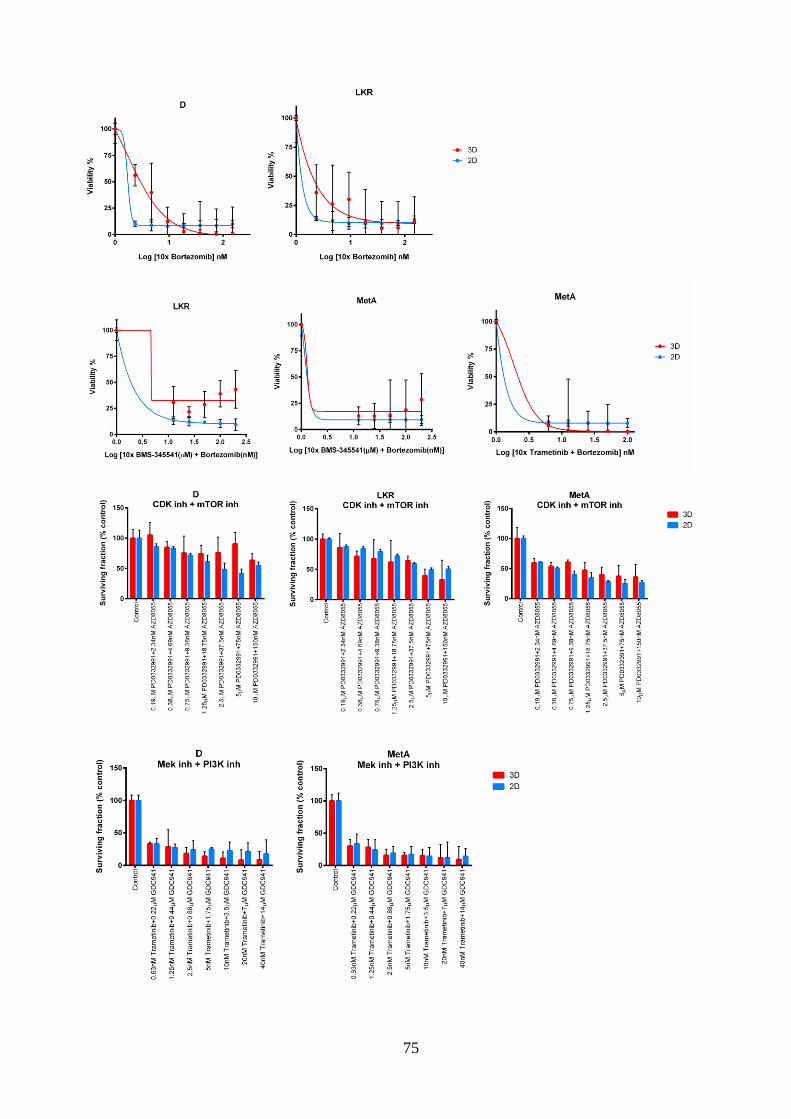
75