
Access over ownership: how the collaborative economy is changing mobility
Vol.:(0123456789)
Scientometrics (2021) 126:3551–3564https://doi.org/10.1007/s11192-021-03865-7
1 3
Investigating collaborative and mobility networks: reflections on the core missions of universities
Zsolt Tibor Kosztyán1,5,6 · Beáta Fehérvölgyi2 · Tibor Csizmadia3 · Kinga Kerekes4
Received: 6 October 2020 / Accepted: 5 January 2021 / Published online: 6 February 2021 © The Author(s) 2021
AbstractGiven the significant role of universities in economic growth and social progress as well as the increasing demand for greater transparency regarding the use of public money, a valid assessment of university performance has become crucial for various stakeholders, including government, industry, funding agencies, and society at large. Contemporary assessments still focus solely on universities’ properties, thereby failing to capture their network relations. To overcome this limitation, this paper proposes a multilayer network-based method to measure the embeddedness of universities in collaboration and mobil-ity networks. This method has several advantages: first, it is relevant for HEIs’ core mis-sions, introducing a new dimension complementary to the existing rankings; second, it is size invariant; and last but not least, it is fully transparent. The proposed multilayer net-work approach enables the integration of further networks, which creates opportunities for a more comprehensive assessment of universities’ performance in achieving their core missions.
Keywords Multilayer network analysis · Collaboration network · Mobility network · University ranking · Embeddedness
Introduction
In modern, knowledge-based societies, higher education institutions (HEIs) are becom-ing increasingly embedded in their local, regional, national, and international environ-ments (Degl’Innocenti et al. 2019; Kenney and Goe 2004; Riviezzo et al. 2020; de Wit 2010) by forming knowledge-related collaborations with external actors such as busi-nesses, governments, other universities, and students as consumers (Sánchez-Barrioluengo 2014; Perkmann et al. 2013; Scandura 2016). University collaborations can be considered both catalysts and engines of their operation supported by policies and laws, programs for
Supplementary Information The online version contains supplementary material available at (https ://doi.org/10.1007/s1119 2-021-03865 -7).
* Zsolt Tibor Kosztyán [email protected]
Extended author information available on the last page of the article
3552 Scientometrics (2021) 126:3551–3564
1 3
enhancing collaboration and mobility, and financial incentives and tax regulations (Geisler 1995; Thune 2007). Donors, both private and public, governments and research agencies seek ways to facilitate and promote university-society synergies based on the assumption that collaborating in a networked environment is advantageous for achieving complex policy goals (OECD 1998, 2007; Thomson et al. 2009). Specifically, the European Eco-nomic Community (EEC) extensively fostered university collaboration by launching the Framework Programmes for research, development and demonstration in 1984 (European Economic Community 1983) and the Erasmus mobility program in 1987 (European Eco-nomic Community 1987). The European Commission’s (EC) 2011 Modernisation Agenda identified the aim of enhancing the internationalization and openness of higher education systems, strengthening collaboration between member states and between universities and firms, and fostering international networks for excellence (European Comission 2011). The EC allocated 3.1 billion EUR (0.36%) of its budget to support the Erasmus (2008–2014) program and 45.8 billion EUR (5.3%) to support the FP7 (2007–2013) program (EU 2013).
Given the significant role of universities in economic growth and social progress, as well as the increasing demand for greater transparency regarding the use of public money (Dolowitz and Marsh 2000; Molas-Gallart and Castro-Martínez 2007; Janger et al. 2017), valid assessment of the universities’ performance becomes crucial for various stakeholders, including government, industry, funding agencies, and society at large (Bölling and Eriks-son 2016; Olcay and Bulu 2017; Ramos-Vielba et al. 2010).
In this respect, university rankings serve as useful instruments for public accountability, supplying information to both consumers and policy makers on measurable differences in university performance (Adler and Harzing 2009; Dill and Soo 2005; Teichler 2011). A number of global rankings, such as the Times Higher Education (THE) World University Ranking, the Academic Ranking of World Universities (ARWU), the U-Multirank, and the CWTS Leiden Ranking, measure and compare university performance each year. These global rankings rely on internationally accessible indicators and bibliometric/webomet-ric data (Çakır et al. 2015; Rauhvargers 2011). In addition, several countries have devel-oped their own national ranking systems, often using sets of more comprehensive, but less accessible/reproducible, indicators (Olcay and Bulu 2017; Saisana et al. 2011).
In our view, existing ranking methods raise several problems. First, indicator-based ranking methods do not consider the interactions, such as collaboration and mobility, between HEIs. From a network point of view, these methods rank nodes (i.e., HEIs) by their properties without considering the links (i.e., collaboration and mobility) between them. Second, the size effect is a substantial shortcoming of indicator-based ranking meth-ods (Van Raan 2005; Szücs 2018). Most rankings, except for ARWU and CWTS, do not consider size, by which many indicators’ measurements would naturally increase with the size of the HEIs, indicating that the larger a HEI is, the higher the ranking. This fact reso-nates with the current debates on the Matthew effect in Science (see, for instance, Azoulay et al. 2014; Ayoubi et al. 2019; Bol et al. 2018). Third, except for few rankings, such as CWTS, several indicators are not transparent (e.g., based on surveys), or their reliability is questionable (e.g., based on self-declaration); therefore, it is difficult to reproduce the ranking orders of the HEIs. Finally, due to different HEI financial and legal environments, several indicators cannot be measured or are not relevant for smaller HEIs (Kosztyán et al. 2019). Therefore, these rankings have bias and cannot usually ensure fair results.
The primary purpose of this paper is to complete the existing rankings by adding a new perspective related to HEIs’ core missions, such as embeddedness in collaboration networks, which no current ranking method addresses. This paper proposes a multilayer network-based method to measure and compare the embeddedness of HEIs in mobility and
3553Scientometrics (2021) 126:3551–3564
1 3
collaboration networks. The innovativeness of this approach is that instead of individual properties of HEIs, the multiple connections between academic and non-academic actors are analyzed and measured by multilayer network analysis. Second, we aim to decrease the size effect of HEIs on their ranking positions by focusing only on their network embed-dedness (measured by multilayer eigenvector centrality) instead of on different indicators. Third, we aim to provide feedback for policy makers related to the synergy between EU-funded programs intended for HEIs by analyzing the correlations between the mobility and research collaboration networks’ properties. Finally, our objective is to transparently use methods and datasets that are freely available, and to ensure that all of our calculations can be reproduced.
The article is organized as follows. "Data sources and methods employed" section describes the applied data and the proposed multilayer model, followed by the section on results ("Result"). Finally, in "Summary and conclusion" section, the paper concludes by summarizing the main findings and identifying further research opportunities.
Data sources and methods employed
The aim of merging different data sources was twofold. First, for inclusion in the database, the studied universities were required to have noteworthy activities in the first two mis-sions (teaching and research). Therefore, inclusion in this study was limited to those Euro-pean universities represented in the Scimago ranking1 and the Leiden ranking,2 which have reported institutional data for their teaching activities in the ETER database.3 The second and most important aspect was to collect as much information about the HEIs as possi-ble from freely available data sources to maintain transparency. Therefore, multiple data sources were combined. The merged data focused on HEIs. ETER, Erasmus and the GRID4 databases have already been connected and geo-coded by Gadár et al. (2020). We extended this database and linked FP7 projects from the CORDIS database, Leiden’s indicators from
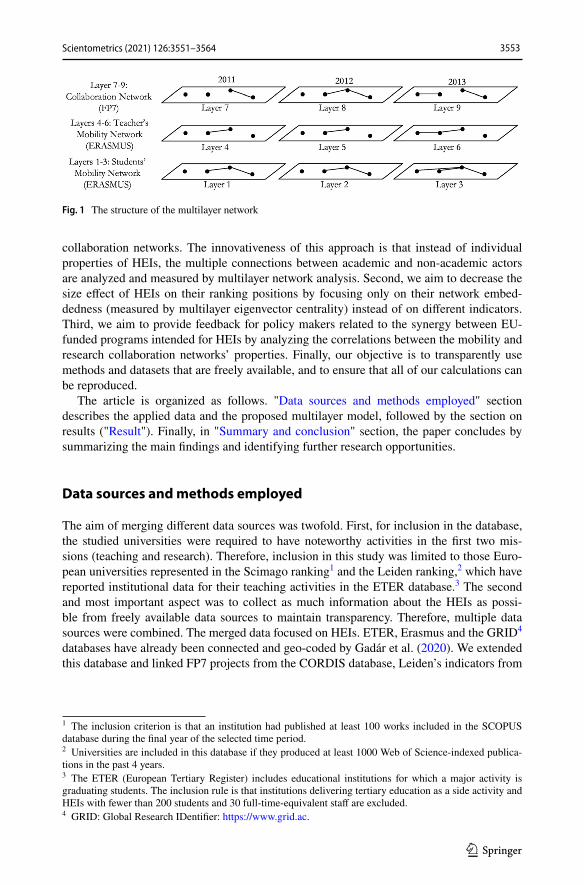
Fig. 1 The structure of the multilayer network
1 The inclusion criterion is that an institution had published at least 100 works included in the SCOPUS database during the final year of the selected time period.2 Universities are included in this database if they produced at least 1000 Web of Science-indexed publica-tions in the past 4 years.3 The ETER (European Tertiary Register) includes educational institutions for which a major activity is graduating students. The inclusion rule is that institutions delivering tertiary education as a side activity and HEIs with fewer than 200 students and 30 full-time-equivalent staff are excluded.4 GRID: Global Research IDentifier: https ://www.grid.ac.
3554 Scientometrics (2021) 126:3551–3564
1 3
the CWTS database5 and the Scimago ranking of HEIs.6 Following entity reasoning, in which the institutions are identified, Erasmus student and teacher mobility networks and FP7 research projects represent one layer each for each studied year in the multilayer struc-ture (see Fig. 1). Further properties, such as collaboration and publication impact (from Leiden’s ranking system), organizational data (from the ETER database), and the number of foreign students, are also assigned to the HEIs. The data sources mentioned above con-tain data related to different universities and cover different time periods. We extracted the data for the 307 European HEIs identified in all of these databases for 2011–2013—the only period for which all data were available.
Mobility networks
To build up the networks related to Erasmus mobility of students and teachers/researchers, we used the EU Open Data Portal,7 which includes data on 1M student and 180k teacher travels among 5267 HEIs in eight subject areas between 2008 and 2014.
The network nodes are the HEIs, and two types of edges are included: student mobility and teacher mobility. The directed edge weights are the number of travels between institu-tions. In this study, only short-term (so-called credit mobility) student and teacher mobility (henceforth, Erasmus database) were analyzed; however, other staff travel and contract net-works could be analyzed in future research.
Research collaboration network
The research collaboration database8 of projects funded under the 7th Framework Pro-gramme (furthermore CORDIS-FP7 database) consists of thirty thousand organizations from EU and non-EU countries and more than twenty thousand projects started between 2007 and 2014. To compare mobility and research collaboration networks, only HEIs from the EU-28 countries are included in our study. However, node (i.e., institutional) prop-erties, such as the number of connections and their partners, are retained. Therefore, we obtain a so-called multilayer group ego network, which contains the studied 307 HEIs and their partners in all layers. The edge weights are the number of earned projects.
Other databases
The European Tertiary Education Register (henceforth the ETER database)9 is used to unify institution names and to compare the proportions of foreign teachers and foreign students out of the number of Erasmus travels. The citation and collaboration data are obtained from Leiden’s ranking database (henceforth the CWTS-LEIDEN database).10 In
7 url: https ://data.europ a.eu/euodp /data/.8 url: https ://data.europ a.eu/euodp /data/datas et/cordi sfp7p rojec ts.9 url: https ://www.eter-proje ct.com/searc h.10 url: http://www.leide nrank ing.com/downl oads.
5 CWTS Leiden database: https ://www.leide nrank ing.com/ranki ng/2019/chart .6 Scimago HEI ranking: https ://www.scima goir.com/ranki ngs.php?secto r=Highe r%20edu c.
3555Scientometrics (2021) 126:3551–3564
1 3
this study, we focused only on the period of 2011–2013 because all data were available only for these three years.
Note that all 307 of the studied HEIs are included in the CWTS Ranking System, are involved in both in the FP7 and the Erasmus programs, and have noteworthy social impact because all of them are in the first tercile of the Scimago Social Impact Rankings of HEIs (2018), which was the earliest ranking related to the third mission of the HEIs.
Data representation
The proposed multilayer network structure consists of 3 × 3 non-interconnected layers. Layers 1–3 and layers 4–6 consist of organizations in Erasmus student and teacher mobility networks, while layers 7–9 consist of the organizations in the FP7 research collaboration network (see Fig. 1). This proposed structure allows researchers to compare the embedded-ness of the HEIs in different networks. Comparing the embeddedness of HEIs in different networks indicates participation interdependencies in parallel EU-funded programs.
The database of the analyzed multilayer networks is separated into three parts.
1. The set of nodes consists of 307 HEIs with all of the properties from the ETER, CWTS-LEIDEN, CORDIS-FP7 and Erasmus databases between 2011 and 2013.
2. The set of edges includes the pairs of nodes and the weights of occurrences. In mobility networks, directed edges specify the direction of travel between the sending and host HEIs, while in research collaboration networks, the edges represent common projects and are directed from the coordinator to the partner HEI.
3. The set of (non-interconnected) layers consists of the Erasmus mobility and FP7 research collaboration networks.
Future research could attach additional layers, such as collaborations on publications and patents.
Methods employed
The merging of multiple databases, such as the ETER, Erasmus, CORDIS, and CWTS-LEIDEN databases, allows researchers to compare and analyze HEIs and their connections, not only with standard statistical methods but also with multilayer analysis techniques, such as multilayer eigenvector centrality.
To analyze synergies between collaboration and mobility and also between publication and collaboration indicators, correlation analysis is applied to explore the relations among the publication, mobility and collaboration activities of European HEIs. In addition, multi-layer centrality detects HEIs, which are embedded in mobility and collaboration networks, and offers size invariant indicators for HEI performance.
3556 Scientometrics (2021) 126:3551–3564
1 3
Formal description of the applied multilayer analysis
A multilayer network is a pair M = (G, C) where G = {G� = (V� ,E�), � ∈ {1,… ,m}} is a family of (directed or undirected, weighted or unweighted) graphs (called layers of M ), where V� is the set of vertices (set of nodes) and E� ⊆ V𝛼 × V𝛼 is the set of edges (links) of graph G� in layer � and
is the set of interconnections between nodes of different layers G� ,G� ∈ M with � ≠ �.In this study, the set of interconnections is not specified; therefore, it is assumed that
C = � . Eigenvector centrality is one of the most common methods used to detect the embeddedness of a node in a graph. The simplest way to calculate eigenvector-like cen-tralities in multilayer networks is to consider the eigenvector centrality c� =
(c[�]
1,… , c[�]
n
)
in each layer 1 ≤ � ≤ m separately, where n is the number of nodes. For a given graph G� ∶= (V� ,E�) with |V�| vertices, let A� = (a
[�]
k[�],l[�]) be the adjacency matrix. The eigenvec-
tor centrality, c[�]k
, and the score of vertex k[�] can be defined as:
where N(k[�]) is a set of the neighbors of k[�] in layer � , and �[�] is a constant.The centrality measure has several important properties, including that the score value
is independent from the node properties, and it depends only on the network’s structure. The eigenvector centrality has additional important properties, e.g., anonymity,11 symme-try,12 positive homogeneity,13 and robustness.14
A numeric centrality measure of each node can be obtained using an aggregation meas-ure (f), such as the sum or the maximum. We used Bonacich -Kleinberg ’s aggregation function because with its additional important properties, such as natural consistency, group scores are obtained from individual scores by summing the scores (Kitti 2016). Therefore, multilayer centrality can be calculated in an aggregated graph G = (V ,E) , where E =
⋃�∈{1,…,m} E� and V = f (V�) . Because of the properties of eigenvector centrality, in
cases of non-interconnected, multilayer networks, varying network sizes in the layers does not affect or bias the scoring.
Results
The results show how to analyze the embeddedness of universities in a multilayer network and how we can rank these universities by their embeddedness.
(1)C = {E𝛼,𝛽 ⊆ V𝛼 × V𝛽 , 𝛼, 𝛽 ∈ {1,… ,m}, 𝛼 ≠ 𝛽}
(2)c[�]
k=
1
�[�]
∑
l[�]∈N(k[�])
c[�]
l[�]=
1
�[�]
∑
l[�]∈G�
a[�]
k[�],l[�]c[�]
l[�]
11 Scores of nodes are unaffected by the way in which they are labeled.12 Symmetric nodes receive the same score.13 Homogeneity is not the scale according to which the strength of the relations is measured that would affect the scores.14 Invariance after adding an average node.
3557Scientometrics (2021) 126:3551–3564
1 3
Descriptive statistics of the explored multilayer network
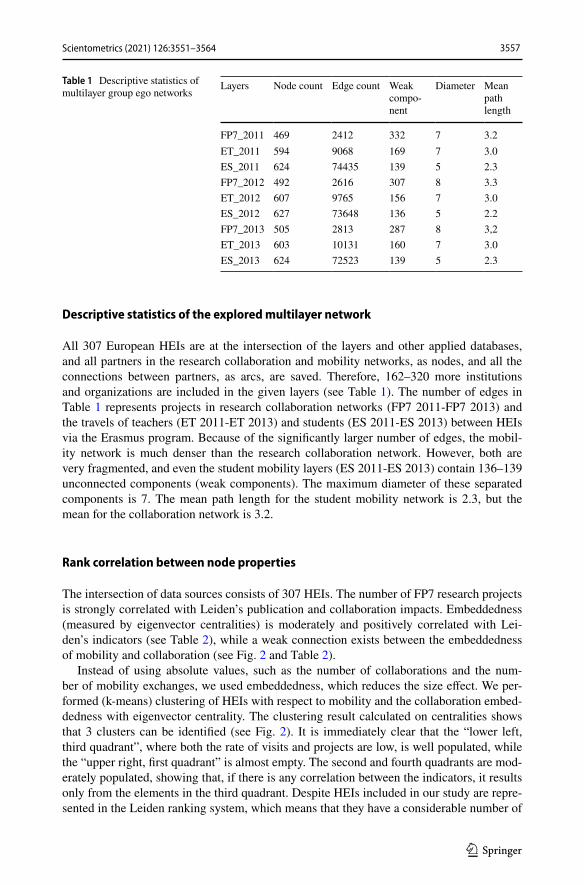
All 307 European HEIs are at the intersection of the layers and other applied databases, and all partners in the research collaboration and mobility networks, as nodes, and all the connections between partners, as arcs, are saved. Therefore, 162–320 more institutions and organizations are included in the given layers (see Table 1). The number of edges in Table 1 represents projects in research collaboration networks (FP7 2011-FP7 2013) and the travels of teachers (ET 2011-ET 2013) and students (ES 2011-ES 2013) between HEIs via the Erasmus program. Because of the significantly larger number of edges, the mobil-ity network is much denser than the research collaboration network. However, both are very fragmented, and even the student mobility layers (ES 2011-ES 2013) contain 136–139 unconnected components (weak components). The maximum diameter of these separated components is 7. The mean path length for the student mobility network is 2.3, but the mean for the collaboration network is 3.2.
Rank correlation between node properties
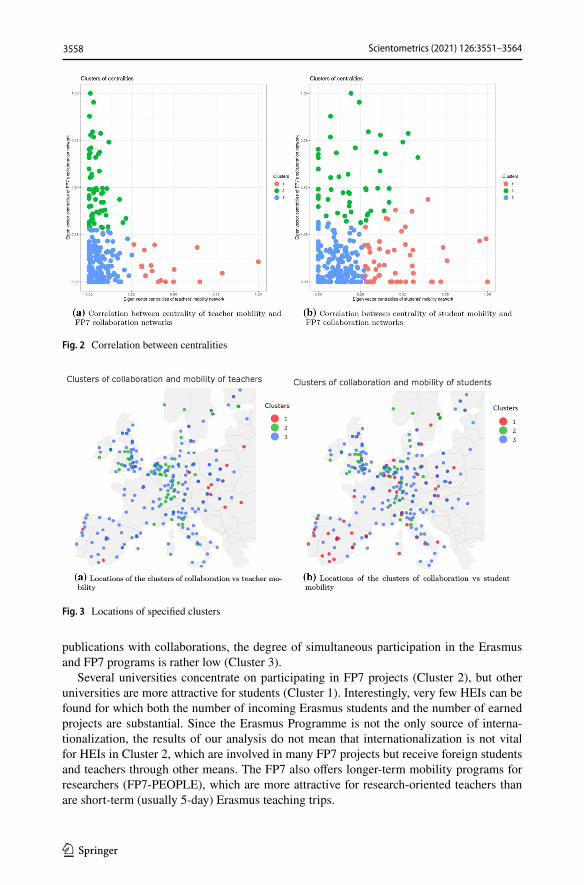
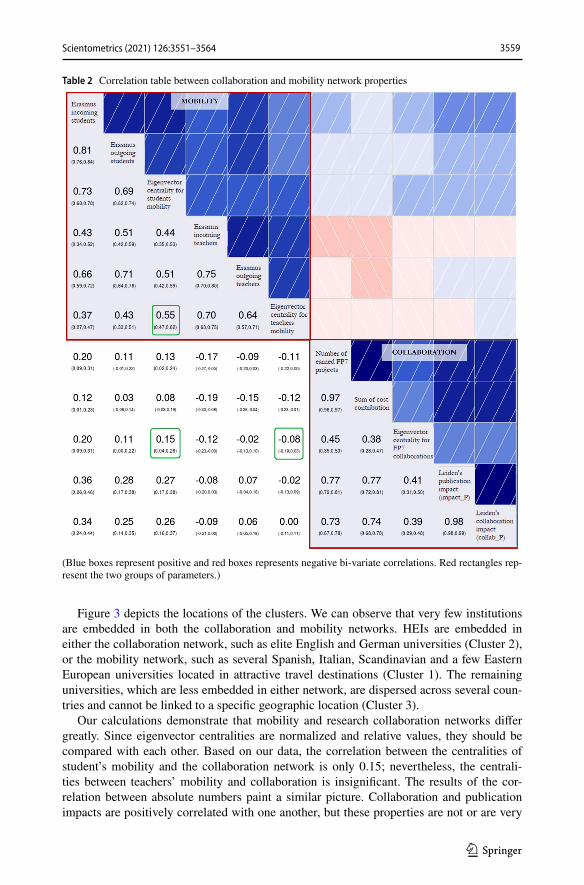
The intersection of data sources consists of 307 HEIs. The number of FP7 research projects is strongly correlated with Leiden’s publication and collaboration impacts. Embeddedness (measured by eigenvector centralities) is moderately and positively correlated with Lei-den’s indicators (see Table 2), while a weak connection exists between the embeddedness of mobility and collaboration (see Fig. 2 and Table 2).
Instead of using absolute values, such as the number of collaborations and the num-ber of mobility exchanges, we used embeddedness, which reduces the size effect. We per-formed (k-means) clustering of HEIs with respect to mobility and the collaboration embed-dedness with eigenvector centrality. The clustering result calculated on centralities shows that 3 clusters can be identified (see Fig. 2). It is immediately clear that the “lower left, third quadrant”, where both the rate of visits and projects are low, is well populated, while the “upper right, first quadrant” is almost empty. The second and fourth quadrants are mod-erately populated, showing that, if there is any correlation between the indicators, it results only from the elements in the third quadrant. Despite HEIs included in our study are repre-sented in the Leiden ranking system, which means that they have a considerable number of
Table 1 Descriptive statistics of multilayer group ego networks
Layers Node count Edge count Weak compo-nent
Diameter Mean path length
FP7_2011 469 2412 332 7 3.2ET_2011 594 9068 169 7 3.0ES_2011 624 74435 139 5 2.3FP7_2012 492 2616 307 8 3.3ET_2012 607 9765 156 7 3.0ES_2012 627 73648 136 5 2.2FP7_2013 505 2813 287 8 3,2ET_2013 603 10131 160 7 3.0ES_2013 624 72523 139 5 2.3
3558 Scientometrics (2021) 126:3551–3564
1 3
publications with collaborations, the degree of simultaneous participation in the Erasmus and FP7 programs is rather low (Cluster 3).
Several universities concentrate on participating in FP7 projects (Cluster 2), but other universities are more attractive for students (Cluster 1). Interestingly, very few HEIs can be found for which both the number of incoming Erasmus students and the number of earned projects are substantial. Since the Erasmus Programme is not the only source of interna-tionalization, the results of our analysis do not mean that internationalization is not vital for HEIs in Cluster 2, which are involved in many FP7 projects but receive foreign students and teachers through other means. The FP7 also offers longer-term mobility programs for researchers (FP7-PEOPLE), which are more attractive for research-oriented teachers than are short-term (usually 5-day) Erasmus teaching trips.
Fig. 2 Correlation between centralities
Fig. 3 Locations of specified clusters
3559Scientometrics (2021) 126:3551–3564
1 3
Figure 3 depicts the locations of the clusters. We can observe that very few institutions are embedded in both the collaboration and mobility networks. HEIs are embedded in either the collaboration network, such as elite English and German universities (Cluster 2), or the mobility network, such as several Spanish, Italian, Scandinavian and a few Eastern European universities located in attractive travel destinations (Cluster 1). The remaining universities, which are less embedded in either network, are dispersed across several coun-tries and cannot be linked to a specific geographic location (Cluster 3).
Our calculations demonstrate that mobility and research collaboration networks differ greatly. Since eigenvector centralities are normalized and relative values, they should be compared with each other. Based on our data, the correlation between the centralities of student’s mobility and the collaboration network is only 0.15; nevertheless, the centrali-ties between teachers’ mobility and collaboration is insignificant. The results of the cor-relation between absolute numbers paint a similar picture. Collaboration and publication impacts are positively correlated with one another, but these properties are not or are very
Table 2 Correlation table between collaboration and mobility network properties
(Blue boxes represent positive and red boxes represents negative bi-variate correlations. Red rectangles rep-resent the two groups of parameters.)
3560 Scientometrics (2021) 126:3551–3564
1 3
weakly correlated with mobility parameters, such as indegree (number of incoming teach-ers/students), outdegree (number of outgoing teachers/students) or embeddedness (eigen-vector centralities). There is a strong, positive correlation (see dark blue boxes in Table 2) between collaboration properties, such as Leiden’s rankings of collaborated publications, and embeddedness in a collaboration network (measured by eigenvector centrality) (see Table 2).
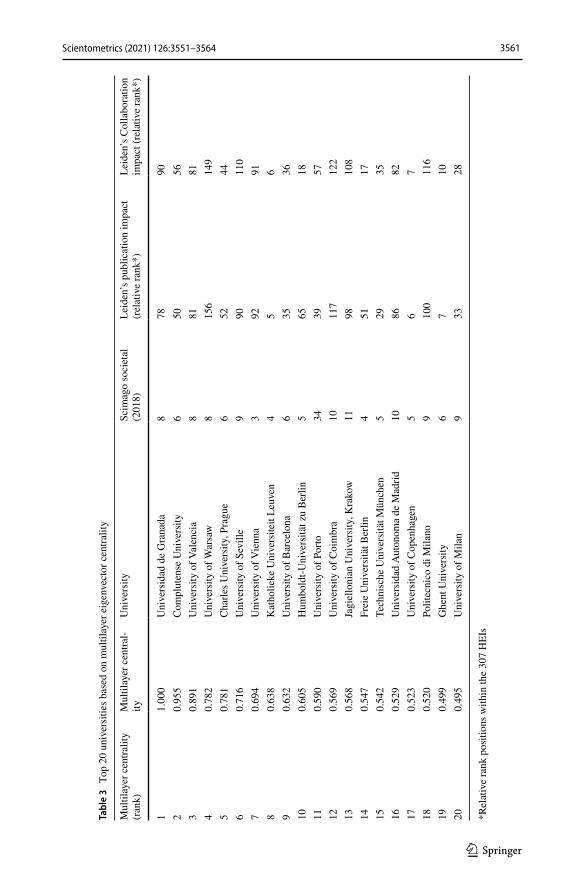
The proposed aggregated (multilayer) centrality strongly correlates with mobility net-works’ centrality and weakly correlates with publication impacts, rather constituting a property of research (the second mission of universities). The eigenvector centrality of the multilayer network allows us to specify new rankings based on the embeddedness of the multilayer network. Table 3) displays the rankings of the top 20 universities by their embeddedness in research collaboration and mobility networks.
Summary and conclusion
The study presents a method for assessing universities’ performance from a new perspec-tive (i.e., embeddedness in mobility and collaboration networks) using existing, freely available data and social network analysis tools.
Our paper contributes to the relevant literature in various ways. To the best of our knowledge, this study is the first investigating universities’ performance using a network-based approach. Evidence from the scientific literature has shown that participation in col-laboration networks fosters the fulfilment of HEIs’ core missions; thus, measuring their networking capacity (as we call it: embeddedness in collaboration networks) could reveal new aspects related to overall HEI performance. To test the proposed ranking method, we used data regarding the beneficiaries of the EU-funded Erasmus and the FP7 programs, both of which are based on collaboration with other academic and non-academic actors. Embeddedness in Erasmus mobility networks is primarily a measure of the universities’ first mission (education), and embeddedness in the FP7 network is mainly a measure of the second mission (research). However, both measures relate to the universities’ third mission, as strong embeddedness in these networks implies high engagement of the respective HEI in interaction, cooperation and knowledge diffusion. In particular, studying multilayer net-works, such as for mobility and scientific project collaboration, can provide new insights into the patterns and consequences of students’ and teachers’ activities.
Second, we propose a multilayer eigenvector centrality method that offers a size-invari-ant indicator, which characterizes HEIs’ embeddedness.
Third, our results are policy relevant. By analyzing the correlation between mobility and research collaboration networks, we found that Erasmus mobility does not have a substantial effect on scientific and FP7 project collaborations. While the FP7 and Eras-mus program aims are closely connected—they both are intended to support the EU in becoming a world-leading knowledge-based society and foster transnational cooperation (European Union 2006a, b)—the dynamics of the mobility and research collaboration net-works differ. This difference is already partly reflected in the networks’ descriptive analysis since the fragmentation of the two networks, the number of nodes (i.e., partners) and the number of edges also differ. Nevertheless, only multilayer analysis of the group ego net-works can reveal the differences that embeddedness highlights for the investigated univer-sities. We found complementarity, but not synergy, between the Erasmus and the FP7 pro-grams, although we would expect mobility, especially teacher mobility, to lead to research
3561Scientometrics (2021) 126:3551–3564
1 3
Tabl
e 3
Top
20
univ
ersi
ties b
ased
on
mul
tilay
er e
igen
vect
or c
entra
lity
*Rel
ativ
e ra
nk p
ositi
ons w
ithin
the
307
HEI
s
Mul
tilay
er c
entra
lity
(ran
k)M
ultil
ayer
cen
tral-
ityU
nive
rsity
Scim
ago
soci
etal
(2
018)
Leid
en’s
pub
licat
ion
impa
ct
(rel
ativ
e ra
nk*)
Leid
en’s
Col
labo
ratio
n im
pact
(rel
ativ
e ra
nk*)
11.
000
Uni
vers
idad
de
Gra
nada
878
902
0.95
5C
ompl
uten
se U
nive
rsity
650
563
0.89
1U
nive
rsity
of V
alen
cia
881
814
0.78
2U
nive
rsity
of W
arsa
w8
156
149
50.
781
Cha
rles U
nive
rsity
, Pra
gue
652
446
0.71
6U
nive
rsity
of S
evill
e9
9011
07
0.69
4U
nive
rsity
of V
ienn
a3
9291
80.
638
Kat
holie
ke U
nive
rsite
it Le
uven
45
69
0.63
2U
nive
rsity
of B
arce
lona
635
3610
0.60
5H
umbo
ldt-U
nive
rsitä
t zu
Ber
lin5
6518
110.
590
Uni
vers
ity o
f Por
to34
3957
120.
569
Uni
vers
ity o
f Coi
mbr
a10
117
122
130.
568
Jagi
ello
nian
Uni
vers
ity, K
rako
w11
9810
814
0.54
7Fr
eie
Uni
vers
ität B
erlin
451
1715
0.54
2Te
chni
sche
Uni
vers
ität M
ünch
en5
2935
160.
529
Uni
vers
idad
Aut
onom
a de
Mad
rid10
8682
170.
523
Uni
vers
ity o
f Cop
enha
gen
56
718
0.52
0Po
litec
nico
di M
ilano
910
011
619
0.49
9G
hent
Uni
vers
ity6
710
200.
495
Uni
vers
ity o
f Mila
n9
3328
3562 Scientometrics (2021) 126:3551–3564
1 3
collaboration. If the EU wishes to increase synergy between its mobility and research col-laboration programs, it should also consider longer-term Erasmus mobility, which would encourage the establishment of international research teams. Comparing mobility and col-laboration network embeddedness with scientific impact demonstrates to policy makers that these programs’ use should have a mutually reinforcing effect, leading to increased synergy between these programs.
Finally, the proposed method and the data used are freely available and transparent; therefore, all of the calculations can be reproduced.
The authors argue that social impacts should not be measured without considering social network properties. The proposed multilayer network approach enables the integra-tion of further networks (i.e., patents obtained by university-industry consortia), thus open-ing up opportunities for a more comprehensive assessment of universities’ performance in achieving their core missions.
Acknowledgements This publication was supported by the European Union and Hungary and co-financed by the European Social Fund through the Project EFOP-3.6.2-16-2017-00017, titled “Sustainable, intelli-gent and inclusive regional and city models” and by the TKP2020-NKA-10 project financed under the 2020-4.1.1-TKP2020 Thematic Excellence Programme by the National Research, Development and Innovation Fund of Hungary. The authors would like to thank Professor András Telcs, Professor Mihály Görög and Dr. László Gadár for their valuable advice as well as Edina Gyilai, Dénes Kiss, Tünde Király, Marcell Kurbucz and Zoltán Módos for their help in collecting data.
Open Access This article is licensed under a Creative Commons Attribution 4.0 International License, which permits use, sharing, adaptation, distribution and reproduction in any medium or format, as long as you give appropriate credit to the original author(s) and the source, provide a link to the Creative Com-mons licence, and indicate if changes were made. The images or other third party material in this article are included in the article’s Creative Commons licence, unless indicated otherwise in a credit line to the material. If material is not included in the article’s Creative Commons licence and your intended use is not permitted by statutory regulation or exceeds the permitted use, you will need to obtain permission directly from the copyright holder. To view a copy of this licence, visit http://creat iveco mmons .org/licen ses/by/4.0/.
References
Adler, N. J., & Harzing, A.-W. (2009). When knowledge wins: Transcending the sense and nonsense of aca-demic rankings. Academy of Management Learning & Education, 8(1), 72–95.
Ayoubi, C., Pezzoni, M., & Visentin, F., et al. (2019). Does it pay to do novel science? The selectivity pat-terns in science funding. UNU-MERIT Working Paper Series, 2019 (037).
Azoulay, P., Stuart, T., & Wang, Y. (2014). Matthew: Effect or fable? Management Science, 60(1), 92–109.Bol, T., de Vaan, M., & van de Rijt, A. (2018). The Matthew effect in science funding. Proceedings of the
National Academy of Sciences, 115(19), 4887–4890.Bölling, M., & Eriksson, Y. (2016). Collaboration with society: The future role of universities? Identifying
challenges for evaluation. Research Evaluation, 25(2), 209–218.Bonacich, P. (1991). Simultaneous group and individual centralities. Social Networks, 13(2), 155–168.Çakır, M. P., Acartürk, C., Alaşehir, O., & Çilingir, C. (2015). A comparative analysis of global and national
university ranking systems. Scientometrics, 103(3), 813–848.de Wit, K. (2010). The networked university: The structure, culture, and policy of universities in a changing
environment. Tertiary Education and Management, 16(1), 1–14.Degl’Innocenti, M., Matousek, R., & Tzeremes, N. G. (2019). The interconnections of academic research
and universities’“third mission”: Evidence from the uk. Research Policy, 48(9), 103793.Dill, D. D., & Soo, M. (2005). Academic quality, league tables, and public policy: A cross-national analysis
of university ranking systems. Higher Education, 49(4), 495–533.Dolowitz, D. P., & Marsh, D. (2000). Learning from abroad: The role of policy transfer in contemporary
policy-making. Governance, 13(1), 5–23.EU. (2013). European Union budget 2013 Financial Report url: https ://ec.europ a.eu/budge t/finan cialr eport
/2013/lib/finan cial_repor t_2013_en.pdf.
3563Scientometrics (2021) 126:3551–3564
1 3
European Commission. (2011). Communication from the commission to the European parliament, the coun-cil, the European economic and social committee and the committee of the regions supporting growth and jobs—an agenda for the modernisation of Europe’s higher education systems.
European Economic Community. (1983). Council resolution of 25 July 1983 on framework programmes for community research, development and demonstration activities and a first framework programme 1984 to 1987.
European Economic Community. (1987). 87/327/eec: Council decision of 15 June 1987 adopting the euro-pean community action scheme for the mobility of university students (erasmus).
European Union. (2006a). Decision no. 1720/2006/ec of the European parliament and of the council of 15 November 2006 establishing an action programme in the field of lifelong learning.
European Union. (2006b). Decision no. 1982/2006/ec of the european parliament and of the council of 18 December 2006 concerning the seventh framework programme of the European community for research, technological development and demonstration activities (2007–2013).
Gadár, L., Kosztyán, Z. T., Telcs, A., & Abonyi, J. (2020). A multilayer and spatial description of the eras-mus mobility network. Scientific Data, 7(1), 41.
Geisler, E. (1995). Industry-university technology cooperation: A theory of inter-organizational relation-ships. Technology Analysis & Strategic Management, 7(2), 217–229.
Janger, J., Schubert, T., Andries, P., Rammer, C., & Hoskens, M. (2017). The eu 2020 innovation indicator: A step forward in measuring innovation outputs and outcomes? Research Policy, 46(1), 30–42.
Kenney, M., & Goe, W. R. (2004). The role of social embeddedness in professorial entrepreneurship: A comparison of electrical engineering and computer science at uc berkeley and stanford. Research Pol-icy, 33(5), 691–707.
Kitti, M. (2016). Axioms for centrality scoring with principal eigenvectors. Social Choice and Welfare, 46(3), 639–653.
Kleinberg, J. M. (1999). Authoritative sources in a hyperlinked environment. Journal of the ACM (JACM), 46(5), 604–632.
Kosztyán, Z. T., Banász, Z., Csányi, V. V., & Telcs, A. (2019). Rankings or leagues or rankings on leagues? Ranking in fair reference groups. Tertiary Education and Management, 25(4), 289–310.
Molas-Gallart, J., & Castro-Martínez, E. (2007). Ambiguity and conflict in the development of ‘Third Mis-sion’ indicators. Research Evaluation, 16(4), 321–330.
OECD. (1998). University research in trans, Paris.OECD. (2007). Higher education and regions: Globally competitive, locally engaged, Paris.Olcay, G. A., & Bulu, M. (2017). Is measuring the knowledge creation of universities possible? A review of
university rankings. Technological Forecasting and Social Change, 123, 153–160.Perkmann, M., Tartari, V., McKelvey, M., Autio, E., Broström, A., D’Este, P., et al. (2013). Academic
engagement and commercialisation: A review of the literature on university-industry relations. Research Policy, 42(2), 423–442.
Ramos-Vielba, I., Fernández-Esquinas, M., & Espinosa-de-los Monteros, E. (2010). Measuring university-industry collaboration in a regional innovation system. Scientometrics, 84(3), 649–667.
Rauhvargers, A. (2011). Global university rankings and their impact. European University Association Brussels.
Riviezzo, A., Napolitano, M. R., & Fusco, F. (2020). Along the pathway of university missions: A system-atic literature review of performance indicators. In Examining the role of entrepreneurial universities in regional development, pp. 24–50. IGI Global.
Saisana, M., d’Hombres, B., & Saltelli, A. (2011). Rickety numbers: Volatility of university rankings and policy implications. Research Policy, 40(1), 165–177.
Sánchez-Barrioluengo, M. (2014). Articulating the ‘three-missions’ in spanish universities. Research Policy, 43(10), 1760–1773.
Scandura, A. (2016). University-industry collaboration and firms’ r&d effort. Research Policy, 45(9), 1907–1922.
Szücs, F. (2018). Research subsidies, industry-university cooperation and innovation. Research Policy, 47(7), 1256–1266.
Teichler, U. (2011). Social contexts and systemic consequence of university rankings: A meta-analysis of the ranking literature. In University rankings, pp. 55–69. Springer.
Thomson, A. M., Perry, J. L., & Miller, T. K. (2009). Conceptualizing and measuring collaboration. Journal of Public Administration Research and Theory, 19(1), 23–56.
Thune, T. (2007). University-industry collaboration: The network embeddedness approach. Science and Public Policy, 34(3), 158–168.
Van Raan, A. F. (2005). Fatal attraction: Conceptual and methodological problems in the ranking of univer-sities by bibliometric methods. Scientometrics, 62(1), 133–143.
3564 Scientometrics (2021) 126:3551–3564
1 3
Authors and Affiliations
Zsolt Tibor Kosztyán1,5,6 · Beáta Fehérvölgyi2 · Tibor Csizmadia3 · Kinga Kerekes4
Beáta Fehérvölgyi [email protected]
Tibor Csizmadia [email protected]
Kinga Kerekes [email protected]
1 Department of Quantitative Methods, Institute of Management, Faculty of Business and Economics, University of Pannonia, Hungary, Egyetem str. 10, Veszprém 8200, Hungary
2 Department of Tourism, Institute of Business, Faculty of Business and Economics, University of Pannonia, Hungary, Egyetem str. 10, Veszprém 8200, Hungary
3 Department of Management, Institute of Management, Faculty of Business and Economics, University of Pannonia, Egyetem str. 10, Veszprém 8200, Hungary
4 Faculty of Economics and Business Administration, Babes-Bolyai University, Teodor Mihali str. 58-60, 400591 Cluj-Napoca, Romania
5 MTA-PE Budapest Ranking Research Group, Hungary, Piarista str. 4, Budapest 1052, Hungary6 Institute od Advanced Studies, Kőszeg (iASK), Hungary, Charnel str. 6, Kőszeg 9730, Hungary