Investigating Bacterial Community Response During Discolouration …/file/C… ·  ·...

1
Investigating Bacterial Community Response During Discolouration Events in an Experimental Water Distribution System Cindy J. Smith*, Rebecca L. Sharpe and Joby B. Boxall Pennine Water Group, Department of Civil and Structural Engineering, Sir Frederick Mappin Building, Mappin Street, University of Sheffield, Sheffield, S1 3JD, UK. *Email: [email protected] INTRODUCTION Discolouration of potable water, due to fine insoluble particles, is a major cause for customer contacts to water companies. Within water distribution systems (WDS) particulate material accumulates on pipe walls. The stability and amount of material within these layers is known to be influenced by the maximum shear stress exerted by daily flow profile but the processes and mechanisms explicitly involved are poorly understood. Mobilisation of material into the bulk water occurs when the shear stress exceeds the conditioning values (Fig. 1). Whilst discolouration is predominantly an aesthetic issue association with microbiological content has been made. Biofilm microbiological loads are known to be significant within WDS. It seems likely that microbial biofilms may be important in understanding causes and consequences of discolouration. The internationally unique temperature controlled piperig test facility at the University of Sheffield (Fig. 2) can be used to bridge the gap between field and bench scale studies by simulating field conditions in a controlled laboratory setting to determine the underpinning factors that contribute to discolouration and the role biofilm microorganisms play. Biofilm microbial cells EPS water flow Fe & Mn . Biofilm microbial cells pipe wall EPS water flow Fe & Mn . Fig. 1. Increased shear stress (right to left) above the daily conditioning shear resulting in discolouration of drinking water as material associated with the pipe wall is mobilised. Loop 1 Loop 2 Loop 3 4m 9m 52 coupons per loop Fig. 2. The temperature controlled pipe loop test facility at the University of Sheffield. Excerpt the Pennine Water Group coupon (Deines et al., 2010), 52 coupons are inserted along the length of each loop to facilitate examination of the pipewall biofilm. AIM To examine the response of WDS bacterial communities to an experimental discolouration event using the internationally unique pipeloop test facility at the University of Sheffield (Fig. 2). OBJECTIVES 1: To test the hypothesis that biofilm stability is influenced by the maximum conditioning shear stress of the water flowing through it. 2: Determine the affect of incremental shear stress flushing steps on biofilm bacterial community structure conditioned at three different shear stresses. METHODS Pipe wall material was developed in each loop for 28 days at 8°C using the following constant shear stress; Loop 1 low 0.11 N/m 2 , Loop 2 medium 0.22 N/m 2 & Loop 3 high – 0.44 N/m 2 . After 28 days, each loop was individually flushed according to figure 3. Each flushing step was conducted for three turnovers of water. Turbidity changes in the bulk water were continuously measured and water samples were collected for DAPI and Mn analysis after one turnover. 5 coupons were Shear stress (N/m²) coupon removal 0.44 0.96 1.1 1.65 2.2 0.66 Fig. 3: Schematic of incremental shear stress applied to each loop. Star indicates coupon removal. taken from each loop before and after the flushing event. Biofilm was removed from the coupons using a nylon brush as described by Deines et al., 2010, filtered and DNA was extracted. TRFLP was conducted using F63FAM & R518 primer set, followed by individual digest with CfoI and AluI. TRFLP profiles were aligned using TAlign (Smith et al., 2005) and subsequently analysed using a BrayCurtis similarity matrix in PRIMER6. QPCR was conducted using the primer set F1369 & R1492 with TaqMan probe 1389 according to Smith et al., 2006. SUMMARY 1: Loop 1, conditioned during the 28 day growth phase at the lowest shear stress (0.11 N/m2) resulted in the greatest amount of material associated with the pipewall is released into the bulk water as evidenced by the highest turbidity, Mn and DAPI cell counts of the three loops (Fig. 1). The increase in DAPI count cell numbers indicates that biological material is released into the bulk water during a discolouration event. 2: Neither the diverse bacterial community structure nor 16S rRNA gene copy numbers on the pipewall of the three loops varied significantly between loops or after the flushing event. In conclusion, pipewall material was mobilisied into the bulk water during the experimental discolouration event, the amount mobilised was influenced by the daily conditioning shear. Neither the conditioning shear stress or the incremental shear stress applied during the flushing altered the pipewall bacterial community structure. RESULTS Coupon Postflush Similarity (%) 50 60 Transform: Square root Resemblance: S17 Bray Curtis similarity 2D Stress: 0.08 A: Loop 1 Transform: Square root Resemblance: S17 Bray Curtis similarity 2D Stress: 0.07 B : Loop 2 Transform: Square root Resemblance: S17 Bray Curtis similarity 2D Stress: 0.07 C: Loop 3 Transform: Square root Resemblance: S17 Bray Curtis similarity Loop 1 2 3 B B B B B A A A A B B B B B A A A A B B B B A A A A A 2D Stress: 0.16 Sample B = Preflush A = Postflush D: All Loops Coupon Preflush References: Deines et al., 2010 Appl. Microbiol.Biotechnol. 87: 749 746; Smith et al., 2005 FEMS Microbiol. Ecol. 54: 375380; Smith et al., 2006 Environ. Microbiol. 8: 804 815. Fig. 5: (AC) MDS analysis of TRFLP data from loop 1, 2 & 3 respectively and (D) combined TRFLP data from all 3 loops before & after flushing. ANOSIM analysis did not show any statistical difference in community structure before and after the flushing event for any loop. Results 2: Pipewall bacterial community structure preand postflushing. Results 3: Quantitative changes in 16S rRNA gene copy numbers from pipe wall preand postflushing. Results 1: Mobilistation of pipe wall material into bulk water during flushing event Fig. 6: 16S rRNA gene copy numbers per mm 2 of pipe wall, quantified preand postflushing for each loop. No statistical difference in gene copy numbers preand postflushing was observed for any of the three loops (P < 0.05). L1 Pre L1 Post L2 Pre L2 Post L3 Pre L3 Post 0 2.0× 10 6 4.0× 10 6 6.0× 10 6 P =0.2139 P =0.9863 P =0.7351 Low Medium High 16S rRNA genes mm 2 B. Manganese A. Turbidity Fig. 4: Normalised increase in A) tubidity, B) manganese and C) DAPI cell counts in the bulk water after each flushing step for loop 1, 2 and 3. C. DAPI Cell counts Shear stress (N/m 2 ) Turbidity (NTU) Shear stress (N/m 2 ) Shear stress (N/m 2 ) Mn (μg/l) Cells/ml

Transcript of Investigating Bacterial Community Response During Discolouration …/file/C… ·  ·...

Investigating Bacterial Community Response During Discolouration Events in an Experimental Water Distribution SystemCindy J. Smith*, Rebecca L. Sharpe and Joby B. Boxall

Pennine Water Group, Department of Civil and Structural Engineering, Sir Frederick Mappin Building, Mappin Street, University of Sheffield, Sheffield, S1 3JD, UK.*E‐mail: [email protected]
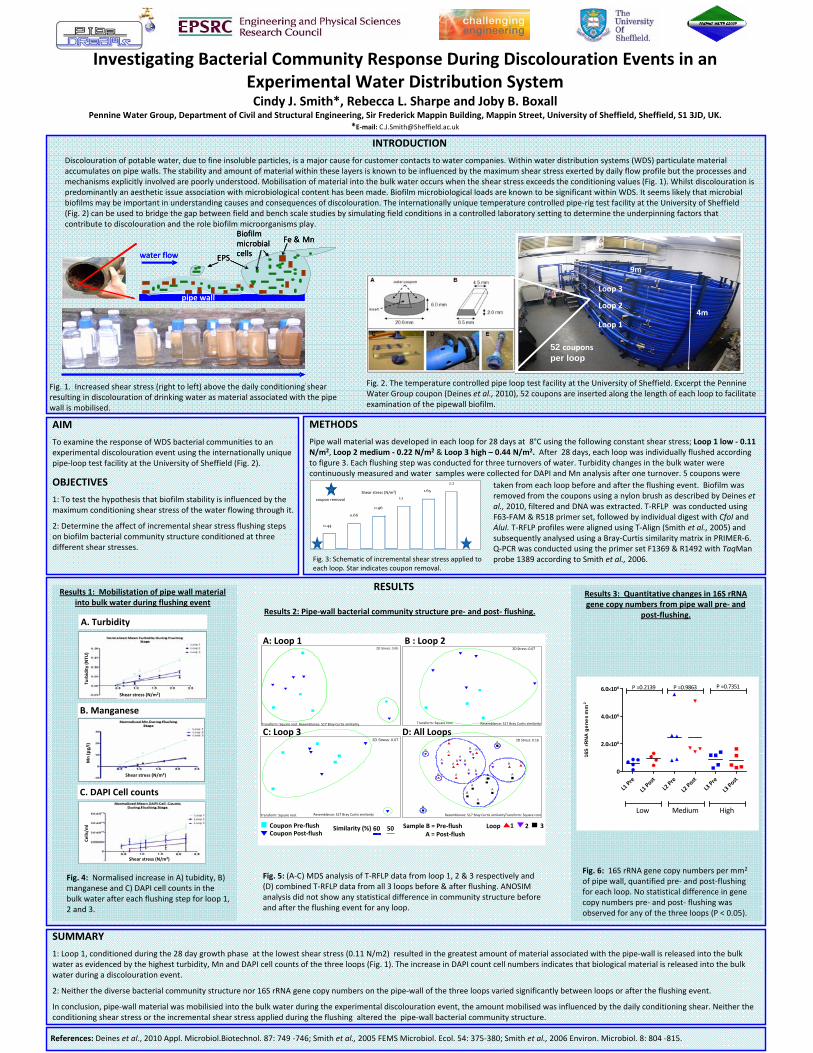
INTRODUCTION

Discolouration of potable water, due to fine insoluble particles, is a major cause for customer contacts to water companies. Within water distribution systems (WDS) particulate material accumulates on pipe walls. The stability and amount of material within these layers is known to be influenced by the maximum shear stress exerted by daily flow profile but the processes and mechanisms explicitly involved are poorly understood. Mobilisation of material into the bulk water occurs when the shear stress exceeds the conditioning values (Fig. 1). Whilst discolouration is predominantly an aesthetic issue association with microbiological content has been made. Biofilm microbiological loads are known to be significant within WDS. It seems likely that microbial biofilms may be important in understanding causes and consequences of discolouration. The internationally unique temperature controlled pipe‐rig test facility at the University of Sheffield (Fig. 2) can be used to bridge the gap between field and bench scale studies by simulating field conditions in a controlled laboratory setting to determine the underpinning factors that contribute to discolouration and the role biofilm microorganisms play.

Biofilm microbial cells

pipe wall

EPSwater flow

Fe & Mn

.

Biofilm microbial cells

pipe wall

EPSwater flow

Fe & Mn

.Fig. 1.  Increased shear stress (right to left) above the daily conditioning shear resulting in discolouration of drinking water as material associated with the pipe wall is mobilised.

Loop 1

Loop 2

Loop 3

4m

9m

52 couponsper loop

Fig. 2. The temperature controlled pipe loop test facility at the University of Sheffield. Excerpt the PennineWater Group coupon (Deines et al., 2010), 52 coupons are inserted along the length of each loop to facilitate examination of the pipewall biofilm. 

AIM

To examine the response of WDS bacterial communities to an experimental discolouration event using the internationally unique pipe‐loop test facility at the University of Sheffield (Fig. 2).

OBJECTIVES

1: To test the hypothesis that biofilm stability is influenced by the maximum conditioning shear stress of the water flowing through it. 

2: Determine the affect of incremental shear stress flushing steps on biofilm bacterial community structure conditioned at three different shear stresses. 

METHODS

Pipe wall material was developed in each loop for 28 days at  8°C using the following constant shear stress; Loop 1 low ‐ 0.11 N/m2, Loop 2 medium ‐ 0.22 N/m2 & Loop 3 high – 0.44 N/m2. After  28 days, each loop was individually flushed according to figure 3. Each flushing step was conducted for three turnovers of water. Turbidity changes in the bulk water were continuously measured and water  samples were collected for DAPI and Mn analysis after one turnover. 5 coupons were

Shear stress (N/m²)

coupon removal

0.44

0.96

1.1

1.65

2.2

0.66

Fig. 3: Schematic of incremental shear stress applied to each loop. Star indicates coupon removal.

taken from each loop before and after the flushing event.  Biofilm was removed from the coupons using a nylon brush as described by Deines et al., 2010, filtered and DNA was extracted. T‐RFLP  was conducted using F63‐FAM & R518 primer set, followed by individual digest with CfoI and AluI. T‐RFLP profiles were aligned using T‐Align (Smith et al., 2005) and subsequently analysed using a Bray‐Curtis similarity matrix in PRIMER‐6. Q‐PCR was conducted using the primer set F1369 & R1492 with TaqManprobe 1389 according to Smith et al., 2006. 

SUMMARY

1: Loop 1, conditioned during the 28 day growth phase  at the lowest shear stress (0.11 N/m2)  resulted in the greatest amount of material associated with the pipe‐wall is released into the bulk water as evidenced by the highest turbidity, Mn and DAPI cell counts of the three loops (Fig. 1). The increase in DAPI count cell numbers indicates that biological material is released into the bulk water during a discolouration event.

2: Neither the diverse bacterial community structure nor 16S rRNA gene copy numbers on the pipe‐wall of the three loops varied significantly between loops or after the flushing event. 

In conclusion, pipe‐wall material was mobilisied into the bulk water during the experimental discolouration event, the amount mobilised was influenced by the daily conditioning shear. Neither the conditioning shear stress or the incremental shear stress applied during the flushing  altered the  pipe‐wall bacterial community structure.

RESULTS

Coupon Post‐flushSimilarity (%) 5060

Transform: Square root Resemblance: S17 Bray Curtis similarity

2D Stress: 0.08

A: Loop 1

Transform: Square root Resemblance: S17 Bray Curtis similarity

2D Stress: 0.07

B : Loop 2

Transform: Square root Resemblance: S17 Bray Curtis similarity

2D Stress: 0.07C: Loop 3

Transform: Square rootResemblance: S17 Bray Curtis similarity

Loop 1 2 3

B

B

B

B

B

A

A

AA

B

B

B

B

BA

A

AA

B

B

B

B

A

A

A

A

A 2D Stress: 0.16

Sample B = Pre‐flushA = Post‐flush

D: All Loops

Coupon Pre‐flush

References: Deines et al., 2010 Appl. Microbiol.Biotechnol. 87: 749 ‐746; Smith et al., 2005 FEMS Microbiol. Ecol. 54: 375‐380; Smith et al., 2006 Environ. Microbiol. 8: 804 ‐815.

Fig. 5: (A‐C) MDS analysis of T‐RFLP data from loop 1, 2 & 3 respectively and                (D) combined T‐RFLP data from all 3 loops before & after flushing. ANOSIM analysis did not show any statistical difference in community structure before and after the flushing event for any loop.

Results 2: Pipe‐wall bacterial community structure pre‐ and post‐ flushing.

Results 3:  Quantitative changes in 16S rRNA gene copy numbers from pipe wall pre‐ and 

post‐flushing.

Results 1:  Mobilistation of pipe wall material into bulk water during flushing event

Fig. 6: 16S rRNA gene copy numbers per mm2

of pipe wall, quantified pre‐ and post‐flushing for each loop. No statistical difference in gene copy numbers pre‐ and post‐ flushing was observed for any of the three loops (P < 0.05).

L1 Pre

L1 Post

L2 Pre

L2 Post

L3 Pre

L3 Post

0

2.0×10⁶

4.0×10⁶

6.0×10⁶ P =0.2139 P =0.9863 P =0.7351

Low Medium High

16S

rR

NA

gen

es m

m2

B. Manganese 

A. Turbidity

Fig. 4: Normalised increase in A) tubidity, B) manganese and C) DAPI cell counts in the bulk water after each flushing step for loop 1, 2 and 3.

C. DAPI Cell counts

Shear stress (N/m2)

Turbidity (NTU

)

Shear stress (N/m2)

Shear stress (N/m2)

Mn(µg/l)

Cells/m

l