Getting Better: Learning to Invest in an Emerging Stock Market

Invest more and better in childrenPerspectives for improved financing of the social sectors in Mozambique

Reproduction of any part of this publication does not require authorization, except for commercial purposes. The identification of the source is however required.
To download an electronic version or Portuguese version of this report or for corrections, please visit: http://sitan.unicef.org.mz/
UNICEF United Nations Children's Fund
Av. do Zimbabwe, 1440 P.O. Box 4713, Maputo Mozambique
Email: [email protected]
© UNICEF Mozambique, Maputo, 2014

Invest more and better in children. Perspectives for improved financing of the social sectors in Mozambique 3
TABLE OF CONTENTS
List of figures 4
List of abbreviations 4
PREFACE 5
1 INTRODUCTION 6
2 RECENT TRENDS IN THE FINANCING OF THE SOCIAL SECTORS 9
3 COVERAGE AND COST SCENARIOS FOR THE SOCIAL SECTORS 12
3.1 Education 13
3.2 Health 14
3.3 Social protection 16
3.4 Water and sanitation 18
3.5 Aggregate costs 20
4 FISCAL SPACE AND FINANCING SCENARIOS 21
4.1 Domestic revenue 23
4.2 External grants 23
4.3 Deficit financing 24
4.4 The overall resource envelope 24
5 CONCLUSION: PERSPECTIVES FOR IMPROVED FINANCING OF THE SOCIAL SECTORS 26
REFERENCES 31

Invest more and better in children. Perspectives for improved financing of the social sectors in Mozambique4
LIST OF FIGURES
Figure 1 GDP growth, 1994-2012 7
Figure 2 Trends in executed social sector expenditure, 2008-2013 10
Figure 3 Gross completion rates and government education expenditure, 2012-2023, by scenarios 14
Figure 4 Health services coverage and government health expenditure, 2012-2023, by scenarios 16
Figure 5 Coverage and costs of social protection programmes, 2012-2023, by scenarios 17
Figure 6 Utilization rates and government expenditure on water and sanitation, 2012-2023, by scenarios 19
Figure 7 Overall government expenditure on education, health, social protection, and water and sanitation, 2012-2023, by scenarios 20
Figura 8 The fiscal space diamond 22
Figura 9 Actual government expenditure, 2008-2013, and projected resource envelope, 2014-2022 (% of non-extractive GDP) 24
Figura 10 Trend in total resource envelope, 2008-2023 (MT billion at 2012 constant prices) 25
Figura 11 Social sector expenditure needs and financing, 2014-2023, by scenarios (% of non-extractive GDP) 28
LIST OF ABBREVIATIONS
ADE Apoio Directo à Escola (Direct School Grant)
AIDS Acquired Immune Deficiency Syndrome
AU African Union
CGE Conta Geral do Estado (Public Accounts)
CSO Country Status Overview
DHS Demographic and Health Survey
DNA Direcção Nacional de Águas (National Water Directorate)
DNO Direcção Nacional do Orçamento (National Budget Directorate)
FDI Foreign direct investment
GDP Gross domestic product
GNI Gross national income
GPCR Gross primary completion rate
HIV Human immunodeficiency virus
ILO International Labour Organisation
IMF International Monetary Fund
INAS Instituto Nacional de Acção Social (National Institute for Social Action)
IPT Intermittent preventive treatment (of malaria)
LLIT Long-lasting insecticide treated (net)
LNG Liquefied natural gas
MINED Ministry of Education
MT Metical
ODA Official development assistance
OPM Oxford Policy Management
ORS Oral rehydration salts
PASD Programa de Apoio Social Directo (Direct Social Support Programme)
PASP Programa de Acção Social Produtiva (Productive Social Action Programme)
PESS Plano Estratégico do Sector da Saúde (Health Sector Strategic Plan)
PMTCT Prevention of mother to child transmission (of HIV)
PSSB Programa de Subsídio Social Básico (Basic Social Grant Programme)
TB Tuberculosis
TGE Total government expenditure

Invest more and better in children. Perspectives for improved financing of the social sectors in Mozambique 5
PREFACE
UNICEF has the mandate of supporting national efforts to realize children’s rights, enshrined in the Convention on the Rights of the Child (CRC), which is ratified by Mozambique. For this reason, UNICEF works with national decision-makers and other social sector partners to promote universal access of children to an essential package of services, products and knowledge, which will contribute to the achievement of these rights.
Mozambique has made great progress in improving the survival and well-being of children in the two decades since the end of the war. However, progress in the provision and quality of basic social services has not been uniform and Mozambique still faces challenges in the guarantee of well-being for all children. Solving these challenges requires improving the effectiveness and efficiency of the social sec-tor. This depends, in turn, on adequate prioritization of children’s rights in sectoral planning, complemented by ensuring adequate financing and better allocation of available resources.
The present publication 'Invest more and better in children. Perspective for improved financing of the social sectors in Mozambique' focuses attention on the prospects for improving social sector financing. The study aims to assess the costs of meeting the rights of chil-dren to have universal access to an essential package of services, products and knowledge. It then goes on to analyze the financial impli-cations of these interventions on the State budget. Such analysis was based on existing strategies as well as medium and long-term plans developed by the health, education, water and sanitation, and social protection sectors, because they constitute the most critical sectors for reaching goals for children and also for having the information readily available. The publication then presents several alternative financ-ing scenarios, more optimistic and pessimistic, and are extrapolated to cover a longer time-period (to 2023).
Through this publication, UNICEF hopes to contribute to the national development dialogue and help in 'putting children first'. De facto, there is a growing recognition that social expenditures for children are actually investments that give opportunity to each child to de-velop their full potential, and later on contribute to the development of the nation. Social investment is crucial for the implementation of children's rights, and a fundamental strategy for sustainable and equitable economic growth in Mozambique.
We would like to thank the Oxford Policy Management for the support given in the analytical process of publication, as well as the invaluable contribution of colleagues in the Ministry of Planning and Development, Ministry of Finance, Ministry of Women and So-cial Action, Ministry of Education, Ministry of Health, Ministry of Public Works and Housing, as well as Civil Society organizations and other partners.
Together for the children of Mozambique!
Koenraad Vanormelingen Representative UNICEF Mozambique

Invest more and better in children. Perspectives for improved financing of the social sectors in Mozambique6
1 Introduction
Invest more and better in children. Perspectives for improved financing of the social sectors in Mozambique 7
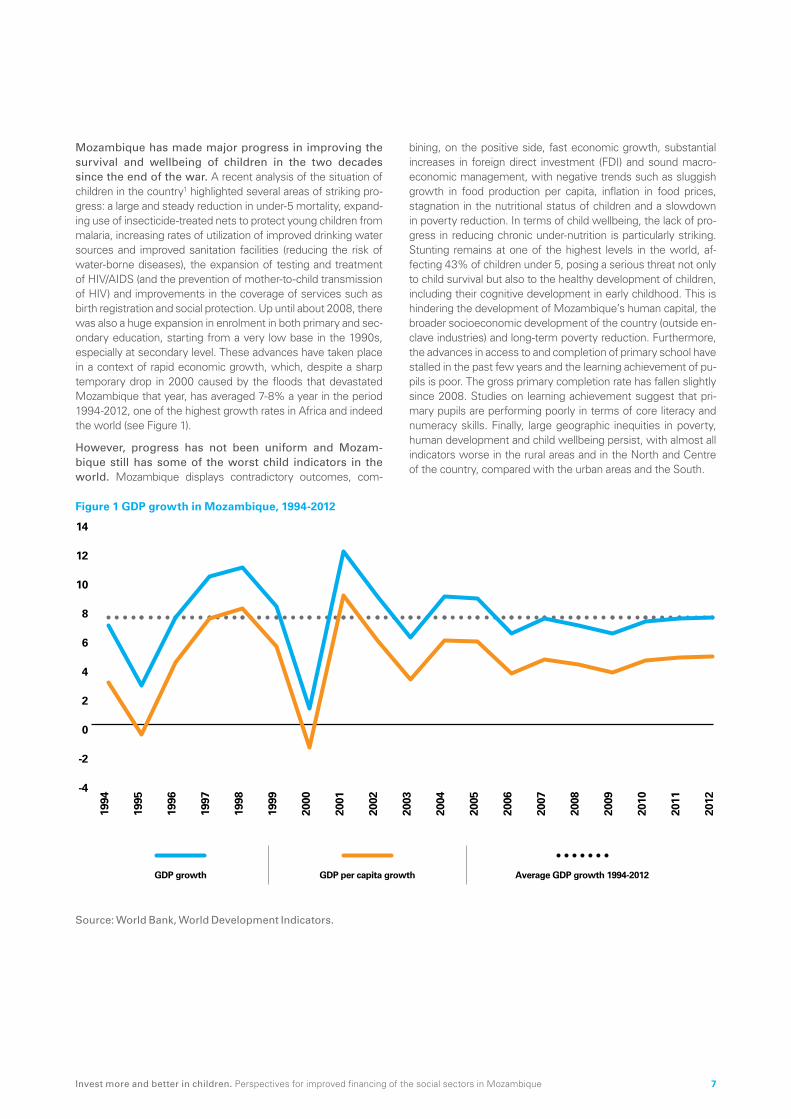
Mozambique has made major progress in improving the survival and wellbeing of children in the two decades since the end of the war. A recent analysis of the situation of children in the country1 highlighted several areas of striking pro-gress: a large and steady reduction in under-5 mortality, expand-ing use of insecticide-treated nets to protect young children from malaria, increasing rates of utilization of improved drinking water sources and improved sanitation facilities (reducing the risk of water-borne diseases), the expansion of testing and treatment of HIV/AIDS (and the prevention of mother-to-child transmission of HIV) and improvements in the coverage of services such as birth registration and social protection. Up until about 2008, there was also a huge expansion in enrolment in both primary and sec-ondary education, starting from a very low base in the 1990s, especially at secondary level. These advances have taken place in a context of rapid economic growth, which, despite a sharp temporary drop in 2000 caused by the floods that devastated Mozambique that year, has averaged 7-8% a year in the period 1994-2012, one of the highest growth rates in Africa and indeed the world (see Figure 1).
However, progress has not been uniform and Mozam-bique still has some of the worst child indicators in the world. Mozambique displays contradictory outcomes, com-
bining, on the positive side, fast economic growth, substantial increases in foreign direct investment (FDI) and sound macro-economic management, with negative trends such as sluggish growth in food production per capita, inflation in food prices, stagnation in the nutritional status of children and a slowdown in poverty reduction. In terms of child wellbeing, the lack of pro-gress in reducing chronic under-nutrition is particularly striking. Stunting remains at one of the highest levels in the world, af-fecting 43% of children under 5, posing a serious threat not only to child survival but also to the healthy development of children, including their cognitive development in early childhood. This is hindering the development of Mozambique’s human capital, the broader socioeconomic development of the country (outside en-clave industries) and long-term poverty reduction. Furthermore, the advances in access to and completion of primary school have stalled in the past few years and the learning achievement of pu-pils is poor. The gross primary completion rate has fallen slightly since 2008. Studies on learning achievement suggest that pri-mary pupils are performing poorly in terms of core literacy and numeracy skills. Finally, large geographic inequities in poverty, human development and child wellbeing persist, with almost all indicators worse in the rural areas and in the North and Centre of the country, compared with the urban areas and the South.
Figure 1 GDP growth in Mozambique, 1994-2012
-4
-2
0
2
4
6
8
10
12
14
1994
1995
1996
1997
1998
1999
2000
2001
2002
2003
2004
2005
2006
2007
2008
2009
2010
2011
2012
GDP growth GDP per capita growth Average GDP growth 1994-2012
Source: World Bank, World Development Indicators.

Invest more and better in children. Perspectives for improved financing of the social sectors in Mozambique8
A range of different factors is holding back faster and more consistent progress. These include the high levels of monetary poverty, its implications for food consumption and di-etary diversity, and the direct and indirect cost barriers to access to social services by the poorest families. The elasticity of pover-ty reduction to GDP growth slowed down sharply in the 2000s, compared with the earlier post-conflict period, reflecting the emergence of a dualistic economy in which FDI and GDP growth have been concentrated in ‘mega-projects’ in the extractive in-dustries with weak linkages to the rest of the economy, creating few jobs and contributing little to poverty reduction (Castel-Bran-co 2013). Meanwhile, climate change and environmental degra-dation have been eroding the foundations of the rain-fed agricul-ture on which the overwhelming majority of Mozambicans living in the rural areas depend for their livelihoods, and increasing the frequency of natural disasters (drought, floods and cyclones). Deep-rooted sociocultural factors, including unequal gender rela-tions, the low educational status of a large part of the population (especially women) and weak access to information, also affect child wellbeing and human development by sustaining deficits in knowledge, attitudes and practices in areas as diverse as child feeding, hygiene, early marriage and sexual practices.
Human progress depends heavily, in a dualistic economy, on the extent to which State revenues are used to promote redistribution, human capital development and econom-ic diversification. Given the weak direct linkages between the extractive sectors and the rest of the economy, public finances are the main mechanism for using the rent from industries such as gas and coal to invest in the human capital and physical infra-structure needed to diversify the economy, generate jobs and re-duce poverty. Publicly funded social protection programmes can also help to reduce poverty, through both their direct redistribu-tive properties and their knock-on effects on families’ access to an adequate diet and to basic social services and thus on pros-pects for human capital development. This report focuses in par-ticular on the financing of basic social services and social protec-tion, given the weaknesses in the coverage and quality of social programmes highlighted in the recent situation analysis.
Despite some major supply-side advances in recent years, bottlenecks in the supply and quality of basic social ser-vices remain important constraints on poverty reduction and improvements in the wellbeing of children. There are still large shortfalls in the geographical coverage of certain ser-vices, with distance from health facilities, for example, remain-ing one of the main reasons for non-utilization of health servic-es. In education, the availability of schools and teachers is still a constraint on access to upper primary education (EP2) in some rural areas -- and even more so on access to secondary educa-tion. There is increasing concern about the quality of services in all sectors. In primary education, the introduction of fast-track teacher training in 2008 succeeded in increasing the number of teachers but at the cost of undermining quality. In the health sec-tor, there are still large shortfalls in health personnel, especially in rural areas, and treatment protocols are not fully respected, often due to endemic drug stock-outs.
Resolving these bottlenecks depends in large part on ad-equate financing. In recent years, government expenditure on the social sectors has been declining in relative terms, as a pro-portion of total government expenditure. This has been masked somewhat by higher absolute levels of expenditure on the social sectors, made possible by the rapid growth of the economy, gov-ernment revenue and overall expenditure. Alongside investment in physical infrastructure, investment in human capital is crucial for balanced development, economic diversification and pover-ty reduction, and this begins with adequate investments during childhood, particularly to improve nutrition, health and learning achievement at school.
This paper therefore focuses attention on the perspectives for improving the financing of the social sectors, which are crucial for the well-being and development of children. Chapter 2 briefly assesses the recent pattern and trends in public expenditure on the social sectors. Chapter 3 then makes long-term projections of the levels of expenditure needed to improve the coverage and quality of services, focusing in particular on four sectors: education, health, water and sanitation, and social protection. The projections presented here are derived from a costing exercise carried out as part of a broader analysis of the situation of children in the country.2 They build on existing medi-um to long-term projections carried out within the sectors, but introduce alternative more optimistic and pessimistic financing scenarios and are extrapolated to cover a longer time-period (to 2023). This time-span takes into account the expectation that, by the early 2020s, gas revenues will start flowing, expanding the fiscal space available to the Government. That hypothesis is tested in Chapter 4, which makes long-term projections of the resource envelope likely to be available to the Government over the next decade. These projections, which are based on modifi-cations to existing IMF scenarios for Mozambique, are presented more fully in another technical study conducted for the Situation Analysis.3 Chapter 5 brings the long-term cost and macro-fiscal projections together to provide an integrated overview of the per-spectives for improved financing of the social sectors.
Invest more and better in children. Perspectives for improved financing of the social sectors in Mozambique 9
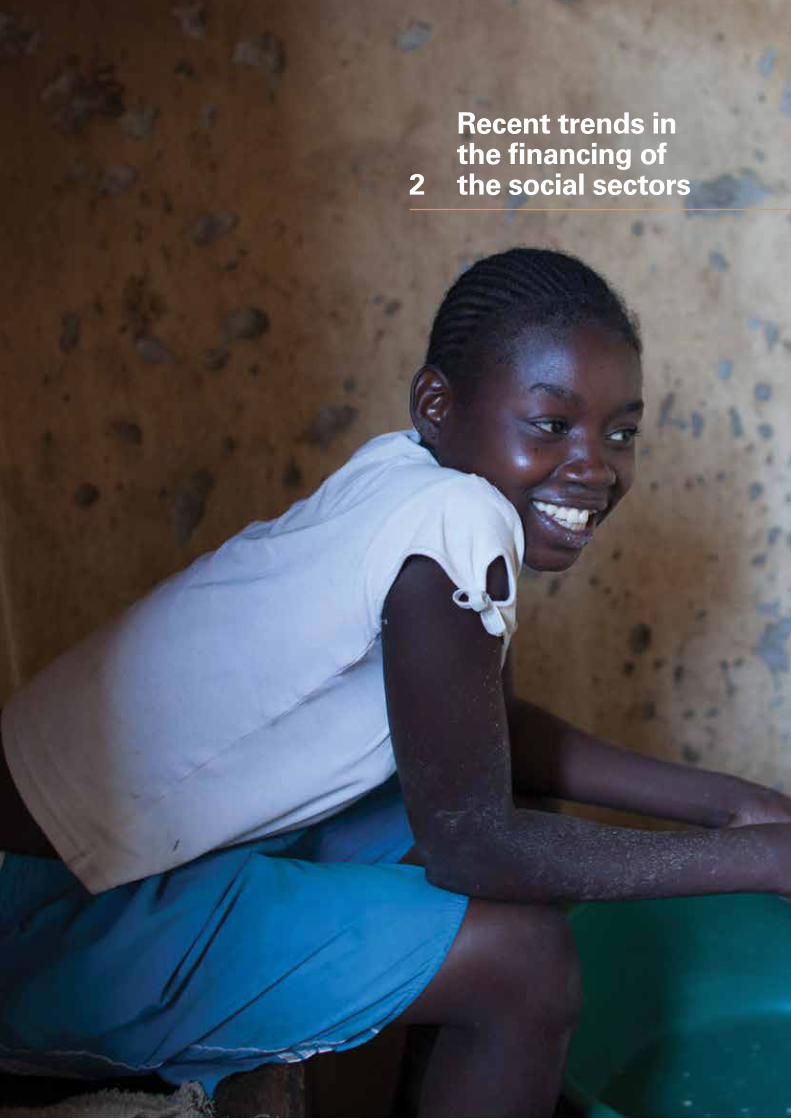
Recent trends in the financing of
2 the social sectors
Invest more and better in children. Perspectives for improved financing of the social sectors in Mozambique10
Analysis of the trends of public expenditure is beset with methodological difficulties due to large extra-budgetary resource flows, as well as classification weaknesses (in-cluding the lack of a programme-based budget classifica-tion) and the fact that district-level expenditures have not (until very recently) been included in sector breakdowns in the published budget law, budget execution reports or the public accounts (the Conta Geral do Estado or CGE). Al-though progress has been made in bringing a substantial part of donor resources (in particular general budget support and most of the common funds) into the PFM system, this is not the case for much of the project financing, which, at different points in the budget cycle, may be off-budget, off-Treasury and/or off-ac-counts (i.e. not recorded in the CGE). These parallel resource flows include substantial aid from the USA in particular, notably for HIV/AIDS. Some locally collected and retained revenues (re-ceitas próprias), in sectors such as health, are likewise not cap-tured in the state accounts (or the budget). The fact that district expenditures are made by multi-sector ‘district services’ meant that, prior to 2012, a significant part of the ‘on-accounts’ public expenditure was not disaggregated by sectors, making it even more difficult to form a comprehensive and accurate picture of sector expenditure. This was a particularly serious limitation giv-en the increasing share of the budget being allocated to and ex-ecuted at the district level in the past few years. In 2013, 53% of education expenditure and 17% of health expenditure was exe-cuted at district level (MINFIN 2014).
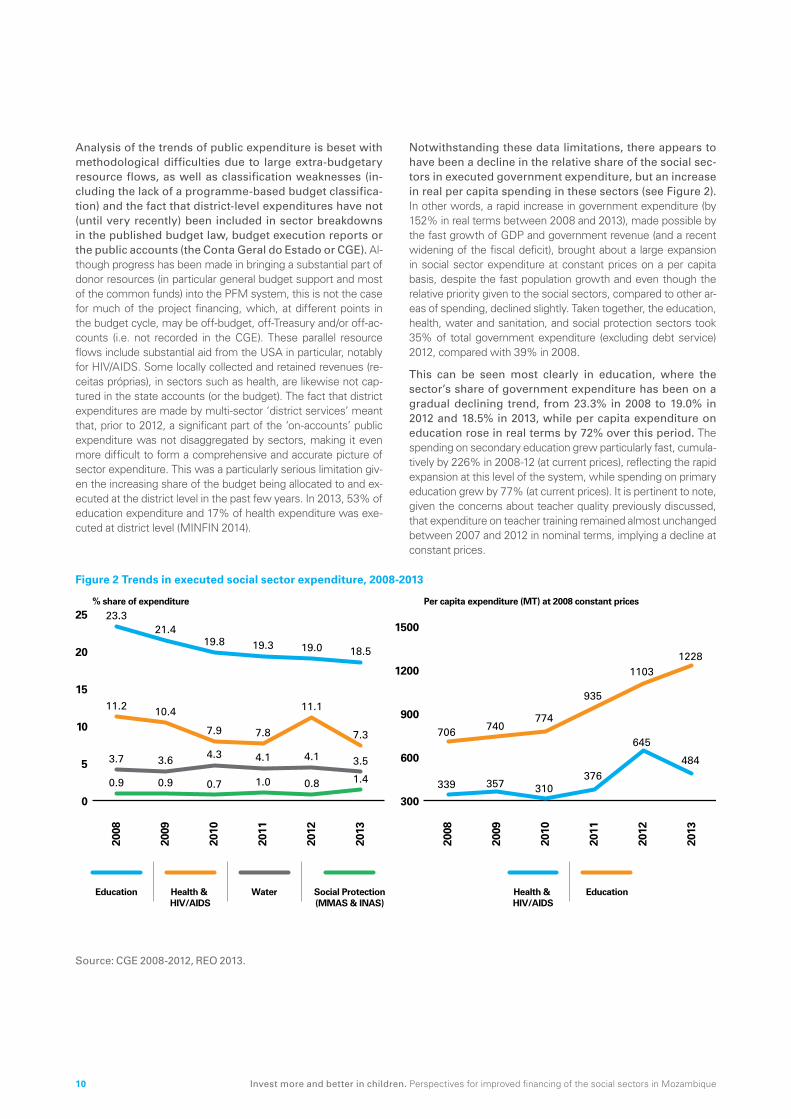
Notwithstanding these data limitations, there appears to have been a decline in the relative share of the social sec-tors in executed government expenditure, but an increase in real per capita spending in these sectors (see Figure 2). In other words, a rapid increase in government expenditure (by 152% in real terms between 2008 and 2013), made possible by the fast growth of GDP and government revenue (and a recent widening of the fiscal deficit), brought about a large expansion in social sector expenditure at constant prices on a per capita basis, despite the fast population growth and even though the relative priority given to the social sectors, compared to other ar-eas of spending, declined slightly. Taken together, the education, health, water and sanitation, and social protection sectors took 35% of total government expenditure (excluding debt service) 2012, compared with 39% in 2008.
This can be seen most clearly in education, where the sector’s share of government expenditure has been on a gradual declining trend, from 23.3% in 2008 to 19.0% in 2012 and 18.5% in 2013, while per capita expenditure on education rose in real terms by 72% over this period. The spending on secondary education grew particularly fast, cumula-tively by 226% in 2008-12 (at current prices), reflecting the rapid expansion at this level of the system, while spending on primary education grew by 77% (at current prices). It is pertinent to note, given the concerns about teacher quality previously discussed, that expenditure on teacher training remained almost unchanged between 2007 and 2012 in nominal terms, implying a decline at constant prices.
Figure 2 Trends in executed social sector expenditure, 2008-2013
Education Health & HIV/AIDS
Water Health & HIV/AIDS
EducationSocial Protection(MMAS & INAS)
0
5
10
15
20
25% share of expenditure Per capita expenditure (MT) at 2008 constant prices
2013
2008
2009
2010
2011
2012
300
600
900
1200
1500
2013
2008
2009
2010
2011
2012
23.3
11.2
3.7
21.4
10.4
3.6
19.8
7.9
4.3
19.3
7.8
4.1
19.0
11.1
4.1
18.5
7.3
3.5
0.9 0.9 0.7 1.0 0.8 1.4 339 357 310 376
645
484
706 740 774
935
1103 1228
Source: CGE 2008-2012, REO 2013.
Invest more and better in children. Perspectives for improved financing of the social sectors in Mozambique 11
The trends in health are more difficult to interpret, due to the large proportion of unstable donor-financed project spending in this sector and the time lag in incorporating data on expenditure from these projects into the govern-ment accounts. The health expenditure in 2013, which shows a sharp decline (in both relative and per capita terms) in Figure 1, may later be adjusted upwards, as happened to the 2012 data. Nonetheless, Mozambique appears to be far from achieving the target of 15% government expenditure on health adopted by the African Union in the Declaration of Abuja in 2001, and the over-all level of government health expenditure per capita is still very low, equivalent to USD 23 in 2012.
Expenditure on social protection (excluding price sub-sidies) has increased, starting from a very low base and rising to about 1.4% of government expenditure in 2013. Almost all of this is for the social transfer programmes of the Na-tional Institute for Social Action (INAS), leaving few resources for the social care services provided by the Ministry of Women and Social Action (MMAS).
Although declining, dependence on donors remains high, especially for health, HIV/AIDS and water and sanitation. Donor dependence is exceptionally high for expenditure in the water and sanitation sector, in the range of 82-87% in 2008-2013 according to the CGE and budget execution reports. Over-all, the sector (excluding water resource management) has been receiving about 4% of total government expenditure, but consist-ently less than 1% of domestically financed government expend-iture since 2009. UNAIDS (2013) estimates that foreign aid pro-vides 97% of HIV/AIDS expenditure, which is not fully captured in the government accounts. This raises the critical question as to whether Mozambique would be able to sustain its progress in increasing coverage of antiretroviral treatment and PMTCT if there was a large decline in external assistance. The external-ly financed share of health expenditure is also high, at 56% in 2012 according to the CGE data. The decline to 24.2% in 2013, as reported by the budget execution report for that year, may be revised upwards as some donor-financed expenditure is later integrated into the accounts, as happened in 2012. Much small-er proportions of expenditure on education and non-contributory social protection are externally financed (14% and 9% respec-tively in 2013). Indeed, the high share of domestic financing of social protection (more than 90%) shows a much lower degree of donor dependence than is common in this sector in low-in-come African countries.

Invest more and better in children. Perspectives for improved financing of the social sectors in Mozambique12
Coverage and cost scenarios for the social
3 sectors
Invest more and better in children. Perspectives for improved financing of the social sectors in Mozambique 13
Alternative scenarios were used to model different levels of results and expenditure in the education, health, water and sanitation, and social protection sectors. These were derived from existing models, already used in the respective sec-tors, but were modified to introduce alternative high, medium and low financing scenarios, as well as to cover a longer time pe-riod (to 2023) and to ensure consistency in macroeconomic and population assumptions across models. For example, the sce-narios in all four sectors use official population estimates derived from the 2007 Census, express costs in constant 2012 prices and use IMF projections of GDP growth to calculate expendi-ture/GDP ratios. It should be noted that, because of the uncer-tainty about future gas production and revenues, GDP is meas-ured excluding extractive industries (i.e. as ‘non-extractive GDP’) throughout this report.
Broadly speaking, the three alternative scenarios presented for each sector may be regarded as:
• Low, based on conservative expectations of financing levels and with programme coverage expanding slowly (at the same pace as in the past or in tandem with population growth);
• Intermediate, allowing for faster growth in coverage and/or im-provements in quality, and thus higher levels of spending;
• High, with much faster expansion, often to achieve univer-sal coverage by 2023, and with more attention to quality, and therefore requiring substantially higher spending than in the medium scenarios.
The scenarios were derived from the following four sec-tor models:
• Education: A cohort model, previously used by MINED to pro-ject education costs, inputs and outputs in the education sec-tor up to 2020 and to produce the budget projections in the Education Strategic Plan 2012-2016;
• Health: The ‘One Health’ tool, which has recently been used by MISAU to project costs, inputs and service coverage for the Health Sector Strategic Plan for the period 2014-2019, inte-grating also health-related nutrition interventions and the sep-arately budgeted Plan for Accelerated Response to HIV/AIDS 2013-2015;
• Social protection: A micro-simulation model used by ILO to make long-term projections of beneficiary coverage and budget requirements for the scale-up of INAS programmes, based on assumptions broadly consistent with the Operation-al Plan for implementation of the Basic Social Security Strate-gy 2009-2014;
• Water and Sanitation: A model used to make long-term projec-tions for the ‘country status overview’ on water and sanitation carried out in 2010 by the National Directorate of Water (DNA) with support from international development partners.
3.1 EDUCATION
The education model is based on a Cohort Progression Analysis (CPA), which tracks the progress of each intake of pupils through the school system from Grade 1 onwards, linked to rates of progression (between grades), repetition and dropout, and inputs (classrooms, teachers, etc.). In the
original Ministry of Education (MINED) model, two separate sets of targets were set, for 2016 and 2020. For the purposes of the current costing exercise, targets for the year 2023 were set on the basis of a linear extension of 2020 targets. The model then uses input-output ratios, such as the pupil-teacher ratio, and his-torical unit costs to budget costs year by year.
Three alternative scenarios present different levels of am-bition. The MINED costing exercise used two scenarios, to which we have added a third, more ambitious scenario. Figure 3 shows the ‘bottom line’ impact of each scenario on gross pri-mary and secondary completion rates, as well as each scenario’s total cost as a percentage of non-extractive GDP.
The low scenario , which is a modified version of the core scenario developed by MINED, sets targets that are con-sidered achievable given projected population growth and current expectations of financing for the sector, which would be equivalent to 5.8% of non-extractive GDP dur-ing most of the period to 2023. Although absolute per capi-ta expenditure on education would rise in real terms under this scenario, government education spending would be lower rela-tive to non-extractive GDP, which was 6.3% in 2012. The gross primary completion rate (GPCR) would improve only slightly, to 51% in 2023, compared to a baseline of 46% in 2010.
The intermediate scenario is derived from the second, more optimistic MINED scenario, in which education re-ceives a higher share of government expenditure, aver-aging 7.8% of non-extractive GDP over the period 2014-2023 and making it possible to improve education sector results considerably, compared to the low scenario. The GPCR would rise to 78% by 2023. Although expenditure on edu-cation as a percentage of total GDP would be slightly lower, this would be comparable to the highest education spenders in Afri-ca, such as Ghana and Swaziland (around 8% in 2012).4
The high scenario has been added as an ‘aspirational’ sce-nario, projecting the resources that would be needed to achieve near universal primary school completion (GPCR of 98%) by the year 2023, while giving adequate attention to the quality of education. The required improvements in-clude a substantial increase in (the currently very low) enrolment in pre-school education to help ensure readiness for school at age 6, a large expansion of teacher training (to improve the qual-ity of teaching), a reduction in the primary pupil-teacher ratio to achieve the MINED policy target of 50, a larger increase (than in the other scenarios) in the ADE capitation grant for schools, higher rates of transition to lower and upper secondary school, a slightly higher rate of increase in teacher salaries (2.5% instead of 2.0% a year) and bonuses to teach in remote areas, and an increase in the proportion of children receiving free school lunch-es to 20% to incentivize poor children to attend school. Over-all, these improvements would raise total government education spending to 11.0% of non-extractive GDP by 2023. Although this may be regarded as extremely difficult to achieve, it is important to note that even this scenario falls far short of desirable quality standards and implies still low levels of enrolment in secondary education.

Invest more and better in children. Perspectives for improved financing of the social sectors in Mozambique14
Figure 3 Gross completion rates and government education expenditure, 2012-2023, by scenarios
0
20
40
60
80
100
120
Scenario 1
Gross secondary completion rate
Gross primarycompletion rate
Scenario 2 Scenario 3 Scenario 1 Scenario 2 Scenario 3
2017
2018
2019
2020
2021
2022
2023
2012
2013
2014
2015
2016
2017
2018
2019
2020
2021
2022
2023
Bas
elin
e20
1220
13
2014
2015
2016
0
2
4
6
8
10
12Gross completion rates (%) Government education spending as % of non-extractive GDP
Source: OPM projections based on education model.
3.2 HEALTH
The scenarios for government health expenditure and ser-vice coverage levels are variants of the core scenario used in the health sector strategic plan (PESS). In the costing car-ried out for the PESS, only one scenario was developed, set-ting out the inputs required to achieve the targets defined in the PESS (Dutta et al, 2013). This includes both the vertical costs of specific programmes or interventions (e.g. vaccination, TB, HIV, etc.) and the horizontal costs related to the operations of the health system as a whole, including all levels of care and referral. This scenario did not take into account past levels of financing or capacity constraints, but started from pre-determined policy objectives. There are also three financing scenarios in the PESS that are respectively considered to be cautious, intermediate and ambitious. However, these financing scenarios are not linked to the PESS results, in the sense that no attempt was made to es-timate how different levels of funding would affect the achieve-ment of PESS objectives. The present exercise uses the same three financing scenarios presented in the PESS and attempts to derive their implications for the coverage of various health pro-grammes. This has been done in the simplest possible way, by adjusting the coverage rates of all PESS programmes, as well as corresponding inputs (human resources, infrastructure, etc.), up-wards or downwards proportionally to the available funding. As such, the scenarios have not involved a process of re-prioritiza-tion to identify the most crucial interventions to be safeguarded in the case of diminished funding.
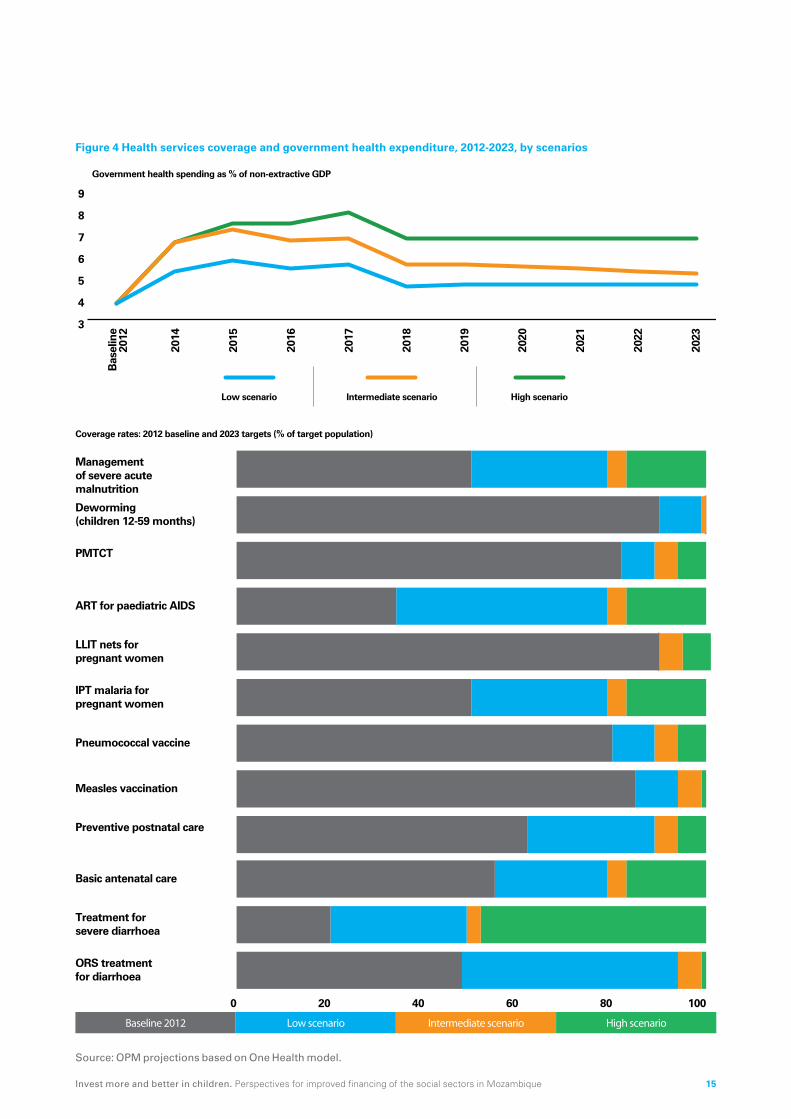
Only the high scenario would enable Mozambique to achieve universal coverage, as can be seen in Figure 4 for a few selected health interventions. Under the low and in-termediate scenarios, there are more modest improvements by 2023.
However, all three scenarios require very large increases in public funding for the health sector compared to current levels. To raise service coverage substantially in the first few years (2014-2017), expenditure in this period under the three sce-narios would be respectively 47%, 82% and 98% higher on av-erage than actual expenditure in 2012, when measured as a pro-portion of non-extractive GDP.5 Thereafter, expenditure would stabilize somewhat as a percentage of non-extractive GDP but at much higher levels than has been achieved in practice in Mo-zambique in recent years. It is noteworthy that the low scenario implies a level of health expenditure that approximates the target of 15% of total government expenditure (TGE) set by the AU in the Declaration of Abuja. Both Scenarios 2 and 3 imply levels of expenditure well above that target (averaging respectively about 18% and 21% of TGE over the 10-year period to 2023).
Invest more and better in children. Perspectives for improved financing of the social sectors in Mozambique 15
Figure 4 Health services coverage and government health expenditure, 2012-2023, by scenarios
LLIT nets for pregnant women
ART for paediatric AIDS
PMTCT
Management of severe acute malnutrition
Deworming (children 12-59 months)
ORS treatment for diarrhoea
Measles vaccination
Pneumococcal vaccine
IPT malaria for pregnant women
Treatment for severe diarrhoea
Basic antenatal care
Preventive postnatal care
0 20 40 60 80 100
Baseline 2012 Low scenario Intermediate scenario High scenario
Coverage rates: 2012 baseline and 2023 targets (% of target population)
Low scenario Intermediate scenario
3
4
5
6
7
8
9
Bas
elin
e 2
012
2014
2015
2016
2017
2018
2019
2020
2021
2022
2023
High scenario
Government health spending as % of non-extractive GDP
Source: OPM projections based on One Health model.

Invest more and better in children. Perspectives for improved financing of the social sectors in Mozambique16
3.3 SOCIAL PROTECTION
The social protection model estimates the coverage and costs of the social transfer programmes of INAS. It was originally based on the 2011 Operational Plan for implementation of the Nation-al Basic Social Protection Strategy 2009-2014, which sets out a framework for the reform and expansion of the social protec-tion system in Mozambique. However, unlike the education and health sector strategic plans, which included official budget pro-jections, the social protection strategy and its operational plan were not costed. The model used here was developed by the ILO in partnership with the IMF and with technical support from OPM, to provide unofficial projections of programme coverage and costs, based on the eligibility criteria set out in the Opera-tional Plan and assumptions regarding other key programme pa-rameters, such as the value of social transfer amounts and the transfer-cost ratio (the ratio of transfers to administrative costs).6 The current Strategy expires in 2014 and a process has started to prepare a new Strategy for the five-year period beginning in 2015. The new Strategy should be budgeted, like the education and health sector strategies, so that it can inform the broader process of medium-term budget planning through the Cenário Fiscal de Médio Prazo (CFMP).
The main objective of the 2011 Operational Plan was to move towards a coherent system of non-contributory social protection programmes. This consists of three main programmes:
• The Programa de Subsídio Social Básico (PSSB – Basic Social Grant Programme), which provides monthly cash transfers for an unlimited period to poor households with an absolute la-bour constraint, i.e. households that are headed by persons who are elderly, disabled or chronically ill and do not have any adult members able to work.
• The Programa de Acção Social Produtiva (PASP – Productive Social Action Programme), which provides temporary employ-ment in labour intensive public works for poor and vulnerable households with residual labour capacity.
• The Programa de Apoio Social Directo (PASD – Direct Social Support Programme), which provides temporary in-kind assis-tance to a range of different types of vulnerable groups, includ-ing child headed households, households with adults tempo-rarily unable to work, households with children suffering from severe acute malnutrition and households with malnourished AIDS patients receiving antiretroviral therapy.
The three scenarios range from the gradual scale-up of the existing programmes as currently designed (low sce-nario) to a scenario introducing modest enhancements in programme design (intermediate scenario) and finally a radical reform converting the PSSB and PASD into a social pension and a child grant (high scenario). Figure 5 shows the evolution of programme coverage levels and expenditure un-der each of these scenarios.
The low scenario models the continuation of current pro-grammes, with a scale-up of coverage but no changes in design. For the PSSB, which already covers almost 300,000 households, the expansion is modest, reflecting mainly the growth in the eligible population. There is a larger scale-up of the PASD to cover more fully than at present the vulnerable groups eligible for this programme. The largest expansion, however, is for the PASP, which would increase coverage of the eligible pop-ulation (able-bodied adults in very poor households with residual labour capacity) from 1% to 29% in rural areas and 2% to 38% in urban areas, reaching about 380,000 households overall by 2023. The total cost of social transfer programmes would almost double as a proportion of non-extractive GDP, from a baseline of 0.3% in 2012 to a range of 0.5% to 0.6% from 2014 onwards, but this is still very low by international standards and it is ques-tionable that it can provide a real social protection ‘floor’ for the most vulnerable households.
The intermediate scenario makes some adjustments to the design of the PSSB and PASP, taking effect immedi-ately from 2014. In particular, the PSSB selection criteria are relaxed to replace the criterion of an absolute household labour constraint (i.e. the complete absence of able-bodied adults) by a high household dependency ratio. In this scenario, households would be eligible if there was a dependency ratio of more than 4 (i.e. more than four household members who are children, el-derly or disabled per able-bodied adult member). Compared with the low scenario, this would double the number of secondary PSSB beneficiaries (to 1.1 million by 2023), including in particular large numbers of vulnerable children, compared with the existing programme.7 In addition, the benefit level is increased slightly. The intermediate scenario also raises the PASP wage in urban areas, to make it more attractive, and replaces poverty targeting by self-selection. Individuals are considered likely to participate in the programme if the wage rate is at least equal to their current income. This would raise coverage to about 680,000 households by 2023, almost twice as many as in the low scenario. The com-bined cost of the programmes rises sharply to about 1.3% of non-extractive GDP.
The high scenario is more ambitious, involving the trans-formation of the PSSB into a social pension (for the elder-ly and disabled), while the PASD would be phased out in favour of a grant for children under 5, beginning in 2017, to reach more systematically the age-group at risk of mal-nutrition. Both programmes would cover the poorest 40% of households, benefiting 660,000 households with elderly mem-bers and 1.9 million households with children under 5 by 2023. In addition, the PASP wage rate would be increased in both ru-ral and urban areas, leading to a further increase in take-up, to 830,000 households by 2023. While aggregate costs would be similar to those in the low scenario up to 2016, the introduction of the child grant in 2017 and its scale-up over the next few years would require a much higher level of social protection spend-ing in the final years of the period, reaching 2.3% by 2023. This would be closer to the level of spending seen in middle-income countries such as South Africa, which spends about 3.2% of GDP on its child grant and social pension.

Invest more and better in children. Perspectives for improved financing of the social sectors in Mozambique 17
Figure 5 Coverage and costs of social protection programmes, 2012-2023, by scenarios
Low Scenario Intermediate Scenario
High Scenario
0.0
0.5
1.0
1.5
2.0
2.5
0
500
1000
1500
2000
2500
3000
3500
PASP PASD PSSBPASP PASD PSSB
PASP PASD PSSB
0
500
1000
1500
2000
2500
3000
3500
0
500
1000
1500
2000
2500
3000
3500
2017
2018
2019
2020
2021
2022
2023
2014
2015
2016
2017
2018
2019
2020
2021
2022
2023
Bas
elin
e 2
012
2014
2015
2016
2017
2018
2019
2020
2021
2022
2023
2014
2015
2016
2017
2018
2019
2020
2021
2022
2023
2014
2015
2016
Low scenario coverage (1,000 households) Intermediate scenario coverage (1,000 households)
High scenario coverage (1,000 households) Cost as % of non-extractive GDP
Source: OPM projections based on social protection model.

Invest more and better in children. Perspectives for improved financing of the social sectors in Mozambique18
3.4 WATER AND SANITATION
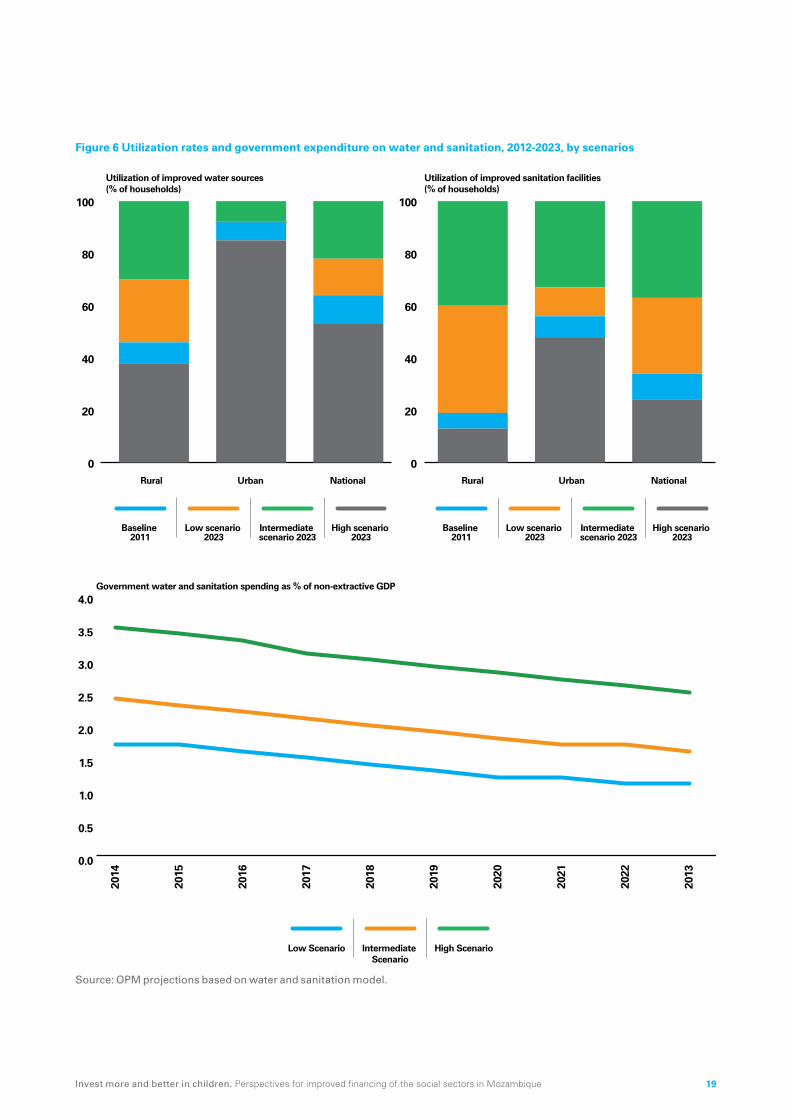
The water and sanitation projections are based on a mod-el developed by the National Directorate for Water (DNA) together with international partners for the Country Sta-tus Overview (CSO) in 2010. This model made simple linear extrapolations of the rates of utilization of improved water sourc-es and improved sanitation facilities, disaggregated by urban and rural areas, from baseline estimates to achieve the MDG targets by 2015. The new projections presented here updated the base-line figures from 2009 to 2011, using the latest available survey data from the DHS 2011, and set new coverage targets under cautious, intermediate and ambitious scenarios. The costs in-clude the investment needed to extend coverage from baseline to target levels, replacement costs (the cost of replacing facilities at the end of their lifespan) and maintenance costs.8 Households contribute a small proportion of total costs.9 Figure 6 shows the projected evolution of government expenditure on water and sanitation and respective coverage rates under the three scenar-ios up to 2023.
The low scenario assumes that the progress observed over the period 1990 to 2011 will continue at the same pace until 2023, leaving large deficits in utilization rates. In other words, this scenario anticipates neither an acceleration of public investment in the water and sanitation sector, nor any im-provement in efficiency (more beneficiaries for the same level of spending). A substantial gap will remain by 2023, with only 46% of households in rural areas using improved water sources com-pared to 92% in urban areas. For use of improved sanitation facil-ities, the gap would be even larger, with only 19% in rural areas compared to 56% in urban areas. This scenario requires govern-ment expenditure averaging 1.4% of non-extractive GDP over the 10-year period from 2014 to 2023, which is slightly below the level of 1.5% reported for 2012 – although it should be recalled that the latter expenditure included also water resource manage-ment and was overwhelmingly donor financed (see Chapter 2). The low scenario is also the least equitable of the three scenar-ios, in so far as it directs only 24% of expenditure to the rural ar-eas. And, although the gap in sanitation coverage is much larger than for water, 56% of the expenditure is for water. This expend-iture distribution reflects both the more conservative nature of this scenario and the lower units costs for sanitation as well as rural water systems, compared with urban water.
The intermediate scenario projects somewhat faster ex-pansion, modifying the targets defined in the National Water Policy. These targets were originally set for 2015 (see DNA 1995). The targets for rural water (70%) and for both urban and rural sanitation (60% and 67%) have simply been reset for 2023, as it is not anticipated that they will be achieved by 2015. However, the target for urban water coverage, towards which progress has been faster, has been raised to 92%, the same lev-el as in the low scenario. Government expenditure on water and sanitation would rise under this scenario to an average of 2.0% of non-extractive GDP. This might well be achievable, although technical capacity limitations (particularly in human resources) might be a constraint, requiring a front-loading of investments in operational capacity. From an equity perspective, it is notewor-thy that the rural areas receive a higher proportion of government resources (41%). The much higher sanitation coverage targets lead to sanitation receiving 53% of the government resources for this sector, compared to 44% in the low scenario.
The high scenario is an aspirational scenario for univer-sal utilization of improved water sources and sanitation facilities in both rural and urban areas by 2023. It estimates the resources required to achieve an ambitious policy objective, independently of budgetary or technical constraints. However, it should be noted that the water policy aimed to achieve universal coverage by 2025, only 2 years later than in this scenario. Both technical and financial constraints might make this scenario diffi-cult to achieve. Overall, this scenario would require government expenditure on water and sanitation, relative to non-extractive GDP, to double in the period 2014-2023 compared to 2012. Since the historical disparities between urban and rural areas would be eradicated by the achievement of universal coverage, this is al-so the most equitable scenario in terms of financing, with 44% of expenditure in the rural areas. And the large gap in sanitation coverage to overcome under the high scenario means that the share of expenditure on sanitation would be highest under this scenario (59% of the total).
Invest more and better in children. Perspectives for improved financing of the social sectors in Mozambique 19
Figure 6 Utilization rates and government expenditure on water and sanitation, 2012-2023, by scenarios
Low scenario 2023
Intermediate scenario 2023
Baseline 2011
High scenario 2023
Low scenario 2023
Intermediate scenario 2023
Baseline 2011
High scenario 2023
0
20
40
60
80
100
Rural Urban National Rural Urban National
0
20
40
60
80
100
Utilization of improved water sources(% of households)
Utilization of improved sanitation facilities (% of households)
Low Scenario Intermediate Scenario
High Scenario
2017
2018
2019
2020
2021
2022
2015
2016
0.0
0.5
1.0
1.5
2.0
2.5
3.0
3.5
4.0
2014
2013
Government water and sanitation spending as % of non-extractive GDP
Source: OPM projections based on water and sanitation model.

Invest more and better in children. Perspectives for improved financing of the social sectors in Mozambique20
3.5 AGGREGATE COSTS
When aggregated, the cautious scenarios imply maintain-ing government expenditure on the four social sectors, as a percentage of non-extractive GDP, at a level similar to that in 2012. This can be seen in Figure 7, which presents the aggregate costs for all four social sectors over the period 2014-2023, in comparison with the baseline year (2012). Under the low scenario, the total cost rises from 11.7% of non-extractive GDP in 2012 to the 13-14% range in 2014-2017 but then falls back to 12.1% thereafter. The slightly higher expenditure in the early years reflects mainly the frontloading of health expenditure to overcome infrastructure shortfalls.
Under the intermediate and high scenarios, the share of social sector spending would rise significantly, reaching on average 17% of non-extractive GDP in the intermediate scenario and 20% in the high scenario. The next chapter will assess how realistic it might be to envisage such an expansion.
Figure 7 Overall government expenditure on education, health, social protection, and water and sanitation, 2012-2023, by scenarios
Low Scenario(average 12%)
Intermediate Scenario(average 17%)
Bas
elin
e 20
12
2014
2015
2016
2017
2018
2019
2020
2021
2022
2023
High Scenario(average 20%)
0
5
10
15
20
25
11,7
Source: OPM projections based on sector models.

Invest more and better in children. Perspectives for improved financing of the social sectors in Mozambique 21
Fiscal space and4 financing scenarios

Invest more and better in children. Perspectives for improved financing of the social sectors in Mozambique22
This chapter makes long-term projections of fiscal space up to 2023, taking into account the expected contribution from gas revenues towards the end of the period. Follow-ing the classic definition by Heller (2009), fiscal space is under-stood here as ‘the availability of budgetary room that allows a government to provide resources for a desired purpose without any prejudice to the sustainability of a government’s financial po-sition’. There are four main sources of fiscal space, as shown in the ‘fiscal space diamond’ in Figure 8: domestic government rev-enue, official development assistance (ODA), the reprioritization of government expenditure (to improve the allocative and oper-ational efficiency of expenditure) and fiscally sustainable deficit financing (i.e. borrowing).
Figure 8 The fiscal space diamond
1
3
24
1: Of�cial development assistance2: Domestic revenue mobilization3: De�cit �nancing4: Reprioritization and improved ef�ciency of expenditure
Source: Roy and Heuty, 2007.
The analysis focuses mainly on three of the four corners of the diamond: domestic revenues (including from gas), ODA and deficit financing. The fourth, the reprioritization of public expenditure, is discussed only in passing, as it is difficult to assess its potential contribution to fiscal space without an analy-sis of the allocative and operational efficiency of public expendi-ture across many different sectors.
Fiscal space is interpreted here simply as the total re-source envelope available for sustainable financing of public expenditure. This is the sum of total government do-mestic revenue plus external grants plus a level of deficit financ-
ing that is fiscally sustainable in the long term. As in Chapter 3, values are generally expressed in relative terms, as percentages of GDP, although there will also be some discussion of the ab-solute growth in the resource envelope over the next ten years.
There is a high degree of uncertainty regarding each of the components of fiscal space, making the analysis ten-tative at best. In particular, it is difficult to predict future govern-ment revenue from liquefied natural gas (LNG), due to uncertain-ties regarding the start-up and scale of LNG production, future LNG prices and the tax regime for LNG revenues. Given Mo-zambique’s historically high but declining dependence on ODA, the projections are also subject to uncertainties concerning the level and composition of future flows of external grants. Finally, the level of deficit that can be regarded as sustainable is open to debate, since it depends ultimately on the economic returns to the public investment financed by borrowing (the quality of in-vestment choices) as well as possible inflationary and ‘crowding out’ effects.
The analysis uses an existing IMF model, data and pro-jections, while introducing alternative scenarios for LNG revenue. The scenarios in this analysis are derived, with some adjustments, from existing projections provided by the IMF, notably through its ‘Debt, Investment, Growth and Natural Re-sources’ (DIGNAR) model (Melina and Xiong 2013), and uses the latest projections for fiscal and other macroeconomic indicators provided by the IMF (2014) and the National Budget Directorate (DNO) in the Ministry of Finance. While this methodology has the obvious advantage of not needing to replicate a complex dy-namic general equilibrium model, that is extremely data-inten-sive, it also means that the analysis is fundamentally tied to the assumptions and parameters of the IMF model for fiscal projec-tions. However, the analysis goes beyond the projections in the IMF model to present three alternative LNG scenarios:
• A base ‘optimistic’ scenario, aligned with IMF projections, which assumes the start of LNG production in 2020, with LNG revenues flowing slowly at first and accelerating from 2023 onwards;
• A more conservative scenario, which reduces LNG revenues to only 50% of the level projected in the first scenario, which could result from either lower international prices and/or more limited than expected production;
• A very pessimistic scenario in which there are no LNG rev-enues during the period under consideration, either because of a major delay in operations or because of the collapse of LNG deals.
4.1 DOMESTIC REVENUE
Domestic resource mobilisation, including possibly tax revenue from LNG towards the end of the period, will be the key source of fiscal space in the next 10 years. The anal-ysis uses IMF (2014) projections for revenue up to 2018, and longer-term IMF projections of LNG revenues (Melina and Xiong 2013), while making simple extrapolations from 2018 to 2023 for other tax and non-tax revenues.

Invest more and better in children. Perspectives for improved financing of the social sectors in Mozambique 23
The discovery of massive natural gas deposits in the Ro-vuma basin has been described as a ‘game changer’ (Hu-bert 2013). The website that publicises the LNG project in Mo-zambique, involving a number of multinational corporations and the Mozambican government, describes LNG as providing the potential to elevate Mozambique to the rank of third-largest ex-porter of LNG in the world, behind Australia and Qatar. If that promise is fulfilled, the implications in terms of future resource revenues could be far-reaching. If the current plans for LNG pro-duction are realized, LNG taxation will become one of the pri-mary sources of revenue for the Mozambican State by the mid-2020s, perhaps reaching 40% of total revenue by the late 2020s (Melina and Xiong 2013).
However, if the base scenario is realized, the revenue gains from LNG will make a substantial impact on public financ-es only at the very end of the period. The base scenario (de-rived from Melina and Xiong 2023) assumes that LNG produc-tion will start in 2020, with capacity of 5 million tons, and build up to 20 million tons per year by 2023. LNG prices are assumed to rise, following global oil prices, to 2018 and then to become constant in real terms from 2018 onwards. Government revenue from LNG would start in 2020, at 2.5% of non-extractive GDP, and rise to 7.3% by 2023, making a substantial additional contri-bution to fiscal space – but only at the end of our 10-year period.
The other LNG scenarios are more pessimistic. Various studies (CIP 2013a and 2013b, and Hubert 2013) have cast doubts over the production timeframe presented in the Govern-ment’s Gas Master Plan (Plano Director) and other official doc-uments, given financing constraints and supply bottlenecks, and questioned the likely Government tax take under existing fiscal arrangements. Furthermore, future prospects for LNG ex-pansion worldwide, including in Mozambique, may be under-mined by the North American shale gas boom, which promises a cheaper alternative to existing supplies.10 Buyers are increas-ingly reluctant to sign long-term LNG contracts and may wait to see what happens to LNG prices in light of the developments in shale gas. This could lead to delays in LNG train construction and lower price scenarios, making the official projections overly optimistic. Finally, the fiscal regime remains subject to uncertain-ties despite progress in the development of new legislation, in-cluding a new Fiscal Law on Petroleum Products in 2007, since many of the agreements were negotiated earlier with more fa-vourable tax provisions. Much of the literature on taxation in Mo-zambique has emphasised how little revenue the Government has obtained from mega-projects (Castel-Branco 2011 and 2013, Di John 2010, Kuegler 2009, Fjelstad and Heggstad 2011, and CIP 2013c), and there are concerns that this may be repeated with LNG.
Whatever happens to LNG, non-extractive tax revenue is expected to continue expanding rapidly due to high GDP growth, even though there is now less room for further improvements in the tax yield. Overall, domestic government revenue rose from 17% to 23% of GDP between 2008 and 2012, due to improvements in tax administration and an expansion of the tax base (to small and medium sized enterprises) even though mega-projects have not been significant contributors.
Given the impressive record in terms of aggregate GDP growth, this has produced a substantial expansion in tax revenue in ab-solute terms.11 Mozambique now has a relatively high revenue/GDP ratio, compared with other low-income African countries, and it would therefore be difficult to make further improvements in the tax yield of the non-extractive sectors. However, the pro-jected continued high growth in non-extractive GDP (above 6% a year in the scenarios to 2023) means that, in absolute terms, non-extractive tax revenue will continue to grow rapidly, increas-ing substantially the resources available for public expenditure.
4.2 EXTERNAL GRANTS
The model presumes a large and rapid decline in Mozam-bique’s aid dependency. The share of ODA in gross national in-come (GNI) has declined from about 60% in 1994 to a level close to 20% in the period since 2003. This was due to the rapid growth in GNI rather than a fall in ODA in real terms, which actually in-creased during this period. There was, however, a gradual shift in the composition of ODA, towards concessional loans. According to DNO data, grants declined very slightly in real terms during the period 2008-2012. The forward scenario uses IMF projections until 2018 and then assumes a trajectory of smaller reductions in grants in the period from 2019 to 2023 (IMF 2013 and 2014). Overall, this means a substantial decline in grants, during the period from 2012 to 2023, in both their relative contribution (from 6.0% to 0.8% of non-extractive GDP) and their absolute value in constant prices (a fall of almost 75% during this period).
The projection of a large absolute real decline in grants may be unduly pessimistic. This did not happen even in the aftermath of the global financial crisis, bucking predictions at the time. There is no evidence that donors are planning to reduce their aid due to the prospect of a large increase in government revenue from natural gas – possibly because this expected surge in domes-tic revenue is still a few years into the future and rather uncertain. Interviews with donors in the course of this study suggested that, while aid would decline in relative terms, due to the rapid growth of GDP, it might not fall much in absolute real terms over the next few years. There are grounds to believe that the composition of aid will continue to change, to the detriment of programme aid (gener-al and sector budget support), due to unease among donors with some aspects of governance and economic management, as well as a broader shift in key OECD countries away from the program-matic aid approaches promoted by the Paris Declaration on Aid Ef-fectiveness. This could lead to an increase in transaction costs and a decline in the efficiency of aid flows, thereby potentially under-mining fiscal space to a limited extent.
Invest more and better in children. Perspectives for improved financing of the social sectors in Mozambique24
4.3 DEFICIT FINANCING
The reality of many fiscal expansions historically is that deficit financing can play a major role in creating fiscal space, especially if public investments pay off in terms of social and economic returns in the medium to long run. This is true even though the preferred means of creating fiscal space are tax revenues and expenditure reprioritization, which carry fewer risks than borrowing (in terms of debt sustainability). Much hinges on the quality of public investment decisions, and their expected rate of return, as well as the capacity to service debt, which depends in part on the scale of future revenues from extractive industries and thus is subject to the uncertainties about LNG prices and revenue already discussed.
The analysis here uses a benchmark fiscal deficit of 5.5% of non-extractive GDP, which is close to the average level of fis-cal deficits in recent years and is also considered sustainable in a developing country like Mozambique with high growth prospects and a very low debt service ratio, which has remained well below 5% of exports of goods and services since 2006. Although it is higher than the benchmarks used in some previous analyses by the IMF, the 5.5% benchmark was considered reasonable and ap-propriate in discussions on these scenarios with the IMF Country Office in March 2014.
4.4 THE OVERALL RESOURCE ENVELOPE
The reality is that Mozambique has already been very suc-cessful in creating fiscal space in recent years. As defined in this analysis, the total resource envelope rose in real terms by 62% between 2008 and 2013, due to the impressive growth in do-mestic government revenue. Actual government expenditure rose even more, by 73%, because the government pursued a highly ex-pansionary fiscal policy towards the end of this period.
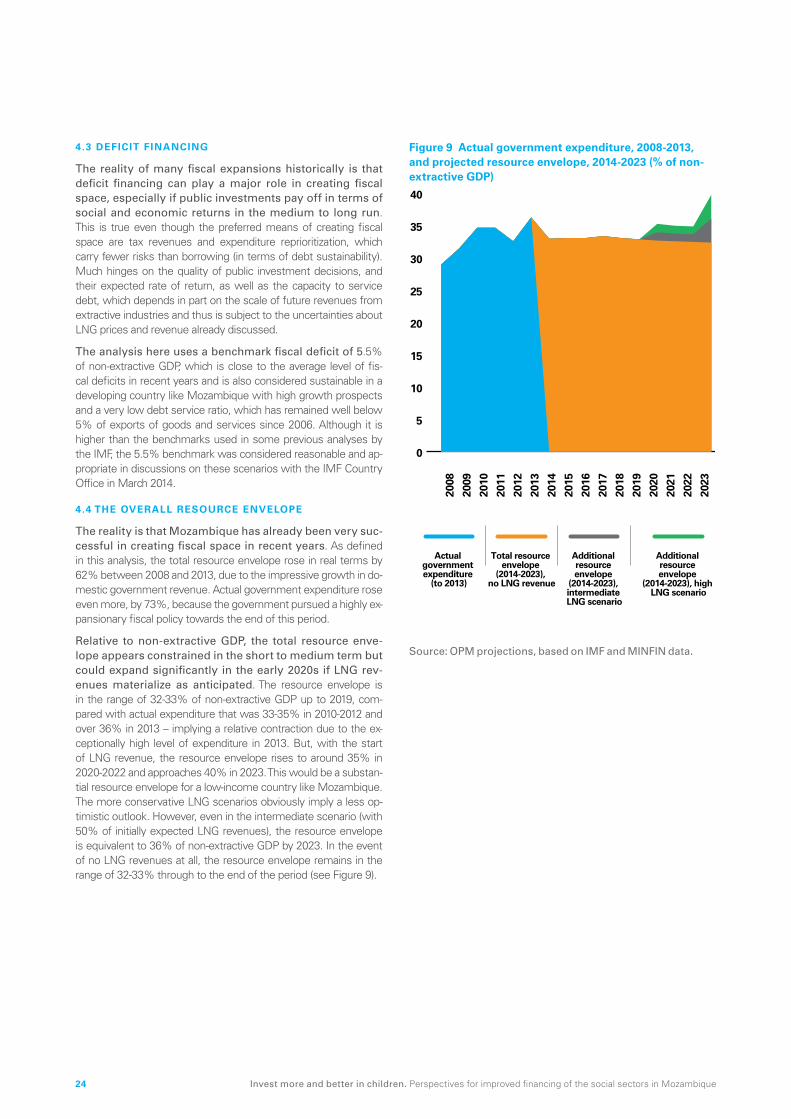
Relative to non-extractive GDP, the total resource enve-lope appears constrained in the short to medium term but could expand significantly in the early 2020s if LNG rev-enues materialize as anticipated. The resource envelope is in the range of 32-33% of non-extractive GDP up to 2019, com-pared with actual expenditure that was 33-35% in 2010-2012 and over 36% in 2013 – implying a relative contraction due to the ex-ceptionally high level of expenditure in 2013. But, with the start of LNG revenue, the resource envelope rises to around 35% in 2020-2022 and approaches 40% in 2023. This would be a substan-tial resource envelope for a low-income country like Mozambique. The more conservative LNG scenarios obviously imply a less op-timistic outlook. However, even in the intermediate scenario (with 50% of initially expected LNG revenues), the resource envelope is equivalent to 36% of non-extractive GDP by 2023. In the event of no LNG revenues at all, the resource envelope remains in the range of 32-33% through to the end of the period (see Figure 9).
Figure 9 Actual government expenditure, 2008-2013, and projected resource envelope, 2014-2023 (% of non-extractive GDP)
Actual government expenditure
(to 2013)
Total resource envelope
(2014-2023), no LNG revenue
Additional resource envelope
(2014-2023), intermediate LNG scenario
Additional resource envelope
(2014-2023), high LNG scenario
0
5
10
15
20
25
30
35
40
2017
2018
2019
2020
2021
2022
2023
2014
2015
2016
2013
2008
2009
2010
2011
2012
Source: OPM projections, based on IMF and MINFIN data.

Invest more and better in children. Perspectives for improved financing of the social sectors in Mozambique 25
However, in absolute terms, all the scenarios point to very substantial growth of the total resource envelope. This is because of the high rate of non-extractive GDP growth, which, although somewhat lower than in the period 1994-2012 (close to 8%), is projected to remain on average above 6% in the peri-od 2014-2022, driving the growth of domestic government rev-enue, which greatly exceeds the decline projected in external grants (see Figure 10).
Figure 10 Trend in total resource envelope, 2008-2023 (MT billion at 2012 constant prices)
2017
2018
2019
2020
2021
2022
2014
2015
2016
2013
2009
2010
2011
2012
Fiscal de�cit (5.5% benchmark)
External grants
Non-LNG domestic revenue
LNG revenue (intermediate scenario)
LNG revenue (high scenario)
0
50
100
150
200
250
300
350
2008
2023
Source: OPM projections, based on IMF and MINFIN data.
In other words, non-extractive GDP growth and the fis-cal revenues it generates (along with deficit financing) can create substantial space for expenditure increases throughout the coming decade. By 2023, the Government would be able to spend almost MT 325 billion in 2012 prices, compared to less than MT 150 billion in 2012, if the high LNG scenario is achieved and still MT 265 billion if no LNG revenues accrue during the period. In other words, whatever happens to LNG revenues, the total fiscal resource envelope is set to in-crease hugely in absolute terms if non-extractive GDP continues to grow at the high rates expected. Furthermore, the increase in the resource envelope could be higher than these projections suggest if, as is quite possible, external grants do not decline as sharply in real terms as has been assumed here.
Invest more and better in children. Perspectives for improved financing of the social sectors in Mozambique26
Conclusion: perspectives for improved financing
5 of the social sectors

Invest more and better in children. Perspectives for improved financing of the social sectors in Mozambique 27
This final section brings together the social sector cost and results scenarios with the scenarios for the public re-source envelope to obtain an integrated overview of fu-ture perspectives for government financing of the social sectors. The results are shown in Figure 11 for the period 2014-2023. The combined funding needs of the education, health, so-cial protection, and water and sanitation sectors are those calcu-lated for each of the three scenarios (cautious, intermediate and aspirational) developed in Chapter 3. The three scenarios for the total government resource envelope, which differ towards the end of the period (2020-2023) due to their different assumptions about future LNG revenues (high, intermediate and none), are taken from Chapter 4. We then apply three different benchmarks for the share of the total resource envelope allocated to the so-cial sectors, as a way of illustrating the levels of expenditure that could be achieved at different levels of budgetary prioritization of the social sectors:
• 35%, which corresponds to the actual share of the four sec-tors in executed government expenditure in 2012 and so may be seen as continuing the status quo;
• 40%, which approximates the highest actual share of the four sectors in executed government expenditure in the period 2008-2012 (39% in 2008), and so may be seen as a realistical-ly achievable historical precedent;
• 50%, which is well above the shares seen in recent years and would be very high by international standards.
The analysis shows that, with only 35% of the resource en-velope allocated to the social sectors, it would be difficult
even to cover the expenditure needs of the low scenario for social sector results and costs, except towards the end of the period. This is partly because of the front-loading of the health sector scenario, including in its cautious variant, to make up early on for existing infrastructure deficiencies. It is only at the very end of the period, assuming that LNG plans are realized fully and on time, that the 35% benchmark exceeds the level needed for the cautious social sector expenditure scenario.
At 40% of the resource envelope, social sector expendi-ture would be sufficient to cover the needs of the low sce-nario and, in the later years with LNG revenue, to come closer to achieving the intermediate scenario. However, even at the end of the period and assuming full achievement of LNG plans, this level of prioritization of the social sectors in re-source allocation is still insufficient to meet fully the expenditure needs of the intermediate scenario. Without LNG revenue, ex-penditure would remain only marginally above the needs of the cautious scenario even at the end of the period.
It is only at a much higher level of prioritization of the so-cial sectors (50% of the resource envelope) that the ex-penditure needs of the intermediate scenario can be met in full, from about 2018 onwards. Assuming LNG revenues come on stream at the planned level, this level of prioritization of the social sectors makes it possible at the very end of the period to begin to meet some of the additional needs of the high sce-nario – but only in 2023 and only partially. Although this has not been modelled, the high scenario (of universal coverage) might then become feasible, at this high level of expenditure prioritiza-tion of the social sectors, in the mid to late 2020s if gas revenues expand further as anticipated.

Invest more and better in children. Perspectives for improved financing of the social sectors in Mozambique28
Figure 11 Social sector expenditure needs and financing, 2014-2023, by scenarios (% of non-extractive GDP)
Cost (low scenario)
Cost (intermediate scenario)
Rea
l 201
2
Cost (high scenario)
Financing (no LNG scenario)
Financing (intermediate scenario
with LNG)
Financing (high scenario
with LNG)
2014
2015
2016
2017
2018
2019
2020
2021
2022
2023
0
5
10
15
20
25Social sector expenditure at 35% of resource envelope
Rea
l 201
2
2014
2015
2016
2017
2018
2019
2020
2021
2022
2023
0
5
10
15
20
25Social sector expenditure at 40% of resource envelope
Cost (low scenario)
Cost (intermediate scenario)
Cost (high scenario)
Financing (no LNG scenario)
Financing (intermediate scenario
with LNG)
Financing (high scenario
with LNG)
Rea
l 201
2
2014
2015
2016
2017
2018
2019
2020
2021
2022
2023
0
5
10
15
20
25Social sector expenditure at 50% of resource envelope
Cost (low scenario)
Cost (intermediate scenario)
Cost (high scenario)
Financing (no LNG scenario)
Financing (intermediate scenario
with LNG)
Financing (high scenario
with LNG)
Source: OPM projections, based on IMF and MINFIN data and social sector models.

Invest more and better in children. Perspectives for improved financing of the social sectors in Mozambique 29
RECOMMENDATIONS
The clear implication of this analysis is that, if Mozam-bique is to meet even the modest targets of the low social sector scenario in the early years and possibly go slightly beyond this in the later years, it will be essential to allocate at least 40% of the resource envelope (or total government expenditure) to the social sectors. This means restoring the relative share achieved in 2008 as a minimum. It is pertinent to highlight that, at this level of financing and expenditure, the re-sults that could be achieved would be quite limited:
• In education, Mozambique would remain far from achieving universal primary completion (one of the MDGs), with a gross primary completion rate that is higher than now but still below 60% by 2023;
• In health, the gains would be larger, because this is the sector with the largest expenditure increases in the low scenario rel-ative to historical levels, resulting by 2023 in close to 80% of pregnant women receiving basic antenatal care and close to 80% of children with severe acute malnutrition receiving treat-ment (among other results);
• Still only about two thirds of the population would be using improved water sources by 2023 (up from 53% in 2011) and only about a third using improved sanitation facilities (up from 24% in 2011);
• Social protection coverage would remain quite limited, benefit-ing only about 7% of households (in 2023), including relatively few vulnerable children.
Anything lower than a 40% allocation to the social sec-tors would probably mean continued stagnation or even a gradual slide backwards in the coverage and quality of ba-sic social services, as has already been experienced since
2008 in several fields, such as primary education and re-productive health services. This would inevitably have ad-verse consequences not only in the short term for child wellbe-ing, but also in the long term for human development, economic diversification (beyond enclave extractive industries) and poverty reduction.
Finally, there may be opportunities to widen fiscal space beyond the projections in the scenarios presented here.
• First, it may be possible to expand domestic revenue further by raising the tax paid by mining companies, given the evi-dence that the mining sector has been heavily under-taxed in the past. Further revenue gains from capital gains are also pos-sible, although difficult to predict.
• Second, while the scenarios presented in this paper incorpo-rated the pessimistic IMF forecast for aid flows, a case should be made to donors to maintain aid flows at least at their cur-rent absolute level (in real terms). Even with high growth and possibly gas revenues towards the end of the period, Mozam-bique will still be a poor country. This is particularly important from the perspective of social sector financing, as a high pro-portion of aid goes to these sectors. If there is a decline in aid flows, the Government would have to increase considerably the share of domestic resources allocated to the social sec-tors, particularly in heavily aid-dependent sectors such as wa-ter and sanitation, health and HIV/AIDS.
• Third, additional resources for high-priority programmes can be obtained, even within the social sectors themselves, by im-proving the prioritization and efficiency of expenditure – the fourth corner of the fiscal diamond that was not discussed in this paper. In other words, it is a question also of improving the quality of spending (value for money) and not only increasing the level of spending.
Invest more and better in children. Perspectives for improved financing of the social sectors in Mozambique30
FOOTNOTES
1. Situation of Children in Mozambique 2014, UNICEF, Mapu-to, June 2014.
2. Sebastian Silva-Leander, Mozambique Situation Analysis: Costing Report, May 2014.
3. Carlos Oya and Samuel Zita, Mozambique Situation Analy-sis: Fiscal Space and Financing Scenarios in the Context of the Resource Boom, May 2014.
4. Comparative education data are from UNESCO Institute of Statistics (data.uis.unesco.org).
5. The projected decreases in expenditure between 2017 and 2018 in all scenarios reflect the frontloading of infrastruc-ture investments in the PESS costing, which envisages that most of the new building requirements will be completed by 2017.
6. The social protection model includes a micro-econometric estimation of the coverage of different programmes, using data from the Mozambique household budget survey (IOF) and the programmes’ eligibility criteria (e.g. age, income, la-bour capacity, etc.). See ILO et al, 2013.
7. This is because households with an absolute labour con-straint are abnormally small, with very few children. For an analysis of the impact of the PSSB on children, see Hodges et al, 2012.
8. The projections also use simplified assumptions regarding unit costs for investment in urban and rural water and sani-tation, which are best estimates based on the current tech-nology mix in urban and rural areas. Water and sanitation facil-ities in rural areas are assumed to have a lifespan of 20 and 10 years respectively, whereas water investments in urban areas are expected to last for 40 years and sanitation facilities for 20 years. The replacement cost is estimated based on the value of the existing stock of capital, assuming a depreciation of the val-ue that is proportional to the lifespan of the equipment. Main-tenance costs are assumed to represent 25% of capital costs across all types of investments.
9. This is 2% for urban and rural water, 17% for rural sanitation and 37.5% for urban sanitation.
10. See Financial Times, 24 November 2013.
11. In 2013 there was also a further surge in revenues thanks to unanticipated capital gains from the extractive sector, equiv-alent in value to 4.2% of GDP, up from 1.2% in 2012. This may herald a new source of fiscal space gains, resulting from new rules on the taxation of capital gains, but the lumpy and unpre-dictable nature of such gains, related to sales of assets in gas and mining ventures, makes them inherently difficult to model.

Invest more and better in children. Perspectives for improved financing of the social sectors in Mozambique 31
REFERENCES
Castel-Branco C (2011) Desafios da mobilização de recursos domésticos: Revisão crítica do debate, Caderno IESE nº 8, Instituto de Estudos Sociais e Económicos, Maputo
Castel-Branco C (2013) ‘Reflectindo sobre a acumulação, porosidade e industrialização em contexto de economia extractiva’, in L de Brito et al (eds.), Desafios para Moçambique 2013, Instituto de Estudos Sociais e Económicos, Maputo
CIP (2013a) ‘Financing Mozambique’s stake in Rovuma natural gas: Big costs, big risks’, Edition nº 05/2013, April, Centro de Integridade Pública de Moçambique, Maputo
CIP (2013b) ‘As potenciais receitas do Rovuma, Implicações dos contratos de 2006 para as receitas do Estado’, Edição nº 07/2013, Maio, Centro de Integridade Pública de Moçambique, Maputo
CIP (2013c) ‘Pande Temane gas exports to South Africa: First major extractive sector projects fails Mozambique’, Edition nº 17/2013, November, Centro de Integridade Pública de Moçambique, Maputo
Di John J (2010) ‘The political economy of taxation and resource mobilization in Sub-Saharan Africa’, in Padayachee V (ed.) The Political Economy of Africa, Routledge, New York
DNA (1995) Política Nacional de Água de Moçambique, Direcção Nacional da Águas, Maputo
Dutta A, Perales N, Silva R & Crivillé L (2013) Estimated resource needs and impact of Mozambique’s Plano Estratégico do Sector Saúde, 2014-2019, Futures Group, Health Policy Project, Washington, DC
Fjeldstad OH and Heggstad KK (2011) The tax systems in Mozambique, Tanzania and Zambia: Capacity and constraints, Christian Michelsen Institute, and NORAD, Oslo
Heller P (2005) ‘Understanding fiscal space’, Policy Discussion Paper nº 5/4, International Monetary Fund, Washington DC
Hubert D (2013) ‘Natural Gas from the Rovuma Basin: A “Game Changer” for Mozambique?’, paper prepared for UNICEF Mozambique, Maputo
ILO, IMF and OPM (2013) ‘Extension of social security: Towards a Mozambican Social Protection Floor, Consolidating a comprehensive social protection system in Mozambique: Analysis of policy alternatives and costs’, ESS paper nº 41, International Labour Organization, with International Monetary Fund and Oxford Policy Management
IMF (2013) Fiscal Framework Considerations for the New Resource-Rich Environment, International Monetary Fund, Washington DC
IMF (2014) Policy Support Instrument Review, Republic of Mozambique, First Review, IMF Country Report nº 14/20, January, International Monetary Fund, Washington DC
Kuegler A (2009) ‘Fiscal Treatment of Mega-Projects’, in Arndt C and Tarp F (eds.) Taxation in a low-income economy, the case of Mozambique’, Routledge, New York
Melina G and Xiong Y (2013) ‘Natural gas, public investment and debt sustainability in Mozambique’, IMF Working Paper WP/13/261, International Monetary Fund, Washington DC
MINFIN (2014) Relatório de Execução do Orçamento do Estado, Ano 2013, Janeiro a Dezembro, Ministério das Finanças, Maputo
Roy R and Heuty A (2009) Fiscal Space: Policy Options for Financing Human Development, Earthscan
UNAIDS (2013) Getting to zero: HIV in Eastern & Southern Africa, United Nations Programme on HIV/AIDS, Geneva

Invest more and better in children. Perspectives for improved financing of the social sectors in Mozambique32
PHOTO CREDITS
Cover: © UNICEF/MOZA2012-00610/Caroline BachPage 6: © UNICEF Mozambique/2011/Mark LehnPage 9: © UNICEF Mozambique/2011/Mark LehnPage 12: © UNICEF/MOZA2012-00408/Ian Berry/
Magnum PhotosPage 22: © UNICEF Mozambique/2011/Mark LehnPage 27: © UNICEF/MOZA2012-00065/Alex Webb/
Magnum Photos

Invest more and better in children. Perspectives for improved financing of the social sectors in Mozambique 33