Inverse Dual-Permeability Modeling of Preferential Water ...
18
Inverse Dual-Permeability Modeling of Preferential Water Flow in a Soil Column and Implications for Field-Scale Solute Transport J. Maximilian Ko ¨hne,* Binayak P. Mohanty, and Jirka S ˇ imu ˚ nek ABSTRACT The question of whether or not soil hydraulic parameters of dual- permeability models (DPM) can be properly identified by inverse analysis of preferential water flow data has not been resolved to date. We applied a DPM based on two coupled Richards’ equations to compare the performance of inverse and forward simulations of labo- ratory preferential flow data. Infiltration and drainage experiments were conducted using a repacked loam soil column (80 cm long, 24-cm diameter) containing a cylindrical sand region (2.4-cm diameter) as the preferential flow path (PFP) along its central axis. The forward DPM water flow simulations relied on hydraulic parameters for the matrix and the PFP as determined by means of separate infiltration and drainage experiments on loam and sand columns, respectively. One inverse DPM approach relied on standard (lumped) observations of infiltration and outflow, while the other included outflow through the matrix and the PFP. Both inverse approaches provided accurate matches of bulk infiltration and outflow, but the outflow out of the matrix and the PFP could only be described when fitting the DPM to region-specific outflow data. The practical implication of this finding for predicting solute transport in natural soils was evaluated. An ob- served tile-drainage hydrograph was used for inverse hydraulic DPM parameter estimation, followed by fitting the solute transfer coefficient and the dispersivity for simulating Br 2 tracer concentrations. This sequential fitting procedure was successful for hydrograph simulation but unsuccessful for Br 2 breakthrough simulation. Simultaneous hy- draulic and transport parameter estimation considerably improved the approximation of Br 2 concentrations. This study shows that a hydrograph alone is not sufficient for inverse identification of soil hydraulic DPM parameters. Simultaneously employing hydrograph and solute breakthrough data may facilitate identification of hydraulic and transport DPM parameters to characterize preferential flow and solute transport. D UAL-PERMEABILITY MODELS are increasingly used for analysis of preferential solute transport in structured soils that contain PFPs, such as fractures or macropores, both on the laboratory column scale (e.g., Gwo et al., 1995, 1996; Allaire et al., 2002a, 2002b; Castiglione et al., 2003; Greco, 2002; Ka ¨ tterer et al., 2001) and on the plot or field scale (e.g., Jarvis et al., 1991; Andreu et al., 1994; Larsson and Jarvis, 1999a, 1999b; Kohler et al., 2001). A problem receiving considerable attention recently is the determination of the many DPM parameters required for simulating preferential water flow and solute transport. While the soil hydraulic func- tions for DPM can be independently estimated from water retention and hydraulic conductivity measure- ments with double-hump curve shapes (e.g., Mohanty et al., 1997; Ko ¨ hne et al., 2002), this approach cannot provide the parameters of water transfer between ma- trix and macropore domains that are also required. In- verse simulation is an alternative way to estimate DPM parameters that are otherwise difficult to obtain. How- ever, questions about the uniqueness of such optimized parameters still exist (S ˇ imu ˚ nek et al., 2001). Several investigations on preferential water flow mechanisms in soils with PFPs were reported (e.g., Booltink and Bouma, 1991; Tofteng et al., 2002; Logsdon, 1995), but only few preferential water flow experiments have been analyzed in detail for evaluation of the region-specific hydraulic parameters related to the matrix or the PFPs (e.g., S ˇ imu ˚ nek et al., 2001; Castiglione et al., 2003; Ko ¨ hne and Mohanty, 2005). While most studies employed a mix- ture of measurements, estimates, and manual calibration of DPM parameters to simulate preferential solute trans- port (e.g., Jarvis et al., 1991; Jabro et al., 1994; Andreu et al., 1994; Ahuja et al., 1995; Larsson and Jarvis, 1999a, 1999b; Malone et al., 2001; Gerke and Ko ¨ hne, 2004), in- verse parameter optimization schemes have been em- ployed as well (e.g., Schwartz et al., 2000; Abbaspour et al., 2001; Ka ¨tterer et al., 2001). Traditionally, the parameters of (nonpreferential) flow and transport models are estimated sequentially. First the soil hydraulic parameters are estimated using hydraulic observations, followed by the estimation of transport parameters using solute concentration data (Jacques et al., 2002; Abbasi et al., 2003). However, comparisons between this sequential fitting procedure and simultaneous estimation of hydraulic and transport parameters from combined data of water flow and sol- ute concentrations rarely showed the sequential scheme to be superior (e.g., Abbasi et al., 2003), while other studies found the simultaneous scheme to be more ef- ficient (Medina and Carrera, 1996; Mishra and Parker, 1989; Inoue et al., 2000). For example, S ˇ imu ˚ nek et al. (2002) used experimental data of Inoue et al. (2000) and showed that although the final parameter estimates for both sequential and simultaneous optimizations were very similar, the confidence intervals for the simulta- neous optimization of soil hydraulic and solute transport parameters, as well as the final value of the objective function, were smaller. It remains unclear whether the sequential parameter estimation scheme can be em- ployed for the inverse simulation of preferential water J.M. Ko ¨hne and B.P. Mohanty, Dep. of Biological & Agricultural Engineering, Texas A&M Univ., Scoates Hall, College Station, TX 77843-2117; J. S ˇ imu ˚nek, Univ. of California, Dep. of Environmental Sciences, 900 University Av., A135 Bourns Hall, Riverside, CA 92521; J.M. Ko ¨hne, currently, Institute for Land Use, Univ. Rostock, Justus- von-Liebig Weg 6, 18059 Rostock, Germany. Received 14 Jan. 2005. *Corresponding author ([email protected]). Published in Vadose Zone Journal 5:59–76 (2006). Original Research doi:10.2136/vzj2005.0008 ª Soil Science Society of America 677 S. Segoe Rd., Madison, WI 53711 USA Abbreviations: DPM, dual-permeability model; IC, initial conditions; LBC, lower boundary conditions; PFP, preferential flow path; SWCC, soil water characteristic curve; TDR, time domain reflectometry. Reproduced from Vadose Zone Journal. Published by Soil Science Society of America. All copyrights reserved. 59 Published online December 16, 2005
Transcript of Inverse Dual-Permeability Modeling of Preferential Water ...
Inverse Dual-Permeability Modeling of Preferential Water Flow in a Soil Column andImplications for Field-Scale Solute Transport
J. Maximilian Kohne,* Binayak P. Mohanty, and Jirka Simunek
ABSTRACTThe question of whether or not soil hydraulic parameters of dual-
permeability models (DPM) can be properly identified by inverseanalysis of preferential water flow data has not been resolved to date.We applied a DPM based on two coupled Richards’ equations tocompare the performance of inverse and forward simulations of labo-ratory preferential flow data. Infiltration and drainage experimentswere conducted using a repacked loam soil column (80 cm long, 24-cmdiameter) containing a cylindrical sand region (2.4-cm diameter) as thepreferential flow path (PFP) along its central axis. The forward DPMwater flow simulations relied on hydraulic parameters for the matrixand the PFP as determined by means of separate infiltration anddrainage experiments on loam and sand columns, respectively. Oneinverse DPM approach relied on standard (lumped) observations ofinfiltration and outflow, while the other included outflow through thematrix and the PFP. Both inverse approaches provided accuratematches of bulk infiltration and outflow, but the outflow out of thematrix and the PFP could only be described when fitting the DPM toregion-specific outflow data. The practical implication of this findingfor predicting solute transport in natural soils was evaluated. An ob-served tile-drainage hydrograph was used for inverse hydraulic DPMparameter estimation, followed by fitting the solute transfer coefficientand the dispersivity for simulating Br2 tracer concentrations. Thissequential fitting procedure was successful for hydrograph simulationbut unsuccessful for Br2 breakthrough simulation. Simultaneous hy-draulic and transport parameter estimation considerably improvedthe approximation of Br2 concentrations. This study shows that ahydrograph alone is not sufficient for inverse identification of soilhydraulic DPM parameters. Simultaneously employing hydrographand solute breakthrough data may facilitate identification of hydraulicand transport DPM parameters to characterize preferential flow andsolute transport.
DUAL-PERMEABILITY MODELS are increasingly usedfor analysis of preferential solute transport in
structured soils that contain PFPs, such as fracturesor macropores, both on the laboratory column scale(e.g., Gwo et al., 1995, 1996; Allaire et al., 2002a, 2002b;Castiglione et al., 2003; Greco, 2002; Katterer et al., 2001)and on the plot or field scale (e.g., Jarvis et al., 1991;Andreu et al., 1994; Larsson and Jarvis, 1999a, 1999b;Kohler et al., 2001). A problem receiving considerableattention recently is the determination of the many DPMparameters required for simulating preferential water
flow and solute transport. While the soil hydraulic func-tions for DPM can be independently estimated fromwater retention and hydraulic conductivity measure-ments with double-hump curve shapes (e.g., Mohantyet al., 1997; Kohne et al., 2002), this approach cannotprovide the parameters of water transfer between ma-trix and macropore domains that are also required. In-verse simulation is an alternative way to estimate DPMparameters that are otherwise difficult to obtain. How-ever, questions about the uniqueness of such optimizedparameters still exist (Simunek et al., 2001). Severalinvestigations on preferential water flow mechanismsin soils with PFPs were reported (e.g., Booltink andBouma, 1991; Tofteng et al., 2002; Logsdon, 1995), butonly few preferential water flow experiments have beenanalyzed in detail for evaluation of the region-specifichydraulic parameters related to the matrix or the PFPs(e.g., Simunek et al., 2001; Castiglione et al., 2003; KohneandMohanty, 2005).While most studies employed amix-ture of measurements, estimates, and manual calibrationof DPM parameters to simulate preferential solute trans-port (e.g., Jarvis et al., 1991; Jabro et al., 1994; Andreuet al., 1994; Ahuja et al., 1995; Larsson and Jarvis, 1999a,1999b; Malone et al., 2001; Gerke and Kohne, 2004), in-verse parameter optimization schemes have been em-ployed as well (e.g., Schwartz et al., 2000; Abbaspouret al., 2001; Katterer et al., 2001).Traditionally, the parameters of (nonpreferential)
flow and transport models are estimated sequentially.First the soil hydraulic parameters are estimated usinghydraulic observations, followed by the estimation oftransport parameters using solute concentration data(Jacques et al., 2002; Abbasi et al., 2003). However,comparisons between this sequential fitting procedureand simultaneous estimation of hydraulic and transportparameters from combined data of water flow and sol-ute concentrations rarely showed the sequential schemeto be superior (e.g., Abbasi et al., 2003), while otherstudies found the simultaneous scheme to be more ef-ficient (Medina and Carrera, 1996; Mishra and Parker,1989; Inoue et al., 2000). For example, Simunek et al.(2002) used experimental data of Inoue et al. (2000) andshowed that although the final parameter estimates forboth sequential and simultaneous optimizations werevery similar, the confidence intervals for the simulta-neous optimization of soil hydraulic and solute transportparameters, as well as the final value of the objectivefunction, were smaller. It remains unclear whether thesequential parameter estimation scheme can be em-ployed for the inverse simulation of preferential water
J.M. Kohne and B.P. Mohanty, Dep. of Biological & AgriculturalEngineering, Texas A&M Univ., Scoates Hall, College Station, TX77843-2117; J. Simunek, Univ. of California, Dep. of EnvironmentalSciences, 900 University Av., A135 Bourns Hall, Riverside, CA 92521;J.M. Kohne, currently, Institute for Land Use, Univ. Rostock, Justus-von-Liebig Weg 6, 18059 Rostock, Germany. Received 14 Jan. 2005.*Corresponding author ([email protected]).
Published in Vadose Zone Journal 5:59–76 (2006).Original Researchdoi:10.2136/vzj2005.0008ª Soil Science Society of America677 S. Segoe Rd., Madison, WI 53711 USA
Abbreviations: DPM, dual-permeability model; IC, initial conditions;LBC, lower boundary conditions; PFP, preferential flow path; SWCC,soil water characteristic curve; TDR, time domain reflectometry.
Reproducedfrom
VadoseZoneJournal.PublishedbySoilScienceSociety
ofAmerica.Allcopyrights
reserved.
59
Published online December 16, 2005
flow and solute transport in the vadose zone, since waterflow observations may not always contain sufficientinformation for proper inverse identification of hydrau-lic DPM parameters (Simunek et al., 2001). A recentstudy showed that despite an excellent fit of the tile-drainage hydrograph, a two-dimensional dual-porosity(mobile–immobile) model may fail to describe observedtracer breakthrough (Haws et al., 2005).
These findings from previous studies suggest that (i)hydrographs may not carry enough information to dis-tinguish between local water flow paths with distinctlydifferent water flow velocities and (ii) while domain-specific flow velocities may not be critical to describewater flow, they may become significant for simulatingpreferential solute transport. Although reasonable, theabove conclusions are only partly supported by exper-imental data, since these data were obtained ratherindirectly at the field scale, where many additional con-founding unknowns are present, such as soil heteroge-neity, off-site contributions, catchment boundaries, andinitial and boundary conditions. Hence, a closer exami-nation of the underlying causes of the above findingsseems warranted.
The primary objective of this study was to investigate ifDPM hydraulic parameters for matrix and PFP regionscan be identified based on standard soil hydraulic ob-servations, such as infiltration, outflow, pressure heads,and water contents of a well-controlled column experi-ment, or if additional domain-specific outflow throughmatrix and PFP must be included. The secondary objec-tive was to evaluate the practical implications of theDPM hydraulic parameter identification for field-scale
preferential solute transport prediction. Observations ofdrainage flux and preferential Br2 tracer breakthroughin a tile-drained field between 1991 and 1994 (Lennartzet al., 1999) were simulated, and we compared the perfor-mances of sequential and simultaneous inverse estimationof soil hydraulic and solute transport DPM parameters.
MATERIALS AND METHODS
Physical Soil Properties
The particle size distributions of the sandy loam soil (hence-forth referred to as loam) and coarse and medium sand arelisted in Table 1. The loam, sampled from arable land nearCollege Station, TX, was air-dried and ground. Additionally,30 smaller soil columns (7.5 cm in diameter and height) werepacked with loam and the medium and coarse sand (10 col-umns per material) to measure the soil water characteristiccurves (SWCC) between saturation and 2500 cm pressurehead according to Klute (1986). Based on the 10 sets of datafor each material, the average water retention functions weredetermined by fitting soil hydraulic functions (van Genuchten,1980) using the RETC model (van Genuchten et al., 1991).Furthermore, the saturated hydraulic conductivity, Ks, wasmeasured on the same soil columns (Klute and Dirksen, 1986).The results for Ks and the SWCC are provided in Table 2.
Flow Experiments with the Homogeneous Soil Columns
Laboratory soil columns 16 cm in diameter and 40 cm highwere packed with loam, coarse sand, and medium sand, re-spectively. These air-dry soil materials were packed using apiston compactor at 3-cm increments to obtain relatively ho-mogeneous bulk densities between 1.6 and 1.7 g cm23. Thebulk densities theoretically correspond to porosities ranging
Table 1. Particle size distribution, organic carbon content (OC), and bulk density (r) of the soil materials used in the homogeneous soilcolumns (i.e., loam, medium-sand, and coarse-sand columns) and in the columns with preferential flow paths (PFP).
Material (pore domain)†
Particle size fractions
Coarse sand2–0.5 mm
Medium sand0.5–0.2 mm
Fine sand0.2–0.05 mm
Silt 0.05–0.002mm
Clay,0.002 mm OC r†
% g cm23
Loam (matrix) 0.0 0.6 52.5 35.8 11.1 0.24 1.66 (1.59)Coarse sand (PFP) 87.8 11.3 0.9 0 0 n.a. 1.65 (1.61)Medium sand (PFP) 16.9 55.1 27.4 0. 6 0 n.a. 1.64 (1.60)
†Name or number in parentheses is for the column with PFP.
Table 2. Soil hydraulic van Genuchten’s (1980) parameters and the range of 95% confidence limits obtained by inverse solution of theRichards’ equation (Simunek et al., 1998) based on experimental infiltration and drainage data for homogeneous loam andmedium-sandand coarse-sand columns. The parameters were used in the forward dual-permeability simulations. Corresponding parameters are alsogiven for the soil water characteristic curve (SWCC) measured at static equilibrium and for Ks at steady-state flow (SSF).
Exp. ur us a n Ks R
cm3 cm23 cm21 cm d21 dLoam
Iinfiltration 0.208 6 0.007 0.340† 0.0051 6 0.0001 2.67 6 0.223 1.7 6 0.1 n.a.¶Drainage 0.195 6 0.016 0.340† 0.0090 6 0.0000 1.27 6 0.07 7.4 6 3.7 n.a.SWCC, SSF 0† 0.391 6 0.006 0.0035 6 0.000 2.40 6 0.32 11.2 6 2.6 n.a.
Medium sand
Infiltration 0† 0.300† 0.0296 6 0.0015 1.93 6 0.16 609 6 34 n.a.SWCC, SSF 0.0 0.370 6 0.012 0.0234 6 0.0038 2.04 6 0.14 850 6 274 n.a.
Coarse sand
Drainage 0† 0.340 6 0.0 0.2500‡ 6 0.0140 1.76 6 0.027 10917 6 1476 0.0335 6 0.0013SWCC, SSF 0† 0.370† 0.1561 6 0.0421 2.24 6 0.31 15542 6 7091 n.a.
†Fixed (not fitted).‡At upper constraint.¶Not available.
Reproducedfrom
VadoseZoneJournal.PublishedbySoilScienceSociety
ofAmerica.Allcopyrights
reserved.
60 VADOSE ZONE J., VOL. 5, FEBRUARY 2006
between 0.35 and 0.4, if a particle density of 2.65 g cm23 isassumed. After slowly saturating the columns with deionizedwater from the bottom to the top to avoid air inclusions, out-flow and infiltration experiments were conducted to determinethe soil hydraulic parameters. A tension infiltrometer with a16-cm-diameter infiltration disc (i.e., matching the soil column)was used for infiltration at zero pressure head. At the columnbottom the soil was in contact with a nylon membrane sup-ported by a densely perforated PVC plate. The lower (seepage)boundary was subject to adjustable suctions controlled by avacuum system with an automated outflow monitoring system.Pressure heads were recorded across the soil column with ten-siometers at 10-, 20-, and 30-cm depths, while water contentsat the 10- and 30-cm depths were measured using time domainreflectometry (TDR) probes of 8-cm length (the same probeswere used in the preferential flow experiments described below).
Experiments were conducted for the following initial andlower boundary conditions (IC and LBC): (i) infiltration intothe loam column (IC:2140 cm, LBC: 0 cm), (ii) three-step out-flow out of the initially saturated loam column (LBC: 0, 260,and 2120 cm), (iii) infiltration into the medium-sand column(IC: 240 cm (top) to 220 cm (bottom), LBC: 215 and 0 cm),(iv) drainage from the initially saturated coarse-sand column(LBC: 0, 230, and 260 cm). Infiltration into coarse sand wasmeasured as well; however, unstable (fingering) flow was ob-served, and the results were excluded from further analysis.
Preferential Flow Experiments
Our soil column setup for studying preferential flow wasdescribed in detail in a recent study (Kohne and Mohanty,2005). Only those setup features are mentioned here that arerelevant to the present study, or that were modified. The setupconsisted of a large loam soil column (24.4-cm diameter, 80-cmlength, henceforth referred to as matrix) with a cylindricalsand-filled PFP (2.4-cm diameter) at the center. A 5-cm-highcylindrical flow separator at the bottom was used to preventwater exchange between the matrix and the PFP due toboundary effects. The PFP region was implemented by ver-tically attaching a metal tube of 2.4-cm diameter to the flowdivider, pouring coarse sand into the metal tube, and slightlycompacting the sand by knocking on the tube’s side-walls. Theloam was packed similarly as for the homogeneous columns,leading to a comparable bulk density (Table 1). After both thematrix and PFP domains were established, the metal tube wascarefully pulled out of the column. The matrix and PFP do-mains were thus in direct contact with each other, but withoutany lateral soil mixing or intrusions between loam and sand,as was verified in horizontal cross sections taken after comple-tion of the experiments. The soil column was slowly saturatedfrom the bottom with deionized water before the first (drain-age) experiment.
For infiltration under constant head boundary condition, atension infiltrometer with infiltration disc of matching diam-eter (24 cm) was employed. Column outflow through the bot-tom boundary (consisting of a perforated plate with nylonmembrane) was monitored separately for the matrix and thePFP. Pressure heads within the PFP were measured withcustom mini-tensiometers (porous ceramic cup: 0.2-cm diam.,1.5-cm length) at depths of 5, 20, 35, 50, and 65 cm. At the samedepths, another set of tensiometers with a 0.6-cm-diameterceramic cup was installed in the soil matrix at distances of 6and 2 cm from the macropore wall, respectively.
Corresponding to the mini-tensiometers, 8-cm-long TDRprobes were used to measure the matrix water contents at thesame depths of 5, 20, 35, 50, and 65 cm. Conventional TDRprobes are too large to measure water contents in the PFP.
Nissen et al. (1998) presented coiled TDR probes with smallerdimensions that allow measurements along short distances. Wefound these to be more suitable to measure water contents inthe PFP, even if they are inherently less accurate than TDRprobes. Four TDR coil probes (0.3-cm diam., 2-cm length)were built according to the design of Nissen et al. (1998) andused to monitor the water content at depths of 20 and 35 cminside the sand-filled PFP and within the loam matrix at adistance of 2 cm from the PFP. The TDR and TDR coil probeswere calibrated separately to measure water contents in thematrix loam and PFP sand.
Three preferential flow experiments were selected forthis study:
Infiltration under zero pressure head into the loam columnwith a medium-sand PFP. Based on tensiometer readings, theinitial hydrostatic pressure head profile increased linearly from2100 cm at the top to220 cm at the bottom of the soil column.A constant pressure head of 220 cm was imposed at the bot-tom boundary.
Infiltration at zero applied pressure head into the loam col-umn with a coarse-sand PFP for somewhat drier initial con-ditions. The hydrostatic pressure head profile varied between2150 cm at the top and270 cm at the bottom. The bottom out-lets of the PFP and the matrix were open to the atmosphere.
Drainage of the initially fully saturated loam column witha coarse-sand PFP. A pressure head of210 cm was applied atthe lower boundary until 138 min, when it was decreased to245 cm.
Field Bromide Displacement Tests
For demonstrating the application and suitability of ourparameter estimation schemes, we used a field Br2 tracerdata set from Lennartz et al. (1999). The experimental fieldsite Bokhorst (northern Germany) had a monitored area of5010 m2. Tile lines were installed at a depth of 1 m and at aspacing of 11 to 14.5 m. The loamy soil at the site was classifiedas a poorly drained Dystric Gleysol. The 0.5-ha experimentalarea was identified as heterogeneous in terms of particle sizedistribution. While the clay content decreased with soil depthfrom 18% to about 10% at the 1-m depth, bulk density in-creased from 1.46 to 1.9 g cm23. The high clay content of thesoil surface layer induced cracks and fissures during dryperiods. The conventional tilled experimental plot was under a3-yr crop rotation with winter rape (Brassica napus L. var.napus) (1991/1992), winter wheat (Triticum aestivum L.) (1992/1993), winter barley (Hordeum vulgare L.), (1993/1994), andwinter rape (1994/1995). In three Br2 tracer tests conductedbetween 1991 and 1994, preferential flow was found to be amajor factor controlling solute transport. Bromide tracer wasapplied once every year in late fall as a KBr solution, and wasmonitored in the drainage discharge during the following 5 mo.Applied mass was comparable among the three tracer tests(ranging between 16.75 and 19.3 kg). Readers are referred toLennartz et al. (1999) for further details about the site, soil,and the tracer experiments.
Numerical Model Simulations
Flow in Homogeneous Soil Columns
The water flow experiments were described by fitting thenumerical solution of the Richards’ equation as implementedin HYDRUS-1D (Simunek et al., 1998) to the observations ofinflow; outflow; pressure heads at the 10-, 20-, and 30-cmdepths; and water contents at the 10- and 30-cm depths. Theresulting van Genuchten (1980) soil hydraulic parameters rep-
Reproducedfrom
VadoseZoneJournal.PublishedbySoilScienceSociety
ofAmerica.Allcopyrights
reserved.
61www.vadosezonejournal.org
resented the matrix (loam) and two PFP materials (mediumsand and coarse sand). The residual water content, ur (L3 L23),was set to zero for the medium and coarse sand. This as-sumption did not adversely affect the description of water flowin the relatively wet water content range as operated in thewater flow experiments. To facilitate the inverse parameteridentification for loam and medium sand, the saturated watercontent, us (L3 L23), was fixed at the measured value.
Preferential Flow in a Soil Column
Dual-permeability models describe preferential flow usingone equation for flow in the matrix and one for flow in thefracture pore system or PFPs, with the two flow regionscoupled by a water transfer term. The DPM of Gerke andvan Genuchten (1993a) as implemented into the modifiedHYDRUS-1D (Simunek et al., 2003) uses the following twomixed-type Richards equations to describe transient waterflow in fractures (Eq. [1a]) and the matrix (Eq. [1b]):
]uf
]t5
]
]z 1Kf
]hf
]z2Kf2 2 Gw
wf
[1a]
]um
]t5
]
]z 1Km
]hm
]z2 Km2 1 Gw
12wf
[1b]
where the subscript “f” defines a property of the fracture poresystem or PFP, the subscript “m” represents the matrix, u is thewater content (L3 L23), h is the pressure head (L), K denotesthe hydraulic conductivity function (LT21), wf is the fraction oftotal soil occupied by the fracture system (0 , wf , 1), andGw is the water transfer term (T21)
Gw 5b
a2Kagw(hf 2 hm) [2]
where b is a dimensionless geometry coefficient, a is thecharacteristic length of the matrix structure (L), Ka is thehydraulic conductivity of the fracture–matrix interface (LT21),and gw is a dimensionless scaling coefficient for which a valueof 0.4 was suggested (Gerke and van Genuchten, 1993b).Because of the absence of depositional coatings at the PFP–matrix interface in our repacked soil columns, we assumed thatKa in the transfer term can be described as
Ka 5 0:5[Km(hf) 1 Km(hm)] [3]
The geometry factor b was calculated assuming hollowcylindrical PFP geometry according to Gerke and vanGenuchten (1996) as
b 51
[0:19ln(161)]2; 1 , 1 , 100 [4]
where the parameter z was calculated as
1 5a 1 bb
[5]
in which b is the cylindrical PFP radius. The volume fraction ofthe PFP, wf, was calculated as
wf 5b2
(a 1 b)25
112
[6]
The numerical grid consisted of 201 elements with a verticalnodal spacing of 0.4 cm to represent the 80-cm-long column.The values for mass-transfer related DPM parameters were
derived from the experimental PFP–matrix geometry (a 511-cm matrix mantle radius, b5 1.2-cm PFP radius, z 5 10.167,b 5 1.0685, and wf 5 0.009675).
The initial condition was defined by the hydrostatic pressurehead profile interpolated between initial tensiometer readingsat various depths. The lower boundary in the model was rep-resented by a seepage face boundary condition, with no flowwhen the boundary was unsaturated, and a zero (atmospheric)pressure head once saturation was reached. For those experi-ments where suction was applied to the lower boundary, theseepage face boundary condition was modified by using thenegative value of applied suction as the threshold value be-tween zero flux and constant pressure head.
Field-Scale Preferential Flow and Bromide Transport
For simplicity, the entire 0.5-ha tile-drained field was rep-resented by a one-dimensional vertical single-layered modeldomain, since assuming several layers or accounting for two-dimensional heterogeneity was impractical for inverse DPMsimulation because of the increasing number of parameters.Soil hydraulic and solute transport DPM parameters of theone-dimensional homogeneous domain were assumed to rep-resent effective soil properties lumped over heterogeneities insoil texture, structure, and effects of tile-induced flow-field.
Preferential water flow was described with Eq. [1] through[3]. However, since the parameters a, Ka, b, and gw in Eq. [2]are difficult to define on the field scale, they were lumpedinto a single water transfer coefficient, vw (T21 L21), whichyields the following simplified expression for the water trans-fer term:
Gw 5 vw(hf 2 hm) [7]
Convection–dispersion equations simulate transport in boththe fracture and matrix regions, again using the DPM of Gerkeand van Genuchten (1993a) as implemented into the modifiedHYDRUS-1D (Simunek et al., 2003), as follows:
]ufcf]t
5]
]z 1ufDf
]cf]z 22
]qfcf]z
2Gs
wf
[8a]
]umcm]t
5]
]z 1umDm
]cm]z 22
]qmcm]z
1Gs
12wf
[8b]
where for the fracture and matrix regions, c is the solute con-centration (L3 M21), q is the volumetric flux density (L T21),and D is the dispersion coefficient (L2 T21) described with thefollowing equation:
ufDf 5 ufD0
u7/3f
u2s,f
1 lf |qf | [9a]
umDm 5 umD0
u7/3m
u2s,m
1 lm|qm| [9b]
where once again for the fracture and matrix regions, D0
represents the molecular diffusion (L2 T21), l signifies thedispersivity (L), and us denotes the saturated water content.The rate of solute mass transfer between the fracture andmatrix regions, Gs, is given as the sum of diffusive and con-vective fluxes:
Gs 5 vs(1 2 wf)(cf 2 cm) 1 Gwc* [10]
where vs is a first-order diffusive solute mass transfer coeffi-cient (T21), and c* is equal to cf for Gw . 0 and cm for Gw , 0.
Reproducedfrom
VadoseZoneJournal.PublishedbySoilScienceSociety
ofAmerica.Allcopyrights
reserved.
62 VADOSE ZONE J., VOL. 5, FEBRUARY 2006
The initial condition for water flow was assumed as a hydro-static profile between zero pressure head at drainage depth(100 cm) and 2100 cm at the top. Measured rainfall rates lessthe actual evapotranspiration were applied as the upper bound-ary condition. A seepage face boundary condition was pre-scribed for water flow at the lower boundary. The initialBr2 concentration was assumed to be zero in 1991 and 1993. In1994, resulting from the prior tracer tests, an initial concentra-tion of 4 mg L21 was assumed throughout the soil. The topboundary condition for solute transport was represented by theprescribed Br2 concentration of the applied KBr solution,while a zero Br2 concentration gradient was prescribed at thelower boundary.
Inverse Parameter Identification
Preferential Flow in a Soil Column
For describing preferential water flow in the soil columnusing Eq. [1] to [6], the DPM requires 13 parameters (i.e., um,r,um,s, am, nm, Km,s, uf,r, uf,s, af, nf, Kf,s, a, wf, b), of which threeparameters related to water transfer between domains areknown (a, wf, b). To additionally reduce the number of un-knowns, the residual water content for the fracture poresystem, uf,r, was fixed at zero. This limited the total number ofunknown water flow parameters to nine. The DPM modelparameters were estimated by minimizing an objective func-tion, F, (Simunek et al., 1998) representing the deviations be-tween measured and calculated variables as follows:
F(b) 5 Omj51Oni51
wi,j[Oj(z,ti) 2 Ej(z,ti,b)]2 [11]
where m is the number of different sets of measurements,n represents the number of observations in a particular mea-surement set, Oj(z,ti) represents observations at time ti for thejth measurement set at location (z), Ej(x, ti, b) are the cor-responding estimated space–time variables for the vector b ofnine optimized van Genuchten (1980) parameters (um,r, um,s,am, nm, Km,s, uf,s, af, nf, Kf,s) and wi,j are weighting factorsthat here were manually calibrated in repeated inverse simu-lation runs until similar contributions of all observation setsto the weighted least squares (Eq. [11]) of residuals betweenobservations and model estimates (Eq. [11]) were achieved.This ad hoc procedure gave more evenly distributed devia-tions between individual data sets and model resultsthan using other weighting options for wi,j, such as the ratioof means or standard deviations of data sets. However,improved automated weighting procedures should be devel-oped in future. The Levenberg-Marquardt algorithm was ap-plied to minimize the objective function (Eq. [11]) (Simuneket al., 1998).
For the case of drainage of the soil column initially com-pletely saturated up to the top, a modification of the aboveprocedure became necessary to properly describe the gradual,noninstantaneous decrease of positive initial pressure heads(see results). At the bottom of the matrix and PFP domains, athin layer corresponding to the bottom perforated-plate thick-ness (L 5 0.4-cm height) with a constant hydraulic resistancefactor of R 5 L/Ks was assumed. The factor R accounted forany potential hydraulic resistance of the bottom plate withnylon membrane during the early phase of drainage, charac-terized by positive pressure heads and large hydraulic gra-dients across the lower boundary. For technical reasons, Rcould not be measured below matrix and PFP, and thus for thedrainage case, R for matrix and PFP had to be inversely es-timated. Allowing for different magnitudes of R at the bottomof matrix and PFP was justified by the fact that the perforated-
plate had a higher perforation density below the PFP thanbelow the matrix.
Three different approaches were compared for estimatingthe parameters of the DPM. First, the inverse-lumped ap-proach relied on observations of pressure heads in the matrixat 5-, 35-, and 65-cm depths, water contents in the matrix at35-cm depth, and cumulative infiltration (across top boundary)or drainage (across bottom boundary) fluxes. Second, theinverse-local approach additionally utilized observations ofregion-specific (matrix and PFP) outflow, that is, data thatwere not available in earlier column studies or field experi-ments. Finally, in the forward approach we studied if inde-pendently determined soil hydraulic parameters for loam,medium sand, and coarse sand could be successfully used forforward DPM simulation of the preferential flow data in therepacked soil columns with various matrix–PFP compositions.
Field-Scale Preferential Flow and Bromide Transport
Two inverse DPM approaches were compared to simulatethe field experiments of Lennartz et al. (1999). In the se-quential DPM approach, eight hydraulic parameters (i.e., am,nm, Km,s, uf,s, af, nf, Kf,s, vw) were estimated based on ob-servations of tile-drainage outflow (both in terms of rate andcumulative values), followed by the estimation of one to threesolute transport parameters for different scenarios (vs; or vs,lf; or vs, lf, lm) based on the observed Br2 concentrationsin tile-drainage effluent. In the simultaneous DPM approach,all eight hydraulic and one to three solute parameters wereestimated at the same time using both tile-drainage and Br2
concentrations. In both approaches, the parameters wereestimated by minimizing the objective function (Eq. [11]) asdescribed above for simulations of soil column tests. The fol-lowing parameters were fixed: the volumetric portion of thefracture pore system (wf 5 0.05), as estimated from dye-stained soil fractions (Kohne, 1999), the residual water contentof the fracture pore system (uf,r 5 0), residual and saturatedmatrix water contents (um,r 5 0.078, um,s 5 0.43) of a loam aspredicted by the neural network prediction option inHYDRUS-1D (Simunek et al., 1998), and the matrixdispersivity at an average magnitude (lm 5 0.5 cm) found inBr2 displacement tests conducted with Bokhorst soil columns(Meyer-Windel, 1998).
Goodness-of-Fit
The goodness-of-fit of the three parameter modelingschemes for preferential flow (inverse-local, inverse-lumped,and forward) was evaluated using the modified index ofagreement (MIA) as given in Legates and McCabe (1999).For each measurement set j, the index MIAj was calculatedas follows:
MIAj 5 1:02Oni51[|Ej(z,ti,b)2Oj(z,ti)|]
Oni51[|Ej(z,ti,b)2O|]1On
i51[Oj(z,ti)2O]
[12]
The MIA (here: MIAj) varies between 0.0 to 1.0, withhigher values indicating better agreement between the modeland observations, similar to the interpretation of the coeffi-cient of determination, R2. Compared with R2, MIA is a morereliable statistical measure since it is more sensitive to differ-ences in the observed and model simulated means and vari-ances and is less sensitive to extreme values (Legates andMcCabe, 1999). There is no statistical basis to decide whichMIA value is a threshold separating “inaccurate” from
Reproducedfrom
VadoseZoneJournal.PublishedbySoilScienceSociety
ofAmerica.Allcopyrights
reserved.
63www.vadosezonejournal.org
“accurate” simulations. Here we assumed all column-scalewater flow simulations with MIA . 0.75 to be “accurate.”However, this value would be too rigorous for assessing field-scale preferential solute transport simulations, for which othercriteria are usually applied, such as the percentage of thesimulation results within a certain deviation from observations(e.g., Larsson and Jarvis, 1999a, 1999b). Hence, a commonMIA threshold value to separate accurate from inaccurate hy-draulic and transport simulations at field scale is not appli-cable. However, visual comparison of the agreement betweenmodel result and data may provide additional information(Green and Stephenson, 1986). Therefore, for the field-scalesimulations, MIAvalues were compared only by relative rank-ing, and additionally two subjective binary (yes/no) goodness-of-fit measures were employed based on visual comparison ofobserved and simulated Br2 breakthrough curves: (i) match offirst preferential Br2 peak and (ii) match of breakthroughcurve pattern (e.g., peaked vs. smooth, skewed vs. symmetric).
RESULTS AND DISCUSSIONHomogeneous Soil Columns
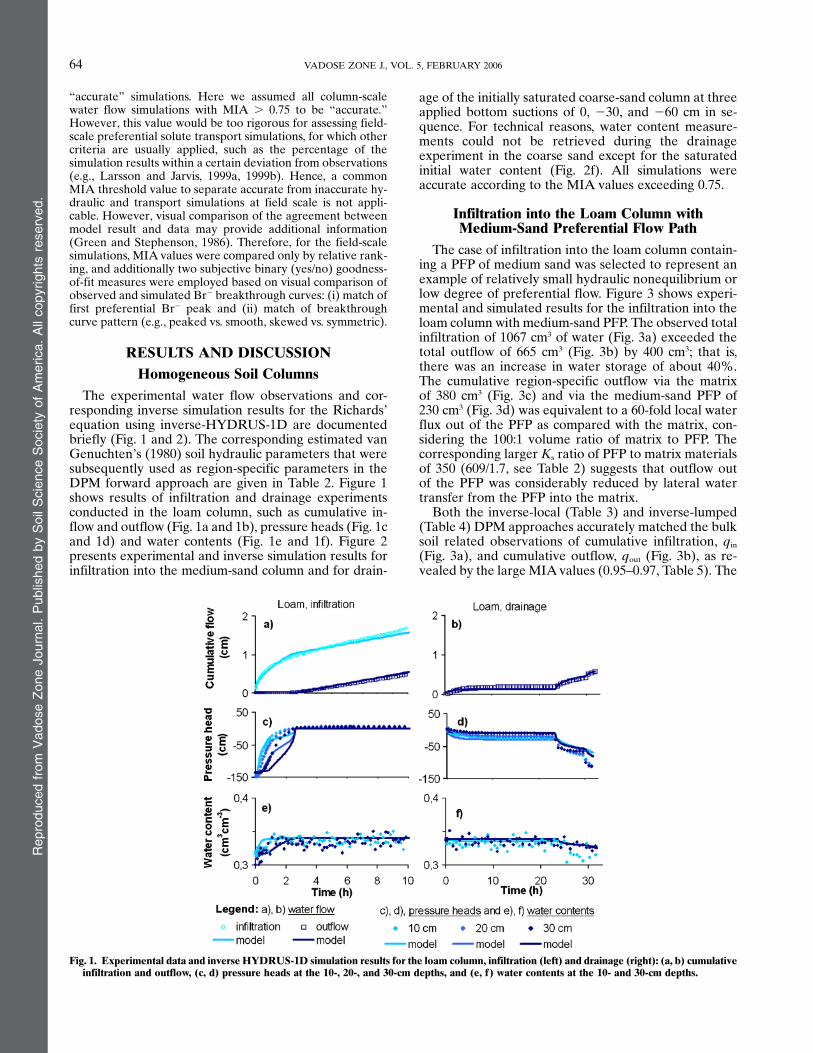
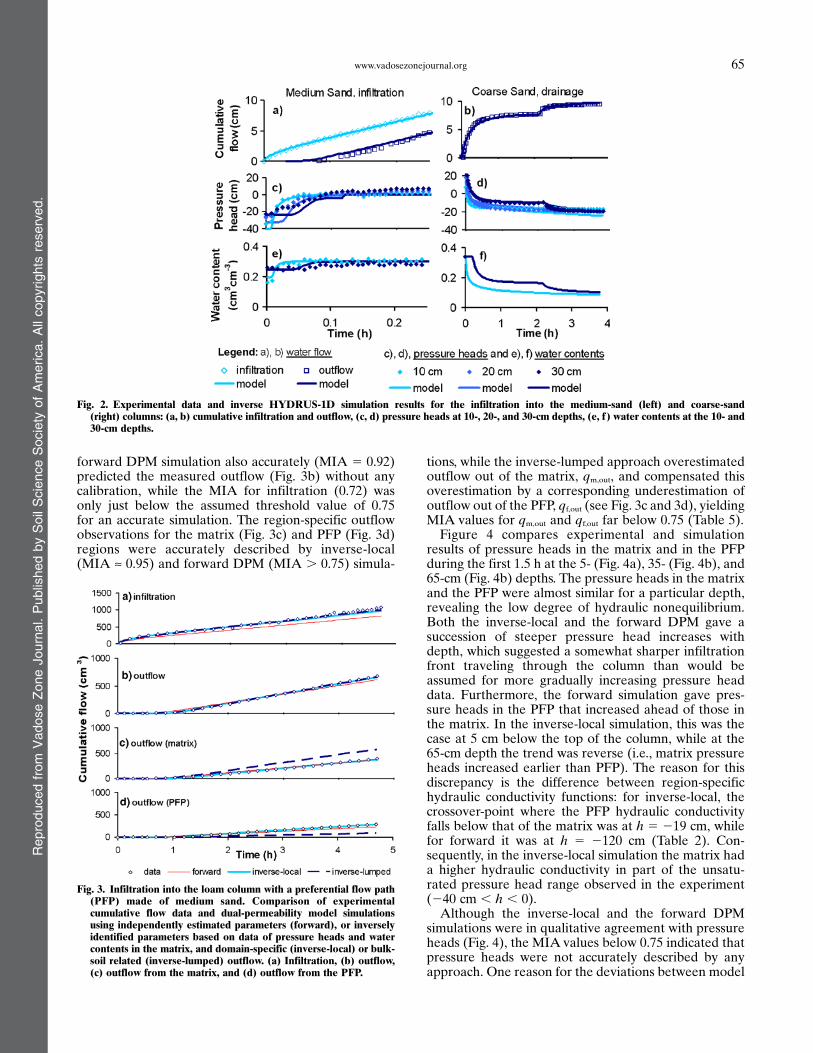
The experimental water flow observations and cor-responding inverse simulation results for the Richards’equation using inverse-HYDRUS-1D are documentedbriefly (Fig. 1 and 2). The corresponding estimated vanGenuchten’s (1980) soil hydraulic parameters that weresubsequently used as region-specific parameters in theDPM forward approach are given in Table 2. Figure 1shows results of infiltration and drainage experimentsconducted in the loam column, such as cumulative in-flow and outflow (Fig. 1a and 1b), pressure heads (Fig. 1cand 1d) and water contents (Fig. 1e and 1f). Figure 2presents experimental and inverse simulation results forinfiltration into the medium-sand column and for drain-
age of the initially saturated coarse-sand column at threeapplied bottom suctions of 0, 230, and 260 cm in se-quence. For technical reasons, water content measure-ments could not be retrieved during the drainageexperiment in the coarse sand except for the saturatedinitial water content (Fig. 2f). All simulations wereaccurate according to the MIA values exceeding 0.75.
Infiltration into the Loam Column withMedium-Sand Preferential Flow Path
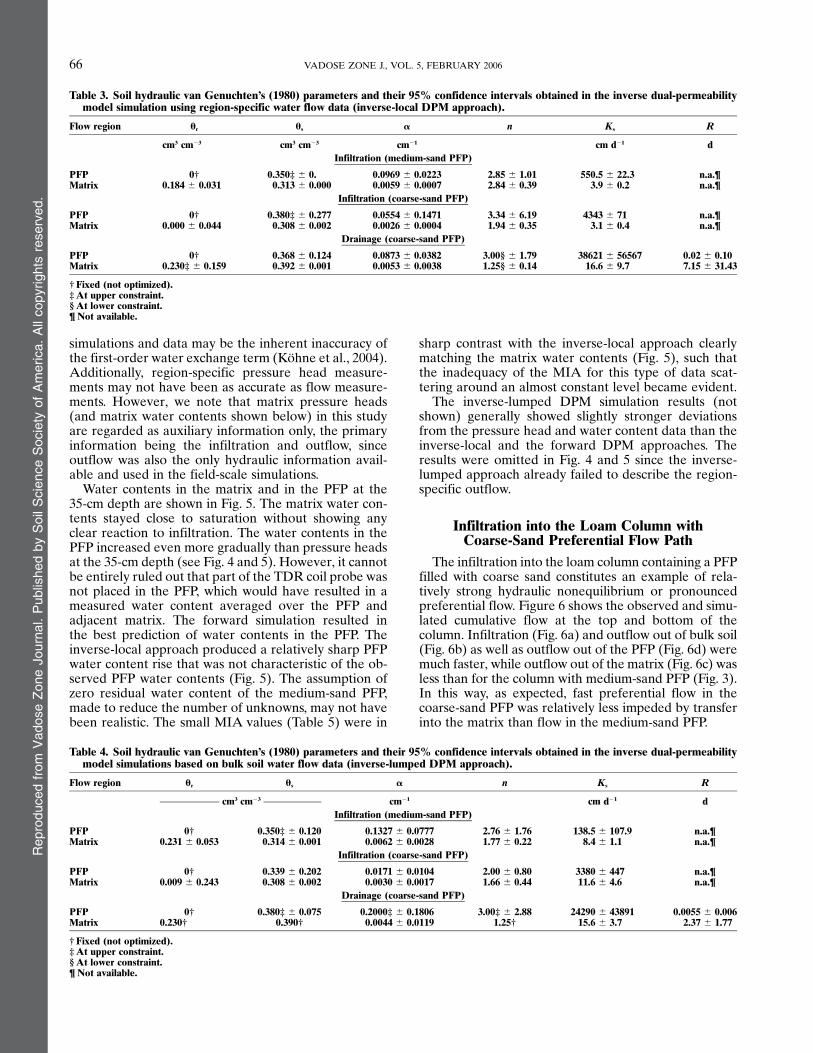
The case of infiltration into the loam column contain-ing a PFP of medium sand was selected to represent anexample of relatively small hydraulic nonequilibrium orlow degree of preferential flow. Figure 3 shows experi-mental and simulated results for the infiltration into theloam column with medium-sand PFP. The observed totalinfiltration of 1067 cm3 of water (Fig. 3a) exceeded thetotal outflow of 665 cm3 (Fig. 3b) by 400 cm3; that is,there was an increase in water storage of about 40%.The cumulative region-specific outflow via the matrixof 380 cm3 (Fig. 3c) and via the medium-sand PFP of230 cm3 (Fig. 3d) was equivalent to a 60-fold local waterflux out of the PFP as compared with the matrix, con-sidering the 100:1 volume ratio of matrix to PFP. Thecorresponding larger Ks ratio of PFP to matrix materialsof 350 (609/1.7, see Table 2) suggests that outflow outof the PFP was considerably reduced by lateral watertransfer from the PFP into the matrix.
Both the inverse-local (Table 3) and inverse-lumped(Table 4) DPM approaches accurately matched the bulksoil related observations of cumulative infiltration, qin
(Fig. 3a), and cumulative outflow, qout (Fig. 3b), as re-vealed by the large MIAvalues (0.95–0.97, Table 5). The
Fig. 1. Experimental data and inverse HYDRUS-1D simulation results for the loam column, infiltration (left) and drainage (right): (a, b) cumulativeinfiltration and outflow, (c, d) pressure heads at the 10-, 20-, and 30-cm depths, and (e, f) water contents at the 10- and 30-cm depths.
Reproducedfrom
VadoseZoneJournal.PublishedbySoilScienceSociety
ofAmerica.Allcopyrights
reserved.
64 VADOSE ZONE J., VOL. 5, FEBRUARY 2006
forward DPM simulation also accurately (MIA 5 0.92)predicted the measured outflow (Fig. 3b) without anycalibration, while the MIA for infiltration (0.72) wasonly just below the assumed threshold value of 0.75for an accurate simulation. The region-specific outflowobservations for the matrix (Fig. 3c) and PFP (Fig. 3d)regions were accurately described by inverse-local(MIA » 0.95) and forward DPM (MIA . 0.75) simula-
tions, while the inverse-lumped approach overestimatedoutflow out of the matrix, qm,out, and compensated thisoverestimation by a corresponding underestimation ofoutflow out of the PFP, qf,out (see Fig. 3c and 3d), yieldingMIA values for qm,out and qf,out far below 0.75 (Table 5).Figure 4 compares experimental and simulation
results of pressure heads in the matrix and in the PFPduring the first 1.5 h at the 5- (Fig. 4a), 35- (Fig. 4b), and65-cm (Fig. 4b) depths. The pressure heads in the matrixand the PFP were almost similar for a particular depth,revealing the low degree of hydraulic nonequilibrium.Both the inverse-local and the forward DPM gave asuccession of steeper pressure head increases withdepth, which suggested a somewhat sharper infiltrationfront traveling through the column than would beassumed for more gradually increasing pressure headdata. Furthermore, the forward simulation gave pres-sure heads in the PFP that increased ahead of those inthe matrix. In the inverse-local simulation, this was thecase at 5 cm below the top of the column, while at the65-cm depth the trend was reverse (i.e., matrix pressureheads increased earlier than PFP). The reason for thisdiscrepancy is the difference between region-specifichydraulic conductivity functions: for inverse-local, thecrossover-point where the PFP hydraulic conductivityfalls below that of the matrix was at h 5 219 cm, whilefor forward it was at h 5 2120 cm (Table 2). Con-sequently, in the inverse-local simulation the matrix hada higher hydraulic conductivity in part of the unsatu-rated pressure head range observed in the experiment(240 cm , h , 0).Although the inverse-local and the forward DPM
simulations were in qualitative agreement with pressureheads (Fig. 4), the MIAvalues below 0.75 indicated thatpressure heads were not accurately described by anyapproach. One reason for the deviations between model
Fig. 3. Infiltration into the loam column with a preferential flow path(PFP) made of medium sand. Comparison of experimentalcumulative flow data and dual-permeability model simulationsusing independently estimated parameters (forward), or inverselyidentified parameters based on data of pressure heads and watercontents in the matrix, and domain-specific (inverse-local) or bulk-soil related (inverse-lumped) outflow. (a) Infiltration, (b) outflow,(c) outflow from the matrix, and (d) outflow from the PFP.
Fig. 2. Experimental data and inverse HYDRUS-1D simulation results for the infiltration into the medium-sand (left) and coarse-sand(right) columns: (a, b) cumulative infiltration and outflow, (c, d) pressure heads at 10-, 20-, and 30-cm depths, (e, f) water contents at the 10- and30-cm depths.
Reproducedfrom
VadoseZoneJournal.PublishedbySoilScienceSociety
ofAmerica.Allcopyrights
reserved.
65www.vadosezonejournal.org
simulations and data may be the inherent inaccuracy ofthe first-order water exchange term (Kohne et al., 2004).Additionally, region-specific pressure head measure-ments may not have been as accurate as flow measure-ments. However, we note that matrix pressure heads(and matrix water contents shown below) in this studyare regarded as auxiliary information only, the primaryinformation being the infiltration and outflow, sinceoutflow was also the only hydraulic information avail-able and used in the field-scale simulations.
Water contents in the matrix and in the PFP at the35-cm depth are shown in Fig. 5. The matrix water con-tents stayed close to saturation without showing anyclear reaction to infiltration. The water contents in thePFP increased even more gradually than pressure headsat the 35-cm depth (see Fig. 4 and 5). However, it cannotbe entirely ruled out that part of the TDR coil probe wasnot placed in the PFP, which would have resulted in ameasured water content averaged over the PFP andadjacent matrix. The forward simulation resulted inthe best prediction of water contents in the PFP. Theinverse-local approach produced a relatively sharp PFPwater content rise that was not characteristic of the ob-served PFP water contents (Fig. 5). The assumption ofzero residual water content of the medium-sand PFP,made to reduce the number of unknowns, may not havebeen realistic. The small MIA values (Table 5) were in
sharp contrast with the inverse-local approach clearlymatching the matrix water contents (Fig. 5), such thatthe inadequacy of the MIA for this type of data scat-tering around an almost constant level became evident.
The inverse-lumped DPM simulation results (notshown) generally showed slightly stronger deviationsfrom the pressure head and water content data than theinverse-local and the forward DPM approaches. Theresults were omitted in Fig. 4 and 5 since the inverse-lumped approach already failed to describe the region-specific outflow.
Infiltration into the Loam Column withCoarse-Sand Preferential Flow Path
The infiltration into the loam column containing a PFPfilled with coarse sand constitutes an example of rela-tively strong hydraulic nonequilibrium or pronouncedpreferential flow. Figure 6 shows the observed and simu-lated cumulative flow at the top and bottom of thecolumn. Infiltration (Fig. 6a) and outflow out of bulk soil(Fig. 6b) as well as outflow out of the PFP (Fig. 6d) weremuch faster, while outflow out of the matrix (Fig. 6c) wasless than for the column with medium-sand PFP (Fig. 3).In this way, as expected, fast preferential flow in thecoarse-sand PFP was relatively less impeded by transferinto the matrix than flow in the medium-sand PFP.
Table 4. Soil hydraulic van Genuchten’s (1980) parameters and their 95% confidence intervals obtained in the inverse dual-permeabilitymodel simulations based on bulk soil water flow data (inverse-lumped DPM approach).
Flow region ur us a n Ks R
cm3 cm23 cm21 cm d21 dInfiltration (medium-sand PFP)
PFP 0† 0.350‡ 6 0.120 0.1327 6 0.0777 2.76 6 1.76 138.5 6 107.9 n.a.¶Matrix 0.231 6 0.053 0.314 6 0.001 0.0062 6 0.0028 1.77 6 0.22 8.4 6 1.1 n.a.¶
Infiltration (coarse-sand PFP)
PFP 0† 0.339 6 0.202 0.0171 6 0.0104 2.00 6 0.80 3380 6 447 n.a.¶Matrix 0.009 6 0.243 0.308 6 0.002 0.0030 6 0.0017 1.66 6 0.44 11.6 6 4.6 n.a.¶
Drainage (coarse-sand PFP)
PFP 0† 0.380‡ 6 0.075 0.2000‡ 6 0.1806 3.00‡ 6 2.88 24290 6 43891 0.0055 6 0.006Matrix 0.230† 0.390† 0.0044 6 0.0119 1.25† 15.6 6 3.7 2.37 6 1.77
†Fixed (not optimized).‡At upper constraint.§At lower constraint.¶Not available.
Table 3. Soil hydraulic van Genuchten’s (1980) parameters and their 95% confidence intervals obtained in the inverse dual-permeabilitymodel simulation using region-specific water flow data (inverse-local DPM approach).
Flow region ur us a n Ks R
cm3 cm23 cm3 cm23 cm21 cm d21 dInfiltration (medium-sand PFP)
PFP 0† 0.350‡ 6 0. 0.0969 6 0.0223 2.85 6 1.01 550.5 6 22.3 n.a.¶Matrix 0.184 6 0.031 0.313 6 0.000 0.0059 6 0.0007 2.84 6 0.39 3.9 6 0.2 n.a.¶
Infiltration (coarse-sand PFP)
PFP 0† 0.380‡ 6 0.277 0.0554 6 0.1471 3.34 6 6.19 4343 6 71 n.a.¶Matrix 0.000 6 0.044 0.308 6 0.002 0.0026 6 0.0004 1.94 6 0.35 3.1 6 0.4 n.a.¶
Drainage (coarse-sand PFP)
PFP 0† 0.368 6 0.124 0.0873 6 0.0382 3.00§ 6 1.79 38621 6 56567 0.02 6 0.10Matrix 0.230‡ 6 0.159 0.392 6 0.001 0.0053 6 0.0038 1.25§ 6 0.14 16.6 6 9.7 7.15 6 31.43
†Fixed (not optimized).‡At upper constraint.§At lower constraint.¶Not available.
Reproducedfrom
VadoseZoneJournal.PublishedbySoilScienceSociety
ofAmerica.Allcopyrights
reserved.
66 VADOSE ZONE J., VOL. 5, FEBRUARY 2006
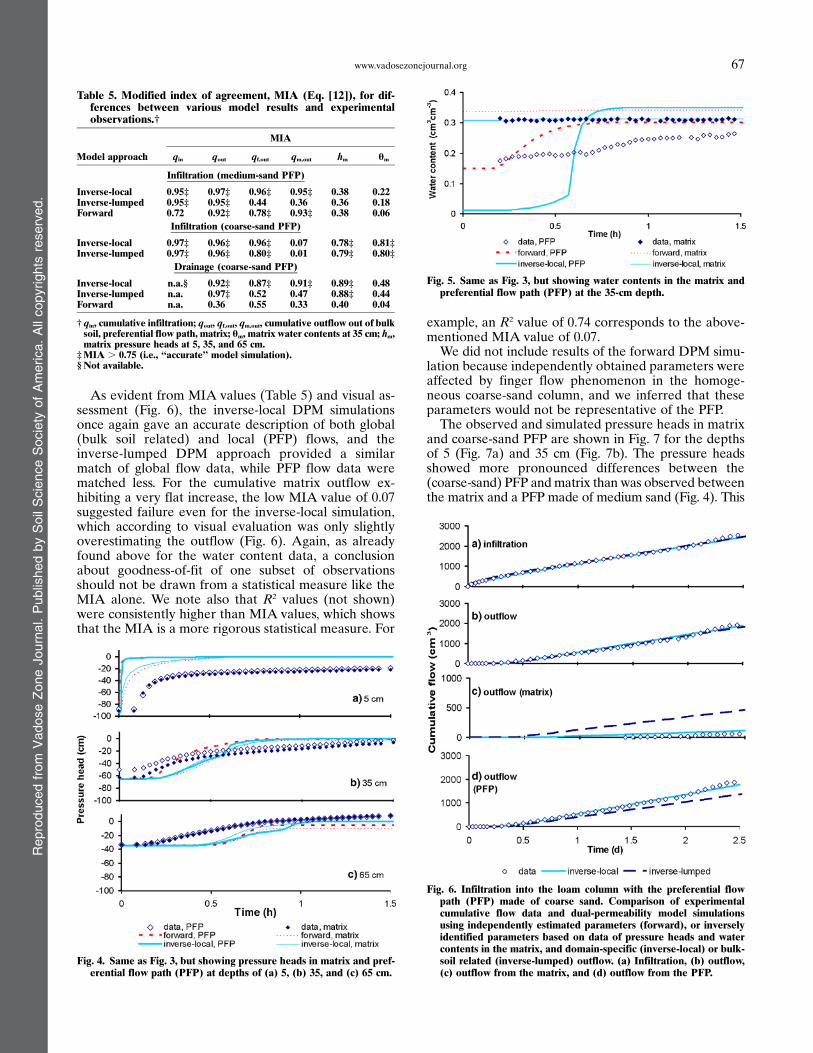
As evident from MIA values (Table 5) and visual as-sessment (Fig. 6), the inverse-local DPM simulationsonce again gave an accurate description of both global(bulk soil related) and local (PFP) flows, and theinverse-lumped DPM approach provided a similarmatch of global flow data, while PFP flow data werematched less. For the cumulative matrix outflow ex-hibiting a very flat increase, the low MIA value of 0.07suggested failure even for the inverse-local simulation,which according to visual evaluation was only slightlyoverestimating the outflow (Fig. 6). Again, as alreadyfound above for the water content data, a conclusionabout goodness-of-fit of one subset of observationsshould not be drawn from a statistical measure like theMIA alone. We note also that R2 values (not shown)were consistently higher than MIA values, which showsthat the MIA is a more rigorous statistical measure. For
example, an R2 value of 0.74 corresponds to the above-mentioned MIA value of 0.07.We did not include results of the forward DPM simu-
lation because independently obtained parameters wereaffected by finger flow phenomenon in the homoge-neous coarse-sand column, and we inferred that theseparameters would not be representative of the PFP.The observed and simulated pressure heads in matrix
and coarse-sand PFP are shown in Fig. 7 for the depthsof 5 (Fig. 7a) and 35 cm (Fig. 7b). The pressure headsshowed more pronounced differences between the(coarse-sand) PFP andmatrix than was observed betweenthe matrix and a PFP made of medium sand (Fig. 4). This
Table 5. Modified index of agreement, MIA (Eq. [12]), for dif-ferences between various model results and experimentalobservations.†
MIA
Model approach qin qout qf,out qm,out hm um
Infiltration (medium-sand PFP)
Inverse-local 0.95‡ 0.97‡ 0.96‡ 0.95‡ 0.38 0.22Inverse-lumped 0.95‡ 0.95‡ 0.44 0.36 0.36 0.18Forward 0.72 0.92‡ 0.78‡ 0.93‡ 0.38 0.06
Infiltration (coarse-sand PFP)
Inverse-local 0.97‡ 0.96‡ 0.96‡ 0.07 0.78‡ 0.81‡Inverse-lumped 0.97‡ 0.96‡ 0.80‡ 0.01 0.79‡ 0.80‡
Drainage (coarse-sand PFP)
Inverse-local n.a.§ 0.92‡ 0.87‡ 0.91‡ 0.89‡ 0.48Inverse-lumped n.a. 0.97‡ 0.52 0.47 0.88‡ 0.44Forward n.a. 0.36 0.55 0.33 0.40 0.04
† qin, cumulative infiltration; qout, qf,out, qm,out, cumulative outflow out of bulksoil, preferential flow path, matrix; um, matrix water contents at 35 cm; hm,matrix pressure heads at 5, 35, and 65 cm.
‡MIA . 0.75 (i.e., ‘‘accurate’’ model simulation).§Not available.
Fig. 4. Same as Fig. 3, but showing pressure heads in matrix and pref-erential flow path (PFP) at depths of (a) 5, (b) 35, and (c) 65 cm.
Fig. 5. Same as Fig. 3, but showing water contents in the matrix andpreferential flow path (PFP) at the 35-cm depth.
Fig. 6. Infiltration into the loam column with the preferential flowpath (PFP) made of coarse sand. Comparison of experimentalcumulative flow data and dual-permeability model simulationsusing independently estimated parameters (forward), or inverselyidentified parameters based on data of pressure heads and watercontents in the matrix, and domain-specific (inverse-local) or bulk-soil related (inverse-lumped) outflow. (a) Infiltration, (b) outflow,(c) outflow from the matrix, and (d) outflow from the PFP.
Reproducedfrom
VadoseZoneJournal.PublishedbySoilScienceSociety
ofAmerica.Allcopyrights
reserved.
67www.vadosezonejournal.org
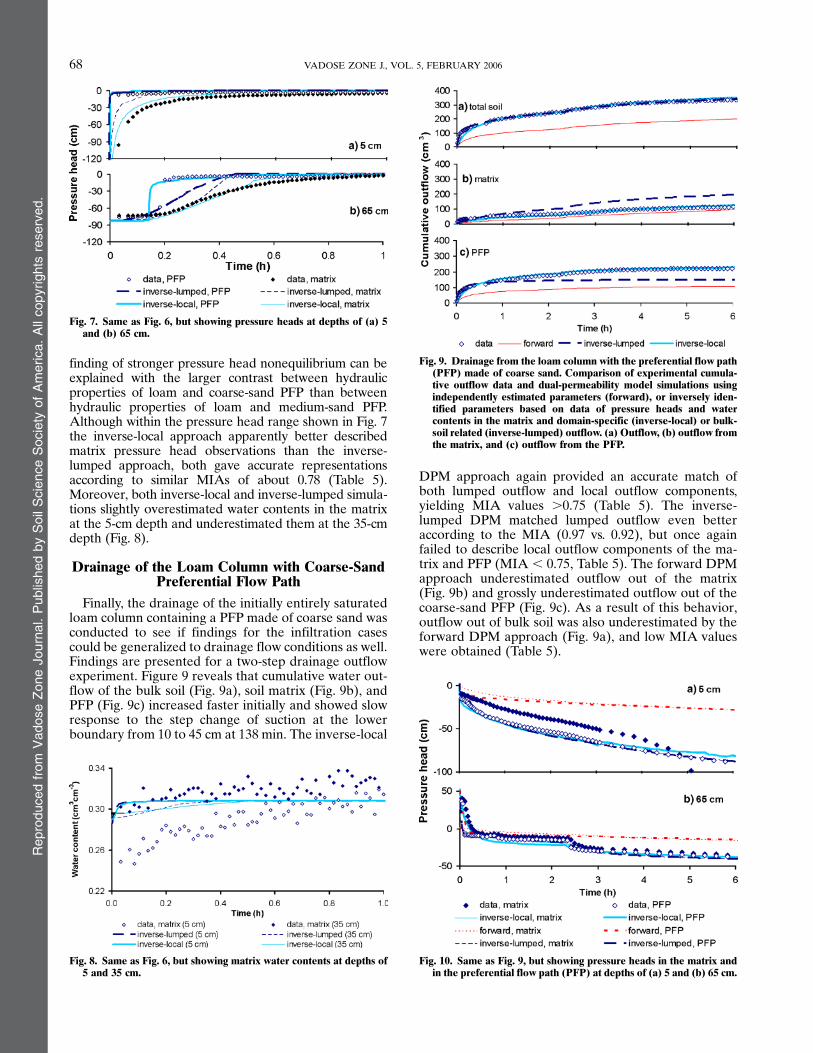
finding of stronger pressure head nonequilibrium can beexplained with the larger contrast between hydraulicproperties of loam and coarse-sand PFP than betweenhydraulic properties of loam and medium-sand PFP.Although within the pressure head range shown in Fig. 7the inverse-local approach apparently better describedmatrix pressure head observations than the inverse-lumped approach, both gave accurate representationsaccording to similar MIAs of about 0.78 (Table 5).Moreover, both inverse-local and inverse-lumped simula-tions slightly overestimated water contents in the matrixat the 5-cm depth and underestimated them at the 35-cmdepth (Fig. 8).
Drainage of the Loam Column with Coarse-SandPreferential Flow Path
Finally, the drainage of the initially entirely saturatedloam column containing a PFP made of coarse sand wasconducted to see if findings for the infiltration casescould be generalized to drainage flow conditions as well.Findings are presented for a two-step drainage outflowexperiment. Figure 9 reveals that cumulative water out-flow of the bulk soil (Fig. 9a), soil matrix (Fig. 9b), andPFP (Fig. 9c) increased faster initially and showed slowresponse to the step change of suction at the lowerboundary from 10 to 45 cm at 138 min. The inverse-local
DPM approach again provided an accurate match ofboth lumped outflow and local outflow components,yielding MIA values .0.75 (Table 5). The inverse-lumped DPM matched lumped outflow even betteraccording to the MIA (0.97 vs. 0.92), but once againfailed to describe local outflow components of the ma-trix and PFP (MIA , 0.75, Table 5). The forward DPMapproach underestimated outflow out of the matrix(Fig. 9b) and grossly underestimated outflow out of thecoarse-sand PFP (Fig. 9c). As a result of this behavior,outflow out of bulk soil was also underestimated by theforward DPM approach (Fig. 9a), and low MIA valueswere obtained (Table 5).
Fig. 8. Same as Fig. 6, but showing matrix water contents at depths of5 and 35 cm.
Fig. 9. Drainage from the loam column with the preferential flow path(PFP) made of coarse sand. Comparison of experimental cumula-tive outflow data and dual-permeability model simulations usingindependently estimated parameters (forward), or inversely iden-tified parameters based on data of pressure heads and watercontents in the matrix and domain-specific (inverse-local) or bulk-soil related (inverse-lumped) outflow. (a) Outflow, (b) outflow fromthe matrix, and (c) outflow from the PFP.
Fig. 7. Same as Fig. 6, but showing pressure heads at depths of (a) 5and (b) 65 cm.
Fig. 10. Same as Fig. 9, but showing pressure heads in the matrix andin the preferential flow path (PFP) at depths of (a) 5 and (b) 65 cm.
Reproducedfrom
VadoseZoneJournal.PublishedbySoilScienceSociety
ofAmerica.Allcopyrights
reserved.
68 VADOSE ZONE J., VOL. 5, FEBRUARY 2006
The pressure heads in the matrix and in the PFP at the5-cm depth (Fig. 10a) decreased starting from slightlynegative values. Pressure heads at the 65-cm depthstarted from initially positive values, decreased within6 min (PFP) and 20 min (matrix) to negative values, andshowed a reaction to the suction step increase at 138 min(Fig. 10b). Differences between pressure heads in PFPand matrix regions were less than for the infiltration case(compare Fig. 7 and 10), which reveals that the degree ofpressure head nonequilibrium during preferential flownot only depends on the difference of hydraulic proper-ties between PFP and matrix, but also on the flow direc-tion (infiltration vs. drainage). The inverse-local andinverse-lumped simulations described pressure headsaccurately (MIA above 0.75; see Fig. 10) when account-ing for a hydraulic resistance at the bottom. Pressureheads simulated with the forward DPM approach didnot match with the observations (Fig. 10, Table 5).
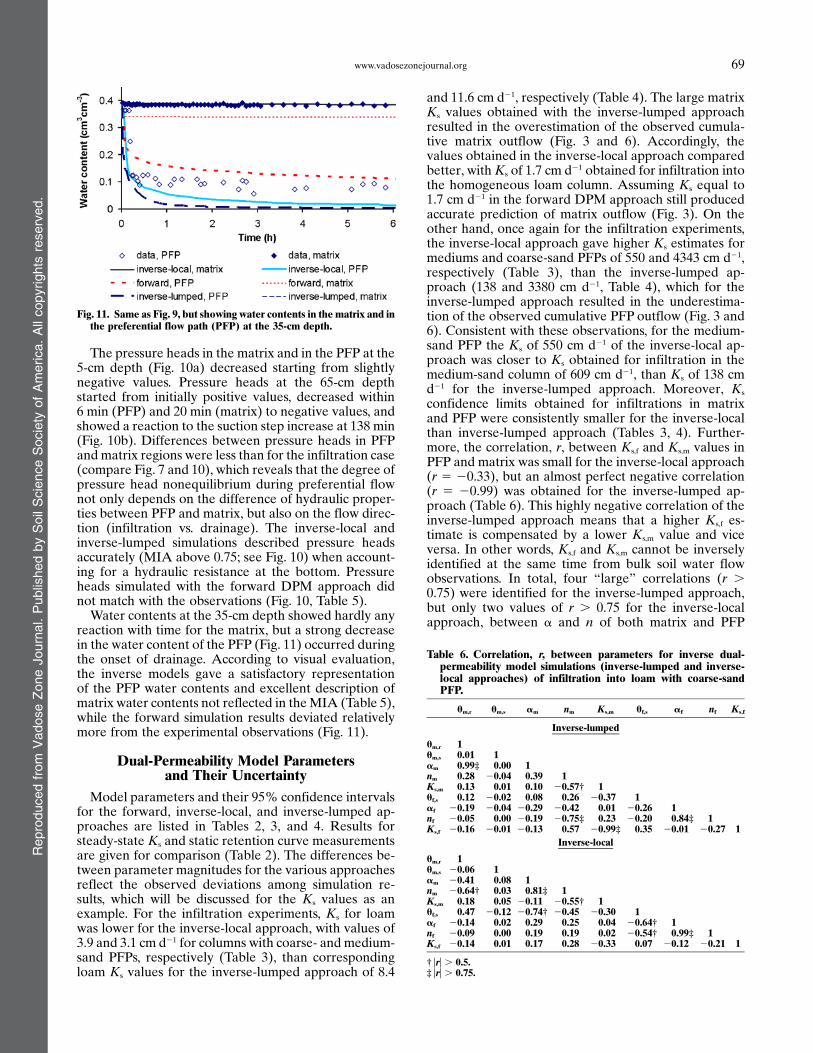
Water contents at the 35-cm depth showed hardly anyreaction with time for the matrix, but a strong decreasein the water content of the PFP (Fig. 11) occurred duringthe onset of drainage. According to visual evaluation,the inverse models gave a satisfactory representationof the PFP water contents and excellent description ofmatrix water contents not reflected in theMIA (Table 5),while the forward simulation results deviated relativelymore from the experimental observations (Fig. 11).
Dual-Permeability Model Parametersand Their Uncertainty
Model parameters and their 95% confidence intervalsfor the forward, inverse-local, and inverse-lumped ap-proaches are listed in Tables 2, 3, and 4. Results forsteady-state Ks and static retention curve measurementsare given for comparison (Table 2). The differences be-tween parameter magnitudes for the various approachesreflect the observed deviations among simulation re-sults, which will be discussed for the Ks values as anexample. For the infiltration experiments, Ks for loamwas lower for the inverse-local approach, with values of3.9 and 3.1 cm d21 for columns with coarse- and medium-sand PFPs, respectively (Table 3), than correspondingloam Ks values for the inverse-lumped approach of 8.4
and 11.6 cm d21, respectively (Table 4). The large matrixKs values obtained with the inverse-lumped approachresulted in the overestimation of the observed cumula-tive matrix outflow (Fig. 3 and 6). Accordingly, thevalues obtained in the inverse-local approach comparedbetter, withKs of 1.7 cm d21 obtained for infiltration intothe homogeneous loam column. Assuming Ks equal to1.7 cm d21 in the forward DPM approach still producedaccurate prediction of matrix outflow (Fig. 3). On theother hand, once again for the infiltration experiments,the inverse-local approach gave higher Ks estimates formediums and coarse-sand PFPs of 550 and 4343 cm d21,respectively (Table 3), than the inverse-lumped ap-proach (138 and 3380 cm d21, Table 4), which for theinverse-lumped approach resulted in the underestima-tion of the observed cumulative PFP outflow (Fig. 3 and6). Consistent with these observations, for the medium-sand PFP the Ks of 550 cm d21 of the inverse-local ap-proach was closer to Ks obtained for infiltration in themedium-sand column of 609 cm d21, than Ks of 138 cmd21 for the inverse-lumped approach. Moreover, Ks
confidence limits obtained for infiltrations in matrixand PFP were consistently smaller for the inverse-localthan inverse-lumped approach (Tables 3, 4). Further-more, the correlation, r, between Ks,f and Ks,m values inPFP and matrix was small for the inverse-local approach(r 5 20.33), but an almost perfect negative correlation(r 5 20.99) was obtained for the inverse-lumped ap-proach (Table 6). This highly negative correlation of theinverse-lumped approach means that a higher Ks,f es-timate is compensated by a lower Ks,m value and viceversa. In other words, Ks,f and Ks,m cannot be inverselyidentified at the same time from bulk soil water flowobservations. In total, four “large” correlations (r .0.75) were identified for the inverse-lumped approach,but only two values of r . 0.75 for the inverse-localapproach, between a and n of both matrix and PFP
Fig. 11. Same as Fig. 9, but showing water contents in the matrix and inthe preferential flow path (PFP) at the 35-cm depth.
Table 6. Correlation, r, between parameters for inverse dual-permeability model simulations (inverse-lumped and inverse-local approaches) of infiltration into loam with coarse-sandPFP.
um,r um,s am nm Ks,m uf,s af nf Ks,f
Inverse-lumped
um,r 1um,s 0.01 1am 0.99‡ 0.00 1nm 0.28 20.04 0.39 1Ks,m 0.13 0.01 0.10 20.57† 1uf,s 0.12 20.02 0.08 0.26 20.37 1af 20.19 20.04 20.29 20.42 0.01 20.26 1nf 20.05 0.00 20.19 20.75‡ 0.23 20.20 0.84‡ 1Ks,f 20.16 20.01 20.13 0.57 20.99‡ 0.35 20.01 20.27 1
Inverse-local
um,r 1um,s 20.06 1am 20.41 0.08 1nm 20.64† 0.03 0.81‡ 1Ks,m 0.18 0.05 20.11 20.55† 1uf,s 0.47 20.12 20.74† 20.45 20.30 1af 20.14 0.02 0.29 0.25 0.04 20.64† 1nf 20.09 0.00 0.19 0.19 0.02 20.54† 0.99‡ 1Ks,f 20.14 0.01 0.17 0.28 20.33 0.07 20.12 20.21 1
† |r| . 0.5.‡ |r| . 0.75.
Reproducedfrom
VadoseZoneJournal.PublishedbySoilScienceSociety
ofAmerica.Allcopyrights
reserved.
69www.vadosezonejournal.org
(Table 6). However, in the case of empirical curve-fitparameters without much physical meaning, such as aand n, correlations may be acceptable if only the shapeof the estimated hydraulic functions is of interest, whichmay be similar for different combinations of such cor-related parameters.
All the above comparisons together suggest that theinverse-local approach not only accurately describedpreferential water flow, but that the resulting inverse Ks
estimates (and other parameters except a and n) werealso generally well identified and physically meaningful,while all this was not the case for the inverse-lumpedapproach. This is a key finding of this study, the practicalimplications of which are shown below for DPM pre-diction of field-scale preferential solute transport basedon tile-drainage hydrographs.
For the drainage experiments and both inverse DPMapproaches, Ks,f and Ks,m and us,m were larger than forinfiltration (Tables 3 and 4). This discrepancy can beexplained when considering the two wetting fronts in thematrix during preferential infiltration, that is, one fromthe top and one from the side by water transfer from the
PFP. Hence, beneath the vertical wetting front in thematrix, there were coexisting wet (adjacent to PFP) anddry (far from PFP) regions, which resulted in lower Ks
and us estimates, as compared with values for waterdrainage coming from the total matrix cross section. Ad-ditionally, lateral water transfer during infiltration mayhave entrapped air below the matrix wetting front, alsoresulting in lower Ks and us estimates for the matrix. Insummary, the above findings are a manifestation of en-hanced soil hydraulic hysteresis during preferential flow.Indications of hysteresis during nonequilibrium flowhave been found before (e.g., Simunek et al., 2001;Kohne and Mohanty, 2005). The relations between Ks
values found for the various approaches were not asclear for drainage as was found for infiltration, which weattribute to the difficulties in modeling the observedgradual positive pressure head dissipation, requiring theestimation of lower boundary resistivity factors formatrix and PFP. Moreover, in the drainage case, thehydraulic resistance factor greatly increased the uncer-tainty associated with theKs values of matrix and PFP, asapparent from large confidence intervals (Tables 3 and 4).
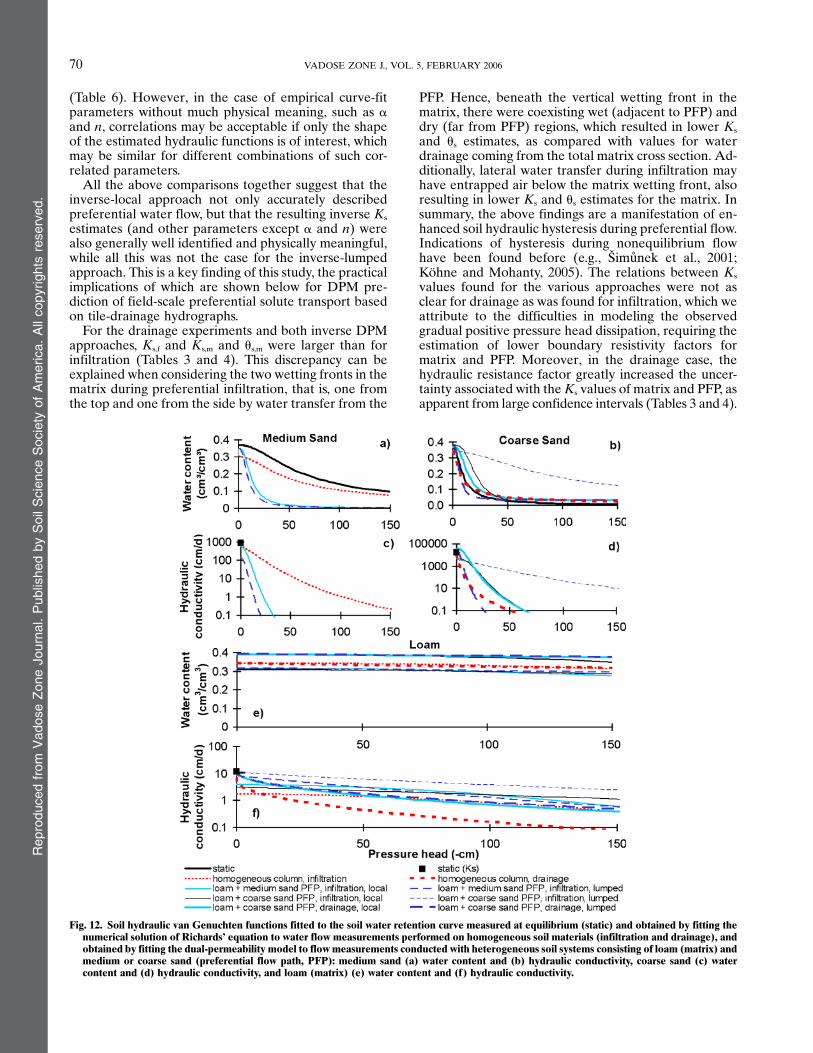
Fig. 12. Soil hydraulic van Genuchten functions fitted to the soil water retention curve measured at equilibrium (static) and obtained by fitting thenumerical solution of Richards’ equation to water flow measurements performed on homogeneous soil materials (infiltration and drainage), andobtained by fitting the dual-permeability model to flowmeasurements conducted with heterogeneous soil systems consisting of loam (matrix) andmedium or coarse sand (preferential flow path, PFP): medium sand (a) water content and (b) hydraulic conductivity, coarse sand (c) watercontent and (d) hydraulic conductivity, and loam (matrix) (e) water content and (f) hydraulic conductivity.
Reproducedfrom
VadoseZoneJournal.PublishedbySoilScienceSociety
ofAmerica.Allcopyrights
reserved.
70 VADOSE ZONE J., VOL. 5, FEBRUARY 2006
For comparison, the magnitudes of Ks measured atsteady state for loam and medium and coarse sand werehigher than measured under transient flow conditions inhomogeneous columns, but the corresponding 95% Ks
confidence limits were still overlapping. The us valuesobtained in static measurements were generally be-tween those obtained for infiltration and drainageexperiments (Tables 2–4).
Those parameter values that were strongly correlatedare no longer amenable to interpretation and compar-ison, while the shapes of hydraulic functions, which maybe similar for different values of correlated parameters,can still be compared across model approaches. Figure 12compares water retention and hydraulic conductivityfunctions obtained for homogeneous columns and steady-state or static conditions with those obtained for the ma-trix and PFP. For medium sand, inverse-local and-lumpedproduced similar PFP retention functions (Fig. 12a) andhydraulic conductivity functions (Fig. 12c), but thesefunctions were higher close to saturation and lower in thedrier range than those obtained for infiltration into themedium-sand column. For coarse sand, the inverse-lumped water retention (Fig. 12b) and hydraulic conduc-tivity (Fig. 12d) functions were vastly different, whichwas unrealistic considering that retention functions ob-tained by static and infiltration measurements were quitesimilar (Fig. 12b). For the loam, retention functions of allapproaches were almost parallel and revealed that es-timated different ur values (and maybe n and a values)obtained in different approaches are not necessarilymeaningful and probably cannot be used outside theexperimental pressure head range near saturation. Thedifferent (convex or concave) shapes of the loam hydrau-
lic conductivity function for infiltration and drainagewere better reproduced by the inverse-local approach,disregarding differences in the absolute values (Fig. 12f).
Simulation of Field Tracer TestsResults for simulated drain discharge rates and cumu-
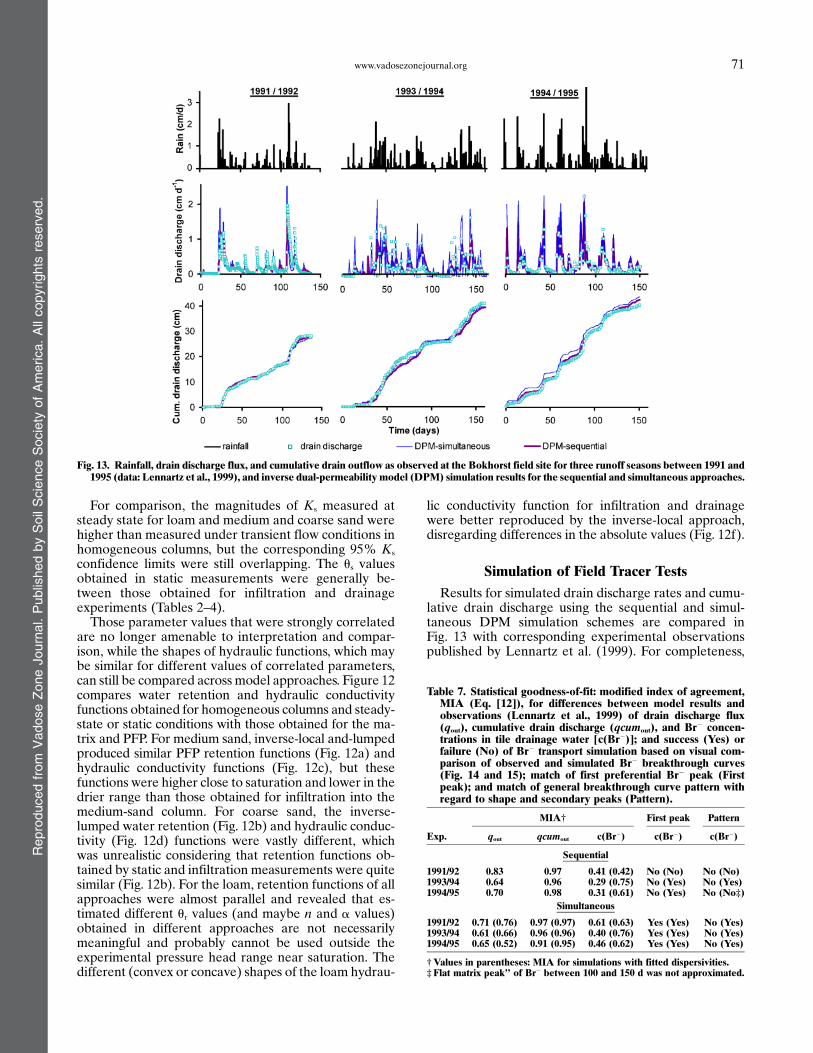
lative drain discharge using the sequential and simul-taneous DPM simulation schemes are compared inFig. 13 with corresponding experimental observationspublished by Lennartz et al. (1999). For completeness,
Fig. 13. Rainfall, drain discharge flux, and cumulative drain outflow as observed at the Bokhorst field site for three runoff seasons between 1991 and1995 (data: Lennartz et al., 1999), and inverse dual-permeability model (DPM) simulation results for the sequential and simultaneous approaches.
Table 7. Statistical goodness-of-fit: modified index of agreement,MIA (Eq. [12]), for differences between model results andobservations (Lennartz et al., 1999) of drain discharge flux(qout), cumulative drain discharge (qcumout), and Br2 concen-trations in tile drainage water [c(Br2)]; and success (Yes) orfailure (No) of Br2 transport simulation based on visual com-parison of observed and simulated Br2 breakthrough curves(Fig. 14 and 15); match of first preferential Br2 peak (Firstpeak); and match of general breakthrough curve pattern withregard to shape and secondary peaks (Pattern).
MIA† First peak Pattern
Exp. qout qcumout c(Br2) c(Br2) c(Br2)
Sequential
1991/92 0.83 0.97 0.41 (0.42) No (No) No (No)1993/94 0.64 0.96 0.29 (0.75) No (Yes) No (Yes)1994/95 0.70 0.98 0.31 (0.61) No (Yes) No (No‡)
Simultaneous
1991/92 0.71 (0.76) 0.97 (0.97) 0.61 (0.63) Yes (Yes) No (Yes)1993/94 0.61 (0.66) 0.96 (0.96) 0.40 (0.76) Yes (Yes) No (Yes)1994/95 0.65 (0.52) 0.91 (0.95) 0.46 (0.62) Yes (Yes) No (Yes)
†Values in parentheses: MIA for simulations with fitted dispersivities.‡Flat matrix peak’’ of Br2 between 100 and 150 d was not approximated.
Reproducedfrom
VadoseZoneJournal.PublishedbySoilScienceSociety
ofAmerica.Allcopyrights
reserved.
71www.vadosezonejournal.org
the natural daily rainfall used as the upper boundarycondition is provided as well (Fig. 13). The drain dis-charge rates closely reflect the rainfall pattern and werereproduced by both inverse DPM schemes, the simul-taneous scheme yielding somewhat higher and narrowerdischarge peaks than the sequential scheme. The result-ing MIA values were only slightly larger for the sequen-tial approach (Table 7). Cumulative drain discharge isreproduced equally well with both schemes, according toMIAvalues around 0.97, except for 1994/1995 where the
sequential approach yielded an MIA of 0.98, as com-pared with 0.91 for the simultaneous approach.
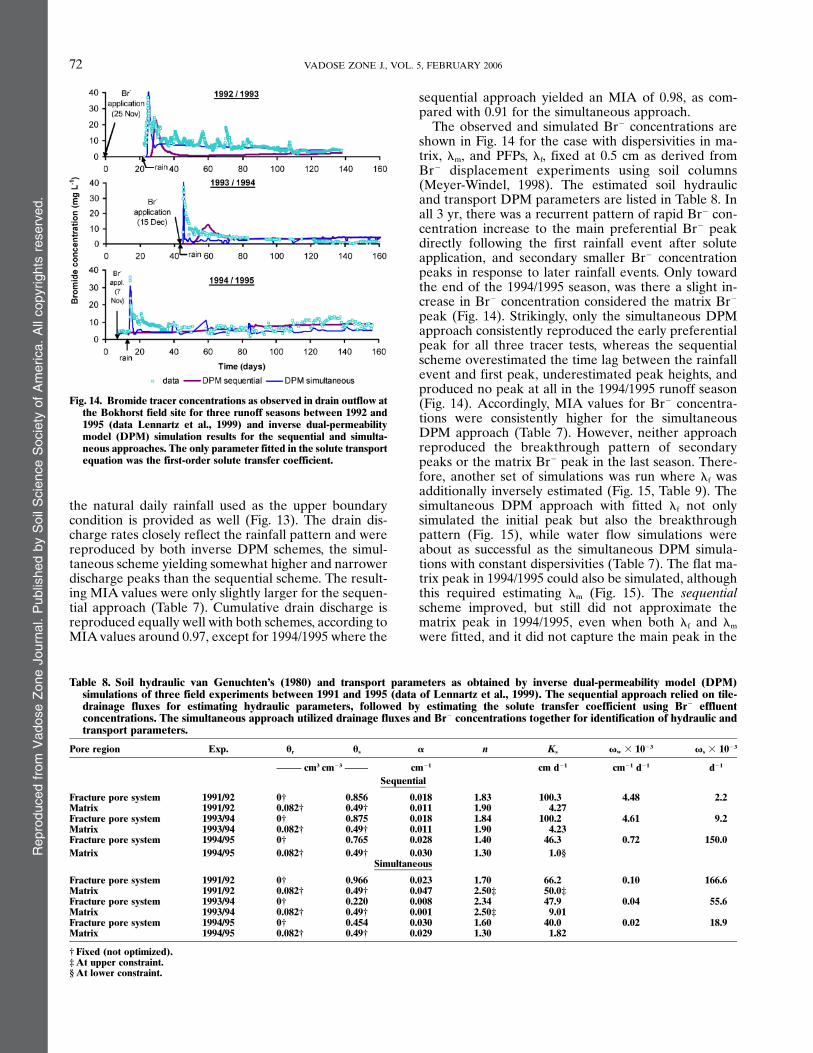
The observed and simulated Br2 concentrations areshown in Fig. 14 for the case with dispersivities in ma-trix, lm, and PFPs, lf, fixed at 0.5 cm as derived fromBr2 displacement experiments using soil columns(Meyer-Windel, 1998). The estimated soil hydraulicand transport DPM parameters are listed in Table 8. Inall 3 yr, there was a recurrent pattern of rapid Br2 con-centration increase to the main preferential Br2 peakdirectly following the first rainfall event after soluteapplication, and secondary smaller Br2 concentrationpeaks in response to later rainfall events. Only towardthe end of the 1994/1995 season, was there a slight in-crease in Br2 concentration considered the matrix Br2
peak (Fig. 14). Strikingly, only the simultaneous DPMapproach consistently reproduced the early preferentialpeak for all three tracer tests, whereas the sequentialscheme overestimated the time lag between the rainfallevent and first peak, underestimated peak heights, andproduced no peak at all in the 1994/1995 runoff season(Fig. 14). Accordingly, MIA values for Br2 concentra-tions were consistently higher for the simultaneousDPM approach (Table 7). However, neither approachreproduced the breakthrough pattern of secondarypeaks or the matrix Br2 peak in the last season. There-fore, another set of simulations was run where lf wasadditionally inversely estimated (Fig. 15, Table 9). Thesimultaneous DPM approach with fitted lf not onlysimulated the initial peak but also the breakthroughpattern (Fig. 15), while water flow simulations wereabout as successful as the simultaneous DPM simula-tions with constant dispersivities (Table 7). The flat ma-trix peak in 1994/1995 could also be simulated, althoughthis required estimating lm (Fig. 15). The sequentialscheme improved, but still did not approximate thematrix peak in 1994/1995, even when both lf and lm
were fitted, and it did not capture the main peak in the
Fig. 14. Bromide tracer concentrations as observed in drain outflow atthe Bokhorst field site for three runoff seasons between 1992 and1995 (data Lennartz et al., 1999) and inverse dual-permeabilitymodel (DPM) simulation results for the sequential and simulta-neous approaches. The only parameter fitted in the solute transportequation was the first-order solute transfer coefficient.
Table 8. Soil hydraulic van Genuchten’s (1980) and transport parameters as obtained by inverse dual-permeability model (DPM)simulations of three field experiments between 1991 and 1995 (data of Lennartz et al., 1999). The sequential approach relied on tile-drainage fluxes for estimating hydraulic parameters, followed by estimating the solute transfer coefficient using Br2 effluentconcentrations. The simultaneous approach utilized drainage fluxes and Br2 concentrations together for identification of hydraulic andtransport parameters.
Pore region Exp. ur us a n Ks vw 3 1023 vs 3 1023
cm3 cm23 cm21 cm d21 cm21 d21 d21
Sequential
Fracture pore system 1991/92 0† 0.856 0.018 1.83 100.3 4.48 2.2Matrix 1991/92 0.082† 0.49† 0.011 1.90 4.27Fracture pore system 1993/94 0† 0.875 0.018 1.84 100.2 4.61 9.2Matrix 1993/94 0.082† 0.49† 0.011 1.90 4.23Fracture pore system 1994/95 0† 0.765 0.028 1.40 46.3 0.72 150.0Matrix 1994/95 0.082† 0.49† 0.030 1.30 1.0§
Simultaneous
Fracture pore system 1991/92 0† 0.966 0.023 1.70 66.2 0.10 166.6Matrix 1991/92 0.082† 0.49† 0.047 2.50‡ 50.0‡Fracture pore system 1993/94 0† 0.220 0.008 2.34 47.9 0.04 55.6Matrix 1993/94 0.082† 0.49† 0.001 2.50‡ 9.01Fracture pore system 1994/95 0† 0.454 0.030 1.60 40.0 0.02 18.9Matrix 1994/95 0.082† 0.49† 0.029 1.30 1.82
†Fixed (not optimized).‡At upper constraint.§At lower constraint.
Reproducedfrom
VadoseZoneJournal.PublishedbySoilScienceSociety
ofAmerica.Allcopyrights
reserved.
72 VADOSE ZONE J., VOL. 5, FEBRUARY 2006
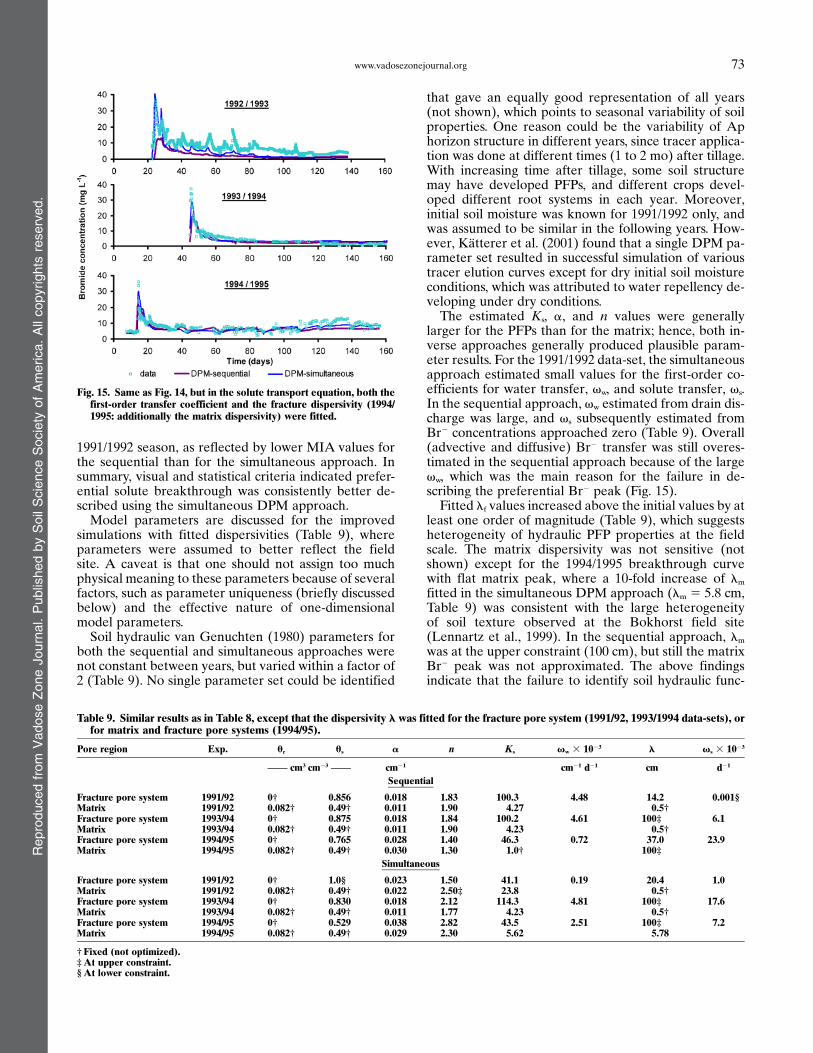
1991/1992 season, as reflected by lower MIA values forthe sequential than for the simultaneous approach. Insummary, visual and statistical criteria indicated prefer-ential solute breakthrough was consistently better de-scribed using the simultaneous DPM approach.
Model parameters are discussed for the improvedsimulations with fitted dispersivities (Table 9), whereparameters were assumed to better reflect the fieldsite. A caveat is that one should not assign too muchphysical meaning to these parameters because of severalfactors, such as parameter uniqueness (briefly discussedbelow) and the effective nature of one-dimensionalmodel parameters.
Soil hydraulic van Genuchten (1980) parameters forboth the sequential and simultaneous approaches werenot constant between years, but varied within a factor of2 (Table 9). No single parameter set could be identified
that gave an equally good representation of all years(not shown), which points to seasonal variability of soilproperties. One reason could be the variability of Aphorizon structure in different years, since tracer applica-tion was done at different times (1 to 2 mo) after tillage.With increasing time after tillage, some soil structuremay have developed PFPs, and different crops devel-oped different root systems in each year. Moreover,initial soil moisture was known for 1991/1992 only, andwas assumed to be similar in the following years. How-ever, Katterer et al. (2001) found that a single DPM pa-rameter set resulted in successful simulation of varioustracer elution curves except for dry initial soil moistureconditions, which was attributed to water repellency de-veloping under dry conditions.The estimated Ks, a, and n values were generally
larger for the PFPs than for the matrix; hence, both in-verse approaches generally produced plausible param-eter results. For the 1991/1992 data-set, the simultaneousapproach estimated small values for the first-order co-efficients for water transfer, vw, and solute transfer, vs.In the sequential approach, vw estimated from drain dis-charge was large, and vs subsequently estimated fromBr2 concentrations approached zero (Table 9). Overall(advective and diffusive) Br2 transfer was still overes-timated in the sequential approach because of the largevw, which was the main reason for the failure in de-scribing the preferential Br2 peak (Fig. 15).Fitted lf values increased above the initial values by at
least one order of magnitude (Table 9), which suggestsheterogeneity of hydraulic PFP properties at the fieldscale. The matrix dispersivity was not sensitive (notshown) except for the 1994/1995 breakthrough curvewith flat matrix peak, where a 10-fold increase of lm
fitted in the simultaneous DPM approach (lm 5 5.8 cm,Table 9) was consistent with the large heterogeneityof soil texture observed at the Bokhorst field site(Lennartz et al., 1999). In the sequential approach, lm
was at the upper constraint (100 cm), but still the matrixBr2 peak was not approximated. The above findingsindicate that the failure to identify soil hydraulic func-
Fig. 15. Same as Fig. 14, but in the solute transport equation, both thefirst-order transfer coefficient and the fracture dispersivity (1994/1995: additionally the matrix dispersivity) were fitted.
Table 9. Similar results as in Table 8, except that the dispersivity l was fitted for the fracture pore system (1991/92, 1993/1994 data-sets), orfor matrix and fracture pore systems (1994/95).
Pore region Exp. ur us a n Ks vw 3 1023 l vs 3 1023
cm3 cm23 cm21 cm21 d21 cm d21
Sequential
Fracture pore system 1991/92 0† 0.856 0.018 1.83 100.3 4.48 14.2 0.001§Matrix 1991/92 0.082† 0.49† 0.011 1.90 4.27 0.5†Fracture pore system 1993/94 0† 0.875 0.018 1.84 100.2 4.61 100‡ 6.1Matrix 1993/94 0.082† 0.49† 0.011 1.90 4.23 0.5†Fracture pore system 1994/95 0† 0.765 0.028 1.40 46.3 0.72 37.0 23.9Matrix 1994/95 0.082† 0.49† 0.030 1.30 1.0† 100‡
Simultaneous
Fracture pore system 1991/92 0† 1.0§ 0.023 1.50 41.1 0.19 20.4 1.0Matrix 1991/92 0.082† 0.49† 0.022 2.50‡ 23.8 0.5†Fracture pore system 1993/94 0† 0.830 0.018 2.12 114.3 4.81 100‡ 17.6Matrix 1993/94 0.082† 0.49† 0.011 1.77 4.23 0.5†Fracture pore system 1994/95 0† 0.529 0.038 2.82 43.5 2.51 100‡ 7.2Matrix 1994/95 0.082† 0.49† 0.029 2.30 5.62 5.78
†Fixed (not optimized).‡At upper constraint.§At lower constraint.
Reproducedfrom
VadoseZoneJournal.PublishedbySoilScienceSociety
ofAmerica.Allcopyrights
reserved.
73www.vadosezonejournal.org
tions relevant to preferential flow in the sequential ap-proach could not be compensated by estimating soluteparameters lm, lf, or vs.
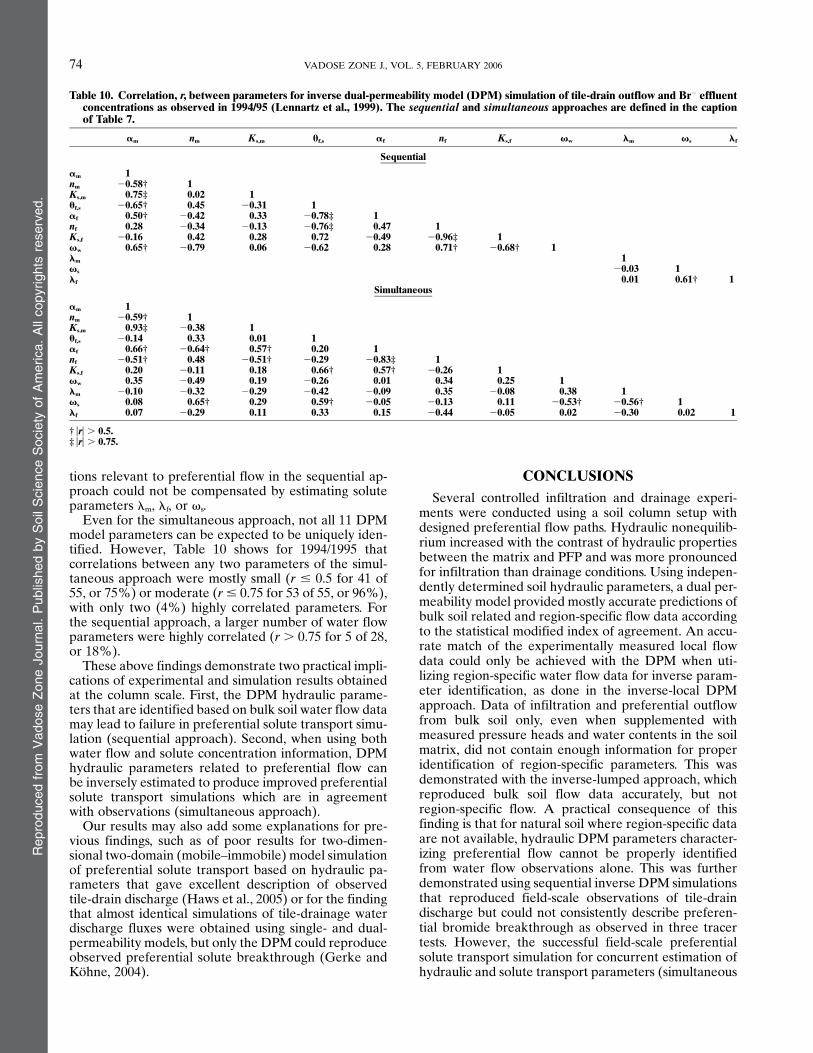
Even for the simultaneous approach, not all 11 DPMmodel parameters can be expected to be uniquely iden-tified. However, Table 10 shows for 1994/1995 thatcorrelations between any two parameters of the simul-taneous approach were mostly small (r # 0.5 for 41 of55, or 75%) or moderate (r# 0.75 for 53 of 55, or 96%),with only two (4%) highly correlated parameters. Forthe sequential approach, a larger number of water flowparameters were highly correlated (r . 0.75 for 5 of 28,or 18%).
These above findings demonstrate two practical impli-cations of experimental and simulation results obtainedat the column scale. First, the DPM hydraulic parame-ters that are identified based on bulk soil water flow datamay lead to failure in preferential solute transport simu-lation (sequential approach). Second, when using bothwater flow and solute concentration information, DPMhydraulic parameters related to preferential flow canbe inversely estimated to produce improved preferentialsolute transport simulations which are in agreementwith observations (simultaneous approach).
Our results may also add some explanations for pre-vious findings, such as of poor results for two-dimen-sional two-domain (mobile–immobile) model simulationof preferential solute transport based on hydraulic pa-rameters that gave excellent description of observedtile-drain discharge (Haws et al., 2005) or for the findingthat almost identical simulations of tile-drainage waterdischarge fluxes were obtained using single- and dual-permeability models, but only the DPM could reproduceobserved preferential solute breakthrough (Gerke andKohne, 2004).
CONCLUSIONSSeveral controlled infiltration and drainage experi-
ments were conducted using a soil column setup withdesigned preferential flow paths. Hydraulic nonequilib-rium increased with the contrast of hydraulic propertiesbetween the matrix and PFP and was more pronouncedfor infiltration than drainage conditions. Using indepen-dently determined soil hydraulic parameters, a dual per-meability model provided mostly accurate predictions ofbulk soil related and region-specific flow data accordingto the statistical modified index of agreement. An accu-rate match of the experimentally measured local flowdata could only be achieved with the DPM when uti-lizing region-specific water flow data for inverse param-eter identification, as done in the inverse-local DPMapproach. Data of infiltration and preferential outflowfrom bulk soil only, even when supplemented withmeasured pressure heads and water contents in the soilmatrix, did not contain enough information for properidentification of region-specific parameters. This wasdemonstrated with the inverse-lumped approach, whichreproduced bulk soil flow data accurately, but notregion-specific flow. A practical consequence of thisfinding is that for natural soil where region-specific dataare not available, hydraulic DPM parameters character-izing preferential flow cannot be properly identifiedfrom water flow observations alone. This was furtherdemonstrated using sequential inverse DPM simulationsthat reproduced field-scale observations of tile-draindischarge but could not consistently describe preferen-tial bromide breakthrough as observed in three tracertests. However, the successful field-scale preferentialsolute transport simulation for concurrent estimation ofhydraulic and solute transport parameters (simultaneous
Table 10. Correlation, r, between parameters for inverse dual-permeability model (DPM) simulation of tile-drain outflow and Br2 effluentconcentrations as observed in 1994/95 (Lennartz et al., 1999). The sequential and simultaneous approaches are defined in the captionof Table 7.
am nm Ks,m uf,s af nf Ks,f vw lm vs lf
Sequential
am 1nm 20.58† 1Ks,m 0.75‡ 0.02 1uf,s 20.65† 0.45 20.31 1af 0.50† 20.42 0.33 20.78‡ 1nf 0.28 20.34 20.13 20.76‡ 0.47 1Ks,f 20.16 0.42 0.28 0.72 20.49 20.96‡ 1vw 0.65† 20.79 0.06 20.62 0.28 0.71† 20.68† 1lm 1vs 20.03 1lf 0.01 0.61† 1
Simultaneous
am 1nm 20.59† 1Ks,m 0.93‡ 20.38 1uf,s 20.14 0.33 0.01 1af 0.66† 20.64† 0.57† 0.20 1nf 20.51† 0.48 20.51† 20.29 20.83‡ 1Ks,f 0.20 20.11 0.18 0.66† 0.57† 20.26 1vw 0.35 20.49 0.19 20.26 0.01 0.34 0.25 1lm 20.10 20.32 20.29 20.42 20.09 0.35 20.08 0.38 1vs 0.08 0.65† 0.29 0.59† 20.05 20.13 0.11 20.53† 20.56† 1lf 0.07 20.29 0.11 0.33 0.15 20.44 20.05 0.02 20.30 0.02 1
† |r| . 0.5.‡ |r| . 0.75.
Reproducedfrom
VadoseZoneJournal.PublishedbySoilScienceSociety
ofAmerica.Allcopyrights
reserved.
74 VADOSE ZONE J., VOL. 5, FEBRUARY 2006
DPM approach) suggests that effluent solute concentra-tions contain indirect information about preferentialwater flow that can be used to identify hydraulic DPMparameters. The principal implications of this study arenot limited by the basic one-dimensional DPM approachadopted here, but should hold even when applyingfurther refined model representations of real soils.
ACKNOWLEDGMENTS
We appreciate the support by the National Science Foun-dation (grant EAR 0296158).
REFERENCESAbbasi, F., J. Simunek, J. Feyen, M.Th. van Genuchten, and P.J.
Shouse. 2003. Simultaneous inverse estimation of soil hydraulic andsolute transport parameters from transient field experiments: Ho-mogeneous soil. Trans. ASAE 46:1085–1095.
Abbaspour, K.C., A. Kohler, J. Simunek, M. Fritsch, and R. Schulin.2001. Application of a two-dimensional model to simulate flow andtransport in a macroporous agricultural soil with tile drains. Eur. J.Soil Sci. 52:433–447.
Ahuja, L.R., K.E. Johnson, and G.C. Heathman. 1995. Macroporetransport of a surface-applied bromide tracer: Model evaluationand refinement. Soil Sci. Soc. Am. J. 59:1234–1241.
Allaire, S.E., S.C. Gupta, J. Nieber, and J.F. Moncrief. 2002a. Role ofmacropore continuity and tortuosity on solute transport in soils: 1.Effects of initial and boundary conditions. J. Contam. Hydrol. 58:299–321.
Allaire, S.E., S.C. Gupta, J. Nieber, and J.F. Moncrief. 2002b. Roleof macropore continuity and tortuosity on solute transport in soils:2. Interactions with model assumptions for macropore description.J. Contam. Hydrol. 58:283–298.
Andreu, L., F. Moreno, N.J. Jarvis, and G. Vachaud. 1994. Applicationof the model MACRO to water movement and salt leaching indrained and irrigated marsh soils. Agric. Water Manage. 25:71–88.
Booltink, H.W.G., and J. Bouma. 1991. Physical and morphologicalcharacterization of bypass flow in a well-structured clay soil. SoilSci. Soc. Am. J. 55:1249–1254.
Castiglione, P., B.P. Mohanty, P.J. Shouse, J. Simunek, M.Th. vanGenuchten, and A. Santini. 2003. Lateral water diffusion in an ar-tificial maroporous system: Modeling and experimental evidence.Available at www.vadosezonejournal.org. Vadose Zone J. 2:212–221.
Gerke, H.H., andM.Th. vanGenuchten. 1993a. A dual-porosity modelfor simulating the preferential movement of water and solutes instructured porous media. Water Resour. Res. 29:305–319.
Gerke, H.H., and M.Th. van Genuchten. 1993b. Evaluation of a first-order water transfer term for variably saturated dual-porosity flowmodels. Water Resour. Res. 29:1225–1238.
Gerke, H.H., and M.Th. van Genuchten. 1996. Macroscopic represen-tation of structural geometry for simulating water and solute masstransfer in dual-porosity media. Adv. Water Resour. 19:343–357.
Gerke, H.H., and J.M. Kohne. 2004. Dual-permeability modeling ofpreferential bromide leaching from a tile drained glacial tillagricultural field. J. Hydrol. (Amsterdam) 289:239–257.
Greco, R. 2002. Preferential flow in macroporous swelling soil withinternal catchment: Model development and applications. J.Hydrol. (Amsterdam) 269:150–168.
Green, I.R.A., and D. Stephenson. 1986. Criteria for comparison ofsingle event models. Hydrol. Sci. 31:395–411.
Gwo, J.P., P.M. Jardine, G.V. Wilson, and G.T. Yeh. 1995. A multiple-pore-region concept to modeling mass transfer in subsurface media.J. Hydrol. (Amsterdam) 164:217–237.
Gwo, J.P., P.M. Jardine, G.V. Wilson, and G.T. Yeh. 1996. Using amultiregion model to study the effects of advective and diffusivemass transfer on local physical nonequilibrium and solute mobilityin a structured soil. Water Resour. Res. 32:561–570.
Haws, N.W., P.S.C. Rao, J. Simunek, and I.C. Poyer. 2005. Single-porosity and dual-porosity modeling of water flow and solutetransport in subsurface-drained field using effective field-scaleparameters. J. Hydrol. (Amsterdam) (in press).
Inoue, M., J. Simunek, S. Shiozawa, and J.W. Hopmans. 2000.Estimation of soil hydraulic and solute transport parameters fromtransient infiltration experiments. Adv. Water Resour. 23:677–688.
Jabro, J.D., J.M. Jemison, Jr., R.H. Fox, and D.D. Fritton. 1994. Pre-dicting bromide leaching under field conditions using SLIM andMACRO. Soil Sci. 157(4):215–223.
Jacques, D., J. Simunek, A. Timmerman, and J. Feyen. 2002.Calibration of Richards’ and convection-dispersion equations tofield-scale water flow and solute transport under rainfall conditions.J. Hydrol. (Amsterdam) 259:15–31.
Jarvis, N.J., P.-E. Jonasson, P.E. Dik, and I. Messing. 1991. Modellingwater and solute transport in macroporous soil. I. Model de-scription and sensitivity analysis. J. Soil Sci. 42:59–70.
Katterer, T., B. Schmied, K.C. Abbaspour, and R. Schulin. 2001.Single- and dual-porosity modeling of multiple tracer transportthrough soil columns: Effects of initial moisture and mode ofapplication. Eur. J. Soil Sci. 52:25–36.
Klute, A. 1986. Water retention: Laboratory methods. p. 635–660.InA. Klute (ed.) Methods of soil analysis. Part 1. Agron. Monogr. 9.ASA and SSSA, Madison, WI.
Klute, A., and C. Dirksen. 1986. Hydraulic conductivity and diffusivity:Laboratory methods. p. 687–734. In A. Klute (ed.) Methods of soilanalysis. Part 1. Agron. Monogr. 9. ASA and SSSA, Madison, WI
Kohler, A., K.C. Abbaspour, M. Fritsch, M.T. van Genuchten, and R.Schulin. 2001. Simulating unsaturated flow and transport in amacroporous soil to tile drains subject to an entrance head: Modeldevelopment and preliminary evaluation. J. Hydrol. (Amsterdam)254:67–81.
Kohne, J.M. 1999. Analyse praferentiellen Wasserflusses und Stoff-transports in strukturierten Boden mit Hilfe eines Dual-Porosi-tatsmodells. Ph.D. dissertation (in German, with English summary).In H. Roweck and B. Lennartz (ed.) Schriftenreihe Inst. WaterManagement and Landscape Ecology 30. Christian-Albrechts-University, Kiel, Germany.
Kohne, J.M., S. Kohne, and H.H. Gerke. 2002. Estimating the hy-draulic functions of dual-permeability models from bulk soil data,Water Resour. Res. 38(7):1121. doi:10.1029/2001WR000492.
Kohne, J.M., and B.P. Mohanty. 2005. Water Flow Processes in a SoilColumn with a Cylindrical Macropore: Experiment and Hierar-chical Modeling. Water Resour. Res. 41:W03010. doi:10.1029/2004WR003303.
Kohne, J.M., B.P. Mohanty, J. Simunek, and H.H. Gerke. 2004. Evalu-ation of a second-order water transfer term for variably saturateddual-permeability flow models. Water Resour. Res. 40:W07409.doi:10.1029/2004WR003285.
Larsson, M.H., and N.J. Jarvis. 1999a. A dual-porosity model to quan-tify macropore flow effects on nitrate leaching. J. Environ. Qual. 28:1298–1307.
Larsson, M.H., and N.J. Jarvis. 1999b. Evaluation of a dual-porositymodel to predict field-scale solute transport in a macroporous soil.J. Hydrol. (Amsterdam) 215:153–171.
Legates, D.R., and G.J. McCabe, Jr. 1999. Evaluating the use of“goodness-of-fit” measures in hydrologic and hydroclimatic modelvalidation. Water Resour. Res. 35:233–241.
Lennartz, B., J. Michaelsen, W. Wichtmann, and P. Widmoser. 1999.Time variance analysis of preferential solute movement at a tile-drained field site. Soil Sci. Soc. Am. J. 63:39–47.
Logsdon, S.D. 1995. Flow mechanisms through continuous and buriedmacropores. Soil Sci. 160:237–242.
Malone, R.W., M.J. Shipitalo, L. Ma, L.R. Ahuja, and K.W. Rojas.2001. Macropore component assessment of the root water qualitymodel (RZWQM) using no-till soil blocks. Trans. ASAE 44:843–852.
Medina, A., and J. Carrera. 1996. Coupled estimation of flow andsolute transport parameters. Water Resour. Res. 32:3063–3076.
Mishra, S., and J.C. Parker. 1989. Parameter estimation for coupledunsaturated flow and transport. Water Resour. Res. 25:385–396.
Meyer-Windel, S. 1998. Transport processes of bromide and herbicidesunder steady-state and transient flow conditions. Ph.D. diss. (InGerman.) Schriftenreihe Institut fur Wasserwirtschaft und Land-schaftsokologie 28. Christian-Albrechts-University, Kiel, Germany.
Mohanty, B.P., R.S. Bowman, J.M.H. Hendrickx, and M.Th. vanGenuchten. 1997. New piecewise-continuous hydraulic functionsfor modeling preferential flow in an intermittent-flood-irrigatedfield. Water Resour. Res. 33:2049–2063.
Reproducedfrom
VadoseZoneJournal.PublishedbySoilScienceSociety
ofAmerica.Allcopyrights
reserved.
75www.vadosezonejournal.org
Nissen, H.H., P. Moldrup, and K. Henriksen. 1998. High-resolutiontime-domain reflectometry coil probe for measuring soil watercontent. Soil Sci. Soc. Am. J. 62:1203–1211.
Schwartz, R.C., A.S.R. Juo, and K.J. McInnes. 2000. Estimating param-eters for a dual-porosity model to describe non-equilibrium, reactivetransport in a fine-textured soil. J. Hydrol. (Amsterdam) 229:149–167.
Simunek, J., D. Jacques, J.W. Hopmans, M. Inoue, M. Flury, and M.Th.van Genuchten. 2002. Solute transport during variably saturatedflow. Inverse methods. p. 1435–1449. In J.H. Dane and G.C. Topp(ed.) Methods of soil analysis. Part 4. SSSA Book Ser. 5. SSSA,Madison, WI.
Simunek, J., N.J. Jarvis, M.T. van Genuchten, and A. Gardenas. 2003.Review and comparison of models for describing nonequilibriumand preferential flow and transport in the vadose zone. J. Hydrol.(Amsterdam) 272:14–35.
Simunek, J., M. Sejna, and M.Th. van Genuchten. 1998. The
HYDRUS-1D software package for simulating the movement ofwater, heat, and multiple solutes in variably-saturated media.Version 2.0. IGWMC-TPS-70. International Ground Water Mod-eling Center, Colorado School of Mines, Golden, CO.
Simunek, J., O.Wendroth, N.Wypler, andM.Th. van Genuchten. 2001.Non-equilibrium water flow characterized by means of upwardinfiltration experiments. Eur. J. Soil Sci. 52:13–24.
Tofteng, Ch., S. Hansen, and H.E. Jensen. 2002. Film and pulse flow inartificial macropores. Nord. Hydrol. 334(4):263–274.
van Genuchten, M.Th. 1980. A closed-form equation for predicting thehydraulic conductivity of unsaturated soils. Soil Sci. Soc. Am. J. 44:892–898.
van Genuchten, M.Th., F.J. Leij, and S.R. Yates. 1991. The RETC codefor quantifying the hydraulic functions of unsaturated soils. EPA/600/2-91/065. USEPA, Office of Research andDevelopment, Wash-ington, DC.
Reproducedfrom
VadoseZoneJournal.PublishedbySoilScienceSociety
ofAmerica.Allcopyrights
reserved.
76 VADOSE ZONE J., VOL. 5, FEBRUARY 2006